Abstract
The remote sensing ecological index (RSEI) has been widely used in the rapid monitoring and evaluation of the regional ecological environment; however, the research on the main factors that cause changes in RSEI and the impact of human activities in the mining area on RSEI is not often explored. To this end, this paper selected the Landsat (TM/OLI) series of remote sensing images from 1986 to 2022; extracted the four important indicators of the normalized difference vegetation index (NDVI), the wetness component of the tasseled cap transformation (WET), normalized difference built-up and soil index (NDBSI), and land surface temperature (LST); calculated the remote sensing ecological index (RSEI) based on the principal component analysis method; monitored and evaluated the ecological environment changes in the Shendong Mining Area for a period of 36 years; and analyzed the driving forces that cause these ecological environment changes. The results show the following: (1) The ecological status of the study area has shown an overall upward trend during the 1986–2022 period. (2) From 1986 to 2022, the area of RSEI with a grade of 0.4–0.6 increased by 1142.74 km2, that with a grade of 0.6–0.8 increased by 124.09 km2, and that with a grade of 0.8–1.0 increased by 0.73 km2. (3) In the past 36 years, the proportion of RSEI with a positive grade difference was 97.52%, and the proportion of regions with a negative grade difference was 6.20%. (4) Rainfall is the main factor that causes changes in the regional ecological environment. By analyzing the main driving factors of ecological environment change and the relationship between human activities and RSEI, reference can be provided for the formulation of environmental protection policies and environmental planning in mining areas.
1. Introduction
Coal resources play an important role in social and economic development. In 2021, China’s raw coal output was 4.13 billion tons, and coal consumption accounted for 56% of China’s total primary energy source [1], which shows that coal resources are an important source of basic energy in China. The mining of coal resources causes a series of ecological environmental problems [2,3], such as land occupation [4], soil quality decline [5,6], land subsidence [7], water and soil loss [8], and land damage [9]. Therefore, the monitoring and evaluation of the ecological environment in mining areas is of great significance.
Remote sensing technology has been widely used in the field of the ecological environment because of its advantages, including a wide monitoring range, fast imaging speed, short revisit period, and low data cost [10], providing an effective means for the monitoring and evaluation of the ecological environment [11,12]. Domestic and foreign scholars have conducted considerable work in the monitoring and evaluation of the ecological environment of mining areas using remote sensing technology. Among them, the remote sensing ecological index (RSEI) can integrate multiple index factors, such as the normalized difference vegetation index (NDVI), wetness component of the tasseled cap transformation (WET), normalized difference built-up and soil index (NDBSI), and land surface temperature (LST), and, being entirely based on remote sensing information with strong objectivity and stability, it has been widely used in the rapid monitoring and evaluation of the regional ecological environment [13,14].
With the wide application of RSEI, its application scope is also changing, from, at first, being only applicable to cities to its use in highways, mountain ecosystems, and scenic spots. Using Landsat TM/OLI as their data source, Sawut et al. calculated the remote sensing ecological index of Fukang City, Xinjiang, from 2000 to 2016. They monitored and evaluated the changes in the quality of the ecological environment of their study area in the previous 16 years and analyzed the reasons for the quality decline in the ecological environment [15]. Based on MODIS series data, Yang et al. extracted the five indicators of vegetation coverage, leaf area index, total primary productivity, and land surface temperature and humidity, constructed a comprehensive remote sensing ecological index using the principal component analysis method, and conducted a macrocomprehensive analysis of the changes in the ecological status of the Lalin Highway from 2012 to 2019 [16]. Shi et al. used remote sensing image data in the same months of 2000 and 2017 to calculate the remote sensing ecological index and analyze the ecological vulnerability of the Tianchi Scenic Spot in Xinjiang using the geographic detector model to detect the impact factors of ecological vulnerability [17]. Li et al. used Landsat data based on the remote sensing ecological index combined with DEM data, meteorological data, and vegetation type spatial distribution data to study and analyze the ecological status of the Helan Mountain ecosystem. They revealed the relationship between the ecological quality change in Helan Mountain and the climate and terrain in the 1989–2017 period [18].
It should be noted that the monitoring of the ecological environment quality of mining areas abroad pays more attention to a certain element in the ecological environment system, such as soil physical and chemical properties and water resources [19,20,21], biodiversity [22,23], land remediation [24,25], etc., and most of the research on the application of the RSEI to the monitoring of ecological environment quality in mining areas is concentrated in China. Wu studied the ecological status, spatiotemporal change characteristics, and driving factors of the Yongding Mining Area in Fujian Province from 2002 to 2014 using the remote sensing ecological index. The research results show that the RSEI is applicable to the ecological environment monitoring of a coal mining area [26]. Wu used the RSEI to monitor and analyze the ecological environment change in the Mattaihao Coal Mine in Ordos, Inner Mongolia, from 2016 to 2019 [27]. Fan made a comprehensive evaluation of the ecological environment of the Shenfu Mining Area from 2000 to 2016 by building an improved remote sensing ecological index, that is, adding the net primary productivity index of vegetation on the basis of the original remote sensing ecological index [28]. Through summary and analysis, we found that the current research on the eco-environmental status of the mining area based on the RSEI mainly focuses on the long-term monitoring and result analysis of the RSEI, while the research on the main factors that cause changes in the RSEI and the impact of human activities in the mining area on the RSEI is not often explored. As an important coal production base in China, the Shendong Mining Area is also an important ecologically fragile zone in China and a national key monitoring area and key control area for water and soil loss. The region is dry and rainy, with monotonous native vegetation types and low coverage [29], and human activities are one of the main driving factors that cause changes in the ecological environment. Therefore, monitoring and evaluating the ecological environment of the Shendong Mining Area and exploring the main controlling factors that cause changes in the ecological environment are of great significance for the formulation of environmental protection policies and environmental planning in the mining area.
Therefore, this paper takes the Shendong Mining Area in western China, which is ecologically fragile, as its study area and calculates the NDVI, WET, NDBSI, and LST based on Landsat TM/OLI data. On this basis, the principal component analysis method was used to construct a remote sensing ecological index to monitor and evaluate the spatiotemporal changes in the ecological environment in the Shendong Mining Area from 1986 to 2022. We analyze the main driving factors of changes in the ecological environment in different periods in the study area and the relationship between human activities and the RSEI, with a view to improving the environmental sustainability of coal production. The rest of this paper is organized as follows: The study area introduces the Shendong Mining Area. Data sources, data processes, and research methods are described in the Methods (Section 3). The temporal and spatial visualization of each index and analysis of the RSEI are presented in the Results and Analysis (Section 4). The Discussion (Section 5) presents the analysis of driving forces for changes in ecological environment quality in coal mining areas, limitations, and future work.
2. Study Area
The Shendong Mining Area is located at the junction of the southeast of Ordos City, Inner Mongolia Autonomous Region, and the north of Yulin City, Shanxi Province, with the geographical coordinates 39°08′–39°58′ N and 109°79′–110°41′ E (Figure 1). The mining area is located in the transitional zone between the southeast edge of the Mu Us Desert and the northern end of the Loess Plateau in the northwest region. It is high in the northwest and low in the southeast, belonging to the typical arid and semiarid continental monsoon climate. The study area is dry in spring and winter and rainy in summer, with an annual evaporation rate that is 6–7 times that of the city’s annual rainfall. The study area is dominated by wind–sand landforms, and the soil is dominated by loess and wind–sand. The soil is poor, low in organic matter content, extremely prone to desertification, and weak in corrosion resistance. The types of native vegetation on the surface are monotonous, with drought-resistant and cold-resistant desert plants and xerophytes as the main species. As a typical arid and semiarid desertification mining area in China, the Shendong Mining Area is characterized by weak ecological stability, high environmental sensitivity, and poor overall plasticity.
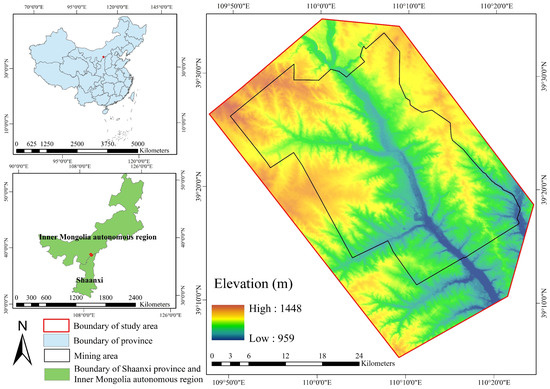
Figure 1.
Geographical location of the study area.
However, the Shendong Mining Area is China’s largest coal production base and a core production area for energy security [30]. The entire mining area mainly adopts underground mining methods. The development process has gone through four stages. From 1985 to 1990, it was the initial stage of development; from 1990 to 1999, the mining area adjustment plan was in the stage of exploration and improvement; from 2000 to 2008, the mining area integrated small coal mines and entered the stage of integrated innovation and development, building China’s first 100 million ton coal production base; and from 2009 to 2022, the mining area entered a stage of rapid development and leapfrogging, with 13 mines built and production exceeding 200 million tons [31,32]. At present, the region has formed an integrated development model that integrates coal production, processing, transportation, coal chemical industry, thermal power, and other industries. The regional economy is developing rapidly, and the population and urban scale are gradually expanding [33].
3. Methods
3.1. Data Sources and Data Processes
Table 1 shows the data sources used in this study. The remote sensing images are from Landsat 5 ETM T1_ L2 and Landsat 8 OLI/TIRS_T1. For the L2 image, the remote sensing image from a month with less than 5% cloud cover, good image quality, and good vegetation growth was selected from the Google Earth Engine platform. The image set underwent radiation correction and atmospheric correction. At the same time, the thermal infrared bands in the two data sets were resampled to a resolution of 30 m using the triple convolution method, so the image could be used directly after downloading. The meteorological data were obtained from the Resource and Environmental Science and Data Center of the Chinese Academy of Sciences (https://www.resdc.cn/, it was accessed on 20 July 2022). The monthly rainfall and temperature data from 1986 to 2015 were collected, and the spatial data of rainfall and temperature in the study area were obtained through the nearest-neighbor interpolation tool on the ArcGIS 10.2. The vector data of the study area were obtained from the Resource and Environmental Science Data Center of the Chinese Academy of Sciences. Finally, all data were rasterized to 30 m × 30 m using the unified WGS1984 ellipsoid coordinates and WGS 1984 49 N projection.

Table 1.
Data Sources and Data Processing.
3.2. Research Methods
3.2.1. Assessment Factor Selection
The four remote sensing indexes of NDVI, WET, NDBSI, and LST can be directly obtained from remote sensing images according to different band combinations. NDBSI was generated by combining the building index IBI and the soil index SI [34]. The calculation formula and reference parameters of these four indicators are shown in Figure 2 [35].
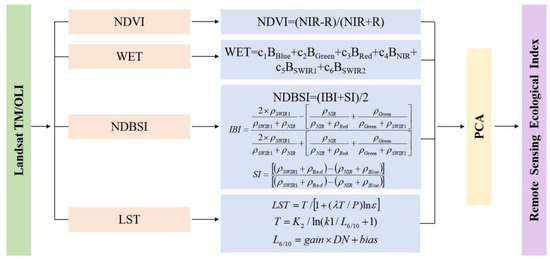
Figure 2.
Ecological environment index system of the study area.
In the above calculation formula, B, G, R, NIR, SWIR1, and SWIR2 represent the reflectivity of bands 1, 2, 3, 4, 5, and 7 of the TM data and bands 1, 3, 4, 5, 6, and 7 of the OLI data. c is the corresponding coefficient for each band when calculating humidity. For Landsat 5 TM images, c1 = 0.0315, c2 = 0.2021, c3 = 0.3102, c4 = 0.1594, c5 = −0.6806, and c7 = −0.6109. For Landsat8 OLI images, c1 = 0.1511, c3 = 0.1793, c4 = 0.3283, c5 = 0.3407, c6 = −0.7117, and c7 = −0.4559 [34,36].
In the calculation of the surface temperature, L6 and L10 are the radiation values of the TM thermal infrared 6 and 10 bands at the sensor; T is the temperature value at the sensor; DN is pixel gray value; Gain and Bias are the gain and bias values of the 6 and 10 bands, respectively; and k1 and k2 are the calibration parameters, which were obtained from the user manual [37,38].
For TM, , and k2 = 1260.56 K. For the TIRS 10 band, , and k2 = 1321.08 K. The calculated temperature T can be converted into the surface temperature LST through the correction of the specific emissivity; λ is the central wavelength of the thermal infrared band; ρ = 1.44 × 10⁻² m·K; ε is the specific emissivity of the ground object; and the surface temperature can be directly obtained from the Google Earth Engine [39].
3.2.2. RSEI Model
The remote sensing ecological index not only appears in the form of a single indicator but also integrates the information of the above-mentioned four indicators. The integration of the index weights through a principal component transformation can effectively avoid the influence of human factors and only rely on the nature of the data itself. This study conducted a principal component analysis on four different indexes on the GEE platform. Because the dimensions of the four indexes are inconsistent, if PCA is directly calculated, the weight of each index will be unbalanced. Therefore, before the principal component analysis, we normalized the four indexes, unified their dimensions to 0~1, and then performed the principal component transformation. The common normalization formula is
where is a normalized index value, is the value of the index in pixel i, is the maximum value of the index, and is the minimum value of the index [34]. After the four indicators are normalized, a new image composed of four index bands is synthesized, and then the principal component analysis is performed. The first principal component (PC1) is further processed to generate the remote sensing ecological index (RSEI). The larger the value, the better the ecological quality. PC1 can be further subtracted from 1 to obtain the initial ecological index RSEI0.
In order to facilitate the measurement and comparison of indicators, the RSEI can also be normalized:
The RSEI is the constructed remote sensing ecological index, with a value range of [0~1]. In order to specifically reflect the characteristics of changes in the ecological environment in the study area, the ecological index of each year was further divided into five grades with an interval of 0.2: poor (0.0~0.2), poor (0.2~0.4), medium (0.4~0.6), good (0.6~0.8), and excellent (0.8~1.0) [40,41].
4. Results and Analysis
4.1. Temporal and Spatial Visualization of Each Index
The four calculated indicators (NDVI, WET, NDBSI, and LST) can be clearly observed through spatial visualization (as shown in Figure 3, Figure 4, Figure 5, Figure 6, Figure 7, Figure 8, Figure 9 and Figure 10), so as to further analyze the spatial and temporal differences in the study area.
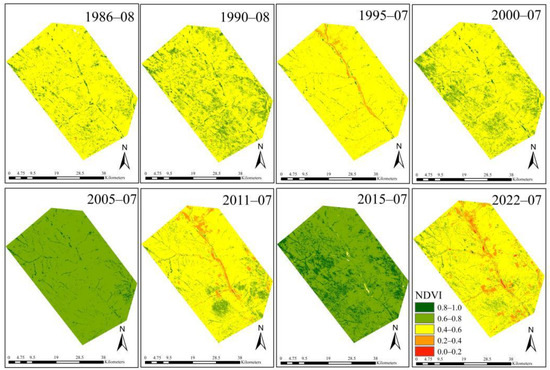
Figure 3.
Spatial distribution map of NDVI.
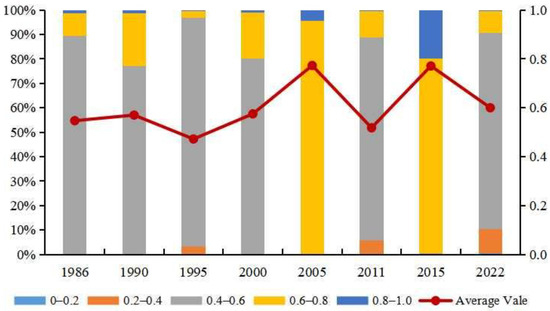
Figure 4.
Area and variation trend of the different grades of NDVI.
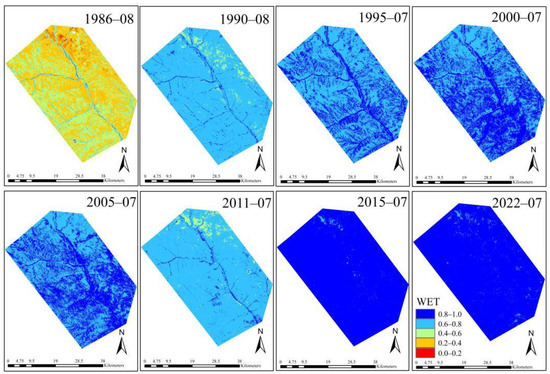
Figure 5.
Spatial distribution map of WET.
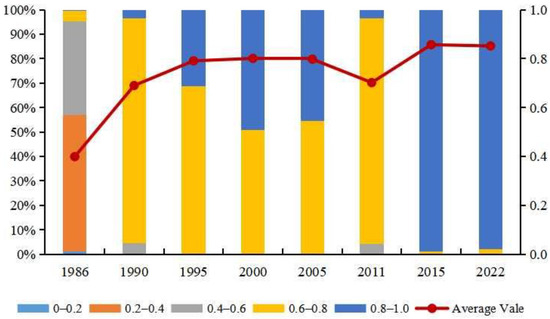
Figure 6.
Area and variation trend of the different grades of WET.
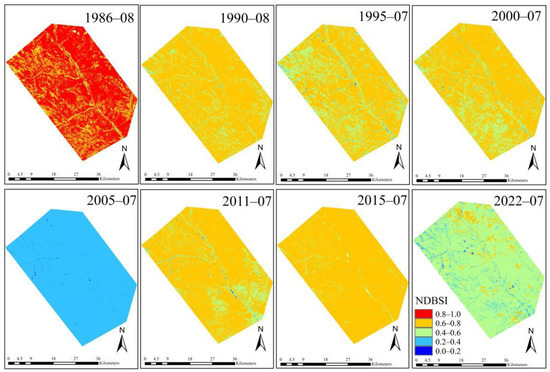
Figure 7.
Spatial distribution map of NDBSI.
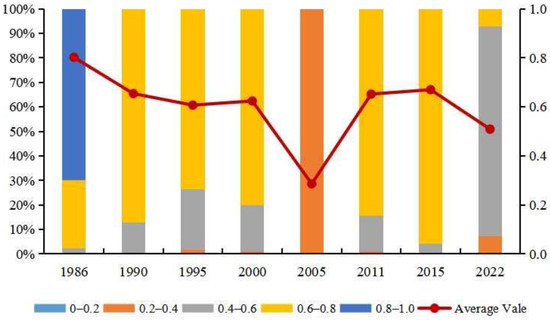
Figure 8.
Area and variation trend of different grades of NDBSI.
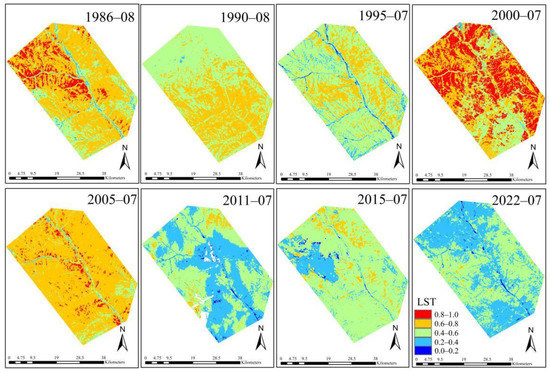
Figure 9.
Spatial distribution map of LST.
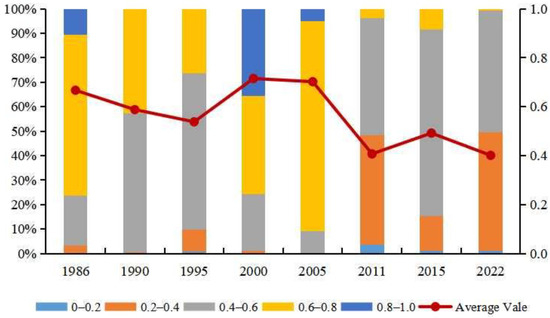
Figure 10.
Area and variation trend of the different grades of LST.
4.1.1. NDVI
It can be observed in Figure 3 that the NDVI of the study area was concentrated at 0.40–0.60 in the 1986–2000 period. From 2005 to 2022, the NDVI values in 2011 and 2022 were lower, with a concentrated distribution between 0.40 and 0.60. In other years, the NDVI value was generally good, with a concentrated distribution between 0.60 and 0.80. At the same time, areas with large NDVI changes were concentrated on both sides of the river, located in the northeast, southwest, and northwest of the study area.
In order to more clearly understand the change trend of NDVI in different periods, the average NDVI in each year and the proportion of NDVI area at different levels were calculated (Figure 4). It can be observed in Figure 4 that the NDVI of the study area showed a fluctuating upward trend from 1986 to 2022, with a large increase in the 1986–2005 period, while the NDVI of the study area showed a gentle upward trend after 2005. The proportion is consistent with the change trend of the mean value of NDVI. In 2005 and 2015, NDVI had a high level, with the largest grade area proportion of 0.6–0.8, accounting for 95.54% and 79.62%, respectively. In the 1986–2000 period, 2011, and 2022, the largest NDVI grade area was 0.4–0.6, and the area ratios were 89.25%, 76.67%, 93.48%, 80.06%, 82.96%, and 80.32%, respectively.
4.1.2. WET
It can be observed in Figure 5 that the humidity in the study area gradually improved between 1986 and 2022. In 1986, the humidity in the study area was generally distributed between 0.2–0.4 and 0.4–0.6, and an area of 0.8–1.0 gradually increased with time. The increased area was mainly distributed to the west and south of the study area. From 2015 to 2022, the overall distribution of humidity in the study area was between 0.8 and 1.0.
In order to understand the change trend of humidity in different periods more clearly, the mean value of humidity in each year and the area proportion of humidity at different levels were calculated (Figure 6). It can be observed in Figure 6 that the humidity in the study area showed a gradual increase from 1986 to 2022. In 1986, the humidity was the lowest, mainly in the range of 0.2–0.6, accounting for 55.71% of the area. In 1990, the humidity increased, concentrated in the range of 0.6–0.8, and the area of this interval accounted for 92.21%. In 1995, humidity continued to increase, with the proportion of 0.8–1.0 increasing by 28%. In 2000, the proportion of 0.8–1.0 increased by 18% compared with 1995. The humidity decreased in 2005, but the change was not obvious, and the proportion of 0.8–1.0 decreased by 4%. The humidity continued to decrease in 2011, the proportion of 0.6–0.8 increased by 37.94%, and the proportion of 0.8–1.0 decreased by 42.14%. From 2015 to 2022, the humidity in the study area increased significantly, and the proportion of 0.8–1.0 was over 95%, close to 100%.
4.1.3. NDBSI
It can be seen from Figure 7 that the dryness of the study area showed a downward trend from 1986 to 2022. In 1986, the dryness grade of the study area was the highest, which was concentrated between 0.8–1.0, and then gradually decreased. In 1990, 1995, and 2000, the dryness of the study area was concentrated between 0.6–0.8, and in 2005, the dryness was concentrated between 0.2–0.4. Compared with 2005, the dryness in 2011 and 2015 increased; the dryness in the study area was concentrated between 0.6–0.8, accounting for 84.45% and 95.71%, respectively.
In order to more clearly understand the change trend of dryness in different periods, the mean value of dryness in each year and the proportion of dryness area in different grades were calculated (Figure 8). It can be seen from Figure 8 that the change trend of dryness in the study area is declining, and the turning points is 2005. In 1986, the dryness was mainly between 0.8–1.0, and the area of this interval accounted for 69.96%; in 1990, 1995, and 2000, dryness was mainly distributed in the range of 0.6–0.8, and the proportions of area in this range were 87.09%, 73.59%, and 79.95% in each year. From 1995 to 2000, the proportion of dryness grade 0.4–0.6 decreased; the dryness grade in 2005 and 2022 is mainly between 0.2–0.4, accounting for more than 98%. The dryness ratio was concentrated between 0.6–0.8 in 2011 and 2015. It can be seen that the change in dryness in the study area is basically opposite to that of humidity.
4.1.4. LST
It can be observed in Figure 9 that the change in surface temperature in the 1986–2022 period was uneven. The surface temperature gradually decreased in the 1986–1995 period and increased in 2000, finally decreasing in the 2005–2022 period. As a whole, the surface temperature in 1986, 2000, and 2005 was higher, and that in 1995, 2011, 2015, and 2022 was lower, as well as being lower in the river area of the study area.
In order to more clearly understand the change trend of dryness in the different periods, the mean value of dryness in each year and the area and proportion of dryness in different grades were calculated (Figure 10). It can be observed in Figure 10 that the trend of heat change in the study area from 1986 to 2022 is downward–upward–downward–upward. In 1986, the surface temperature was concentrated between 0.6 and 0.8 and, in 1990, it was concentrated between 0.4 and 0.8; therefore, the surface temperature was on the high side. In 1995, the surface temperature was concentrated in the range of 0.4–0.6 and, in 2000, in the range of 0.6–1.0, again being on the high side. The surface temperature was mainly distributed in the ranges of 0.6–0.8 in 2005 and 0.4–0.6 in the 2011–2022 period, accounting for 47.69%, 76.02%, and 71.97%. From 1986 to 2022, the heat intensity in the study area changed slightly, except for that in 2000 and 2005.
4.2. Analysis of RSEI
4.2.1. Results of the PCA of Each Index and the RSEI
The principal component analysis results of the RSEI in the Shendong Mining Area from 1986 to 2022 are shown in Table 2. It can be observed in Table 2 that the contribution rates of the characteristic values of the first principal component PC1 from 1986 to 2022 were 76.90%, 71.10%, 64.99%, 72.08%, 70.16%, 62.72%, 63.55%, and 65.18%, which shows that PC1 concentrated most of the characteristics of the four indicators. In 1995, 2011, 2015, and 2022, in PC1, the principal component loads of NDVI and WET were positive, indicating that they played a positive role in the ecological environment, while the principal component loads of LST and NDBSI were negative, indicating that they had a negative impact on the ecological environment, which is consistent with the real-life situation. In the 1986–1990 and 2000–2005 periods, the principal component correspondence coefficient was the opposite to those in 1995, 2011, 2015, and 2022. Therefore, the “1-PC1” operation was required. The results show that NDVI and WET were both positive, while NDBSI and LST were both negative. At the same time, it can also be found that although the contribution rate of NDVI was positive, the contribution rate was low, while the contribution rate of meteorological factors, such as WET, NDBSI, and LST, was high. Therefore, the main factor to evaluate whether the ecological environment improved is the meteorological conditions, which is consistent with the actual situation.
Table 2.
Principal component analysis of the four factors.
4.2.2. Temporal and Spatial Changes in RSEI
After normalization, the RSEI was divided into five levels, poor (0.0–0.2), relatively poor (0.2–0.4), medium (0.4–0.6), good (0.6–0.8), and excellent (0.8–1.0), according to the boundaries of 0.2, 0.4, 0.6, 0.8, and 1.0, respectively. The spatial distribution of the divisions of the remote sensing ecological index is shown in Figure 11.
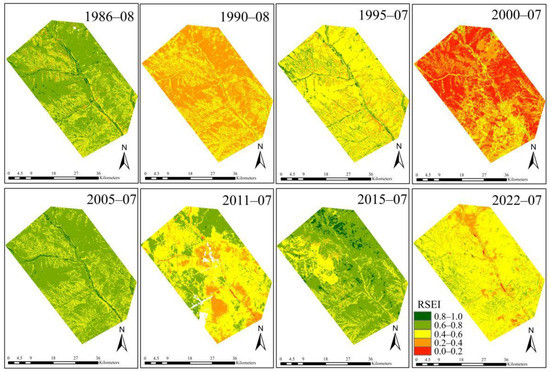
Figure 11.
Spatial distribution map of the RSEI.
The higher the normalized RSEI, the better the ecological condition. Conversely, the lower the normalized RSEI, the worse the ecological condition. It can be observed in Figure 11 that the ecological condition of the study area was poor in 2000, followed by 1990. The ecological conditions were good in 1986, 1995, 2005, 2011, 2015, and 2022. In order to more clearly understand the change trend of the RSEI in different periods, the mean value of the RSEI in each year (Figure 12) and the area and proportion of the RSEI at different levels were calculated (Table 3 and Figure 13). It can be observed in Figure 12 that the RSEI in the study area is on the rise as a whole, with the specific change pattern of rising–falling–rising, specifically, the 1986–1995 period as the rising stage, the 1995–2005 period as the falling stage, and the 2005–2022 period as the final rising stage. It can be observed in Table 3 and Figure 13 that the RSEI of the study area from 1986 to 2022 was concentrated in the range of 0.4–0.6, except in 1986 and 2005. As a whole, the distribution of 0.8–1.0 is the lowest, followed by 0.0–0.2. From the perspective of the specific changes that occur each year, the RSEI grades in the study area were mainly concentrated in the range of 0.2–0.4, accounting for 77.40%. In 1990, the RSEI grades were mainly concentrated in the range of 0.2–0.6, accounting for 89.06%, and in the 1995–2000 period, the RSEI grades increased compared with those in 1990, when the grades were mainly concentrated in the range of 0.4–0.6, accounting for 84.05% and 80.58%, respectively. In 2005, the RSEI grades were significantly low, mainly concentrated in the range of 0.2–0.4, accounting for 85.03%. In 2011, the RSEI of the study area increased significantly, and from 2011 to 2022, the RSEI grades of the study area were mainly concentrated in the range of 0.4–0.6, accounting for 59.41%, 74.40%, and 78.87%, respectively.
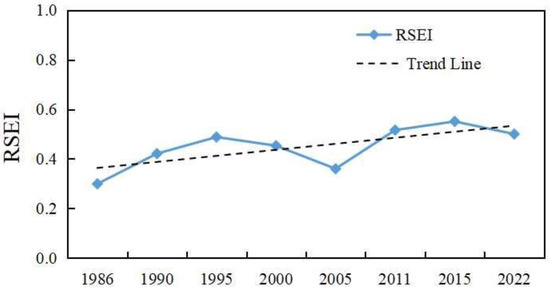
Figure 12.
Variation trend of the RSEI in different years.
Table 3.
Area and proportion of the different grades of the RSEI.
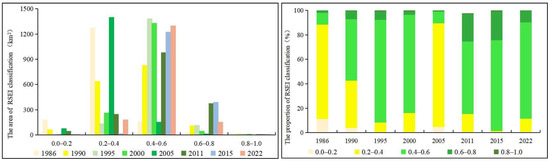
Figure 13.
Area and proportion of the different grades of the RSEI.
4.2.3. Monitoring and Analysis of RSEI Changes
Based on the RSEI classification standard for each year from 1986 to 2022, the statistics of the classification area changes (Table 4) and difference change detection (Figure 14) were conducted for the RSEI images of each adjacent year and the beginning and end years in the study area.
Table 4.
Proportion of the difference in ecological status in the study area.
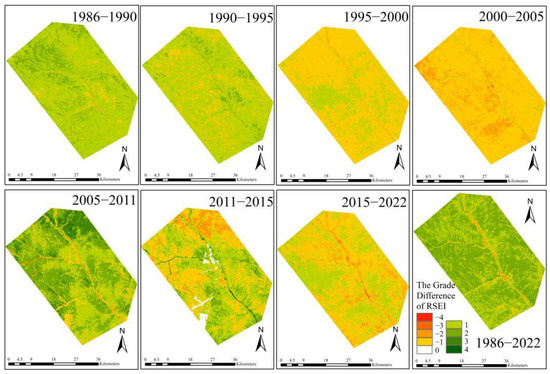
Figure 14.
Variation of the RSEI difference in different years.
It can be observed in Figure 14 that the area with a positive RSEI difference in the 1986–1990, 1990–1995, and 2005–2011 periods is significantly larger than the area with a negative RSEI difference. The area with a negative RSEI grade difference in the 1995–2000 and 2000–2005 periods is significantly larger than the area with a positive RSEI grade difference. Combined with Table 4, it can be concluded that the proportion of the unchanged RSEI level is concentrated in the range of 0.00–0.12%, indicating that the ecological situation of the study area has changed significantly in each consecutive year. In the 1986–1990, 1990–1995, 2005–2011, and 2011–2015 periods, the regions with a positive RSEI differential accounted for 93.67%, 79.72%, 99.21%, and 55.25%, respectively, while in the 1995–2000, 2000–2005, and 2015–2022 periods, the regions with a negative RSEI differential accounted for 75.04%, 97.92%, and 68.43%, respectively. As a whole, in the 1986–2022 period, the RSEI of the study area improved.
From 1986 to 2022, the area where the ecological conditions deteriorated reached 102.38 km2, accounting for about 6.20%, while the area where the ecological conditions improved was 1544.23 km2, accounting for approximately 93.68%, indicating that the ecological quality of the study area increased significantly. Among them, the area of grade 1 was 575.80 km2, accounting for 34.93%, mainly distributed in the west, southwest, and northeast of the edge of the study area. The area of grade 2 was 946.56 km2, accounting for approximately 57.42%, mainly distributed in the northwest and southeast of the study area. The area of grade 3 was 21.53 km2, accounting for approximately 1.31%. The distribution range is small, and it was superimposed on the area of grade 2, namely the northwestern and eastern edges of the study area.
4.3. Analysis of the Driving Factors
In order to further analyze the comprehensive representativeness of the RSEI, the correlation analysis of the RSEI and the four ecological indicators was conducted. The results of the analysis are presented in Table 5. In the calculation of the correlation coefficient between each index, the p-value at the 95% confidence level was less than 0.05, passing the significance test. It can be observed that the RSEI has the highest average correlation, with an average value of 0.709 in the 1986–2022 period and a maximum value of 0.819 in 1986. NDBSI occupies the second place, with an average value of 0.670 in the 1986–2022 period. The correlation of WET, LST, and NDVI is relatively low, with 0.575, 0.452, and 0.435, respectively. From the perspective of single factors, NDBSI has the highest average correlation among the four factors, reaching a maximum value of 0.765 in 1995. The average correlation coefficient between the RSEI and the four factors in each year is greater than 0.669. The average value of the 1986–2022 period is 0.709, which is 33.02% higher than the average value of the four indicators (0.533). It is evident that in addition to integrating the information of each factor, the ecological index is more representative than the individual factor and can better represent the comprehensive ecological situation of the region. To sum up, the indicators related to the ecological status of the study area are in the order of NDBSI > WET > LST > NDVI, from the largest to the smallest.
Table 5.
Correlation matrix of the RSEI and the four factors.
5. Discussion
5.1. Analysis of Driving Forces for Changes in Ecological Environment Quality in Coal Mining Areas
5.1.1. Climate Change
According to the results of the analysis in Section 4.2, NDBSI and WET are the most relevant indicators of the ecological conditions in the study area. Therefore, in order to further explore the relationship among NDBSI, WET, and the RSEI, the temperature (Figure 15) and rainfall (Figure 16) in the 1986–2015 period were statistically analyzed.
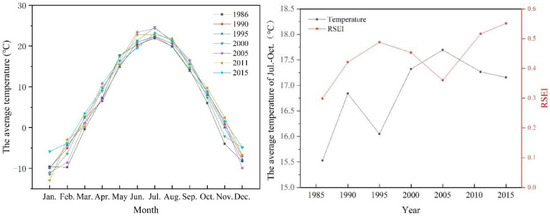
Figure 15.
Annual change in temperature from 1986 to 2015.
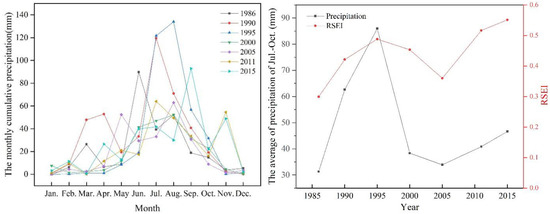
Figure 16.
Annual change in precipitation from 1986 to 2015.
It can be observed in the first figure that the temperature distribution trend of the study area in the 1986–2015 period was consistent. The highest temperature occurred between June and August, and the lowest temperature occurred between November and February. The overall temperature in the 1986–2015 period presented a fluctuating upwards trend, and the change range of temperature was small, with an annual mean difference of 2.5 °C. From 1986 to 2015, the annual rainfall changed significantly, especially in summer (July to October). Except for 2000, there were peaks in the summers of the 1986–2015 period, and the summer rainfall in 2000 was significantly lower than the summer rainfall in the other years. At the same time, it can be observed that the changes in the RSEI and the rainfall from July to October of the 1986–2015 period were consistent, with the lowest average rainfall values in 2000 and 2005, and the corresponding value of the RSEI was also low. Therefore, we can consider that rainfall is the main factor affecting the ecological status of the study area.
5.1.2. Coal Mining Intensity
There are more than ten coal mines concentrated in the research area, with the mining area accounting for 55.15% of the entire research area (Figure 1). Scholars have shown that coal mining activities are one of the factors affecting the quality of the ecological environment in mining areas [42,43]. From 1985 to 2022, coal mining in Ordos City, Inner Mongolia, and Yulin City, Shaanxi Province, experienced a period of vigorous development (Figure 17), with raw coal production increasing 265 times and 290 times, respectively. Due to the special geographical location of the Shendong Mining Area, it is the main coal production area of the two cities. Specifically, from 1985 to 2000, it was in the initial and exploratory stage, with a growth of 38 million tons in raw coal production over the past 15 years. From 2000 to 2008, it was in the stage of innovation integration, with a significant increase in productivity. Over the past 8 years, the production of raw coal increased by 377 million tons. The period from 2008 to 2022 belongs to a leapfrog development period, with a 14-year increase in raw coal production of 941 million tons. From the perspective of the RSEI in the research area, the overall trend showed a fluctuating increase from 1986 to 2022. Compared with the RSEI in 1986, the RSEI in 2022 increased by 67.22%, indicating that the mining of coal resources did not have a serious negative impact on the ecological environment.
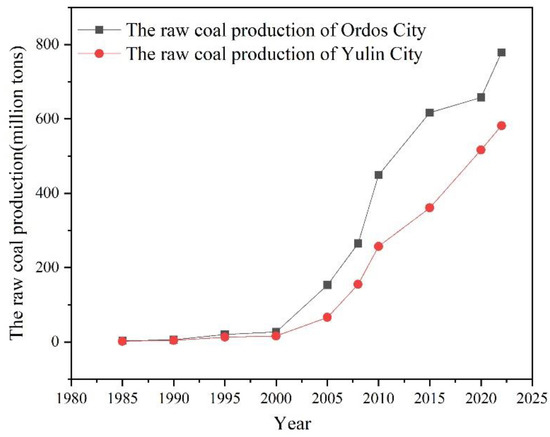
Figure 17.
The raw coal production of Yulin City and Ordos City from 1985 to 2022.
5.1.3. Policy and Technology
Ecological restoration is the main reason for the improvement in the ecological environment of the Shendong Mining Area. Since the 1980s, the Chinese government and relevant departments have formulated a series of policies and regulations to deal with the degradation of the ecological environment. For example, the Provisions on Land Reclamation was officially implemented on 1 January 1989; the Notice on the Strengthening of Land Reclamation Management for Production and Construction Projects was issued in 2006; and the Land Reclamation Regulations was issued by the State Council in 2011. From the implementation of the Provisions on Land Reclamation to the end of 2015, the ecological restoration rate of China’s mining areas rose from 2% to 48% [44,45]. The results of ecological restoration in the mining area were also reflected in Shendong Mining Area. As of 2015, the Shendong Mining Area has invested a total of CNY 1.45 billion in ecological construction funds. In the early stages of development in 1985, the vegetation coverage rate was between 3% and 11%, which has now increased to over 60%, and the ecological construction governance area has reached 245 km2, which is 1.5 times the coal mining area at that time [46]. It is worth noting that the RSEI of the Shendong Mining Area has significantly improved during the two stages of the 2005–2010 and 2010–2015 periods, which is related to the strong measures implemented in China in 2007, such as the formal inclusion of land reclamation in mining permits and land use approvals [47]. Research showed that the land reclamation area in the Shendong Mining Area had increased by 63%, and the land types in the mining area had significantly improved. The damaged land areas such as collapsed land, accumulated land, and mining land had decreased, while the agricultural land, construction land, and forestry land in the mining area had increased [48].
In addition, technological progress has also promoted the improvement of ecological quality in mining areas. Since 2005, the Shendong Mining Area has implemented artificial-assisted restoration technology, sealing and restoration technology, and ecological function optimization technology in subsidence areas. The Shendong Mining Area has carried out research on technologies such as management and protection, fertilization, and pest control and proposed an active ecological environment prevention and control model for “large-scale ecological environment prevention and control, controlling local desertification caused by mining subsidence” in desert areas [49]. Therefore, driven by policy support and technological progress, the ecological quality of the Shendong Mining Area has gradually shifted from poor to good, achieving positive succession of the ecosystem.
Future policy and technological guidance should focus on the following two aspects: (i) Strengthen ecological environment monitoring in mining areas. The characteristics and problem diagnosis of land and ecological environment damage in mining areas are key to ecological restoration. The combination of drone remote sensing and artificial intelligence technology will provide strong technical support for ecological environment monitoring and problem identification diagnosis in mining areas and can achieve precise and efficient monitoring of the ecological environment in mining areas. (ii) Enhancing the stability of the mining area ecosystem. According to the overall, systematic, and inherent laws of the ecosystem, we should learn from nature and carry out systematic restoration. After nearly 30 years of ecological restoration, the vegetation coverage of the ecologically fragile Shendong Mining Area has significantly increased; however, the plant population is single and the ecological stability is poor. Therefore, we should attach great importance to the research of ecological stability improvement technology, natural landscape restoration technology, and engineering governance technology to reduce disturbance in order to achieve the improvement of ecological restoration from quantity to quality [47].
5.2. Limitations and Future Work
This paper uses the GEE platform, based on Landsat TM/OLI data, to analyze the trend of ecological remote sensing index changes in the Shendong Mining Area from 1986 to 2022 using the RSEI and explores the main influencing factors that cause its changes. Through research, it was found that the RSEI of the Shendong Mining Area showed a fluctuating upward trend from 1986 to 2022, which is similar to the results of other related studies [29,50]; so, the reliability of this method has been proven. From a global perspective, research on using the RSEI for monitoring the ecological environment of mining areas mainly focuses on China. Most foreign scholars still apply the RSEI to urban ecological environment monitoring [51,52,53], with few applying it to ecological environment monitoring in mining areas. This may be due to different coal mining methods in different countries, resulting in different focus and research content [54,55]. This approach improves accuracy and also reflects practical issues more objectively and quickly compared with traditional methods.
This method has certain advantages but also has certain drawbacks. This method is based on remote sensing technology and has certain requirements for the quantity and quality of satellite data. In this research, we use LandsatTM/OLI data with a spatial resolution of 30 m, which can meet the research requirements. However, the satellite revisit period is 16 days, and satellite data with cloud cover greater than 20% are removed. Ultimately, there are few satellite data that reflect the surface ecological quality in vegetation growth season, and there may be situations where suitable data sources cannot be selected in individual years. Therefore, multisource data fusion can be considered to improve the temporal resolution of satellite data. In addition, the initial application scenario of the RSEI is in cities, so the four indicators composed of greenness, humidity, dryness, and heat can well reflect the ecological environment changes in urban areas. However, in mining cities, there is a lack of consideration for mining area characteristic factors, such as soil erosion, soil quality, groundwater resources, and other factors which were caused by mining. Therefore, future research can combine the above factors to construct an improved RSEI, which can further improve the monitoring accuracy of ecological environment quality in mining areas.
6. Conclusions
This paper calculated the RSEI from 1986 to 2022 by using Landsat TM/OLI as the data source and the Shendong Mining Area as the case study area, and the overall RSEI showed an upward trend, indicating that the overall ecological situation of the study area showed a trend of improvement from 1986 to 2022. By analyzing the impact of climate change, coal mining intensity, policies, and technologies on the ecological environment quality of mining areas, it can be found that although traditional concepts believe that coal mining will cause certain damage to the ecological environment, under the promotion of policy support and technological progress, the ecological quality of mining areas has gradually shifted from poor to good, achieving positive succession of ecological environmental quality. This study can provide reference for how to further improve the ecological environment of mining areas in the future, thereby ensuring the sustainable development of coal mining.
Author Contributions
Conceptualization, L.B.; methodology, L.B.; software, L.B. and S.L.; validation, S.L. and G.L.; writing—original draft preparation, L.B.; writing—review and editing, L.B, and K.Z.; visualization, S.L. and G.L.; supervision, Y.Y.; funding acquisition, Y.Y. All authors have read and agreed to the published version of the manuscript.
Funding
This research was funded by the Science and Technology Innovation Project of CHN ENERGY (GJNY-22-92), the National Natural Science Foundation of China (52004012), and the Science and Technology Innovation Project of CHN ENERGY (GJNY2030XDXM-19–03.1, GJNY-21-129).
Data Availability Statement
Experimental data are available upon request from the authors.
Acknowledgments
All support that was provided is acknowledged in the Author Contributions and Funding Sections.
Conflicts of Interest
The authors declare no conflict of interest.
References
- BP. BP Statistical Review of World Energy 2021; BP: London, UK, 2021. [Google Scholar]
- Hu, Z.; Wang, X.; He, A. Distribution characteristic and development rules of ground fissures due to coal mining in windy and sandy region. J. China Coal Soc. 2014, 39, 11–18. [Google Scholar]
- Zhou, D.; Wu, K.; Cheng, G.; Li, L. Mechanism of mining subsidence in coal mining area with thick alluvium soil in China. Arab. J. Geosci. 2015, 8, 1855–1867. [Google Scholar] [CrossRef]
- Tan, W.; Wang, L.; Huang, C. Environmental effects of coal gangue and its utilization. Energy Sources Part A Recovery Utilization Environ. Eff. 2016, 38, 3716–3721. [Google Scholar] [CrossRef]
- Ma, K.; Zhang, Y.; Ruan, M.; Guo, J.; Chai, T. Land Subsidence in a Coal Mining Area Reduced Soil Fertility and Led to Soil Degradation in Arid and Semi-Arid Regions. Int. J. Environ. Res. Public Health 2019, 16, 3929. [Google Scholar] [CrossRef] [PubMed]
- Jing, Z.; Wang, J.; Zhu, Y.; Feng, Y. Effects of land subsidence resulted from coal mining on soil nutrient distributions in a loess area of China. J. Clean. Prod. 2018, 177, 350–361. [Google Scholar] [CrossRef]
- Xiao, W.; Zheng, W.; Zhao, Y.; Chen, J.; Hu, Z. Examining the relationship between coal mining subsidence and crop failure in plains with a high underground water table. J. Soils Sediments 2021, 21, 2908–2921. [Google Scholar] [CrossRef]
- Matsumoto, S.; Ogata, S.; Shimada, H.; Sasaoka, T.; Kusuma, G.J.; Gautama, R.S. Application of Coal Ash to Postmine Land for Prevention of Soil Erosion in Coal Mine in Indonesia: Utilization of Fly Ash and Bottom Ash. Adv. Mater. Sci. Eng. 2016, 8386598. [Google Scholar] [CrossRef]
- He, T.; Xiao, W.; Zhao, Y.; Deng, X.; Hu, Z. Identification of water logging in Eastern China induced by mining subsidence: A case study of Google Earth Engine time-series analysis applied to the Huainan coal field. Remote Sens. Environ. 2020, 242, 111742. [Google Scholar] [CrossRef]
- Xiao, W.; Zhang, W.; Ye, Y.; Lv, X.; Yang, W. Is underground coal mining causing land degradation and significantly damaging ecosystems in semi-arid areas? A study from an Ecological Capital perspective. Land Degrad. Dev. 2020, 31, 1969–1989. [Google Scholar] [CrossRef]
- Lv, X.J.; Xiao, W.; Zhao, Y.L.; Zhang, W.K.; Li, S.C.; Sun, H.X. Drivers of spatio-temporal ecological vulnerability in an arid, coal mining region in western china. Ecol. Indic. 2019, 106, 105475.1–105475.18. Ecol. Indic. 2019, 106, 105475.1–105475.18. [Google Scholar]
- Xiao, W.; Lv, X.J.; Zhao, Y.L.; Sun, H.X.; Li, J.Q. Ecological resilience assessment of an arid coal mining area using index of entropy and linear weighted analysis: A case study of Shendong Coalfield, China. Ecol. Indic. Integr. Monit. Assess. Manag. 2020, 109, 105841–105843. [Google Scholar] [CrossRef]
- Xu, H. A remote sensing urban ecological index and its applicationt. Acta Ecol. Sin. 2013, 33, 7853–7862. [Google Scholar]
- Xu, H.; Deng, W. Rationality Analysis of MRSEI and Its Difference with RSEI. Remote Sens. Technol. Appl. 2022, 37, 1–7. [Google Scholar]
- Sawut, R.; Abliz, A.; Hu, L.; Kasim, N.; Li, X. Dynamic Monitoring and Analysis of Ecological Environment in Fukang City Based on RSEI Model. Res. Soil Water Conserv. 2020, 27, 283–289, 297. [Google Scholar]
- Yang, Y.; Xu, G.; Chen, X.; Wu, S.; Lian, Y. Ecological changes of Lalin Highway based on ecological remote sensing index. J. Tianjin Norm. Univ. (Nat. Sci. Ed.) 2022, 42, 51–58. [Google Scholar]
- Shi, H.; Shi, T.; Liu, Q.; Wang, Z. Ecological vulnerability of tourism scenic spots:based on remote sensing ecological index. Pol. J. Environ. Stud. 2021, 30, 3231–3248. [Google Scholar] [CrossRef]
- Li, T.; Ma, C.; Guo, Z. Ecological quality evaluation and influencing factors analysis of Helan Mountain based on RSEI. Chin. J. Ecol. 2021, 40, 1154. [Google Scholar] [CrossRef]
- Kumar, E.; Subramani, T.; Li, P.Y.; Karunanidhi, D. Quantification of Health and Environmental Risks Due to Radionuclides in Limestone Mining Regions of Ariyalur, South India. Hum. Ecol. Risk Assess. 2022, 2, 243–264. [Google Scholar] [CrossRef]
- Dutta, M.; Saikia, J.; Tafarel, S.R.; Waanders, F.B.; de Medeiros, D.; Cutruneo, C.M.; Silva, L.F.O.; Saikia, B.K. Environmental assessment and nano-mineralogical characterization of coal, overburden and sediment from Indian coal mining acid drainage. Geosci. Front. 2017, 8, 1285–1297. [Google Scholar] [CrossRef]
- Choudhury, A.; Lahkar, J.; Saikia, B.K.; Singh, A.K.A.; Chikkaputtaiah, C.; Boruah, H.P.D. Strategies to address coal mine-created environmental issues and their feasibility study on northeastern coalfields of Assam, India: A review. Environ. Dev. Sustain. 2020, 7, 9667–9709. [Google Scholar] [CrossRef]
- Pradhan, S.K.; Kumar, U.; Singh, N.R.; Thatoi, H. Functional diversity and metabolic profile of microbial community of mine soils with different levels of chromium contamination. Int. J. Environ. Health Res. 2019, 4, 461–473. [Google Scholar] [CrossRef]
- Lu, P.; Tan, Y.J.; Dai, N.H.; Di, M.X.; Weng, X.D.; Zhan, Y.H.; Xu, D.R. Composition and Structure of Soil Fauna Communities and Their Relationships with Environmental Factors in Copper Mine Waste Rock after Re-vegetation. Glob. Ecol. Conserv. 2021, 32, e01889. [Google Scholar] [CrossRef]
- Ahirwal, J.; Maiti, S.K. Restoring Coal Mine Degraded Lands in India for Achieving the United Nations-Sustainable Development Goals. Restor. Ecol. 2021, 5, 13606. [Google Scholar] [CrossRef]
- Worlanyo, A.S.; Li, J.F. Evaluating the Environmental and Economic Impact of Mining for Post-mined Land Restoration and Land-use: A Review. J. Environ. Manag. 2021, 279, 111623. [Google Scholar] [CrossRef] [PubMed]
- Wu, Z.; Wang, M.; Chen, S.; Zou, D. Monitoring and evaluation of ecological environment’s spatio-temporal variation in mine based on RSEI-a case of Yongding mine. Ecol. Sci. 2016, 35, 200–207. [Google Scholar]
- Wu, S. Romote Sensing Monitoring and Evaluation of Ecological Environment in Coal Mine Subsidence Area-A Case Study of Mataihao Mining Area; China University of Mining and Technology: Xuzhou, China, 2021. [Google Scholar]
- Fan, D.; Qiu, Y.; Sun, W.; Zhao, X.; Mai, X.; Hu, Y. Evaluating ecological environment based on remote sensing ecological index in Shenfu mining area. Bull. Surv. Mapp. 2021, 7, 23–28. [Google Scholar]
- Li, R.; Chen, G.; Li, W.; Meng, R.; Wang, M.; Guo, Y. Spatiotemporal Analysis of Eco-environmental Benefits in Shenfu-Dongsheng Mining Area During 1995–2020 Based on RSEI. Bull. Soil Water Conserv. 2021, 41, 143–151. [Google Scholar]
- Liu, Y.; Wei, J.L.; Bi, Y.L.; Yue, H.; He, X. Evaluation of ecosystem service function in Shendong mining area. J. China Coal Soc. 2021, 46, 1599–1633. [Google Scholar]
- Liu, Y.; Wei, J.L.; Yue, H.; Wang, Y. Analysis on temporal and spatial characteristics and driving factors of soil erosion in Shendong mining area. Sci. Surv. Mapp. 2022, 47, 142–153. [Google Scholar]
- Zhou, H.F. Exploration and practice of building world—class mine in Shendong Mining Area. Coal Sci. Technol. 2015, 43, 26–28. [Google Scholar]
- Song, Y.Y.; Xue, D.Q.; Dai, L.H. Spatial-temporal pattern and evolution mechanism of coordinated development of human settlement environment and economy in energy accumulation and vulnerable ecology regions: A case of contiguous areas among Shanxi-Shaanxi-Inner Mongolia. Arid Land Geogr. 2017, 40, 1328–1337. [Google Scholar]
- Liao, W.; Nie, X.; Zhang, Z. Interval association of remote sensing ecological index in China based on concept lattice. Environ. Sci. Pollut. Res. 2022, 29, 34194–34208. [Google Scholar] [CrossRef] [PubMed]
- Tang, H.; Fang, J.W.; Xie, R.J.; Ji, X.L.; Li, D.Y.; Yuan, J. Impact of Land Cover Change on a Typical Mining Region and Its Ecological Environment Quality Evaluation Using Remote Sensing Based Ecological Index (RSEI). Sustainability 2022, 14, 12694. [Google Scholar] [CrossRef]
- Hu, X.; Xu, H. A new remote sensing index for assessing the spatial heterogeneity in urban ecological quality: A case from Fuzhou City, China. Ecol. Indic. 2018, 89, 11–21. [Google Scholar] [CrossRef]
- Estoque, R.C.; Murayama, Y.; Myint, S.W. Effects of landscape composition and pattern on land surface temperature: An urban heat island study in the megacities of Southeast Asia. Sci. Total Environ. 2017, 577, 349–359. [Google Scholar] [CrossRef]
- United States Geological Survey (USGS). Landsat 8 (L8) Data Users Handbook; Geological Survey, Department of the Interior, U.S: Washington, DC, USA, 2016. [Google Scholar]
- Cui, R.H.; Han, J.Z.; Hu, Z.Q. Assessment of Spatial Temporal Changes of Ecological Environment Quality: A Case Study in Huaibei City, China. Land 2022, 6, 944. [Google Scholar] [CrossRef]
- Lian, Z.K.; Hao, H.C.; Zhao, J.; Cao, K.Z.; Wang, H.S.; He, Z.C. Evaluation of Remote Sensing Ecological Index Based on Soil and Water Conservation on the Effectiveness of Management of Abandoned Mine Landscaping Transformation. Int. J. Environ. Res. Pubic Health 2022, 15, 9750. [Google Scholar] [CrossRef]
- Xu, F.; Li, H.K.; Li, Y.S. Ecological environment quality evaluation and evolution analysis of a rare earth mining area under different disturbance conditions. Environ. Geochem. Health 2020, 6, 2243–2256. [Google Scholar]
- Yang, Y.M.; Liu, S.Y.; Zhang, K.; Bai, L.; Wu, F.X. Comprehensive Evaluation of Ecological Environmental Quality in Small-Scale Coal Mining Subsidence Area Based on Hierarchical Structure-A Case Study of Shendong Coalfield in Western China. Processes 2022, 10, 952. [Google Scholar] [CrossRef]
- Awotwi, A.; Anornu, G.K.; Quaye-Ballard, J.A.; Thompson, A. Monitoring land use and land cover changes due to extensive gold mining, urban expansion, and agriculture in the Pra River basin of Ghana, 1986–2025. Land Degrad. Dev. 2018, 29, 3331–3343. [Google Scholar] [CrossRef]
- National Development and Reform Commission of China; National Energy Administration of China. 13th Five-Year Plan for Coal Industry Development; National Development and Reform Commission (NDRC): Beijing, China, 2016. [Google Scholar]
- Nie, X.R.; Hu, Z.Q.; Zhu, Q.; Ruan, M.Y. Research on Temporal and Spatial Resolution and the Driving Forces of Ecological Environment Quality in Coal Mining Areas Considering Topographic Correction. Remote Sens. 2021, 13, 2815. [Google Scholar] [CrossRef]
- Kang, S.Y.; Xia, S.H.; Wang, H.J.; Liu, R. Ecological Construction Mode of Shendong Mining Area of China Shenhua. Shenhua Sci. Technol. 2016, 14, 3–6. [Google Scholar]
- Hu, Z.Q. The 30 Years’Land Reclamation and Ecological Restoration in China: Review, Rethinking and Prospect. Coal Sci. Technol. 2019, 47, 25–35. [Google Scholar] [CrossRef]
- Yu, X.Y.; Mu, C. Benefit evaluation of land reclamation in Shendong mining area. J. Xi’an Univ. Sci. Technol. 2019, 39, 201–208. [Google Scholar]
- Guo, Y.N.; Yang, P.; Yang, J.Z.; Wang, Y.; He, A.M.; Li, N.K. Discussion on coal mining and ecological environment control in desertification mining area. Shaanxi Coal 2014, 33, 16–18. [Google Scholar]
- Yue, H.; Liu, Y.; Zhu, R. Monitoring Ecological Environment Change Based on Remote Sensing Ecological Index in Shendong Mining Area. Bull. Soil Water Conserv. 2019, 39, 101–107. [Google Scholar]
- Boori, M.S.; Choudhary, K.; Paringer, R.; Kupriyanov, A. Spatiotemporal ecological vulnerability analysis with statistical correlation based on satellite remote sensing in Samara, Russia. J. Environ. Manag. 2021, 285, 112138. [Google Scholar] [CrossRef] [PubMed]
- Lai, S.H.; Eladawy, A.; Sha, J.M.; Li, X.M.; Wang, J.L.; Kurbanov, E.; Lin, Q.X. Towards an integrated systematic approach for ecological maintenance: Case studies from China and Russia. Ecol. Indic. 2022, 140, 108982. [Google Scholar] [CrossRef]
- Maity, S.; Das, S.; Pattanayak, J.M.; Bera, B.; Shit, P.K. Assessment of ecological environmenta quality in Kolkata urban agglomeration, India. Urban Ecosyst. 2022, 4, 1137–1154. [Google Scholar] [CrossRef]
- Lechner, A.M.; Baumgartl, T.; Matthew, P.; Glenn, V. The impact of underground longwall mining on prime agricultural land: A review and research agenda. Land Degrad. Dev. 2014, 27, 1650–1663. [Google Scholar] [CrossRef]
- Darmody, R.G.; Bauer, R.; Barkley, D.; Clarke, S.; Hamilton, D. Agricultural impacts of longwall mine subsidence: The experience in Illinois, USA and Queensland, Australia. Int. J. Coal Sci. Technol. 2014, 1, 207–212. [Google Scholar] [CrossRef]


Disclaimer/Publisher’s Note: The statements, opinions and data contained in all publications are solely those of the individual author(s) and contributor(s) and not of MDPI and/or the editor(s). MDPI and/or the editor(s) disclaim responsibility for any injury to people or property resulting from any ideas, methods, instructions or products referred to in the content. |
© 2023 by the authors. Licensee MDPI, Basel, Switzerland. This article is an open access article distributed under the terms and conditions of the Creative Commons Attribution (CC BY) license (https://creativecommons.org/licenses/by/4.0/).