
Failure Characterization and Analysis of a Sport Utility Vehicles SUV Rear Door Damper Made by Nylon as Structural Element
 ,
,  and
and
Abstract
:1. Introduction
2. Materials and Methods
3. Results
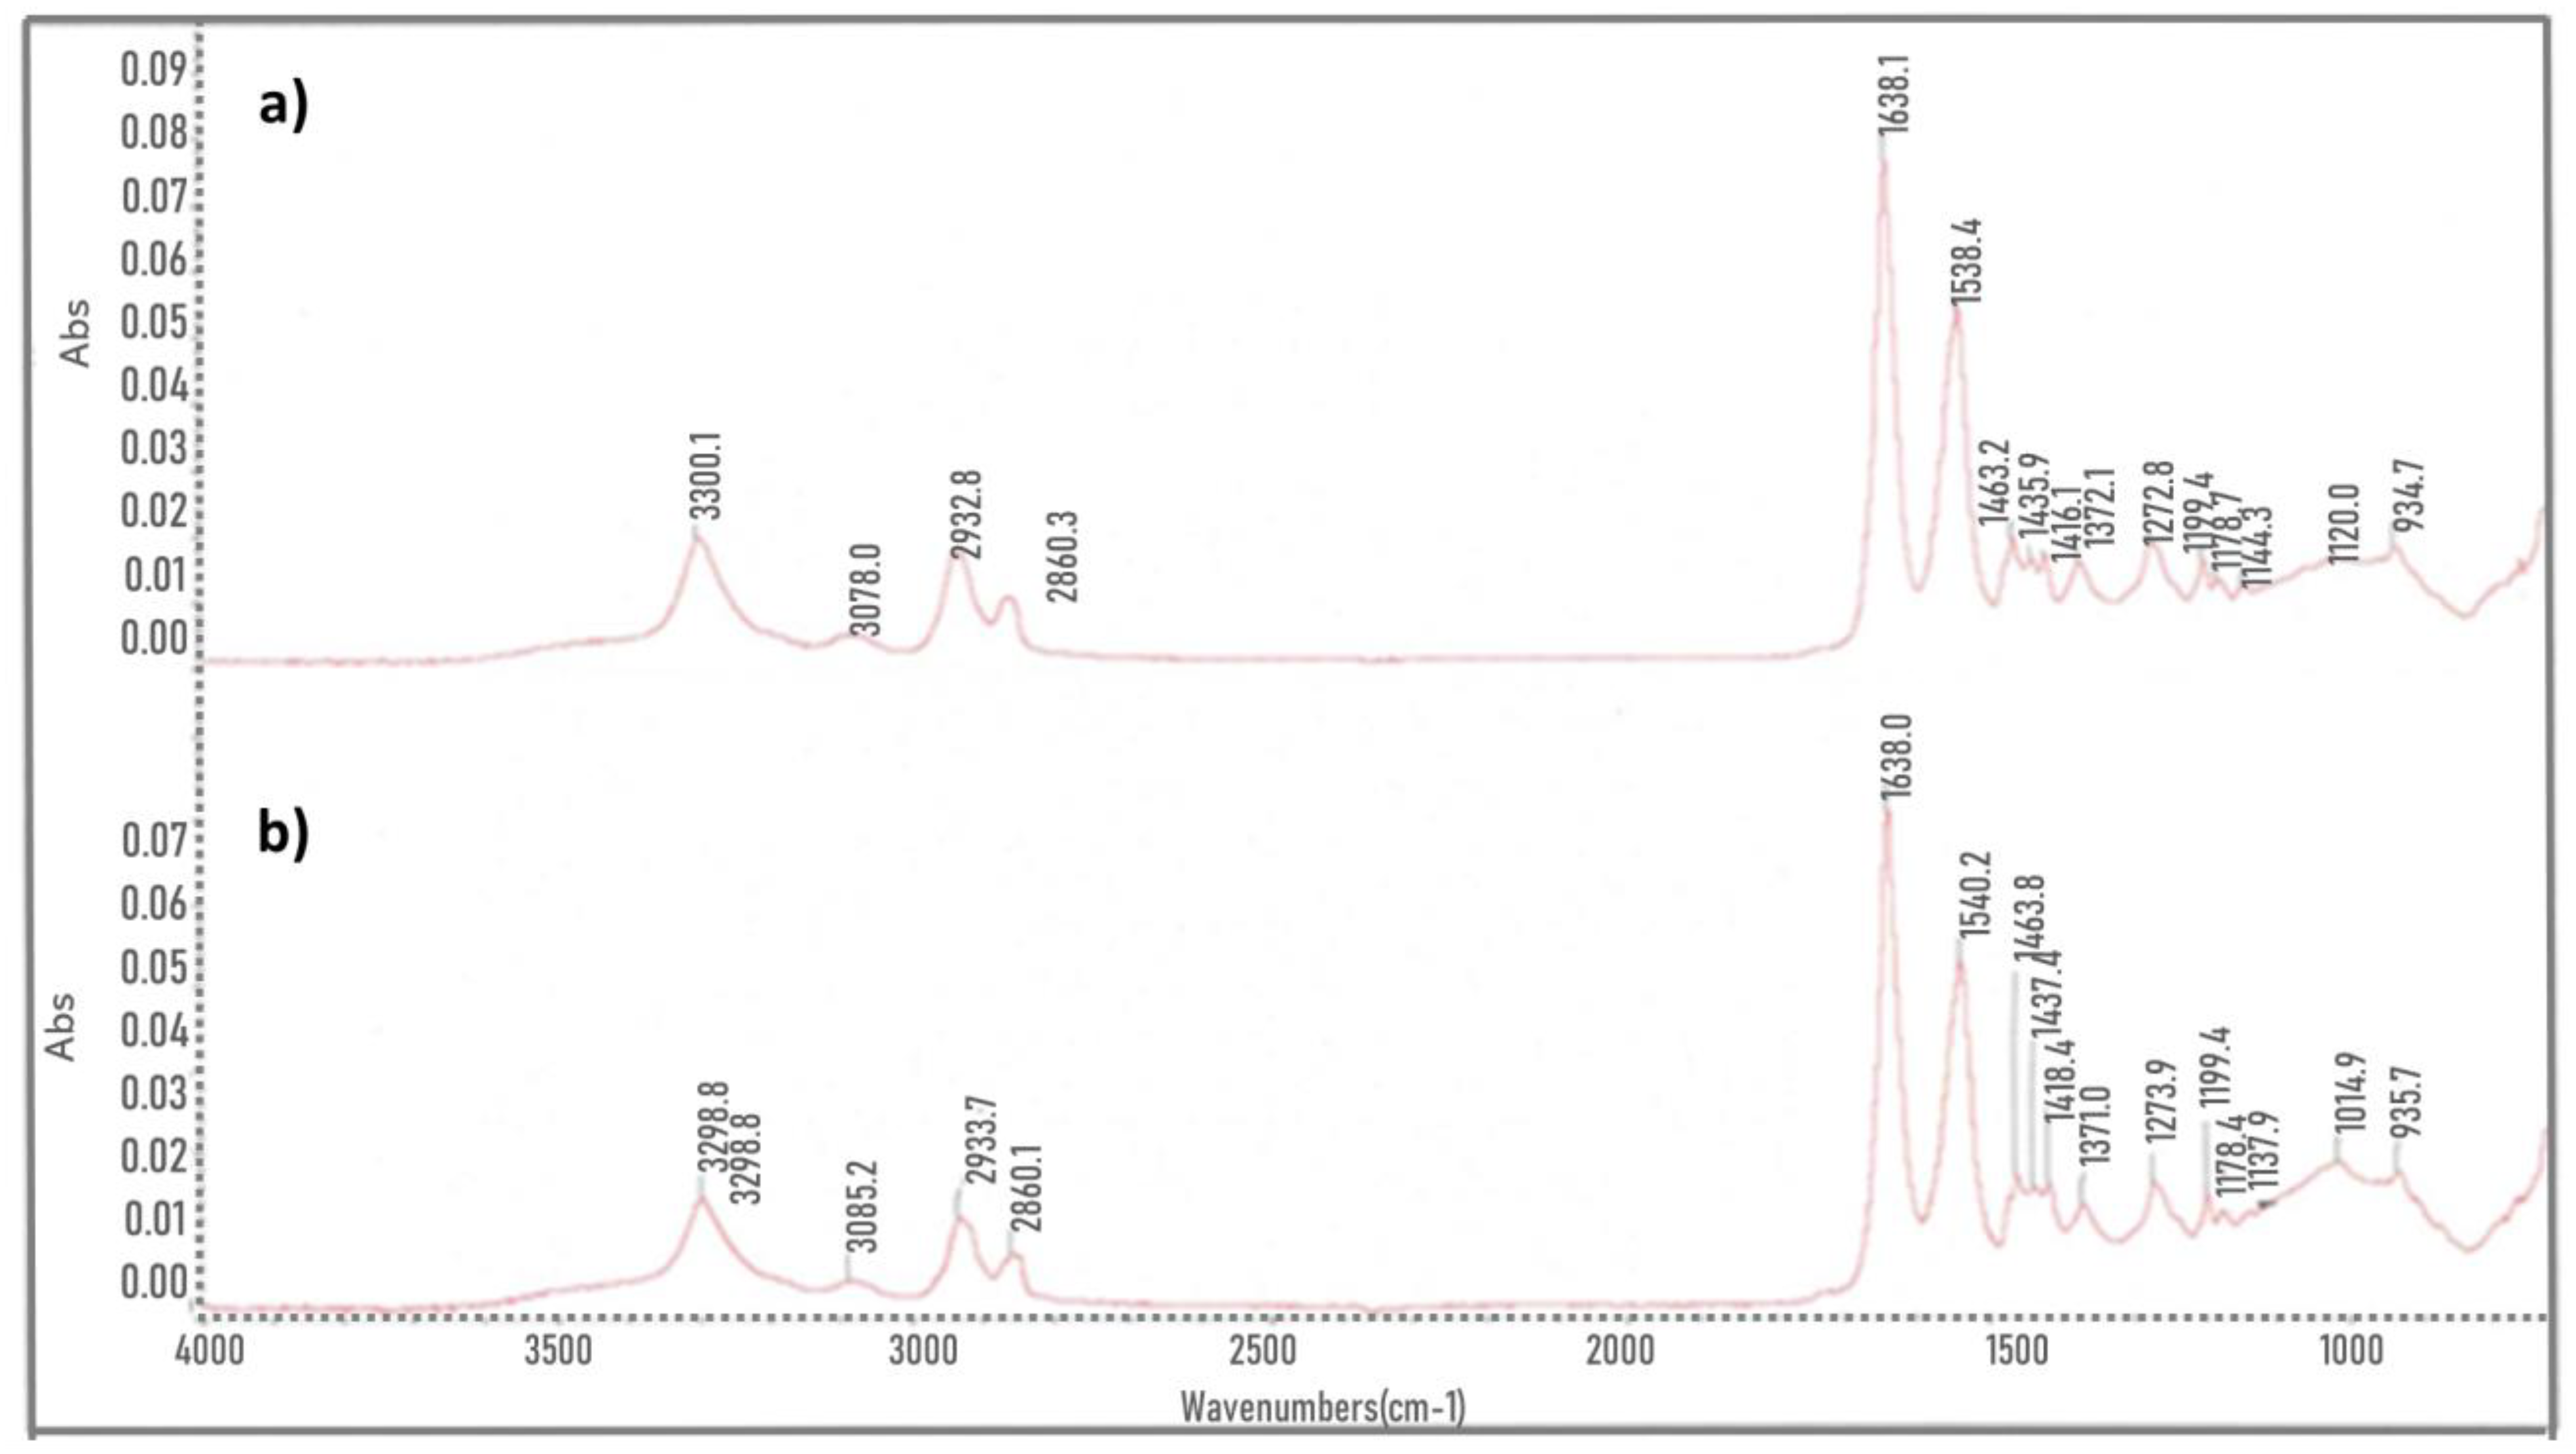
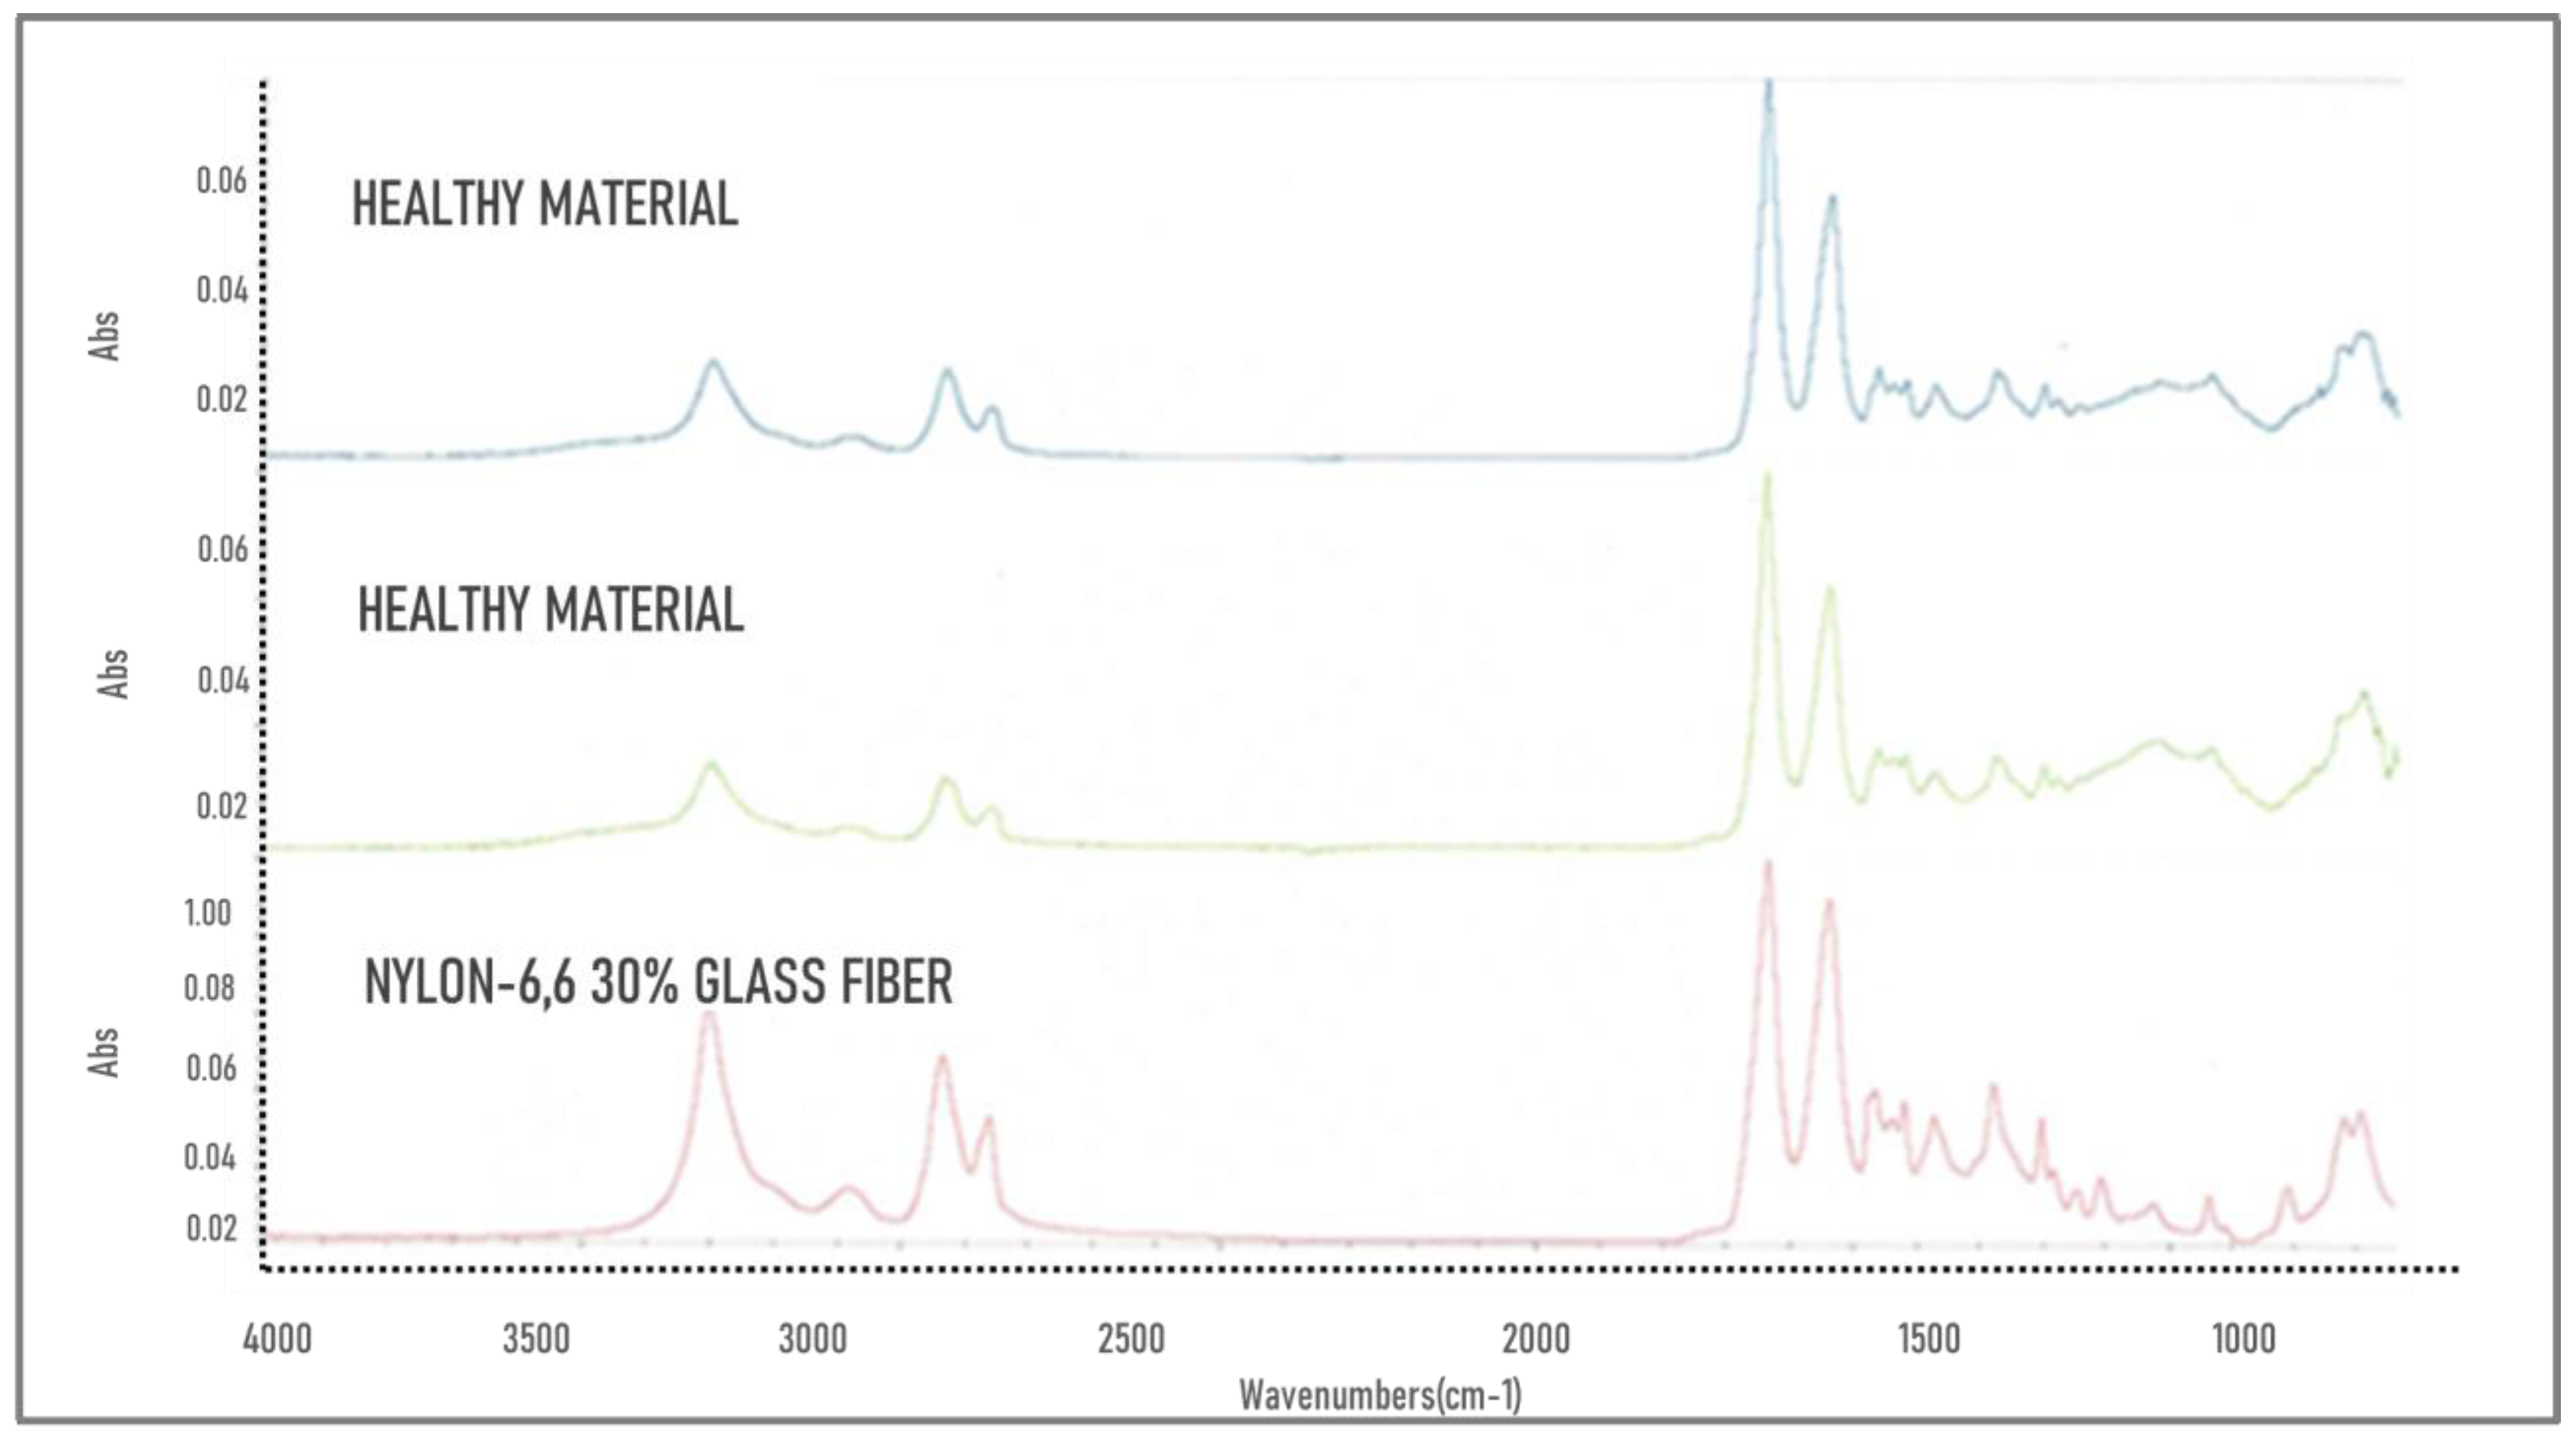
3.1. FTIR
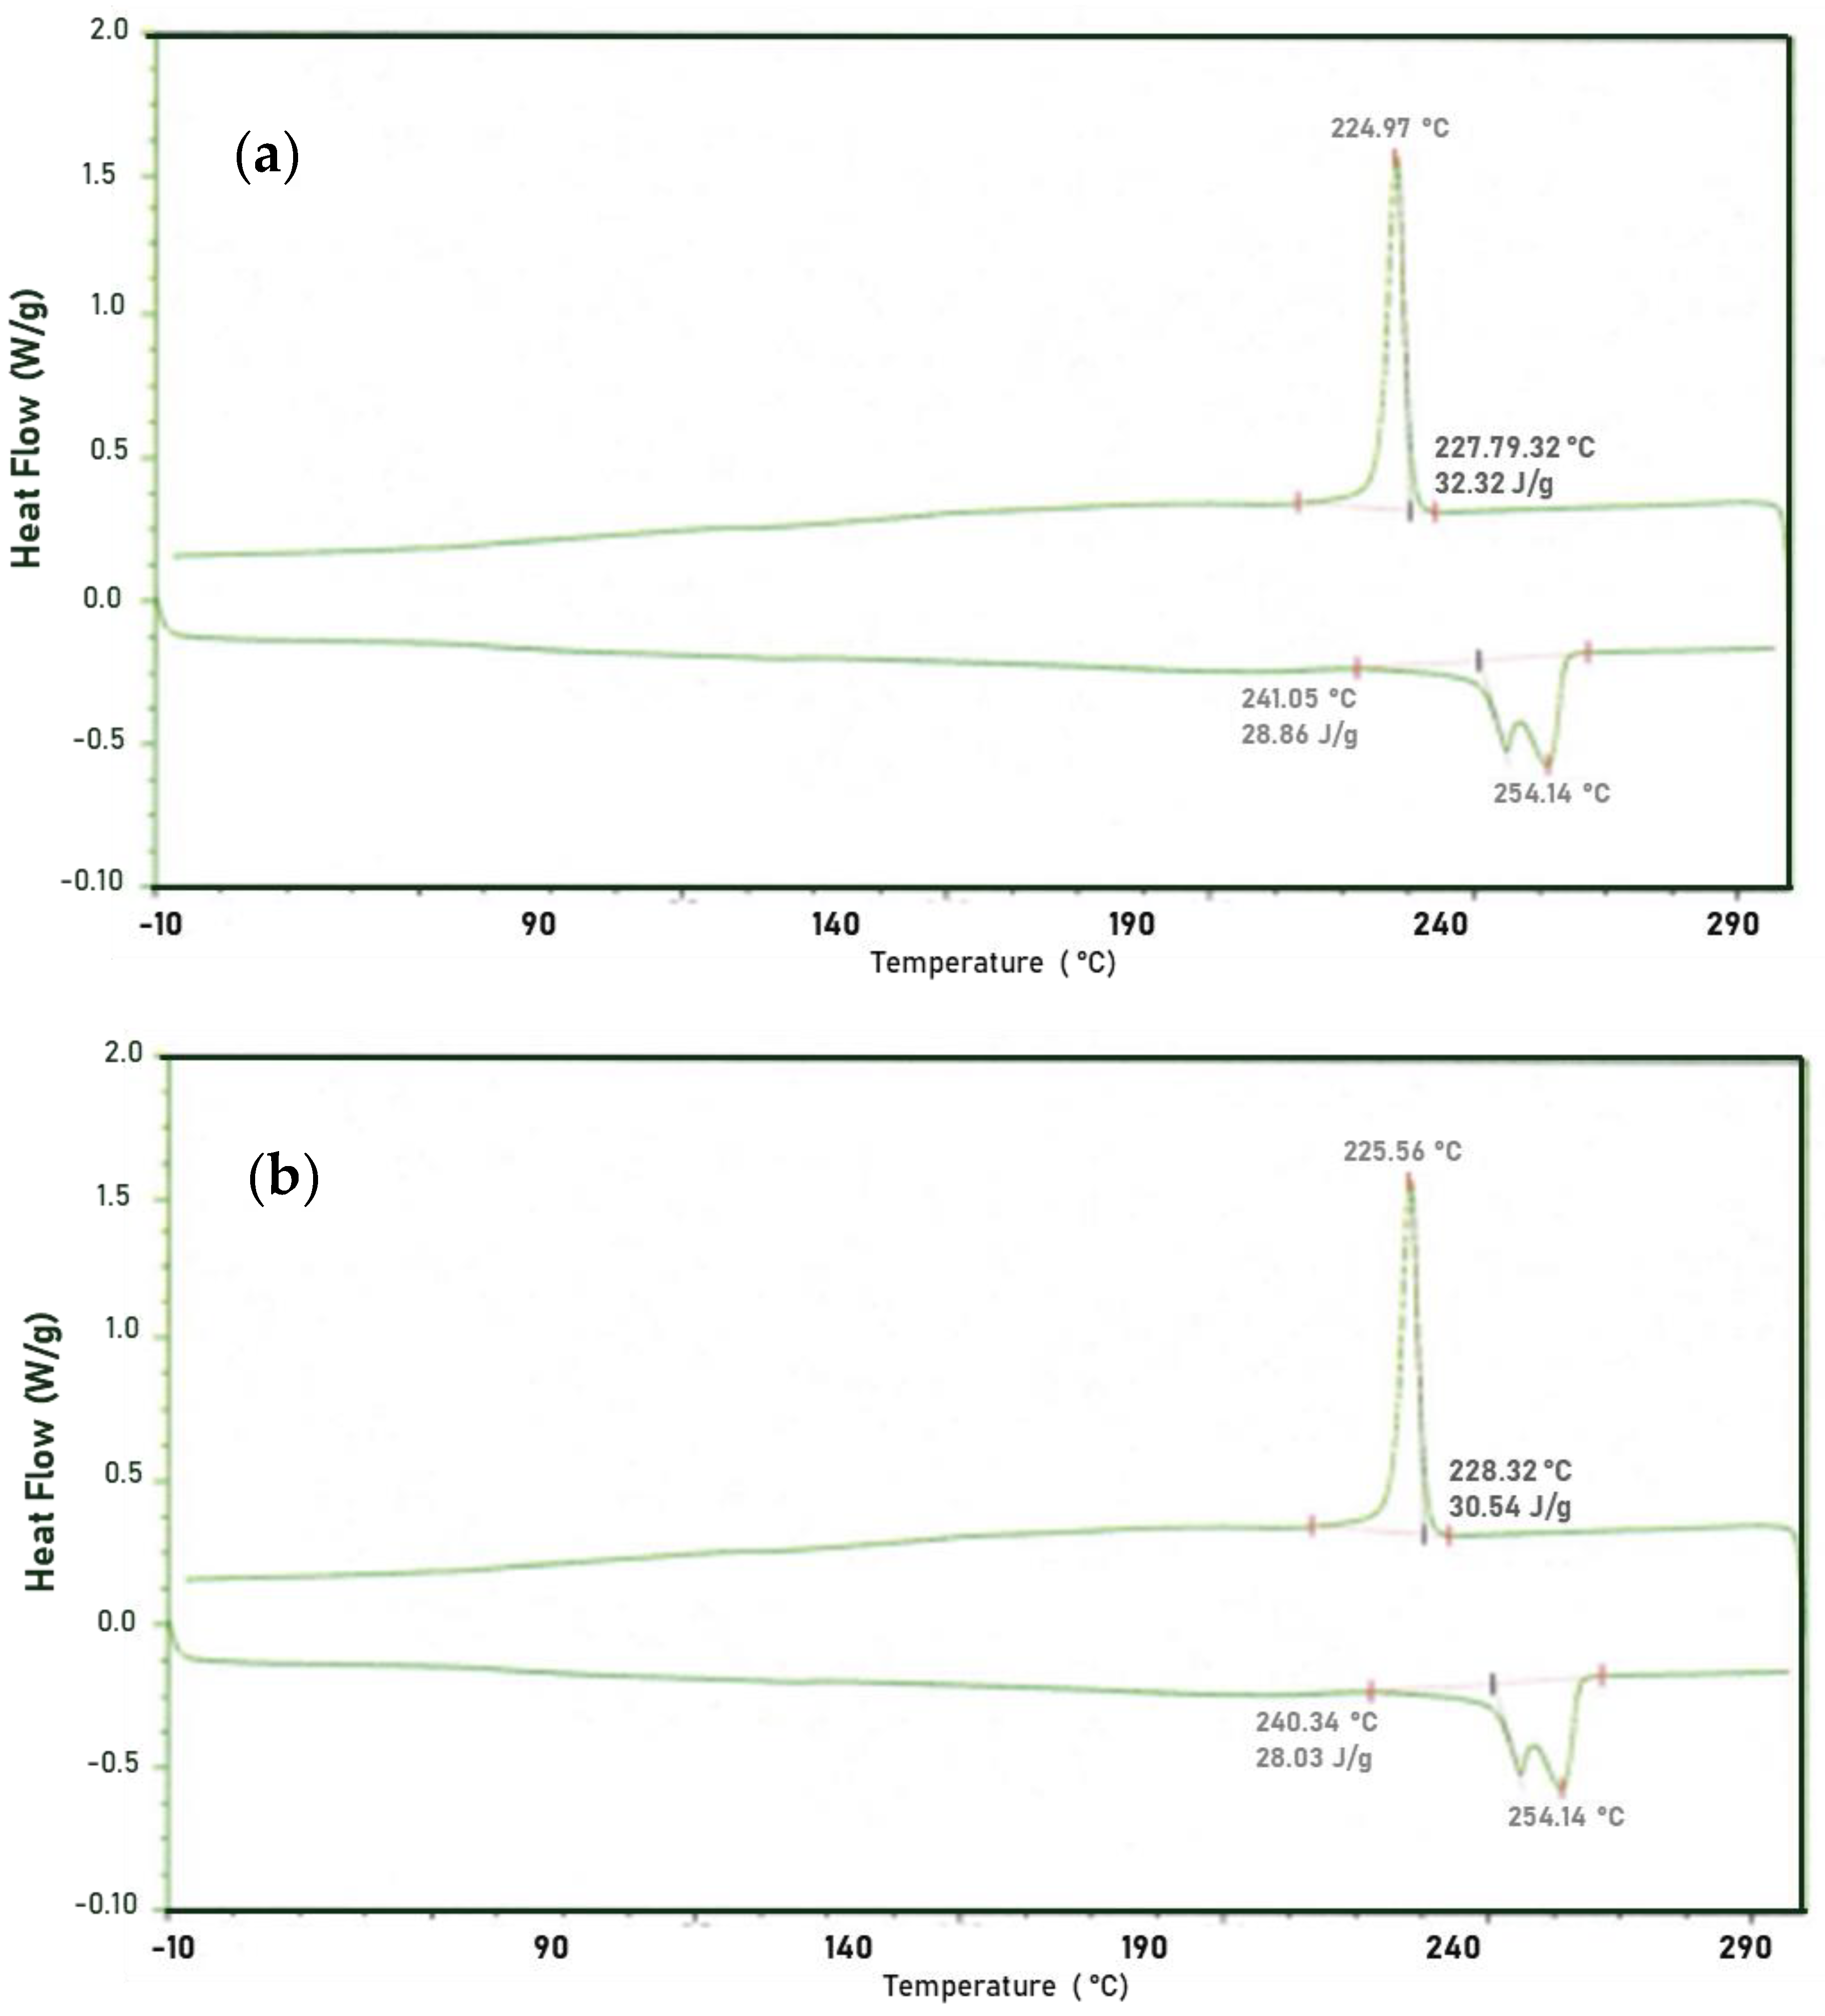
3.2. Differential Scanning Calorimetry
3.3. Thermogravimetry Scanning
3.4. Optical Microscopy
3.5. X-ray Tomography
4. Discussion
5. Conclusions
- It was determined by FTIR that there are no significant differences in the chemical bonds of both samples even though an increase in the peak is observed in the amorphous region and in the transition region, it was also identified that there is a gap in crystallinity degree in the healthy sample (29.84%) and the fractured sample (26.42%). TGA shows a lower thermal stability in the fractured sample, as well as an increase in volatile material amount.
- In the FTIR analysis, characteristic functional groups of nylon-6,6, and fiberglass to a lesser extent, were found in both samples. Microscopy shows a surface roughness in the fractured sample that cannot be found in the healthy sample.
- Computerized X-ray tomography displayed that if both samples show a pore zone, in the fractured sample there is a higher number of pores rather than the ones found in the healthy sample.
- The change of these properties implies an alteration in the mechanical integrity of the fractured material.
Author Contributions
Funding
Data Availability Statement
Acknowledgments
Conflicts of Interest
References
- Kaliappan, S.; Balaji, V.; Raj, N.M.; Yatika, G.; Natrayan, L.; Shyam, D. Friction stir welding of nylon 6–6 thick plates using biochar colloidal nanoparticle. Mater. Today Proc. 2023, in press. [CrossRef]
- Rashed, K.; Kafi, A.; Simons, R.; Bateman, S. Fused filament fabrication of nylon 6/66 copolymer: Parametric study comparing full factorial and Taguchi design of experiments. Rapid Prototyp. J. 2022, 28, 1111–1128. [Google Scholar] [CrossRef]
- Farbodi, M.; Mahdavi, B. Investigation of Morphology and Antibacterial Properties of Nylon 6, 6/PANI/ZnO Nanocomposite. Int. J. New Chem. 2022, 9, 282–290. [Google Scholar]
- Khan, R.M.; Mushtaq, A. Effect of Reinforced Glass Fibre on the Mechanical Properties of Polyamide: Mechanical Properties of Polyamide. Pak. J. Sci. Ind. Res. Ser. A Phys. Sci. 2021, 64, 10–18. [Google Scholar] [CrossRef]
- Sudhakar, M.; Priyadarshini, C.; Doble, M.; Murthy, P.S.; Venkatesan, R. Marine bacteria mediated degradation of nylon 66 and 6. Int. Biodeterior. Biodegrad. 2007, 60, 144–151. [Google Scholar] [CrossRef]
- Nam, K.T.; Pant, H.R.; Jeong, J.W.; Pant, B.; Kim, B.I.; Kim, H.Y. Solvent degradation of nylon-6 and its effect on fiber morphology of electrospun mats. Polym. Degrad. Stab. 2011, 96, 1984–1988. [Google Scholar] [CrossRef]
- Holland, B.J.; Hay, J.N. Thermal degradation of nylon polymers. Polym. Int. 2000, 49, 943–948. [Google Scholar] [CrossRef]
- Polat, S.; Avcı, A.; Ekrem, M. Fatigue behavior of composite to aluminum single lap joints reinforced with graphene doped nylon 66 nanofibers. Compos. Struct. 2018, 194, 624–632. [Google Scholar] [CrossRef]
- Kim, D.K.; Lee, A.S.; Baek, B.K.; Song, K.H.; Hong, S.M.; Koo, C.M. PPE/nylon 66 blends with high mechanical toughness and flame retardancy. Macromol. Res. 2020, 28, 103–109. [Google Scholar] [CrossRef]
- Zhang, M.; Gao, Q.; Yang, C.; Pang, L.; Wang, H.; Li, R.; Xing, Z.; Hu, J.; Wu, G. Preparation of antimicrobial MnO4−-doped nylon-66 fibers with excellent laundering durability. Appl. Surf. Sci. 2017, 422, 1067–1074. [Google Scholar] [CrossRef]
- Deguchi, T.; Kakezawa, M.; Nishida, T. Nylon biodegradation by lignin-degrading fungi. Appl. Environ. Microbiol. 1997, 63, 329–331. [Google Scholar] [CrossRef] [Green Version]
- Deguchi, T.; Kitaoka, Y.; Kakezawa, M.; Nishida, T. Purification and characterization of a nylon-degrading enzyme. Appl. Environ. Microbiol. 1998, 64, 1366–1371. [Google Scholar] [CrossRef] [Green Version]
- Friedrich, J.; Zalar, P.; Mohorčič, M.; Klun, U.; Kržan, A. Ability of fungi to degrade synthetic polymer nylon-6. Chemosphere 2007, 67, 2089–2095. [Google Scholar] [CrossRef]
- Klun, U.; Friedrich, J.; Kržan, A. Polyamide-6 fibre degradation by a lignolytic fungus. Polym. Degrad. Stab. 2003, 79, 99–104. [Google Scholar] [CrossRef]
- Xie, K.; He, Y.; Cai, J.; Hu, W. Thermal conductivity of Nylon 46, Nylon 66 and Nylon 610 characterized by Flash DSC measurement. Thermochim. Acta 2020, 683, 178445. [Google Scholar] [CrossRef]
- Sambale, A.; Kurkowski, M.; Stommel, M. Determination of moisture gradients in polyamide 6 using StepScan DSC. Thermochim. Acta 2019, 672, 150–156. [Google Scholar] [CrossRef]
- Patti, A.; Acierno, S.; Nele, L.; Graziosi, L.; Acierno, D. Sustainable Basalt Fibers vs. Traditional Glass Fibers: Comparative Study on Thermal Properties and Flow Behavior of Polyamide 66-Based Composites. ChemEngineering 2022, 6, 86. [Google Scholar] [CrossRef]
- Shinzawa, H.; Mizukado, J. Rheo-optical two-dimensional (2D) near-infrared (NIR) correlation spectroscopy for probing strain-induced molecular chain deformation of annealed and quenched Nylon 6 films. J. Mol. Struct. 2018, 1158, 271–276. [Google Scholar] [CrossRef]
- Oshiro, M.; Takashima, K.; Furukawa, Y. Infrared Stark spectra for a Nylon 6 film. Chem. Phys. Lett. 2019, 728, 32–36. [Google Scholar] [CrossRef]
- Černohorský, P.; Pisarenko, T.; Papež, N.; Sobola, D.; Ţălu, Ş.; Částková, K.; Kaštyl, J.; Macků, R.; Škarvada, P.; Sedlák, P. Structure Tuning and Electrical Properties of Mixed PVDF and Nylon Nanofibers. Materials 2021, 14, 6096. [Google Scholar] [CrossRef]
- Lim, J.V.; Bee, S.T.; Sin, L.T.; Ratnam, C.T.; Abdul Hamid, Z.A. Fabrication and Conductivity of Graphite Nanosheet/Nylon 610 Nanocomposites Using Graphite Nanosheets Treated with Supercritical Water at Different Temperatures. Polymers 2022, 14, 4660. [Google Scholar] [CrossRef]
- de Lima, H.F.; Vaz, M.A.; da Costa, M.F.; Gomez, A.A.; de Oliveira, G.L. Creep behavior of in-service flexible flowline polyamide 11. Polym. Test. 2020, 81, 106205. [Google Scholar] [CrossRef]
- Luna, C.B.B.; do Nascimento, E.P.; Siqueira, D.D.; Soares, B.G.; Agrawal, P.; de Mélo TJ, A.; Araújo, E.M. Tailoring Nylon 6/Acrylonitrile-Butadiene-Styrene Nanocomposites for Application against Electromagnetic Interference: Evaluation of the Mechanical, Thermal and Electrical Behavior, and the Electromagnetic Shielding Efficiency. Int. J. Mol. Sci. 2022, 23, 9020. [Google Scholar] [CrossRef]
- Baranowski, T.; Dobrovolskij, D.; Dremel, K.; Hölzing, A.; Lohfink, G.; Schladitz, K.; Zabler, S. Local fiber orientation from X-ray region-of-interest computed tomography of large fiber reinforced composite components. Compos. Sci. Technol. 2019, 183, 107786. [Google Scholar] [CrossRef]
- Liebrich, A.; Langowski, H.C.; Schreiber, R.; Pinzer, B.R. Porosity distribution in laser-sintered polymeric thin sheets as revealed by X-ray micro tomography. Polym. Test. 2019, 76, 286–297. [Google Scholar] [CrossRef]
- Butenegro, J.A.; Bahrami, M.; Swolfs, Y.; Ivens, J.; Martínez, M.Á.; Abenojar, J. Novel Thermoplastic Composites Strengthened with Carbon Fiber-Reinforced Epoxy Composite Waste Rods: Development and Characterization. Polymers 2022, 14, 3951. [Google Scholar] [CrossRef]
- ASTM Designation D3418; Standard Test Methods for Transition Temperatures and Enthalpies of Fusion and Crystallization of Polymers by Differential Scanning Calorimetry. ASTM International: West Conshohocken, PA, USA, 2015.
- Movasaghi, Z.; Rehman, S.; ur Rehman, D.I. Fourier transform infrared (FTIR) spectroscopy of biological tissues. Appl. Spectrosc. Rev. 2008, 43, 134–179. [Google Scholar] [CrossRef]
- Shueb, M.I.; Abd Manaf, M.E.; Ratnam, C.T.; Mohamad, N.; Mohamed, M. Enhancement of mechanical and electrical properties in graphene nanoplatelet modified nylon 66. Malays. J. Compos. Sci. Manuf. 2020, 1, 1–10. [Google Scholar] [CrossRef]
- Linggawati, A.; Mohammad, A.W.; Ghazali, Z. Effect of electron beam irradiation on morphology and sieving characteristics of nylon-66 membranes. Eur. Polym. J. 2009, 45, 2797–2804. [Google Scholar] [CrossRef]
- Cooper, S.J.; Coogan, M.; Everall, N.; Priestnall, I. A polarised μ-FTIR study on a model system for nylon 6 6: Implications for the nylon Brill structure. Polymer 2001, 42, 10119–10132. [Google Scholar] [CrossRef]
- Xu, B.; Long, J.; Xu, G.; Yang, J.; Liang, Y.; Hu, J. Facile fabrication of superhydrophobic and superoleophilic glass-fiber fabric for water-in-oil emulsion separation. Text. Res. J. 2019, 89, 2674–2681. [Google Scholar] [CrossRef]
- Krause, A.; Lange, A.; Erzin, M. Plastics analysis guide: Chemical and instrumental methods. Carl. Hanser Verlag. 1983, 1983, 358. [Google Scholar]
- Blaine, R.L. Thermal applications note. In Polymer Heats of Fusion; TA Instruments: New Castle, DE, USA, 2002. [Google Scholar]
- Pawlak, A.; Galeski, A.; Rozanski, A. Cavitation during deformation of semicrystalline polymers. Prog. Polym. Sci. 2014, 39, 921–958. [Google Scholar] [CrossRef]
- Flexman, E.A., Jr. Impact behavior of nylon-66 compositions: Ductile-brittle transitions. Polym. Eng. Sci. 1979, 19, 564–571. [Google Scholar] [CrossRef]
- Hassan, A.; Rahman, N.A.; Yahya, R. Extrusion and injection-molding of glass fiber/MAPP/polypropylene: Effect of coupling agent on DSC, DMA, and mechanical properties. J. Reinf. Plast. Compos. 2011, 30, 1223–1232. [Google Scholar] [CrossRef]
- Santulli, C.; Gil, R.G.; Long, A.C.; Clifford, M.J. Void content measurements in commingled E-glass/polypropylene composites using image analysis from optical micrographs. Sci. Eng. Compos. Mater. 2002, 10, 77–90. [Google Scholar] [CrossRef]


| Sample | 40–300 °C (%) | 300–600 °C (%) | 600–650 °C (%) | Tmax (°C) | Waste (%) |
|---|---|---|---|---|---|
| Healthy material | 1.28 | 66.58 | 1.87 | 434.13 | 29.84 |
| Fractured material | 4.40 | 66.99 | 1.95 | 423.14 | 26.42 |
Disclaimer/Publisher’s Note: The statements, opinions and data contained in all publications are solely those of the individual author(s) and contributor(s) and not of MDPI and/or the editor(s). MDPI and/or the editor(s) disclaim responsibility for any injury to people or property resulting from any ideas, methods, instructions or products referred to in the content. |
© 2023 by the authors. Licensee MDPI, Basel, Switzerland. This article is an open access article distributed under the terms and conditions of the Creative Commons Attribution (CC BY) license (https://creativecommons.org/licenses/by/4.0/).
Share and Cite
Cruz-Salinas, J.; Paramo-Kañetas, P.J.; Valdovinos-Chacón, G.; Lozano, N.E.M.; Zamora-Antuñano, M.A.; Gama-Lara, S.A. Failure Characterization and Analysis of a Sport Utility Vehicles SUV Rear Door Damper Made by Nylon as Structural Element. Processes 2023, 11, 1885. https://doi.org/10.3390/pr11071885
Cruz-Salinas J, Paramo-Kañetas PJ, Valdovinos-Chacón G, Lozano NEM, Zamora-Antuñano MA, Gama-Lara SA. Failure Characterization and Analysis of a Sport Utility Vehicles SUV Rear Door Damper Made by Nylon as Structural Element. Processes. 2023; 11(7):1885. https://doi.org/10.3390/pr11071885
Chicago/Turabian StyleCruz-Salinas, Jorge, Pedro Jacinto Paramo-Kañetas, Gonzalo Valdovinos-Chacón, Néstor Efrén Méndez Lozano, Marco Antonio Zamora-Antuñano, and Sergio Arturo Gama-Lara. 2023. "Failure Characterization and Analysis of a Sport Utility Vehicles SUV Rear Door Damper Made by Nylon as Structural Element" Processes 11, no. 7: 1885. https://doi.org/10.3390/pr11071885