Abstract
Multi-stage, multi-cluster fracturing in horizontal wells is widely used as one of the most effective methods for unconventional reservoir transformation. This study is based on the extended finite element method and establishes a multi-hydraulic fracturing propagation model that couples rock damage, stress, and fluid flow, and the influence of horizontal stress difference and cluster spacing on fracture propagation is quantitatively analyzed. The simulation results show that changes in horizontal stress differences and inter-cluster spacing have a significant impact on the final propagation morphology of hydraulic fractures, and the change of the fracture initiation sequence forms different stress shadow areas, which in turn affects the propagation morphology of the fractures. When two fractures simultaneously propagate, they will eventually form a “repulsive” deviation, and a smaller stress difference and a decrease in inter-cluster spacing will lead to a more significant deviation of the fracture. Specifically, when the horizontal stress difference is 4 MPa and the cluster spacing is 6 m, the offset of the fracture tip along the direction of minimum horizontal principal stress is about 1.6 m, compared to the initial perforation position. When two fractures propagate sequentially, the fractures do not significantly deviate and propagate along the direction of maximum horizontal principal stress. When fractures propagate sequentially, the stress difference has little effect on the morphology of the fracture, but changes in inter-cluster spacing will significantly affect the length of the fracture. This study quantifies the effect of inter-fracture interference on fracture propagation morphology, providing guidance for optimizing the construction parameters of multi-stage hydraulic fracturing.
1. Introduction
Hydraulic fracturing is an important stimulation measure for the exploration and development of some unconventional reservoirs, such as shale reservoirs and tight sandstone reservoirs [1,2]. A single-plane fracture is not enough to realize the economic exploitation of unconventional oil and gas resources, and the complex fracture network is a necessary condition to improve the oil and gas production in low-permeability reservoirs, which is usually realized by multi-stage hydraulic fracturing of horizontal wells. In order to improve the operation efficiency, the usual construction method is to form several perforation clusters and create multiple hydraulic fractures in the same section of the reservoir through multi-stage hydraulic fracturing of horizontal wells, thereby increasing the volume of reservoir reconstruction [3,4,5]. However, according to some scholars’ statistical analysis of production data, less than half of the perforation clusters contribute to the oil and gas production within a section, which means that most perforation clusters do not achieve the expected effect of increasing production [6,7]. The real increase in oil and gas production comes from the combination of unconventional well structures and large-scale hydraulic fracturing. Single-stage fracturing has evolved into multi-stage production enhancement, and single-well-fracturing has evolved into simultaneous fracturing of branch wells to increase reservoir control and improve well productivity. This has become a commonly used measure to increase production in the industry today [8,9,10].
Therefore, there is an urgent need to improve the efficiency of production and reduce extraction costs; however, there are many factors that affect the propagation of hydraulic fractures: (1) The physical properties of the reservoir near the wellbore are heterogeneous, including natural faults, in situ stress, and rock yield strength. (2) Interactions between different hydraulic fractures within the same horizontal wellbore may inhibit further propagation of some fractures, especially if a fracture is subjected to additional stress from adjacent fractures. This phenomenon is known as the stress shadow effect, which can occur even in homogeneous reservoirs [11,12,13]. (3) The dynamic fluid distribution between hydraulic fractures is related to wellbore hydraulics and perforation characteristics, and is influenced by wellbore friction, perforation friction, and hydraulic fracture propagation control.
Regarding the required number of fractures or spacing between fractures, it is important to note that the optimal production should be achieved through a cost-effective and efficient fracture network. Roussel and Sharma have studied this issue from the perspectives of production and geomechanics [14]. A study was conducted on the distance between hydraulic fractures from a production perspective. Yu and Sepehrnoori [15] observed that fractures too close to each other did not significantly increase production. According to their research results, fracture spacing, length, and well spacing can be optimized under certain porosity, permeability, and fracture conductivity conditions. However, this study did not consider the impact of geological factors of the reservoir on determining the optimal distance between fractures. Many studies have shown that geological and geo-mechanical information about rocks and their variations in the reservoir is also important, as stress primarily controls the initiation and propagation of fractures [16,17]. Stress shadow mainly refers to the phenomenon of local high stress in the direction perpendicular to the fracture surface near the fracture center, which will lead to the reorientation of the direction of the maximum stress in the stress-affected area, and then make the subsequent fracture propagation deviate or even parallel to the wellbore axis. Therefore, it is necessary to optimize the fracture spacing to obtain the maximum number of fractures perpendicular to the wellbore [18].
Currently, there are many numerical methods used for hydraulic fracturing analysis, among which the finite element method (FEM) is the most widely used. The FEM is essentially a numerical method for the mechanics of continuous media. In order to use the finite element method for analyzing hydraulic fracturing and other discontinuous problems, improvements need to be made to the traditional finite element method. Methods for improving the finite element method for non-continuous problems can be divided into two categories: unfixed-mesh methods and fixed-mesh methods [19,20]. Physics-based hydraulic fracturing models usually include different coupled components [21,22]: rock deformation and fracture opening and closing, fluid flow within the fracture, and fracture initiation and propagation. Many scholars have already carried out comprehensive research on the propagation of fractures through the use of numerical simulation methods. Sendon [23] established an analytical model of induced stress around a single planar fracture, which became the cornerstone for subsequent research on fracture interference. Bunger and Peirce conducted research on the propagation of winged fractures and the interaction between them in isotropic media, proposing simple measures to promote synchronized fracture propagation [24]. Zhang et al. studied the deflection and propagation of hydraulic fractures encountering planar bedding planes using boundary element and finite difference methods. The results showed that the deflection of fractures and fluid invasion into weak interfaces mainly depend on the local stress and deformation state at the intersection [25]. Most of the existing studies on fracture interactions have focused on static descriptions, with less attention paid to changes in the magnitude and orientation of the inter-fracture stress during dynamic fracture propagation. Furthermore, there has been little research on the impact of the order of fracture initiation on competitive fracture propagation, and a lack of quantitative exploration of the stress shadow effect on fracture propagation.
In this study, we employ the extended finite element method (XFEM) to simulate hydraulic fracture propagation, which is a type of fixed-grid method. The key idea of XFEM is to enrich the finite element interpolation space with additional discontinuous functions, so that the displacement jumps associated with the fracture can be modeled within the element [26,27]. Different from the existing research, based on the bilinear T-S criterion, this study uses stiffness degradation to describe the damage evolution process of fractures, and realizes the coupling process of fluid flow and solid damage deformation to simulate the expansion of two clusters of different fractures in the same section of horizontal wells. Using the advantages of finite element software simulation, the dynamic change process of the stress shadow size and influence area during fracture propagation is intuitively characterized. The fracture length and width data are extracted by the plug-in program, and the influence of cluster spacing, the horizontal stress difference, and the fracture initiation sequence on fracture propagation morphology is emphatically explored.
2. Materials and Methods
2.1. Fluid–Solid Coupling Simulation
During hydraulic fracturing in saturated porous media, the fluid acting on the fracture surface causes deformation of the solid phase in the porous media. The change in rock pore pressure caused by the injection of fracturing fluid leads to changes in fracture morphology and permeability. Therefore, the process of fracture propagation in geological formations is a dynamic coupling process of viscous fluid flow and rock deformation [4,28,29]. In this study, we investigated the extension of hydraulic fractures and the deformation of the rock matrix during hydraulic fracturing. A homogeneous and isotropic 2D elastic medium was chosen as the region for hydraulic fracture propagation. The rock deformation was described by linear elasticity theory, and the equilibrium equation was satisfied by:
where, is the stress tensor, is the volume force on the rock mass, is the strain tensor, is the medium displacement, and is the elastic tensor.
To simulate fluid flow in hydraulic fractures, the porous media continuity equation was applied in weak form by imposing pore pressure at each node to simulate the flow of fracturing fluid within the porous medium:
where is the density of the fluid, kg/m3 is the matrix porosity, is the average flow velocity of the fluid in the matrix, m3/s, and is the outer normal direction of the surface S.
The flow equation in the above equation satisfies the Darcy equation:
In this study, the concept of the permeability coefficient was used to characterize the fluid permeability, which is expressed as follows:
where, is the permeability coefficient, m/s, k is the permeability, m2, is the fluid viscosity, Pa·s, is the ratio of fluid volume to total volume, ∇Pw is the pressure gradient in the direction of fracturing fluid flow, and is the free-fall acceleration, m/s2.
2.2. The Mathematical Model of Extended Finite Element
2.2.1. Extended Finite Element Method
In the traditional finite element method, the problem domain is discretized into a series of small elements, and the solution is approximated using polynomial functions within each element. This method performs well in dealing with simple geometries and continuous media. However, when there are local discontinuities such as fractures, it requires increasing the mesh refinement to capture these discontinuities, leading to increased computational costs. The extended finite element method is based on the classical finite element method and incorporates additional generalized degrees of freedom to represent local discontinuities. This allows simulations to be performed on relatively coarse grids without the need for mesh refinement around fractures [26,30].
The extended finite element method improves the interpolation shape function within the element. The method incorporates the use of the Heaviside step function, , and the asymptotic fracture tip function, , to account for the discontinuity of the fracture surfaces, where is used to characterize the intermittent displacement field:
is used to characterize the singular displacement field and describe the singularity of the fracture tip stress. The expression in polar coordinates is:
Therefore, its displacement vector function, u, which characterizes the overall division characteristics, is:
where is the ordinary nodal displacement form function, is the continuous part of the displacement solution, and are the nodal extended degree of freedom vectors, is the intermittent jump function of the fracture surface, and is the fracture tip stress asymptotic function [31,32]. The first part of the equation applies to all nodes within the model, the second part applies to nodes whose functional shape is formed by internal fractures, and the third part is used only for nodes whose shape function is separated by the fracture tip [33]. As shown in Figure 1, when an element is undamaged, each virtual node lies entirely on the primary node; when the element is cracked, the fracture element is divided into two parts, each of which consists of several virtual nodes and primary nodes dependent on the fracture direction. Each virtual node is unbound from its origin and can be moved [34].
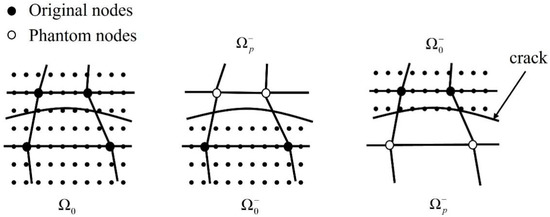
Figure 1.
The XFEM using phantom nodes.
The expressions for the interpolation of the pressure field and the displacement field have the same form:
where, , are the node pressure expansion degrees of freedom, and and are the enhancement functions of the pressure nodes.
2.2.2. Fracture Propagation and Extension Criteria Based on Extended Finite Element
In this study, the extended finite element method was used to simulate the expansion of hydraulic fractures. The tensile-separation criterion based on the damage mechanics of cohesive units was used for the initiation and extension of hydraulic fractures [35]. As shown in Figure 2, the first part involves determining the effective displacement at complete damage, , relative to the effective displacement at the onset of damage, , or the energy dissipation due to failure, . The second part mainly defines the evolution of the damage parameter, , between initial failure and complete failure. This parameter can be specified by a linear or exponential softening law, which is directly provided in a table that shows the relationship between effective displacement and damage. When using the linear displacement-based extension criterion, it can be expressed as:
where is the maximum displacement of the unit, is the displacement at which the unit is opened, and is the displacement at which the unit starts to be damaged.
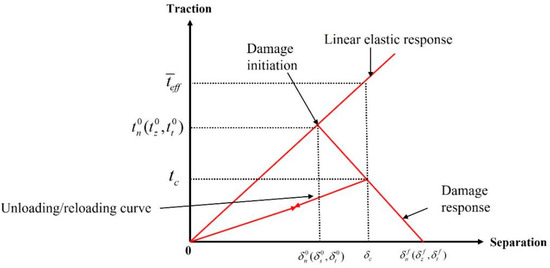
Figure 2.
Tensile—separation curve.
The constitutive model of rock before damage is linear elasticity, and the element that degrades to complete failure after damage. In this study, the maximum principal stress criterion was used as the fracture initiation criterion, that is:
where, is the maximum critical stress to which the rock is subjected, MPa, and is the maximum principal stress to which the rock is subjected, MPa.
In this study, the type of damage evolution for hydraulic fracture propagation was selected as displacement, and mode-independent was used as the mixed-mode behavior. When the initial damage reached 0.001 mm, the element was considered completely broken. During the process of hydraulic fracture propagation, the formation’s permeability and porosity will change with the change of the effective stress of the porous medium in the formation, so the coupling relationship between the formation stress field and the seepage flow field must be considered. According to the principle of virtual work, the stress balance equation can be obtained as follows:
where is the virtual velocity, m/s, is the virtual variation rate, s−1, is the volume force per unit volume, N/m3, t is the external surface force per unit area, N/m3, and is the total stress in the porous medium of the formation, Pa.
Based on the principle of mass conservation, the continuity equation of fluid media can be obtained as follows:
where, is the rate of change of the formation pore volume, is the ratio of formation liquid volume to total volume, is the density of liquid in the formation pore, kg/m3, and is the flow velocity of the formation pore liquid, m/s.
2.3. Stress Field Superimposed on Fracture Propagation of Multiple Clusters in Horizontally Oriented Well
During the fracturing process of the horizontal well, the formation of horizontal wellbore will significantly affect the original in situ stress field. Therefore, the injection of fracturing fluid will cause the pore pressure around the wellbore to increase and generate additional stress due to the difference between the pore pressure of the wellbore and that of the formation. In situ stress is the natural stress that exists in a rock mass, and it is regularly distributed in a three-dimensional state. There are many factors that affect the change of in situ stress, among which the obvious ones are wellbore pressure, the original tectonic stress component, and the change caused by fracturing fluid seepage [36]. For the process of propagation of multi-cluster fractures in the horizontal well, besides considering the stress disturbance caused by the propagation of different fractures, the significant temperature difference of the reservoir at different well depths and the thermal effect of the drilling fluid and fracturing fluid injected on the wellbore and fractures also bring additional stress effects. Figure 3 shows the multi-fracture stress superposition model, which regards the rock as an infinitesimal deformation, porous elastic body, according to the principle of stress superposition, the disturbed stress field of horizontal well-fracturing is the sum of the initial in situ stress, wellbore pressure, fracturing fluid seepage, fracture-induced stress, and additional stress caused by thermal effects, that is:
where, is the total fracture disturbance stress, is the initial ground stress, is the stress around the wellbore after drilling, is the fracture fluid percolation stress, is the fracture-induced stress, and is the thermal stress.
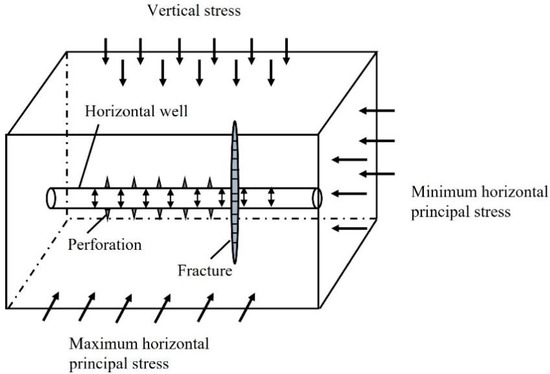
Figure 3.
Multi-fracture stress superposition model.
3. Model Construction and Validation
3.1. Model Construction
In the simulation of simultaneous expansion of multiple clusters of fractures in horizontal wells, a total of three fractures with equal spacing were set in the horizontal wells, where the direction of the horizontal wellbore was the direction of the minimum horizontal principal stress to ensure that the formed hydraulic fractures were transverse fractures. The size of the numerical simulation model was 100 m × 100 m, and the related geo-mechanical parameters and fracturing construction parameters are shown in Table 1.

Table 1.
Mechanical parameters of stratigraphic rocks.
The simulation adopted the super-hydrostatic pressure system, with a fracturing fluid flow rate and viscosity of 0.12 m3/min and 1 mPa·s, respectively. The perforation length was 1 m, and the pumping time of each hydraulic fracture was maintained for 100 s. To simplify the calculation, the horizontal wellbore was located at the bottom of the model, and the perforation direction was aligned with the maximum horizontal principal stress direction. The established geometric model is shown in Figure 4. A constant-pressure water fracturing system was applied, and the boundary pore pressure was set to 0 MPa and kept constant during the fracturing process. The reservoir rock matrix was represented by a structured, standardized, linear quadrilateral plane strain element type known as CPE4P, and the hydraulic fracture propagation was simulated with two-node linear truss elements (T2D2).
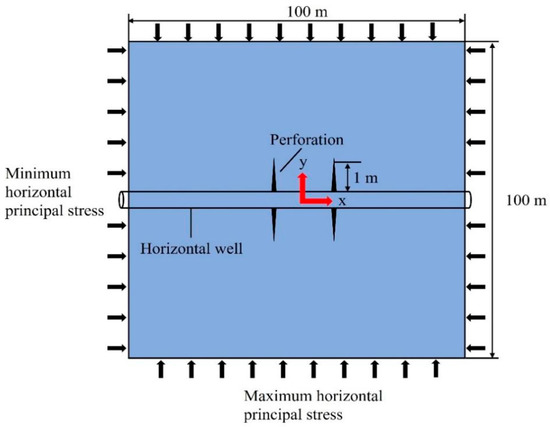
Figure 4.
Geometric model of horizontal well multi-cluster fracturing.
In the XFEM, fracture is modeled independent of mesh configuration and element type. This means that no remeshing is required, and discontinuity, including fractures, need not be aligned with element boundaries [37]. However, different mesh configurations have an impact on the simulation convergence and effectiveness. Therefore, we conducted an investigation on various mesh sizes and selected four different mesh sizes for evaluation: 0.3 m, 0.5 m, 0.8 m, and 1 m, respectively. The relevant mechanical parameters are referenced from Table 1. The cluster spacing was 6 m, the horizontal differential stress was 4 MPa, and the fracturing fluid displacement and viscosity were 0.12 m3/min and 1 mPa·s, respectively. The length of the perforation was 1 m, and the injection time was set to 100 s.
Figure 5 displays the morphology of fractures after simultaneous initiation and propagation of dual-cluster fractures extracted using the plugin under different mesh sizes. As observed from Figure 5, it can be inferred that changing the mesh size had minimal impact on the final morphology of the fractures after propagation. Two cases with the largest difference in half-fracture height were selected for comparison. When the mesh size was 0.3 m, the half-fracture height on the right side was 15.37 m, while with a mesh size of 0.8 m, the half-fracture height was 14.91 m. The difference between the two cases was only 0.46 m. Considering that smaller mesh sizes are suitable for smaller initial perforation lengths, it is important to balance the computational efficiency and simulation accuracy. Finer mesh configurations tend to significantly increase the computation time and can lead to convergence issues [38]. Taking into account both the computational time and the simulation effectiveness, a mesh size of 0.5 m was selected as the optimal choice for the fracture propagation numerical model in this study. This mesh size strikes a balance between capturing essential details and maintaining an acceptable computational efficiency, ensuring a reasonable compromise between accuracy and computational resources.
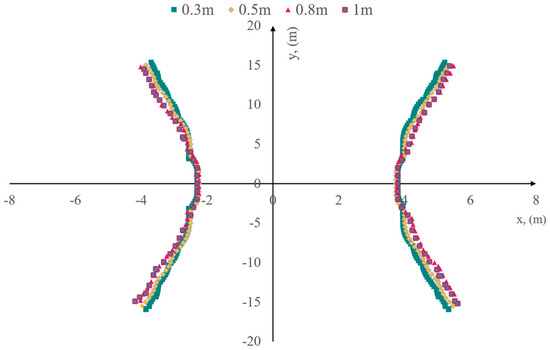
Figure 5.
Fracture morphology of different mesh sizes.
3.2. Model Verification
The interaction among multiple fractures plays a crucial role in determining the geometric shape of the fractures during their propagation. In this study, we conducted a comparative analysis of the dual-cluster fracture propagation model for horizontal wells proposed by Wu et al. [39]. The wellbore and initial perforation locations in their model were similar to those depicted in Figure 4. The horizontal wellbore was aligned parallel to the minimum horizontal principal stress direction, while the initial perforation locations were positioned along the maximum horizontal principal stress direction. The model input parameters are presented in Table 2, and the simulation results are shown in Figure 6. Figure 6a illustrates the fracture opening after expansion in the current model, while Figure 6b displays a comparison of the fracture propagation paths between the two models. In a horizontal well, parallel fractures may deviate from each other due to the stress shadow effect. Once the fractures open, they exert additional stresses on the surrounding rock and neighboring fractures. This can lead to local variations in the direction of the horizontal principal stress and deviations in the fracture paths from the planar geometry.
Table 2.
Input parameters (after Wu et al., 2012 [39]).
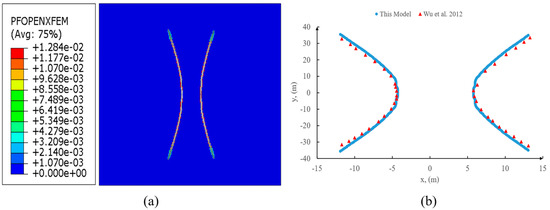
Figure 6.
(a) Fracture propagation geometry. (b) The comparison of fracture propagation paths between this model and Wu et al. [39]’s model.
From Figure 6, it can be observed that the fracture propagation paths of the two models exhibited a high degree of consistency, with only slight deviations at the fracture tips. The analysis suggests that these deviations might be attributed to the different boundary effects caused by the variations in model sizes. As the fractures propagated, they encountered different resistances at the fracture tips, leading to slight differences in the final morphology of the fractures. Based on the above analysis, it can be concluded that the simulation results of the two models mentioned earlier exhibited good agreement. This confirmed the effectiveness and accuracy of the model used in this study.
4. Numerical Simulation Results
To investigate the competition of fracture propagation under simultaneous initiation of two fractures, two perforated intervals with a perforation depth of 1 m were placed horizontally along the direction of the minimum horizontal principal stress in the study area as the initial fractures. The injection time was set to 100 s and the injection rate was chosen as 0.002 m/s. The two perforated intervals concurrently injected fluid. This paper also explores the interference effect of the stress disturbance caused by the propagation of the first fracture on the subsequent initiation fracture under the condition of two fractures initiating at different times. In order to simulate the stress shadow effect induced by fracture propagation under reservoir conditions, two fractures were initiated at different times with a constant injection rate of 0.002 m/s and a duration of 100 s each, followed by a 600 s pressure depletion after the first fracture was completed. The simulation of simultaneous and sequential fracture initiation revealed how stress field and fracture spacing influenced the complexity and diversity of fracture propagation patterns. To investigate the effects of stress difference and fracture spacing on fracture propagation, we performed simulations with different values of these parameters. We varied the stress difference from 2 to 8 MPa and the fracture spacing from 6 to 12 m. Here, we present the results and analysis of how these factors influenced fracture propagation.
4.1. Horizontal Differential Principal Stress
In the simulations under different reservoir stress conditions, we set different values of minimum and minimum horizontal principal stress, such that the horizontal principal stress difference was 2, 4, 6, or 8 MPa. The overburden stress was set to 15 MPa. Table 3 shows the reservoir rock mechanical parameters for this area. The other basic rock mechanical parameters are presented in Table 1. The perforation cluster spacing was kept at 10 m. As shown in Figure 7, the distribution of reservoir pore pressure underwent changes as the stress difference increased. Furthermore, the deviation angles of the fracture morphology gradually decreased as a result, and stress concentration phenomena appeared at the tips of the fractures. By programming and extracting the nodal information of the two-dimensional fractures, the post-propagation coordinate information of the fractures can be obtained. Based on Figure 8, the morphology of the fractures exhibited consistency under different stress difference conditions when the two fractures simultaneously initiated and propagated. This consistency is attributed to the initial perforation cluster being symmetrically located in the model and having consistent boundary conditions. Under a stress difference of 2 MPa, the deviation of the fracture tip was significant, deflecting approximately 1.02 m along the direction of the minimum horizontal principal stress, as compared to the initial initiation point. As the stress difference increased, the variation in the fracture morphology notably decreased. Under the stress difference conditions of 6 MPa and 8 MPa, the fracture morphology was approximately consistent.
Table 3.
Reservoir ground stress conditions and cluster spacing.
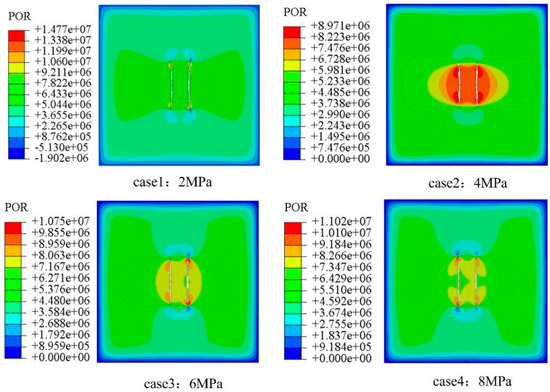
Figure 7.
Pore pressure distribution after simultaneous fracture initiation under different stress difference conditions.
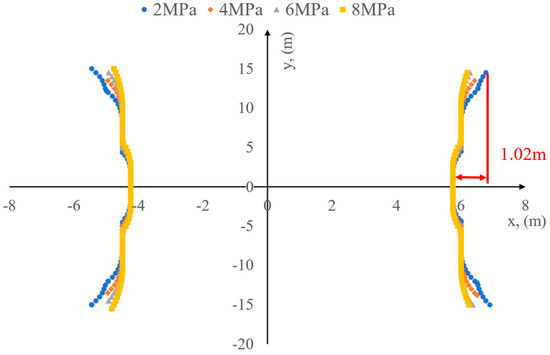
Figure 8.
The morphology of the simultaneously initiated fractures under different stress difference conditions.
In contrast, for simulation calculations involving the sequential initiation of two fractures, the interference from the stress shadow effect generated by the first fracture after expansion may affect the propagation of the second fracture. Thus, the morphology of the fractures will exhibit significant differences compared to the case where both fractures simultaneously initiated. As illustrated in Figure 9, the change in the horizontal principal stress difference had little influence on the final morphology of the fracture. However, due to the stress interference from the previously initiated fracture on the subsequently initiated fracture, the average half-length of the later-initiated fracture decreased by approximately 6 m under the four different stress difference conditions. In contrast, the length of the previously initiated fracture did not decrease compared to the simultaneous initiation condition. These findings suggest that stress interference between fractures can have a detrimental impact on reservoir fracturing and enhanced oil recovery by reducing the hydraulic fracturing effective area.
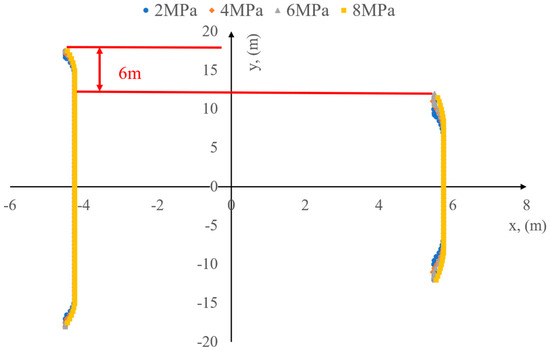
Figure 9.
The morphology of the sequentially initiated fractures under different stress difference conditions.
Figure 10 shows the variation of the minimum horizontal principal stress vector under the condition of a stress difference of 2 MPa. Due to the default setting of the simulator, the vector represents compressive stress as a negative value. From the figure, it can be observed that after the first hydraulic fracture extended, the surrounding stress field was disturbed, resulting in an elliptical-shaped stress shadow area that restricted the propagation of the second fracture. Figure 11 shows the distribution of the minimum horizontal principal stress at the ends of the two sequentially propagating fractures under the four different stress conditions. It can be observed from the figure that the minimum horizontal principal stress at the ends of the initial fracture reached its maximum value, resulting in a high-stress area at the tip of the fracture. When the second fracture propagated, it eventually stopped due to the fact that the pore pressure inside the fracture was lower than the fracture pressure of the element.
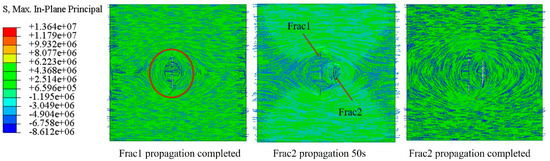
Figure 10.
Minimum horizontal principal stress vector at different moments under the condition of a 2 MPa stress difference.
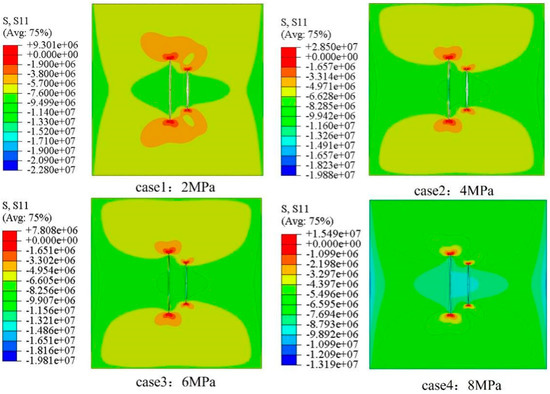
Figure 11.
The distribution of minimum horizontal principal stress after sequential fracturing under different stress difference conditions.
The subsequent fracture initiation pressure was also affected by stress interference. Under the condition of staggered fracture initiation, the difference in the pore pressure of the fracture elements was not significant among the four stress difference conditions. Taking the stress difference of 2 MPa as an example, Figure 12 shows the pore pressure changes with time at the perforation locations of the two fractures under the stress difference of 2 MPa. It can be seen from the figure that as time increased, the pore pressure of the two fractures first increased, and then decreased to a certain level and remained stable. The first fracture started to propagate in 0–100 s, followed by the pressure-relief stage of the first fracture from 100 to 700 s, and then the second fracture started to propagate. The initiation pressure of the first fracture was around 36.31 MPa, while the subsequent fracture initiation pressure increased to 43.08 MPa. This suggests that the propagation of the first fracture hindered the propagation of the second fracture, and ultimately, the pore pressure in both fractures tended to be consistent.
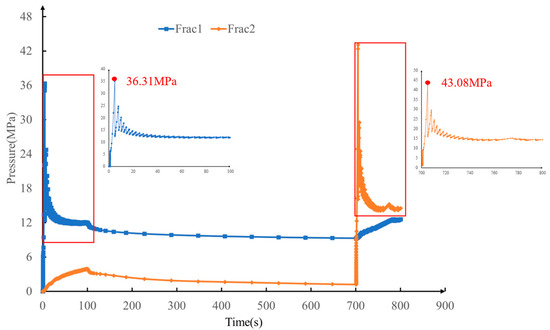
Figure 12.
The evolution of pore pressure at the location of the perforation over time.
4.2. Perforation Cluster Spacing
The variation of cluster spacing also had a significant impact on the morphology of the fracture propagation. In this study, the effect of different perforation cluster spacing on fracture propagation was investigated. Cluster spacings of 6 m, 8 m, 10 m, and 12 m were set, respectively (Table 4). The mechanical parameters of the reservoir rock are still based on Table 1, with the minimum horizontal principal stress set to 6 MPa, the maximum horizontal principal stress set to 10 MPa, and the overlying stress set to 15 MPa.
Table 4.
Mechanical parameters of reservoir rocks and cluster spacing.
Figure 13 shows the distribution of fracture pore pressure after simultaneous initiation and propagation of fractures under different cluster-spacing conditions. It can be seen from the figure that the maximum pore pressure was generated at the fracture tip. Combined with the fracture morphology in Figure 14, it can be seen that as the cluster spacing decreased, the inter-fracture deflection angle gradually increased, and the end of the hydraulic fracture with a cluster spacing of 6 m deviated from the initial perforation cluster position by about 1.6 m. It should be noted that, in contrast to the simulation results under the condition of the changing stress difference (Figure 8), the two simultaneously initiated fractures under the conditions of 8 m and 12 m cluster spacing showed obvious asymmetry. The reason for this is that, under the distance condition of the shot-hole cluster, the initial shot-hole positions of the two fractures were not in the middle of the model, and the influence of the boundary effect led to greater resistance to the propagation of the second fracture.
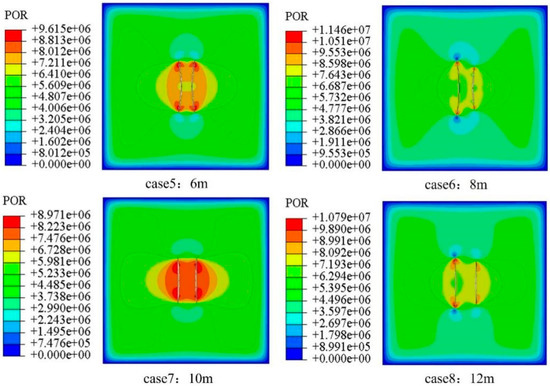
Figure 13.
Pore pressure distribution after simultaneous fracture initiation under different cluster-spacing conditions.
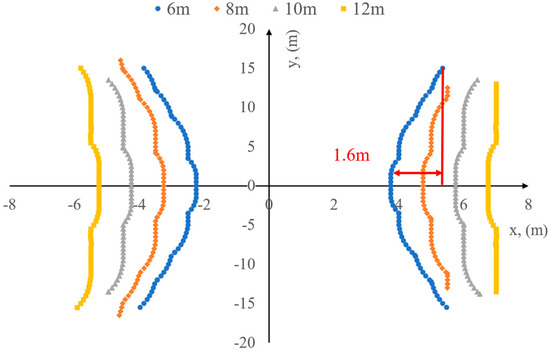
Figure 14.
The morphology of the simultaneously initiated fractures under different cluster-spacing conditions.
Similarly, simulations were conducted to study the sequential initiation and propagation of fractures under different cluster-spacing conditions. The obtained fracture patterns are shown in Figure 15, which exhibited significant differences in the propagation of the two fractures. The later-initiated fracture was subjected to interference from the first fracture, resulting in a significant decrease in its half-length, but with a smaller deflection. This indicates that fracture deflection is more susceptible to interference when multiple fractures are competing for propagation at the same time. Moreover, the length of the fractures significantly varied during sequential propagation, and the interference became more pronounced as the cluster spacing decreased.
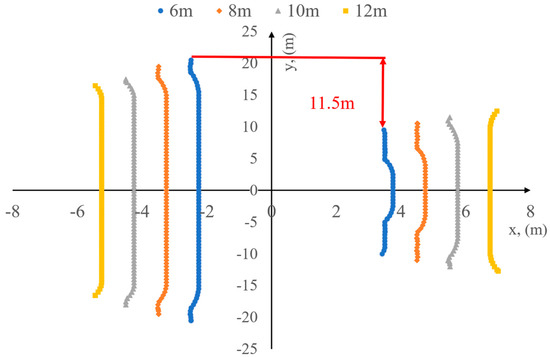
Figure 15.
The morphology of the sequentially initiated fractures under different cluster-spacing conditions.
When the cluster spacing was 6 m, the half-length of the second fracture was reduced by about 11.5 m. By referring to the minimum horizontal principal stress vector map of the fracture propagation process under the cluster spacing of 6 m, as shown in Figure 16, it can be inferred that the propagation of the first fracture resulted in significant stress interference, which changed the magnitude and direction of the minimum horizontal principal stress and created stress shadow effects around the fracture, where the minimum horizontal principal stress around the fracture was higher than the original minimum horizontal principal stress, resulting in the stress shadow effect around the fracture. When the second fracture propagated, the same pumping displacement generated the same pore pressure at the fracture tip. However, due to the presence of high-stress zones, the fracture propagation was hindered, and the half-length of the fracture significantly decreased. In addition, for the case of sequential initiation, in the simulation examples of cases 5–8, the average initiation pressure of the second fracture was lower than that of the first fracture, with a difference of about 8 MPa. The trend of the relationship between the initial perforation pore pressure and time was similar to that shown in Figure 12.
Figure 16.
Minimum horizontal principal stress vector at different moments when the cluster spacing was 6 m.
5. Conclusions
In this study, the bilinear T-S criterion and stiffness degradation were used to describe the damage evolution of fractures, and a coupled model of fluid flow and solid damage deformation was constructed. Based on the extended finite element model, the propagation simulation of multiple cluster fractures during the horizontal well-fracturing transformation process was realized, and the following main conclusions were obtained.
(1) During the process of multi-cluster fracture propagation and extension in horizontal wells, the stress difference and the size change of inter-cluster clusters had a greater impact on the final morphology of fractures and the area of reservoir transformation. The fracture initiation sequence also directly affected the final fracture morphology. When the two fractures simultaneously initiated, a more obvious fracture deflection occurred; when the fractures initiated at different times, the fracture length of the later-initiated fracture was significantly reduced due to the stress interference caused by the earlier-propagated fracture.
(2) When simultaneously initiating, changing the stress difference and inter-cluster spacing formed two relatively symmetrical deflected fractures. The smaller the minimum horizontal principal stress difference and the inter-cluster spacing, the more obvious the fracture deflection. When the horizontal stress difference was 4 MPa and the inter-cluster spacing was 6 m, the fracture tip deviated from the initial perforation position by about 1.6 m along the direction of the minimum horizontal principal stress.
(3) When the two fractures separately initiated, the fractures basically extended along the direction of the maximum horizontal principal stress. Due to the propagation of the first fracture, the size and direction of the surrounding stress field were changed, and a high-stress zone was induced around the fracture, forming an elliptical stress shadow area, which hindered the propagation of subsequent fractures. The variation in the stress difference had a minimal impact on the fracture length. Under four different stress difference conditions, the length of the subsequent fracture decreased by approximately 6 m. On the other hand, the change in cluster spacing had a significant influence on the fracture length. When the cluster spacing was 6 m, the half-length of the fracture decreased the most. The subsequently expanding fracture had a reduction of approximately 11.5 m compared to the initially expanding fracture.
(4) The pore pressure at the perforation location also experienced significant changes with variations in the fracturing sequence. When the two fractures were simultaneously initiated, the fracture initiation pressure for both fractures was around 36 MPa. However, in the case of sequential fracturing, the initiation pressure for the subsequent fracture increased by 7 MPa, reaching 43.08 MPa. This is because the expansion of the first fracture altered the original stress field, resulting in an increased resistance for subsequent fracture initiation. Eventually, the pore pressure at the perforation locations of both fractures stabilized at approximately 13 MPa.
Author Contributions
Writing—original manuscript, Q.R.; supervision, X.Z.; investigation, J.D.; data curation, M.X.; formal analysis, D.R. and R.L. All authors have read and agreed to the published version of the manuscript.
Funding
This research was funded by the Key Core Technology Research Projects of PetroChina Company Limited (No. 2020B-4911) and the APC was funded by the Research Institute of Petroleum Exploration and Development.
Data Availability Statement
No new data were created or analyzed in this study. Data sharing is not applicable to this article.
Conflicts of Interest
The authors declare no conflict of interest.
References
- Zou, J.; Zhang, Y.; Zhang, L.; Jing, J.; Fu, Y.; Wang, Y.; Zhang, G.; Zhou, F. Numerical Simulation Research on the Effect of Artificial Barrier Properties on Fracture Height. Processes 2023, 11, 310. [Google Scholar] [CrossRef]
- Dong, R.; Wang, Q.; Wheeler, M.F. Prediction of Mechanical Stability of Acidizing-Induced Wormholes through Coupled Hydro-Chemo-Mechanical Simulation; OnePetro: Richardson, TX, USA, 2019. [Google Scholar]
- Dong, R.; Alpak, F.O.; Wheeler, M.F. Accurate Two-Phase Flow Simulation in Faulted Reservoirs by Combining Two-Point Flux Approximation and Mimetic Finite Difference Methods. SPE J. 2023, 28, 111–129. [Google Scholar] [CrossRef]
- Zhao, Y.; Wang, L.; Ma, K.; Zhang, F. Numerical Simulation of Hydraulic Fracturing and Penetration Law in Continental Shale Reservoirs. Processes 2022, 10, 2364. [Google Scholar] [CrossRef]
- Jia, S.; Dai, Z.; Zhou, Z.; Ling, H.; Yang, Z.; Qi, L.; Wang, Z.; Zhang, X.; Thanh, H.V.; Soltanian, M.R. Upscaling Dispersivity for Conservative Solute Transport in Naturally Fractured Media. Water Res. 2023, 235, 119844. [Google Scholar] [CrossRef] [PubMed]
- Rybak, Y.; Khayrutdinov, M.; Kongar-Syuryun, C.; Tyulyayeva, Y. Resource-Saving Technologies for Development of Mineral Deposits. Sustain. Dev. Mt. Territ. 2021, 13, 405–415. [Google Scholar]
- Bosikov, I.I.; Klyuev, R.V.; Mayer, А.V. Comprehensive Assessment of Hydraulic Fracturing Technology Efficiency for Well Construction during Hydrocarbon Production. Записки Гoрнoгo Института 2022, 258, 1006–1013. [Google Scholar] [CrossRef]
- Wang, Y.; Zhou, F.; Zhang, Y.; Wang, Y.; Su, H.; Dong, R.; Wang, Q.; Bai, H. Numerical Studies and Analysis on Reaction Characteristics of Limestone and Dolomite in Carbonate Matrix Acidizing. Geoenergy Sci. Eng. 2023, 222, 211452. [Google Scholar] [CrossRef]
- Liu, C.; Cui, J.; Zhang, Z.; Liu, H.; Huang, X.; Zhang, C. The Role of TBM Asymmetric Tail-Grouting on Surface Settlement in Coarse-Grained Soils of Urban Area: Field Tests and FEA Modelling. Tunn. Undergr. Space Technol. 2021, 111, 103857. [Google Scholar] [CrossRef]
- Zhang, X.; Wang, Z.; Reimus, P.; Ma, F.; Soltanian, M.R.; Xing, B.; Zang, J.; Wang, Y.; Dai, Z. Plutonium Reactive Transport in Fractured Granite: Multi-Species Experiments and Simulations. Water Res. 2022, 224, 119068. [Google Scholar] [CrossRef] [PubMed]
- Bunger, A.P.; Peirce, A.P. Numerical Simulation of Simultaneous Growth of Multiple Interacting Hydraulic Fractures from Horizontal Wells. In Proceedings of the Shale Energy Engineering 2014, Pittsburgh, PA, USA, 21–23 July 2014; American Society of Civil Engineers: Pittsburgh, PA, USA, 2014; pp. 201–210. [Google Scholar]
- Singh, A.; Xu, S.; Zoback, M.; McClure, M. Integrated Analysis of the Coupling between Geomechanics and Operational Parameters to Optimize Hydraulic Fracture Propagation and Proppant Distribution; OnePetro: Richardson, TX, USA, 2019. [Google Scholar]
- Zhu, T.; Ding, H.; Wang, C.; Liu, Y.; Xiao, S.; Yang, G.; Yang, B. Parameters Calibration of the GISSMO Failure Model for SUS301L-MT. Chin. J. Mech. Eng. 2023, 36, 20. [Google Scholar] [CrossRef]
- Roussel, N.P.; Sharma, M.M. Strategies to Minimize Frac Spacing and Stimulate Natural Fractures in Horizontal Completions; OnePetro: Richardson, TX, USA, 2011. [Google Scholar]
- Yu, W.; Sepehrnoori, K. Optimization of Multiple Hydraulically Fractured Horizontal Wells in Unconventional Gas Reservoirs. J. Pet. Eng. 2013, 2013, 151898. [Google Scholar] [CrossRef]
- Xu, W.; Calvez, J.L.; Thiercelin, M. Characterization of Hydraulically-Induced Fracture Network Using Treatment and Microseismic Data in a Tight-Gas Formation: A Geomechanical Approach; OnePetro: Richardson, TX, USA, 2009. [Google Scholar]
- Abousleiman, Y.; Tran, M.; Hoang, S.; Bobko, C.; Ortega, A.; Ulm, F.-J. Geomechanics Field and Laboratory Characterization of Woodford Shale: The Next Gas Play; OnePetro: Richardson, TX, USA, 2007. [Google Scholar]
- Morrill, J.C.; Miskimins, J.L. Optimizing Hydraulic Fracture Spacing in Unconventional Shales; OnePetro: Richardson, TX, USA, 2012. [Google Scholar]
- Ren, Q.; Dong, Y.; Yu, T. Numerical Modeling of Concrete Hydraulic Fracturing with Extended Finite Element Method. Sci. China Ser. E-Technol. Sci. 2009, 52, 559–565. [Google Scholar] [CrossRef]
- Zhang, X.; Ma, F.; Dai, Z.; Wang, J.; Chen, L.; Ling, H.; Soltanian, M.R. Radionuclide Transport in Multi-Scale Fractured Rocks: A Review. J. Hazard. Mater. 2022, 424, 127550. [Google Scholar] [CrossRef] [PubMed]
- Chen, B.; Barron, A.R.; Owen, D.R.J.; Li, C.-F. Propagation of a Plane Strain Hydraulic Fracture with a Fluid Lag in Permeable Rock. J. Appl. Mech. 2018, 85, 091003. [Google Scholar] [CrossRef]
- Dong, R.; Wheeler, M.F.; Ma, K.; Su, H. A 3D Acid Transport Model for Acid Fracturing Treatments with Viscous Fingering; OnePetro: Richardson, TX, USA, 2020. [Google Scholar]
- Sneddon, I.N.; Mott, N.F. The Distribution of Stress in the Neighbourhood of a Fracture in an Elastic Solid. Proceedings of the Royal Society of London. Ser. A Math. Phys. Sci. 1997, 187, 229–260. [Google Scholar] [CrossRef]
- Meehan, C.L.; VanBriesen, J.M.; Vahedifard, F.; Yu, X.; Quiroga, C. Shale Energy Engineering 2014; American Society of Civil Engineers: Reston, VA, USA, 2014; ISBN 978-0-7844-1365-4. [Google Scholar]
- Zhang, X.; Jeffrey, R.G. Role of Overpressurized Fluid and Fluid-Driven Fractures in Forming Fracture Networks. J. Geochem. Explor. 2014, 144, 194–207. [Google Scholar] [CrossRef]
- Moës, N.; Dolbow, J.; Belytschko, T. A Finite Element Method for Fracture Growth without Remeshing. Int. J. Numer. Methods Eng. 1999, 46, 131–150. [Google Scholar] [CrossRef]
- Peng, J.; Xu, C.; Dai, B.; Sun, L.; Feng, J.; Huang, Q. Numerical Investigation of Brittleness Effect on Strength and Microcracking Behavior of Crystalline Rock. Int. J. Geomech. 2022, 22, 04022178. [Google Scholar] [CrossRef]
- Wan, B.; Liu, Y.; Zhang, B.; Luo, S.; Wei, L.; Li, L.; He, J. Investigation of the Vertical Propagation Pattern of the 3D Hydraulic Fracture under the Influence of Interlayer Heterogeneity. Processes 2022, 10, 2449. [Google Scholar] [CrossRef]
- Zhu, H.; Deng, J.; Jin, X.; Hu, L.; Luo, B. Hydraulic Fracture Initiation and Propagation from Wellbore with Oriented Perforation. Rock Mech. Rock Eng. 2015, 48, 585–601. [Google Scholar] [CrossRef]
- Daux, C.; Moës, N.; Dolbow, J.; Sukumar, N.; Belytschko, T. Arbitrary Branched and Intersecting Fractures with the Extended Finite Element Method. Int. J. Numer. Methods Eng. 2000, 48, 1741–1760. [Google Scholar] [CrossRef]
- Liu, C.; Liu, H.; Zhang, Y.; Deng, D.; Wu, H. Optimal Spacing of Staged Fracturing in Horizontal Shale-Gas Well. J. Pet. Sci. Eng. 2015, 132, 86–93. [Google Scholar] [CrossRef]
- Haddad, M.; Sepehrnoori, K. XFEM-Based CZM for the Simulation of 3D Multiple-Cluster Hydraulic Fracturing in Quasi-Brittle Shale Formations. Rock Mech. Rock Eng. 2016, 49, 4731–4748. [Google Scholar] [CrossRef]
- Abdullah, E.; Ferrero, J.-F.; Barrau, J.-J.; Mouillet, J.-B. Development of a New Finite Element for Composite Delamination Analysis. Compos. Sci. Technol. 2007, 67, 2208–2218. [Google Scholar] [CrossRef]
- Heidari-Rarani, M.; Sayedain, M. Finite Element Modeling Strategies for 2D and 3D Delamination Propagation in Composite DCB Specimens Using VCCT. CZM and XFEM Approaches. Theor. Appl. Fract. Mech. 2019, 103, 102246. [Google Scholar] [CrossRef]
- Salehi, S.; Nygaard, R. Full Fluid-Solid Cohesive Finite-Element Model to Simulate Near Wellbore Fractures. J. Energy Resour. Technol. 2014, 137, 012903. [Google Scholar] [CrossRef]
- Liu, F.; Gordon, P.A.; Valiveti, D.M. Modeling Competing Hydraulic Fracture Propagation with the Extended Finite Element Method. Acta Geotech. 2018, 13, 243–265. [Google Scholar] [CrossRef]
- Sepehri, J.; Soliman, M.Y.; Morse, S.M. Application of Extended Finite Element Method (XFEM) to Simulate Hydraulic Fracture Propagation from Oriented Perforations; OnePetro: Richardson, TX, USA, 2015. [Google Scholar]
- Wu, K.; Olson, J.E. Simultaneous Multifracture Treatments: Fully Coupled Fluid Flow and Fracture Mechanics for Horizontal Wells. SPE J. 2015, 20, 337–346. [Google Scholar] [CrossRef]
- Wu, R.; Kresse, O.; Weng, X.; Cohen, C.; Gu, H. Modeling of Interaction of Hydraulic Fractures in Complex Fracture Networks; OnePetro: Richardson, TX, USA, 2012. [Google Scholar]


Disclaimer/Publisher’s Note: The statements, opinions and data contained in all publications are solely those of the individual author(s) and contributor(s) and not of MDPI and/or the editor(s). MDPI and/or the editor(s) disclaim responsibility for any injury to people or property resulting from any ideas, methods, instructions or products referred to in the content. |
© 2023 by the authors. Licensee MDPI, Basel, Switzerland. This article is an open access article distributed under the terms and conditions of the Creative Commons Attribution (CC BY) license (https://creativecommons.org/licenses/by/4.0/).