Abstract
Cryogenic fracturing has been explored in recent years as a waterless fracturing method for well stimulation to avoid issues encountered in water-based hydraulic fracturing. Cryogenic stimulation using liquid nitrogen applies large thermal gradients on reservoir rocks to induce fractures. This study investigates the initiation and proliferation of cryogenic fractures from boreholes under external stress on specimens. We flowed liquid nitrogen through boreholes drilled through the center of transparent PMMA cylinders under uniaxial stress and monitored fracture proliferation, temperatures, and borehole pressures. Our results show that the effect of stress resembles that of hydraulic fractures such that fractures propagate more in the direction of the stress. Under loading perpendicular to the borehole axis, a cloud of annular and longitudinal fractures extends more in the direction of loading. Under loading parallel to the borehole axis, longitudinal fractures dominate, and annular fractures become more suppressed and more sparsely distributed than those of unconfined specimens. Even if fractures are driven to initiate against the influence of stress, such as those from a boundary edge of a high stress concentration, they gradually deflect in the direction of stress, similar to hydraulic fractures from perforation holes that curve toward a direction perpendicular to the minimum stress direction.
1. Introduction
To increase hydrocarbon mobility in low-permeability reservoirs, most wells are completed with well stimulations. Multistage hydraulic fracturing in horizontally drilled wells has been the most popular method for well stimulation. The large amount of water-based fracturing fluid in hydraulic fracturing, however, creates water-related problems such as potential impacts on the environment and groundwater, formation damage resulting from capillary retention and clay swelling, and the high level of consumption of freshwater, placing demands on local water supplies. Consequently, to avoid or minimize these water-related issues, the research and development into waterless or reduced-water fracturing methods have been active in recent years [1,2,3,4,5]. Cryogenic fracturing has been researched as a potentially effective waterless fracturing method.
In cryogenic fracturing, a cryogen, typically liquid nitrogen (LN), is applied on a much warmer rock under downhole conditions, exerting a very large thermal gradient and thermal stresses on reservoir formation to initiate and propagate fractures [6]. Laboratory and numerical studies have been conducted to understand cryogenic fracturing and its implications for the field [7]. Cryogenic treatments increase the pore size in saturated sandstone and expand micro-fissures resulting from thermal stress and frost force [8]. The shale pore structure undergoes significant alteration after freeze–thaw cycles, and some micro-pores are aggregated to form micro- and macro-cracks [9]. LN cooling increases permeability [10,11,12], although it is less effective on sandstone than on other sedimentary rocks [13,14]. Conductive cracks, the size and number of which increase with the initial temperature, are also generated on the surface and near the wellbore of shale [10,15]. After LN treatment, the strength and brittleness of shale decline, which reduces the initiation and propagation pressure of reservoir stimulation [9,16,17].
Nevertheless, we still do not understand how cryogenic fractures initiate and proliferate from boreholes over time. Consequently, Cha et al. [18] studied the process of cryogenic fracture proliferation from wellbores of transparent PMMA samples under no external confining stress. They revealed that annular fracture, longitudinal fracture, and exclusion distance are unique patterns of cryogenic fractures in the early stage. In addition, while cryogenic stimulation produces tortuous fractures, higher borehole pressure promotes straighter growth. Cha et al. [18], however, did not apply external stress to the specimens.
Therefore, in this follow-up study, we investigated the proliferation of cryogenic fractures from boreholes under external stress. For comparison, we applied two uniaxial loading schemes: (1) loading perpendicular to the borehole axis and (2) loading parallel to the borehole axis. Like Cha et al. [18], this study focused on pure thermal shock with negligible borehole hydraulic loading during the coolant flow. We flowed LN through boreholes drilled through the center of transparent PMMA blocks to visualize fracture initiation and propagation. Fracture propagation, temperature, and borehole pressure were recorded during the flow to assess cryogenic fracturing processes and behaviors.
2. Laboratory Study
2.1. Devices and Procedure
LN was supplied from a Dewar and transported through a vacuum-jacketed hose to the specimen and injected into the borehole and then directed to an outlet (Figure 1). This configuration allowed liquid nitrogen (LN) to be continuously flushed, which maximized thermal shock and the thermal gradient on borehole walls and thus cooled the rock around the borehole as rapidly as possible. For the flow of LN through the borehole, we applied a coaxial flow design in which LN entered the borehole through the central smaller-diameter inlet tubing (blue tubing and arrow—Figure 1a), which passed through a larger-size cross-shaped fitting. Warmed nitrogen exited through the annulus between the inlet tubing and the casing, and then through the space in the cross-shaped fitting (orange arrows—Figure 1a). Cryogenic fracturing was carried out via pure thermal shock; the pressure inside the boreholes was less than 50 kPa during the LN flow. A small diameter (30 AWG) of T-type thermocouple wires (TT-T-30 from Omega Engineering, Norwalk, CT, USA) was selected for fast thermal responses (<0.1 s) and access to the borehole. More information about the equipment and measurements appears in Cha et al. [19] and Lu and Cha [20].
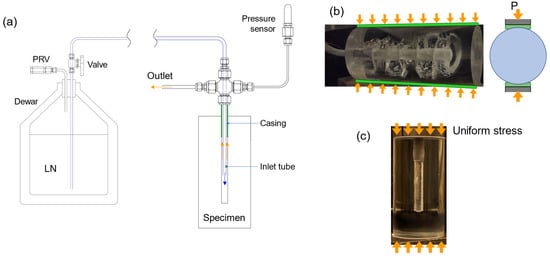
Figure 1.
Experimental setup for the cryogenic stimulation of specimens under stress. (a) Overall setup without the loading device. (b) Vertical stress on the horizontal well (i.e., stress perpendicular to the borehole axis). (c) Vertical stress on the vertical well (i.e., stress parallel to the borehole axis).
Uniaxial loading schemes include (1) loading perpendicular to the borehole axis and (2) loading parallel to the borehole axis (Figure 1 and Table 1). Loading perpendicular to the borehole axis was attained via vertical stress on a horizontal well, in which a loading was applied along a strip due to the cylindrical shape of the specimens used in this study (Figure 1b). The loading parallel to the borehole axis was achieved using vertical stress on a vertical well, in which case, uniform stress was applied over the whole end faces (Figure 1c). Unlike triaxial loading, uniaxial loading enabled real-time visual monitoring because the sides perpendicular to the other two axes were exposed. Teflon sheets placed between the specimen and loading platens uniformly distributed the loading and minimized friction.

Table 1.
Conditions of externally applied stresses and roughness of borehole surfaces.
2.2. Specimens
We conducted the experiments in poly(methyl methacrylate) (PMMA), a transparent, thermoplastic polymer, with the advantage being that one could visually observe fracture proliferation. Researchers have used PMMA for hydraulic fracturing tests because of its known properties and proximity to shale in terms of certain mechanical properties, including fracture toughness and brittleness [21,22,23]. Table 2 summarizes the mechanical and thermal properties of PMMA at both room temperature and cryogenic temperature, for it exhibits temperature-dependent properties. We used three cylindrical PMMA specimens, the outer sizes of which were 10.2 cm in diameter, and embedded the casing in the borehole to a depth of 4.45 cm in all three cases. The full dimensions of each specimen and its borehole are provided in detail in Figure 2. The stress conditions applied to each specimen and roughness conditions are listed in Table 1.
Table 2.
Properties of liquid nitrogen and PMMA (Updated from Cha et al. [18]). Properties of shale, gas nitrogen, and water are shown for comparison.
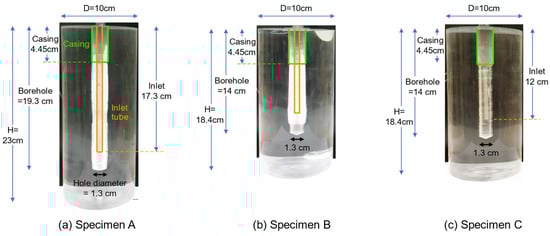
Figure 2.
Dimensions of PMMA specimens and placement of the stainless-steel casings and inlet tubes.
3. Results and Interpretations
3.1. Temperature and Pressure
With the introduction of LN, the borehole temperatures of the specimens dropped rapidly and reached the boiling point of nitrogen in 3.14 min for Specimen A, 3.32 min for Specimen B, and 2.4 s for Specimen C (Location 1 and 2 of Figure 3). The temperature at the outer surfaces, however, remained high, above 0 °C, and also depended on their proximity to the cracks, resulting from the entrance of LN into the crack apertures (Location 3, 4, and 5 of Figure 3). As Location 5 was the farthest from the cracks, the temperature remained the highest. When the LN flow stopped, the temperature at Location 4 recovered because the LN evaporated from the apertures of adjacent cracks, so the area began to warm up. At Location 3, however, the temperature continued to decrease because of its proximity to the region of higher crack density and the steel loading block, the temperature of which was low due to contact with the flow tubing and leaked LN. This temperature distribution demonstrates the effect of the presence of cracks on temperature propagation. During the flows, the ΔT between the borehole surface and the outer surface remained above 200 K, creating an average thermal gradient between the borehole and the outer surfaces of about 46.0 K/cm.
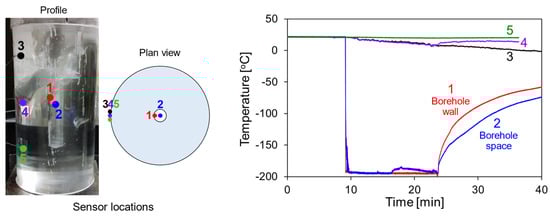
Figure 3.
Typical data of the temperature evolution at various locations during the flow of LN (Specimen C). The colored dots in the left figure show the locations of temperature sensors.
As LN was directly transferred from the Dewar to the borehole, the pressure inside the borehole remained closely associated with the pressure inside the Dewar. The pressure measured at the borehole fell in the range of 90–100 kPa for Specimen A, 20–80 kPa for Specimen B, and 30–60 kPa for Specimen C (Figure 4a). Unlike Specimen A, Specimen B and C had leakage, which reduced the borehole pressure. In fact, because of excessive leaking, we terminated the experiment for Specimen C.
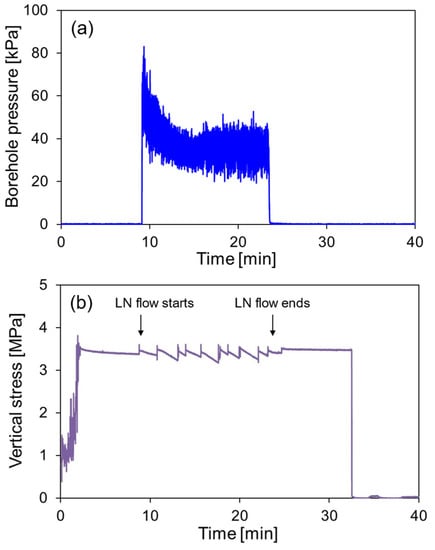
Figure 4.
(a) Typical borehole pressure and (b) vertical stress responses controlled by the oil pressure of the hydraulic actuator, indicating the shrinkage of the specimen during the flow of LN (Specimen C).
Global, longitudinal contractions of specimens were indicated by pressure responses of the hydraulic system (Figure 4b). That is, when the specimen was cooled down, the specimen shrank and the pistons in contact with the specimen decompressed, which decreased the hydraulic pressure. In Figure 4b, each jump represents a manual adjustment that made up for pressure decay in the hydraulic lines to maintain the vertical stress at around 3.45 MPa.
3.2. Fracture Propagation
Behaviors observed in unconfined specimens still held under uniaxial stresses. Fractures started orthogonally from the borehole surfaces, and initial cracks developed primarily in two patterns—fractures perpendicular to the borehole axis (annular fractures) and fractures parallel to the borehole axis (longitudinal fractures)—which were governed by simple pre-crack stress components: circumferential thermal contraction and longitudinal thermal contraction. While the fractures initiated from the borehole perpendicular to the borehole surface, they soon curved one way or another. Fracture growth was characterized by abrupt starts and stops, and as the fracture propagated outward, the growth appeared to be more continuous.
Specimens A, B, and C took 1.83 min, 2.17 min, and 0.5 min, respectively, for the initial cracks to emerge after the initial flow. The average speeds of radial fracture propagation were quantified from time-lapse photos using the longest cracks. The average speeds of fracture propagation in the radial direction were 6.4 mm/min for Specimen A, 7.9 mm/min for Specimen B, and 5.7 mm/min for Specimen C. As Specimen C had a major fracture with consistent curvature, its lengthwise crack speed was 7.1 mm/min. These crack speeds were slightly faster compared to those in the unconfined test [18]. As fractures propagate radially, the fracture propagation rate tends to decrease.
3.3. Effect of Stress
3.3.1. Loading Perpendicular to the Borehole Axis (Specimen A)
Annular fractures emerged slightly earlier than longitudinal fractures and at a quasi-equal distance (final distance between the fractures ≈ 2.5 cm) (Figure 5 and Figure 6). Longitudinal fractures followed about 15 s after and tended to initiate mainly from the top (ceiling) and bottom parts of the borehole, oriented vertically, which was the effect of externally applied stresses.
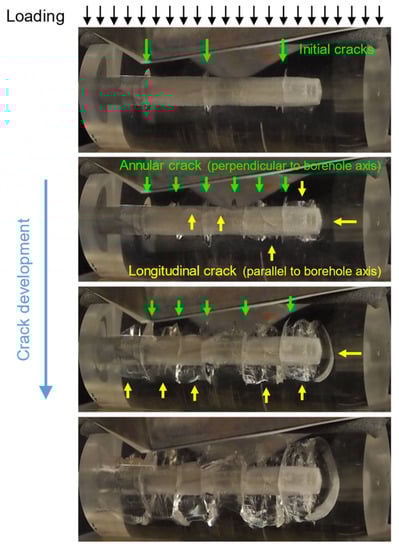
Figure 5.
Selected steps of crack development in Specimen A.
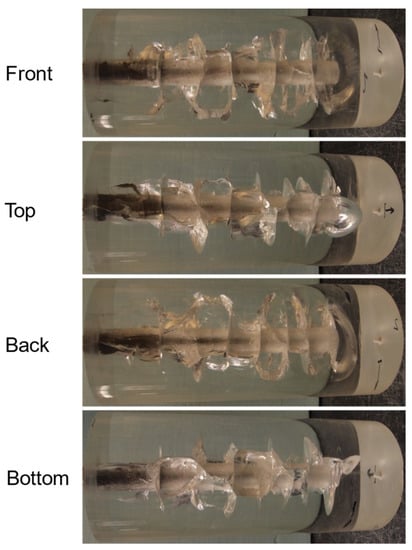
Figure 6.
Crack view from the four sides after completing the experiment on Specimen A.
Although silicone pads were placed to distribute the load a bit, the configuration, not including the borehole, resembled Brazilian tests (Figure 1c and Figure 7a). In Brazilian test loading, compressive stress occurs along the loading direction within the specimen, while tensile stress occurred perpendicular to the loading direction, which is a favorable stress distribution for vertical crack initiation and propagation. Figure 7b shows that the axial loading created the compressive stress of 191 kPa on the horizontal plane at the center of the disk and the tensile stress of −64 kPa on the vertical plane. Although the tensile stress was far below the tensile strength 65 MPa of PMMA (Table 2), it still contributed to preferential fracture propagation along the direction of the loading axis by creating a relative difference between the stresses of the two directions.
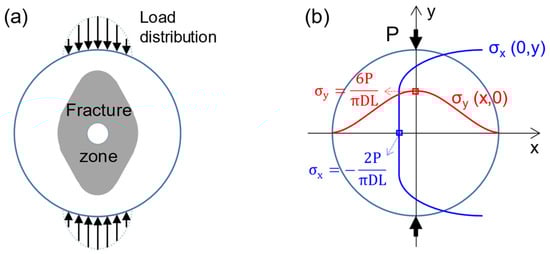
Figure 7.
(a) Schematic of the approximate radial extent of fractures observed in Specimen A (cross-sectional view). (b) Stress distribution within a cylindrical specimen under Brazilian-test-type loading.
Overall, both annular and longitudinal fractures extended more in the direction of the loading (Figure 6 and Figure 7a). The likely explanation for why the fractures did not propagate all the way to the end was the sharply increasing compressive stress near both ends (Figure 6 and Figure 7).
Following the initiation of the annular fractures, longitudinal cracks initiated from and/or formed between the annular fractures, as pre-existing defects (i.e., annular fractures) act as stress concentrators (Figure 5).
3.3.2. Loading Parallel to the Borehole Axis (Specimen B)
For Specimen B, vertical stress of 6.9 MPa was applied on the vertical borehole (Table 1). Longitudinal fractures appeared first, and then, after about 50 s (which is significant), annular fractures followed. Longitudinal fractures remained dominant throughout the stimulation, and the annular fractures in Specimen B were more suppressed and more sparsely distributed (final distance between the fractures ≈ 3.5 cm) than those in Specimen A (Figure 8). After all, unlike in an unconfined borehole, in which cooling immediately creates tension longitudinally and circumferentially, the wall of the vertical borehole was initially under compressive stress longitudinally due to the external loading. With continued LN flow, cooling reduced the compressive stress and then created tensile stress. Unlike Specimen A, in which fractures propagated preferentially in the direction of loading (Figure 7a), the radial propagation of the fractures in Specimen B were roughly equally distributed without a preferential direction (Figure 9).
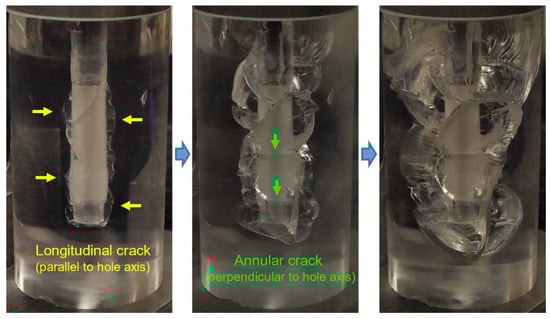
Figure 8.
Selected steps of crack development in Specimen B.
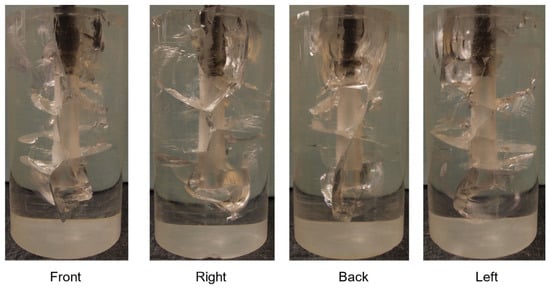
Figure 9.
Crack view from the four sides after completing the experiment in Specimen B.
3.4. Effect of the Distribution of Surface Defects on Crack Initiation
It was observed that during drilling, due to the elevated temperature, borehole surfaces underwent plastic deformation and developed a rough texture. In addition, residual stresses may have existed near the borehole walls because of the cooling of the hot surface during drilling, although this was not verified using such tools as photoelasticity. On the other hand, the smooth or “flawless” surface was created when the temperature of the materials was kept low by slow drilling and a sufficient supply of cooling fluid. Therefore, different levels of surface roughness existed (Figure 2).
The upper part of Specimen C, where the casing was embedded, had a rough surface but a smooth surface below (Figure 2c). All of the fractures in this specimen initiated from the rough surface, but no fractures initiated from the smooth/polished surface (Figure 10 and Figure 11). A major fracture initiated from the circumference (green arrow—Figure 10) where the hole diameter changes abruptly (the diameter of the hole for the embedded casing was slightly larger). As fractures only occurred on the rough surface in the upper part, they reached the top boundary, causing leakage (Figure 10).
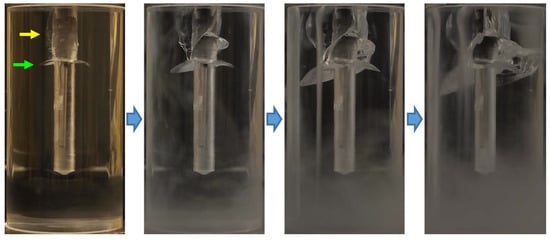
Figure 10.
Selected steps of crack development in Specimen C.
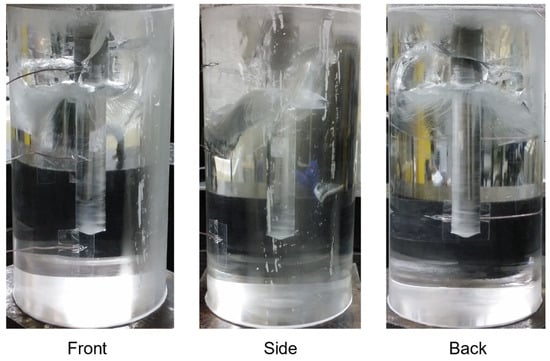
Figure 11.
View of cracks from the sides after completing the experiment in Specimen C.
Hence, it follows that the uniformly rough surface provided a random distribution of defects, which acted as stress concentrators when tensile stress was applied, and thus served as spots for the nucleation of cracks. Conversely, polished/flawless surfaces do not have defects (or have defects on a much smaller scale) and thus do not facilitate crack nucleation as readily as rough surfaces. Thus, surface roughness lowers threshold stress for crack initiation, as predicted using the critical stress at the tip of a defect/crack required for propagation, given by Griffith’s criterion [33]
where a is the depth of a micro crack on the surface, is the surface energy per unit area, and ν is Poisson’s ratio. With crack length a = 0.1 mm and other properties in Table 2, we obtain σf = 0.86 MPa for the plane stress condition and σf = 0.93 MPa for the plane strain condition. Also, Irwin’s criterion for crack propagation in terms of fracture toughness is [34]
where KIc is the fracture toughness of the material, and Y is a dimensionless geometric factor that depends on the shape and size of the crack. Applying a value of Y = 1.3 for a semi-elliptical surface crack [35] and the fracture toughness of 0.78 at −80 °C (Table 2), we obtained σf = 33.6 MPa.
While Griffith’s criterion yields a much lower value than Irwin’s criterion, both predict lower threshold stresses for initiating a crack than the tensile strength of 55–76 MPa of PMMA. Incidentally, the change in the tangential tensile stress induced by temperature changes on the wellbore wall estimated using was calculated to be 67 MPa with the specimen properties in Table 2 (E = 2.85 GPa, α = 70 × 10−6/K, and ν = 0.38) and ΔT = 210 °C. Overall, the formulas indicate the role of defects in lowering the stress required to initiate fractures. The difference between the depth of roughness of the rough and smooth surfaces was at least one order of magnitude, which effectively prevented crack initiation on the smooth surface.
Therefore, it follows from the observations that if the borehole is rough throughout, then the distributed fractures with exclusion distance occur (Specimen A and B). However, if a polished surface exists, cracks occur outside the polished area such as rough surfaces or weak boundaries (Specimen C).
These observations suggest that the initiation and pattern of cryogenic fractures from a wellbore in the field would be significantly influenced by surface characteristics such as drilling-induced textures or naturally existing cracks.
3.5. Cryogenic Fracture vs. Hydraulic Fracture: Effect of Stress
The orientation of a hydraulically induced fracture is dependent on the in situ stress state (magnitude and orientation). Hydraulic fractures form perpendicular to the minimum stress direction (Figure 12a). Under the same stress states as those applied in this study, Figure 12 shows the schematics of the expected orientation of hydraulically induced fractures from an open borehole. As no stresses were present in either horizontal direction (albeit not a realistic condition), this particular situation would have created a vertical fracture in any lateral direction (Figure 12b,c). Hydraulic fracturing exhibits one major fracture plane (per stage in staged fracturing) (Figure 12), although complex features can arise locally if a reservoir formation contains natural fractures. In addition, boundary effects may exist in laboratory specimens.
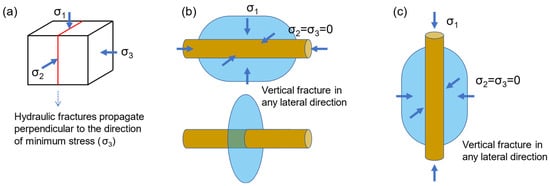
Figure 12.
Expected orientation of hydraulically induced fractures. (a) General principle. (b) The case of horizontal wells with σ1 ≠ 0 and σ2 = σ3 = 0 (Specimen A). (c) The case of vertical wells with σ1 ≠ 0 and σ2 = σ3 = 0 (Specimen B and C).
On the other hand, cryogenic thermal shock with a negligible influence of borehole hydraulic loading induces multiple initiations (vs. the bi-wing initiation of hydraulic fracturing) and curved propagation (vs. the straight propagation of hydraulic fracturing). If stress is applied uniaxially, in addition to manifesting these two features, the effect of stress resembles that of hydraulic fractures such that fractures propagate more in the direction of maximum stress (Figure 5, Figure 6, Figure 7, Figure 8 and Figure 9).
Unlike in the cases that present a regular fracture pattern nucleated from randomly, homogeneously distributed defects (Specimen A and B), in Specimen C, a major annular fracture was driven to initiate perpendicular to the surface of the ringed edge because of a large stress concentration there even though the specimen was under loading parallel to the borehole axis. However, the annular fracture gradually became vertical (the direction of stress), which was clearly the influence of the applied stress (Figure 10 and Figure 11).
Similar behaviors occur in hydraulic fracturing in perforated holes. After hydraulic fractures are forced to initiate at the tip of perforation holes, they curve toward the direction perpendicular to the minimum stress direction [36,37,38,39]. Figure 13 displays an idealized diagram of the influence of the stress ratio σH/σh and the injection rate.
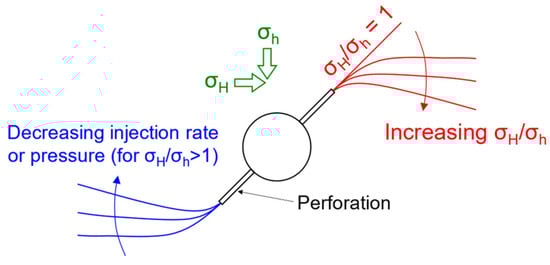
Figure 13.
Idealized diagram of the effect of the stress ratio σH/σh and the injection rate on hydraulic fracturing from perforated holes.
3.6. Cooling Rate of the Borehole Surface
The cooling rates of the borehole surfaces from the initial introduction of LN to about −190 °C, where the temperature quickly stabilizes, were 1.09 °C/s for Specimen A, 1.03 °C/s for Specimen B, and 90.8 °C/s for Specimen C (Figure 3). Thus, the thermal transfer was much more facilitated in Specimen C.
According to the results of previous studies on the cooling of a concrete borehole [17,19], the cooling rates of Specimen A and B were comparable to cases in which the film boiling regime is relevant, where an insulating vapor film is created between the liquid and a hot surface, which slows heat transfer (i.e., the Leidenfrost effect). On the other hand, the magnitude of the cooling rate in Specimen C was comparable to that of the contact boiling regime, which allows much more rapid cooling. In Cha et al.’s study [17], rapid cooling with contact boiling was achieved in the high-pressure LN flow through a borehole, probably due to suppressed vapor film under high pressure.
In pursuit of an explanation for the significantly different cooling rates in our study, although the roughness level of the specimens is a factor affecting boiling regimes, a variety of other surface properties also affect boiling regimes. Many studies have reported that roughness destabilizes the vapor film or elevates the Leidenfrost point, thus enhancing heat transfer [40,41,42]. On the other hand, some studies have reported that certain texture patterns reduce the Leidenfrost point [43,44]. Other surface properties such as wettability and porosity affect the boiling regime [45,46]. A further complexity in our study was the rapid flow condition, which has not been reported in the literature.
A high initial cooling rate is favorable for inducing thermal shock because it creates high local thermal gradients transiently. However, the distribution of pre-existing surface defects appears to be a more dominant factor in fracture initiation.
4. Discussions
4.1. Crack Spacing: Exclusion Distance
A tendency toward regularly spaced annular fractures was displayed in Specimen A and B (Figure 5 and Figure 8). Regular crack spacing or an exclusion distance is present because major cracks cannot form closer than a certain length due to the limited amount of thermal contraction. The crack spacing pattern or exclusion distance has also been reported and modeled in thermal cracking in simple two-dimensional media [47,48,49].
For the geometry of a slab subjected to cooling on one face, the spacing and penetration of the cracks in a regular array depends on the following dimensionless quantity:
where L is the slab thickness, Lc is the characteristic length (or Griffith crack length) of a shrinking solid, and GF is the fracture energy of crack propagation (N/m). Lc is based on thermal tensile stress (σth), Young’s modulus (E), and fracture energy:
The significance of is that cracking will occur when the diffusion of heat has penetrated the slab to a depth of roughly Lc. As L/Lc increases, cracking starts earlier, the final crack spacing decreases, and penetration increases [50,51]. From the equation, increasing accelerates the trend. In the 3D borehole environment, where fractures at later stages begin to interact in a complex manner, the exclusion distance of annular fractures is more obvious in the early stages (Figure 5 and Figure 8).
4.2. Fracture Tortuosity
A non-dimensional fracture toughness (κ) was introduced to categorize the pattern of tortuosity or waviness of thermally induced crack propagation in brittle solid [52]:
where α is the linear thermal expansion coefficient, and b is crack spacing. Cracks propagate straight when κ is relatively large, while they may form wavy paths for relatively small κ values. In our experimental results, κ was 0.141, categorized as “wavy”. Although the classification based on simple glass plates may not allow quantitative comparison with our results from borehole geometry, the equation predicts that smaller fracture toughness and larger ΔT induce more wavy fractures, supported by simulation results. High temperature differences induce high T-stress, which may lead to the turning of the crack. When its local propagating direction becomes normal to its macroscopic propagation direction, it is likely to be arrested because further development of the cooled layer does not increase the stress intensity factor (KI) [52].
The pattern and degree of tortuosity and fracture merging as observed in the borehole geometry of this study were more complex than those observed in the simple geometries of previous thermal shock studies [53,54,55]. Possible causes for fracture tortuosity and the merging observed in this study were the geometry of the borehole and the flow of cryogenic liquid nitrogen in fracture apertures, driving complex, dynamic thermo-mechanical conditions and crack propagation. In fact, we observed that LN flowed almost to the tip of a crack in its liquid state assisted by its low viscosity and surface tension (see Table 2) even though no permeation into the materials occurred.
The curvatures in this study exhibited similarities to “caged fractures” around underbalanced wellbores, where fractures curl around wellbores within a fracture cage [56,57], within which, the principal deviatoric compressional stress follows concentric rings, not the far-field stress. From the principle of a crack following the path of least resistance, the tendency of the fractures curved to be contained within a cylindrical volume rather than propagated outward was induced by the rotation of the local principal stress caused by changes in the internal stress field.
4.3. Effect of Rock Types
PMMA was selected for this study because of its transparency for observations of real-time fracture processes, and PMMA has been used in the literature as a surrogate for rocks in borehole fracturing experiments owing to its similarity to shale regarding certain mechanical properties [21,22,23]. Among rock formations, the closest counterpart of PMMA, which is glassy and impermeable, is shale. In Cha et al.’s study [17], breakdown tests after cryogenic thermal shock on fine-grained shale specimens with low permeability revealed distinct curvatures in fractures even though penetration was limited due to large triaxial stresses.
On the other hand, fractures created via cold-water thermal shock on hot concrete specimens under negligible borehole pressure exhibited a rough fracture surface without consistent curvature [20]. Porous sandstone also exhibited a fracture surface similar to that of concrete, but penetration was significantly less than that of concrete even in an unconfined condition in our unpublished work.
Two differences between fine-grained rock and coarse-grained/porous rock related to thermal fracture patterns can be pointed out. Coarse-grained or porous rocks such as concrete specimens and sandstone are characterized by significant porosity and large grain sizes. Fluid permeates into the porous formation, affecting the temperature field differently from that in a non-permeation condition. Large grains can divert or bifurcate cracks in grain scales, possibly affecting subsequent crack propagation as well. For the latter aspect of large grain sizes, laboratory specimens may not be large enough to reduce the relative effect of grain size and manifest curvature patterns in a greater scale.
4.4. Limitations
Although the degree of the locality of the thermal process was sufficient to create the level of fractures observed in this study, thermal contractions around boreholes were not fully local, since we observed some global contraction in Figure 4b. In a large-scale test or field-scale test where the volume influenced by the thermal process is significantly smaller than the surrounding volume, the locations of measurement or the boundary would be sufficiently far from the thermal influence; thus, measurement would take place under fixed displacement, and global contraction would be negligible. The findings are applicable to open holes.
5. Conclusions
In this study, we performed cryogenic fracturing tests in the boreholes of transparent PMMA specimens under external stresses and directly observed dynamic cryogenic fracturing processes and morphology with time in the borehole geometry. Salient, unprecedented observations of cryogenic fracture proliferation from boreholes under stresses are summarized below.
The major differences between cryogenic fracturing and hydraulic fracturing are that cryogenic thermal shock induces multiple initiations (vs. the bi-wing initiation of hydraulic fracturing) and curved propagation (vs. the straight propagation of hydraulic fracturing). If external stress is applied uniaxially, while still manifesting these two features, the effect of stress resembles that of hydraulic fractures such that fractures propagate more in the direction of the stress.
Specifically, in the case of loading perpendicular to the borehole axis, the cloud of annular and longitudinal fractures extends more in the direction of loading than it does in the case of an unconfined specimen. In the case of loading parallel to the borehole axis, longitudinal fractures are dominant, and annular fractures are more suppressed and more sparsely distributed than they are in the cases of loading perpendicular to the borehole axis or the unconfined specimen.
Even if an annular fracture is driven to initiate from a boundary under the loading parallel to the axis because of high stress concentration, it gradually deflects in the direction of stress, much as hydraulic fractures initiated at the tip of perforation holes curve toward the direction perpendicular to the minimum stress direction.
The roughness of a borehole surface lowers the threshold stress for the initiation of cryogenic fractures. On a borehole surface with uniform roughness, distributed fractures with an exclusion distance will occur. If a surface presents various roughness levels, cracking is focused on rougher surfaces or boundaries. Therefore, in the field, the initiation of cryogenic fractures would be greatly influenced by surface characteristics such as drilling-induced texture or naturally existing cracks.
Author Contributions
Conceptualization, M.C.; methodology, M.C.; formal analysis, M.C.; investigation, M.C., N.B.A. and L.W.; writing—original draft preparation, M.C.; writing—review and editing, N.B.A. and L.W.; funding acquisition, M.C. All authors have read and agreed to the published version of the manuscript.
Funding
This work was supported by a research grant from Jeju National University in 2021.
Institutional Review Board Statement
Not applicable.
Informed Consent Statement
Not applicable.
Data Availability Statement
The data presented in this study are available on request from the corresponding author.
Conflicts of Interest
The authors declare no conflict of interest.
References
- Wang, L.; Yao, B.; Cha, M.; Alqahtani, N.B.; Patterson, T.W.; Kneafsey, T.J.; Miskimins, J.L.; Yin, X.; Wu, Y.-S. Waterless fracturing technologies for unconventional reservoirs-opportunities for liquid nitrogen. J. Nat. Gas Sci. Eng. 2016, 35 Pt A, 160–174. [Google Scholar] [CrossRef]
- Liew, M.; Danyaro, K.U.; Zawawi, N.A.W.A. A comprehensive guide to different fracturing technologies: A review. Energies 2020, 13, 3326. [Google Scholar] [CrossRef]
- Nianyin, L.; Chao, W.; Suiwang, Z.; Jiajie, Y.; Yinhong, D. Recent advances in waterless fracturing technology for the petroleum industry: An overview. J. Nat. Gas Sci. Eng. 2021, 92, 103999. [Google Scholar] [CrossRef]
- Fu, C.; Liu, N. Waterless fluids in hydraulic fracturing–A review. J. Nat. Gas Sci. Eng. 2019, 67, 214–224. [Google Scholar] [CrossRef]
- Liu, J.; Xie, J.; Yang, B.; Li, F.; Deng, H.; Yang, Z.; Gao, M. Experimental Study on the Damage Characteristics and Acoustic Properties of Red Sandstone with Different Water Contents under Microwave Radiation. Materials 2023, 16, 979. [Google Scholar] [CrossRef]
- Tang, S.; Wang, J.; Chen, P. Theoretical and numerical studies of cryogenic fracturing induced by thermal shock for reservoir stimulation. Int. J. Rock Mech. Min. Sci. 2020, 125, 104160. [Google Scholar] [CrossRef]
- Huang, Z.; Zhang, S.; Yang, R.; Wu, X.; Li, R.; Zhang, H.; Hung, P. A review of liquid nitrogen fracturing technology. Fuel 2020, 266, 117040. [Google Scholar] [CrossRef]
- Cai, C.; Li, G.; Huang, Z.; Shen, Z.; Tian, S.; Wei, J. Experimental study of the effect of liquid nitrogen cooling on rock pore structure. J. Nat. Gas Sci. Eng. 2014, 21, 507–517. [Google Scholar] [CrossRef]
- Han, S.; Cheng, Y.; Gao, Q.; Yan, C.; Han, Z. Experimental study of the effect of liquid nitrogen pretreatment on shale fracability. J. Nat. Gas Sci. Eng. 2018, 60, 11–23. [Google Scholar] [CrossRef]
- Wu, X.; Huang, Z.; Li, R.; Zhang, S.; Wen, H.; Huang, P.; Dai, X.; Zhang, C. Investigation on the damage of high-temperature shale subjected to liquid nitrogen cooling. J. Nat. Gas Sci. Eng. 2018, 57, 284–294. [Google Scholar] [CrossRef]
- Alqatahni, N.B.; Cha, M.; Yao, B.; Yin, X.; Kneafsey, T.J.; Wang, L.; Wu, Y.-S.; Miskimins, J.L. Experimental Investigation of Cryogenic Fracturing of Rock Specimens Under True Triaxial Confining Stresses. In Proceedings of the SPE Europec featured at 78th EAGE Conference and Exhibition, Vienna, Austria, 30 May 2016; p. 24. [Google Scholar]
- Elwegaa, K.; Emadi, H. The effect of thermal shocking with nitrogen gas on the porosities, permeabilities, and rock mechanical properties of unconventional reservoirs. Energies 2018, 11, 2131. [Google Scholar] [CrossRef]
- Du, M.; Gao, F.; Cai, C.; Su, S.; Wang, Z. Study on the surface crack propagation mechanism of coal and sandstone subjected to cryogenic cooling with liquid nitrogen. J. Nat. Gas Sci. Eng. 2020, 81, 103436. [Google Scholar] [CrossRef]
- Cha, M.; Yin, X.; Kneafsey, T.; Johanson, B.; Alqahtani, N.; Miskimins, J.; Patterson, T.; Wu, Y.-S. Cryogenic fracturing for reservoir stimulation—Laboratory studies. J. Pet. Sci. Eng. 2014, 124, 436–450. [Google Scholar] [CrossRef]
- Yang, R.; Chunyang, H.; Huang, Z.; Wen, H.; Li, X.; Huang, P.; Liu, W.; Chen, J. Liquid Nitrogen Fracturing in Boreholes under True Triaxial Stresses: Laboratory Investigation on Fractures Initiation and Morphology. SPE J. 2021, 26, 135–154. [Google Scholar] [CrossRef]
- Jiang, L.; Cheng, Y.; Han, Z.; Gao, Q.; Yan, C.; Wang, H.; Fu, L. Effect of liquid nitrogen cooling on the permeability and mechanical characteristics of anisotropic shale. J. Pet. Explor. Prod. Technol. 2019, 9, 111–124. [Google Scholar] [CrossRef]
- Cha, M.; Alqahtani, N.B.; Yao, B.; Yin, X.; Kneafsey, T.J.; Wang, L.; Wu, Y.-S.; Miskimins, J.L. Cryogenic Fracturing of Wellbores Under True Triaxial-Confining Stresses: Experimental Investigation. SPE J. 2018, 23, 1271–1289. [Google Scholar] [CrossRef]
- Cha, M.; Alqahtani, N.B.; Yin, X.; Wang, L.; Yao, B.; Kneafsey, T.J.; Miskimins, J.L.; Wu, Y.-S. Propagation of Cryogenic Thermal Fractures from Unconfined PMMA Boreholes. Energies 2021, 14, 5433. [Google Scholar] [CrossRef]
- Cha, M.; Alqahtani, N.B.; Yin, X.; Kneafsey, T.J.; Yao, B.; Wu, Y.-S. Laboratory system for studying cryogenic thermal rock fracturing for well stimulation. J. Pet. Sci. Eng. 2017, 156, 780–789. [Google Scholar] [CrossRef]
- Lu, Y.; Cha, M. Thermally induced fracturing in hot dry rock environments—Laboratory studies. Geothermics 2022, 106, 102569. [Google Scholar] [CrossRef]
- Gan, Q.; Elsworth, D.; Alpern, J.S.; Marone, C.; Connolly, P. Breakdown pressures due to infiltration and exclusion in finite length boreholes. J. Pet. Sci. Eng. 2015, 127, 329–337. [Google Scholar] [CrossRef]
- Khadraoui, S.; Hachemi, M.; Allal, A.; Rabiei, M.; Arabi, A.; Khodja, M.; Lebouachera, S.E.I.; Drouiche, N. Numerical and experimental investigation of hydraulic fracture using the synthesized PMMA. Polym. Bull. 2020, 78, 3803–3820. [Google Scholar] [CrossRef]
- Alpern, J.; Marone, C.; Elsworth, D.; Belmonte, A.; Connelly, P. Exploring the Physicochemical Processes That Govern Hydraulic Fracture Through Laboratory Experiments. In Proceedings of the 46th U.S. Rock Mechanics/Geomechanics Symposium, Chicago, IL, USA, 24–27 June 2012; p. 6. [Google Scholar]
- Zhang, C.; Zhou, Y.; Shao, T.; Xie, Q.; Xu, J.; Yang, W. Hydrophobic treatment on polymethylmethacrylate surface by nanosecond-pulse DBDs in CF4 at atmospheric pressure. Appl. Surf. Sci. 2014, 311, 468–477. [Google Scholar] [CrossRef]
- Kinloch, A.J. Fracture Behaviour of Polymers; Springer Science & Business Media: Berlin/Heidelberg, Germany, 2013. [Google Scholar]
- Yu, P.; Yao, X.; Tan, S.; Han, Q. A Macro-Damaged Viscoelastoplastic Model for Thermomechanical and Rate-Dependent Behavior of Glassy Polymers. Macromol. Mater. Eng. 2016, 301, 469–485. [Google Scholar] [CrossRef]
- Richeton, J.; Ahzi, S.; Vecchio, K.S.; Jiang, F.C.; Adharapurapu, R.R. Influence of temperature and strain rate on the mechanical behavior of three amorphous polymers: Characterization and modeling of the compressive yield stress. Int. J. Solids Struct. 2006, 43, 2318–2335. [Google Scholar] [CrossRef]
- Zhang, X.; Sun, Z.; Hu, X. Low temperature fracture toughness of PMMA and crack-tip conditions under flat-tipped cylindrical indenter. Polym. Test. 2014, 38, 57–63. [Google Scholar] [CrossRef]
- Bilotti, E.; Fenwick, O.; Schroeder, B.C.; Baxendale, M.; Taroni-Junior, P.; Degousée, T.; Liu, Z. 6.14 Organic Thermoelectric Composites Materials. In Comprehensive Composite Materials II; Beaumont, P.W.R., Zweben, C.H., Eds.; Elsevier: Oxford, UK, 2018; pp. 408–430. Available online: https://www.sciencedirect.com/science/article/abs/pii/B9780128035818100244 (accessed on 6 June 2023).
- Esposito, M.; Buontempo, S.; Petriccione, A.; Zarrelli, M.; Breglio, G.; Saccomanno, A.; Szillasi, Z.; Makovec, A.; Cusano, A.; Chiuchiolo, A.; et al. Fiber Bragg Grating sensors to measure the coefficient of thermal expansion of polymers at cryogenic temperatures. Sens. Actuators A Phys. 2013, 189, 195–203. [Google Scholar] [CrossRef]
- Nguyen, D.; Phan, T.; Hsu, T.-P.; Phan, J. Adhesion and surface energy of shale rocks. Colloids Surf. A Physicochem. Eng. Asp. 2017, 520, 712–721. [Google Scholar] [CrossRef]
- Taghichian, A.; Hashemalhoseini, H.; Zaman, M.; Yang, Z.-Y. Geomechanical optimization of hydraulic fracturing in unconventional reservoirs: A semi-analytical approach. Int. J. Fract. 2018, 213, 107–138. [Google Scholar] [CrossRef]
- Griffith, A.A., VI. The phenomena of rupture and flow in solids. Philos. Trans. R. Soc. Lond. Ser. A Contain. Pap. A Math. Phys. Character 1921, 221, 163–198. [Google Scholar]
- Irwin, G.R. Analysis of stresses and strains near the end of a crack traversing a plate. J. Appl. Mech. 1957, 24, 361–364. [Google Scholar] [CrossRef]
- Anderson, T.L. Fracture Mechanics: Fundamentals and Applications; CRC Press: Boca Raton, FL, USA, 2017. [Google Scholar]
- Liu, L.; Li, L.; Elsworth, D.; Zhi, S.; Yu, Y. The impact of oriented perforations on fracture propagation and complexity in hydraulic fracturing. Processes 2018, 6, 213. [Google Scholar] [CrossRef]
- Dong, Z.; Tang, S. Numerical study of near-wellbore hydraulic fracture propagation. Theor. Appl. Fract. Mech. 2019, 103, 102274. [Google Scholar] [CrossRef]
- Feng, Y.; Gray, K. Modeling of curving hydraulic fracture propagation from a wellbore in a poroelastic medium. J. Nat. Gas Sci. Eng. 2018, 53, 83–93. [Google Scholar] [CrossRef]
- Xi, X.; Yang, S.; Shipton, Z.; Cai, M. Modelling the near-wellbore rock fracture tortuosity: Role of casing-cement-rock well system, perforation and in-situ stress. Int. J. Rock Mech. Min. Sci. 2022, 157, 105182. [Google Scholar] [CrossRef]
- Kruse, C.; Anderson, T.; Wilson, C.; Zuhlke, C.; Alexander, D.; Gogos, G.; Ndao, S. Extraordinary shifts of the Leidenfrost temperature from multiscale micro/nanostructured surfaces. Langmuir 2013, 29, 9798–9806. [Google Scholar] [CrossRef] [PubMed]
- Kwon, H.-m.; Bird, J.C.; Varanasi, K.K. Increasing Leidenfrost point using micro-nano hierarchical surface structures. Appl. Phys. Lett. 2013, 103, 201601. [Google Scholar] [CrossRef]
- Weickgenannt, C.M.; Zhang, Y.; Sinha-Ray, S.; Roisman, I.V.; Gambaryan-Roisman, T.; Tropea, C.; Yarin, A.L. Inverse-Leidenfrost phenomenon on nanofiber mats on hot surfaces. Phys. Rev. E 2011, 84, 036310. [Google Scholar] [CrossRef]
- Vakarelski, I.U.; Patankar, N.A.; Marston, J.O.; Chan, D.Y.; Thoroddsen, S.T. Stabilization of Leidenfrost vapour layer by textured superhydrophobic surfaces. Nature 2012, 489, 274–277. [Google Scholar] [CrossRef]
- Arnaldo del Cerro, D.; Marin, A.G.; Römer, G.R.; Pathiraj, B.; Lohse, D.; Huis in’t Veld, A.J. Leidenfrost point reduction on micropatterned metallic surfaces. Langmuir 2012, 28, 15106–15110. [Google Scholar] [CrossRef]
- Zhong, L.; Guo, Z. Effect of surface topography and wettability on the Leidenfrost effect. Nanoscale 2017, 9, 6219–6236. [Google Scholar] [CrossRef]
- Kim, H.; Truong, B.; Buongiorno, J.; Hu, L.-W. On the effect of surface roughness height, wettability, and nanoporosity on Leidenfrost phenomena. Appl. Phys. Lett. 2011, 98, 083121. [Google Scholar] [CrossRef]
- Bourdin, B.; Marigo, J.-J.; Maurini, C.; Sicsic, P. Morphogenesis and Propagation of Complex Cracks Induced by Thermal Shocks. Phys. Rev. Lett. 2014, 112, 014301. [Google Scholar] [CrossRef] [PubMed]
- Jenkins, D.R. Determination of crack spacing and penetration due to shrinkage of a solidifying layer. Int. J. Solids Struct. 2009, 46, 1078–1084. [Google Scholar] [CrossRef]
- Jiang, C.P.; Wu, X.F.; Li, J.; Song, F.; Shao, Y.F.; Xu, X.H.; Yan, P. A study of the mechanism of formation and numerical simulations of crack patterns in ceramics subjected to thermal shock. Acta Mater. 2012, 60, 4540–4550. [Google Scholar] [CrossRef]
- Jenkins, D.R. Optimal spacing and penetration of cracks in a shrinking slab. Phys. Rev. E 2005, 71, 056117. [Google Scholar] [CrossRef]
- Amarasiri, A.L.; Kodikara, J.K. Effect of characteristic lengths of fracture on thermal crack patterns. Int. J. Geomech. 2015, 15, 04014071. [Google Scholar] [CrossRef]
- Sumi, Y.; Mu, Y. Thermally induced quasi-static wavy crack propagation in a brittle solid. Mech. Mater. 2000, 32, 531–542. [Google Scholar] [CrossRef]
- Wang, Y.; Zhou, X.; Kou, M. An improved coupled thermo-mechanic bond-based peridynamic model for cracking behaviors in brittle solids subjected to thermal shocks. Eur. J. Mech.-A/Solids 2019, 73, 282–305. [Google Scholar] [CrossRef]
- Shao, Y.; Zhang, Y.; Xu, X.; Zhou, Z.; Li, W.; Liu, B. Effect of crack pattern on the residual strength of ceramics after quenching. J. Am. Ceram. Soc. 2011, 94, 2804–2807. [Google Scholar] [CrossRef]
- Xu, X.; Lin, Z.; Sheng, S.; Yuan, W. Evolution mechanisms of thermal shock cracks in ceramic sheet. J. Appl. Mech. 2016, 83, 071001. [Google Scholar] [CrossRef]
- Weijermars, R.; Wang, J. Stress Reversals near Hydraulically Fractured Wells Explained with Linear Superposition Method (LSM). Energies 2021, 14, 3256. [Google Scholar] [CrossRef]
- Weijermars, R. Stress cages and fracture cages in stress trajectory models of wellbores: Implications for pressure management during drilling and hydraulic fracturing. J. Nat. Gas Sci. Eng. 2016, 36, 986–1003. [Google Scholar] [CrossRef]


Disclaimer/Publisher’s Note: The statements, opinions and data contained in all publications are solely those of the individual author(s) and contributor(s) and not of MDPI and/or the editor(s). MDPI and/or the editor(s) disclaim responsibility for any injury to people or property resulting from any ideas, methods, instructions or products referred to in the content. |
© 2023 by the authors. Licensee MDPI, Basel, Switzerland. This article is an open access article distributed under the terms and conditions of the Creative Commons Attribution (CC BY) license (https://creativecommons.org/licenses/by/4.0/).