Abstract
The basic work of power data research is anomaly detection. It is necessary to find a method suitable for processing current power system data. Research proposes an algorithm of fast density peak clustering with Local Outlier Factor (LOF). The algorithm has poor performance in processing datasets with irregular shapes and significant local density changes, and has the disadvantage of strong dependence on truncation distance. This study provides the decision rules for outliers incorporating the idea of LOF. The improved algorithm can fully consider the characteristics of power data and reduce the dependence on truncation distance. In anomaly detection based on the simulation of real power data, the classification accuracy of the improved CFSFDP algorithm is 4.87% higher than that of the traditional algorithm, and the accuracy rate is 97.41%. The missed and false detection rates of the LOF-CFSFDP algorithm are decreased by 2.23% and 2.64%, respectively, compared to the traditional algorithm, and it is ultimately able to reach rates of 1.26% and 1.33%. These results indicate that the algorithm proposed in this study can better describe the characteristics of power data, making the features of outliers and cluster center points more obvious.
1. Introduction
Today, people have higher requirements for the services provided by power grid (PG) companies. The original single and rugged service model has difficulty coping with more personalized and intelligent customer needs. Therefore, providing personalized, real-time, and refined services to customers has become an urgent pursuit of PG companies. To date, the driving technologies for power data in most countries have not yet fully matured, and the massive amount of accumulated power data cannot yet effectively provide full value to PG companies. Therefore, it is necessary to use artificial intelligence and big data methods to deeply mine power data, discover its hidden information, and fully utilize its data-driven function to improve the value and profits of PG companies. Outlier data (OD) detection has a wide range of applications in the power industry. It is a significant technology that can discover OD and hidden information behind OD, and has strong practicality [1,2]. Outliers exist in power data, and if these original data are not processed in advance during data analysis there is a great negative impact on the accuracy of data analysis. At the same time, OD include identification of the potential causes of abnormal phenomena. By using data-driven methods to identify these causes, timely attention can be paid to the occurrence of faults, real-time monitoring of the PG can be achieved, and sources of power quality interference can be eliminated. Meanwhile, the same approach can reduce technical losses in the PG and improve the stability of the operating state of the power system. The early methods used for detecting power anomalies were relatively simple, often using technical personnel on site for troubleshooting. This method utilizes a certain amount of prior knowledge and requires continuous data accumulation in the early stages, which wastes a large amount of human and material resources. Moreover, it often occurs only after a power failure has occurred, and cannot maintain the operational status of the PG in real-time. By using data-driven methods to detect anomalies in power data, enterprises can reduce their reliance on human resources and monitor the operational status of the PG in real-time. When the PG is in a state of alert or abnormality, this method can issue a timely alarm, cut off the power supply, prevent the spread of faults, and minimize economic losses for the PG. For users, smart grid anomaly detection (AD) enhances service, detects bad electricity use behavior in a timely fashion, and eliminates dangers caused by abnormal electricity use [3,4]. For society at large, AD can reduce waste of human resources and expenses due to competitive costs while improving the competitiveness of enterprises. In accordance with the above situation, the present study proposes a fast density peak clustering (FDPC) algorithm with Local Outlier Factor (LOF). In line with the concept of LOF and the introduction of the concept of logistic followers, features such as irregularity, high density, high precision, and high resolution are redefined and criteria for distinguishing outliers are established. The improved algorithm can fully consider the characteristics of power data and reduce dependence on the truncation distance. To assist enterprises in achieving real-time intelligent detection, reducing energy waste, and improving their competitiveness, we conducted research on power AD methods. T. Dutta et al. established a PG AD platform using low-cost drones and aerial imaging technology, achieving autonomous detection of the PG and effectively reducing enterprise costs [5]. While the FDPC algorithm has obvious advantages for AD in power data, there are a number of limitations when using this method. In cases involving power data with irregular shape and significant local density changes, the FDPC algorithm has poor processing performance and strong dependence on the truncation distance. To overcome these challenges, the present study redefines the relative density, distance, and retrograde using the idea of LOF. The improved algorithm can fully consider power data and is less dependent on the truncation distance. The theoretical contribution of this research is to successfully construct an LOF-based FDPC algorithm for power data outlier detection, successfully identify large local density changes in power data, and improve the problems of insufficient clustering centers and inaccurate clustering results. In terms of practical contributions, this research can help power companies to provide better product strategies and improve their competitiveness in the power market, leading to higher profits.
2. Related Works
FDPC is a common clustering method that has been widely applied in the research of many scholars. Shao N and others stated that the operation of the Internet of Thing (IoTs) for distribution greatly affects the efficiency of the entire power system, playing an important role in the intelligent construction of the PG. As the sensing layer of the IoT for distribution, the accuracy of its measurement data determines whether the IoTs for distribution can operate normally and efficiently. Based on this, they proposed an AD method based on the principle of spatiotemporal correlation. At first, the distance matrix between datapoints was estimated based on the spatiotemporal correlation theory and similarity measurement criteria, and the improved DBSCAN algorithm was used to screen outliers. Finally, the spatiotemporal correlation characteristics of the data were input into the fuzzy logic system to judge the sources of outliers, and the reliability of this method was verified by simulation experiments [6]. Lee J H et al. suggested that using deep learning algorithms for big data analysis could provide effective value for enterprises when executing decisions, and proposed an intelligent method for identifying outlier factors. This method combines convolutional neural networks (CNNs), short-term memory algorithms, and fast Fourier transform to achieve algorithm prediction functions. Their experimental results showed that the dataset pretreated by fast Fourier transform made it easier to find ignored outlier factors in follow-up analysis. Compared with other models, the loss during training and testing was significantly decreased, and the convergence was close to zero. Therefore, the authors concluded that this model and data preprocessing approach greatly helped in completing outlier diagnosis [7]. Rydin Gorjão L et al. noted that power systems have attracted the attention of many scholars and that this research includes the use of theories such as scaling laws and interference propagation speed. A large amount of power experience data is the key to verifying these theories. Thus, their study selected a known and publicly available dataset to analyze the frequency of the PG, verified the scaling rules of fluctuations, and specifically described the homogenization process of fluctuations [8]. Sun J et al. conducted a study to evaluate the performance and technical level of power supply chain systems in various provinces of China. Through quantitative comparative analysis, they described the improvements that should be made to inefficient power supply chain systems [9]. Tenorio Trigoso A et al. investigated the IoT as the key to building a smart city. Their IoT-based approach included data processing and network protocols, respectively the POST architecture and MQTT-CEP architecture. POST was used as the baseline, while MQTT-CEP was responsible for processing time. The combination of these two operations achieved a great improvement in service quality. Their research findings noted that when the grid was at a normal level, the structure was more stable under increased load [10].
In the research on outliers in power data, scholars have adopted a variety of methods of analysis. He X et al. suggested that node selection of crowdsourcing exception data in a troubleshooting system plays an important role in the completion of difficult tasks. Although the existing trusted node selection approach based on blockchain improved the reliability of task results to a certain extent, considering its cost, the authors proposed selection of trusted working nodes using the TWNS algorithm, and first modeled it to form an inverse 0–1 knapsack problem. Then, the problem was solved through branching and bounding of the TWNS algorithm. Finally, three sets of known data were selected for simulation experiments to verify the reliability of the algorithm. The experimental results showed that the TWNS algorithm reduced crowdsourcing costs by 64.6% [11]. Lili M A et al. proposed a way to enhance the detection capability of fiber optic communication networks to improve AD. Their recognition algorithm iteratively optimizes network anomaly attack features. The steps are roughly divided into two; initially, the sample data are classified, the neighborhood interval radius is selected, and the feature parameters are extracted and optimized through clustering iteration. Finally, the screening of outliers is achieved through the entropy objective function [12]. Deng X et al. established a CNN model to detect and classify anomalies in synchronous phasor measurements. Their study considered four types of anomalies observed in actual synchronous phasors, including error modes, random spikes, leakage points, and high-frequency interference. The proposed model was extensively evaluated based on measurement results collected on site from the synchronized phasor network of the Jiangsu PG in China. The excellent performance of the proposed model indicates that using deep learning to detect anomalies in synchronized phasor measurement has great potential [13]. Sla B et al. mined the attribute features behind electricity theft based on electricity distribution and utilization data, then summarized the identification methods for electricity theft. According to the distance and density algorithm, their AD method had a good recognition effect for the detection of power theft using voltage and power loss methods. In response to the issue of power factor error recognition, they used Pearson coefficient and grayscale correlation analysis to analyze the degree of change in the load characteristic curve after power theft occurred. Then, the line loss and abnormal power consumption monitoring models were calculated and applied. By relying on a comprehensive management system for power consumption and line loss, power outage identification was achieved from the two dimensions of monitoring period and before monitoring period [14].
To sum up, the CFSFDP method has been widely used in cancer detection, computer technology, and other fields; however, it has been less used for AD in power data. Meanwhile, scholars have made different improvements to CFSFDP and gained inspiration from it. In this research, LOF is introduced into the algorithm, and the improved method is applied for the first time in OD analysis, with the purpose of providing new ideas for assisting in OD detection.
3. FDPC Based on LOF for Power Data Security
3.1. AD of Fast Density Peak
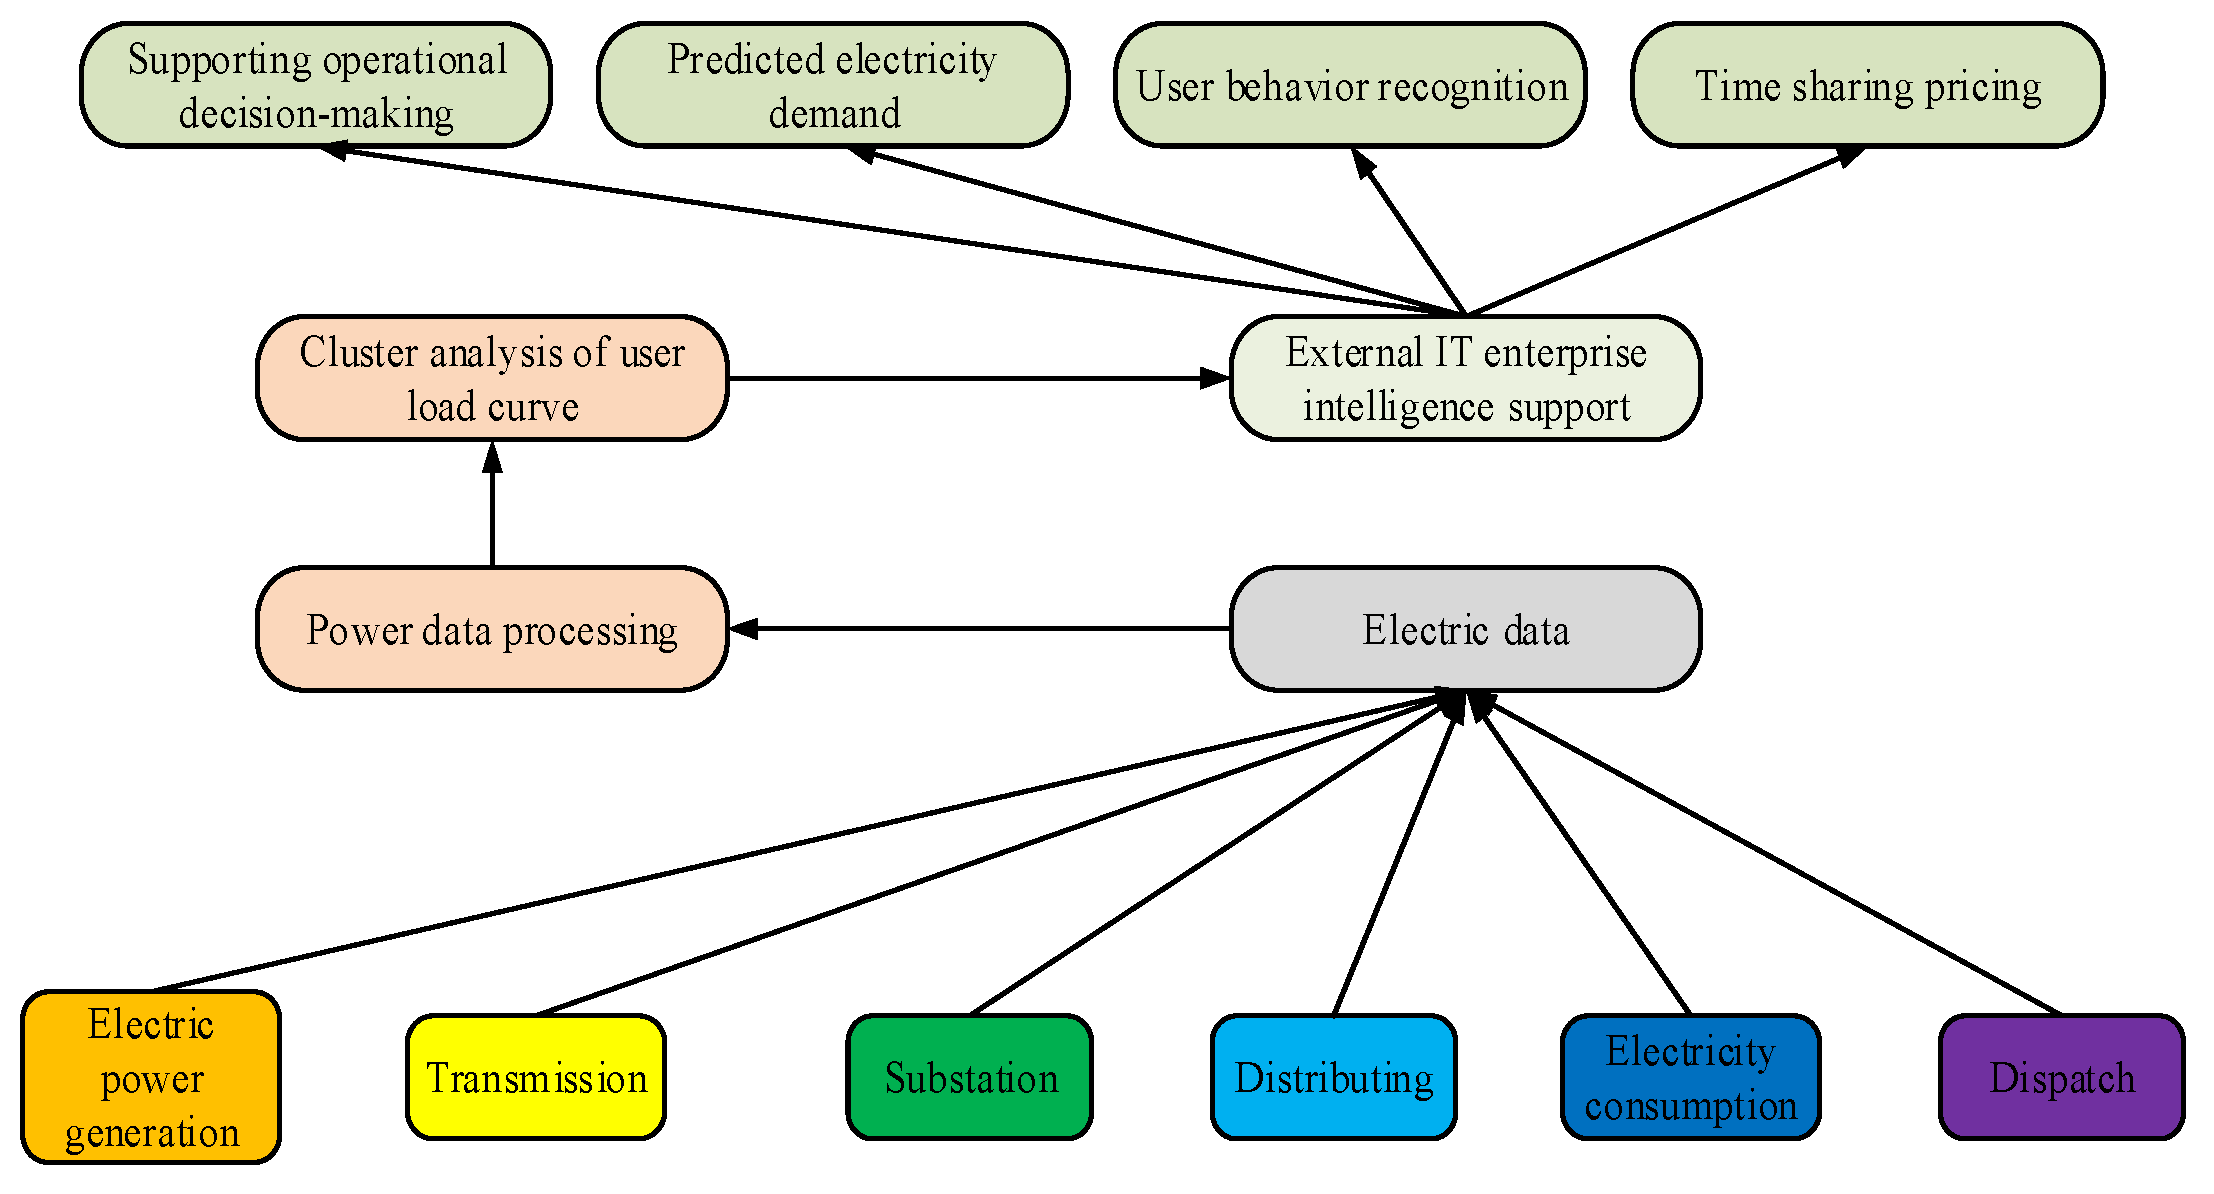
With the advancement of digital transformation, power enterprises have installed data acquisition equipment in systems used for power generation, transmission, distribution, and consumption, providing data support for intelligent power station construction and power system decisionmaking. However, behind the digital transformation lies the need for managing massive amounts of data, especially the various types of information hidden behind OD. How to accurately extract useful content from these data is of great significance for the normal operation of the power system. The schematic diagram of the power system decisionmaking application is shown in Figure 1.
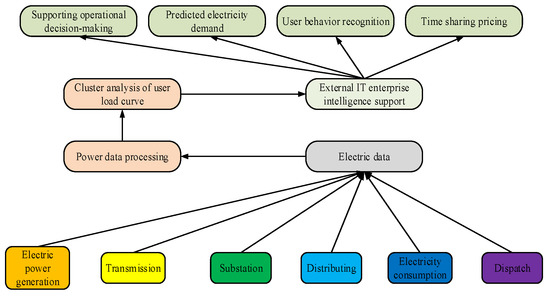
Figure 1.
Schematic diagram of power system decisionmaking application.
Figure 1 reflects the fact that prediction of the power system is based on changes in power data; thus, the detection of OD has important practical significance for power development. OD are a type of data with a different meaning than other data in the dataset. This leads people to believe that OD are not necessarily randomly generated, rather being generated in one or several specific situations. In the actual operation of the power system, multiple systems may generate such data, which may conceal information about the activity status of the system or collector. The generation of OD often implies the occurrence of abnormal situations. Therefore, the amount of information contained in outlier data may be greater than that contained in normal data (which are nonetheless valuable as a reference). Analyzing data that deviate from normal mode can help in analyzing the operating status of the PG from the back. The essence of density-based AD methods is that the cluster density of normal sample points is higher than that of outlier samples. For CFSFDP, the distance between data and adjacent points is represented by Formula (1) [15,16,17].
In Formula (1), means the distance between data points; is the detection datapoint; and indicates an approaching point. Meanwhile, Formula (1) needs to meet two conditions. One is that there are at least neighboring points in the set except for its own datapoints. The second is that there are at most neighboring points in the set except for its own datapoints. The expression that satisfies the above conditions is shown in Formula (2).
The true distance between the detection data and adjacent points can be expressed by , and its reachable distance should not be less than . The expressions for the local reachable density and LOF of sample points are described by Formula (3).
In Formula (3), denotes the number of adjacent points within the distance of the sample point, while is the reachable distance. The closer the ratio of local outliers is to 1, the closer the density of the sample point is to that of its neighboring points in the domain. This reflects the fact that the sample points belong to the same cluster as the neighboring points in the domain. If the ratio of LOFs is larger, this means that the density of sample points is smaller than that of the adjacent points in the field, which means that the sample points may belong to an outlier.
CFSFDP performs well in processing power data, and the research on clustering technology is relatively mature. This algorithm can quickly discover the clustering centers of arbitrarily shaped sample sets and complete classification while using the feature values of sample points to eliminate outliers. However, this method has certain limitations. The clustering algorithm and outliers are complementary. When the quality of the clustering results is poor, the results of AD are not accurate. Abnormal points are sensitive to the number of clustering results, and different clustering centers may result in different clustering results. In certain cases, samples belonging to outliers may become normal sample points under another clustering result [18,19,20]. Power data have the characteristic of significant changes in local density, such as during summer, when electricity consumption shows a significant upward trend, resulting in peak electricity consumption. If these power consumption data are included in the annual power consumption data, they may be regarded as outlier data by the algorithm. However, during the summer data period from June to September this peak electricity consumption is normal, not anomalous.
3.2. LOF-Based Fast Density Peak AD
When using CFSFDP to detect outliers, it is not necessary to determine the cluster center in advance. However, the accuracy of the CFSFDP algorithm is determined by the truncation distance, and the characteristics of power data are not taken into account when calculating density, leading to unsatisfactory results. The present study proposes using the concept of LOF to define the relative density and distance, then a modified CFSFDP algorithm is proposed based on LOF. This method redefines local density using Formula (4) [21].
In Formula (4), refers to the sample point local density parameter value. Similarly, the improved expression for the relative distance can be obtained by Formula (5) [22].
In Formula (5), the selected samples are calculated in sequence and the minimum relative distance among them is selected. Using Formulas (4) and (5), a decision graph of can be drawn. When the cluster of adjacent points is the same as the cluster of sample points, the reachable distance between them is smaller, only resulting in a larger . If the sample points are outliers, the reachable distance between them is large, resulting in a smaller . For the relative distance formula, if there are fewer adjacent points around the sample points, one of two different situations occurs. The first scenario occurs when there are a few neighboring points around the sample point and it is far from the high-density sample, in which case the reachable distance should be greater than the true distance between the sample and the neighboring points. The second situation occurs when the sample points are isolated points; when the distance from the adjacent points is large, the reachable distance is taken as the true value between the sample points. When the sample points belong to the same cluster as the surrounding neighboring points, the minimum distance between the sample points and samples with high relative sample point density is set as the relative distance of the sample points. For the sample points with the highest density in the dataset, is taken. Through the above analysis, if the distance and density of a sample in the dataset are relatively large, it may be the clustering center. Sample points with small relative density and large relative distance may be outliers.
Due to the AD rule in Formula (3), the relative density of a sample is assigned based on the size of the LOF. For sample points with a local factor greater than 1, the relative density is set to 0. Sample points not greater than 1 can reduce time complexity, as shown in Formula (6) [23].
If the sample point is an outlier, Formula (7) is satisfied.
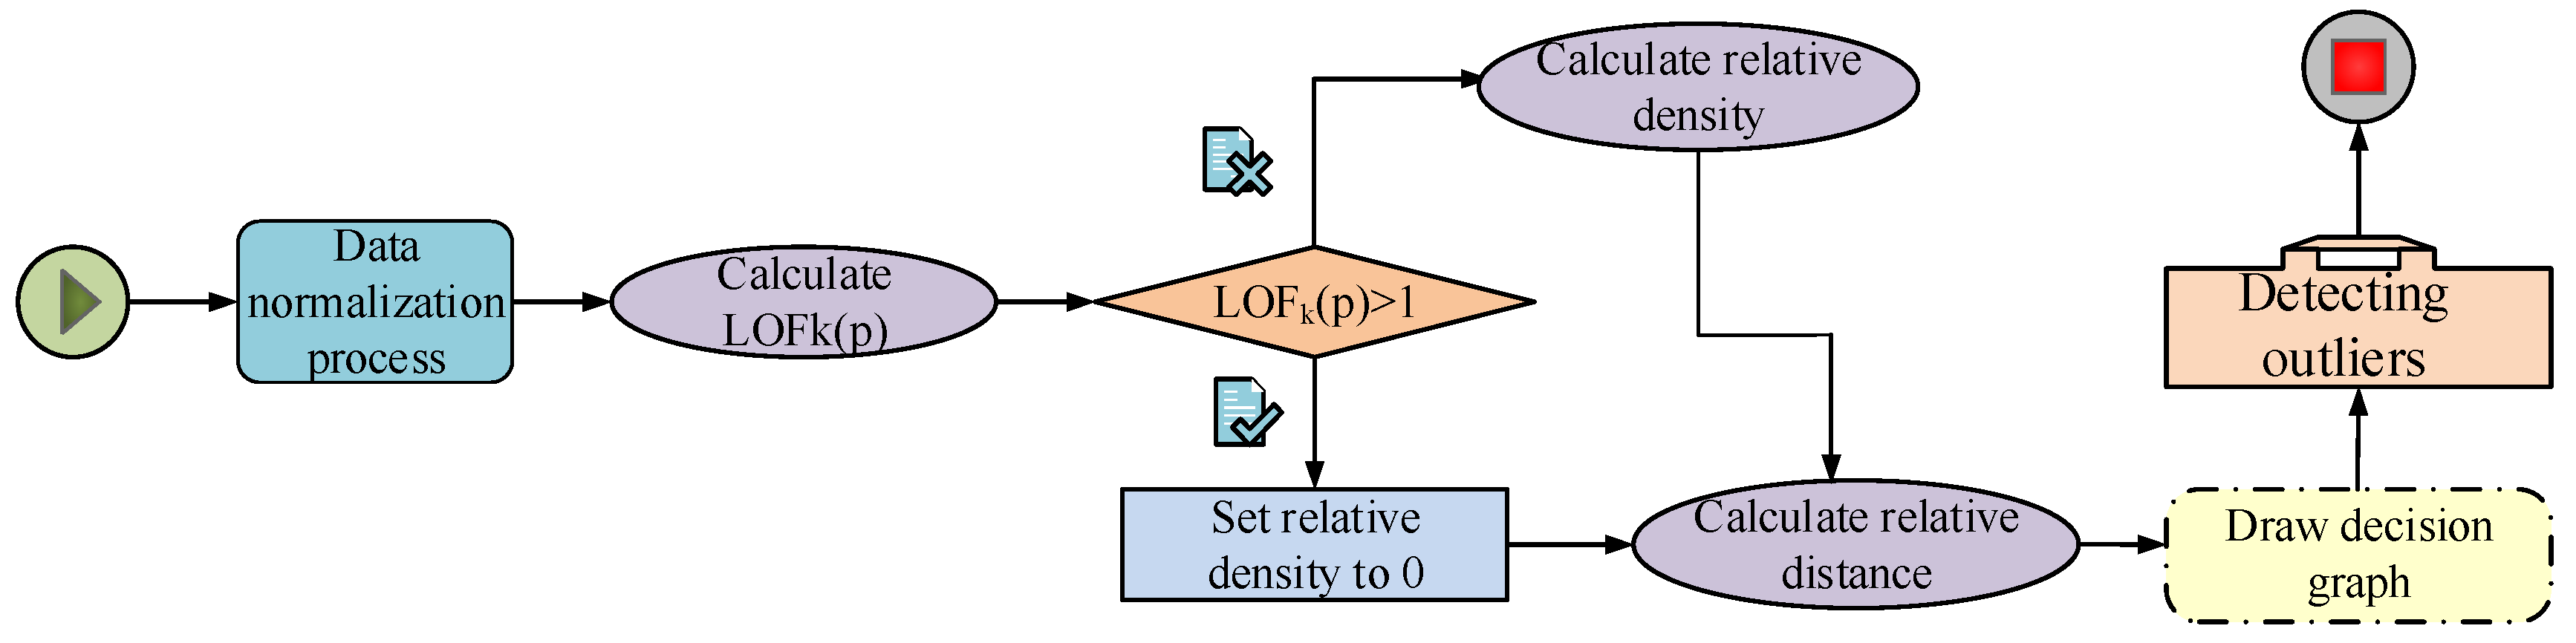
The improved AD algorithm calculates the sample points’ reachable distance, sets the relative density of sample points greater than 1 to 0 using the LOF formula, then marks the point. Then the relative distance of the sample points is calculated and the relative density of the remaining unlabeled sample points is calculated. Then, a decision map is drawn for . Finally, the sample points are judged as to whether they are outliers. The detailed flow chart of the improved algorithm is shown in Figure 2.
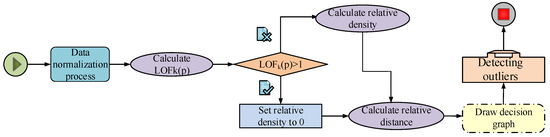
Figure 2.
Flow chart of AD with LOF.
3.3. Power Load Cluster Analysis with Improved LOF
Extracting feature values from power data first requires reducing the dimensionality of the samples. Feature extraction involves transforming the original high-dimensional feature space into a new low-dimensional one through some form of transformation. The original feature set of power data is composed of features that reflect the time characteristics of load curves, such as the peak, average, and valley values of power consumption rates. Although the physical meaning of the new features obtained through feature extraction is not clear, the new features do contain most of the information in the dataset, providing improved clustering efficiency while ensuring high clustering accuracy. Due to the high dimensionality of time series datasets and their high levels of random disturbances and noise, it becomes quite difficult to analyze the similarity of sequences. Among the data dimensionality reduction processing methods, Principal Component Analysis (PCA) has a good effect on dimensionality reduction. The essence of PCA is to linearly transform multiple original variables to obtain a certain amount of mutually orthogonal new variables. Although the number of new variables is smaller, they should contain as much information about the original variables as possible; these new variables are called principal components. Assuming that the sample set of the original power data is , the sample matrix is Formula (8) [24].
The standardization formula for normalizing the sample matrix is Formula (9).
In Formula (9), means the sample mean, while indicates the standard deviation. The standardized matrix obtained from Formula (9) is Formula (10) [25].
The correlation coefficient matrix is calculated according to Formula (11) in the standardized matrix of Formula (10).
In Formula (11), denotes the correlation coefficient matrix, and its eigenvalues are calculated as shown in Formula (12).
In Formula (12), expresses the eigenvalues, and the number of eigenvalues is determined by Formula (13).
Formula (13) seeks to solve the value of when ensuring that the information utilization rate reaches 85% or more. Then, each eigenvalue equation group is solved to obtain the unit eigenvector, as listed in Formula (14).
The principal components of the standardized matrix are calculated to obtain the principal component matrix, as shown in Formula (15) [26].
In Formula (15), stands for the principal component vector of the -th sample and its -th component is the projection of vector on the unit feature vector .
The original algorithm relies on a lack of standardized judgment rules in manually identifying possible clustering centers in the decision graph, which involves a certain degree of randomness and subjectivity. In response to this issue, in this paper we propose n improved CFSFDP using the LOF idea in which a clustering center critical point is selected using the normalized product of the eigenvalues of sample points, achieving automatic selection of clustering centers. This method compares the differences between the normalized products of feature values to evaluate the features of sample points. The change in slope of a two-dimensional planar graph drawn based on the characteristic values of the sample points can directly reflect the critical point of the clustering center. Furthermore, the sample points before the critical point are automatically determined as the cluster center, while those after the critical point are clustered according to the allocation principle. The trend of the initial point slope change in the plan view is Formula (16).
In Formula (16), refers to the product of the normalized eigenvalues of the sample points. One characteristic of power data is significant local density changes; thus, research on power data focuses on local changes. This study improves the description features of sample points by using samples with significant slope changes as critical points. The trend of the slope change is redefined as in Formula (17).
In Formula (17), the trend of the slope change is the ratio of the slopes between sample points, and the sample point with the largest is considered as the critical point. In CFSFDP, density information is more important than distance information. This study uses Formula (18) to weight the products of the normalized sample point features.
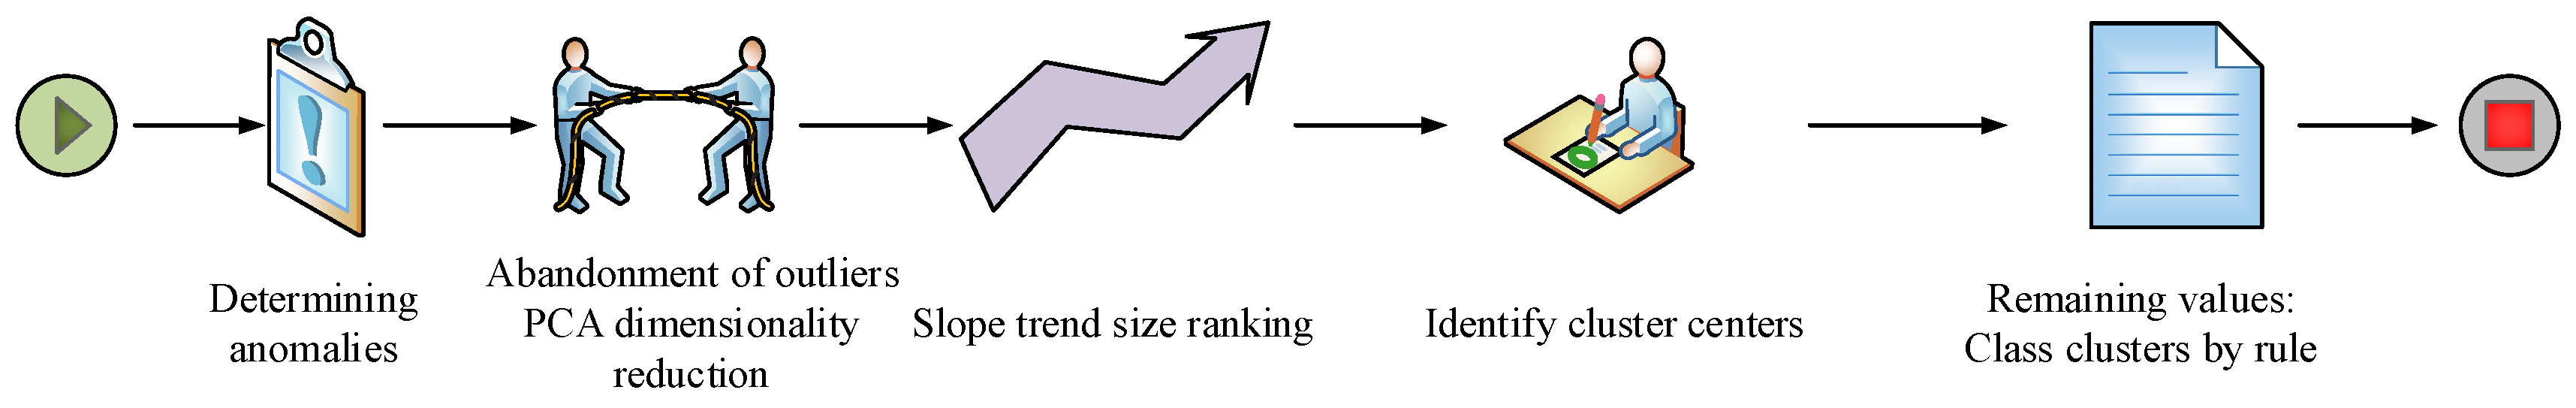
In Formula (18), and both mean the parameter values of the sample points, while refers to a preference parameter with a value of 1.2. If the value of is larger, the probability of the sample becoming the cluster center is greater. The flow chart of the improved LOF-CFSFDP is shown in Figure 3.
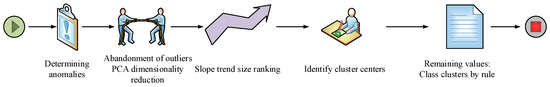
Figure 3.
Flow chart of the improved LOF fast density peak algorithm.
Figure 3 shows the overall flow chart of the algorithm. The algorithm first determines whether the power data are abnormal, then discards the outliers in the data and uses the PCA method to reduce the dimensionality of the data. The datapoints are sorted according to their score sizes. The datapoints that rank first are the center points, and the remaining points are classified according to the rules.
4. Performance Analysis of Power Data Security Detection Based on LOF-CFSFDP
4.1. Analysis of OD Detection Performance
This study analyzed OD detection performance through simulation experiments, for which Python was adopted. A power company used an electricity meter to measure power with a frequency of 1 h, resulting in 24 sample points each day. The relevant parameters used in the simulation experiment are shown in Table 1.

Table 1.
Simulation parameters.
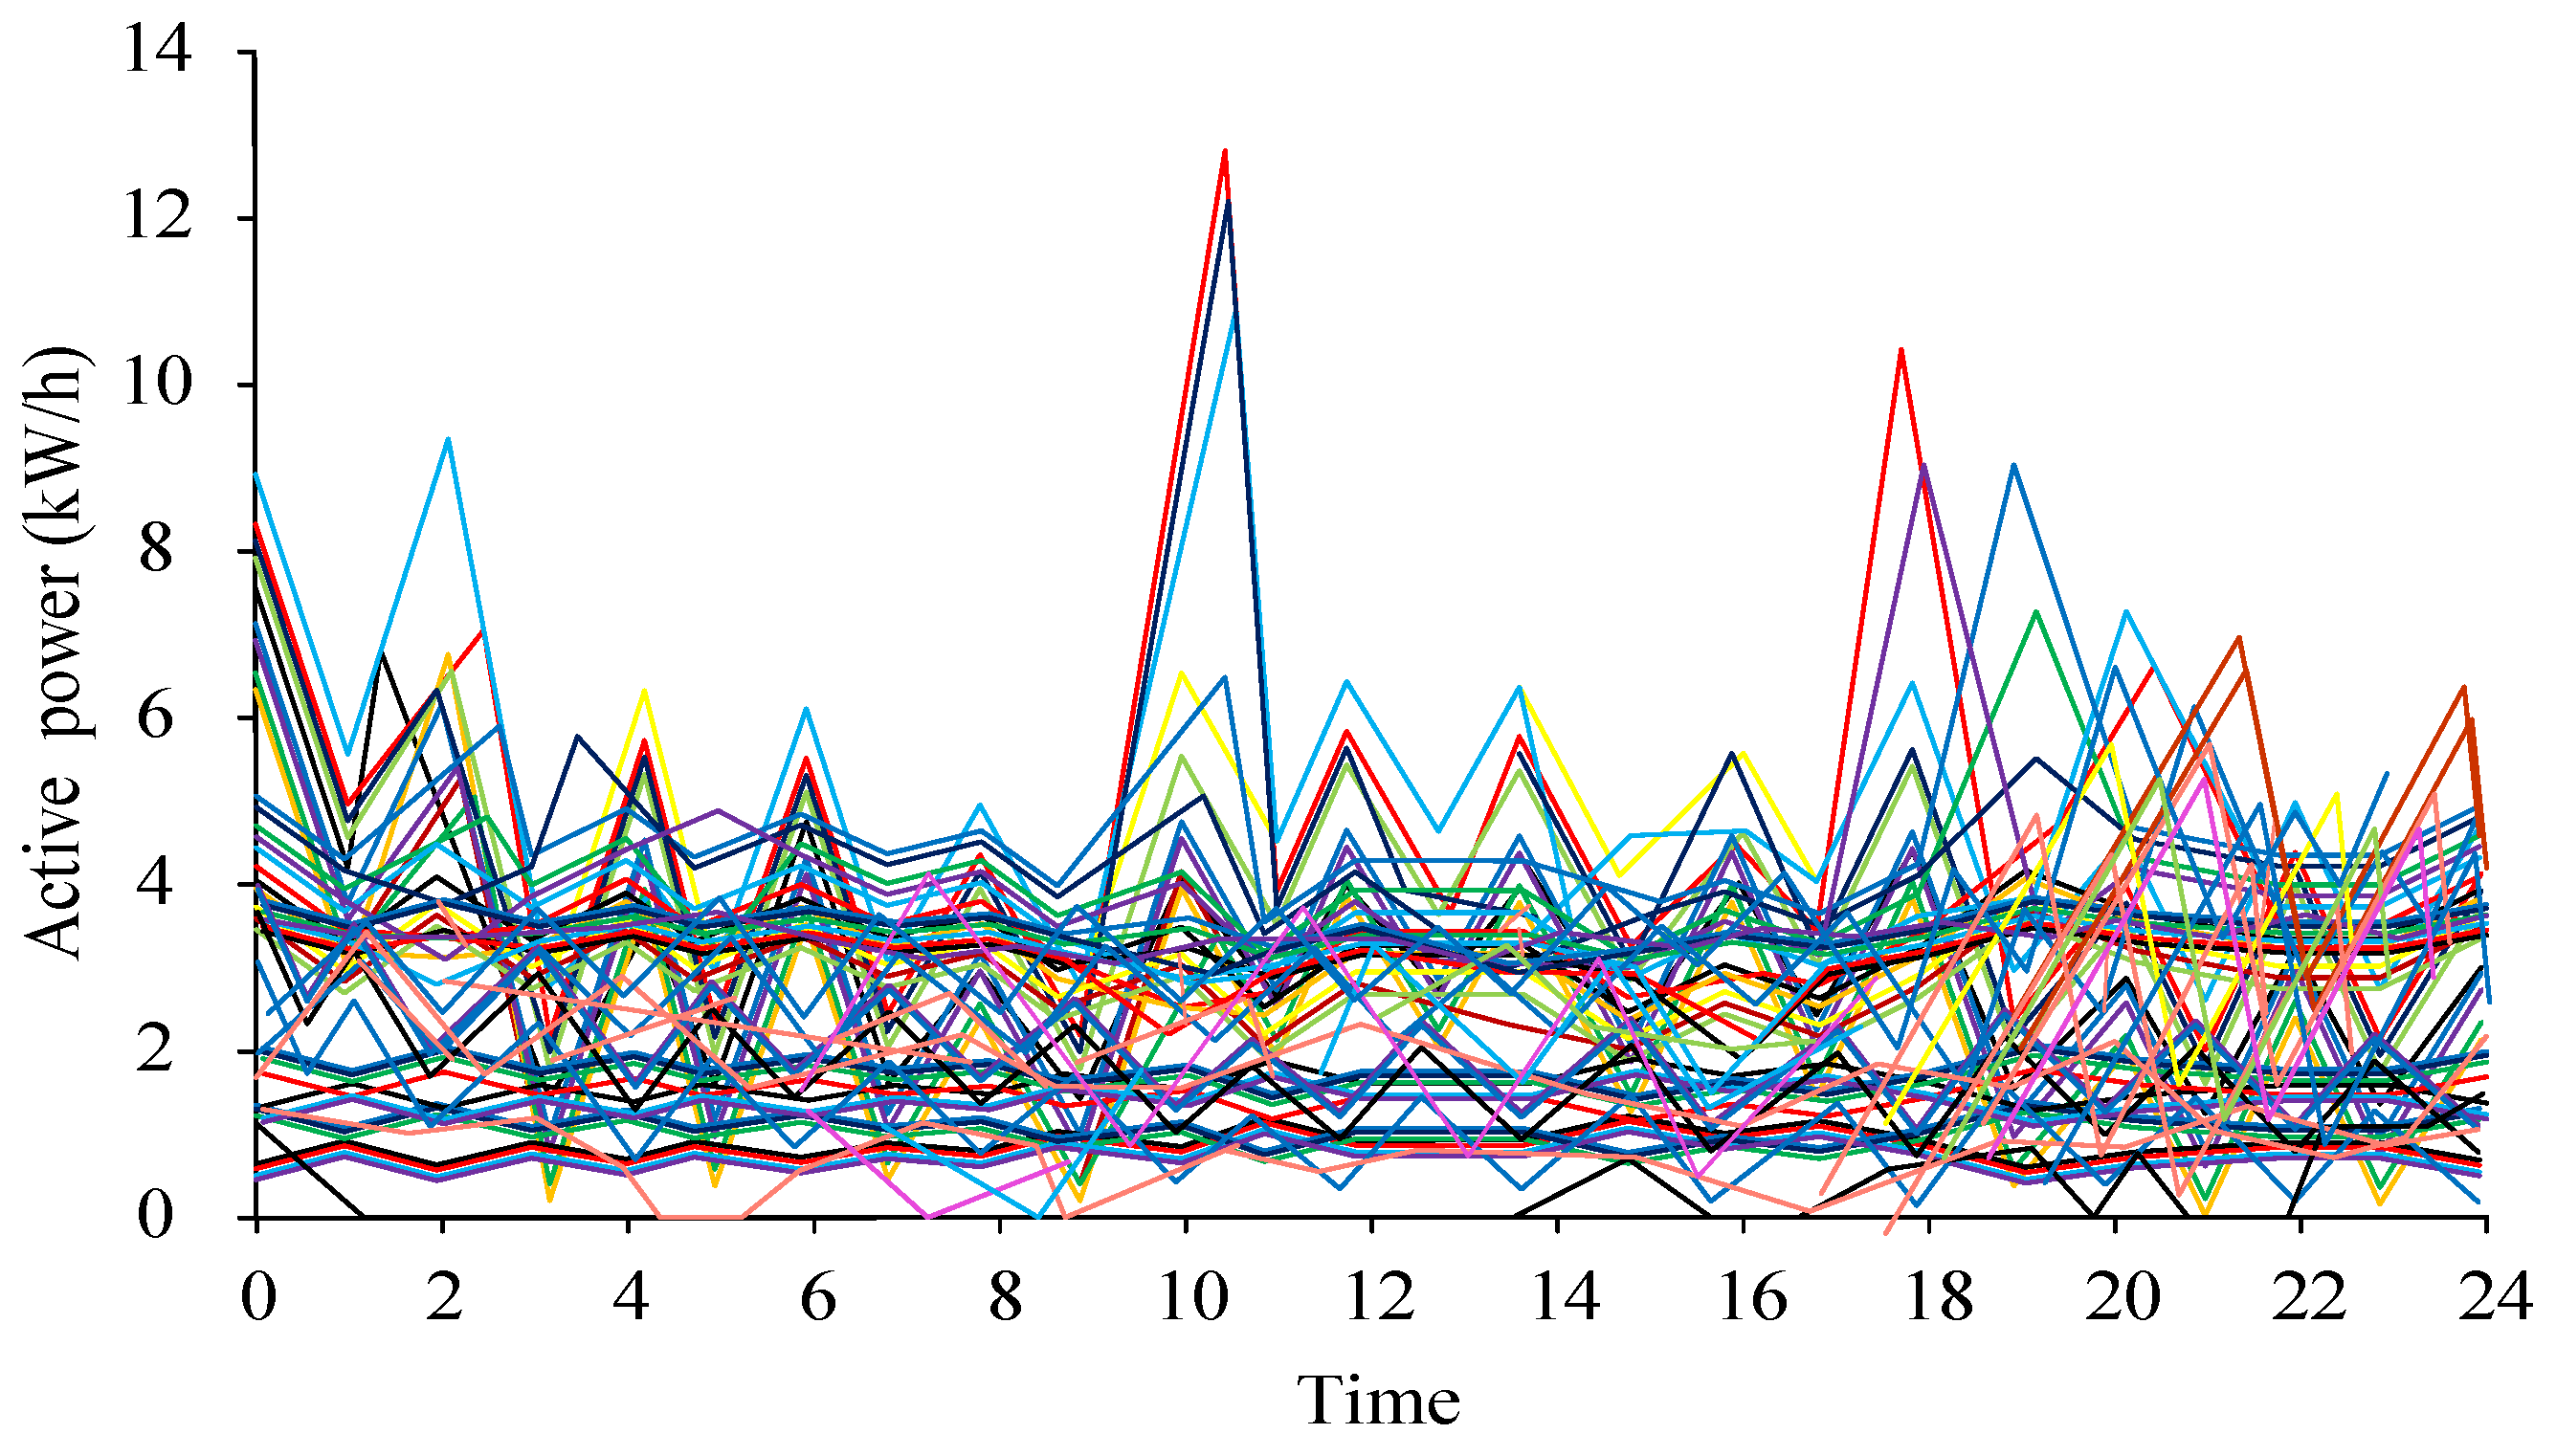
A time range of 8760 sample points, from 15 June 2021 to 15 June 2022, was used. The AD performance on the dataset was compared with the improved CFSFDP algorithm. The visualized results of the active power samples collected in the experiment are shown in Figure 4.

Figure 4.
Daily load curve of power company.
The curve in Figure 4 represents the electricity load at different dates. Several of the curves show significant daily load changes deviating from normal load changes. These data that deviate from the normal mode were the detection target in the experiment. The pre- and post-improvement CFSFDP decision diagrams are shown in Figure 5.

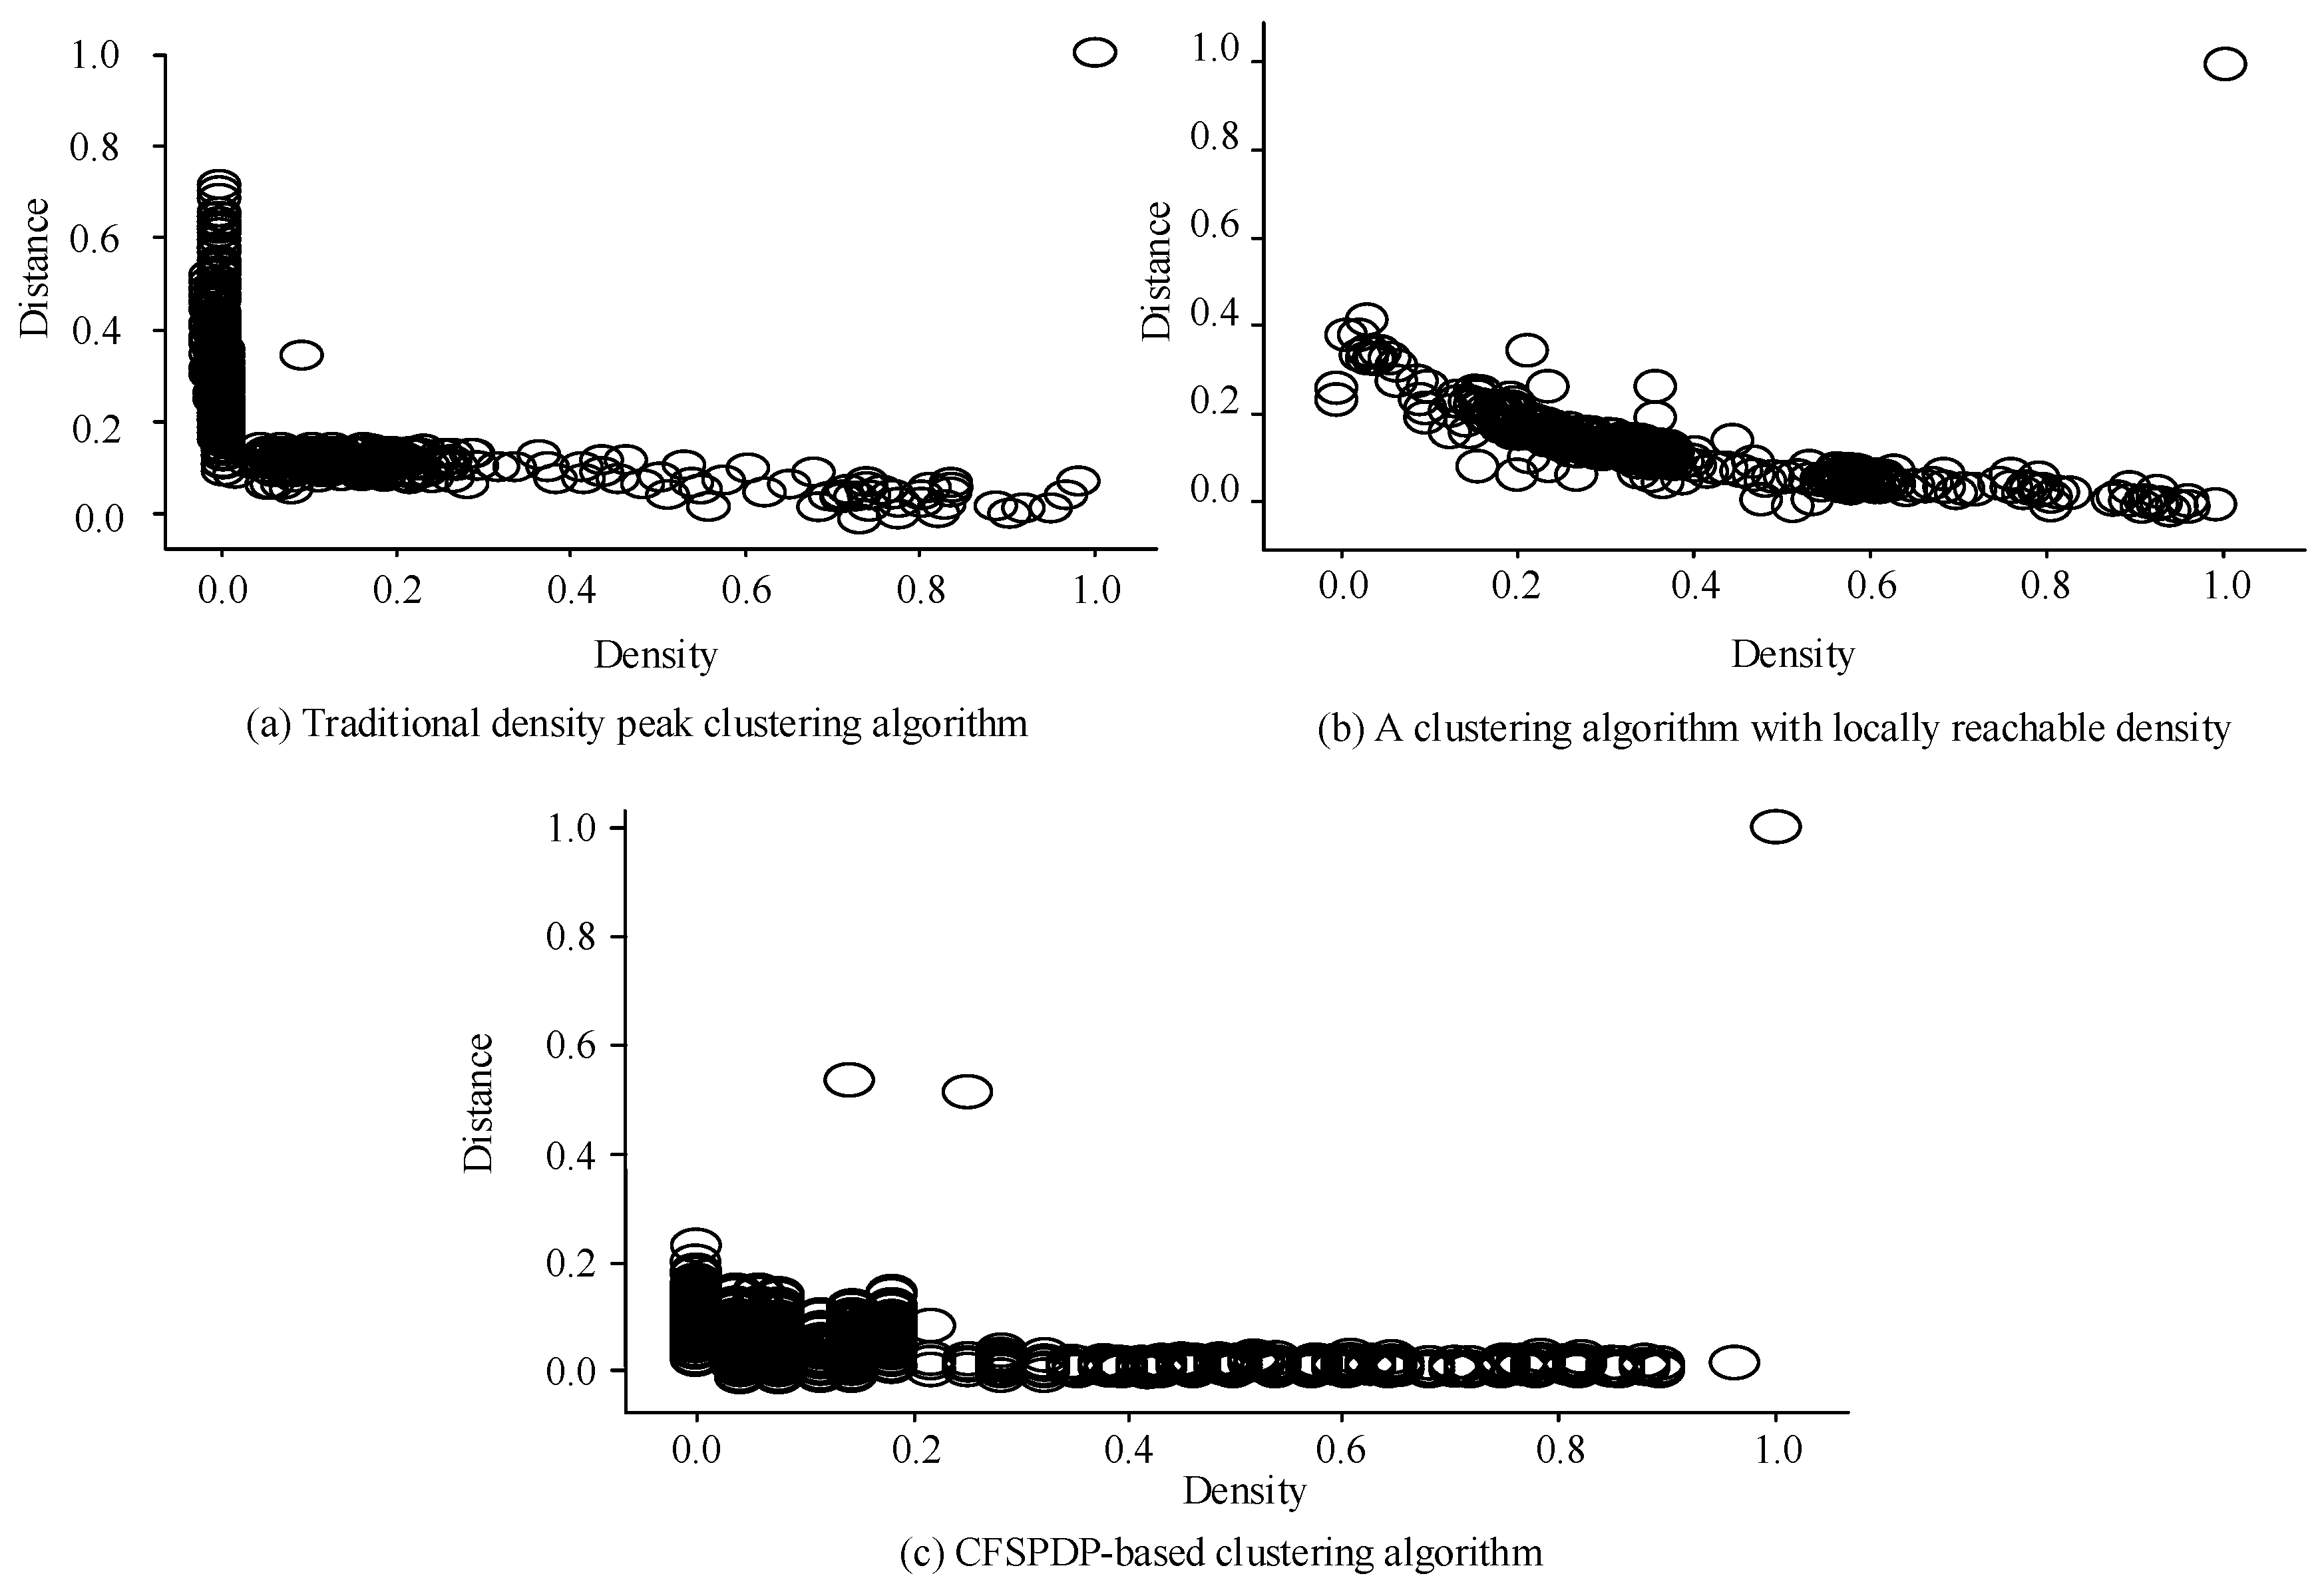
Figure 5.
CFSFDP decision diagram before and after improvement.
Figure 5a shows the decision diagram of the traditional CFSFDP algorithm. Only the sample points with a density of 1.0 and a distance of 1.0 were detected as obvious cluster centers, while the other cluster centers did not have obvious features. This result is consistent with the recognition capability of CFSFDP in processing data with large local density changes, which might result in missed or erroneous measurements for data with low peak values. Figure 5b shows the redefined CFSFDP decision graph. Although this method shows progress in processing locally changing data if the existing clustering centers are not considered, the effect is not yet ideal. Figure 5c shows the improved CFSFDP decision graph with four distinct clustering centers, which have densities of 1.0, 0.1, 0.2, 0.1 and distances of 1.0, 5.0, 0.5, 0.9, respectively. It can be seen that the clustering effect is better than for the first two methods. Seven abnormal curves were detected from a total of 365 curves from 15 June 2021 to 15 June 2022. The time distribution of the curves is shown in Figure 6.
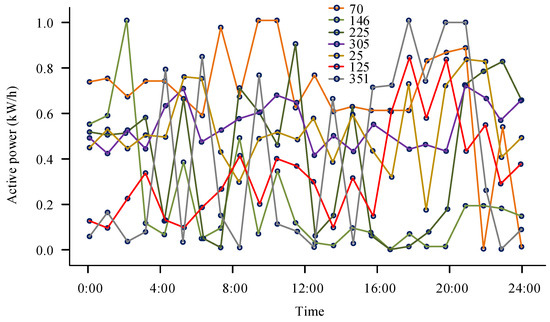
Figure 6.
Abnormal daily load curve.
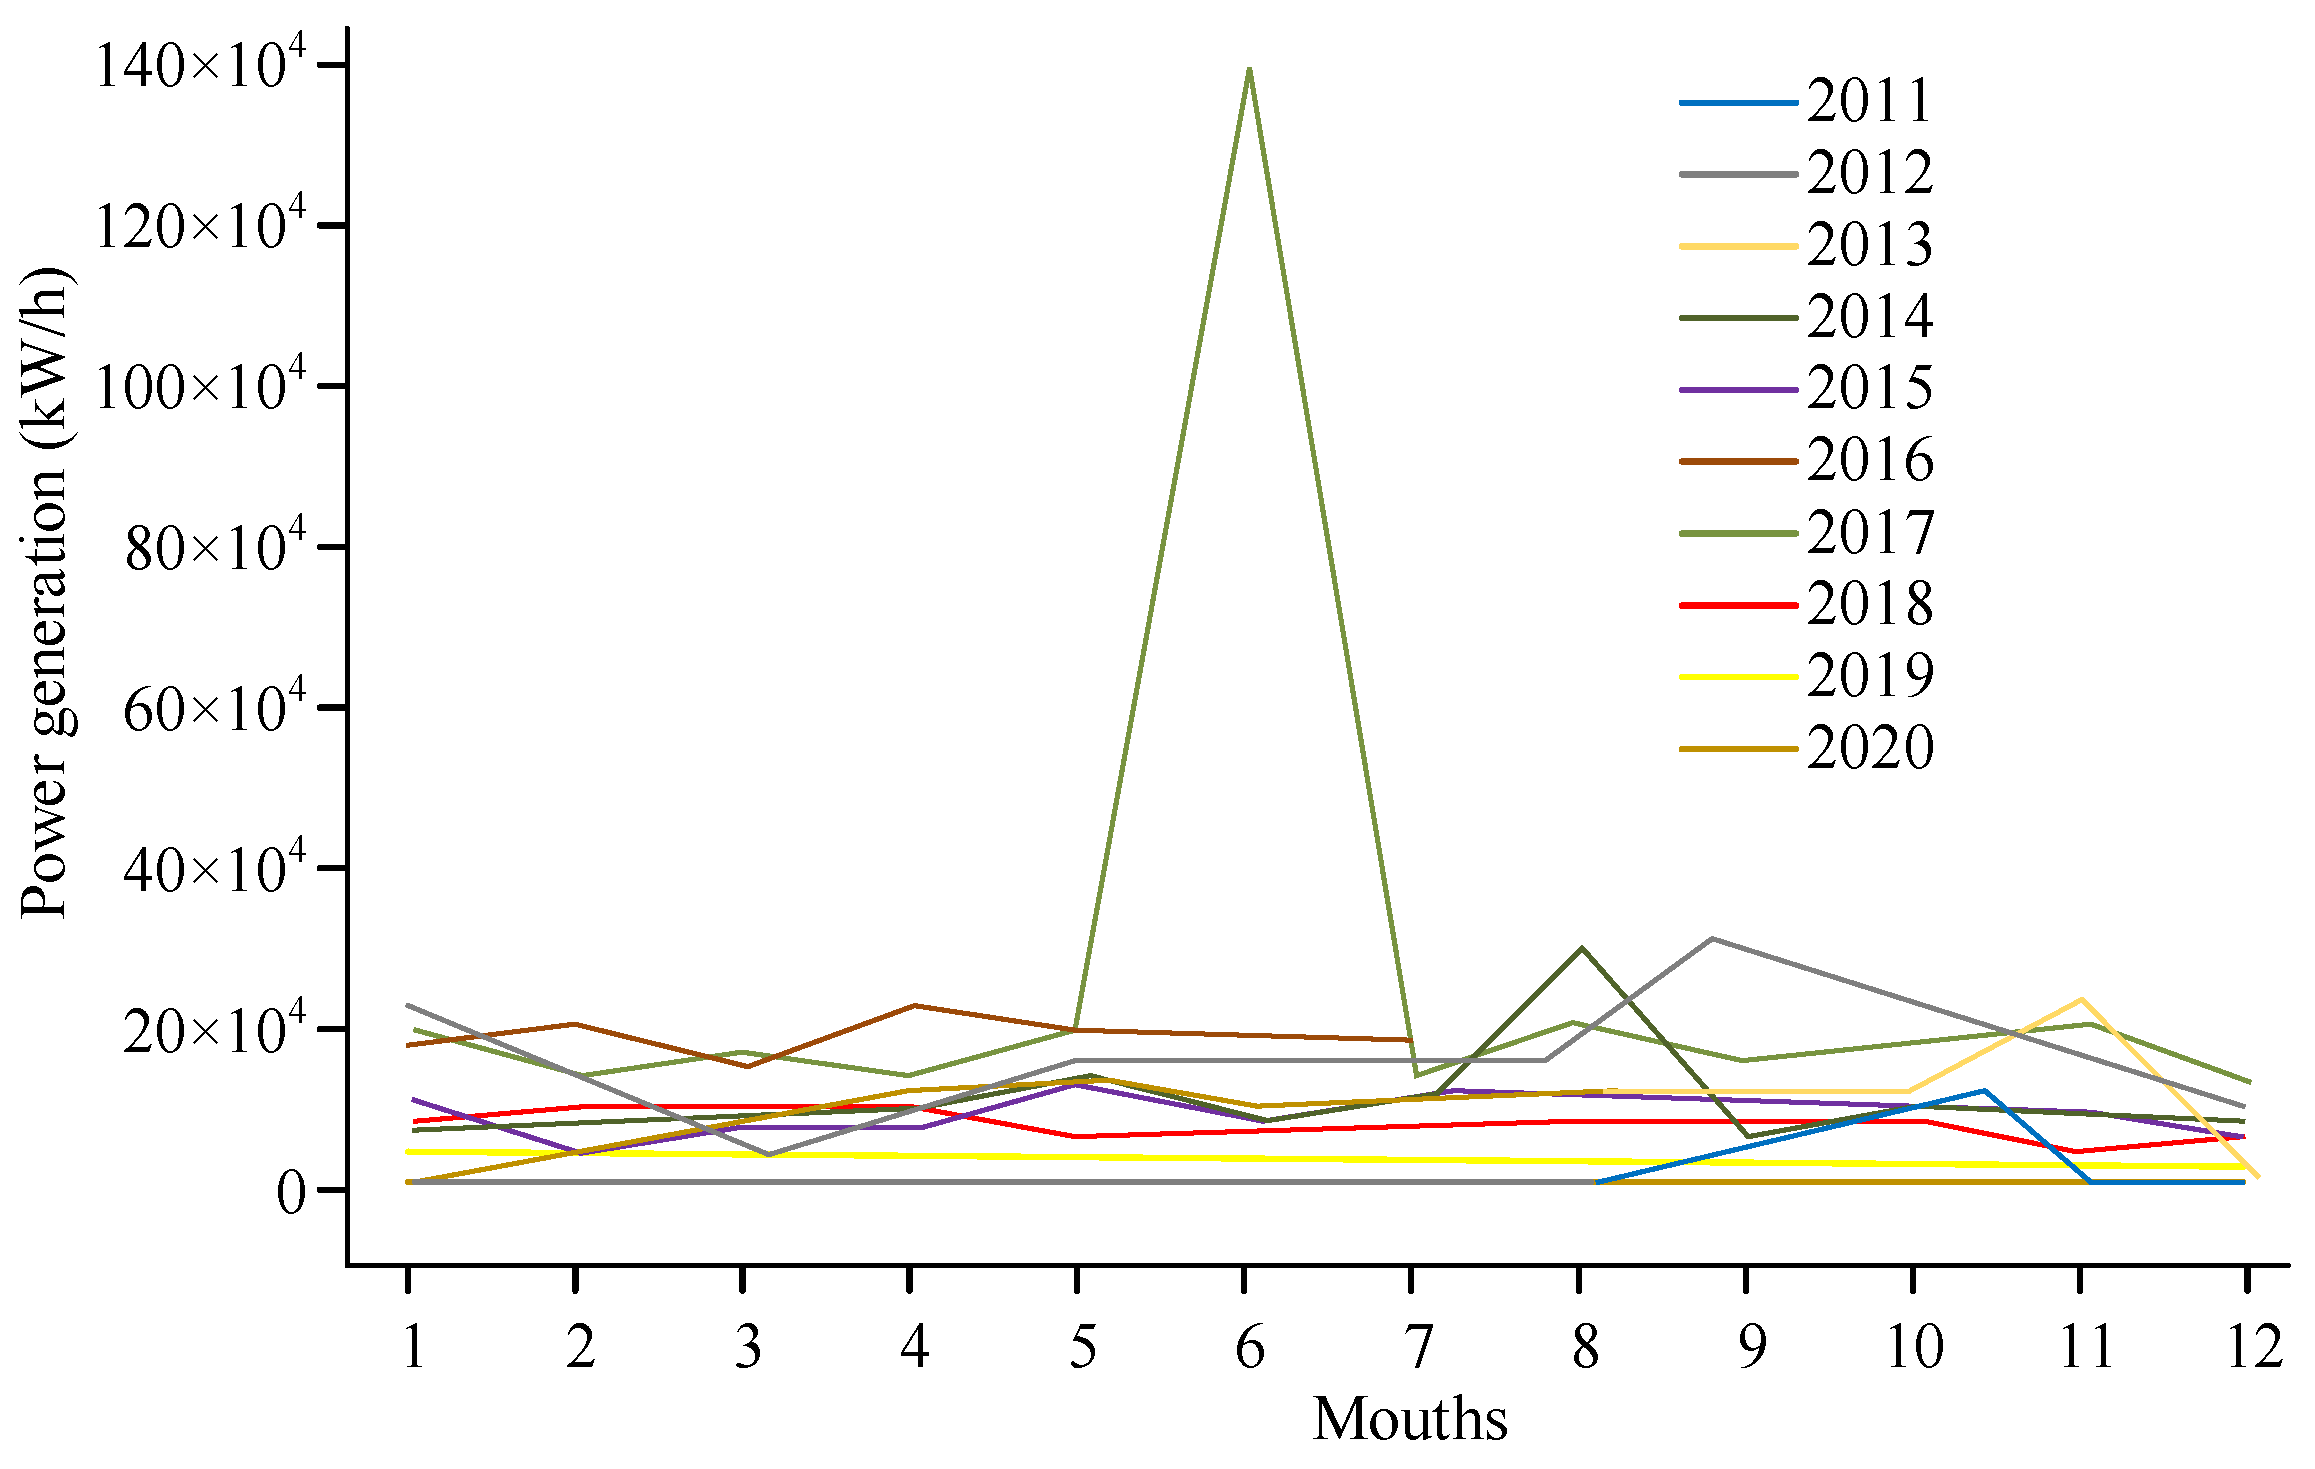
The abnormal curve in Figure 6 is numbered by date (days), and the data anomalies include 5, 38, 59, 77, 278, 337, and 349. The abnormal data are more concentrated around 50 days, which was during the summer, indicating that there were more electricity consumption anomalies in summer. The variation amplitude of the curve in Figure 6 is uneven, with the maximum variation amplitude of active power concentrated between 11 a.m. to 13 p.m. and 20 p.m. to 22 p.m., with the maximum value of active power reaching 1.0 kW/h. To validate the effectiveness of the proposed algorithm, the experiment utilized this method to process another set of datasets. These data were taken from a certain location’s wind power from 2011 to 2020, with a sampling frequency set at one month. Therefore, there were a total of 128 sample datapoints. The visual distribution curve is shown in Figure 7.
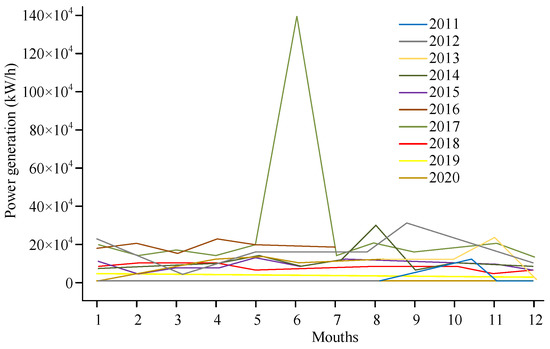
Figure 7.
Annual load curve of wind power generation.
In Figure 7, most of the data on wind power generation over the past decade are concentrated within a certain range, with only one obvious peak datapoint deviating from the normal data. The wind power generation shows seasonal characteristics and is greatly influenced by the geographical environment. During a season of low electricity consumption when the wind energy was sufficient, a phenomenon can be seen of abandoning wind and limiting electricity. Due to the high wind energy demand, a strong grid acceptance capacity is required, while the electricity load during the off-season is relatively low, which could have caused some wind turbines to pause.
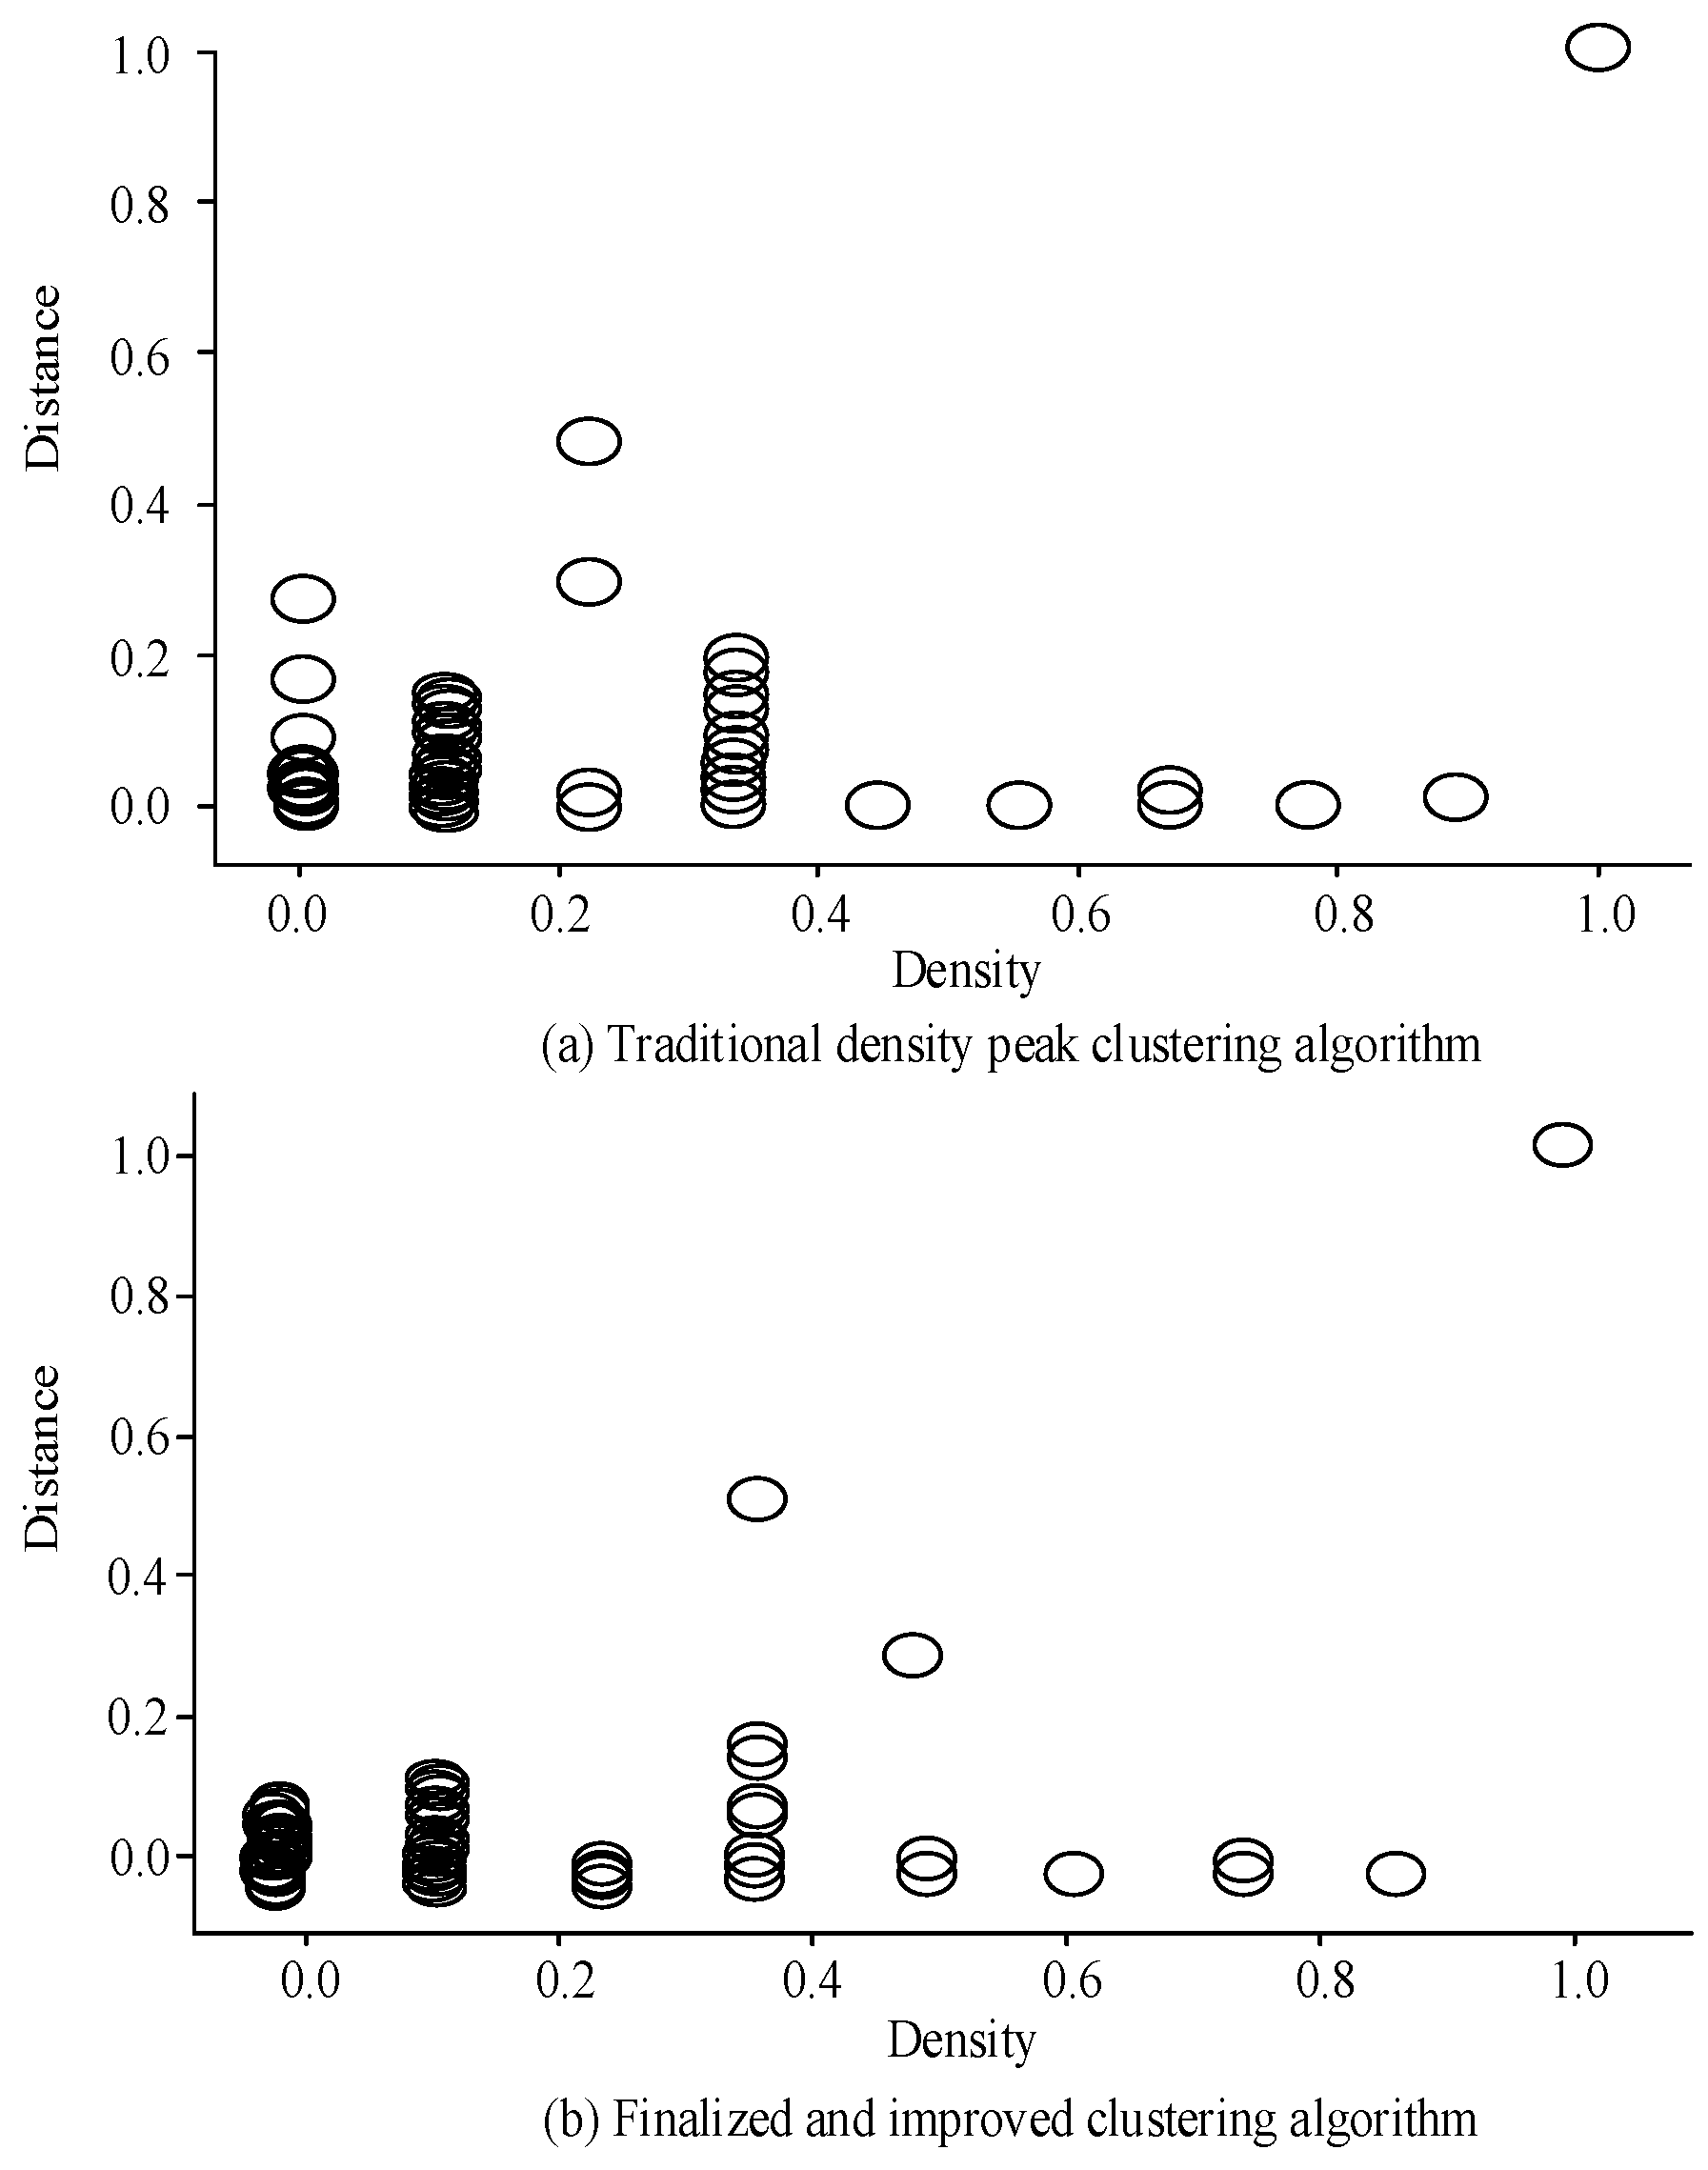
Figure 8 shows the decision diagrams of CFSFDP before and after optimization on the wind power generation dataset. Figure 8a shows the CFSFDP decision map before improvement. In the decision map, both samples exhibit a ring phenomenon. The distribution of the remaining sample points is relatively dense. These results indicate that the use of the unmodified CFSFDP algorithm with power data containing significant local density changes has obvious limitations and cannot generate good clustering centers. Figure 8b shows the decision graph generated by the optimized CFSFDP algorithm. The ring phenomenon in the cluster center is significantly improved, showing distinct features. Comparing two sets of experiments, CFSFDP presents significant differences before and after optimization, notably improving the clustering performance of the algorithm.
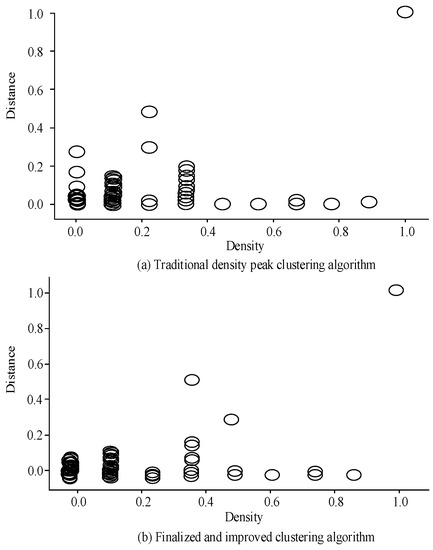
Figure 8.
Decision diagrams of CFSFDP algorithm before and after improvement.
4.2. Performance Analysis of Power Load Clustering
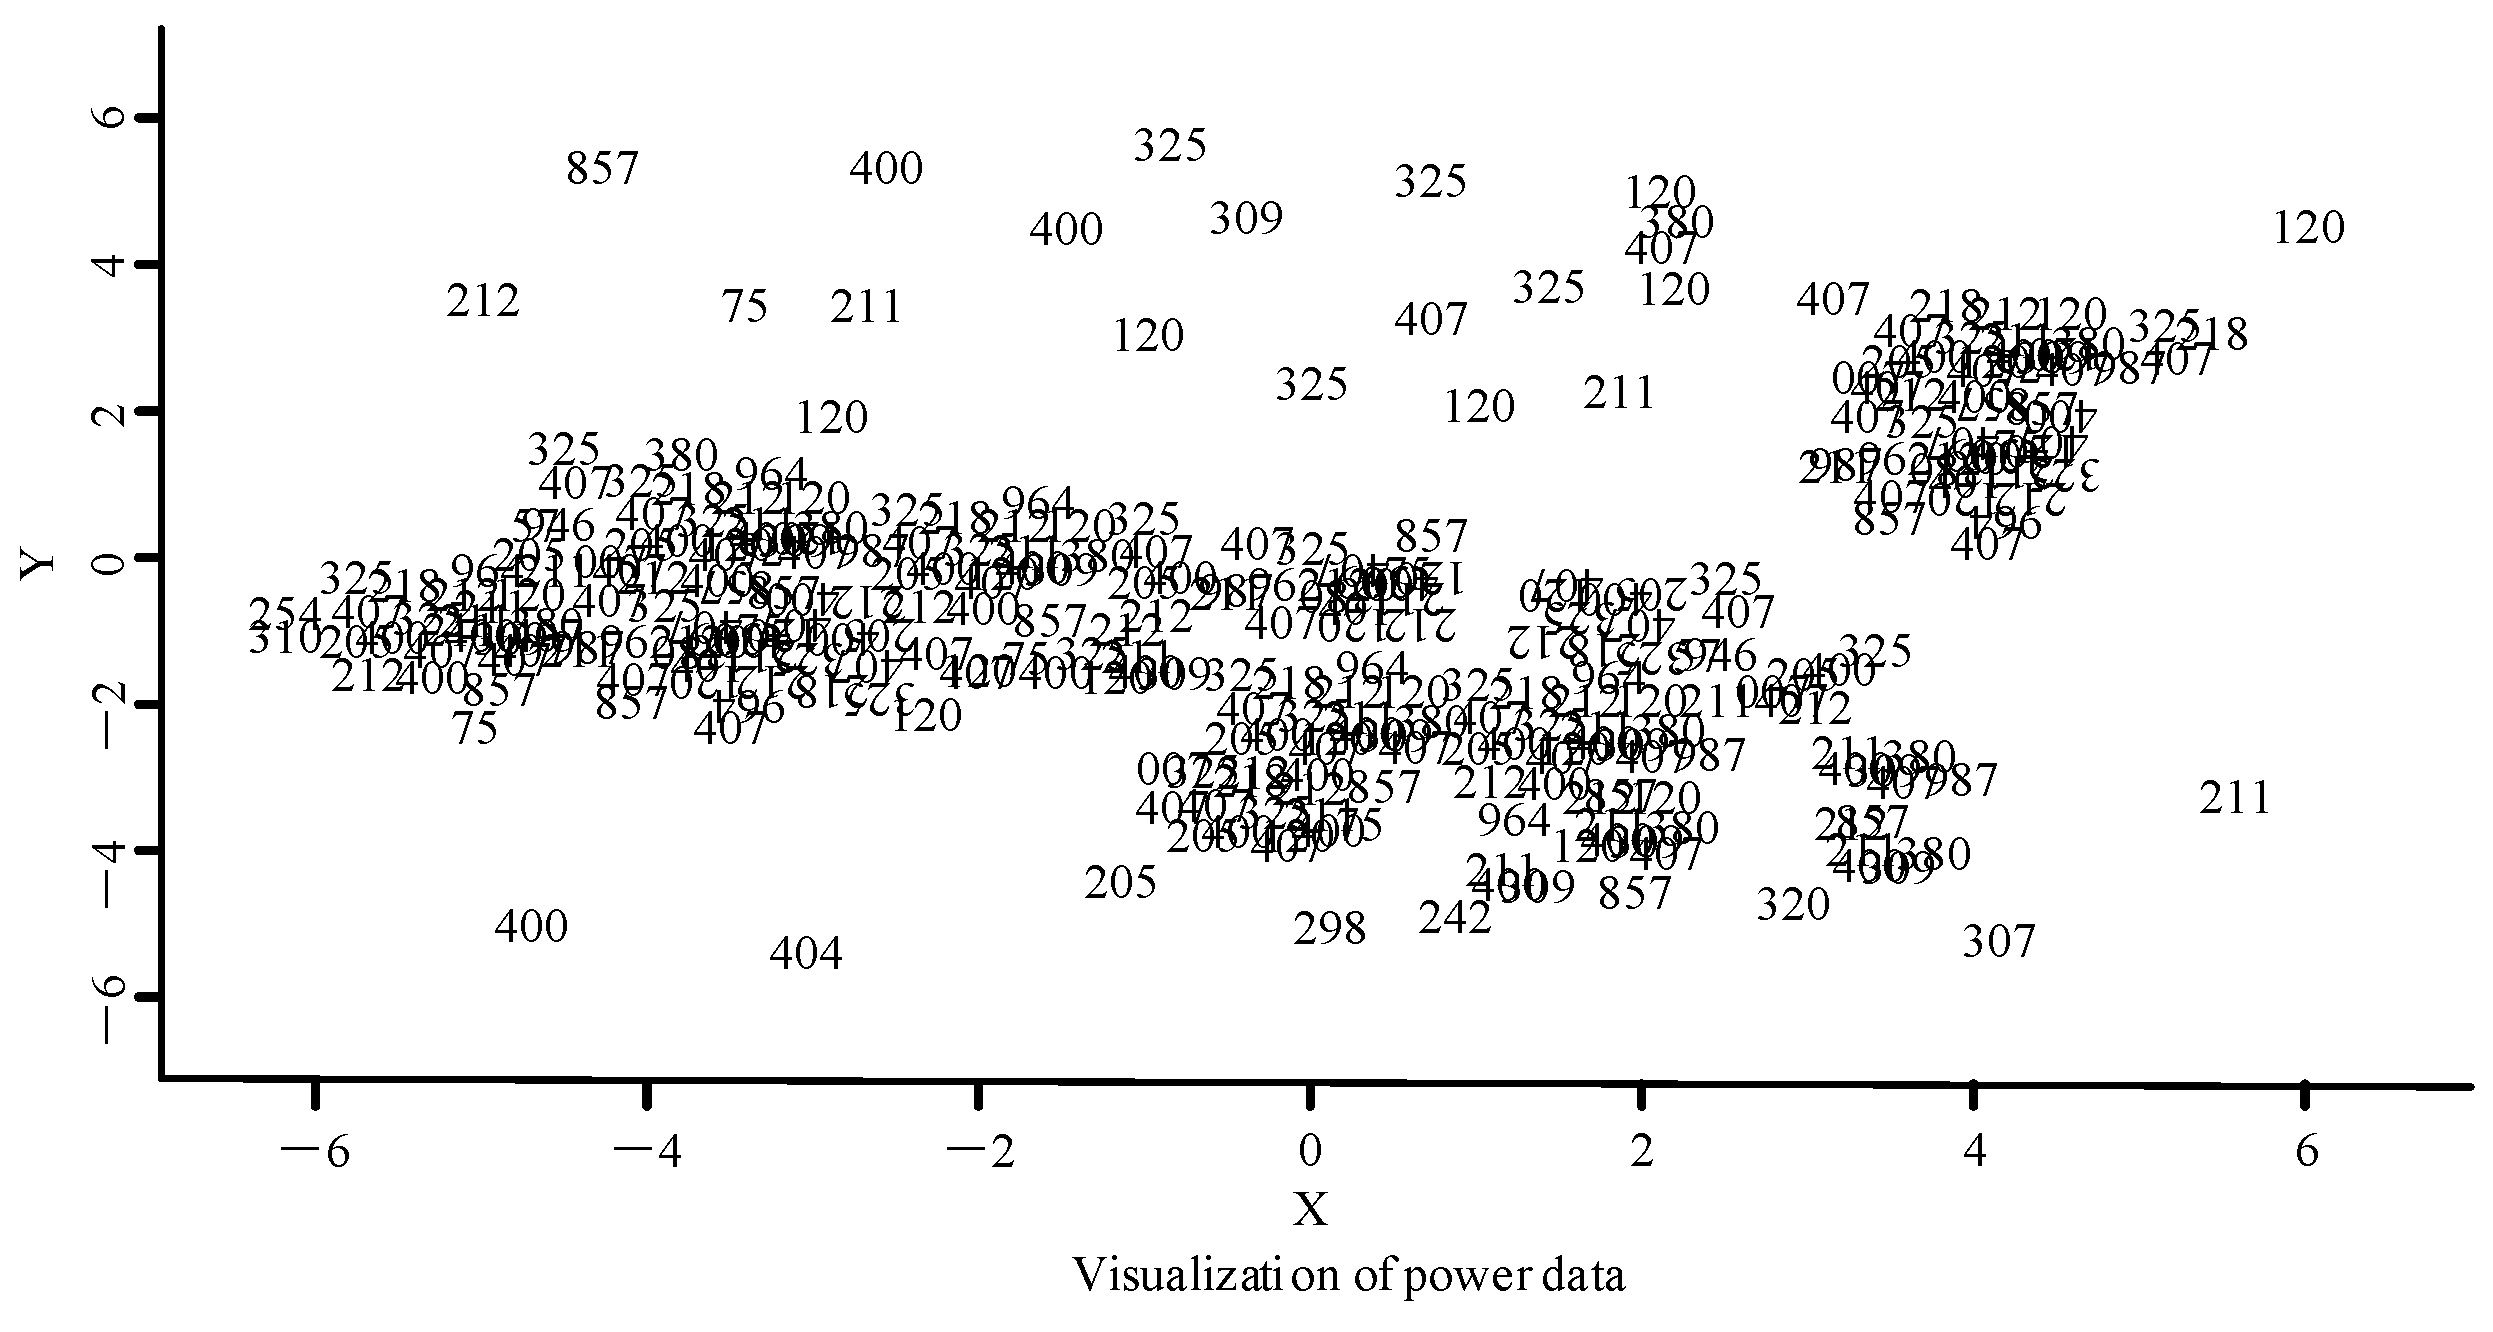
The power load cluster analysis performance experiment used the active power collected by a power company as the experimental dataset. The experiment first used PCA to reduce the dimensionality of the data in order to obtain a more intuitive data distribution and reduce the burden of computing the Euclidean distance between the sample points. A visualization of the distribution of the data with the dimension reduced through PCA is shown in Figure 9.
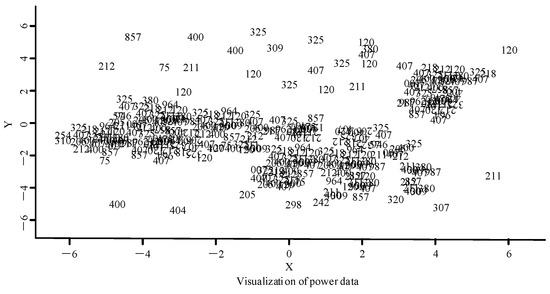
Figure 9.
Power data visualization distribution diagram.
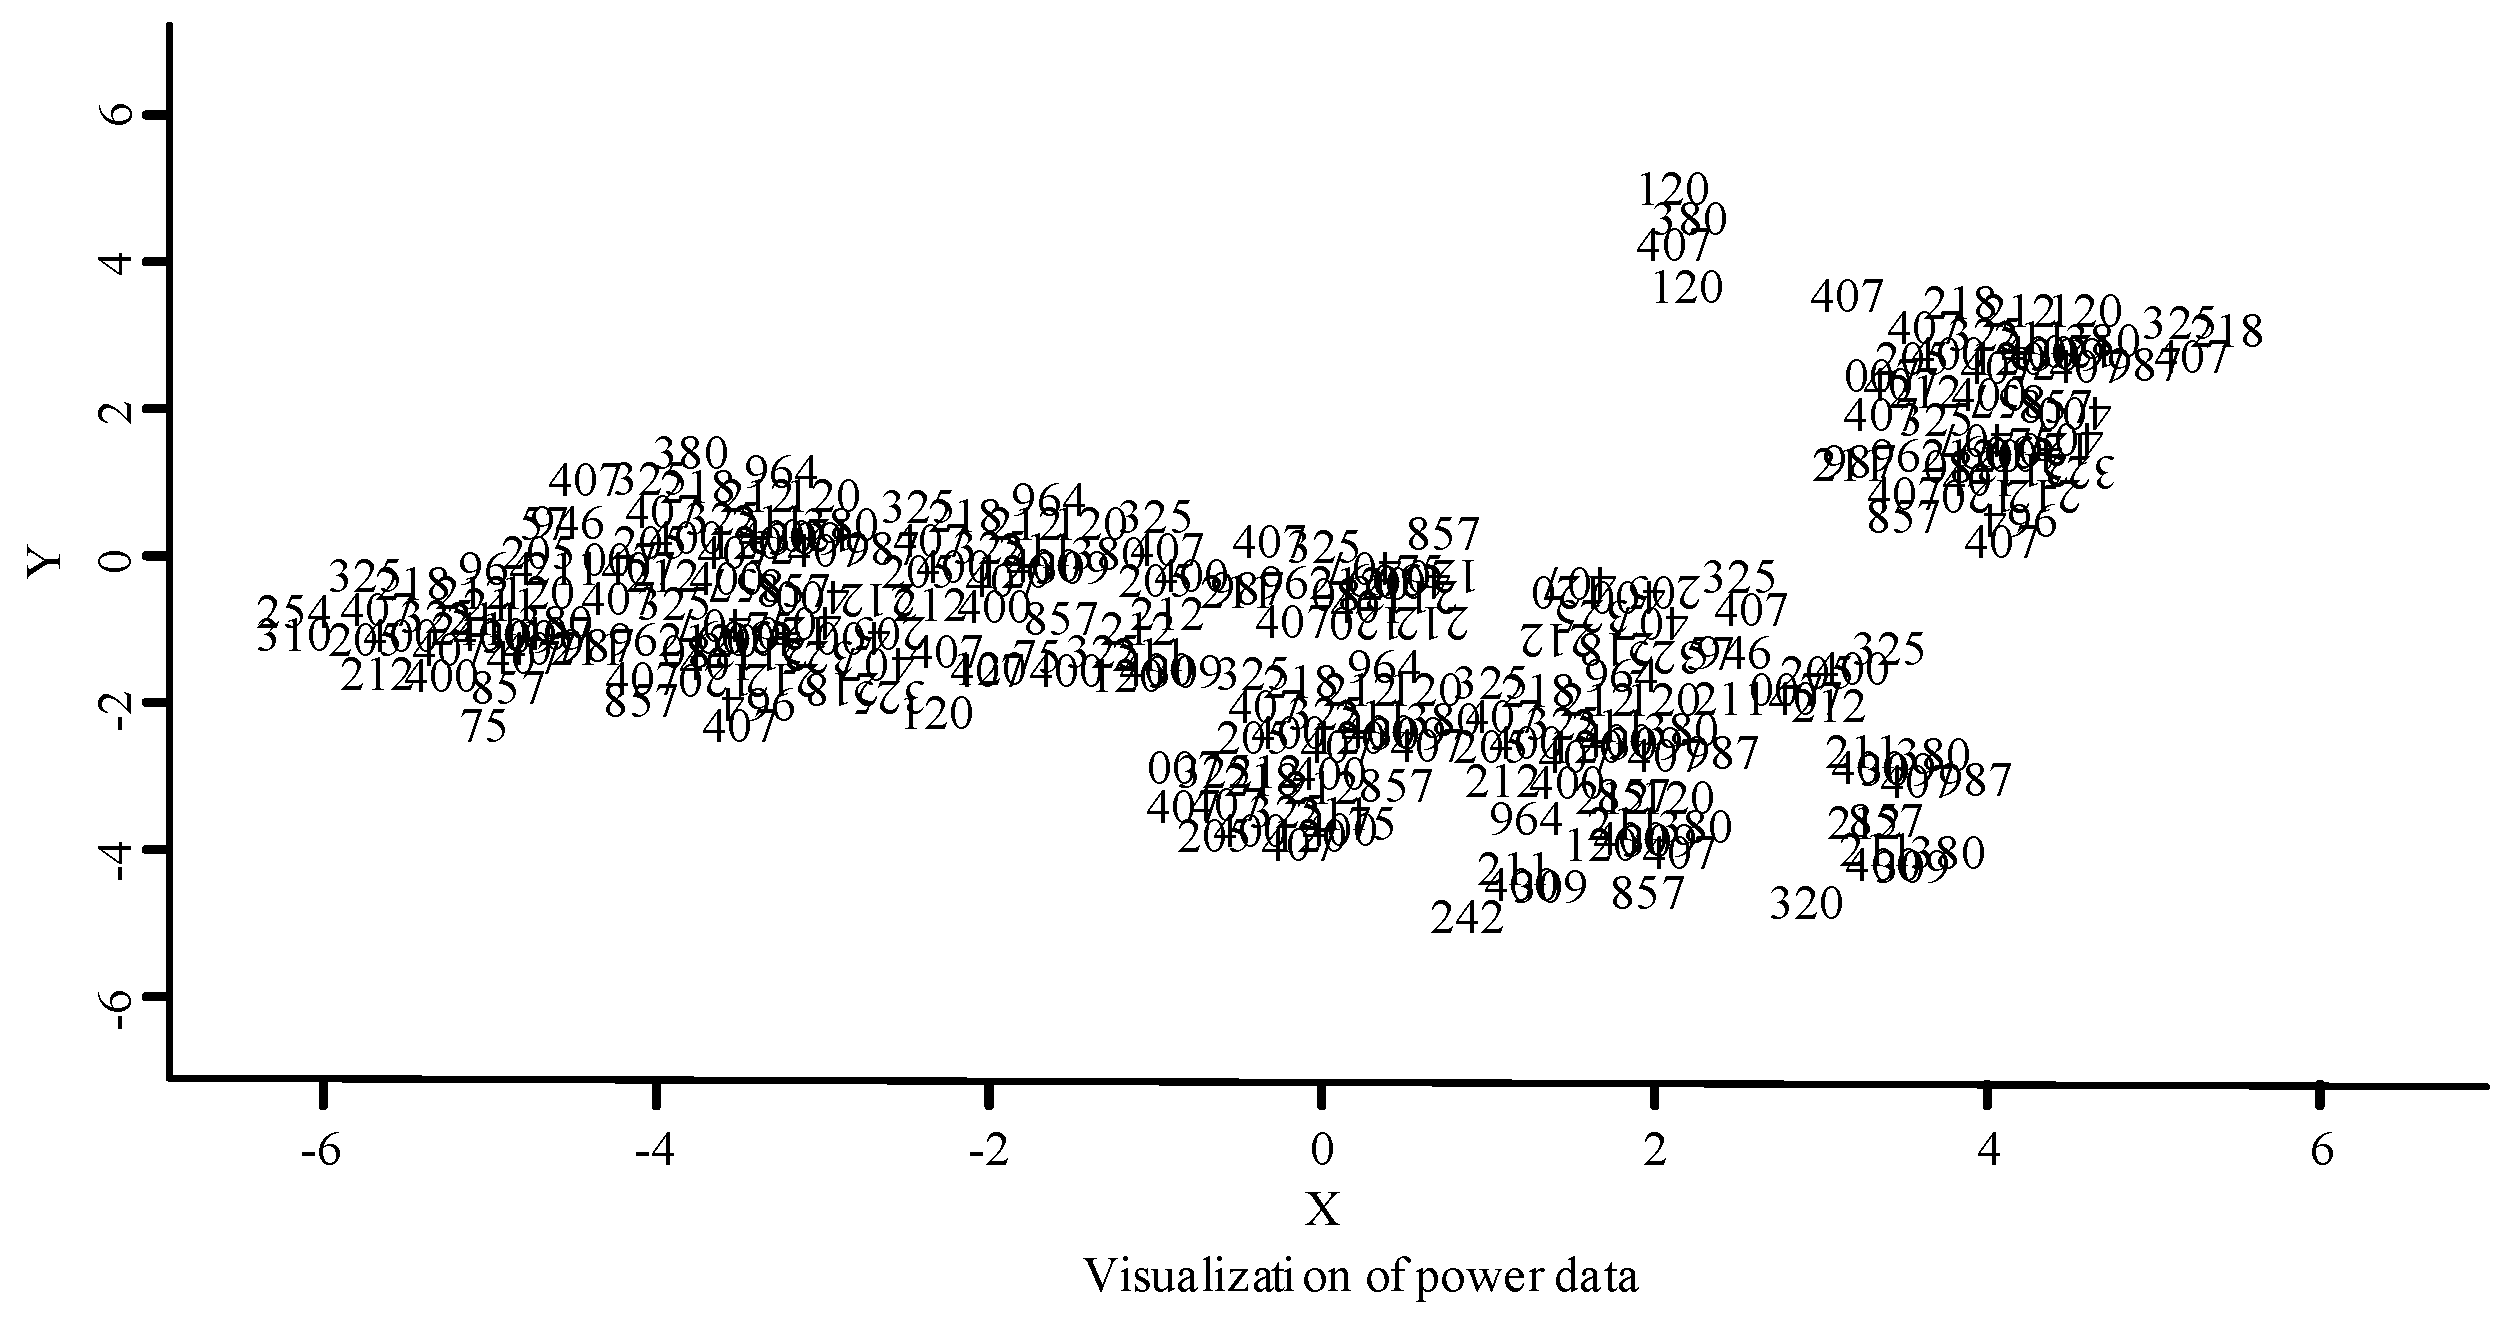
The improved power data AD method was then used to detect the reduced dimension data; the new power data visualization distribution diagram is shown in Figure 10. After dimension reduction processing, obvious changes can be observed in the power data visualization in Figure 10. Compared with Figure 9, the distribution of abnormal values is deleted after dimension reduction processing, showing the distribution of the normal data more clearly while preserving the denser number of clusters.

Figure 10.
Data visualization distribution diagram after removing outliers.
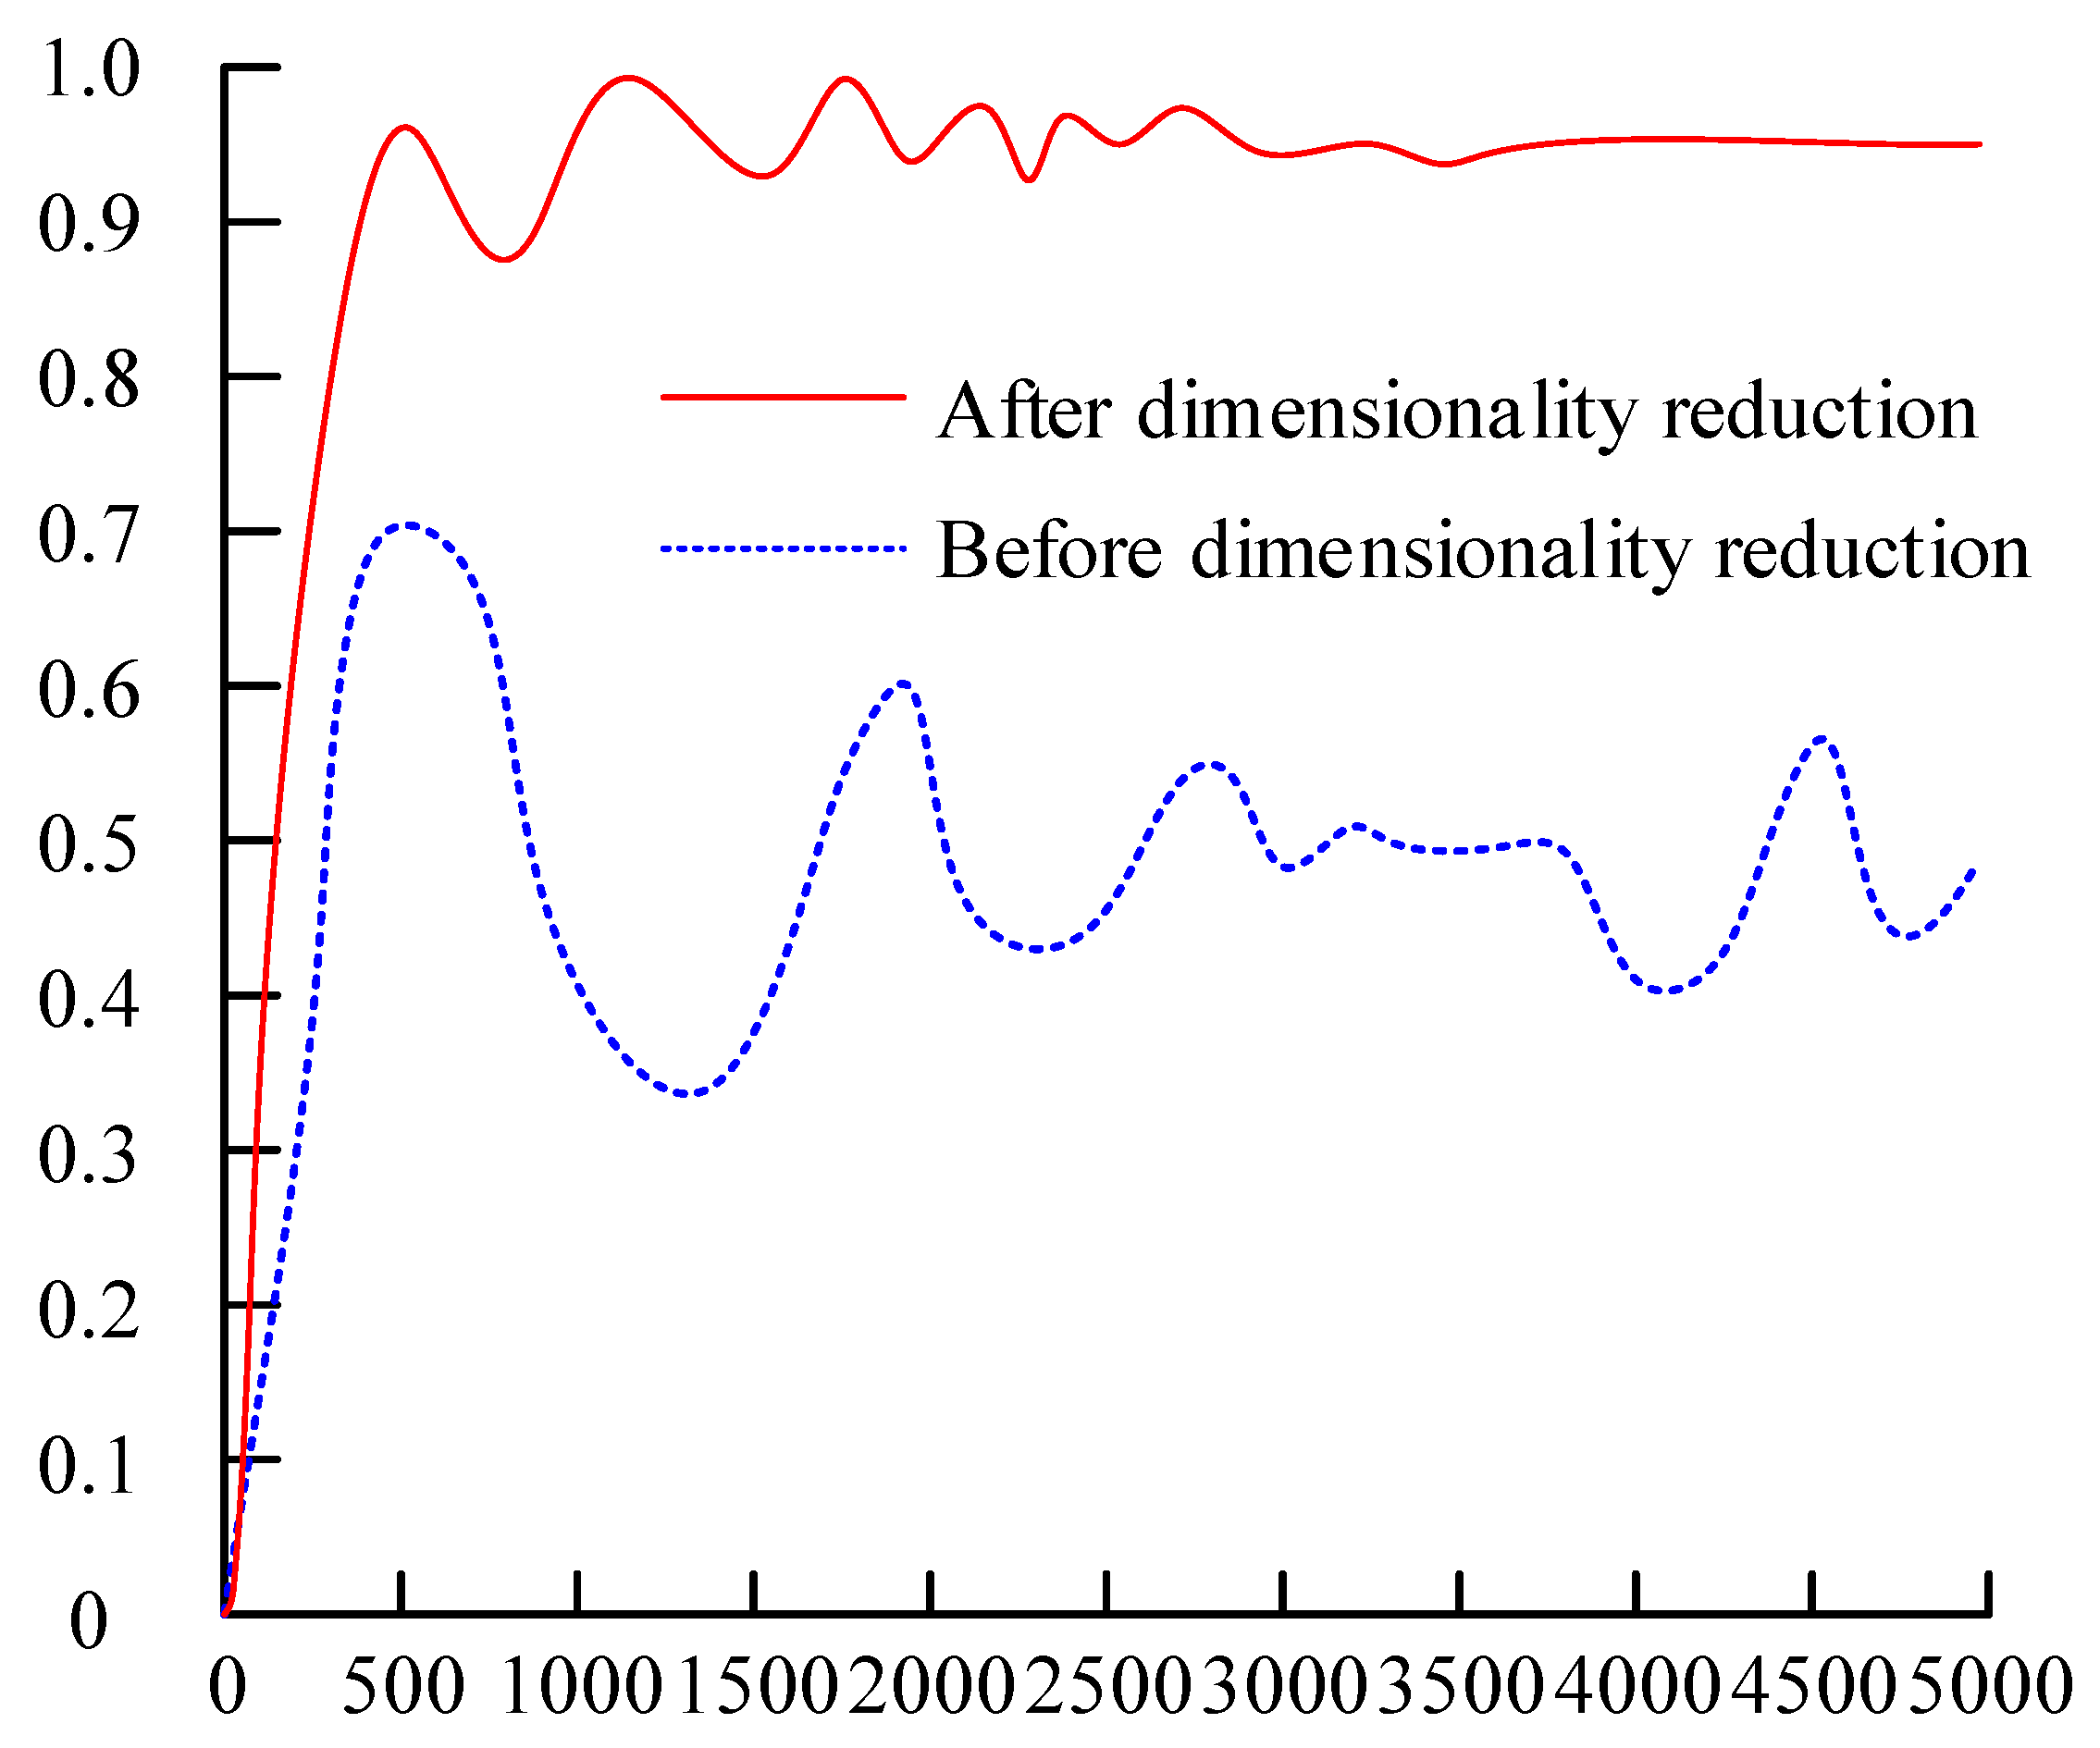
This study utilized data before and after dimensionality reduction for AD in power data, using the AD accuracy as the experimental standard. The specific results are shown in Figure 11. It can be seen that the accuracy of the data before dimensionality reduction undergoes significant fluctuation, and as the data volume increases it shows a downward overall trend. The accuracy after data dimensionality reduction is relatively more stable and flat, and as the amount of data increases, the curve ultimately stabilizes to around 0.948. These experimental results indicate that performing dimensionality reduction on the original data can improve model performance.
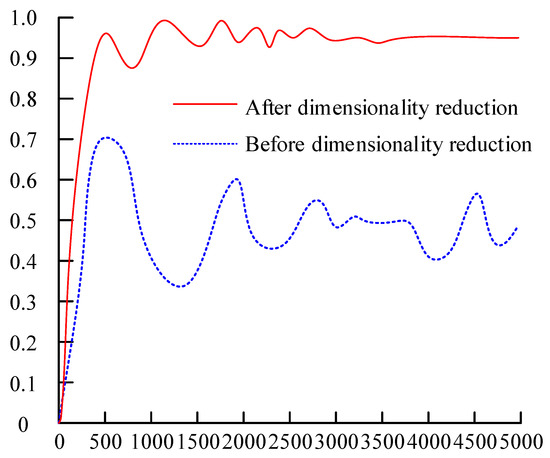
Figure 11.
Performance comparison before and after data dimensionality reduction.
Prior to clustering analysis, it was necessary to determine the selection of the parameters in the algorithm. The parameter values for the slope were set to 1%, 1.5%, and 2%. The clustering experiment was conducted under these three parameter values; the obtained slope sorting graphs are presented in Figure 12.
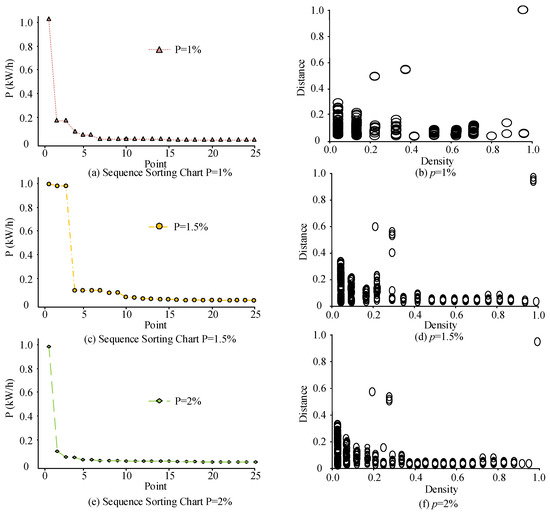
Figure 12.
Decision graph results under different parameter settings.
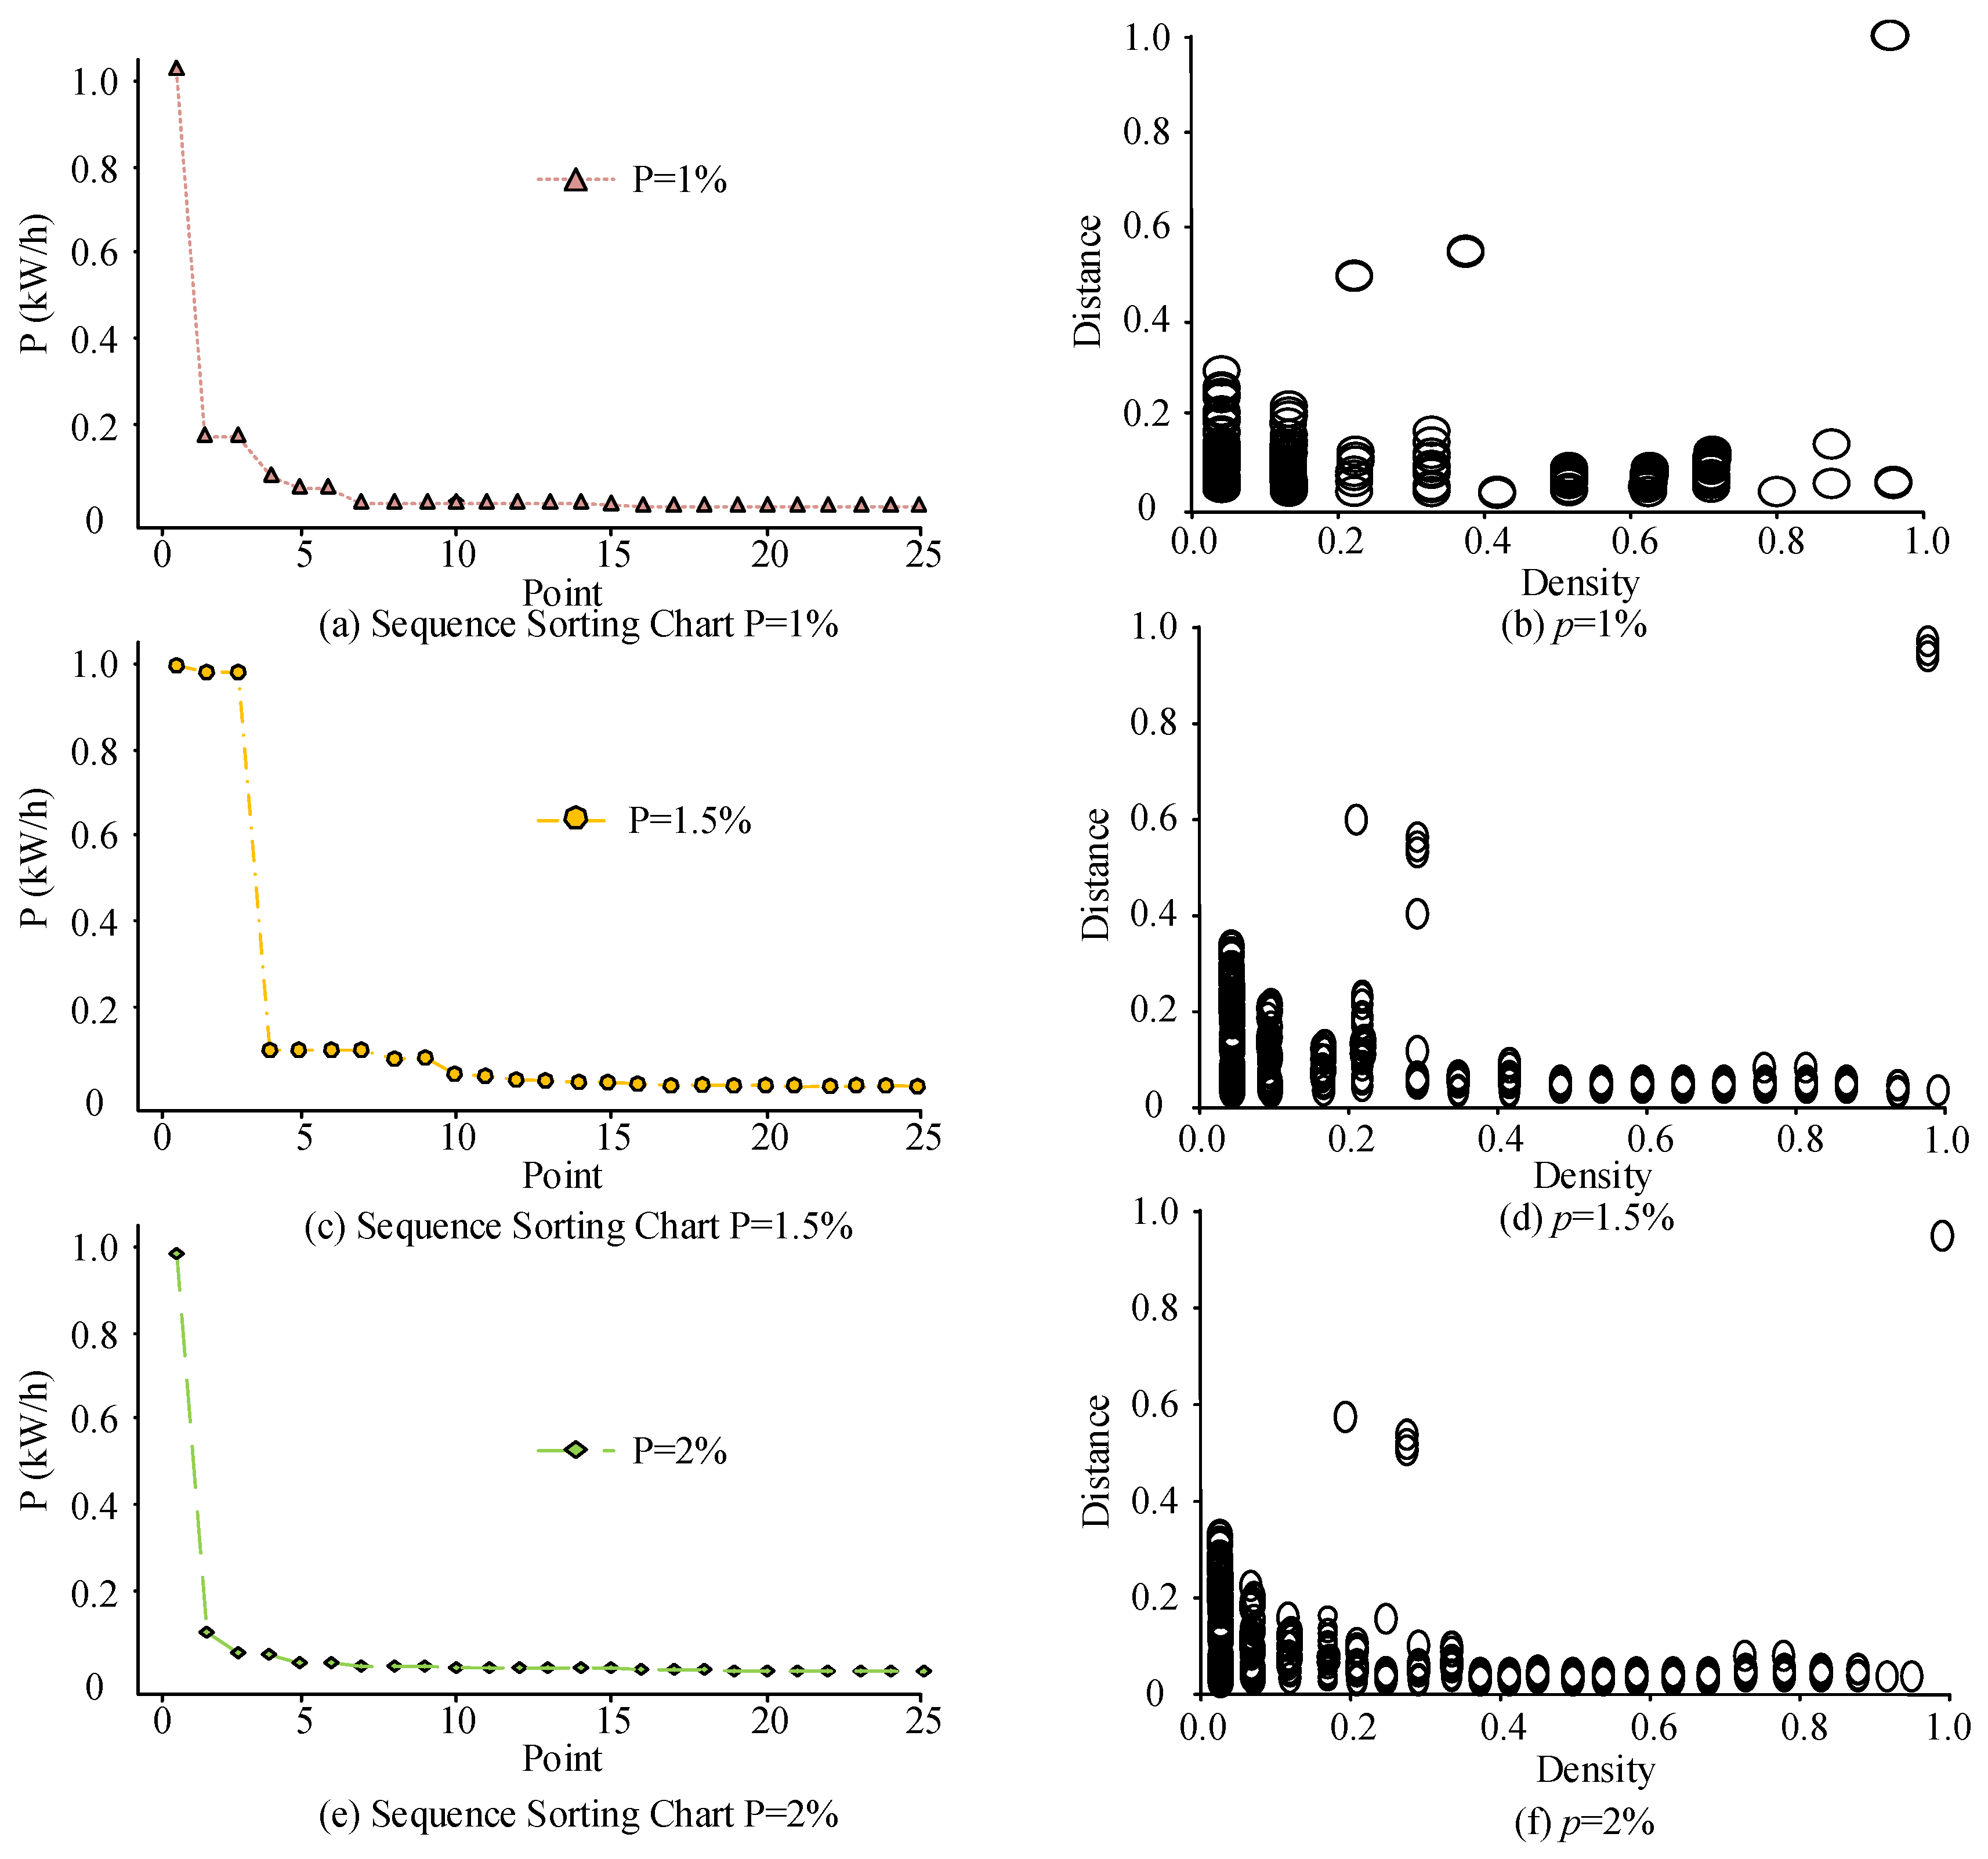
Figure 12 shows the slope sorting diagram and decision diagram under different parameter settings. Figure 12a,b displays the sorting and decision diagrams, respectively, with a slope of 1%. The distribution of the sample points in Figure 12b is relatively scattered. Although the sample points with densities of 0.2, 0.4, 1.0, and distances of 0.6, 0.5, and 1.0 have obvious characteristics, there is a ring phenomenon in the figure. The selection of cluster centers in Figure 12d is relatively vague. Although there are three distinct clustering centers at a density of 1.0 and a distance of 1.0, at densities of 0.3 and 0.4 and a distance of 0.5 there are four clustering centers with unclear features, and the distances are relatively small. The distribution of sample points in Figure 12f is more compact, and the sample points with densities of 0.3, 0.4, and 1.0 and distances of 0.5, 0.5, and 1.0 have significant clustering effects. These results show that when the slope parameter is 2% the clustering center of the algorithm is clearer, and the phenomenon of looping is improved as well.
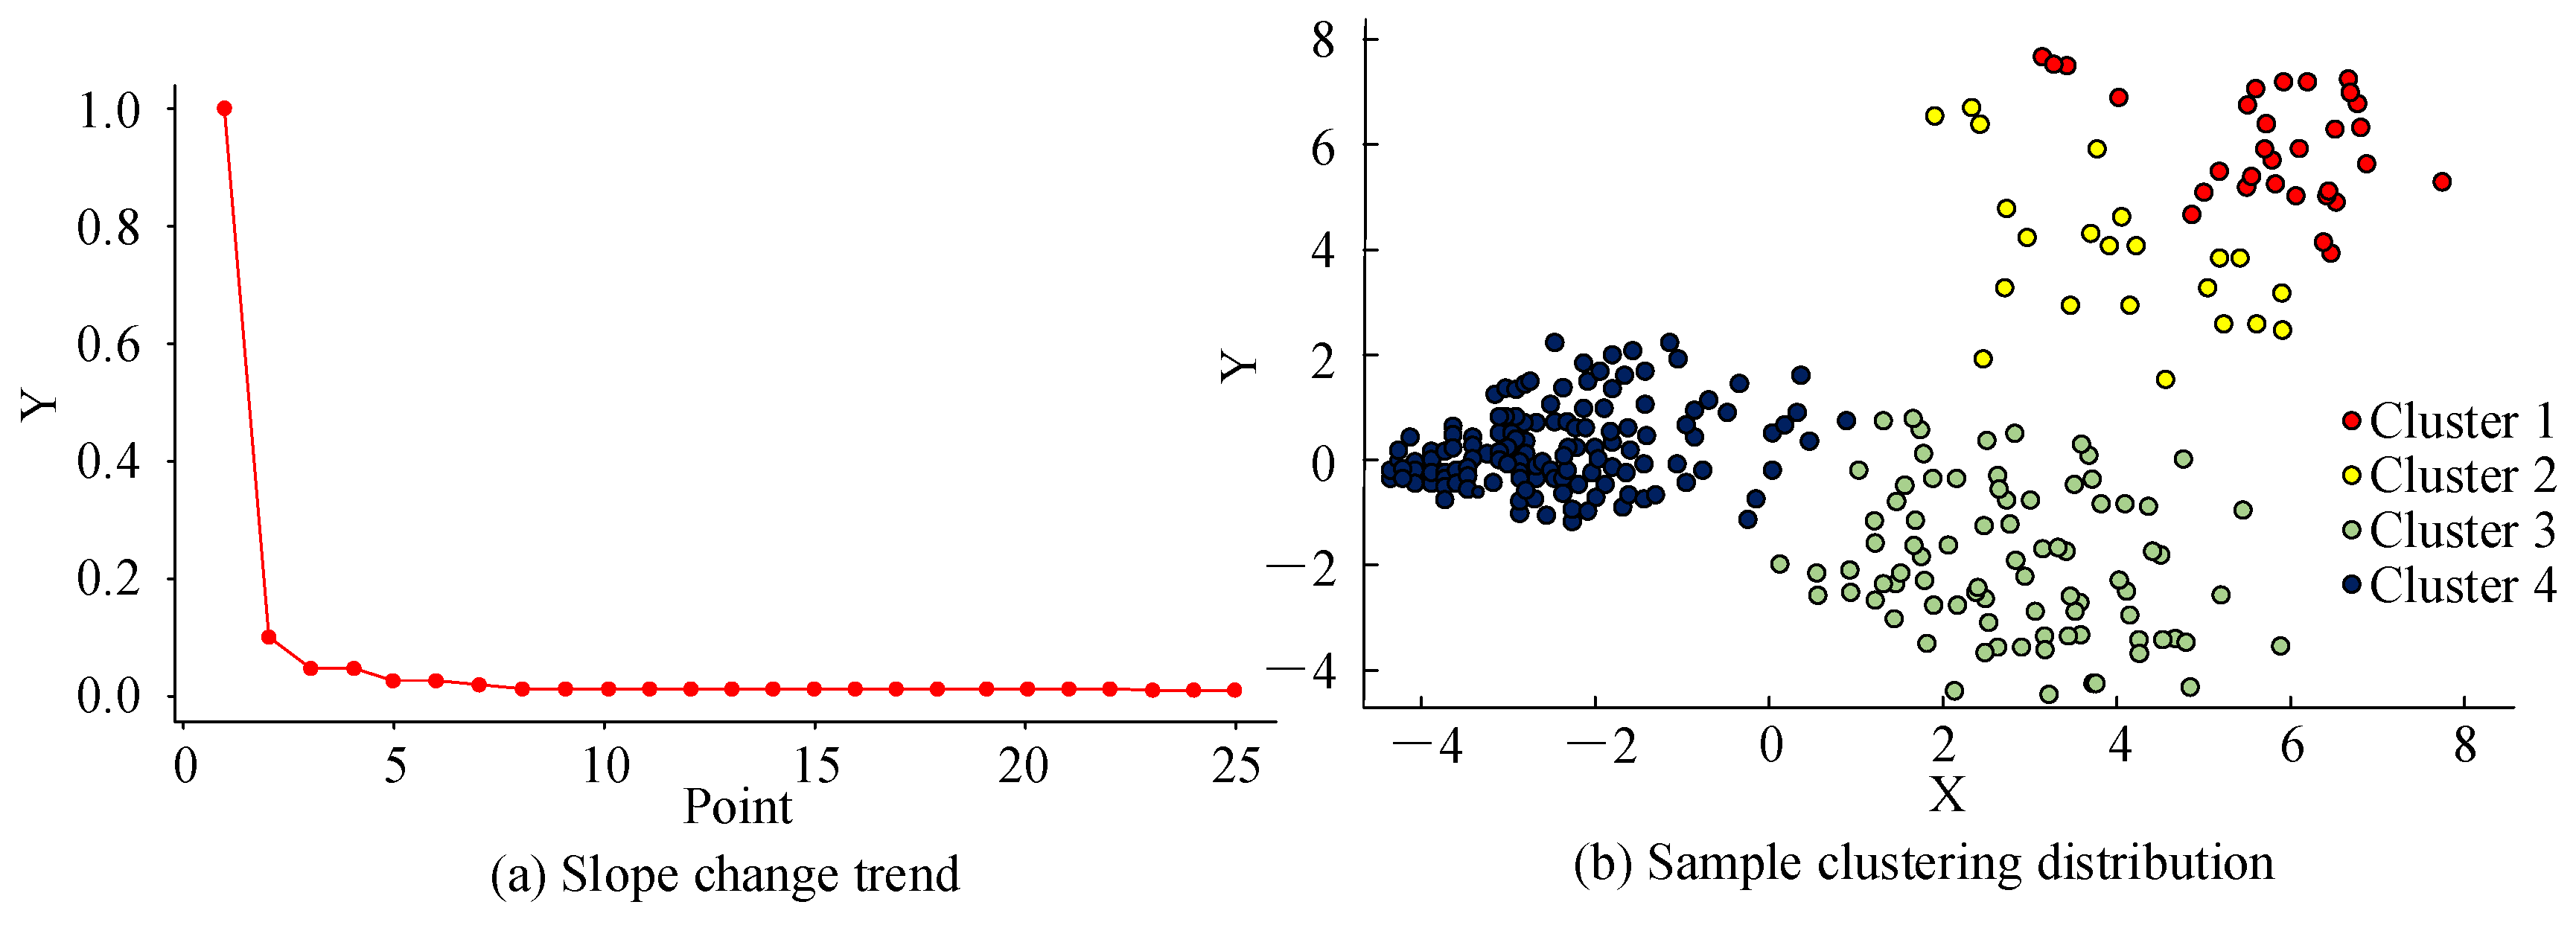
Figure 13 shows the clustering results of the improved CFSFDP algorithm. Figure 13a shows the trend of the slope change. Here, the fourth sample point has the largest slope change; thus it was considered a critical point and the first four points were selected as the clustering center. The remaining sample points were classified according to the allocation rules, resulting in Figure 13b. Here, the blue and green sample points have good clustering performance. Although the distribution of the red and orange sample points is relatively wide, the clustering is distinct and the distance between sample points is relatively large.
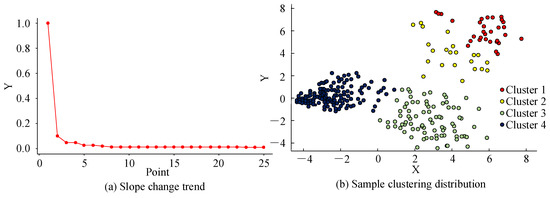
Figure 13.
Improved CFSFDP algorithm clustering results.
To verify the clustering performance of the improved CFSFDP algorithm, the traditional CFSFDP algorithm was subjected to the same experiment. The obtained clustering results are shown in Figure 14. Only three samples in Figure 13 were considered to be critical points, which is one less than the improved CFSFDP algorithm. The reason for this is that the algorithm exhibited a looping phenomenon, treating samples located closer together as cluster centers. The traditional CFSFDP algorithm had only three clustering points that were relatively close in distance, while the remaining sample points were widely distributed and mixed. Therefore, the improved clustering algorithm showed good performance in processing power data with significant local density changes.
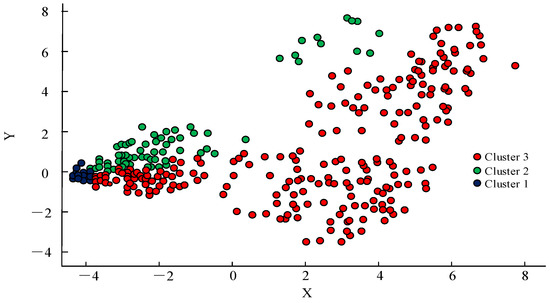
Figure 14.
Clustering results of traditional CFSFDP algorithm.
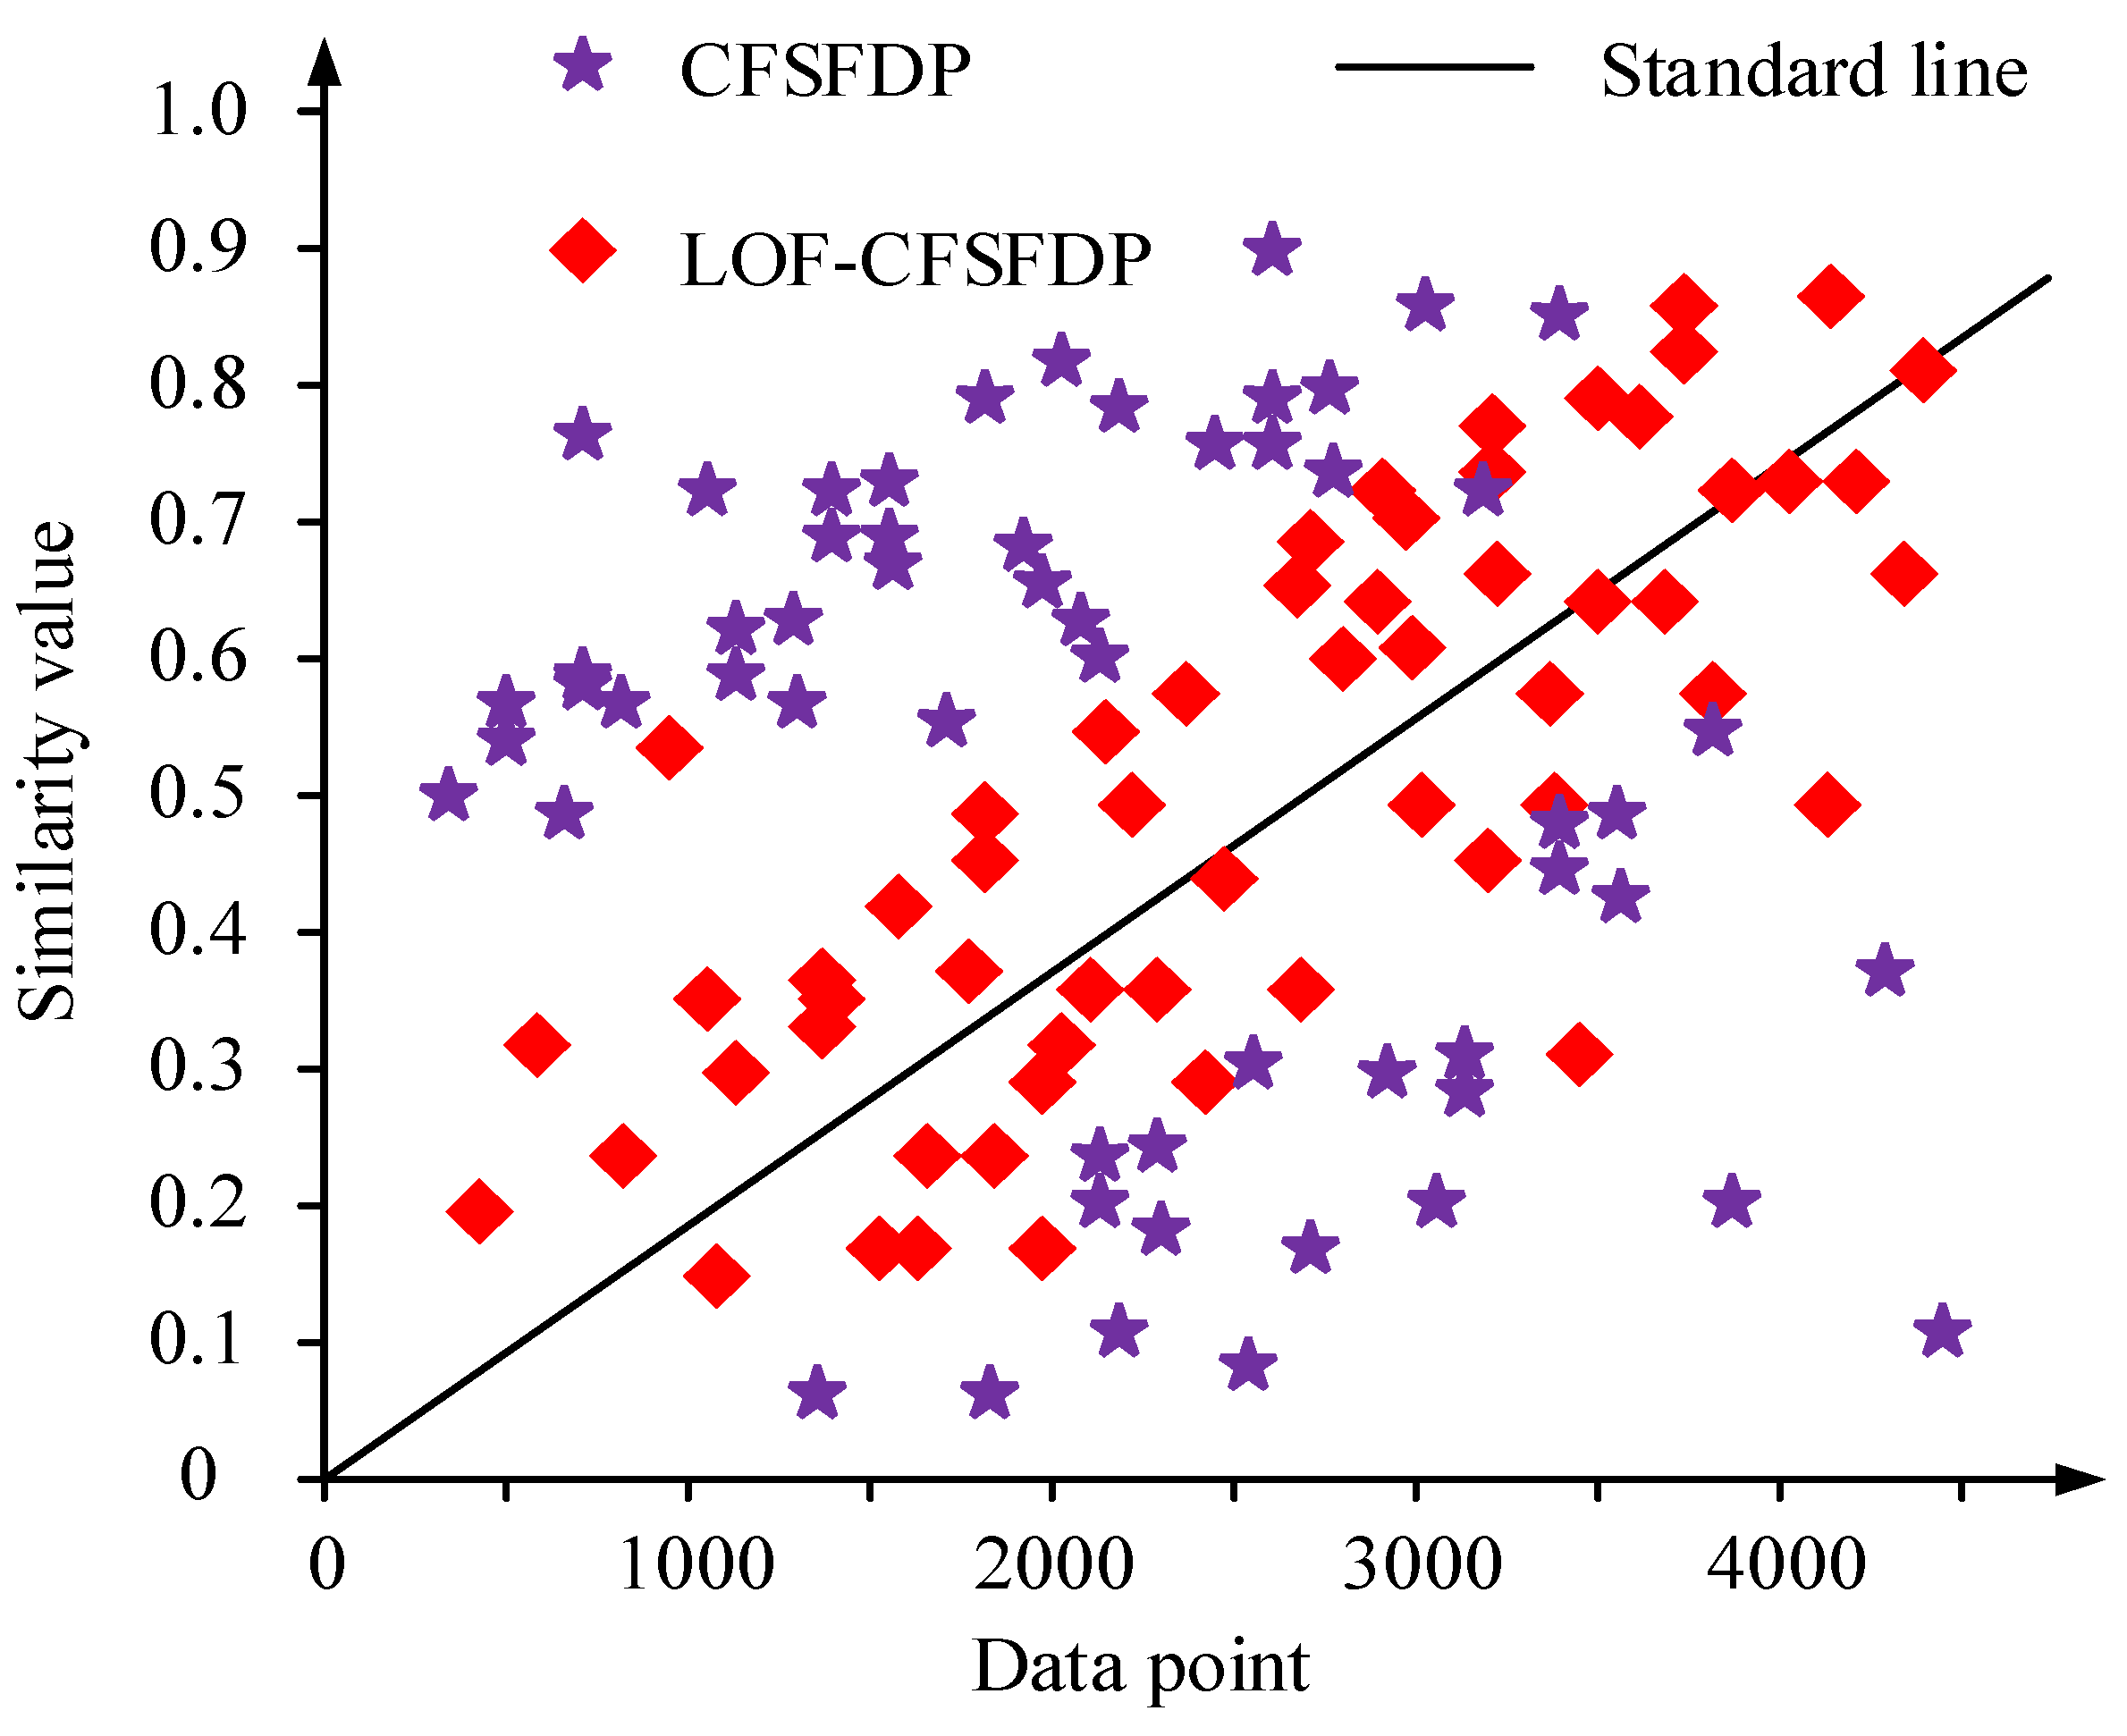
Figure 15 shows the outlier results of the CFSFDP algorithm before and after improvement. The results show that the outliers detected by the CFSFDP algorithm were large, their distribution was scattered, and there were many outliers in the edge area. The outliers detected by the LOF-CFSFDP algorithm were closer to the standard value, and their distribution was closer. These experimental results show that the improved algorithm had a better clustering effect and its outliers were more reasonable.

Figure 15.
Outlier results of CFSFDP algorithm before and after improvement.
Table 2 shows the performance results of the indicators before and after improving the algorithm. In Table 2, the accuracy of the traditional CFSFDP algorithm is 92.54%, with a missing detection rate of 3.49% and a misdetection rate of 3.97%. The improved CFSFDP algorithm has an accuracy of 97.41%, an increase of 4.87%. The missing detection rate is 1.26%, which is 2.23% lower than the traditional algorithm. The misdetection rate is 1.33%, which is 2.64% lower than the traditional algorithm. These results indicate good results for power data security monitoring based on the proposed LOF-CFSFDP algorithm. To further validate the performance of the methods used in the study, k-Nearest Neighbor (KNN) and K-means clustering were introduced to the experiment for comparison. The results in terms of the number of anomalies detected, accuracy, and error rate are shown in Table 3.
Table 2.
Performance comparison results before and after algorithm improvement.
Table 3.
Performance comparison results of different algorithms.
Table 3 shows that the number of datapoints had a direct impact on performance. When there were many datapoints, the anomaly detection and error rates of all three models declined. When the number of datapoints was 45,600, the anomaly rate of the LOF-CFSFDP algorithm was only 0.41%, with an accuracy of 99.24% and an error rate of 0.76%. Compared with the KNN algorithm, the anomaly detection rate decreased by 0.11%, the accuracy increased by 2.06%, and the error rate decreased by 2.06%. These experimental results show that the LOF-CFSFDP algorithm proposed in this study has relatively advanced performance, with the feasibility of this method being verified through experiments.
5. Conclusions
There are many shortcomings in the current research on AD in power data. The present study has proposed an improved CFSFDP algorithm based on LOF while considering the characteristics of the large local density changes, multiple data dimensions, and abundant data information in power data. This study utilized PCA to reduce the dimensionality of power data and drew a decision map generated based on the new local density and distance. We conducted performance analysis and testing on the improved algorithm through comparative experiments using a constructed active power dataset and wind power generation dataset. In AD, the classification accuracy of the improved CFSFDP algorithm reached 97.41%, 4.87% higher than that of the traditional algorithm. The missing detection and misdetection rates of the LOF-CFSFDP algorithm were improved by 1.26% and 1.33%, respectively, compared to the traditional algorithm. These results verify that the improved CFSFDP algorithm can make up for the shortage in artificially selected clustering centers and reduce the uncertainty of clustering results. In addition, the proposed LOF-CFSFDP algorithm achieved good results in processing actual user electricity consumption data, further verifying its effectiveness. The main contribution of this research is the successful use of PCA for dimensionality reduction of power data, redefining local density and distance, drawing new decision maps, and successfully detecting abnormal power data. However, there remain several shortcomings in the research, such as the failure to analyze the causes of abnormal power data. Although the improved FDPC algorithm was effective for load clustering, no specific analysis of the clustering results was possible. Therefore, the focus of subsequent work should be to combine the clustering results with the actual situation of power enterprises in order to conduct further analysis and research, such as time-share pricing, user behavior analysis, load forecasting, etc.
Author Contributions
Conceptualization, Z.L.; methodology, Z.L.; software, N.L.; validation, L.D.; formal analysis, Z.L.; investigation, C.C.; resources, C.C.; data curation, Z.L.; writing—original draft preparation, B.Z.; writing—review and editing, Z.L.; visualization, L.D.; supervision, Z.L.; project administration, B.Z.; funding acquisition, L.D. All authors have read and agreed to the published version of the manuscript.
Funding
This research was funded by the National Key R&D Program of China (2022YFB3104300): Security Protection Technology of Cloud–Edge Collaborative Industrial Intelligent Controller.
Data Availability Statement
Data is contained within the article. The data presented in this study are available in A Fast Density Peak Clustering Method for Power Data Security Detection Based on Local Outlier Factors.
Conflicts of Interest
The authors declare no conflict of interest.
References
- Yan, L.; Zhang, K.; Xu, H.; Liu, S.; Shi, Y. Abnormal Detection Based on Graph Attention Mechanisms and Transformer. Acta Electonica Sin. 2022, 50, 900–908. [Google Scholar] [CrossRef]
- Yang, J.; Zhang, W.-A.; Guo, F. Distributed Kalman-Like Filtering and Bad Data Detection in the Large-Scale Power System. IEEE Trans. Ind. Inform. 2021, 18, 5096–5104. [Google Scholar] [CrossRef]
- Pei, C.; Zhang, S.; Zeng, X. Research on anomaly detection of wireless data acquisition in power system based on spark. Energy Rep. 2022, 8, 1392–1404. [Google Scholar] [CrossRef]
- Xiahou, K.; Liu, Y.; Wu, Q.H. Decentralized Detection and Mitigation of Multiple False Data Injection Attacks in Multiarea Power Systems. IEEE J. Emerg. Sel. Top. Ind. Electron. 2022, 3, 101–112. [Google Scholar] [CrossRef]
- Dutta, T.; Soni, A.; Gona, P.; Gupta, H.P. Real Testbed for Autonomous Anomaly Detection in Power Grid Using Low-Cost Unmanned Aerial Vehicles and Aerial Imaging. IEEE MultiMedia 2021, 28, 63–74. [Google Scholar] [CrossRef]
- Shao, N.; Chen, Y. Abnormal Data Detection and Identification Method of Distribution Internet of Things Monitoring Terminal Based on Spatiotemporal Correlation. Energies 2022, 15, 2151. [Google Scholar] [CrossRef]
- Lee, J.-H.; Kang, J.; Shim, W.; Chung, H.-S.; Sung, T.-E. Pattern Detection Model Using a Deep Learning Algorithm for Power Data Analysis in Abnormal Conditions. Electronics 2020, 9, 1140. [Google Scholar] [CrossRef]
- Gorjão, L.R.; Jumar, R.; Maass, H.; Hagenmeyer, V.; Yalcin, G.C.; Kruse, J.; Timme, M.; Beck, C.; Witthaut, D.; Schäfer, B. Open database analysis of scaling and spatio-temporal properties of power grid frequencies. Nat. Commun. 2022, 11, 6362. [Google Scholar] [CrossRef]
- Sun, J.; Xu, S.; Li, G. Does China’s power supply chain systems perform well? A data-based path-index meta-frontier analysis. Ind. Manag. Data Syst. 2021, 121, 2048–2070. [Google Scholar] [CrossRef]
- Tenorio-Trigoso, A.; Castillo-Cara, M.; Mondragón-Ruiz, G.; Carrión, C.; Caminero, B. An Analysis of Computational Resources of Event-Driven Streaming Data Flow for Internet of Things: A Case Study. Comput. J. 2023, 66, 47–60. [Google Scholar] [CrossRef]
- He, X.; Yang, H.; Wang, G.; Yu, J. Towards trusted node selection using blockchain for crowdsourced abnormal data detection. Futur. Gener. Comput. Syst. 2022, 133, 320–330. [Google Scholar] [CrossRef]
- Ma, L.; Liu, J. Research on abnormal data detection of optical fiber communication network based on data mining. J. Appl. Opt. 2020, 41, 1305–1310. [Google Scholar] [CrossRef]
- Deng, X.; Bian, D.; Wang, W.; Jiang, Z.; Yao, W.; Qiu, W.; Tong, N.; Shi, D.; Liu, Y. Deep learning model to detect various synchrophasor data anomalies. IET Gener. Transm. Distrib. 2020, 14, 5739–5745. [Google Scholar] [CrossRef]
- Liu, S.; Liang, Y.; Wang, J.; Jiang, T.; Sun, W.; Rui, Y. Identification of stealing electricity based on big data analysis. Energy Rep. 2020, 6, 731–738. [Google Scholar] [CrossRef]
- Guan, J.; Li, S.; He, X.; Chen, J. Peak-Graph-Based Fast Density Peak Clustering for Image Segmentation. IEEE Signal Process. Lett. 2021, 28, 897–901. [Google Scholar] [CrossRef]
- Liang, Z.; Chen, P. An automatic clustering algorithm based on the density-peak framework and Chameleon method. Pattern Recognit. Lett. 2021, 150, 40–48. [Google Scholar] [CrossRef]
- Jain, K.; Saxena, A. Simulation on supplier side bidding strategy at day-ahead electricity market using ant lion optimizer. J. Comput. Cogn. Eng. 2023, 2, 17–27. [Google Scholar] [CrossRef]
- Zhou, K.; Li, Z.; Zhu, G.; Huang, Y.; Li, Y. An Adaptive Pulse Separation Strategy for PD Detection in Frequency-Tuned Resonant Tests. IEEE Trans. Instrum. Meas. 2021, 70, 1–9. [Google Scholar] [CrossRef]
- Guo, J.; Zhang, J.; Zhang, Y.; Xu, P.; Li, L.; Xie, Z.; Li, Q. An improved density-based approach to risk assessment on railway investment. Data Technol. Appl. 2022, 56, 382–408. [Google Scholar] [CrossRef]
- Long, Z.; Gao, Y.; Meng, H.; Yao, Y.; Li, T. Clustering based on local density peaks and graph cut. Inf. Sci. 2022, 600, 263–286. [Google Scholar] [CrossRef]
- Ma, J.; Teng, Z.; Tang, Q.; Qiu, W.; Yang, Y.; Duan, J. Measurement Error Prediction of Power Metering Equipment Using Improved Local Outlier Factor and Kernel Support Vector Regression. IEEE Trans. Ind. Electron. 2022, 69, 9575–9585. [Google Scholar] [CrossRef]
- Mokua, N.; Maina, C.W.; Kiragu, H. Anomaly Detection for Raw Water Quality—A Comparative Analysis of the Local Outlier Factor Algorithm and the Random Forest Algorithms. Int. J. Comput. Appl. 2022, 174, 47–54. [Google Scholar] [CrossRef]
- Zhou, L.; Zhang, T.; Zhang, Z.; Lei, Z.; Zhu, S. A new online quality monitoring method of chain resistance upset butt welding based on Isolation Forest and Local Outlier Factor. J. Manuf. Process. 2021, 68, 843–851. [Google Scholar] [CrossRef]
- Yang, X.; Xiang, Y.; Jiang, B. On multi-fault detection of rolling bearing through probabilistic principal component analysis denoising and Higuchi fractal dimension transformation. J. Vib. Control 2022, 28, 1214–1226. [Google Scholar] [CrossRef]
- Kobayashi, S.; Kaneko, S.; Tamaki, T.; Kiguchi, M.; Tsukagoshi, K.; Terao, J.; Nishino, T. Principal Component Analysis of Surface-Enhanced Raman Scattering Spectra Revealing Isomer-Dependent Electron Transport in Spiropyran Molecular Junctions: Implications for Nanoscale Molecular Electronics. ACS Omega 2022, 7, 5578–5583. [Google Scholar] [CrossRef]
- Akiba, N.; Nakamura, A.; Sota, T.; Hibino, K.; Kakuda, H.; Aalders, M.C. Separation of overlapping fingerprints by principal component analysis and multivariate curve resolution–alternating least squares analysis of hyperspectral imaging data. J. Forensic Sci. 2022, 67, 1208–1214. [Google Scholar] [CrossRef]


Disclaimer/Publisher’s Note: The statements, opinions and data contained in all publications are solely those of the individual author(s) and contributor(s) and not of MDPI and/or the editor(s). MDPI and/or the editor(s) disclaim responsibility for any injury to people or property resulting from any ideas, methods, instructions or products referred to in the content. |
© 2023 by the authors. Licensee MDPI, Basel, Switzerland. This article is an open access article distributed under the terms and conditions of the Creative Commons Attribution (CC BY) license (https://creativecommons.org/licenses/by/4.0/).