Article

The Study of an Energy Management Strategy within a Microgrid with Photovoltaic Production of the <<PROPRE.MA>> Project in the City of Tangier and Integrating V2G Technology

by
Youssra Doudou
1,*,
Abdeljabbar Cherkaoui
1 and
Mostafa Ezziyyani
2
1
Laboratory of Innovative Technologies, Department of Electrical Engineering, National School of Applied Sciences of Tangier, Abdelmalek Essaadi University, Tétouan 93000, Morocco
2
Mathematics and Applications Laboratory, Department of Computer Sciences, Faculty of Sciences and Techniques of Tangier, Abdelmalek Essaadi University, Tétouan 93000, Morocco
*
Author to whom correspondence should be addressed.
Processes 2023, 11(7), 2090; https://doi.org/10.3390/pr11072090
Submission received: 17 May 2023 / Revised: 10 July 2023 / Accepted: 11 July 2023 / Published: 13 July 2023

Abstract

:
The energy stored in an electric vehicle’s (EV’s) battery would be drawn and distributed to the electrical grid to better drive energy consumption within a microgrid that includes a renewable generator(s) managed by a specific energy management strategy. This concept, known as vehicle-to-grid technology (V2G), makes the energy stored in the electric vehicle’s battery more beneficial by discharging it to the public grid during periods of high demand. In this study, we will consider a vehicle system connected to a microgrid, which includes a photovoltaic generator reported from the <<PROPRE.MA>> project in the city of Tangier, and will elaborate on a strategy of the car connected to the V2G (vehicle to grid) network. This study proposes an optimal energy management strategy within the micro grid to charge the battery of a single electric vehicle during off-peak hours when energy costs are low, and to discharge them for driving purposes during peak hours when the energy cost is high. This is explored through a case study of two scenarios in the form of two different driving profiles of electric vehicles. The goal is to understand the behavior of the system in terms of energy redistribution from the V2G and from G2V (grid to the vehicle), and the contribution of the photovoltaic array reported by the <<PROPRE.MA>> photovoltaic generator in the city of Tangier. This study is conducted in a simplified standard Matlab microgrid with the necessary adaptation for the integration of this project generator into the grid, along with a judicious choice of an EV to ensure more explicit battery behavior in relation to our grid parameters. The simulation covers a single day (24 h). This strategy will manage the solar power, the load power, the state of charge of the EV battery, the time of day, and the driving scenario. Using two driving profiles, we will show the performance of the proposed energy management strategy. On the one hand, the V2G technology depends on the driving profile of the EV user is demonstrated. On the other hand, the 100%, 4.65% and 3.32% contributions of the 6 kW photovoltaic generator of the project <<PROPRE.MA>> in the city of Tangier are demonstrated. This contribution covers the load demand for charging of the battery of the electric vehicle that does not have the possibility to charge at work, as well as charging of the battery of the electric vehicle that can be charged at work.

1. Introduction

The use of batteries to charge during surplus generation and cover the energy need during shortage of generation is a common microgrid technology. However, the electrical power generated from renewable energy resources is fluctuating and unpredictable, and, in addition to the high demand for electricity during peak hours, unbalances the main distribution network. This can be remedied with solutions for storage and redistribution of the energy produced. One example is pumped storage: Water is pumped continuously to produce energy and indirectly store the energy in a clean form. Since this storage solution is expensive, the use of the battery of an EV via V2G technology is very promising. On the one hand, V2G technology makes it possible to make better use of renewable energies, thus reducing the demand for energy that produces greenhouse gas emissions. On the other hand, EVs parked at home and at work can be transformed into electricity generators.
Large parking facilities, such as shops, universities, and hospitals, can apply V2G technology to reduce power drawn from the grid during peak demand. This will be very beneficial when the price of electricity is high or when there is not enough energy from distribution generation, such as solar cells and wind turbines. When EVs are not in use, the energy stored in the batteries will not be useful. The objective of this study is to propose a strategy for managing the storage of this energy during off-peak hours and to reuse it during the period of high demand (peak hours) in order to regulate the public grid. Studies in this direction have already been carried out and published in the literature. The study presented in [1] proposes a dual-use scheme that uses V2G technology for both peak load and frequency reduction. This work has shown that the benefits to the user in this type of dual-use program are close to or even greater than the benefits achieved in either of the single-use programs without taking into account the battery degradation related to the number of charge/discharge cycles performed. In order to address this issue, the study published in [2] is a review of V2G technology which has become an important concept due to the high number of electric vehicles on the market. These electric vehicles can be used as storage devices to supply the load. This paper discusses the economic benefits to the electric grid and EV owners as well as battery degradation, bi-directional charging, charging stations, and battery management strategies, and in [3], shows that this range of EV battery SOC (state of charge) [30% < SOC < 90%] allows for a slow weakening of the battery. The results of these two works are obtained in a microgrid connected to the distribution network. In contrast, in [4] they proposed a two-level scheduling approach for peak load shaving within an isolated microgrid. The work published in [5] proposed a load/unload algorithm to find the number of EVs that minimizes the electrical energy consumption from the grid. The results showed that the suggested algorithm provides energy savings after the installation of electric vehicle charging stations through a case study.
EV battery charging can be performed with and without wires. Charging the electric vehicle battery with a wire disturbs some users and may prevent the development of electric vehicles, so the authors of paper [6] focused on wireless charging as a technology to increase the use of electric vehicles. They described the state of the art of the wireless V2G concept and presented a perspective on the challenges for fast development of this technology. In the concept of V2G technology, the battery range of an electric vehicle has an important role. Paper [7] proposes a smart cyber-physical multi-source energy system to increase the range of electric vehicle as well as a good self-distributed energy system through the NSGA-II (Non-Dominated Sorting Genetic Algorithm- II) genetic algorithm. Furthermore, in [8], the authors studied the environmental side of V2G technology, showing that the integration of this technology in a microgrid allows for a reduction in CO2 emissions. The results show that the integration of controlled EVs results in a reduction of 213.23 kg of CO2 emissions. And in [9], the authors studied the challenges and benefits of moving from the existing traditional grid model to a new model, known as microgrid, as a new paradigm for smart cities of the future. They envisaged an energy system architecture that can be applicable to existing and new cities for more benefits such as clean energy production and lower energy costs.
Most of these works do not take into account the contribution of the solar generator for EV charging and mainly use large fleets of EVs in their models. Here, we will discuss a small-scale study. The current study proposes an optimal energy management strategy within a microgrid to charge the battery of a single EV during off-peak hours when the energy cost is low and to discharge them for driving purposes during peak hours when the energy cost is high in order to regulate the grid during high demand. Furthermore, compared to previous work related to V2G technology, the current study contributes in a very different way. A case study that targets the contribution of a photovoltaic generator reported from the <<PROPRE.MA>> project in the city of Tangier [10,11] will be proposed. It will involve two scenarios in the form of two different electric vehicle driving profiles. One of the relevant observations of this study is that the redistribution of energy from the vehicle to the grid depends on the profile performed.
The simulation in this study was based on the assumption of a single EV user, with state of charge limits, but with two different driving profiles in a microgrid.
The rest of this paper is organized as follows. Section 2 describes the system used in this study, with a review of the proposed energy management strategy, followed by a detailed description of the different simulation cases. The results are presented in Section 3, followed by a discussion in Section 4 and a conclusion in Section 5, and finally a presentation of the <<PROPRE.MA>> project in the acknowledgement section.

2. Materials and Methods

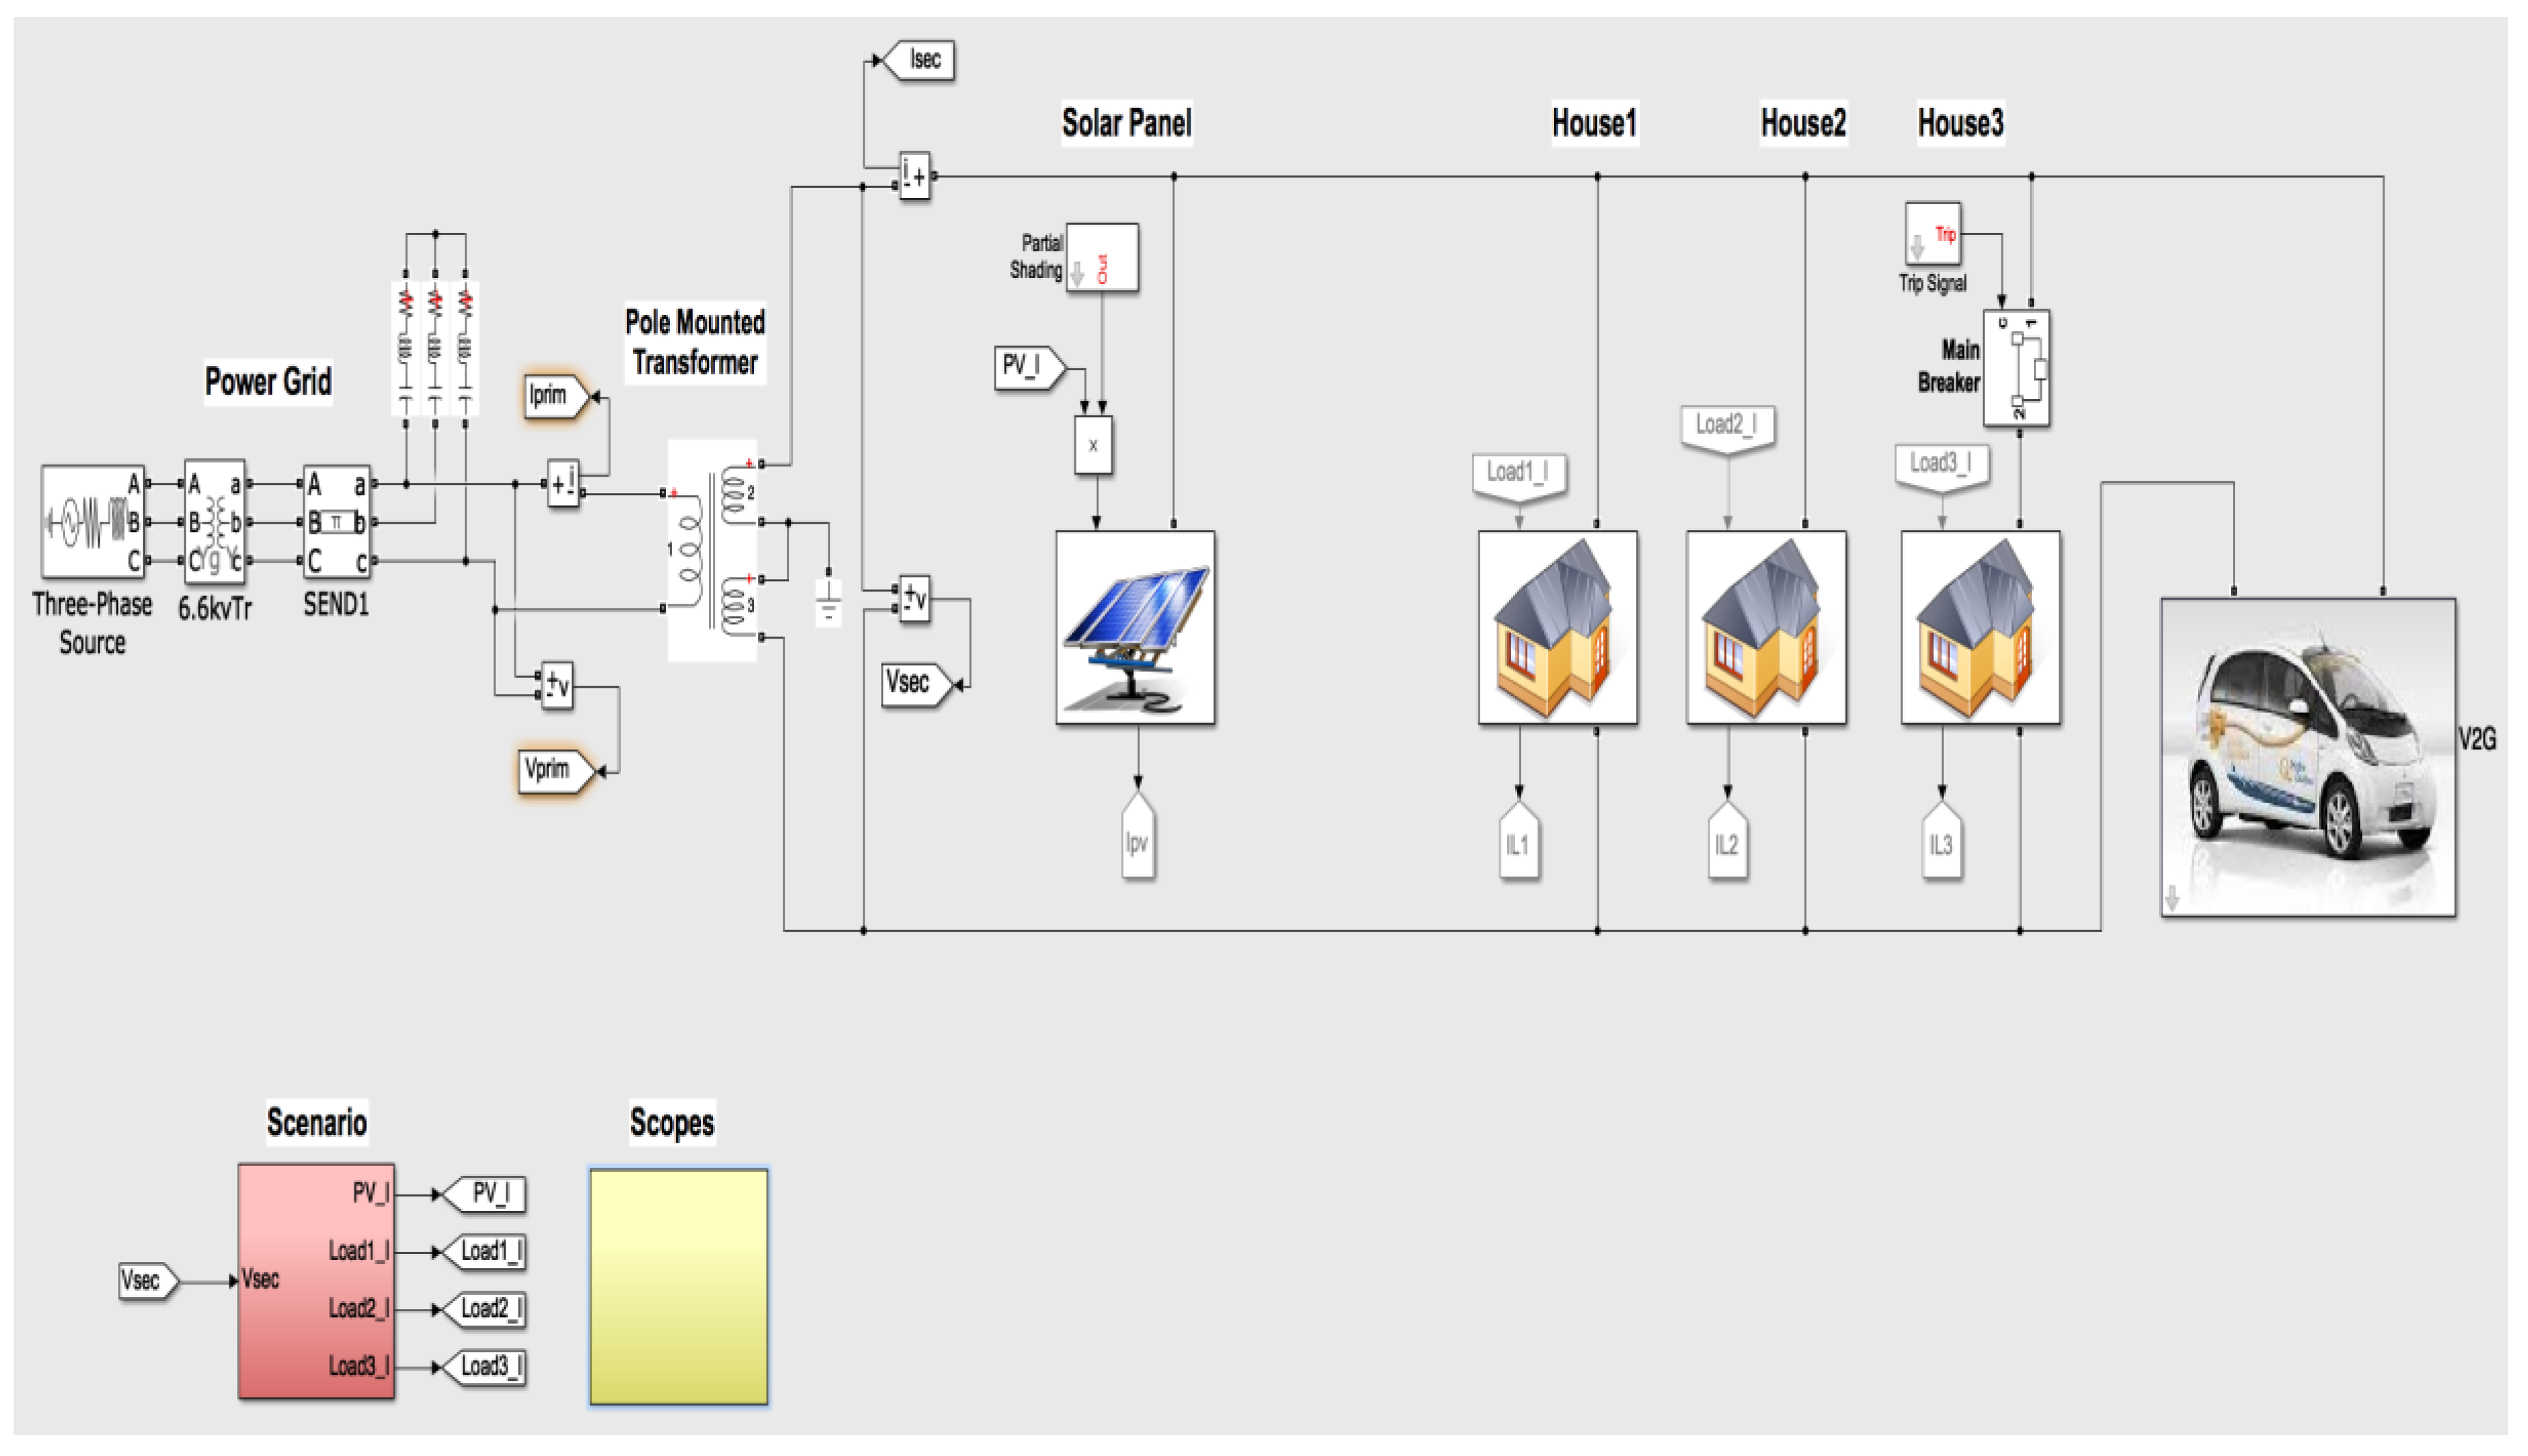
2.1. Description of the System

The power system consists of a photovoltaic installation of the <<PROPRE.MA>> project in the city of Tangier, which provides a peak installed power of 6 kW, and is connected to the main AC (Alternating Current) bus of 230 V (phase voltage) through a DC/DC (Direct Current/Direct Current) converter and an inverter. The load is represented by three houses consuming a maximum power of 2.5 kW each, a 100% electric car of the brand Renault Twingo with a Lithium-Ion battery of 22 kWh capacity [12] connected to the AC bus of the microgrid via a DC/DC converter and an inverter, and a bi-directional charging station for EV. All loads are considered AC and the system follows a predefined and deterministic operational strategy. Although each micro-source is interconnected to the system by its own power electronics, which is responsible for its proper operation and maximum power extraction, the control of the overall system operation is centralized. A central converter is responsible for power distribution within the microgrid. Figure 1 shows the microgrid and the different subsystems of the model, which is based on a simplified model of a microgrid in Matlab/Simulink [13].
The scenario subsystem includes the values of the power produced by the PV (Photovoltaic) panels and the load during one day. The scope subsystem includes all the graphs needed to visualize the results of the microgrid operation and the chart block, which contains the status diagram of the proposed energy management strategy shown in Figure 2.

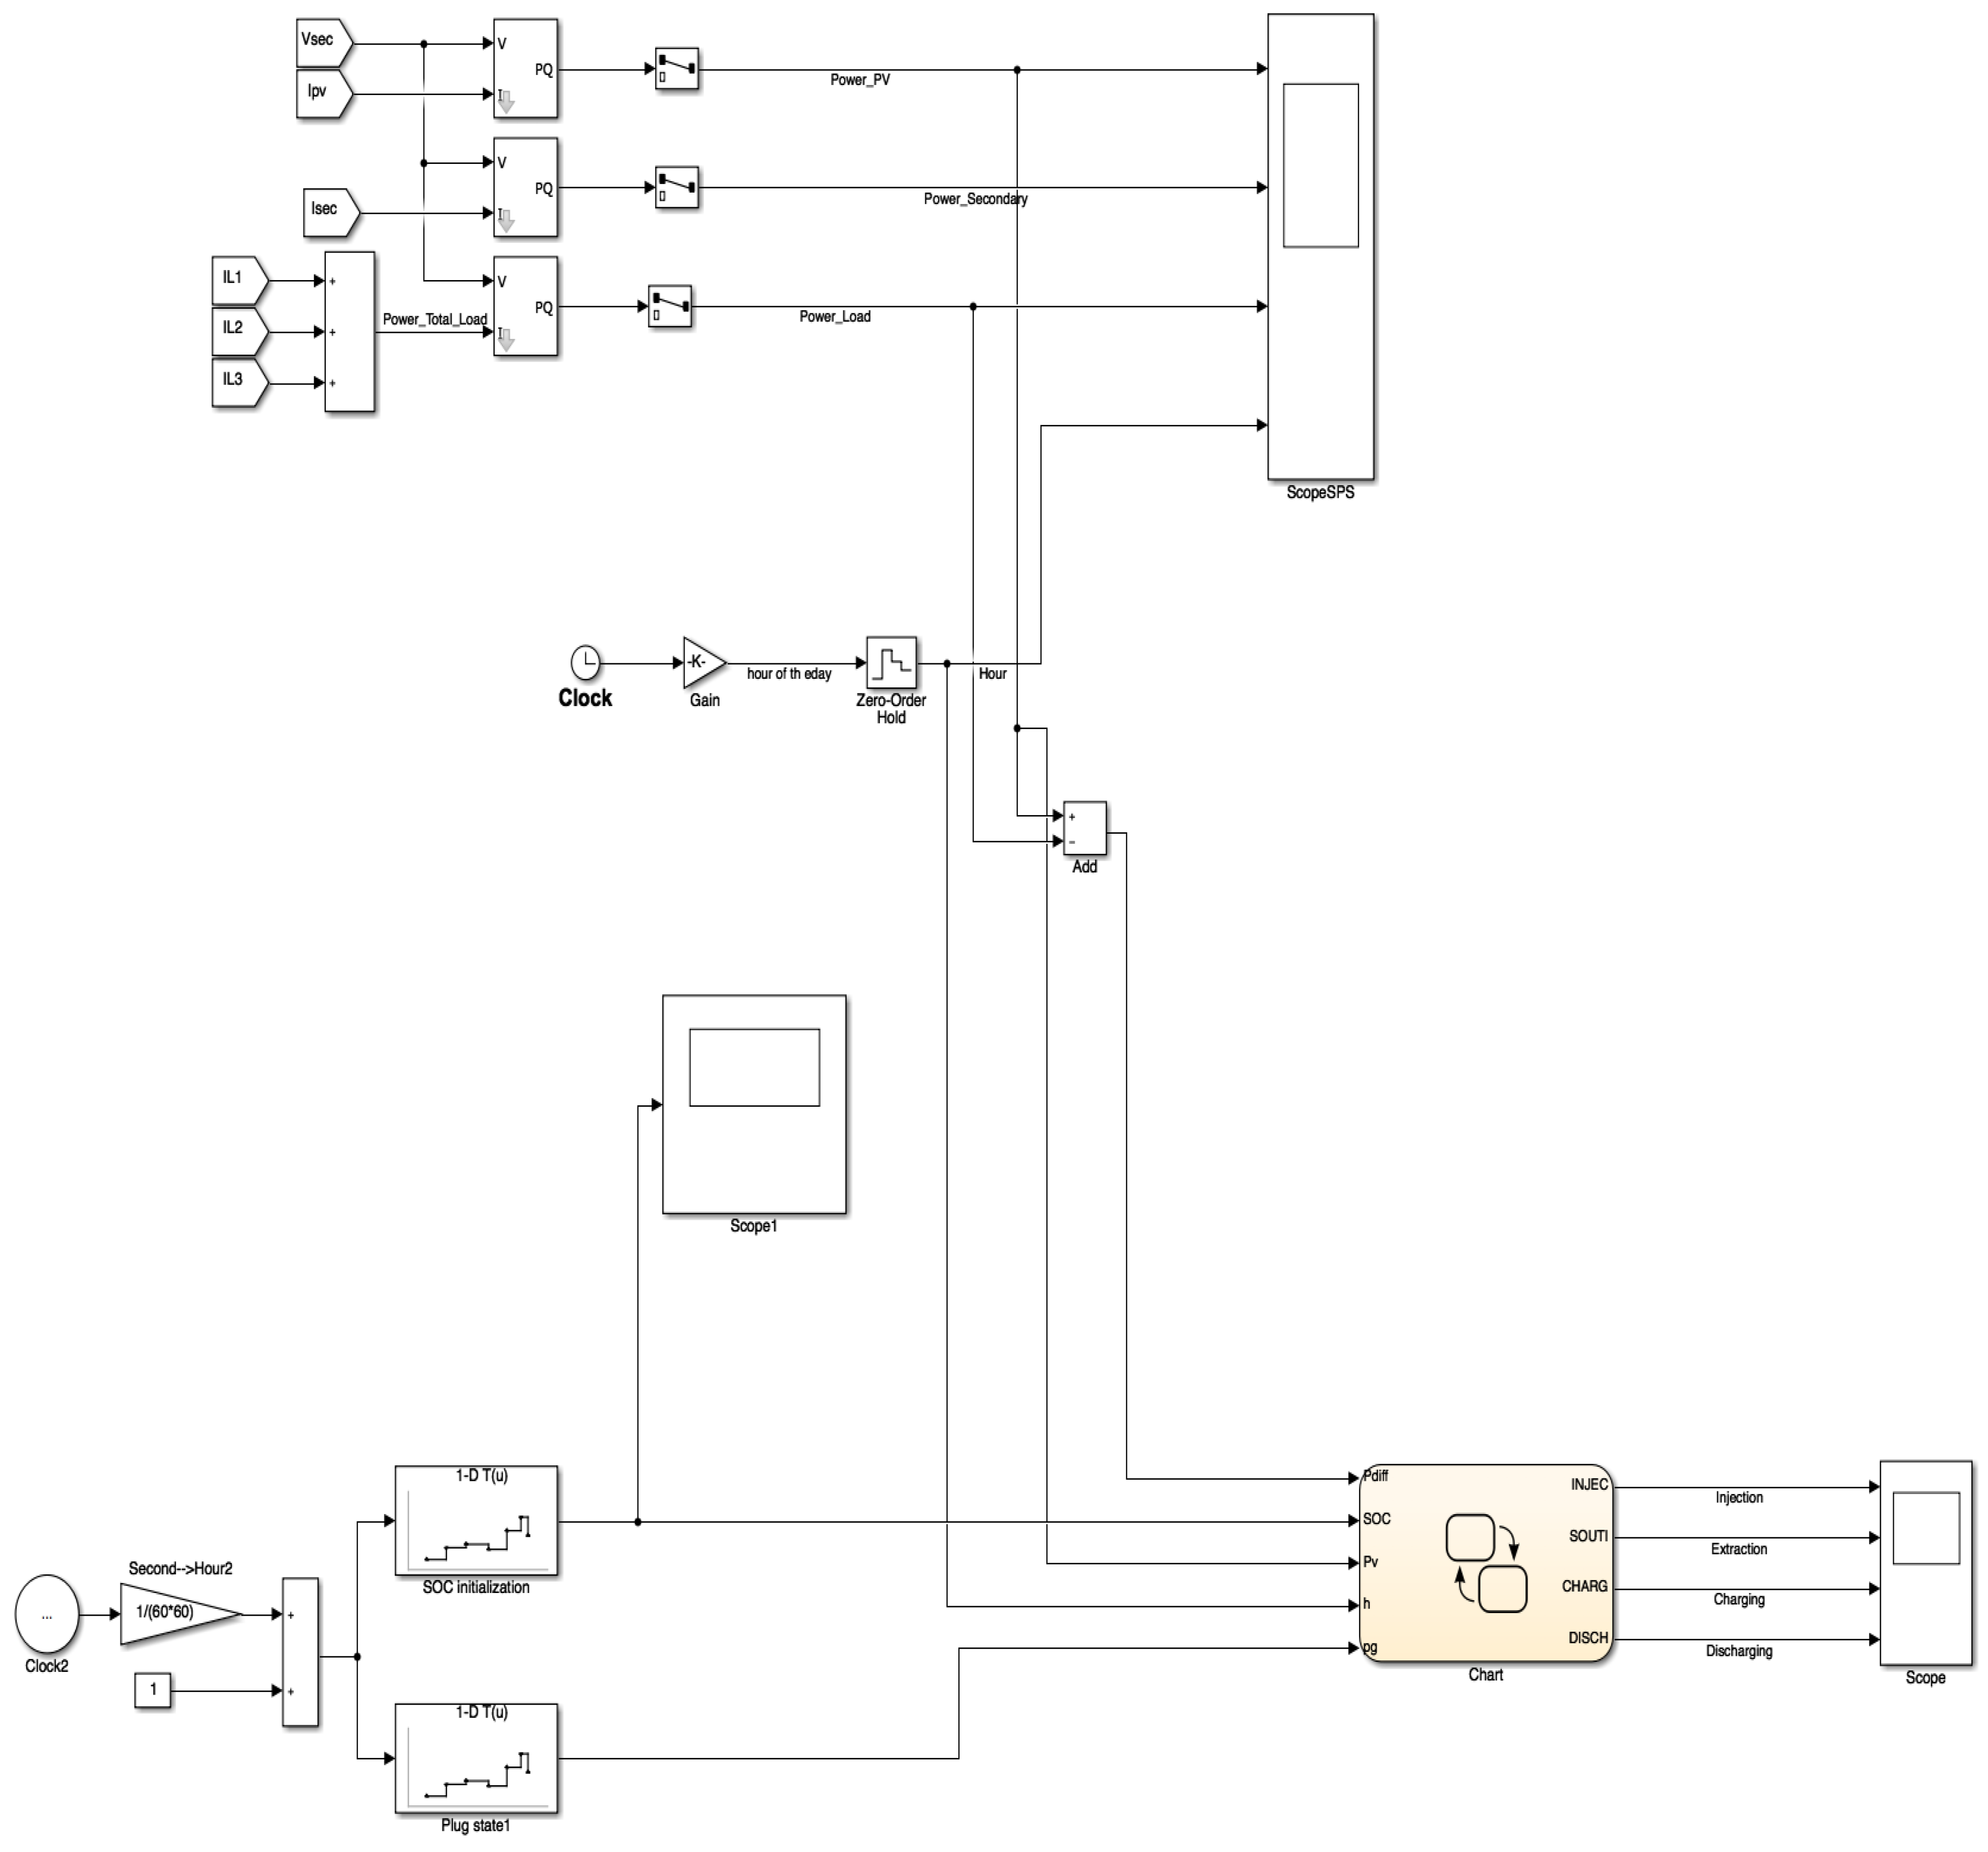
2.2. Control and Operational Strategy

In this section, the logic of the operational strategy and its control will be described. During off-peak hours, the electric vehicle is not connected to the V2G terminal, and the solar energy produced feeds the load. If there is a surplus of energy within the system, it will be injected into the main grid to be consumed during peak hours by the homeowner. If there is an energy deficit during the same period, electricity will be drawn from the grid to cover the needs of the load.
On the other hand, when the electric vehicle is connected to the V2G terminal, during peak hours, the EV battery will be discharged into the public grid, respecting its minimum state of charge which must not be exceeded. The EV will only be charged from midnight, at off-peak hours, so that it can be used in the morning by its owner while respecting the maximum state of charge of the battery.
According to ONEE (Office National d’Électricité et de l’Eau Potable), the peak and off-peak hours in Morocco are shown in Table 1.
The following parameters are the most significant variables in the control of the microgrid:
Pv: The photovoltaic power of the project <<PROPRE.MA>> in the city of Tangier.
Pchar: The power of the load
Pdiff: The power of the difference between the photovoltaic power and that of the load.
SoC: The state of charge of the batteries.
SoCmax: The maximum state of charge.
SoCmin: The minimum state of charge.
h: The time of day.
pg: The state of the car if it is connected to the V2G terminal or not.
There are also signals with Boolean values that enable or disable battery charging or discharging and main grid injection or extraction: CHARG (Charging), DISCH (Discharging), INJEC (Injection) and SOUTI (Extraction), respectively.
In more detail, the operational energy management strategy is as follows:
When the electric vehicle is not connected to its V2G terminal (pg = 0), in this case, the EV is used to go to work, to return home, or to do some shopping. So, if the “Pdiff (Power difference)” between the photovoltaic power and the load power is greater than zero (Pdiff > 0), then there is a surplus of energy inside the microgrid that will be injected into the distribution network for further use; otherwise, if the power difference between the photovoltaic power and the load power is less than zero (Pdiff < 0), then there is a deficit of energy, so drawing from the network is necessary to meet the load needs.
In case the electric vehicle is connected to its V2G terminal (pg = 1), then if h (hour) is greater than or equal to 06 p.m. (h ≥ 18), i.e., during peak hours, during this period just the discharge of the EV battery will be performed. If now the battery state of charge is higher than the minimum state of charge (SoC > SoCmin), then the amount of energy from the EV battery will be made available to the grid; otherwise, if the battery state of charge is less than or equal to the minimum state of charge (SoC ≤ SoCmin), then no action will be activated. When the time is less than 7 a.m. (h < 7), since we are in the off-peak hours, during this period, just the charging of the battery of the EV will be carried out, but before it is necessary to check the state of charge of the battery, if it is greater than or equal to the maximum state of charge (SoC ≥ SoCmax), then no action will be activated. If it is lower than the maximum state of charge (SoC < SoCmax), there will be two cases: If the photovoltaic power is greater than zero (Pv > 0), then the EV battery will be charged by solar energy; otherwise, if the photovoltaic energy is less than or equal to 0 (Pv ≤ 0), then the EV battery will be charged by energy from the main grid.
The flowchart of the main energy management strategy is shown in Figure 3.
This flowchart will be implemented as a state diagram inserted into the chart block in Simulink and shown in Figure 4. By definition, state diagrams are high-level graphical representations used as a starting point for the design of complex software, as their simplicity allows the different modes of operation to be clearly illustrated [14].

2.3. Description of the Different Cases of the Simulation
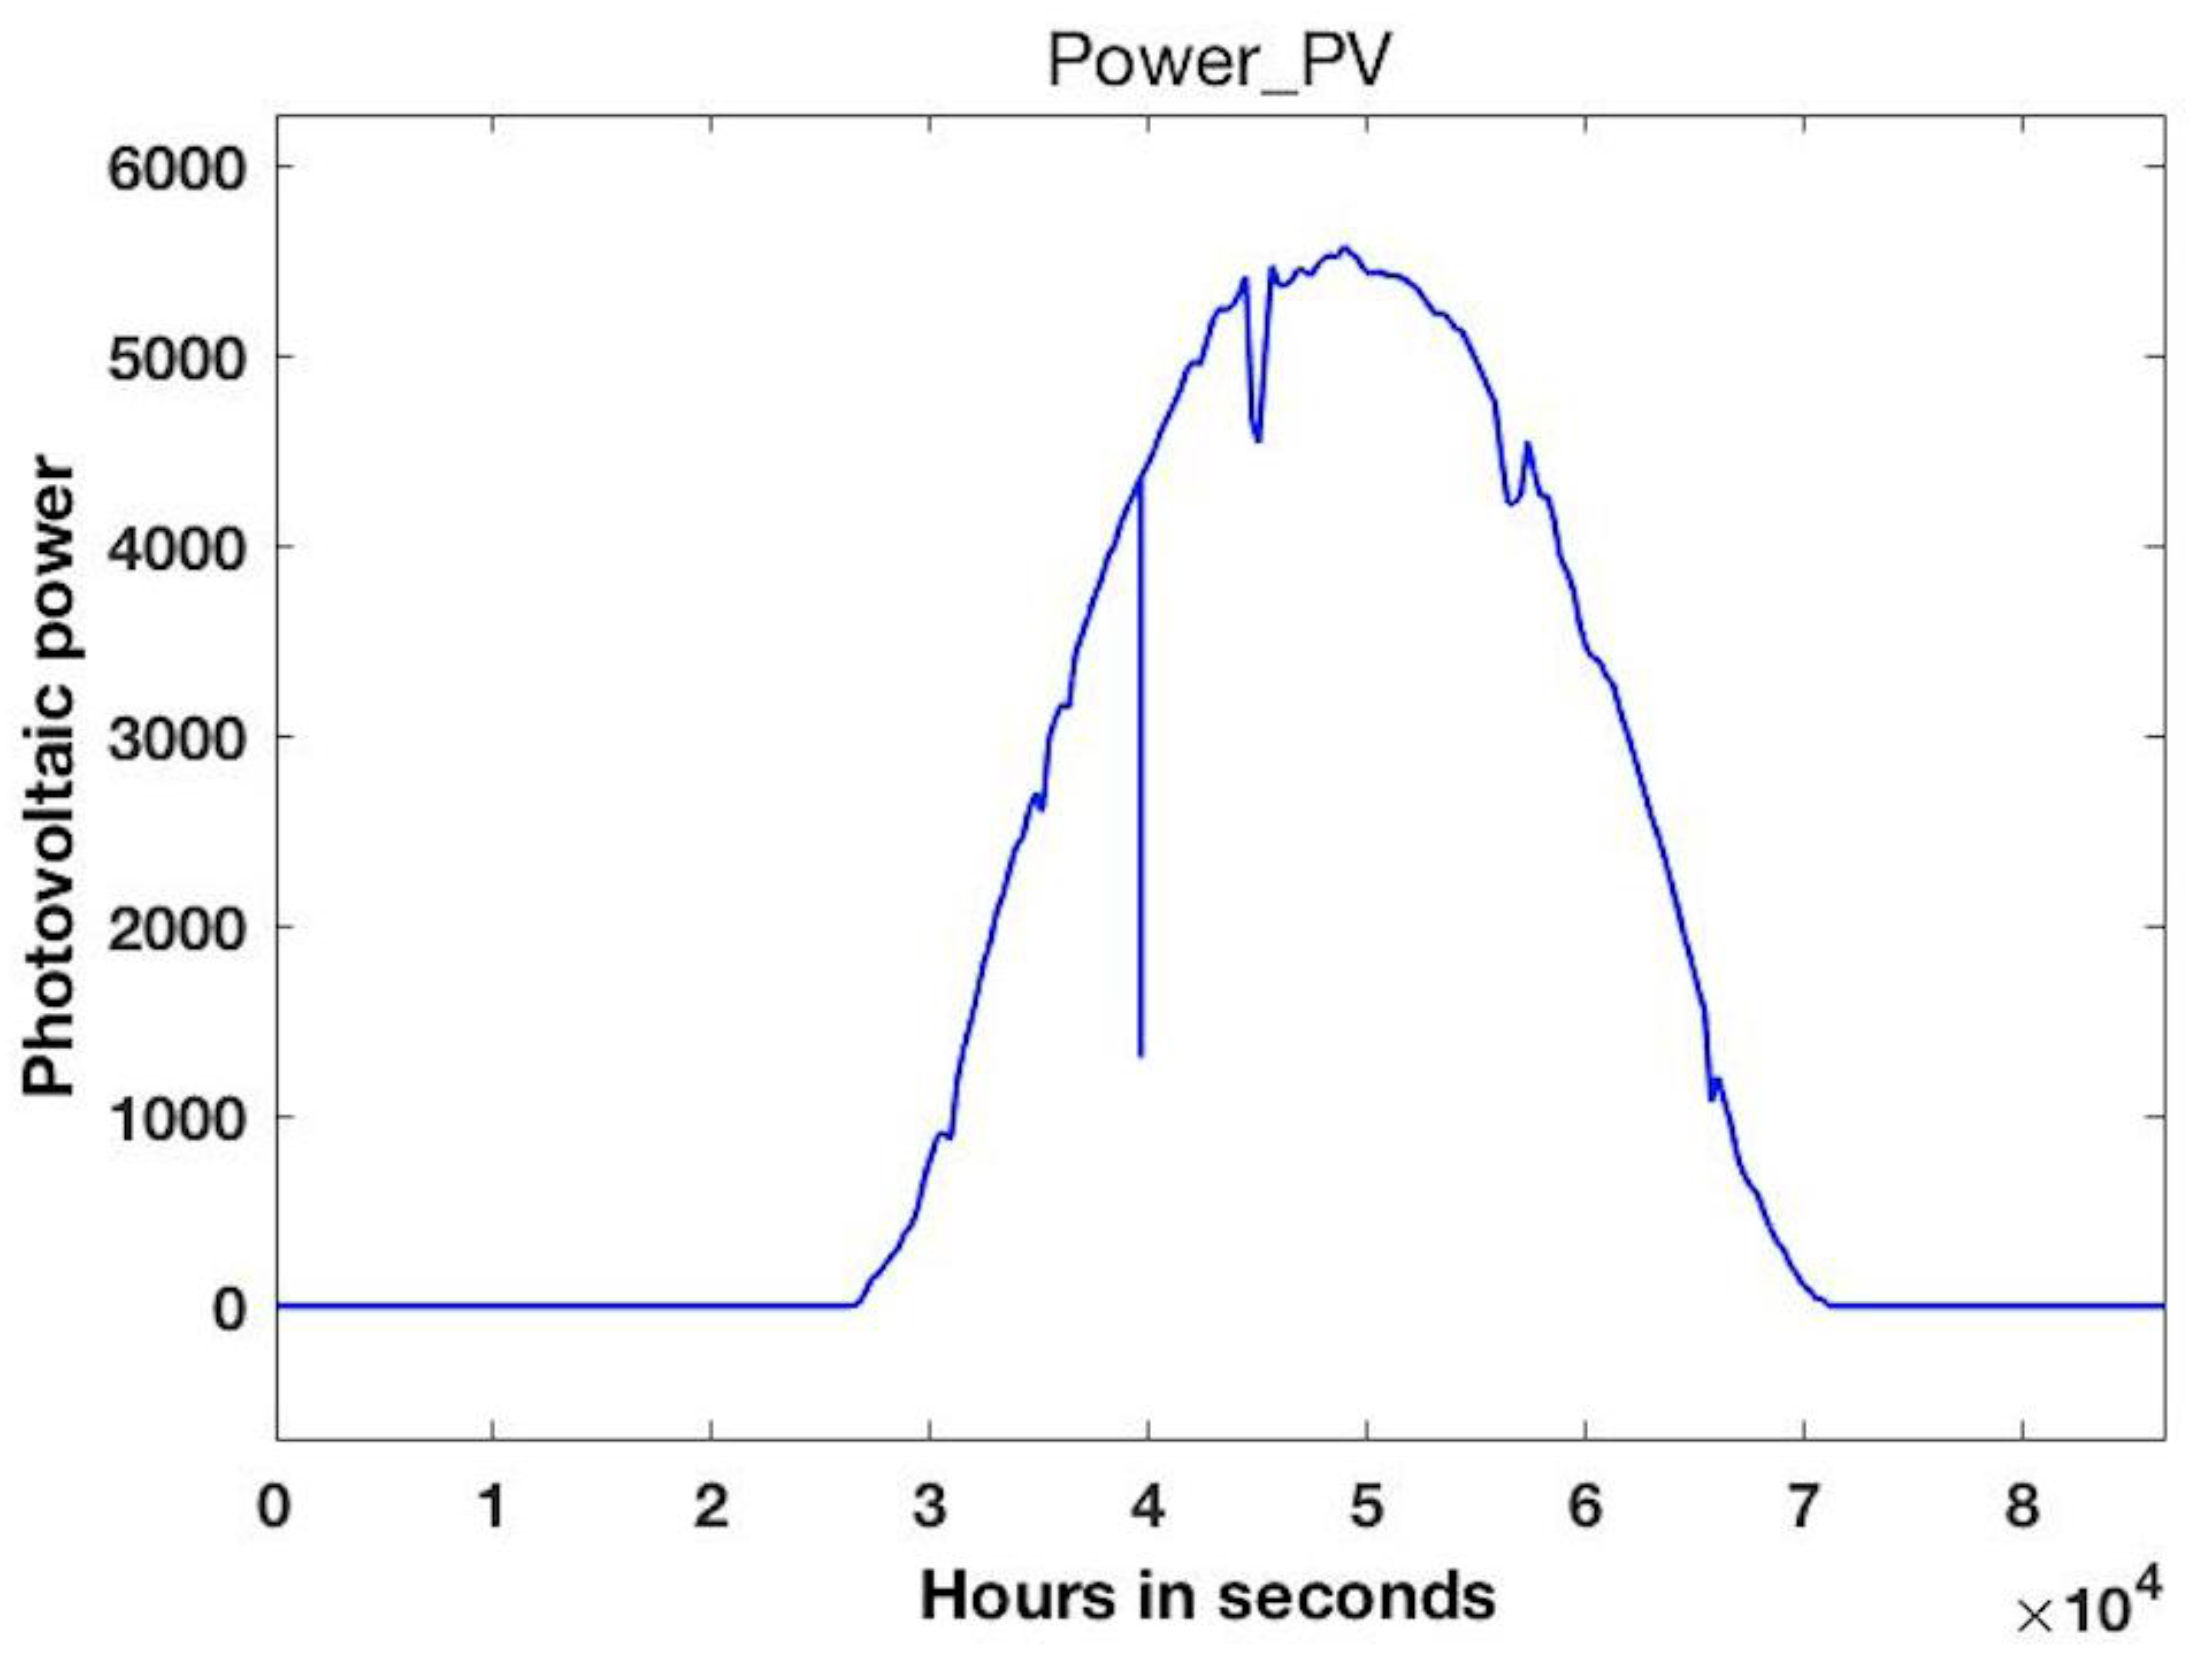
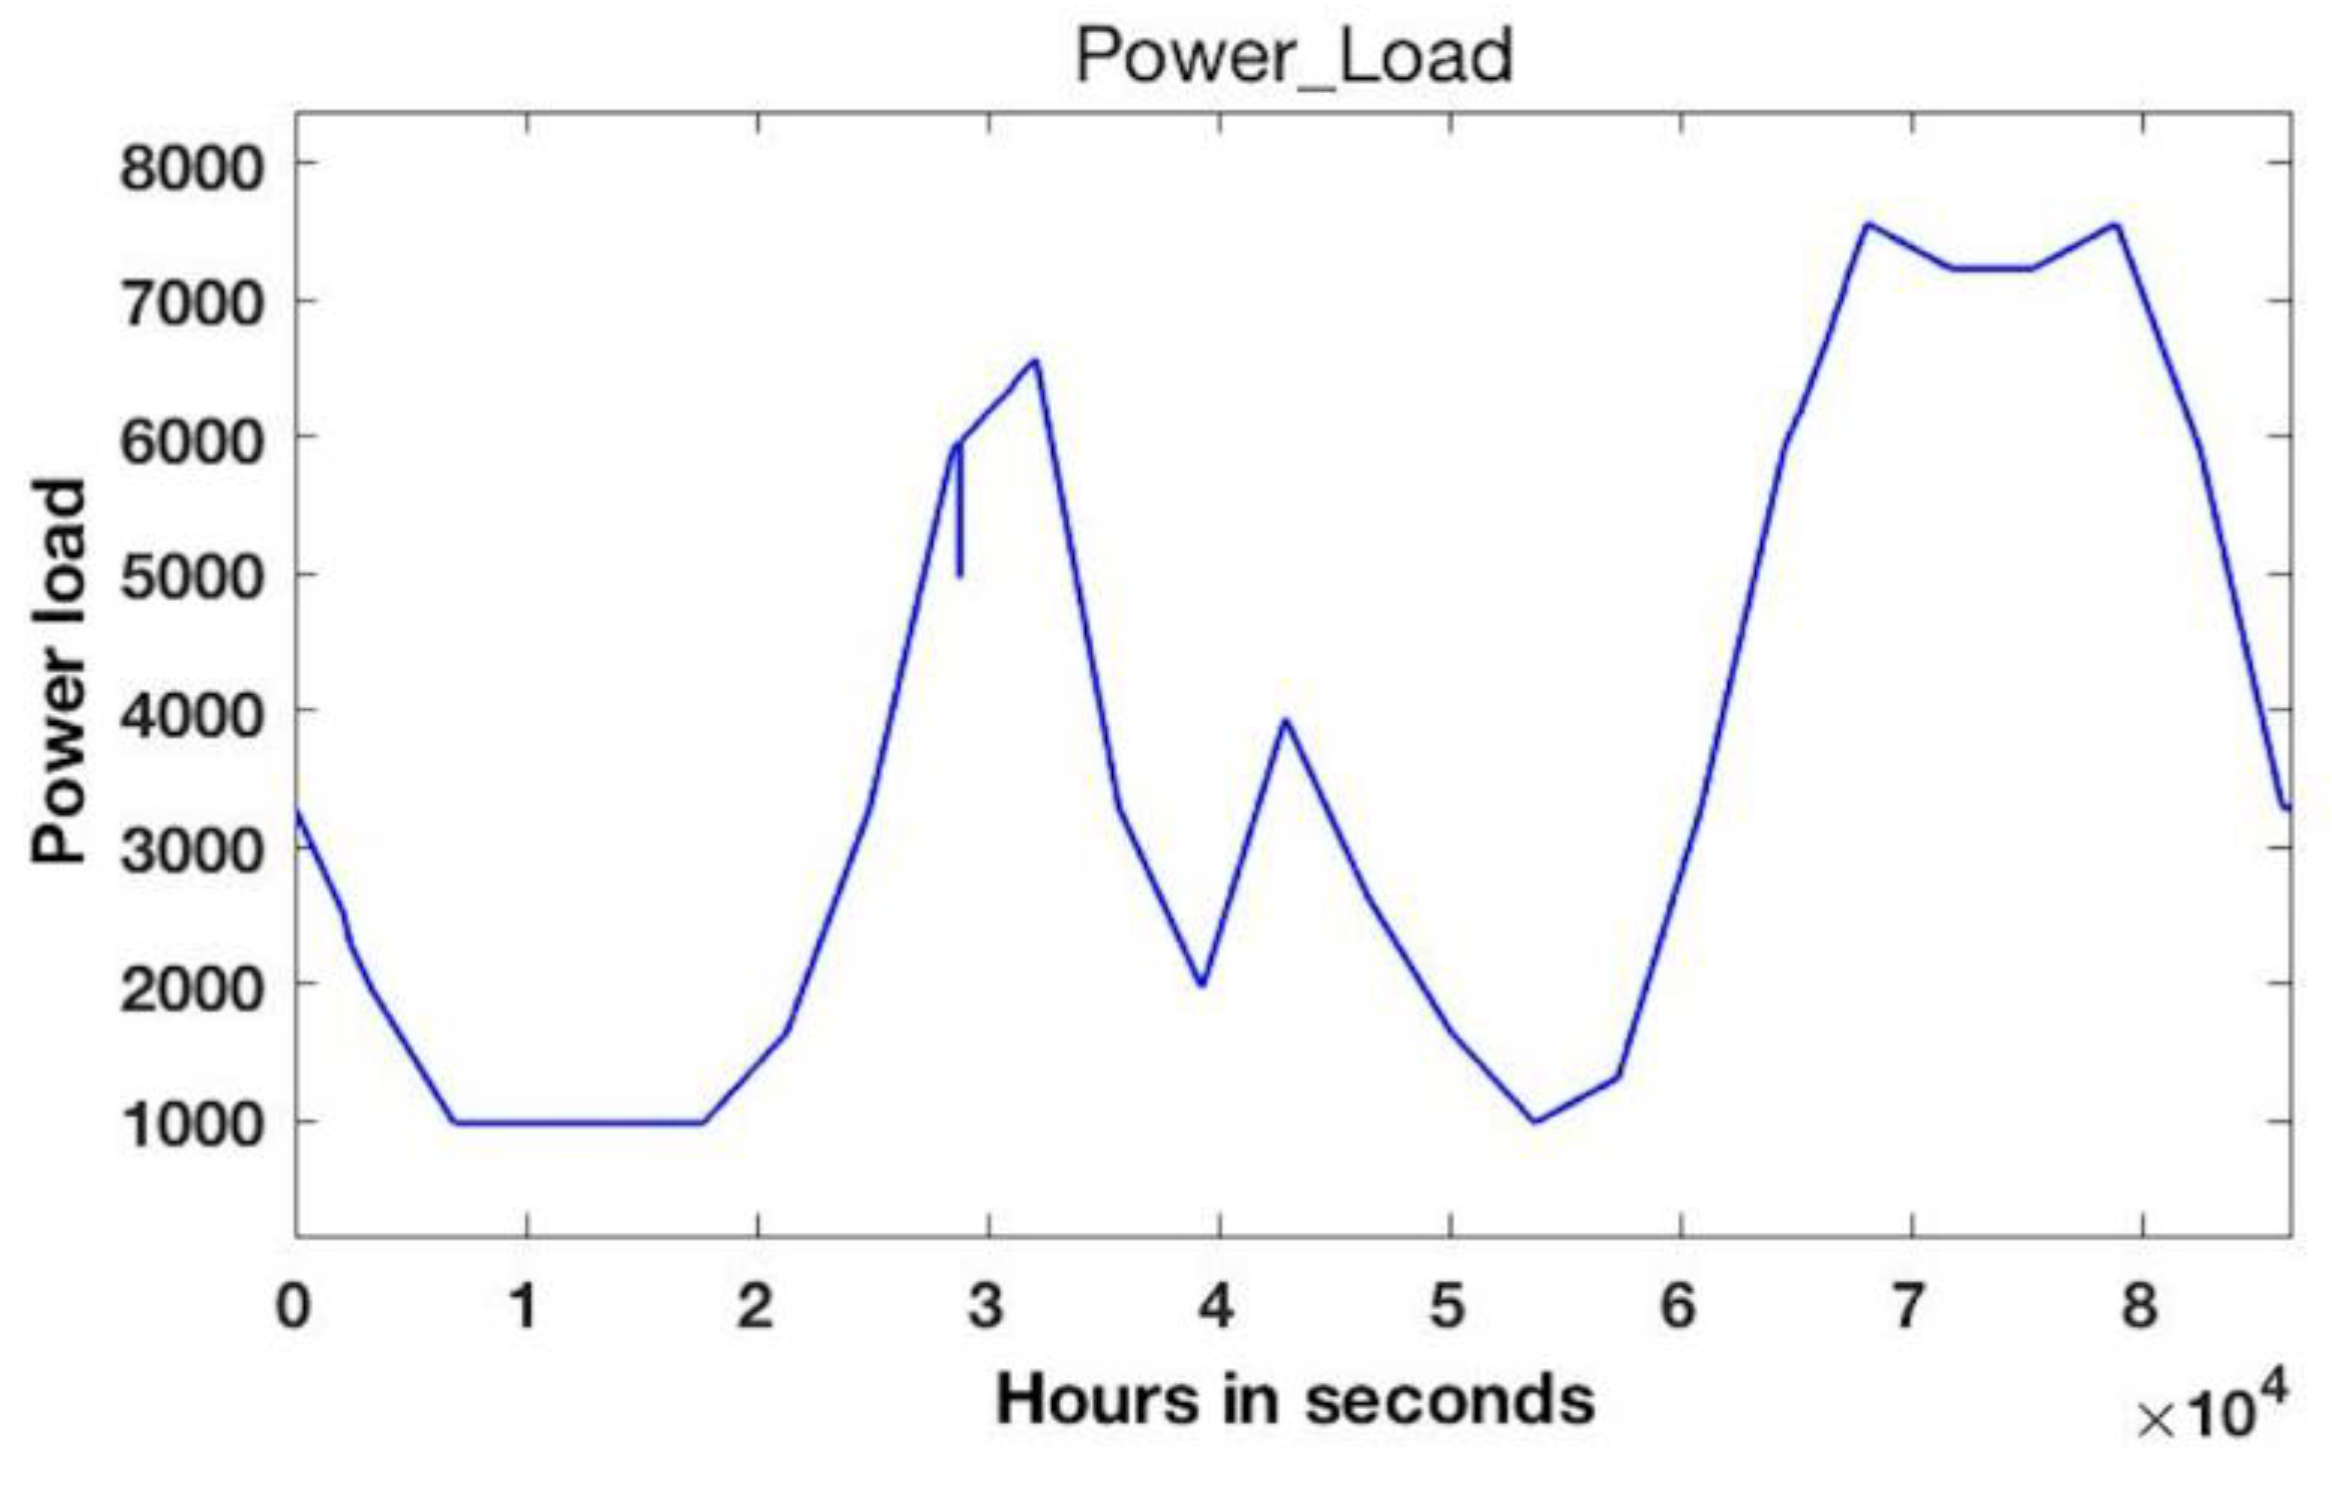
In this section, different driving profiles are specified in order to understand the behavior of the EV battery by analyzing the times of energy withdrawal from the main grid during off-peak hours and energy injection into the grid during peak hours. We also study the contribution of the photovoltaic array to cover the load requirements, including the EV battery.
The simulation is realized with Matlab/Simulink and will cover a period of one day (24 h). It is a day in April, when the energy efficiency of the solar source reaches its highest values, as shown in Figure 5. The load curve is shown in Figure 6. The three houses reach at 9 am a peak consumption of 6500 W, and at 7 p.m. and 9 p.m. a consumption of 7500 W. The V2G technology is only applied during the peak hours, from 5 p.m. in winter and 6 p.m. in summer, in order to balance the network.
We consider a Renault Twingo EV user, with two different driving profiles and state-of-charge limits that are represented as follows: EV = [SoCmin–SoCmax] = [20–90%] to limit long-term battery degradation [2].
The main difference in the SoC interval comes from the different driving profiles. The value 1 means that it is connected to the V2G terminal and the value 0 means the opposite. In this case, the EV is driven by its user to go to work, to go home, or to do some shopping.
In the first profile (case i), the user of the electric vehicle does not have the possibility to charge it at work. The driving profile determines the state of charge of the battery of the electric vehicle (Figure 7 and Figure 8).
In the second profile (case ii), the user of the electric vehicle has the possibility to charge it at work. The driving profile determines the state of charge of the battery of the electric vehicle (Figure 9 and Figure 10).

3. Results

After describing the structure of the model and specifying the different simulation profiles in the previous section, this section focuses on the study of the simulation results. The two basic profiles are simulated, and their results are presented. The results of the simulation outputs within the microgrid are shown in Figure 11 and Figure 12, respectively.

3.1. Case (i)

Case (i) involves the EV user who does not have the possibility to charge his car at work. Figure 11 shows the injection time into the grid, the withdrawal time from the load, the charging time of the EV battery, and the discharging time of the battery, respectively.
From 8 a.m. to 6 p.m. (off-peak hours), the EV is not connected to the V2G terminal. In this case, the photovoltaic production will cover the needs of the load. If there is a surplus, it will be injected into the main grid; otherwise, if there is a deficit, a withdrawal from the grid will be necessary. Table 2 represents the energy produced, on the selected day of April, by the photovoltaic generator of the <<PROPRE.MA>> project in the city of Tangier, the energy consumption of the load, and the energy injected or withdrawn each hour from 8 a.m. to 7 p.m.
From 6 p.m., the user arrives home and plugs his car into the V2G terminal. In this case, the state of charge of the EV will be checked; if it is lower than its minimum state of charge, no action will be triggered; otherwise, if it is higher than its state of charge, the amount of energy stored in the battery of the EV will be injected into the grid during high demand.
So, in our case study we have:
At 18 h, the SoC = 0.2 = 20% and the SoCmin = 0.2 = 20% (Figure 8), so SoC = SoCmin, so there will be no discharge (Figure 11). And because the EV will only be charged from midnight onwards from the public grid, the battery will store an amount of energy of 15.4 kWh because its maximum state of charge is 90%.

3.2. Case (ii)

Case (ii) implies that the EV user has the possibility to charge the car at work. Figure 12 shows the time of injection into the grid, the time of withdrawal from the load, the time of charging the EV battery, and the time of discharging the battery, respectively.
From 10 a.m. to 7 p.m. (10 a.m. to 6 p.m.: off-peak and 6 p.m. to 7 p.m.: peak hour), the EV is not connected to the V2G terminal. In this case, the photovoltaic production will cover the charging needs. If there is a surplus, it will be injected into the main grid; otherwise, if there is a deficit, a withdrawal from the grid will be necessary. Table 3 represents the energy produced on a day in April by the photovoltaic array of the <<PROPRE.MA>> project in the city of Tangier, the energy consumption of the load, and the energy injected or withdrawn each hour from 8 a.m. to 7 p.m.
From 7 p.m., the user arrives home and plugs his car into the V2G terminal. In this case, the EV’s state of charge will be checked. If it is below its minimum state of charge, no action will be triggered; otherwise, if it is higher than its state of charge, the amount of energy stored in the EV’s battery will be injected into the grid during high demand.
In our case study, we find that:
At 7 p.m. the SoC = 0.65 = 65% and the SoCmin = 0.2 = 20% (Figure 10), then SoC > SoCmin, and since the consumption of the EV battery is 22 kWh at 100%, then the amount of energy that will be injected into the grid is 9.9 kWh during the peak hours (Figure 12). And because the EV will only be charged from midnight onwards from the public grid, the battery will store an amount of energy of 15.4 kWh because its maximum state of charge is 90%.

4. Discussion of the Results

The analysis of the last two graphs in Figure 11 and Figure 12 shows that V2G technology is highly dependent on the driving profile achieved by the EV user. Because in the first case (case i) the driver does not have the possibility to charge his car at his place of work, he arrives at home with a state of charge equal to the minimum state of charge; therefore, there is no injection into the grid, and knowing that we are during high demand, in this case, the V2G technology is not beneficial. The owner will charge his car during off-peak hours, 15.40 kWh × 1.2467 DH/kWh = 19.19 DH. And according to Table 2, we have Ptotalinjection = 361.30 kWh (total power injected), so a cost of 361.30 kWh × 1.2467 DH/kWh = 450.43 DH and Ptotalextraction = 30.49 kWh (total power extracted), and so a cost of 30.49 kWh × 1.2467 DH/kWh = 38.01 DH. Then we have Premaining = Ptotalinjection − Ptotalextraction = 361.30 − 30.49 = 330.81 kWh (residual power) and Pbatterycharging = 15.40 kWh (power for loading the battery), so the percentage contribution of the photovoltaic generator is: %= (Pbatterycharging ÷ Premaining) × 100 = (15.40 ÷ 330.81) × 100 = 4.65%.
In this case, we conclude that the photovoltaic generator of the <<PROPRE.MA>> project contributed a percentage of 4.65% in charging the EV battery.
On the other hand, in the second case (case ii), the driver has the possibility to charge his car at his place of work, so he arrives home with a state of charge higher than the minimum state of charge. In this case, the amount of energy stored in the EV battery is injected into the grid, the V2G technology is beneficial. During peak hours, the owner injects an amount of energy of 9.9 kWh, so a cost of 9.9 kWh × 2.2441 DH/kWh = 24.16 DH. And he will charge his car during off-peak hours, 15.40 kWh × 1.2467 DH/kWh = 19.19 DH. In addition, in the workplace, the EV owner extracts a quantity of energy of 5.5 kWh because it arrives with a state of charge of 65%, so a cost of 5.5 kWh × 1.2467 DH/kWh = 6.85 DH.
And according to Table 3, we have Ptotalinjection = 361.30 kWh, so a cost of 361.30 kWh × 1.2467 DH/kWh = 450.43 DH and Ptotalextraction = 30.49 kWh, so a cost of 30.49 kWh × 1.2467 DH/kWh= 38.01 DH. Then, we have, Premaining = Ptotalinjection − Ptotalextraction = 361.30 − 30.49 = 330.81 kWh, and Pbatterycharging = 15.40 kWh + 5.5 kWh = 20.90 kWh and PV2G = 9.9 kWh (power injected from the EV battery to the grid), so the percentage contribution of the photovoltaic generator is: %= ((Pbatterycharging − PV2G) ÷ Premaining) × 100 = ((20.90 − 9.9) ÷ 330.81) × 100 = 3.32%.
In this case, we conclude that the photovoltaic generator of the <<PROPRE.MA>> project contributed a percentage of 3.32% in charging the EV battery.
The production of the photovoltaic generator of the <<PROPRE.MA>> project in the city of Tangier, used in this study, is a production of a typical day in April. In both cases, this generator will contribute 100% to cover the other load requirements all day. In addition, we have (Pinjection > Pextraction) case(ii) > (Pinjection > Pextraction) case(i) using V2G technology.
According to ONEE, the cost of electricity during off-peak hours is 1.2467 DH/kWh and 2.2441 DH/kWh is the cost of electricity during peak hours.

5. Conclusions

In this study, the energy stored in EV batteries is used for V2G application during high demand via the study of an energy management strategy inside a microgrid integrating photovoltaic generation of the <<PROPRE.MA>> project in Tangier city.
The results of this study show on the one hand that the V2G technology depends on the driving profile of the EV user, and on the other hand, the 100%, 4.65%, and 3.32% contribution of the 6 kW photovoltaic generator of the project <<PROPRE.MA>> in the city of Tangier. This facilitates meeting the load requirements by charging the battery of the electric vehicle that cannot be charged at work, as well as the battery of the electric vehicle that can be charged at work. It also demonstrates the effectiveness of the proposed strategy.
The results are obtained using Matlab/Simulink and can be applied to all microgrids integrating renewable sources.
In our future work, we propose the optimal driving profile for V2G technology to be always beneficial.

Author Contributions

Conceptualization, Y.D. and A.C.; methodology, Y.D. and A.C.; software, Y.D.; validation, A.C. and M.E.; formal analysis, Y.D.; investigation, Y.D. and A.C.; resources, Y.D. and A.C.; data curation, Y.D.; writing—original draft preparation, Y.D.; writing—review and editing, Y.D. and A.C.; visualization, A.C.; supervision, A.C. and M.E.; project administration, Y.D. and A.C.; funding acquisition. All authors have read and agreed to the published version of the manuscript.

Funding

This research received no external funding.

Data Availability Statement

Restrictions apply to the availability of these data.

Acknowledgments

<<PROPRE.MA>> is a project sponsored by IRESEN and proposed and piloted by the Faculty of Sciences Semlalia, Marrakech. It was conducted by 23 Moroccan higher education institutions including the National School of Applied Sciences of Tangier and a private company named <RESING>. The main objective of the project is to establish a photovoltaic productivity map for the whole Moroccan territory through the installation of polycrystalline, monocrystalline, and amorphous silicon PV modules in partner with higher education institutions located in 23 different Moroccan cities including Tangier. And on the other hand, to compare different silicon-based solar cell technologies in Morocco.

Conflicts of Interest

The authors declare no conflict of interest.

References

  1. White, C.D.; Zhang, K.M. Using vehicle-to-grid technology for frequency regulation and peak-load reduction. Power Sources 2011, 196, 3972–3980. [Google Scholar] [CrossRef]
  2. Zhou, Y.; Li, X. Vehicle to grid technology: A review. In Proceedings of the 2015 34th Chinese Control Conference (CCC), Hangzhou, China, 28–30 July 2015. [Google Scholar]
  3. Tchagang, A.; Yoo, Y. V2B/V2G on Energy Cost and Battery Degradation under Different Driving Scenarios, Peak Shaving, and Frequency Regulations. World Electr. Veh. J. 2020, 11, 14. [Google Scholar] [CrossRef] [Green Version]
  4. Li, Y.; Li, K. Incorporating Demand Response of Electric Vehicles in Scheduling of Isolated Microgrids with Renewables Using a Bi-Level Programming Approach. IEEE Access 2019, 7, 116256–116266. [Google Scholar] [CrossRef]
  5. AbuElrub, A.; Hamed, F.; Saadeh, O. Microgrid integrated electric vehicle charging algorithm with photovoltaic generation. J. Energy Storage 2020, 32, 101858. [Google Scholar] [CrossRef]
  6. Sassi, H.B.; Errahimi, F.; Essbai, N.; Alaoui, C. V2G and Wireless V2G concepts: State of the Art and Current Challenges. In Proceedings of the 2019 International Conference on Wireless Technologies, Embedded and Intelligent Systems(WITS), Fez, Morocco, 3–4 April 2019. [Google Scholar]
  7. Tehrani, K. A smart cyber physical multi-source energy system for an electric vehicle prototype. J. Syst. Archit. 2020, 111, 101804. [Google Scholar] [CrossRef]
  8. Gamil, M.M.; Senjyu, T.; Masrur, H.; Takahashi, H.; Lotfy, M.E. Controlled V2Gs and battery integration into residential microgrids: Economic and environmental impacts. Energy Convers. Manag. 2022, 253, 115171. [Google Scholar] [CrossRef]
  9. Kazerani, M.; Tehrani, K. Grid of Hybrid AC/DC Microgrids: A New Paradigm for Smart City of Tomorrow. In Proceedings of the 2020 IEEE 15th International Conference of System of Systems Engineering (SoSE), Budapest, Hungary, 2–4 June 2020. [Google Scholar]
  10. Bennouna, A.; Aarich, N.; Erraissi, N.; Akhsassi, M.; Asselman, A.; Barhdadi, A.; Boukhattem, L.; Cherkaoui, A.; Darmane, Y.; Doudou, A.; et al. Energy performance of 3 silicon-based PV module technologies in 20 sites of Morocco. Energy Sustain. Dev. 2019, 53, 30–56. [Google Scholar] [CrossRef]
  11. Aarich, N.; Erraissi, N.; Akhsassi, M.; Bennouna, A.; Asselman, A.; Barhdadi, A.; Boukhattem, L.; Cherkaoui, A.; Darmane, Y.; Doudou, A.; et al. Photovoltaic DC yield maps for all Morocco validated with ground measurements. Energy Sustain. Dev. 2018, 47, 158–169. [Google Scholar] [CrossRef]
  12. Available online: https://www.renault.fr/vehicules-electriques/twingo-electric.html (accessed on 3 January 2023).
  13. Mita, H. Simplified Model of a Small Scaled Microgrid. Available online: https://fr.mathworks.com/help/physmod/sps/examples/simplified-model-of-a-small-scale-micro-grid.html (accessed on 4 September 2020).
  14. Available online: https://fr.mathworks.com/discovery/state-diagram.html (accessed on 5 December 2022).
Figure 1. General view of the model in Simulink-Matlab.
Processes 11 02090 g001
Figure 2. An overview of the scope subsystem.
Processes 11 02090 g002
Figure 3. Flow chart of the main operational strategy.
Processes 11 02090 g003
Figure 4. System status diagram.
Processes 11 02090 g004
Figure 5. Photovoltaic power on 09 April in Watt.
Processes 11 02090 g005
Figure 6. The power of the 09 April load in Watt.
Processes 11 02090 g006
Figure 7. The first daily driving profile of the electric vehicle.
Processes 11 02090 g007
Figure 8. The daily state of charge (SoC) of the electric vehicle battery with the first driving profile.
Processes 11 02090 g008
Figure 9. The second daily driving profile of the electric vehicle.
Processes 11 02090 g009
Figure 10. The daily state of charge (SoC) of the electric vehicle battery with the second driving profile.
Processes 11 02090 g010
Figure 11. The behavior of the microgrid integrating an electric vehicle with the first profile.
Processes 11 02090 g011
Figure 12. The behavior of the microgrid integrating an electric vehicle with the second profile.
Processes 11 02090 g012
Table 1. Peak and off-peak hours in Morocco according to ONEE.
Winter from 1 October to 31 AprilSummer from 1 March to 30 September
Peak hours5 p.m. to 10 p.m.6 p.m. to 11 p.m.
Off-peak hoursfrom 7 a.m. to 5 p.m. and from 10 p.m. to 7 a.m.from 7 a.m. to 6 p.m. and from 11 p.m. to 7 a.m.
Table 2. Pv(Photovoltaic), Pload (load), Pinjection and Pextraction (injection and extraction) power within the microgrid integrating an electric vehicle with the first profile.
Pv (kWh)Pload (kWh)Pinjection (kWh)Pextraction (kWh)
8 a.m.–9 a.m.12.8424.87012.03
9 a.m.–10 a.m.32.0233.9001.88
10 a.m.–11 a.m.48.9910.9238.070
11 a.m.–12 a.m.61.9613.3348.630
12 a.m.–1 p.m.67.2412.7654.480
1 p.m.–2 p.m.59.798.8450.950
2 p.m.–3 p.m.68.655.4463.210
3 p.m.–4 p.m.60.434.9055.530
4 p.m.–5 p.m.48.7010.6138.090
5 p.m.–6 p.m.33.0320.6912.340
6 p.m.–7 p.m.12.9229.50016.58
Table 3. Photovoltaic, load, injection, and extraction power within the microgrid integrating an electric vehicle with the second profile.
Pv (kWh)Pload (kWh)Pinjection (kWh)Pextraction (kWh)
8 a.m.–9 a.m.12.8424.87012.03
9 a.m.–10 a.m.32.0233.9001.88
10 a.m.–11 a.m.48.9910.9238.070
11 a.m.–12 a.m.61.9613.3348.630
12 a.m.–1 p.m.67.2412.7654.480
1 p.m.–2 p.m.59.798.8450.950
2 p.m.–3 p.m.68.655.4463.210
3 p.m.–4 p.m.60.434.9055.530
4 p.m.–5 p.m.48.7010.6138.090
5 p.m.–6 p.m.33.0320.6912.340
6 p.m.–7 p.m.12.9229.50016.58
Disclaimer/Publisher’s Note: The statements, opinions and data contained in all publications are solely those of the individual author(s) and contributor(s) and not of MDPI and/or the editor(s). MDPI and/or the editor(s) disclaim responsibility for any injury to people or property resulting from any ideas, methods, instructions or products referred to in the content.

