Article

Thermal Behavior Prediction of Sludge Co-Combustion with Coal: Curve Extraction and Artificial Neural Networks

1
State Key Laboratory of Clean Energy Utilization, Institute for Thermal Power Engineering, Zhejiang University, Hangzhou 310027, China
2
Huaneng Shandong Shidaobay Nuclear Power Co., Ltd., Weihai 264300, China
*
Author to whom correspondence should be addressed.
Processes 2023, 11(8), 2275; https://doi.org/10.3390/pr11082275
Submission received: 4 July 2023 / Revised: 25 July 2023 / Accepted: 26 July 2023 / Published: 28 July 2023
(This article belongs to the Special Issue Low-Carbon Combustion Technology and Engineering)

Abstract

:
Previous studies on the co-combustion of sludge and coal have not effectively utilized the characteristics of the combustion process to predict thermal behavior. Therefore, focusing on these combustion process characteristics is essential to understanding and predicting thermal behavior during the co-combustion of sludge and coal. In this paper, we use thermogravimetric analysis to study the co-combustion of coal and sludge at different temperatures (300–460 °C, 460–530 °C, and 530–600 °C). Our findings reveal that the ignition improves, but the combustion worsens with more sludge. Then, we further employ curve extraction based on temperature and image segmentation to extract the DTG (weight loss rate) curves. We successfully predicted the DTG curves for different blends using nonlinear regression and curve extraction, achieving an excellent R2 of 99.7%. Moreover, the curve extraction method predicts DTG better than artificial neural networks for two samples in terms of R2 (99.7% vs. 99.1% and 99.7% vs. 94.9%), which guides the application of co-combusting coal and sludge.

1. Introduction

The co-disposal of sludge in pulverized coal boilers is an effective approach to rapidly and safely disposing of sludge, with benefits such as energy recovery and resource utilization [1,2]. The co-combustion of sludge with coal is currently employed as a viable method to convert dried sludge into higher-value fuels or chemicals. This co-combustion process offers specific advantages, such as substituting fossil fuels and mitigating CO2 emissions [3]. However, several studies have investigated the co-combustion behavior of sludge and coal due to their varying combustion characteristics. Kang et al. [4] revealed that blending sewage sludge with coal has positive economic benefits. Yang et al. [5] found that co-combusting coal gangue and sewage sludge improves ignition performance and reduces SO2 and NOx emissions. Fu et al. [6] studied heavy metals’ thermochemical, kinetic, and emission behaviors during the co-combustion of industrial coal slime and sewage sludge. Results showed that the mixture has synergistic combustion properties, and adding sludge improves ignition performance. Moreover, the optimal synergistic effect of the mixture is achieved when the sludge addition ratio is 20%. Due to the complex composition of sludge, its combustion characteristics vary when mixed with different types of coal. This makes it challenging to accurately characterize the combustion process and optimize the actual conditions.
Thermogravimetric analysis (TGA) is a technique used to study fuel characterization by rapidly assessing combustion characteristics such as ignition temperature, maximum mass loss rate, and burn-up temperature. Merdun et al. [3] used TGA to study the co-combustion behavior of sewage sludge and lignite coal and determine the optimal mixing ratio. Wang et al. [7] used TGA to evaluate the synergistic effect of municipal sewage sludge and coal slime and found that the effect peaked when the coal slime ratio reached 40%. However, such studies require complex experiments to determine co-combustion characteristics, leading to significant time and economic costs in practical engineering applications. In the study of the co-combustion characteristics of coal and sludge, researchers quickly obtained the combustion parameters of the mixture according to the thermogravimetric curve [8].
Curve extraction employs specialized algorithms to recognize and process curve images to derive corresponding data. As computer technology increasingly integrates into various fields, curve extraction has found widespread applications in numerous areas. Xiao et al. [9] proposed a multi-time-frequency curve extraction algorithm to extract the characteristic frequency of instantaneous faults in variable-speed bearings. Yochum et al. [10] proposed a method for curve generation based on the continuous wavelet transform. The development of computer technology has facilitated the easy storage and retrieval of numerous thermogravimetric curves from databases. However, most studies on coal and sludge co-combustion do not include research on predicting thermal behavior based on thermogravimetric curves, instead focusing on experimental analysis. This limits the full utilization of the vast amount of data in the current database. Thermogravimetric curve extraction (TCE) based on image segmentation technology allows the conversion of thermogravimetric curve data into numerical form. This enables the estimation of thermal behavior during coal and sludge co-combustion reactions. As a result, this approach can offer valuable insights for practical engineering applications, which can considerably reduce the time and economic costs associated with the practical application process.
Prediction methods for thermal behavior mainly involve simulation and intelligent algorithms, except for TCE. Simulation models utilize mechanism functions or simulation software, which require extensive calculations and complex processes and rely on selecting mechanism functions for result accuracy. On the other hand, intelligent algorithm prediction, such as artificial neural networks (ANN) [11], does not require an in-depth understanding of the reaction process mechanism. ANN is often implemented to handle nonlinear problems and predict unknown data [12,13,14]. There have been numerous studies on the applications of ANNs in the field of thermal analysis. However, it is important to note that the current utilization of ANNs in this field still has room for significant development [15]. Ni et al. [14] investigated the co-combustion of sewage sludge and peanut shells and used ANN to predict experimental data. Yildiz et al. [16] used ANN to predict the TG data of co-combusting hazelnut shells and lignite, proving the accuracy of TG data predicted by the ANN model. Given its high accuracy and predictive advantages, this study employs the ANN model to predict the weight loss rate (DTG) and complements the results with TCE.
In this paper, we explored the co-combustion characteristics of sludge and coal and initially predicted the DTG of their co-combustion using TCE. We investigated the combustion characteristics of coal and sludge at various blending ratios through TGA. We employed the curve extraction method to utilize the thermogravimetric curve of coal and sludge. Subsequently, we developed a thermal behavior prediction model for their co-combustion reaction using nonlinear regression. Compared with the ANN model, the TCE method performs better in predicting DTG values for the two test samples in terms of the R2 evaluation index (99.7% vs. 99.1% and 99.7% vs. 94.9%, respectively).

2. Materials and Methods

2.1. Raw Material

In this study, coal and sludge samples were collected from a coastal city and a power plant, respectively. The collected samples were dried at room temperature and subsequently crushed, sieved, and mixed to obtain the desired compositions. Specifically, the mixture percentages included 0%, 5%, 7%, 10%, 15%, 20%, 30%, 50%, and 100%, which were named ZC, SS5, SS7, SS10, SS15, SS20, SS30, SS50, and SS, respectively. Table 1 shows the proximate and ultimate analyses of ZC and SS. SS was found to contain high levels of volatile matter and ash but low levels of fixed carbon, while ZC exhibited low ash content and high fixed carbon and volatile matter content. In addition, the ratios of C/H and V/FC in SS were determined to be 6.49 wt.% and 165.85 wt.%, respectively, whereas ZC had ratios of 15.22 wt.% and 0.87 wt.%, respectively. Therefore, SS showed better ignition performance compared to ZC.

2.2. Thermogravimetric Experiment

The TGA/DSC3+ simultaneous thermal analyzer with a temperature accuracy of ±5 °C was employed for thermogravimetric analysis. The experiment was conducted at a constant air flow rate of 50 mL/min. During the process, an 8 mg sample was heated from room temperature to 900 °C at a single rate of 20 °C/min [17,18]. Table 2 displays the experimental conditions employed in the thermogravimetric analysis.
The comprehensive combustion characteristic index, S, is introduced to compare the combustion performance of sludge, coal, and their mixtures.
S = ( | d w / d t | ) m a x ( | d w / d t | ) m e a n T i 2 T b
where (|dw/dt|)max is the maximum rate of weight loss (wt.%/s−1), (|dw/dt|)mean is the average rate of weight loss (wt.%/s−1), and Ti is ignition temperature (°C), determined by the TGA tangent method. Tb is the burnout temperature (°C), at which the mass loss reaches 98%.

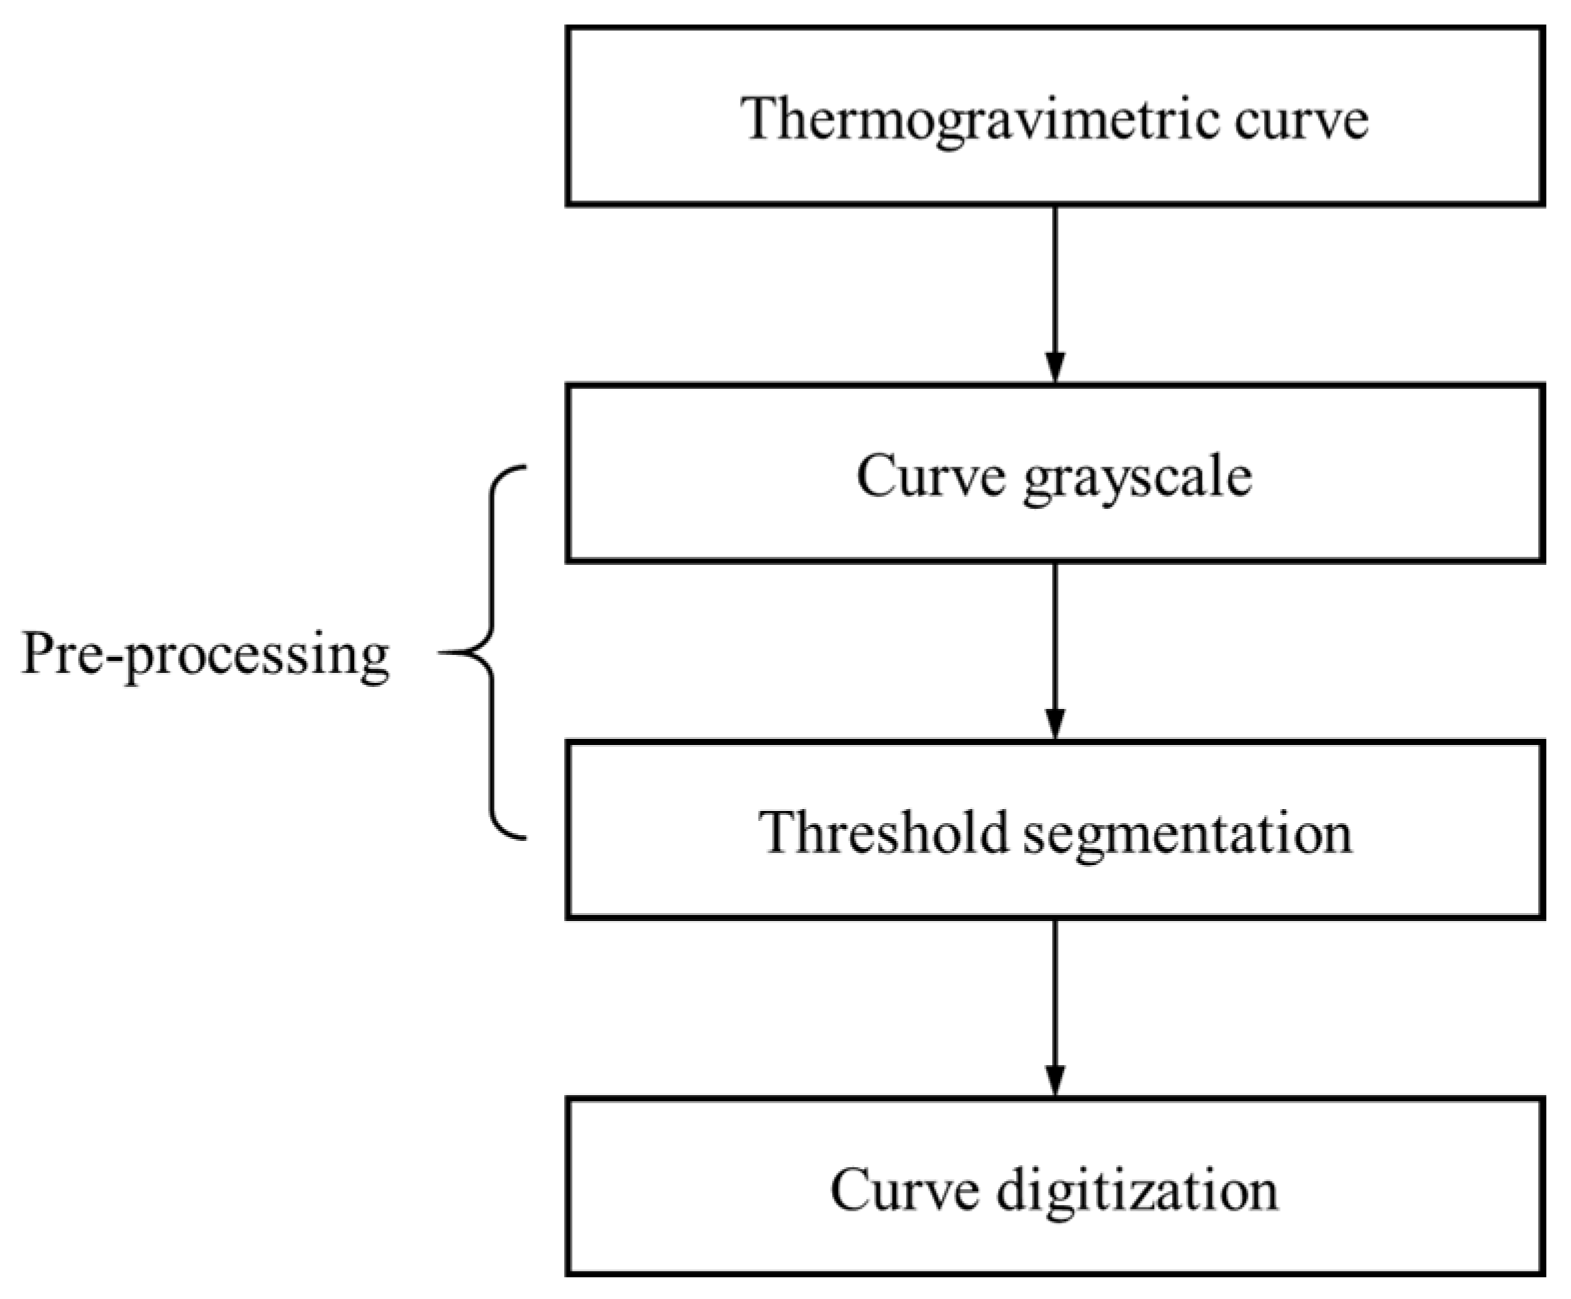
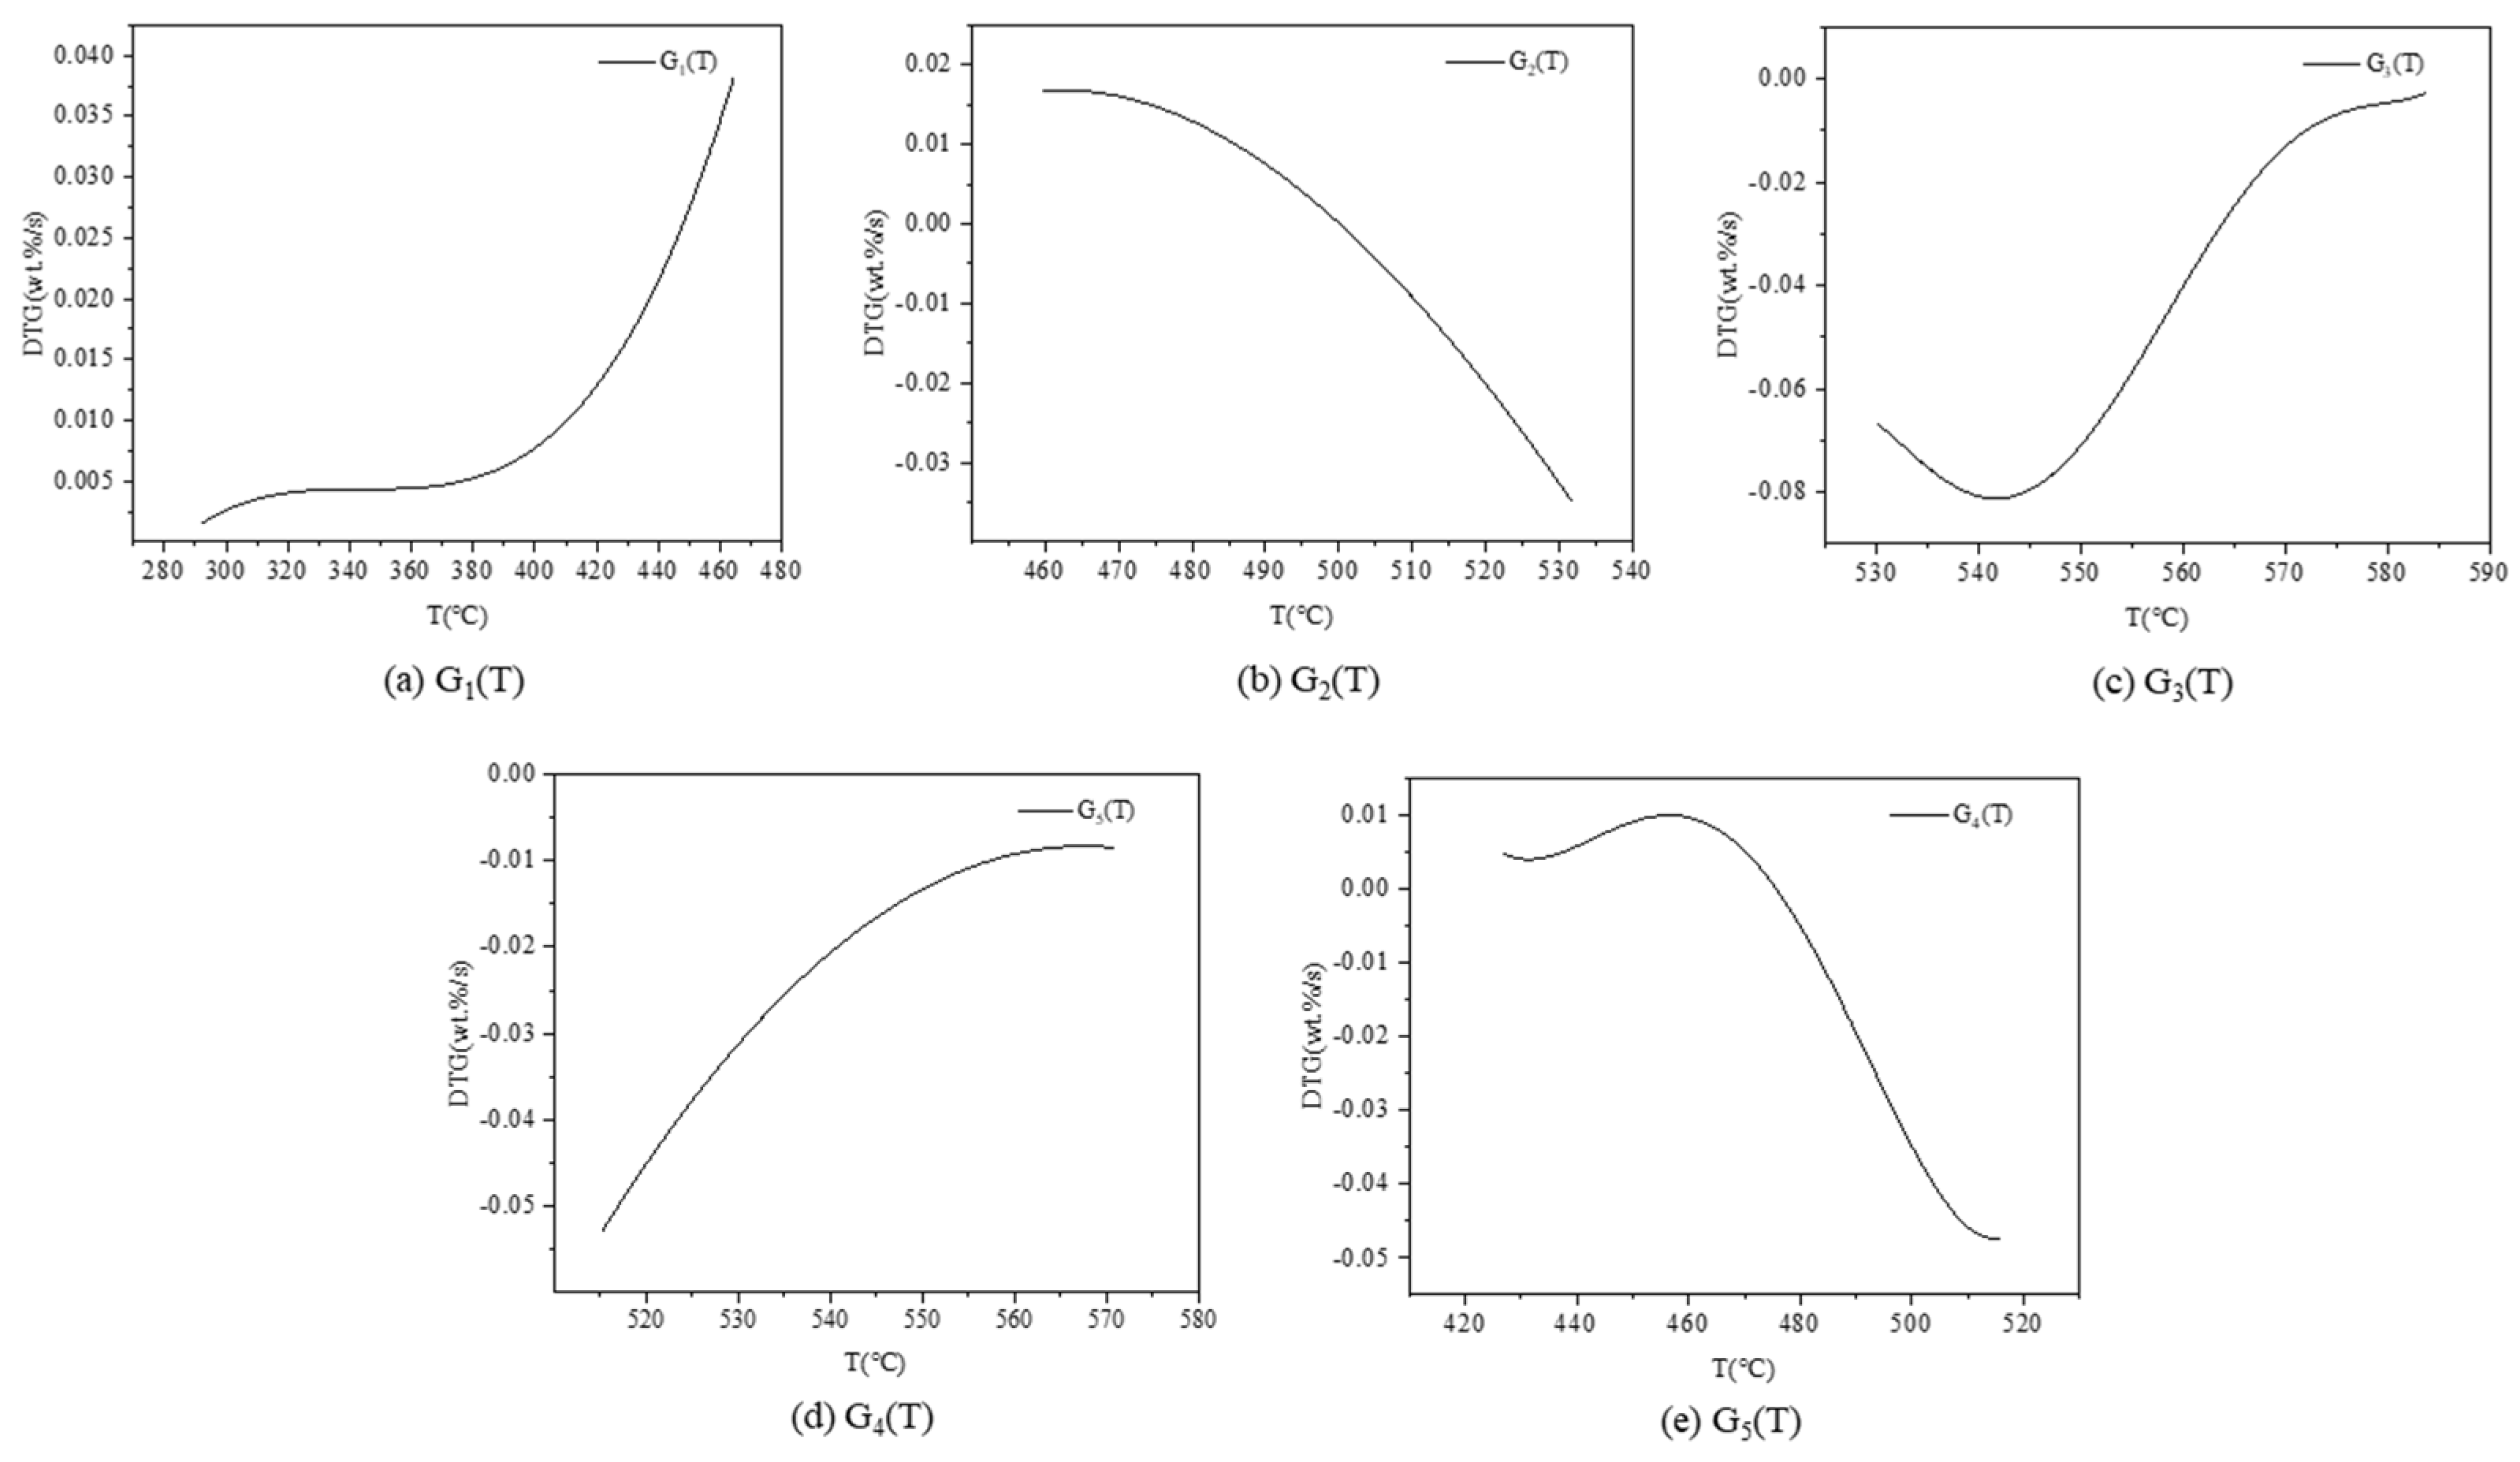
2.3. Thermogravimetric Curve Extraction

In this paper, the TCE method consists of three steps: curve grayscale, threshold segmentation, and curve digitization. Curve grayscale converts the original curve image into grayscale format. Thresholding separates the curve from the background in a grayscale image by assigning pixels as the background or curve based on a specified threshold. This separation allows the extraction of the curve, enabling subsequent processing and analysis. And curve digitization converts the extracted curve into numerical data. Figure 1 illustrates the TCE process.
Since the thermogravimetric curves had multiple colors, the color information of the thermogravimetric curves was not relevant to the present study. Hence, it was necessary to convert the thermogravimetric curve into grayscale, and the grayscale conversion algorithm is shown in Equation (2).
G r a y = 0.299 R + 0.587 G + 0.144 B
where Gray, R, G, and B are grayscale pixel values, red pixel values, green pixel values, and blue pixel values, respectively.
Threshold segmentation was used to separate the thermogravimetric curve and the coordinate axis from the background. The threshold segmentation algorithm is shown in Equation (3).
g x , y = 1 f x , y t 0 f x , y < t
where (x, y) is pixel coordinates, f(x, y) is pixel value, and t is the threshold.
Finally, the extracted points on the image matrix needed to be converted into coordinate values of the thermogravimetric curve by Equation (4).
Y = Δ Y n y X = Δ X m x f ( x , y ) = 1
where X and Y are abscissae and ordinate values of the thermogravimetric curve. Δ X and Δ Y are the lengths of the horizontal and vertical axes of the thermogravimetric curve, respectively. n and m are the number of rows and columns of the image matrix.

2.4. Artificial Neural Networks

Artificial neural networks (ANNs) are a type of data-driven approach used to determine nonlinear relationships between input and output variables. They are widely used in simulating physical systems by applying neural network structures and recognizing patterns in a system after learning from a set of training data. The basic structure of an ANN consists of three independent layers: input, hidden, and output. In this paper, the ANNs used had one input layer, two hidden layers, and one output layer. The input layer consists of temperature and mixing ratio, and DTG (the weight loss rate) was set as the output layer. The activation function used for the hidden layer was the rectified linear unit (ReLU) function, and the optimal number of hidden layers was determined using a grid search. The number of iterations was set to 1000 steps, and the batch size was set to 64. An early stop strategy was implemented to prevent overfitting, whereby training stopped and the model was saved when the loss value stopped decreasing for 10 rounds with the validation set. The mean squared error (MSE) loss function was used, with default values for all other parameters. The performance of the ANN model was evaluated using mean absolute error (MAE), MSE, and R-squared (R2). The best ANN model had a high R2 value and small MSE and MAE values [19].
M S E = 1 n i = 1 n y ^ i y i 2
M A E = 1 n i = 1 n y ^ i y i
R 2 = y ^ i y ¯ 2 y i y ¯ 2
where y ^ i is the value of prediction, y i is the observed value, and y ¯ is the mean of all observed values.

3. Results and Discussion

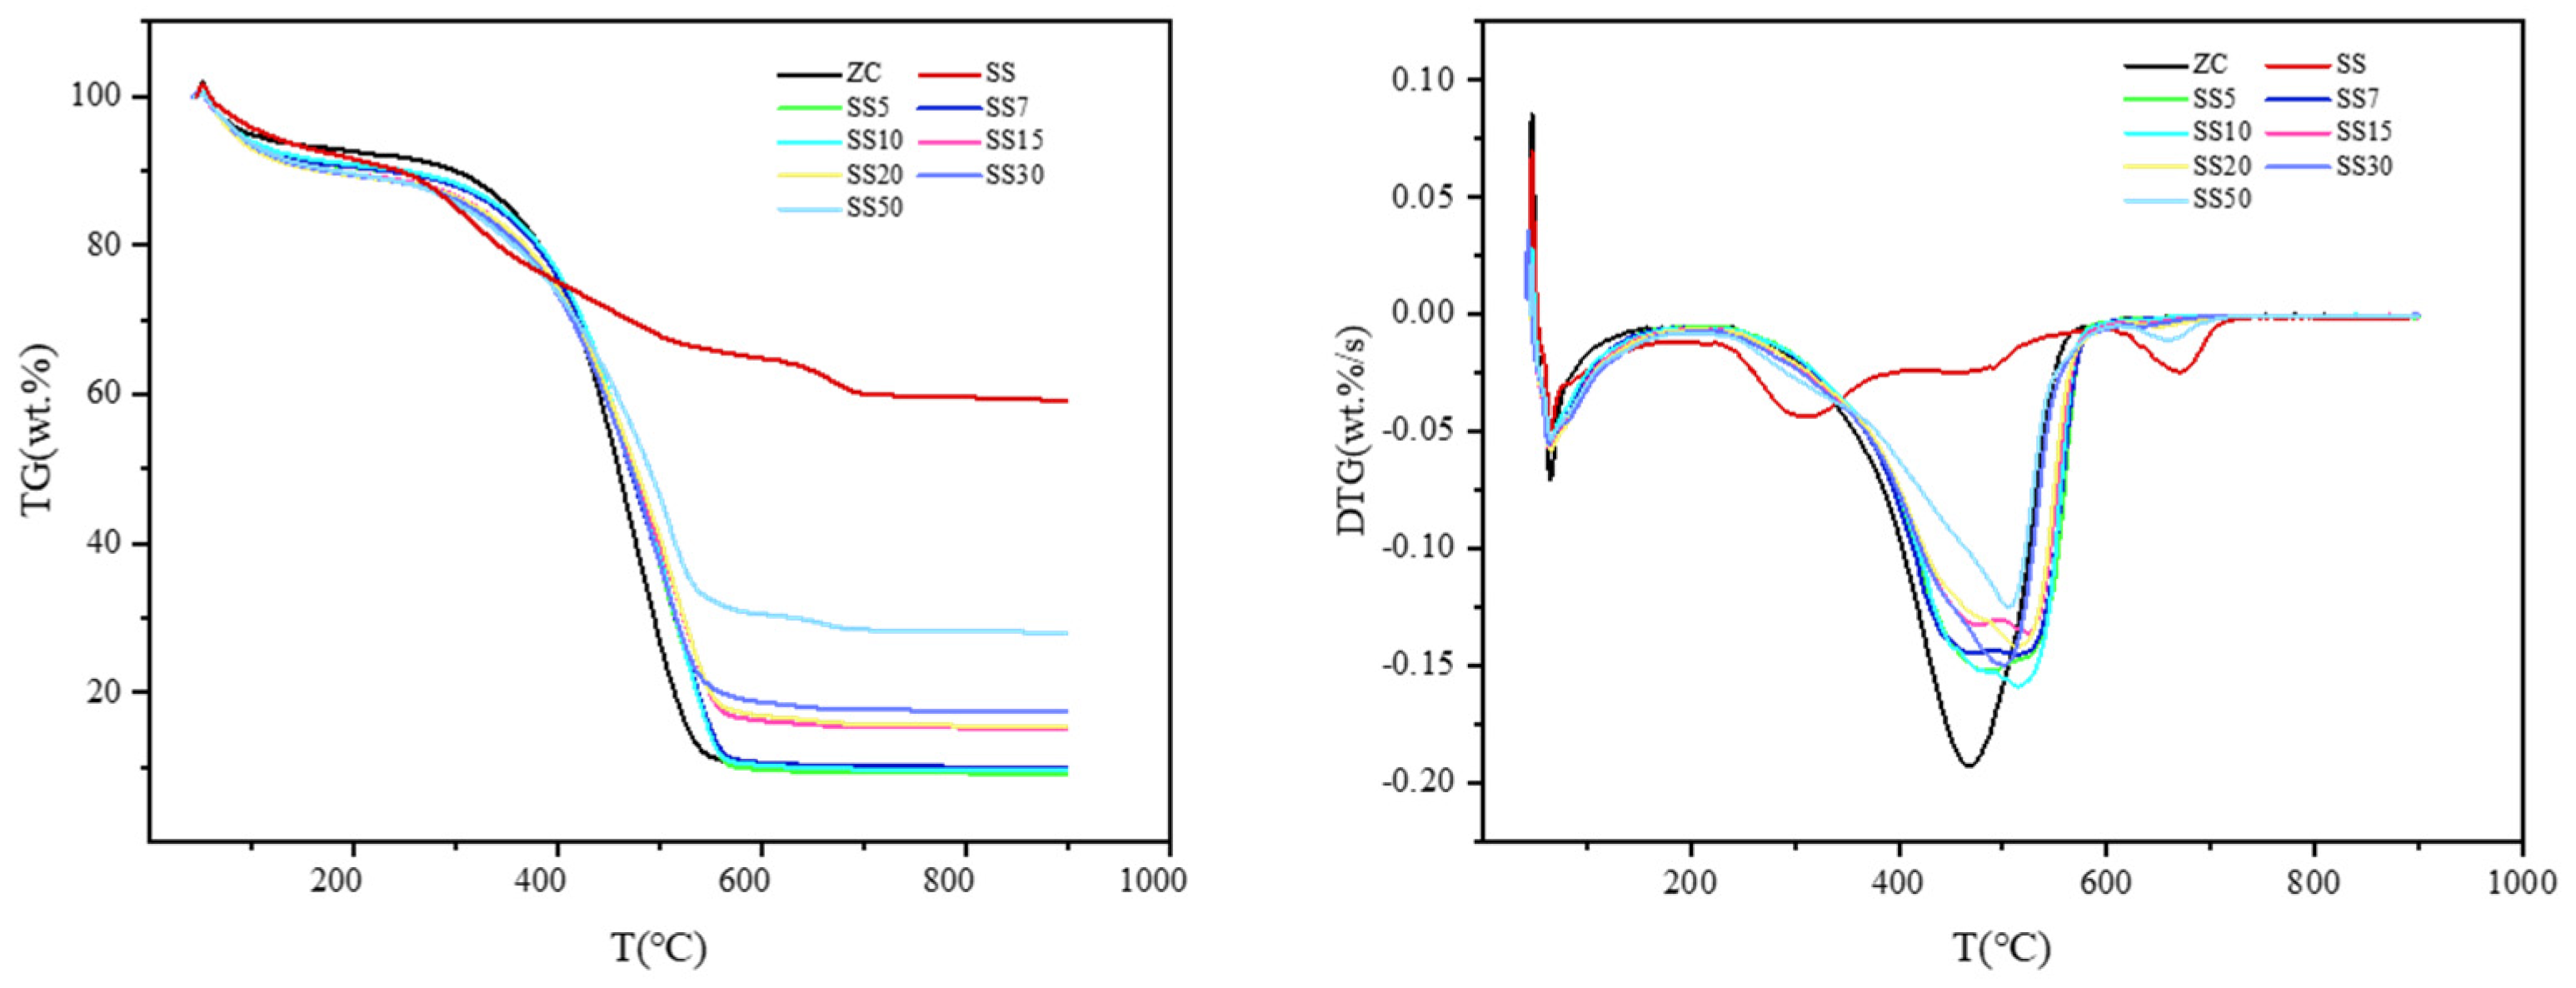
3.1. Co-Combustion Characteristics

During the experiment, TG represents the total mass loss of the samples, while DTG represents the rate at which the mass loss occurs. Figure 2 displays the TG and DTG curves of sludge and coal, and their different combustion characteristics are obvious. There are four weight loss stages observed in sludge. The initial stage of weight loss (before 200 °C) is caused by the volatilization of free water and chemically bound water [20]. The second stage (200–400 °C) is primarily caused by the combustion of volatiles. The third stage exhibits a shoulder peak between 400–600 °C, which is primarily because the combustion of semi-volatile substances lags behind that of volatile substances. Fixed carbon and refractory organic matter are primarily combusted at the fourth stage (600–730 °C) [21]. The weight loss behavior of coal is similar to that of sludge at temperatures below 200 °C. However, the DTG curve of coal only shows a weight loss peak after 200 °C due to the combustion of volatile and fixed carbon in coal, which has no obvious boundaries. Fixed-carbon combustion becomes prevalent at this stage. Additionally, the TG curves of both sludge and coal slightly rise during the initial heating stage due to oxygen chemisorption on the sample surface.
The TG and DTG curves of the sludge–coal mixture lie between those of sludge and coal and progressively shift towards coal as the percentage of sludge decreases. Within the temperature range of 200 °C to 410 °C, the weight loss rate of the mixture escalates as the proportion of sludge rises, primarily due to the incineration of sludge volatiles at this temperature. This enhances the reaction intensity of thermal decomposition at lower temperatures [22]. After that, the weight loss rate of the mixture dwindles with an increase in the percentage of sludge in the mixture, owing to the relatively low volatility and fixed carbon content of the sludge. When the blending ratio of the sludge is less than 15%, there is no significant difference between the weight loss of the blend and that of coal. At this point, the mixture is dominated by coal, and the influence of sludge is minimal. However, the weight loss of the mixture decreases significantly when the blending ratios are greater than 15%.
In addition, the combustion characteristics of the mixture are similar to those of coal, but more minerals are present in the residual residue after the sludge co-combustion. According to the DTG curve, the peak of the mixture before 600 °C is similar to coal. With the increase in the sludge blending ratio, the peak of the mixture gradually shifts to the right, accompanied by a decrease in its magnitude. This suggests that the addition of sludge reduces the combustion intensity of coal. Notably, when the blending ratio of sludge exceeds 30%, the DTG curve exhibits a prominent peak after 600 °C. This peak primarily arises from the decomposition and combustion of refractory organic matter present in the sludge.
Table 3 shows the combustion characteristics of the samples. The ignition temperature of ZC surpasses the ignition temperature of SS by 126.768 °C, indicating that sludge undergoes pyrolysis and combustion at lower temperatures compared to coal. This is because the chemical bonds of organic compounds like proteins and carbohydrates in sludge are weaker than those in coal [7]. Consequently, these compounds undergo thermal decomposition and combustion reactions at lower temperatures, as reported in previous studies [23,24]. Furthermore, the ignition temperature decreases significantly as the sludge blending ratio increases. The addition of sludge contributed to the reduction in the ignition temperature of the mixture, and it has a significant beneficial effect on coal-fired boiler ignition. However, the increase in the sludge blending ratio leads to a significant decrease in the comprehensive combustion index, from 10% at 9.14 × 10⁻⁹ wt.%2/(°C3s2) to 50% at 4.56 × 10⁻⁹ wt.%2/(°C3s2). This indicates that excessive sludge incorporation results in a decrease in the comprehensive combustion performance of the mixture.

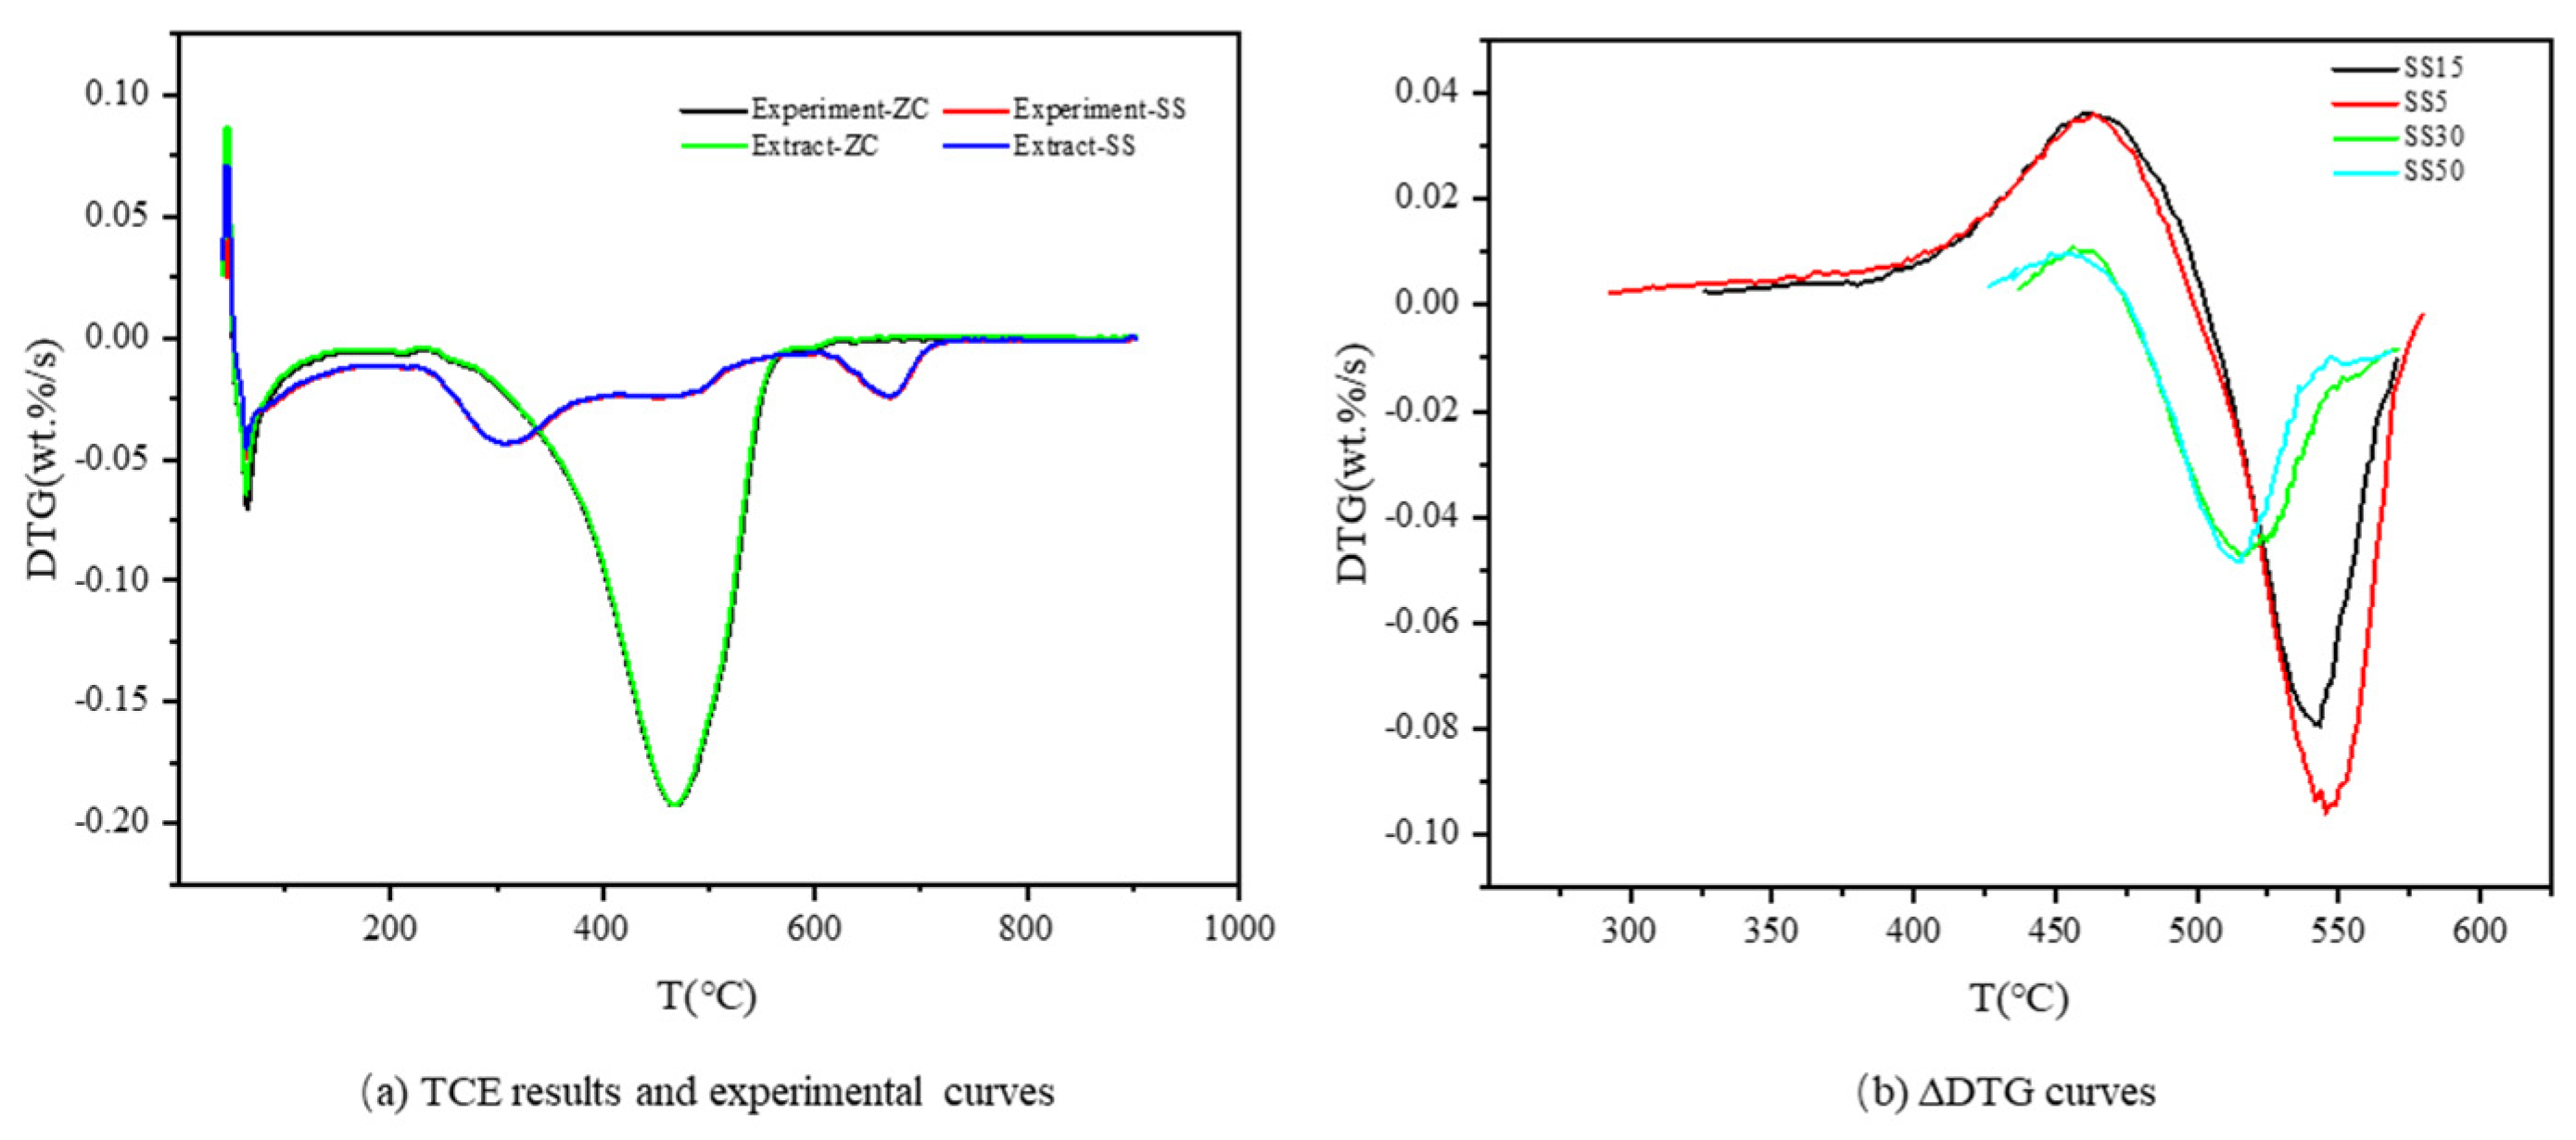
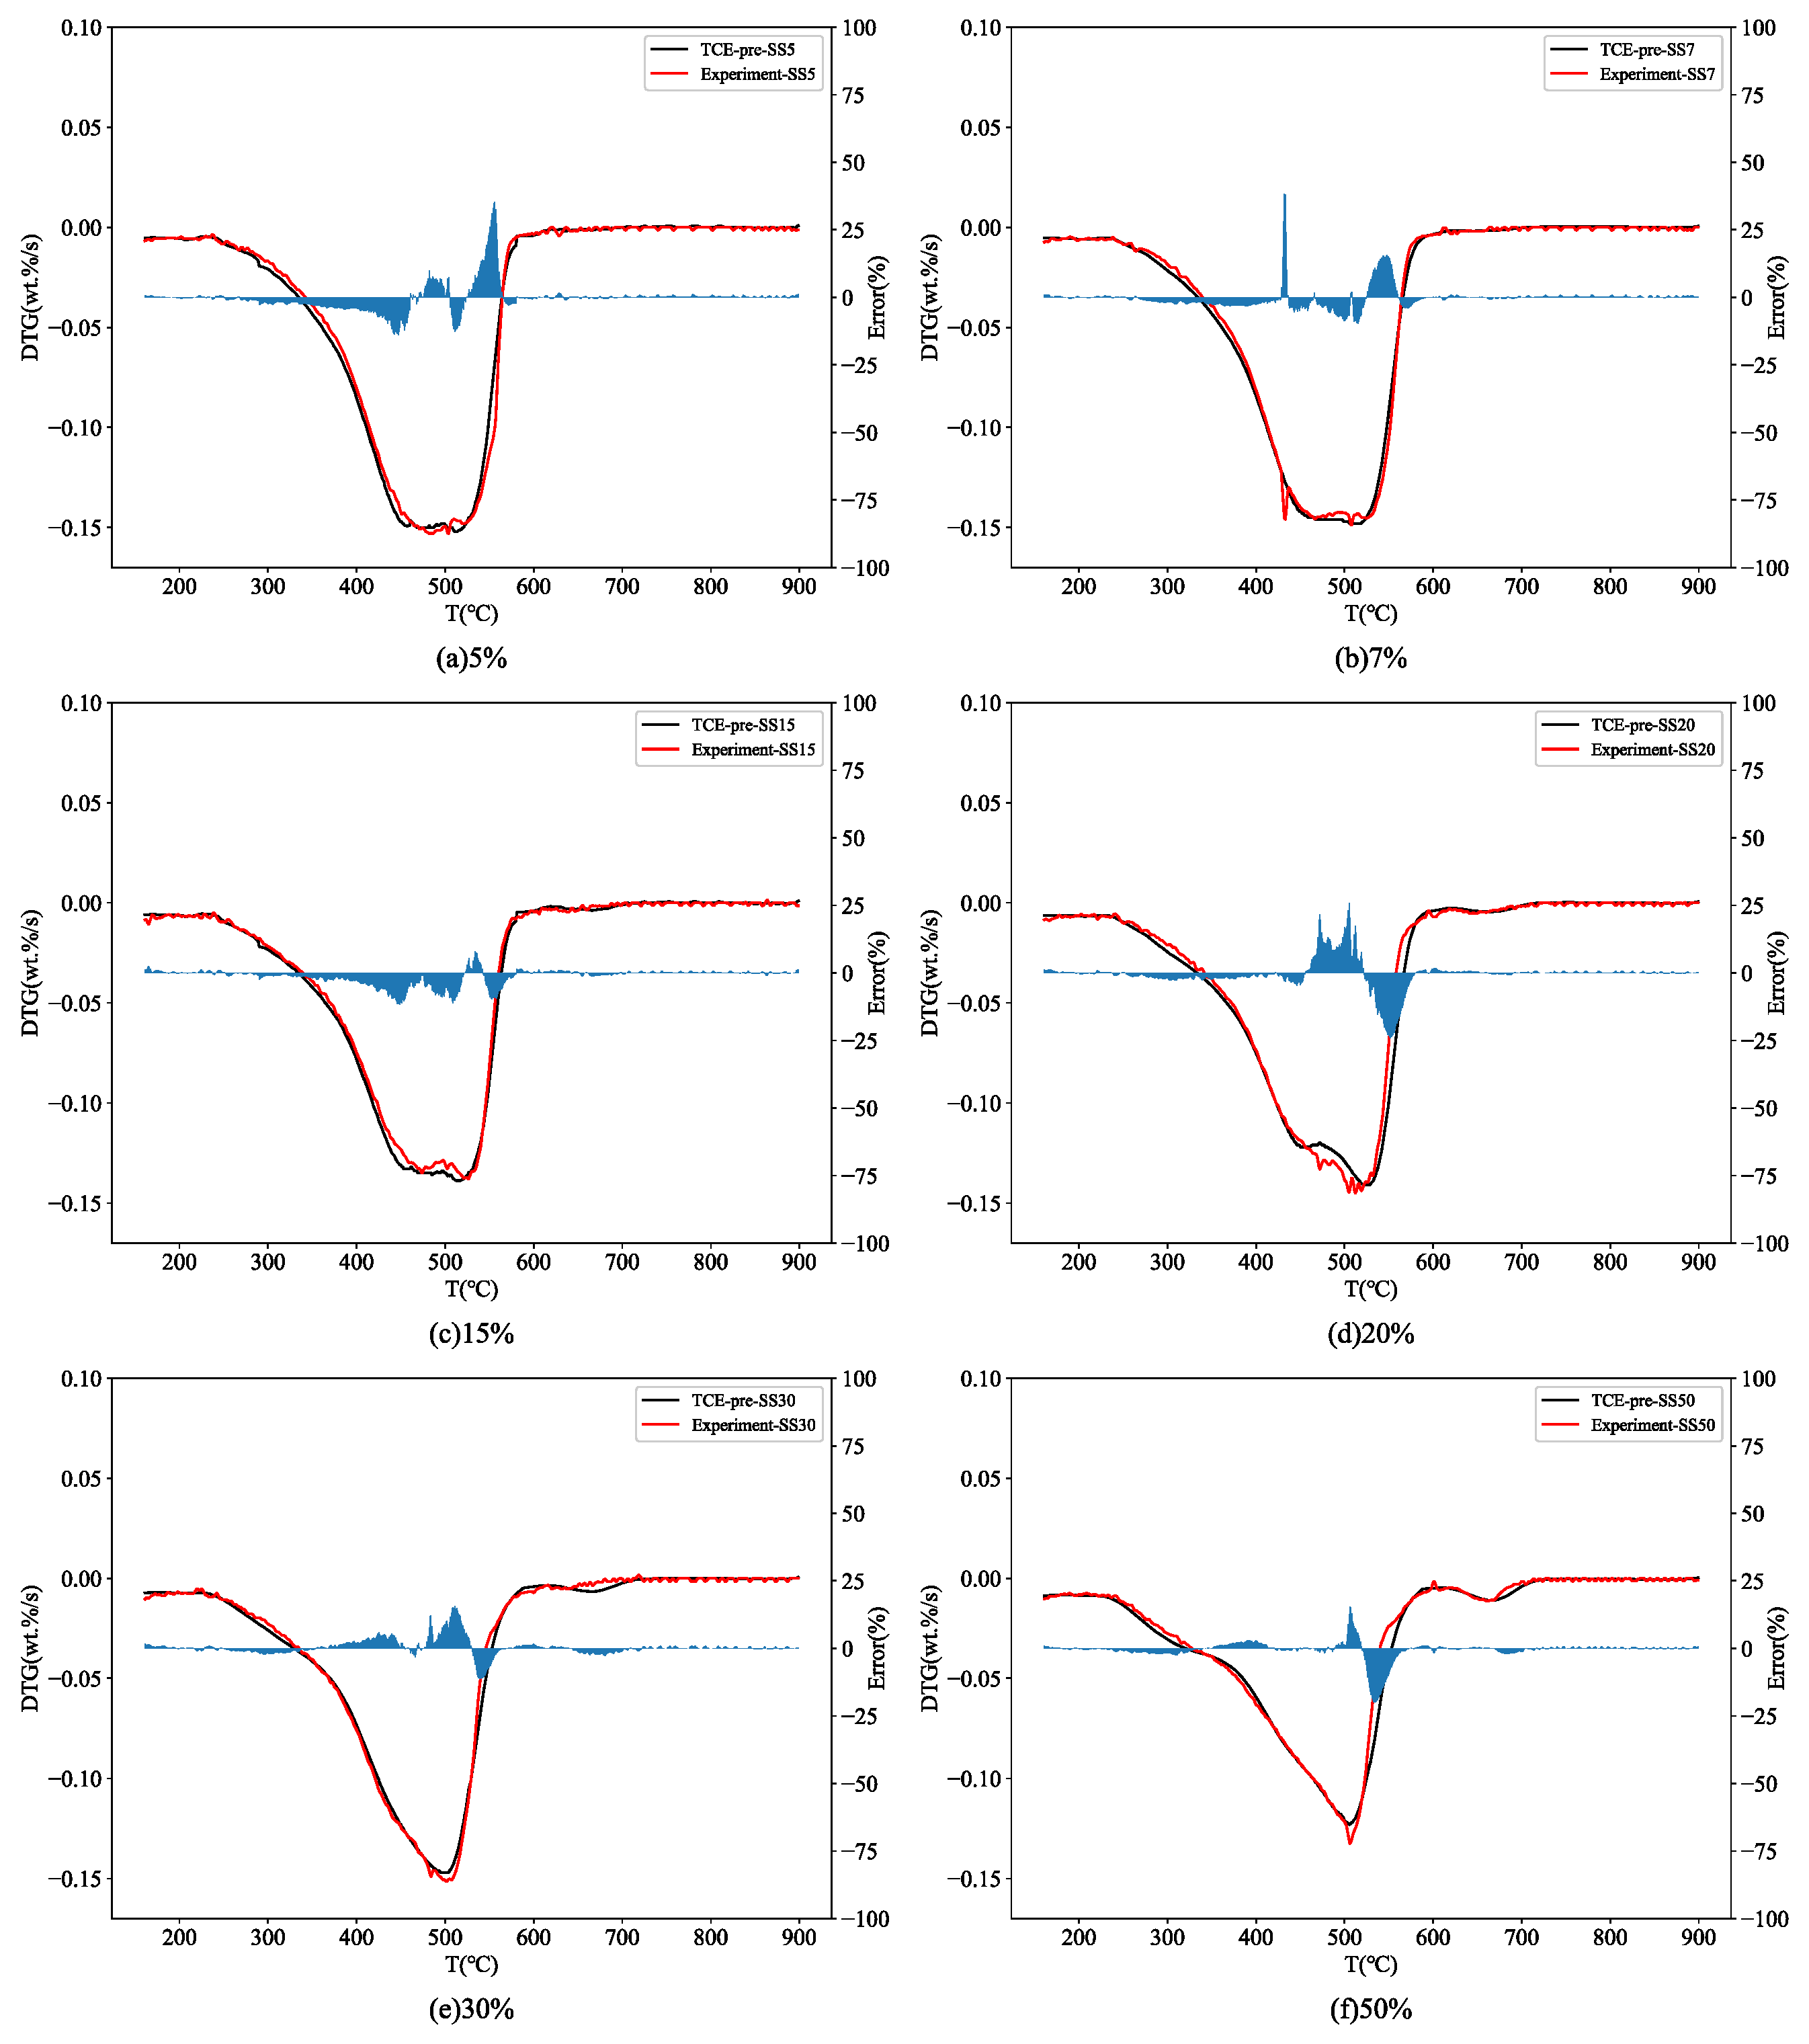
3.2. Thermogravimetric Curve Extraction

The thermogravimetric curves of sludge and coal were extracted to further discuss the synergistic effect of the co-combustion of sludge and coal and fully use the thermogravimetric curve data. It can be seen from Figure 3 that the extracted results are consistent with the experimental curve. Figure 4 shows the co-pyrolysis experimental curve and theoretical calculation curve. The theoretical calculation curve is obtained by the linear addition of the TCE results for sludge and coal. The equation for this process is represented as Equation (8):
D T G Theory , m i x = ( 1 p ) D T G Theory ZC + p D T G Theory SS
where DTGTheory-ZC and DTGTheory-SS are the TCE results of coal and sludge, respectively, and p is the blending ratio of SS.
Figure 4 shows the combustion characteristics of the sludge–coal mixture and reveals a remarkable synergistic effect. The extent of the synergistic effect varies with the blending ratio of sludge and coal. Notably, the synergistic effect of co-combustion has a differential impact on various temperature ranges, consistent with earlier findings [25,26]. Coimbra et al. [25] studied the synergistic effect between sludge and coal by comparing theoretically calculated curves with experimental curves. They found that the synergistic effect is affected by the temperature range and blending ratio.

3.3. Thermal Behavior Prediction
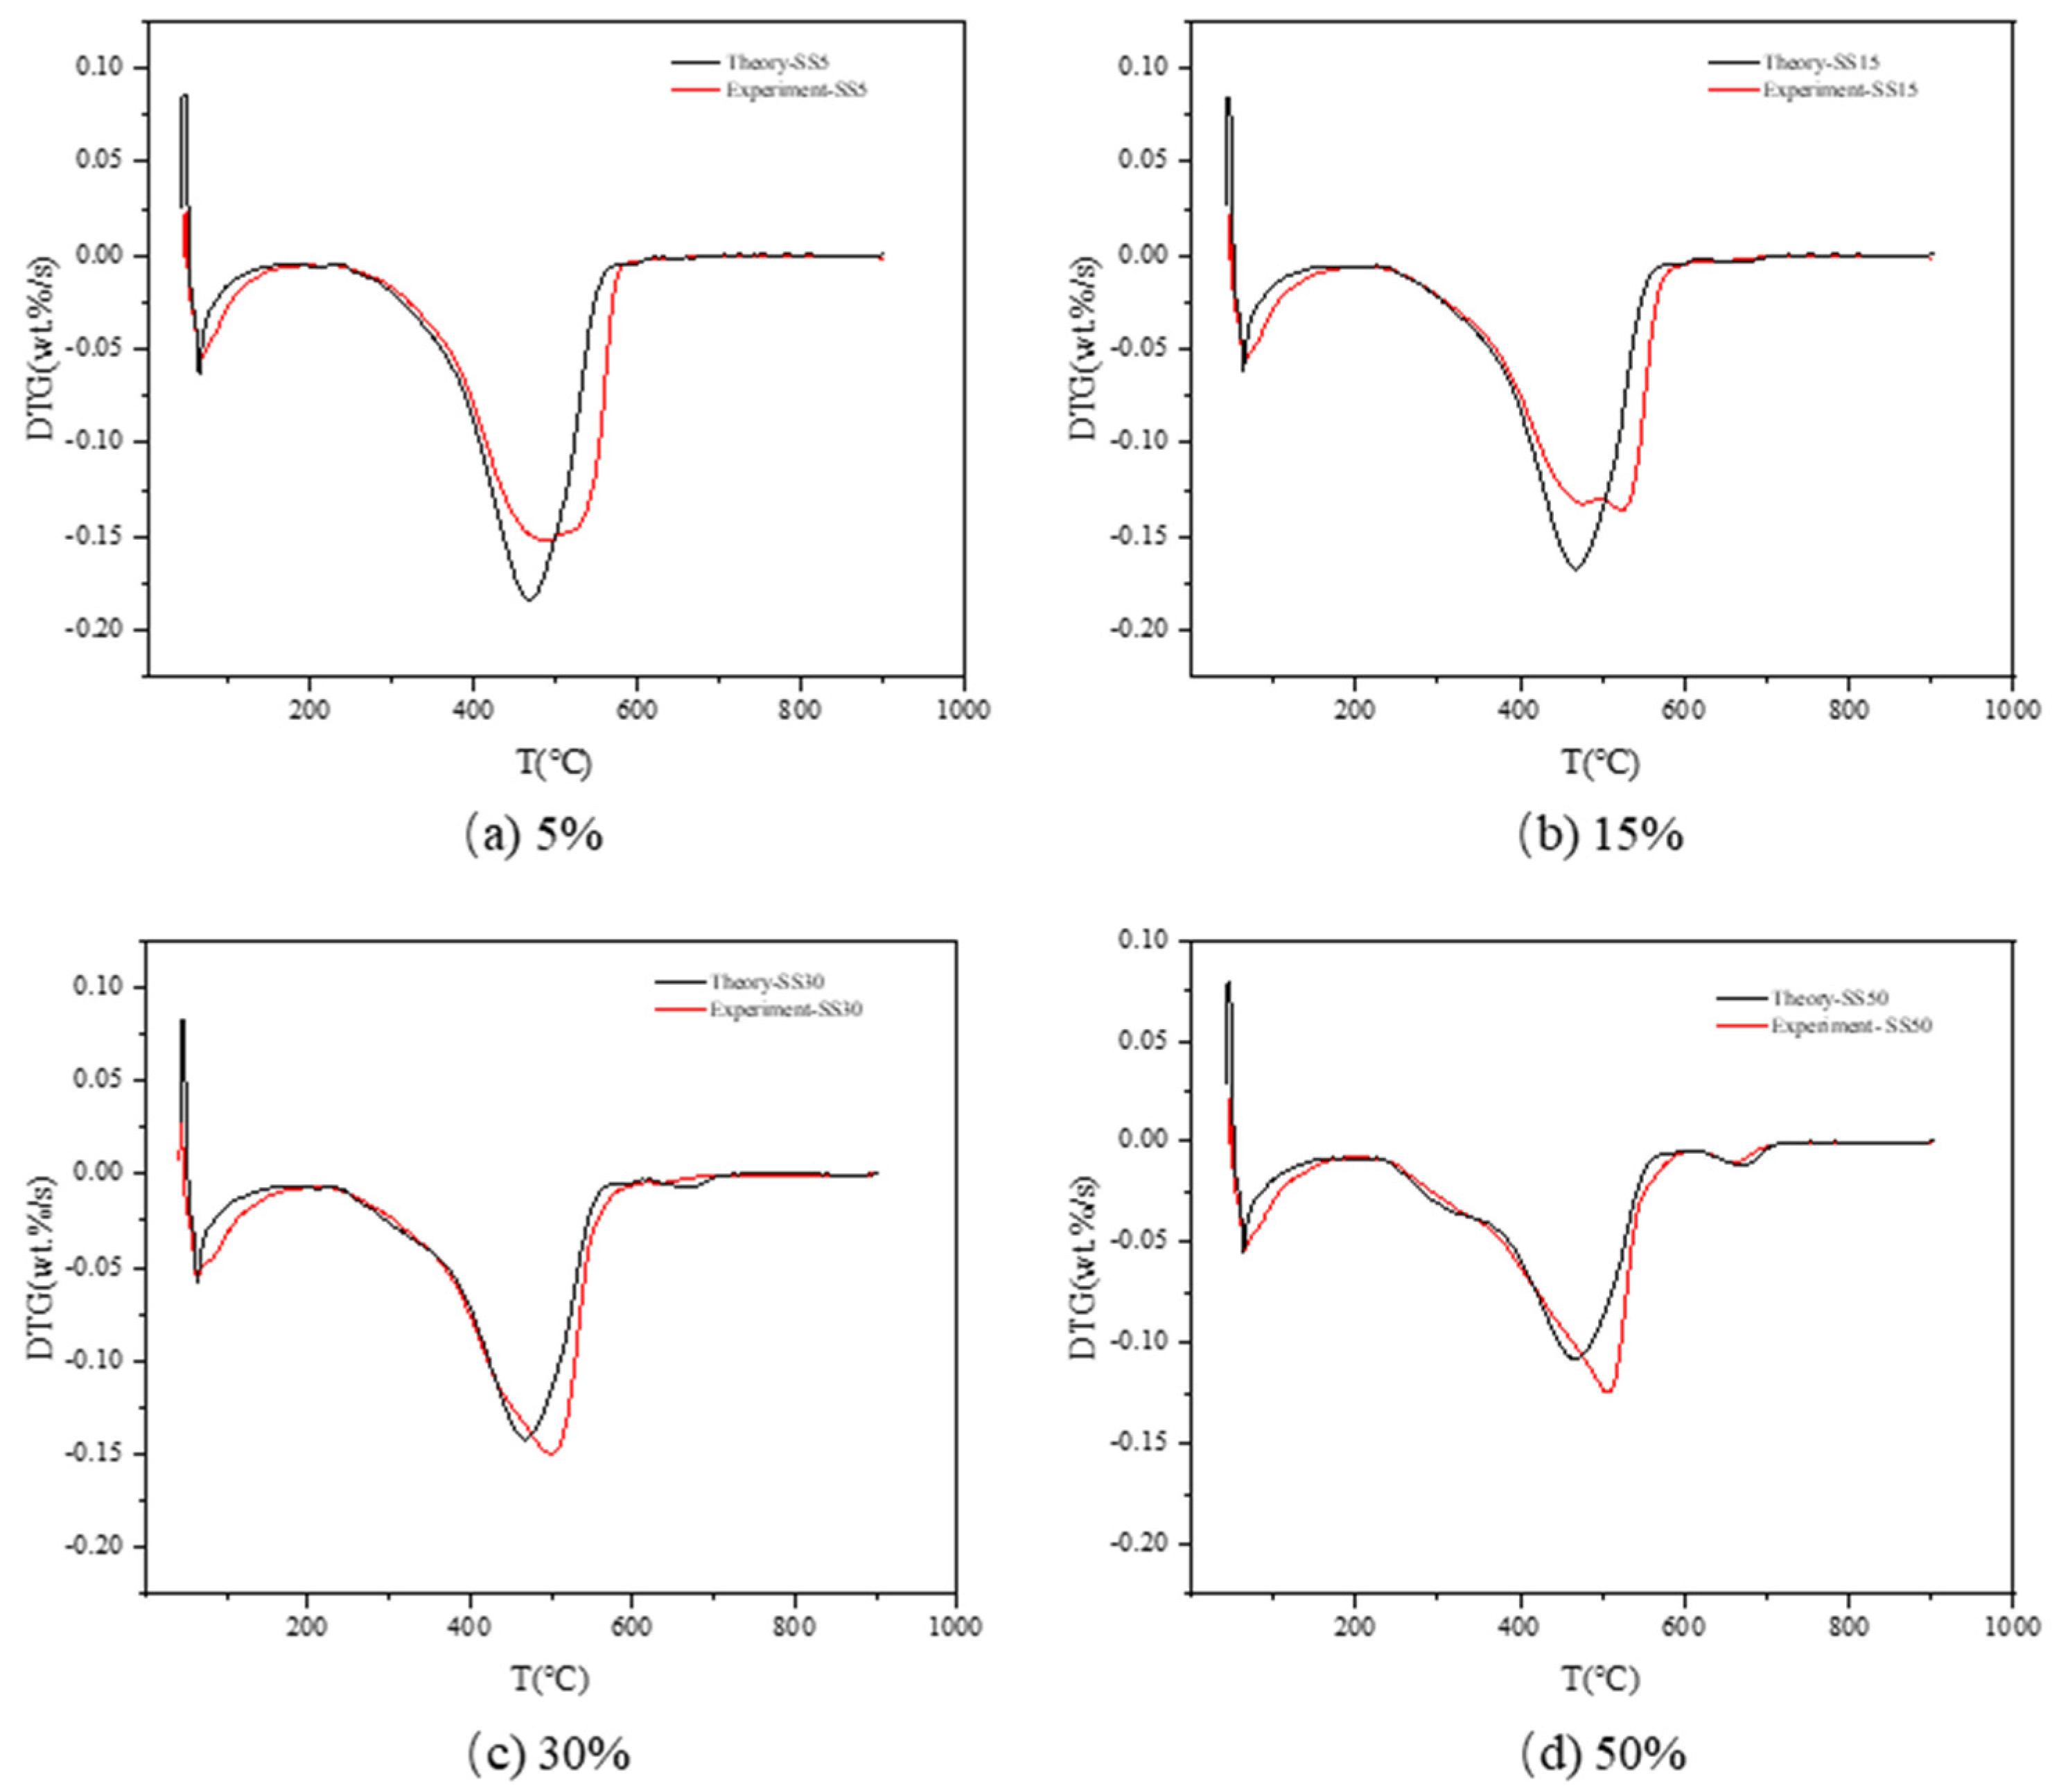
3.3.1. TCE

Figure 3 shows Δ D T G of the theoretical calculation curve and experimental curve, Δ D T G obtained by Equation (9):
Δ D T G = D T G Experiment D T G Theory
where DTGExperiment and DTGTheory are the experimental curves and theoretical calculation curves, respectively.
The deviation between the theoretically calculated and experimental curves was primarily influenced by the temperature and blending ratio of sludge and was most pronounced within the range of 300–600 °C. The synergistic effect exhibited a slight inhibition on the pyrolysis of sludge and coal within the temperature range of 300–460 °C, which can be attributed to the influence of sludge pyrolysis products. Sludge tar is one of the main products of sludge pyrolysis [27]. During co-combustion, viscous tar produced by sludge may adhere to the coal surface and hinder the precipitation of volatiles. However, as volatiles continue to decompose and the tar gasifies during the pyrolysis process, the inhibitory effect gradually disappears. Within the temperature range of 460–600 °C, the synergistic effect mainly promotes co-combustion due to the promotion of fixed carbon combustion. This promotion is mainly influenced by the inorganic components in sludge. The combustion rate of fixed carbon is related to oxygen absorption. During combustion, metal and semi-metal components can capture atmospheric oxygen through surface cavities, accelerating oxygen transfer to the fixed carbon surface and increasing the combustion rate.
The blending ratio and temperature influence the synergistic effect of the mixture. Hence, a nonlinear regression DTG curve prediction model is established based on the DTG curve error analysis.
0 < p < 30 % D T G p r e = ( 1 p ) D T G T h e o r y Z C + p D T G T h e o r y S S + G 1 ( T ) 290 ° C < T 460 ° C D T G p r e = ( 1 p ) D T G T h e o r y Z C + p D T G T h e o r y S S + ρ G 2 ( T ) 460 ° C < T 530 ° C D T G p r e = ( 1 p ) D T G T h e o r y Z C + p D T G T h e o r y S S + ρ G 3 ( T ) 530 ° C < T 580 ° C
30 % < p < 50 % D T G p r e = ( 1 p ) D T G T h e o r y Z C + p D T G T h e o r y S S + G 4 ( T ) 425 ° C < T 515 ° C D T G p r e = ( 1 p ) D T G T h e o r y Z C + p D T G T h e o r y S S + ρ G 5 ( T ) 515 ° C < T 570 ° C
where DTGTheory-ZC and DTGTheory-SS are the TCE results of ZC and SS, respectively. p is the blending ratio of SS, ρ is the correction factor, and ρ = 1 + p and G1(T)–G5(T) are temperature-dependent correction curves, as shown in Figure 5.
The synergistic effect of co-combustion of coal and sludge mainly occurs in the temperature range of 300 °C to 600 °C. The prediction results are shown in Figure 6. The agreement between the experimental and predicted DTG curves in the temperature range of 300 °C to 600 °C confirms the model’s accuracy. Table 4 presents the prediction results of (|dw/dt|)max, Tmax, and R2. The R2 values of the model are greater than 96.5%, and the maximum errors of (|dw/dt|)max and Tmax are 2.76% and 2.21%, respectively. These results demonstrate the ability of the model to predict the reaction characteristics of sludge and coal co-combustion.

3.3.2. ANN Models

The commonly used data split ratio is 8:2, which ensures a balanced division between the training and validation sets. To ensure representative sampling, two data sets (SS7 and SS30) were randomly selected as the testing sets. Therefore, the combustion data were divided into two groups, with 80% used for training and 20% (SS7 and SS30) used for testing. Before training, the min–max normalization technique was adopted. Table 5 shows the MSE, MAE, and R2 of different ANN models. The second column (layer size) indicates the number of neurons in the respective layers. Among these models, ANN 24 achieved the smallest MSE (0.000467) and MAE (0.010857), as well as the largest R2 value (0.9746). It is important to note that prediction accuracy tends to be low when the number of neurons is small or when there is a large difference in the number of neurons between the hidden layers, as mentioned in previous studies [14,16]. The model accuracy has increased but has leveled off or even overfitted [28,29] as the number of neurons increases. ANN 24 could be considered the best neural network model for predicting the DTG of CC and ZC. Figure 7 shows the experimental values of SS7 and SS30 and the predicted values predicted by ANN 24. Table 6 shows the prediction results of (|dw/dt|)max, Tmax, and the regression coefficients R2. Notably, the neural network model exhibits significantly worse performance within the temperature range of 400–530 °C compared to other temperature ranges. This temperature range is the most intense phase of combustion [30] and has significant variations in DTG for different mixture ratios, which results in the highest prediction deviation.
Figure 7 demonstrates that ANN 24 fits DTG experimental values well at different blending ratios (7% and 30%), with R2 values reaching 94% and 99%, respectively. Although the ANN model can predict effectively after training, the TCE method outperforms the ANN model in predicting DTG values, as indicated in Table 3. In SS7 samples, the (|dw/dt|)max and Tmax errors of ANN 24 are higher than those of the proposed method (2.68%, 1.61%, 2.01%, and 2.48%, respectively). In contrast, R2 values are lower (99.1% vs. 99.7%). Similarly, in SS30 samples, the (|dw/dt|)max and Tmax errors of ANN 24 are higher than those of the proposed method (9.93%, 2.66%, 2.65%, and 0.31%, respectively), while R2 values are lower (94.9% vs. 99.7%). Therefore, the TCE method has a relatively higher prediction accuracy than the ANN model in predicting DTG values for sludge co-combustion. At the same time, while ANN models use large data for model training [31], the TCE method needs fewer data and is interpretable in the prediction process. However, the ANN model has a simpler prediction process and is suitable when large amounts of data are available and fast prediction is required.

4. Conclusions

This paper investigated the prediction of sludge and coal co-combustion characteristics using thermogravimetric curve extraction and artificial neural network models. These were not presented before in the study about the co-combustion characteristics and prediction of SS-ZC. The co-combustion characteristics of SS-ZC were studied, and the combustion synergistic effect was different in the temperature ranges of 300–460 °C, 460–530 °C, and 530–600 °C. Therefore, based on the curve extraction and TGA, a nonlinear regression thermal behavior prediction model for coal and sludge co-combustion was proposed, in which the R2 of DTG prediction results under different sludge blending ratios was greater than 96.5%. In addition, the errors of the peak and peak temperatures of the predicted and experimental curves were calculated. The maximum for different sludge blending ratios was 2.76% and 2.21%, respectively. Finally, compared with the artificial neural network, the proposed method better predicted DTG values for SS7 and SS30 samples in terms of the R2 evaluation index (99.7% vs. 99.1% and 99.7% vs. 94.9%, respectively). This shows the TCE method has relatively higher prediction accuracy than the ANN model in predicting DTG values for sludge co-combustion.
The results obtained will help to further understand the co-combustion process of SS-ZC and provide reference and guidance for the operation of incinerators blended with sludge. Therefore, future research can be conducted to explore co-combustion prediction using alternative methods such as LSTM and image recognition techniques. Moreover, based on the accuracy of the co-combustion characteristics prediction, further investigation can be carried out to forecast the operating conditions and other parameters of the incinerator, leading to the optimization of incinerator control.

Author Contributions

Investigation, C.W. and J.L.; methodology, C.W. and J.L.; writing—original draft preparation, C.W. and J.L.; resources, Q.H., X.L. (Xiaoqing Lin) and W.Y.; writing—review and editing, X.L. (Xiaoqing Lin), Y.Y. and Y.M.; data curation, H.Y.; funding acquisition, X.L. (Xiaodong Li) and J.Y.; supervision, X.L. (Xiaoqing Lin), X.L. (Xiaodong Li) and J.Y. All authors have read and agreed to the published version of the manuscript.

Funding

This study was supported by the “Pioneer” and “Leading Goose” R&D Program of Zhejiang (2022C03016) and the Fundamental Research Funds for the Central Universities (K20220145).

Data Availability Statement

Data generated or analyzed during this study are available from the corresponding author upon reasonable request.

Conflicts of Interest

The authors declare no conflict of interest.

Nomenclature

TGAThermogravimetric analysisMMoisture, wt%
TCEThermogravimetric curve extractionAAsh, wt%
ANNArtificial neural networksVVolatile matter, wt%
DTGThe weight loss rateFCFixed carbon, wt%
MAEMean absolute errorCCarbon, wt%
MSEMean squared errorHHydrogen, wt%
TGThe total mass lossNNitrogen, wt%
ZCThe mixture
(0% sludge and 100% coal)
SSulfur, wt%
SSThe mixture
(100% sludge and 0% coal)
OOxygen, wt%

References

  1. Park, J.M.; Keel, S.; Yun, J.; Yun, J.H.; Lee, S.-S. Thermogravimetric study for the co-combustion of coal and dried sewage sludge. Korean J. Chem. Eng. 2017, 34, 2204–2210. [Google Scholar] [CrossRef]
  2. Liu, J.-z.; Wang, R.-k.; Gao, F.-y.; Zhou, J.-H.; Cen, K.-F. Rheology and thixotropic properties of slurry fuel prepared using municipal wastewater sludge and coal. Chem. Eng. Sci. 2012, 76, 1–8. [Google Scholar] [CrossRef]
  3. Merdun, H.; Laougé, Z.B.; Çığgın, A.S. Synergistic effects on co-pyrolysis and co-combustion of sludge and coal investigated by thermogravimetric analysis. J. Therm. Anal. Calorim. 2021, 146, 2623–2637. [Google Scholar] [CrossRef]
  4. Kang, J.H.; Kang, J.Y.; Lee, S.H.; Kim, B.T.; Lee, N.-H. A Study on the Evaluation of Fuel Characteristic and Economic Benefit for Co-combustion of Dried Sewage Sludge with Coal. J. Korea Org. Resour. Recycl. Assoc. 2014, 22, 11–19. [Google Scholar]
  5. Yang, Z.; Zhang, Y.; Liu, L.; Wang, X.; Zhang, Z. Environmental investigation on co-combustion of sewage sludge and coal gangue: SO2, NOx and trace elements emissions. Waste Manag. 2016, 50, 213–221. [Google Scholar] [CrossRef] [PubMed]
  6. Fu, B.; Liu, G.; Mian, M.M.; Zhou, C.; Sun, M.; Wu, D.; Liu, Y. Co-combustion of industrial coal slurry and sewage sludge: Thermochemical and emission behavior of heavy metals. Chemosphere 2019, 233, 440–451. [Google Scholar] [CrossRef] [PubMed]
  7. Wang, Y.; Jia, L.; Guo, J.; Wang, B.; Zhang, L.; Xiang, J.; Jin, Y. Thermogravimetric analysis of co-combustion between municipal sewage sludge and coal slime: Combustion characteristics, interaction and kinetics. Thermochim. Acta 2021, 706, 179056. [Google Scholar] [CrossRef]
  8. Wu, J.; Wang, B.; Cheng, F. Thermal and kinetic characteristics of combustion of coal sludge. J. Therm. Anal. Calorim. 2017, 129, 1899–1909. [Google Scholar] [CrossRef]
  9. Xiao, F.; Zhang, H.; Ma, P.; Wang, C. Fault diagnosis of variable rotating speed rolling bearing using generalized features based on MTFCE. Vib. Shock. 2022, 41, 152–159+188. [Google Scholar] [CrossRef]
  10. Yochum, M.; Renaud, C.; Jacquir, S. Automatic detection of P, QRS and T patterns in 12 leads ECG signal based on CWT. Biomed. Signal Process. Control. 2016, 25, 46–52. [Google Scholar] [CrossRef]
  11. Chen, J.; Liu, J.; He, Y.; Huang, L.; Sun, S.; Sun, J.; Chang, K.; Kuo, J.; Huang, S.; Ning, X. Investigation of co-combustion characteristics of sewage sludge and coffee grounds mixtures using thermogravimetric analysis coupled to artificial neural networks modeling. Bioresour. Technol. 2017, 225, 234–245. [Google Scholar] [CrossRef] [PubMed]
  12. Witek-Krowiak, A.; Chojnacka, K.; Podstawczyk, D.; Dawiec, A.; Pokomeda, K. Application of response surface methodology and artificial neural network methods in modelling and optimization of biosorption process. Bioresour. Technol. 2014, 160, 150–160. [Google Scholar] [CrossRef] [PubMed]
  13. Aghbashlo, M.; Peng, W.X.; Tabatabaei, M.; Kalogirou, S.A.; Soltanian, S.; Hosseinzadeh-Bandbafha, H.; Mahian, O.; Lam, S.S. Machine learning technology in biodiesel research: A review. Prog. Energy Combust. Sci. 2021, 85, 100904. [Google Scholar] [CrossRef]
  14. Ni, Z.S.; Bi, H.B.; Jiang, C.L.; Sun, H.; Zhou, W.L.; Tian, J.J.; Lin, Q.Z. Investigation of co-combustion of sewage sludge and coffee industry residue by TG-FTIR and machine learning methods. Fuel 2022, 309, 122082. [Google Scholar] [CrossRef]
  15. Muravyev, N.V.; Luciano, G.; Ornaghi, H.L.; Svoboda, R.; Vyazovkin, S. Artificial Neural Networks for Pyrolysis, Thermal Analysis, and Thermokinetic Studies: The Status Quo. Molecules 2021, 26, 3727. [Google Scholar] [CrossRef]
  16. Yildiz, Z.; Uzun, H.; Ceylan, S.; Topcu, Y. Application of artificial neural networks to co-combustion of hazelnut husk-lignite coal blends. Bioresour. Technol. 2016, 200, 42–47. [Google Scholar] [CrossRef]
  17. Mian, I.; Li, X.; Jian, Y.; Dacres, O.D.; Zhong, M.; Liu, J.; Ma, F.; Rahman, N. Kinetic study of biomass pellet pyrolysis by using distributed activation energy model and Coats Redfern methods and their comparison. Bioresour. Technol. 2019, 294, 122099. [Google Scholar] [CrossRef]
  18. SP, S.P.; Swaminathan, G.; Joshi, V.V. Energy conservation–A novel approach of co-combustion of paint sludge and Australian lignite by principal component analysis, response surface methodology and artificial neural network modeling. Environ. Technol. Innov. 2020, 20, 101061. [Google Scholar]
  19. Xie, C.; Liu, J.; Zhang, X.; Xie, W.; Sun, J.; Chang, K.; Kuo, J.; Xie, W.; Liu, C.; Sun, S. Co-combustion thermal conversion characteristics of textile dyeing sludge and pomelo peel using TGA and artificial neural networks. Appl. Energy 2018, 212, 786–795. [Google Scholar] [CrossRef]
  20. Yan, J.-d.; Cui, H.; Yang, J.; Liu, Z. Research on pyrolysis behavior of Yanzhou coal using TG/MS. Zhongguo Kuangye Daxue Xuebao 2003, 32, 102–106. [Google Scholar]
  21. Bifan, H.; Liao, W.; Chuan, H. Study on combustion characteristics and kinetics of Chongqing municipal sewage sludge. Proc. CSEE 2010, 30, 32–37. [Google Scholar]
  22. Liu, J.; Jiang, X.; Shen, J.; Zhang, H. Chemical properties of superfine pulverized coal particles. Part 1. Electron paramagnetic resonance analysis of free radical characteristics. Adv. Powder Technol. 2014, 25, 916–925. [Google Scholar] [CrossRef]
  23. Folgueras, M.B.; Díaz, R.M. Influence of FeCl3 and lime added to sludge on sludge–coal pyrolysis. Energy 2010, 35, 5250–5259. [Google Scholar] [CrossRef]
  24. Xiao, P.; Xu, L.; Wang, X.; Chang, Z. Co-pyrolysis characteristics of coal and sludge blends using thermogravimetric analysis. Environ. Prog. Sustain. Energy 2015, 34, 1780–1789. [Google Scholar] [CrossRef]
  25. Coimbra, R.N.; Paniagua, S.; Escapa, C.; Calvo, L.F.; Otero, M. Thermogravimetric analysis of the co-pyrolysis of a bituminous coal and pulp mill sludge. J. Therm. Anal. Calorim. 2015, 122, 1385–1394. [Google Scholar] [CrossRef]
  26. Shen, L.; Zhang, D.-K. An experimental study of oil recovery from sewage sludge by low-temperature pyrolysis in a fluidised-bed. Fuel 2003, 82, 465–472. [Google Scholar] [CrossRef]
  27. Lutz, H.; Romeiro, G.A.; Damasceno, R.N.; Kutubuddin, M.; Bayer, E. Low temperature conversion of some Brazilian municipal and industrial sludges. Bioresour. Technol. 2000, 74, 103–107. [Google Scholar] [CrossRef]
  28. Schmidhuber, J. Deep learning in neural networks: An overview. Neural Netw. 2015, 61, 85–117. [Google Scholar] [CrossRef] [PubMed]
  29. Hippert, H.S.; Pedreira, C.E.; Souza, R.C. Neural networks for short-term load forecasting: A review and evaluation. IEEE Trans. Power Syst. 2001, 16, 44–55. [Google Scholar] [CrossRef]
  30. Xu, T.; Wang, C.B.; Hong, D.K.; Li, S.; Yue, S. The synergistic effect during co-combustion of municipal sludge and coal: Experimental and ReaxFF molecular dynamic study. Energy 2023, 262, 125553. [Google Scholar] [CrossRef]
  31. Lee, J.G.; Jun, S.; Cho, Y.W.; Lee, H.; Kim, G.B.; Seo, J.B.; Kim, N. Deep Learning in Medical Imaging: General Overview. Korean J. Radiol. 2017, 18, 570–584. [Google Scholar] [CrossRef] [PubMed]
Figure 1. The TCE process.
Processes 11 02275 g001
Figure 2. TG and DTG curves.
Processes 11 02275 g002
Figure 3. TCE results and the ΔDTG curves.
Processes 11 02275 g003
Figure 4. Theoretical calculation and experimental curves of SS blending ratios of 5%, 15%, 30%, and 50%.
Processes 11 02275 g004
Figure 5. Correction curves of G1(T)–G5(T).
Processes 11 02275 g005
Figure 6. TCE prediction results.
Processes 11 02275 g006
Figure 7. Prediction results of ANN 24.
Processes 11 02275 g007
Table 1. Proximate and ultimate analysis.
SampleProximate Analysis (wt.%)Ultimate Analysis (wt.%)
MAVFCV/FCCHNSOC/H
SS2.6063.6333.570.20167.8512.071.861.410.2318.206.49
ZC1.683.6344.0650.630.8770.754.651.570.5517.1715.22
Table 2. Thermogravimetric experiment conditions.
ConditionValue
Temperatureroom temperature ~900 °C
Temperature accuracy±5 °C
Sample quality8 mg
Heating rate20 °C/min.
Air flow rate50 mL/min
Table 3. The combustion characteristic parameters.
Sample S × 1 0 9 dw / dt m a x dw / dt mean T i T b T m a x
ZC10.670.1930.053393.53617.17470.62
SS58.530.1520.054391.93615.88481.23
SS78.260.1430.054389.88608.80492.82
SS109.140.1580.054389.19612.35511.66
SS156.830.1360.045384.19612.03525.77
SS207.770.1400.050383.04611.71513.61
SS307.230.1490.048380.76682.63497.50
SS504.560.1230.037374.64703.64512.11
SS1.560.0440.019266.76750.21312.21
Table 4. The TCE prediction results of (|dw/dt|)max, Tmax, and R2.
Sample (|dw/dt|)max (wt.%/s)Tmax (°C)R2
SS5Predicted value−0.148487.1299.3%
Error (%)2.761.22
SS7Predicted value−0.146495.3999.7%
Error (%)2.012.48
SS15Predicted value−0.137517.7299.6%
Error (%)1.031.53
SS20Predicted value−0.141524.5097.4%
Error (%)0.502.21
SS30Predicted value−0.147503.6799.7%
Error (%)2.650.31
SS50Predicted value−0.122506.6896.5%
Error (%)0.891.06
Table 5. The performance comparisons of the artificial neural network model.
ModelLayers SizeMSEMAER2
ANN 1(2, 8, 1)0.001040.0221320.9433
ANN 2(2, 16, 1)0.0010640.0199280.942
ANN 3(2, 32, 1)0.0174270.094420.0501
ANN 4(2, 64, 1)0.0179250.0969150.023
ANN 5(2, 128, 1)0.0133640.0725310.2716
ANN 6(4, 8, 1)0.0009910.0206150.946
ANN 7(4, 16, 1)0.0011840.0199180.9355
ANN 8(4, 32, 1)0.0012950.0215090.9294
ANN 9(4, 64, 1)0.0017870.0225260.9026
ANN 10(4, 128, 1)0.001010.0183090.945
ANN 11(8, 8, 1)0.001150.0212550.9373
ANN 12(8, 16, 1)0.0007230.0159660.9606
ANN 13(8, 32, 1)0.0013630.0208650.9257
ANN 14(8, 64, 1)0.0009610.01790.9476
ANN 15(8, 128, 1)0.0010380.0173880.9434
ANN 16(16, 8, 1)0.001260.0195210.9313
ANN 17(16, 16, 1)0.0013540.0199590.9262
ANN 18(16, 32, 1)0.0009310.0166250.9492
ANN 19(16, 64, 1)0.0009830.0185560.9464
ANN 20(16, 128, 1)0.0011790.0212050.9357
ANN 21(32, 8, 1)0.0014180.0228440.9227
ANN 22(32, 16, 1)0.0007110.0159960.9613
ANN 23(32, 32, 1)0.0010040.018870.9453
ANN 24(32, 64, 1)0.0004670.0108570.9746
ANN 25(32, 128, 1)0.0009480.0188430.9483
Table 6. The ANN24 prediction results of (|dw/dt|)max, Tmax, and R2.
Sample dw / dt m a x (wt.%/s) T m a x (°C) R2
SS7Predicted value−0.153516.1599.1%
Experimental value−0.149507.99
Error (%)2.681.61
SS30Predicted value−0.136488.7794.9%
Experimental value−0.151502.13
Error (%)9.932.66
Disclaimer/Publisher’s Note: The statements, opinions and data contained in all publications are solely those of the individual author(s) and contributor(s) and not of MDPI and/or the editor(s). MDPI and/or the editor(s) disclaim responsibility for any injury to people or property resulting from any ideas, methods, instructions or products referred to in the content.

