Article

Oxidation Kinetics Analysis of Crude Oils with Different Viscosities

1
Petroleum Engineering School, Southwest Petroleum University, Chengdu 610500, China
2
Tianfu Yongxing Laboratory, Chengdu 610213, China
*
Author to whom correspondence should be addressed.
Processes 2023, 11(8), 2361; https://doi.org/10.3390/pr11082361
Submission received: 13 July 2023 / Revised: 31 July 2023 / Accepted: 3 August 2023 / Published: 5 August 2023
(This article belongs to the Special Issue Process Technologies for Heavy Oils and Residua Upgradings)

Abstract

:
In order to compare the oxidation kinetics parameters of crude oils with different properties in the process of crude oil oxidation, six different crude oil samples were selected to analyze the oxidation characteristics of crude oils with different properties. In order to study the oxidation of crude oil, thermogravimetric analysis (TGA) and differential scanning calorimetry (DSC) synchronous analyzer were used for crude oil in the oxygen environment between 25 °C and 900 °C at a heating rate of 20 °C/min. The experimental results were based on crude oil oxidation using TGA and DTG experimental data to evaluate the oxidation mechanism of different crude oils, so as to better understand the situation in the oxidation reaction process. At the same time, the oxidation stage of crude oil was divided according to DSC data. Arrhenius method was used to analyze the oxidation kinetic parameters of crude oils with different properties, and the activation energies and pre-exponential factors of different crude oils were calculated. The experimental results show that the oxidation stage of crude oil can be divided into three stages: low-temperature oxidation, fuel deposition, and high-temperature oxidation. The low-temperature oxidation reaction begins at 280 °C, and the high-temperature oxidation reaction occurs at 400 °C. The low-temperature oxidation activation energy of an oil sample is 39.73–77.74 kJ/mol. The activation energy of the high-temperature oxidation is in the range of 106.27–264.47 kJ/mol. The activation energy of crude oil in the low-temperature oxidation stage increases with the increase of crude oil viscosity and decreases with the increase of crude oil viscosity in the high-temperature oxidation stage. Therefore, during the high-temperature oxidation stage, high-viscosity crude oil is more prone to reactions.

1. Introduction

Laboratory experiments and field tests confirmed that, compared with water injection, air injection can increase oil recovery by 14–23% [1,2,3]. One of the keys of this technology is whether the injected O2 can oxidize well with the reservoir crude oil [4]. Therefore, oxidation kinetics of crude oil became the basic theory of air injection to enhance oil recovery [5]. In addition, it is of great significance to understand the propagation of combustion front in porous media [6,7]; furthermore, the combination of oxidation reaction kinetic parameters and numerical simulation can provide a basic research method for air injection projects [8].
Crude oil oxidation kinetic parameters include activation energy, pre-exponential factor, and reaction mechanism function. At present, the experimental methods for calculating the kinetic parameters of crude oil oxidation include thermogravimetric analysis (TGA), derivative thermogravimetry (DTG), differential scanning calorimeter (DSC), accelerated rate calorimetry (ARC), etc. [9,10] Scholars usually use the TGA method to study the oxidation process of heavy oil under atmospheric pressure because of the low content of dissolved gas in heavy oil and the small difference in oil composition between surface condition and formation condition. The TGA method can measure the conversion rate of crude oil in each oxidation stage at different heating rates. Based on the conversion rate of crude oil combined with the Arrhenius equation, the oxidation kinetic parameters of crude oil in different oxidation stages can be obtained by differential method or integral method [11,12].
Kok et al. [13,14] used thermal analysis techniques (TGA-DTG, and DSC) to study the oxidation behavior of heavy- and medium-grade crude oils. Higher activation energy values were obtained in heavy and medium crude oils. They discussed that the higher the asphaltene content in crude oil, the higher the activation energy and heat release (the asphalt has a high content of bitumen, high activation energy, and releases a large amount of heat). Other parameters such as heating rate, clay minerals, and metal additives also have an important influence on the oxidation behavior of crude oil. Gundogar et al. [15] reported the oxidation behavior of light and medium crude oil under atmospheric air and calculated the activation energy using different kinetic models. Results showed that activation energy at the high-temperature oxidation (HTO) stage is significantly higher than that at the low-temperature oxidation (LTO) stage. The studies indicate that heavier oils with greater asphaltene content had a greater influence on the oxidation heat release and activation energy [16]. Liu et al. [17] used thermogravimetric analysis to explore the influence of chemical composition of crude oil on oxidation kinetics; the higher the content of colloid and asphaltene in crude oil, the greater its reaction rate and energy demand in the low-temperature oxidation (LTO) stage. As well, more coke deposits were generated in the fuel deposition (FD) stage, which was positive for high-temperature combustion. The LTO stage generally presents an endothermic trend; energy accumulation is essential to the subsequent reaction. In recent years, more attention has been paid to the effects of aromatics, resins, and asphaltenes on the oxidation behavior of heavy crude oil, and catalysts have been considered to reduce the reaction temperature and improve the reaction speed [18,19].
The high content of colloid and asphaltene is one of the important reasons for the high viscosity of crude oil. Previous studies have confirmed that colloid and asphaltene are important factors affecting the activation energy of the reaction. Although the oxidation behavior of crude oil has been studied extensively for many years, scholars pay more attention to the kinetic parameters of the three stages (LTO, FD, and HTO), but the relationship between the oxidation kinetic parameters and the properties of crude oil (e.g., viscosity) is less discussed or only heavy and light oil’s oxidation kinetic parameters are compared: no one has systematically studied the effect of crude oil weight at different oxidation stages on the activation energy. In this article, six kinds of crude oil with different viscosities were conducted by synchronous thermal analysis technology [20] of TGA, DTG, and DSC, in order to analyze the heat release in different oxidation stages of different samples, and the kinetic parameters were calculated for each stage. Finally, based on the published references data as supplementary [21], the relationship between activation energies and oil viscosities of different samples at different oxidation stages was given.

2. Experimental Section

2.1. Materials

There are 6 kinds of crude oil used in this experiment. Before the experiment, the samples were dehydrated and impurities were removed; the water content of the dehydrated oil sample after treatment is less than 0.5%. According to Table 1, sample 1 is light with a viscosity of 9.6 mPa·s and a API gravity of 31.2. Samples 2–3 are ordinary heavy oil, with viscosities between 66–574 mPa·s and API gravities between 22.9–20.4. The viscosity of samples 5 and 6 is much higher than that of the other ones, the API gravities are less than 20. (API gravity = 141.5/SG − 131.5, SG is the ratio of crude oil density to pure water density at 4 °C under standard atmospheric pressure).

2.2. Experimental Apparatus and Procedure

The crude oil oxidation process was implemented by TGA/DSC synchronous thermal analyzer (Mettler Toledo TGA/DSC3+, Figure 1). TGA/DSC synchronous thermal analyzer can simultaneously measure mass signal and heat release signal, and it has TGA and DSC analysis function. The experimental temperature is 25–900 °C, and the protective gas is nitrogen with a flow rate of 50 mL/min. The reaction gas is air, and the flow rate is 20 mL/min. The reaction gas passes over the surface of the crucible and causes the sample to undergo an oxidation reaction, then the surplus reaction gas is eliminated together with the protective gas.
The procedures are as follows: (1) Switched on the software system and set the temperature range as 25–900 °C and the heating rate as 20 °C/min; (2) Empty ceramic crucible was placed in the furnace body, the gases tubes were connected, the reaction gas was air, the protective gas was 99.99% high purity nitrogen; (3) The baseline calibration was first executed to improve the TG/DSC thermal analysis accuracy, and repeated three times for stability; (4) Blank curves were recorded as correlation data; (5) Oil sample was placed in the ceramic crucible with the mass around 10–20 mg; (6) TG/DSC synchronous tests were carried out on 6 oil samples under the same experimental conditions; (7) TG-DTG and TG-DSC curves were drawn and analyzed, respectively, using the testing data of different oil samples; (8) Kinetic parameters were calculated according to Arrhenius kinetic theory [22].

3. Results and Discussion

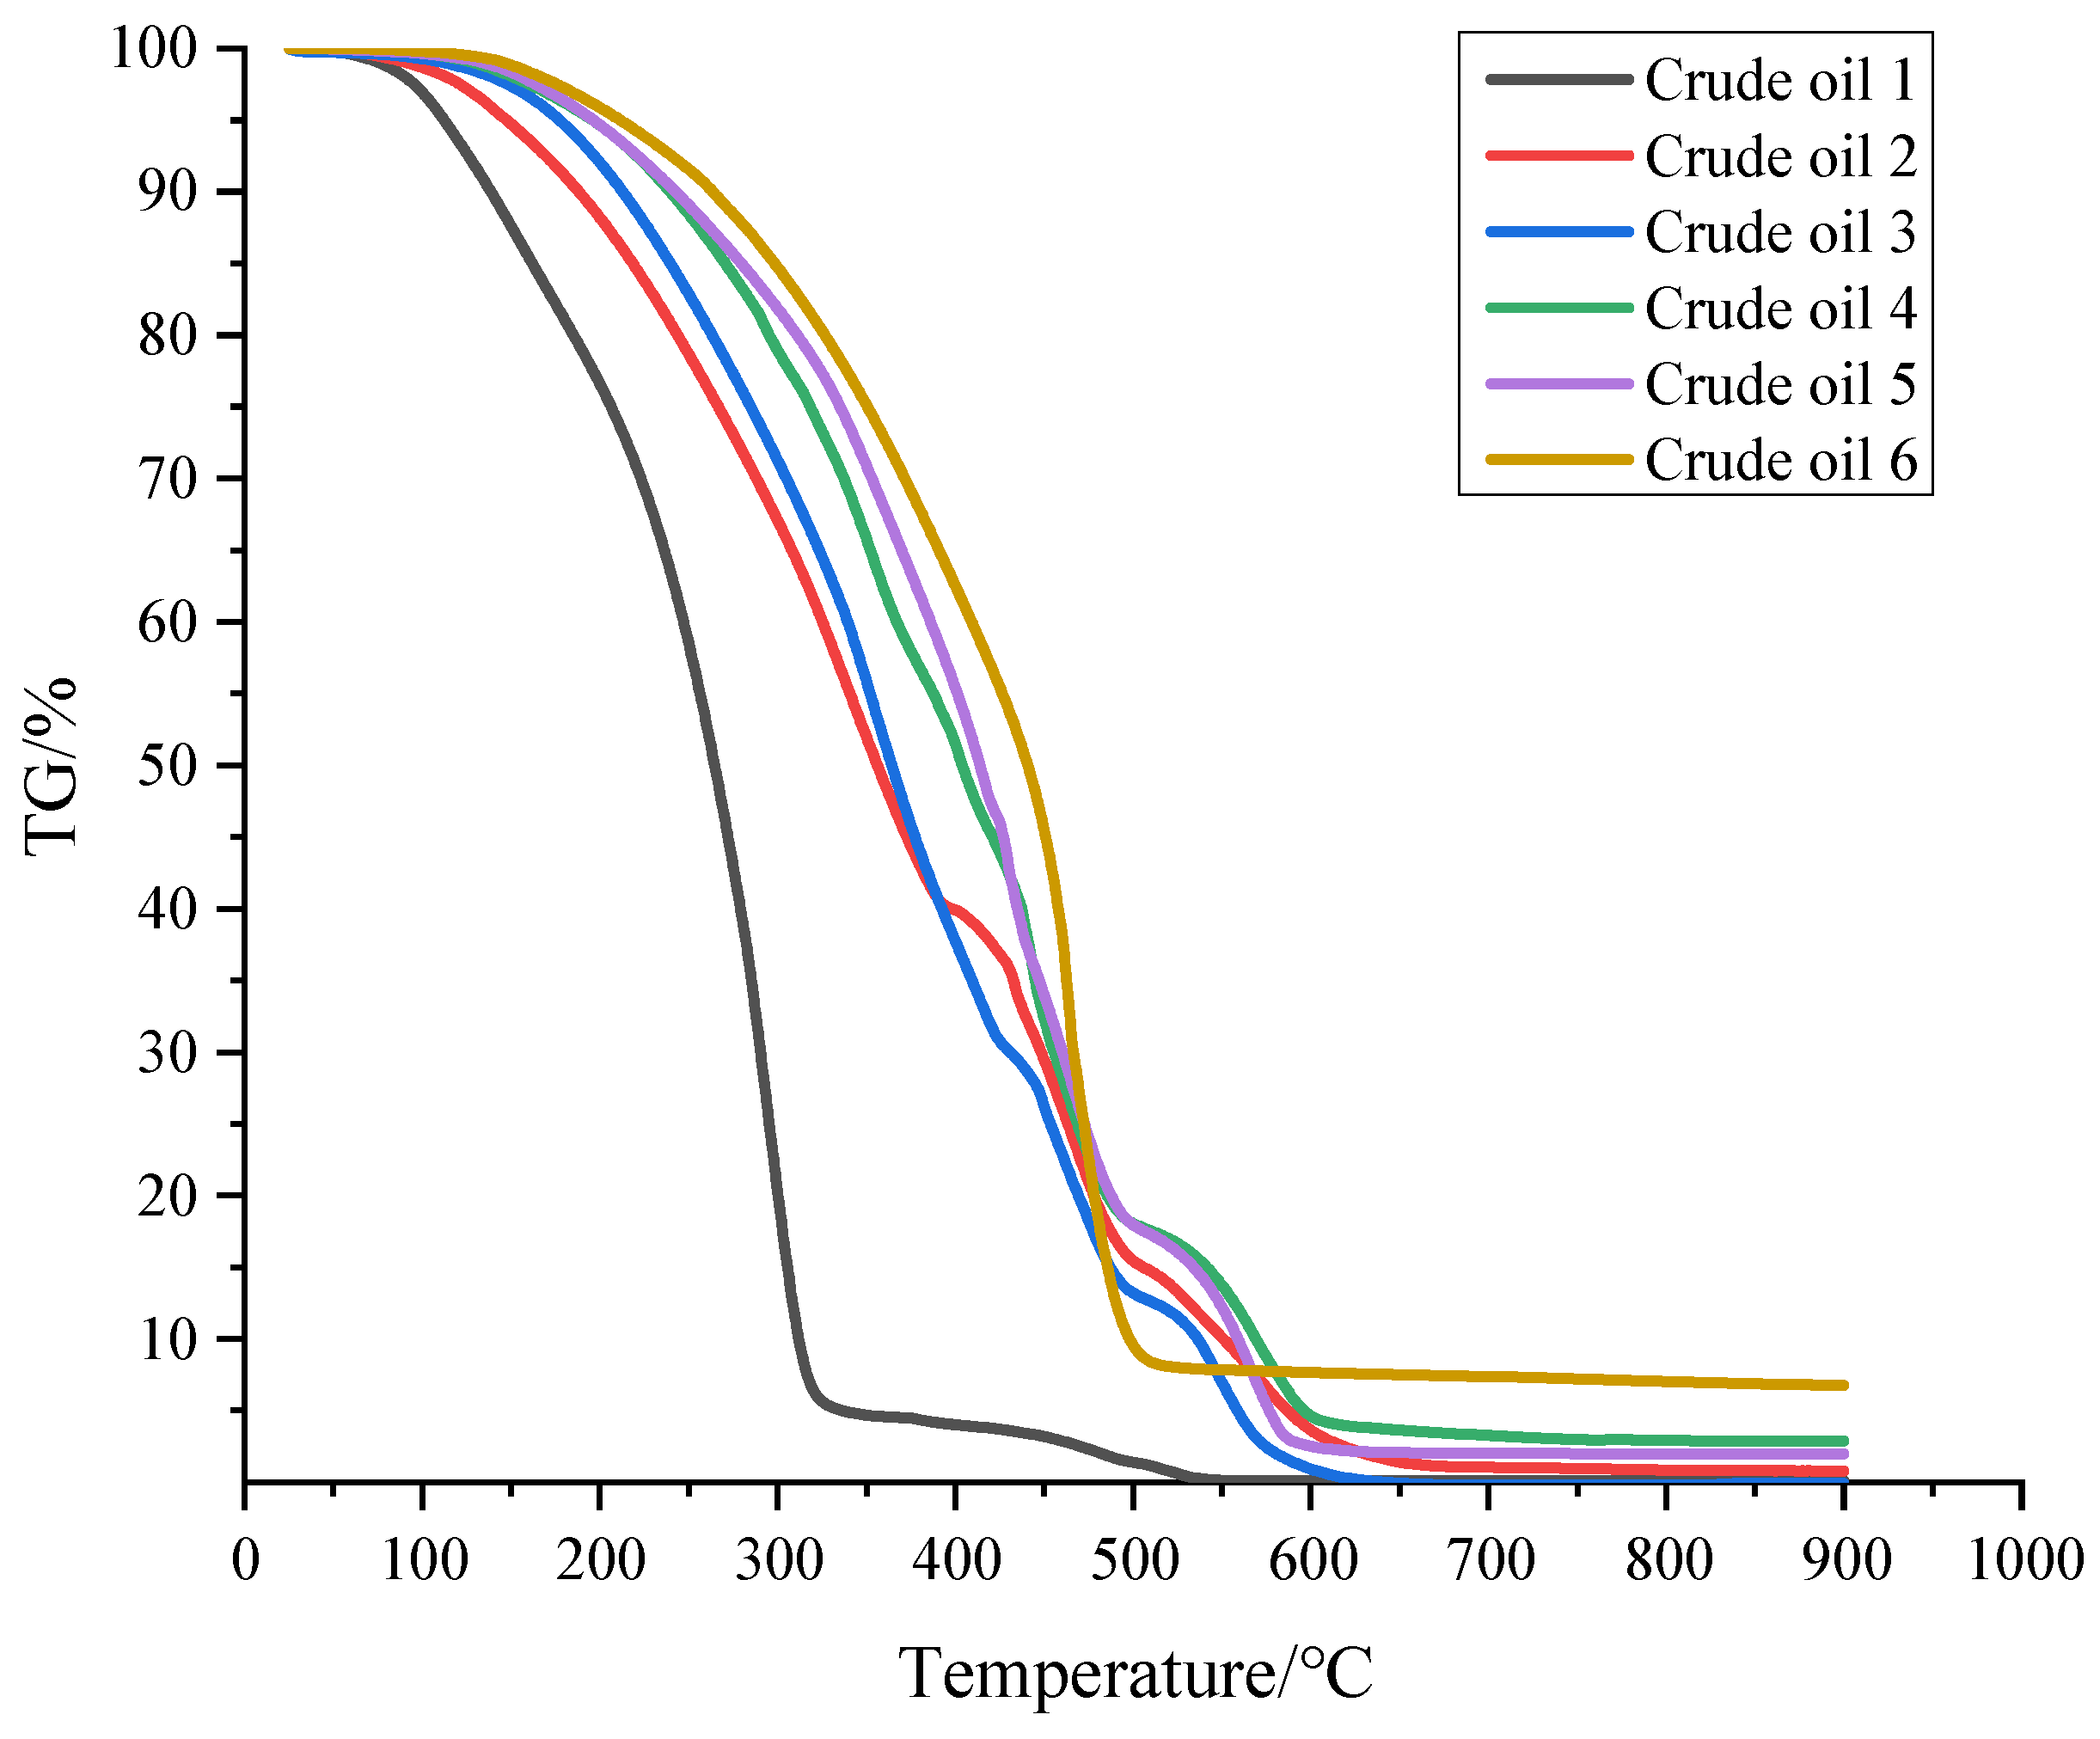
3.1. TG-DTG Analysis

TG-DTG curve can dynamically reflect the weight loss rate of oil samples during oxidation. The horizontal coordinate is temperature, the vertical coordinate of TG curve is the residue mass fraction of the sample at a certain temperature, and the vertical coordinate of DTG curve is the derivative of conversion rate to reaction time. The larger the absolute value is, the faster the oxidation reaction rate is.
As shown in Figure 2, when the temperature is below 140 °C, the TG curve is flat, and the weight loss rate basically remains unchanged. The main reason for weight loss is volatile light hydrocarbon components. When the temperature is higher than 140 °C, the weight loss rate increases rapidly, among which, the weight loss rate of oil sample 6 is the lowest at low-temperature, because oil sample 6 is ordinary heavy oil class ⅱ with high content of colloid and asphaltene and heavy components, and it does not undergo oxidation easily at low temperature. Oil sample 1 has the highest weight loss rate at the low-temperature oxidation stage, mainly because of the high content of light components in oil sample 1, which is conducive to the occurrence of spontaneous combustion of crude oil in the oxidation process. The weight loss rate of oil samples 3 and 4 in the low-temperature oxidation stage is between that of oil sample 1 and oil sample 6, because the light component content of oil samples 3 and 4 is smaller than that of oil sample 1, while the gelatinous asphaltene content is larger than that of oil sample 1. The thermogravimetric curve shifts to the right as the viscosity of crude oil increases.
TG and DTG curves of different oil samples at the same heating rate are shown in Figure 3. The oxidation characteristics of crude oil can be divided according to the temperature range and reaction rate of exothermic reaction. TG-DTG curve shows that the reaction rate peak of each crude oil sample is different. The first peak occurs at 300–400 °C, and the main reaction type is a low-temperature oxidation reaction between crude oil and oxygen [23]. The second peak occurs at 500–600 °C, and the reaction type is a high-temperature oxidation reaction between oil coke and oxygen. The weight loss rate of each oil sample showed a characteristic of multi-peak fluctuation, which was mainly caused by the fact that the oil sample used in the experiment was pure oil, and the air swept over the sample surface. After the crude oil on the surface became coking, the internal oil sample could not fully contact with oxygen and the oxidation was incomplete. The peak reaction rate of oil samples 1–2 is around 300 °C, and that of oil samples 3–6 is around 350 °C to 450 °C. The peak area of oil samples 5–6 is larger than that of others, which further indicates that the thicker crude oil is, the lower the content of light hydrocarbon components is, and the weight loss is slower in the low-temperature oxidation reaction stage. On the whole, the peak reaction rate shifted to the right with the increase in crude oil viscosity.
According to the TG experimental results of crude oils with different properties, the mass changes before and after the reaction were analyzed to obtain the mass loss rate. The results are shown in Table 2. The average mass loss rate of oil samples 1–2 was 98.765%, that of oil samples 3–4 was 97.49%, that of oil samples 5–6 was 97.68%. In general, the mass loss rate of ordinary heavy oil was less than that of light oil samples.

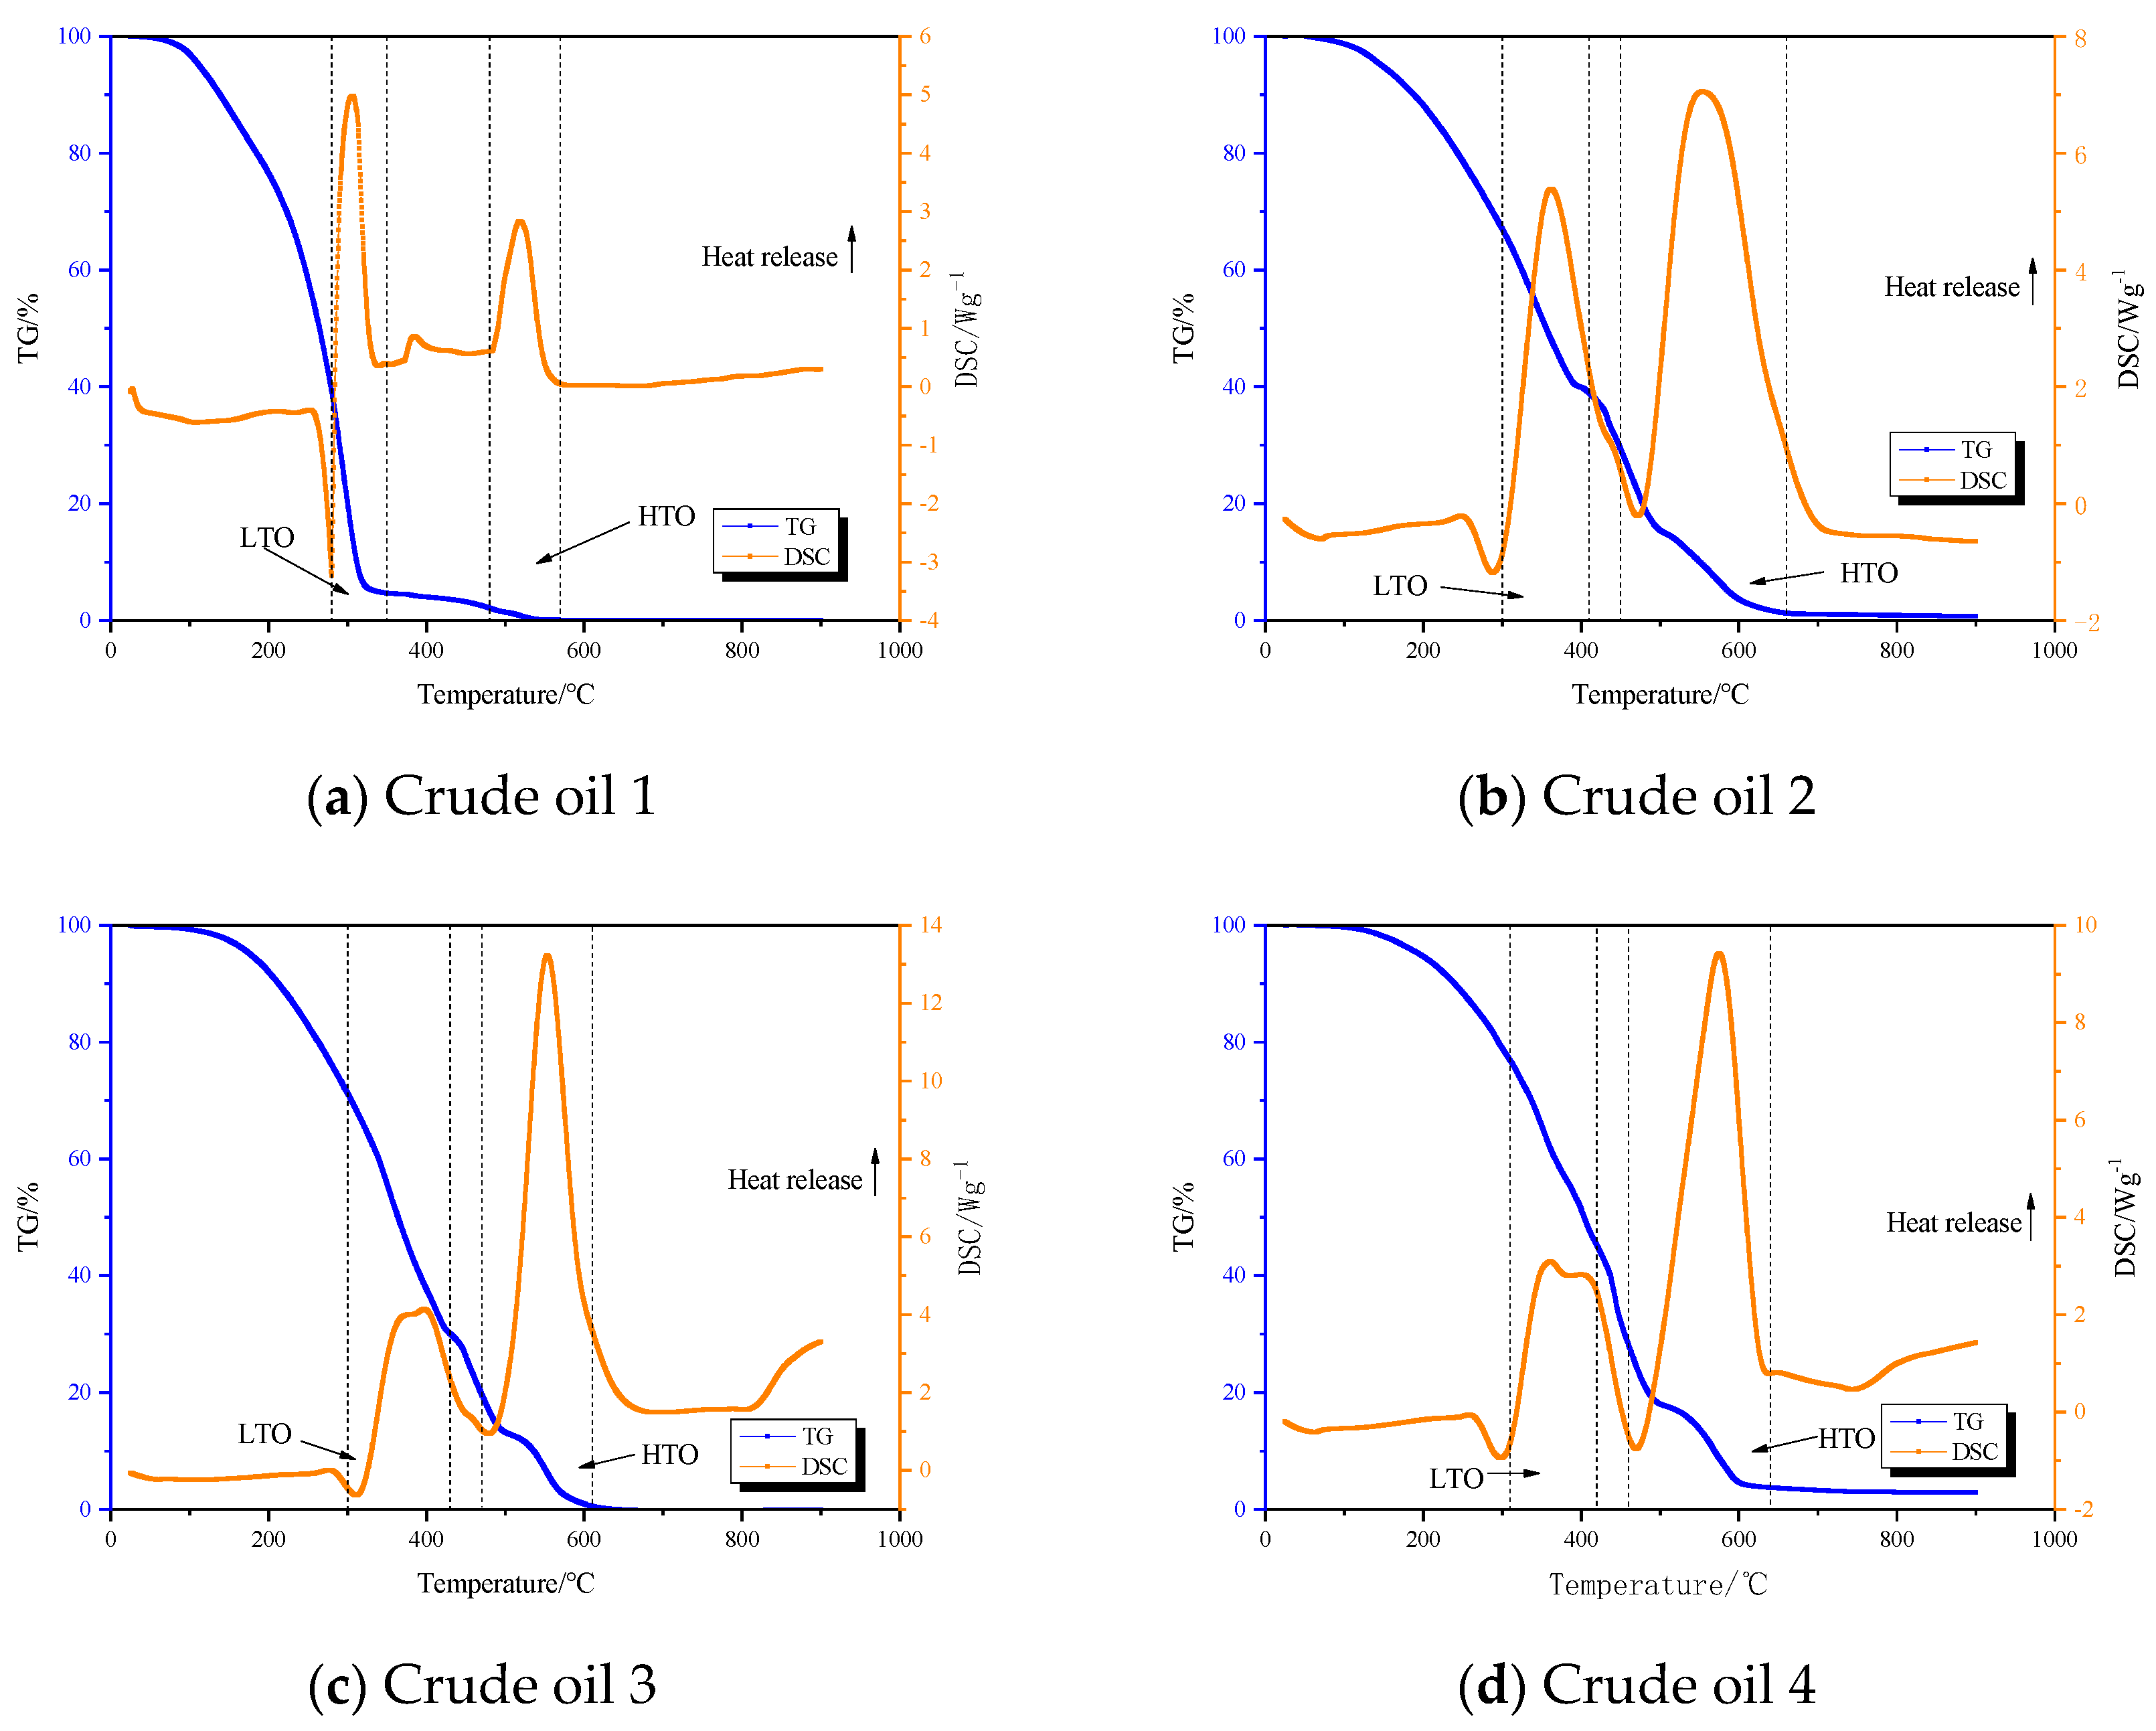
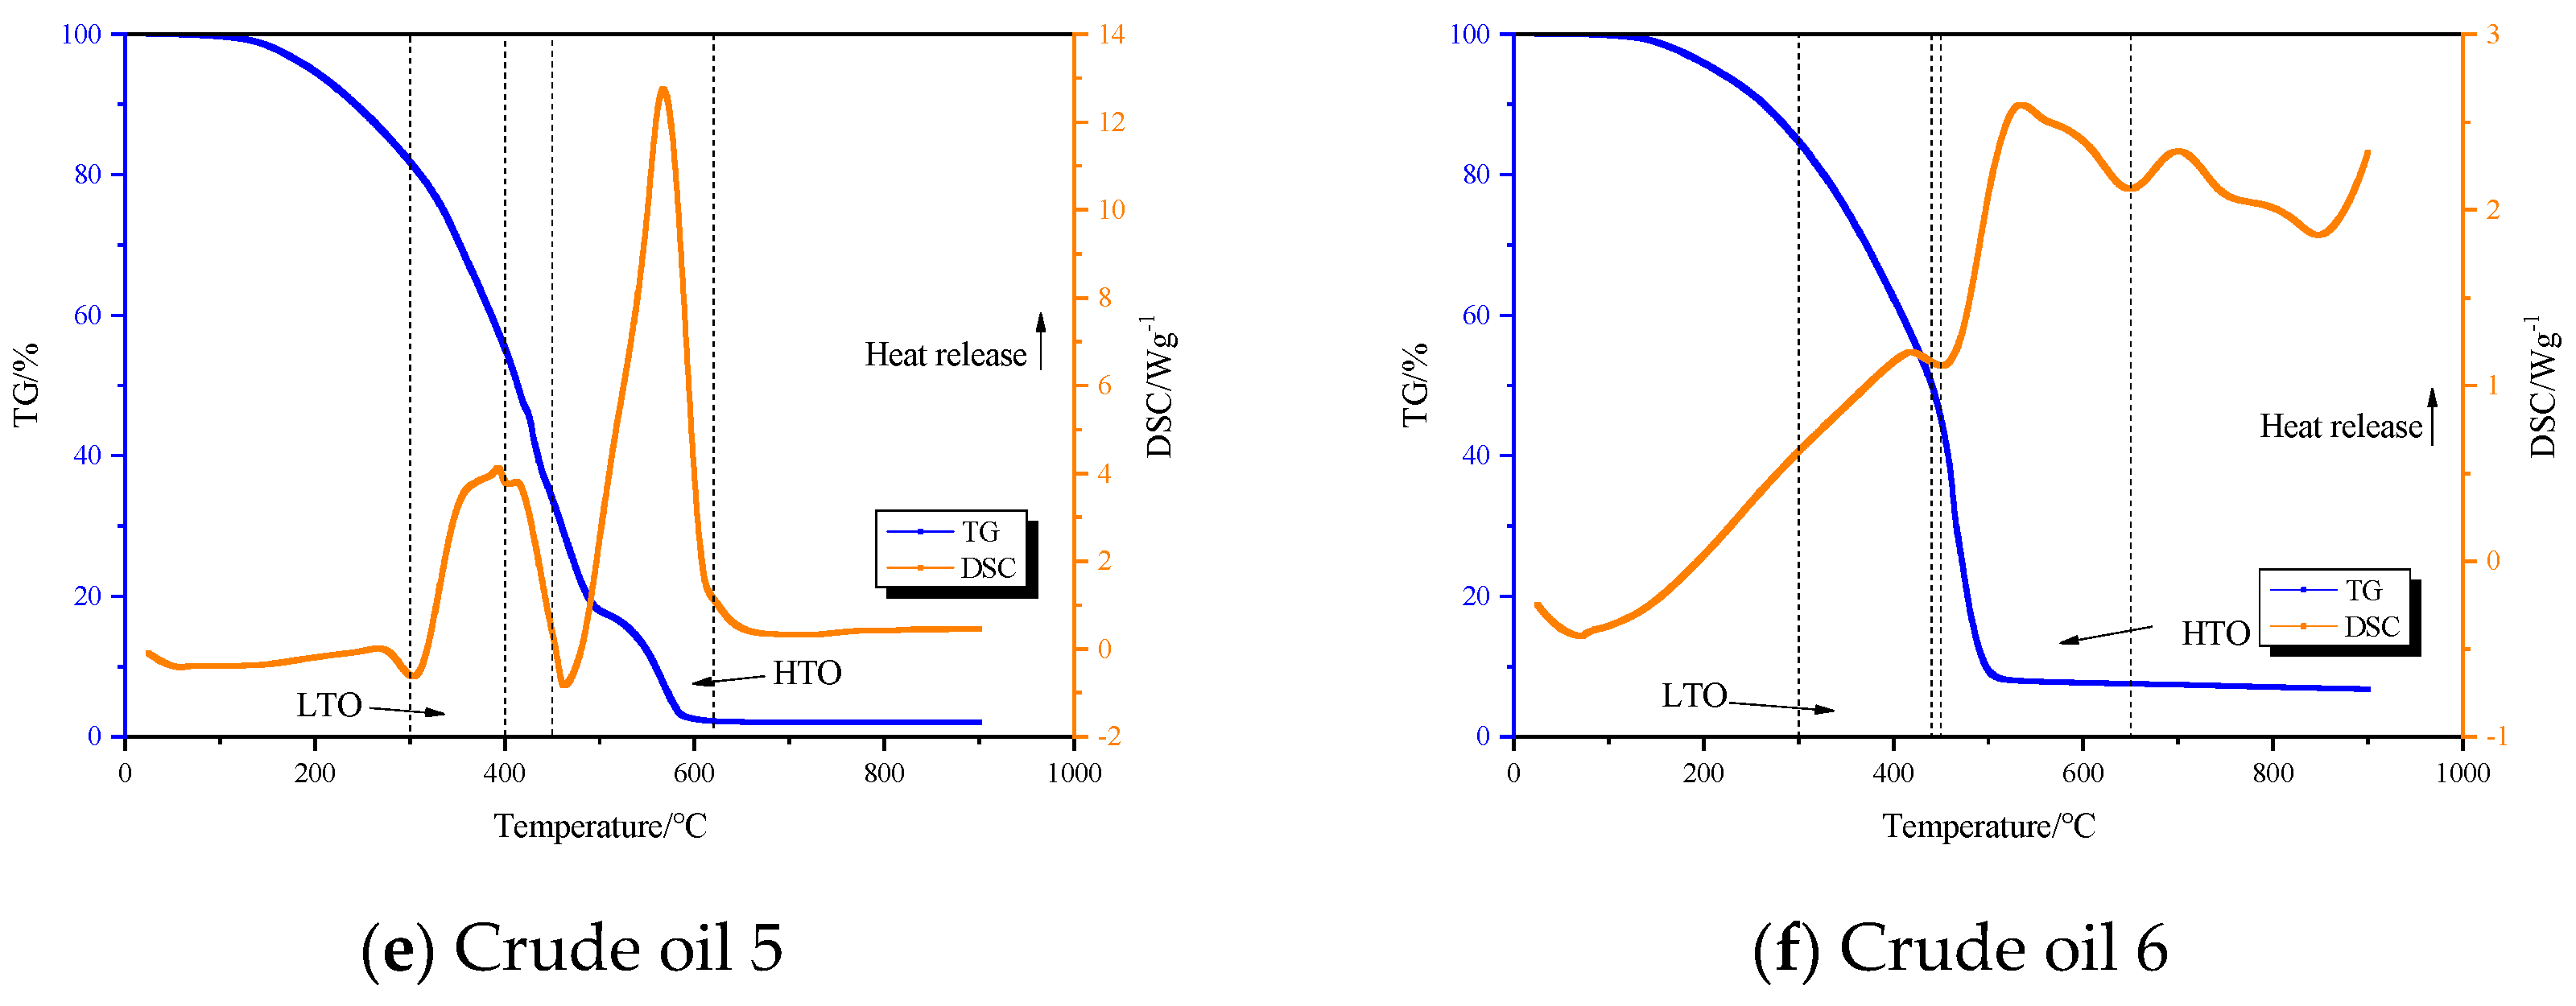
3.2. TG-DSC Analysis

In order to more accurately differentiate each sample of oxidation reaction stage, the quality of crude oil samples was drawn according to the results of the measurement unit of heat release rate curve (DSC curve). As shown in Figure 4, DSC curve trends upward as the exothermic peak and downward for absorption of heat. According to the curve change rule, these regions can be precisely divided into the low-temperature oxidation, fuel deposition, and high-temperature oxidation stages of each crude oil. Each stage has different characteristics of crude oil oxidation reaction.
As shown in Figure 4, the low-temperature oxidation reaction began to occur at 280 °C and the high-temperature oxidation reaction occurred at 450 °C.
The lower limit of temperature in the low-temperature oxidation stage is about 280 °C, and the upper limit is about 400 °C. In this stage, oxygenation reaction and further polycondensation reaction of oxidized derivatives form heavy components with large molecular weight. At this stage, oxidative and exothermic phenomena were observed on the DSC curve, but the thermal effect was weak, and the mass loss rate of crude oil samples was still caused by the volatilization of light hydrocarbon components.
The fuel deposition stage is the excessive stage of low-temperature oxidation reaction to high-temperature oxidation reaction, and the lower limit of temperature is about 400 °C while the upper limit is about 450 °C. The DTG curve shows that the conversion rate of crude oil sample has obvious change, and the DSC curve shows that the heat release rate of crude oil sample per unit mass has obvious change. The reason for weight loss is mainly caused by volatilization of short-chain hydrocarbons produced by alkyl side chains and weak chemical bond fractures of some oxygen-containing derivatives.
The lower limit of temperature at the high-temperature oxidation stage is 450 °C, above which the second conversion rate peak and heat release rate peak of unit mass crude oil sample appear on DTG and DSC curves, and the corresponding reaction is the combustion reaction of solid coke. When the reaction temperature is higher than 450 °C, pyrolytic coke and light hydrocarbon are generated by the pyrolysis reaction of crude oil. Pyrolytic coke mainly comes from colloidal and asphaltene components with large relative molecular weight, high viscosity, and complex aromatic ring structure, and the formation process does not need oxygen action. The non-hydrocarbon gases produced by the reaction are mainly CO2, CO, and H2O.
By analyzing different crude oil TG-DSC curves, the sample crude oil oxidation reaction stage was divided according to the DSC peak, as shown in Table 3. With the increase of crude oil viscosity, the crude oil oxidation temperature interval gradually increases; with the increase of crude oil viscosity, the heat release in the high-temperature oxidation stage increases significantly. This is mainly because the combination of low-viscosity crude oil and light hydrocarbon content is high; the low-temperature oxidation stage is accompanied by a large number of light hydrocarbons that undergo volatilization and have heat absorption characteristics, at the same time, the oxygenation and bond break in the low-temperature oxidation stage are also endothermic reactions, so they offset part of the heat released by oxidation, resulting in a low comprehensive heat release of low-viscosity crude oil at this stage.

3.3. Oxidation Reaction Models at Each Stage

3.3.1. Reaction Model for Low-Temperature Oxidation Stage

Crude oil oxidation is a complex series of reactions. In the low-temperature oxidation stage, the two-step reaction scheme proposed by Clara et al. [24] can be utilized:
C H x + y 2 O 2   C H x O y ,
C H x O y + [ 2 + β 2 ( 1 + β ) + x 4 y 2 ] O 2   1 1 + β C O 2 + β 1 + β C O + x 2 H 2 O .
CHx and CHxOy are the fuel and polar compounds for the reaction, respectively. Polar compounds include aldehydes, ketones, alcohols, and carboxylic acids. Fuel is the oxidized part of crude oil. In the first oxidation reaction, CHx is consumed to form polar compounds, but no combustion occurs. The second step is a combustion reaction, where oxygen reacts with polar compounds to generate CO, CO2, and water.
β is molar CO/CO2 ratio, and the values of x, y, and β are influenced by oil and temperature.

3.3.2. Reaction Model for Fuel Deposition Stage

There are two simultaneous reactions at this stage:
R C H x O y   R C H x O y + H 2 + C n H 2 n + 2 ,
R C H x O y + R C H x O y   C o k e .
On the one hand, the macromolecular chain and the ring chain break to form small molecule hydrocarbons, and the crude oil is modified; on the other hand, small molecule hydrocarbons are repolymerized to form coke, which is used as fuel for the next stage [25].

3.3.3. Reaction Model for High-Temperature Oxidation Stage

This stage is a combustion reaction, in which the coke formed in the previous stage reacts with oxygen, and the products are carbon oxides and water. Murugan et al. [26] describe coke combustion using the following equation:
C o k e + O 2   C O x + H 2 O .

3.4. Kinetics of Oxidation of Crude Oil

3.4.1. Kinetic Mechanism of Oxidation Reaction

Crude oil oxidation, pyrolysis, and combustion reactions are complex and continuous reaction processes, because the crude oil contains a large number of hydrocarbons, there are multiple complex intermediate reactions in oxidation; in order to understand this complex process, it is necessary to study the dynamics of the process.
In the TG experimental reactor, oxygen was in excess and the crude oil content was small. Kok et al. [22] proposed a simple model to calculate kinetic parameters by using Arrhenius kinetic theory. It is assumed that the oxidation rate of the crude oil sample depends only on the reaction rate, the reaction order, and the remaining mass of the sample. Oxidative combustion of crude oil can be approximated as a first-order reaction, expressed by the chemical reaction rate equation:
d ω d t = k ω
ω = m 0 m 2 m 0 m 1
k = A e x p ( E R T )
Assuming first-order kinetics,
d ω d t = ω A e x p ( E R T )  
Taking the logarithm of both sides,
l o g ( d ω d t ω ) = l o g A E 2.303 R T
d ω d t —the rate of mass change, mg/°C
m 0 —sample initial mass, mg
m 1 —sample finial mass, mg
m 2 —sample middle mass, mg
T—temperature, K
E—activation energy, kJ/mol
R—gas constant, 8.314 J/(mol·K)
A—Arrhenius constant, 1/min
When lg[(d ω /dt)1/W] is plotted vs. 1/T, a straight line with a slope of E/2.303 R is obtained, and from the intercept, the Arrhenius constant can be estimated (Figure 5). The individual activation energies for each reaction region can be notionally attributed to different reaction mechanisms.
Due to the complexity of the oxidation and pyrolysis process of crude oil, the dominant reaction and process are different in different temperature ranges. Therefore, the activation energy obtained by the above calculation method is apparent activation energy, rather than corresponding to a specific reaction.

3.4.2. Calculation of Oxidation Kinetic Parameters

The log((dω/dt)/ω) − 1/T curve is plotted by Equation (5), as shown in Figure 5. The activation energy and pre-exponential factors of various oil samples were calculated by differential method through the slope and intercept of the fitted relationship curves of six kinds of crude oil, as shown in Table 4. The activation energy of oil samples 1–2 at the low-temperature oxidation stage is smaller, that of oil samples 3–5 at the low-temperature oxidation stage is larger, and that of oil sample 6 at the low-temperature oxidation stage is the largest. The activation energy of oil samples 1–2 at the high-temperature oxidation stage is larger than that of oil samples 3–6 at the high-temperature oxidation stage.
The activation energy of the low-temperature oxidation stage is smaller than that of the high-temperature oxidation stage, while the frequency factor of the low-temperature oxidation stage is larger than that of the high-temperature oxidation stage. The activation energy of ordinary heavy oil is higher than that of light oil. With the increase of crude oil viscosity, the activation energy of the low-temperature oxidation phase gradually increases, and that of the high-temperature oxidation reaction phase gradually decreases.

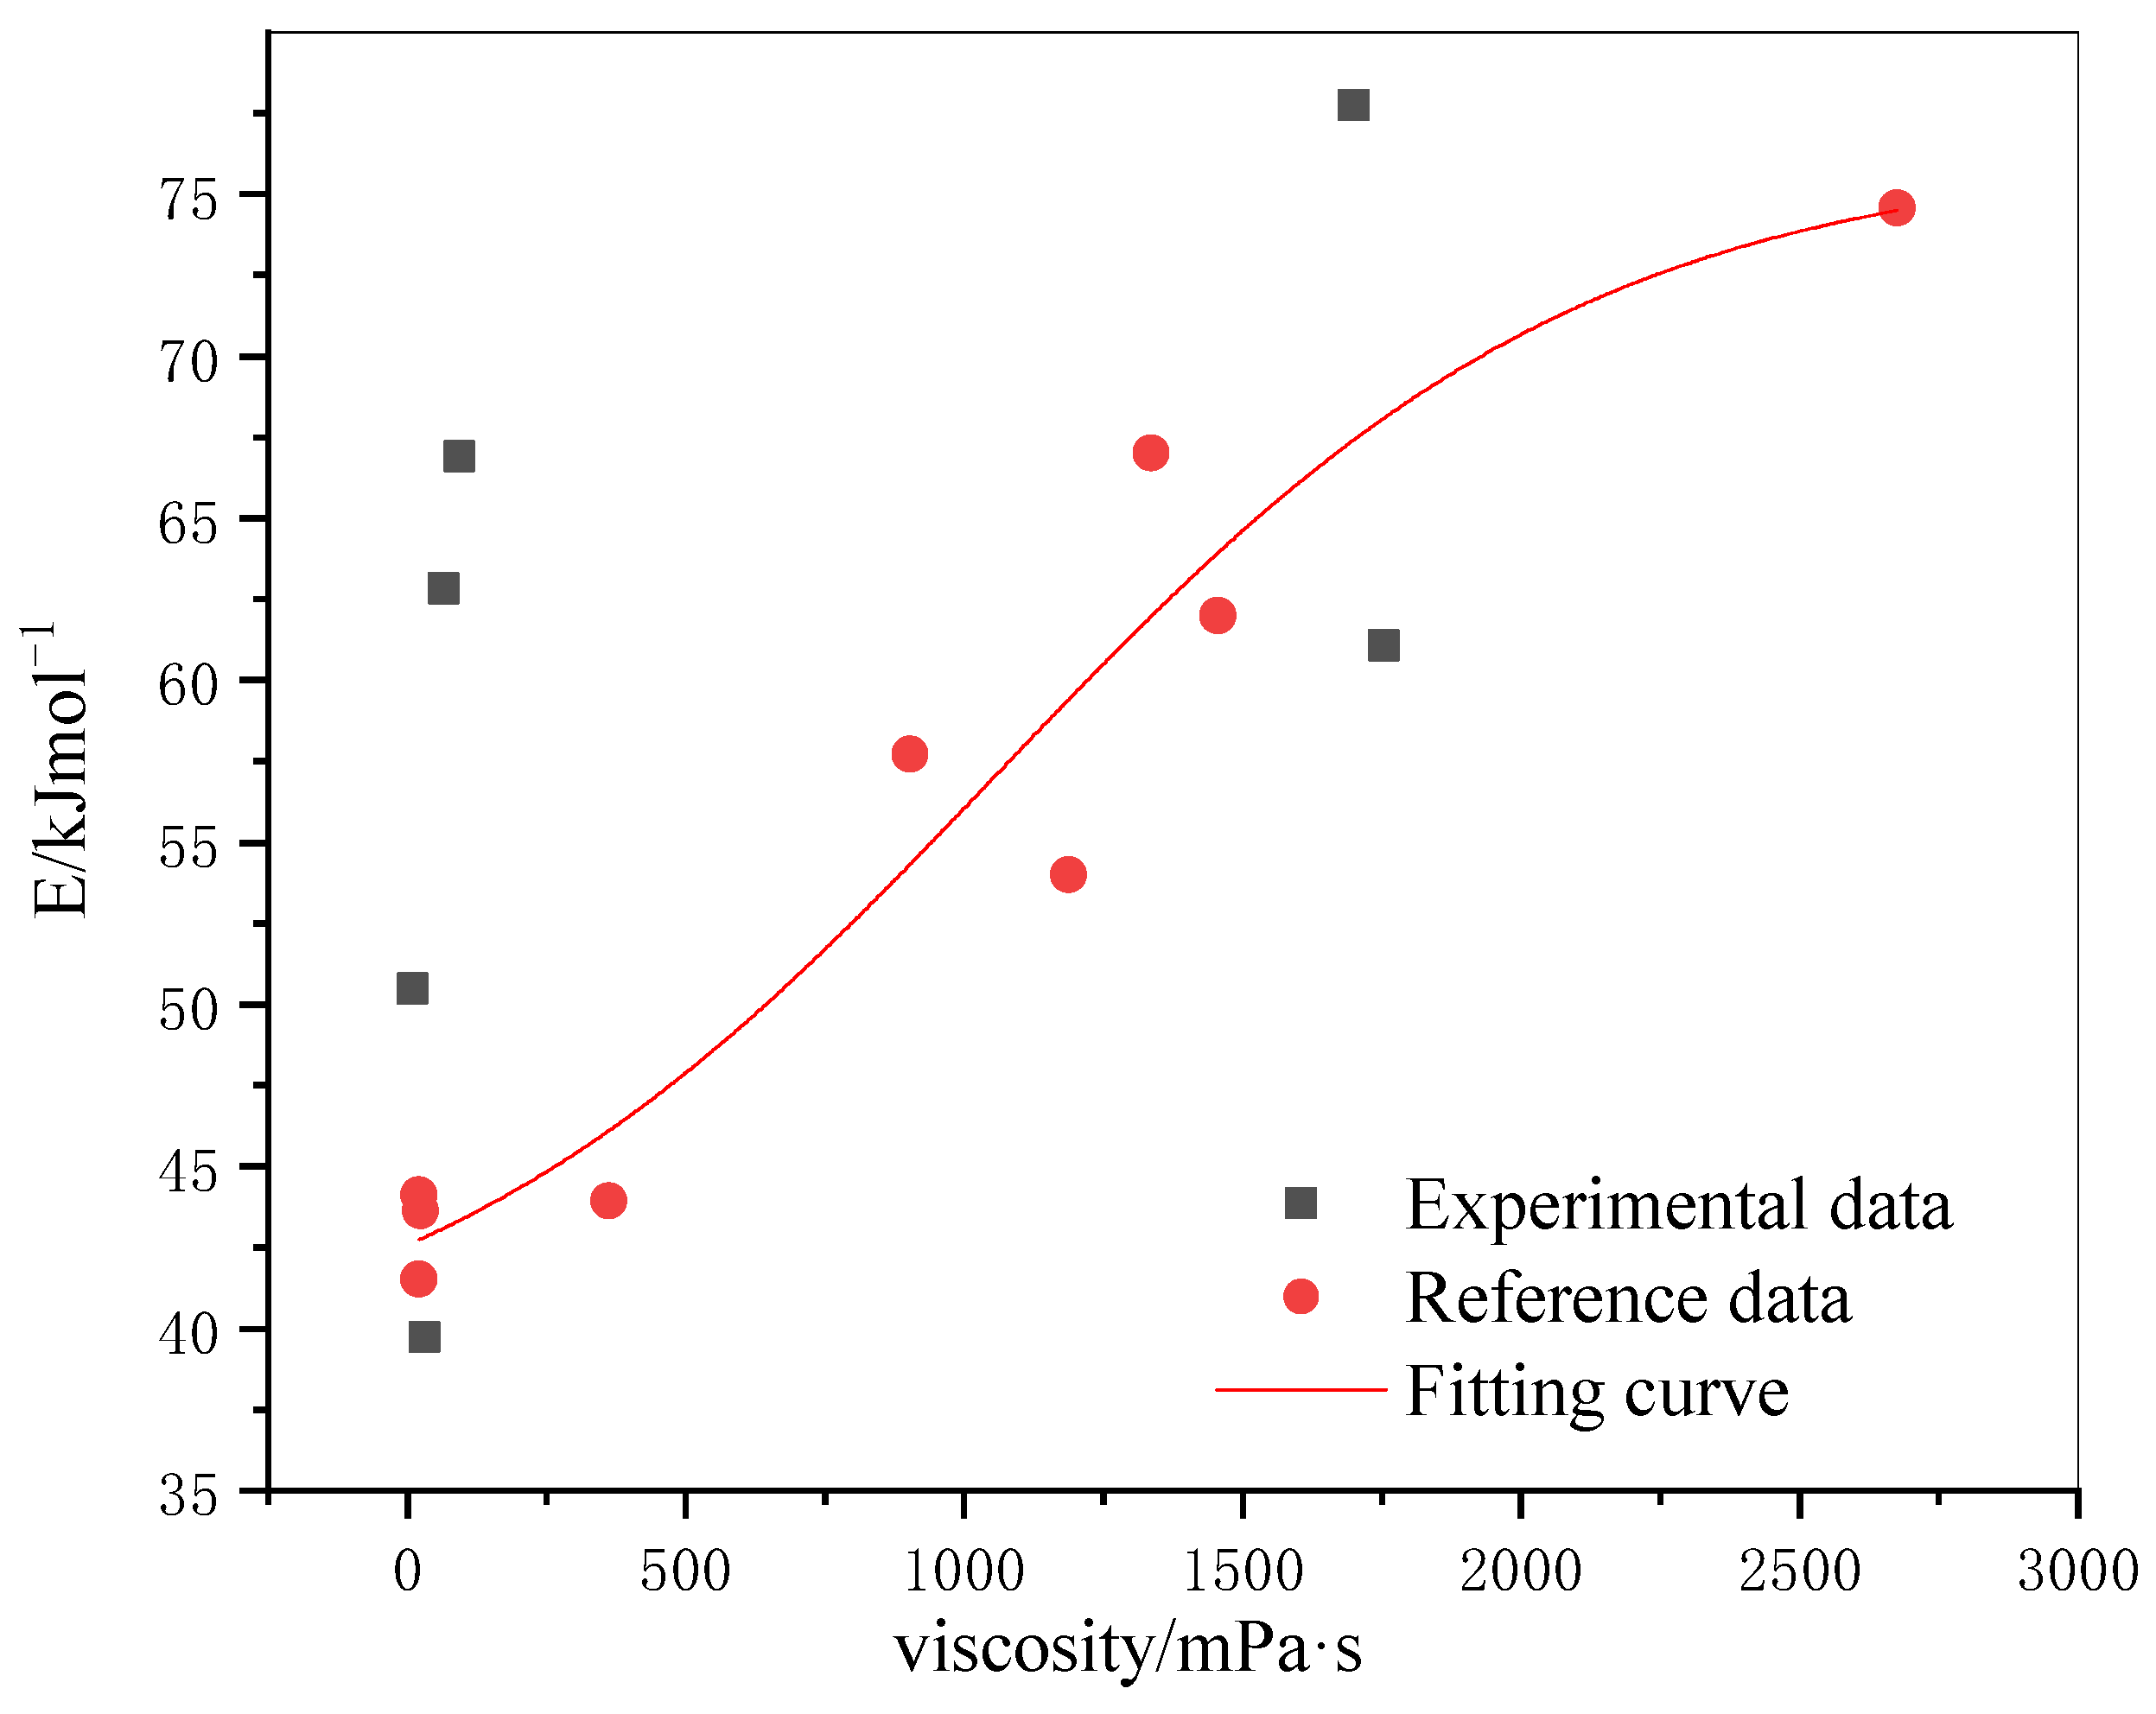
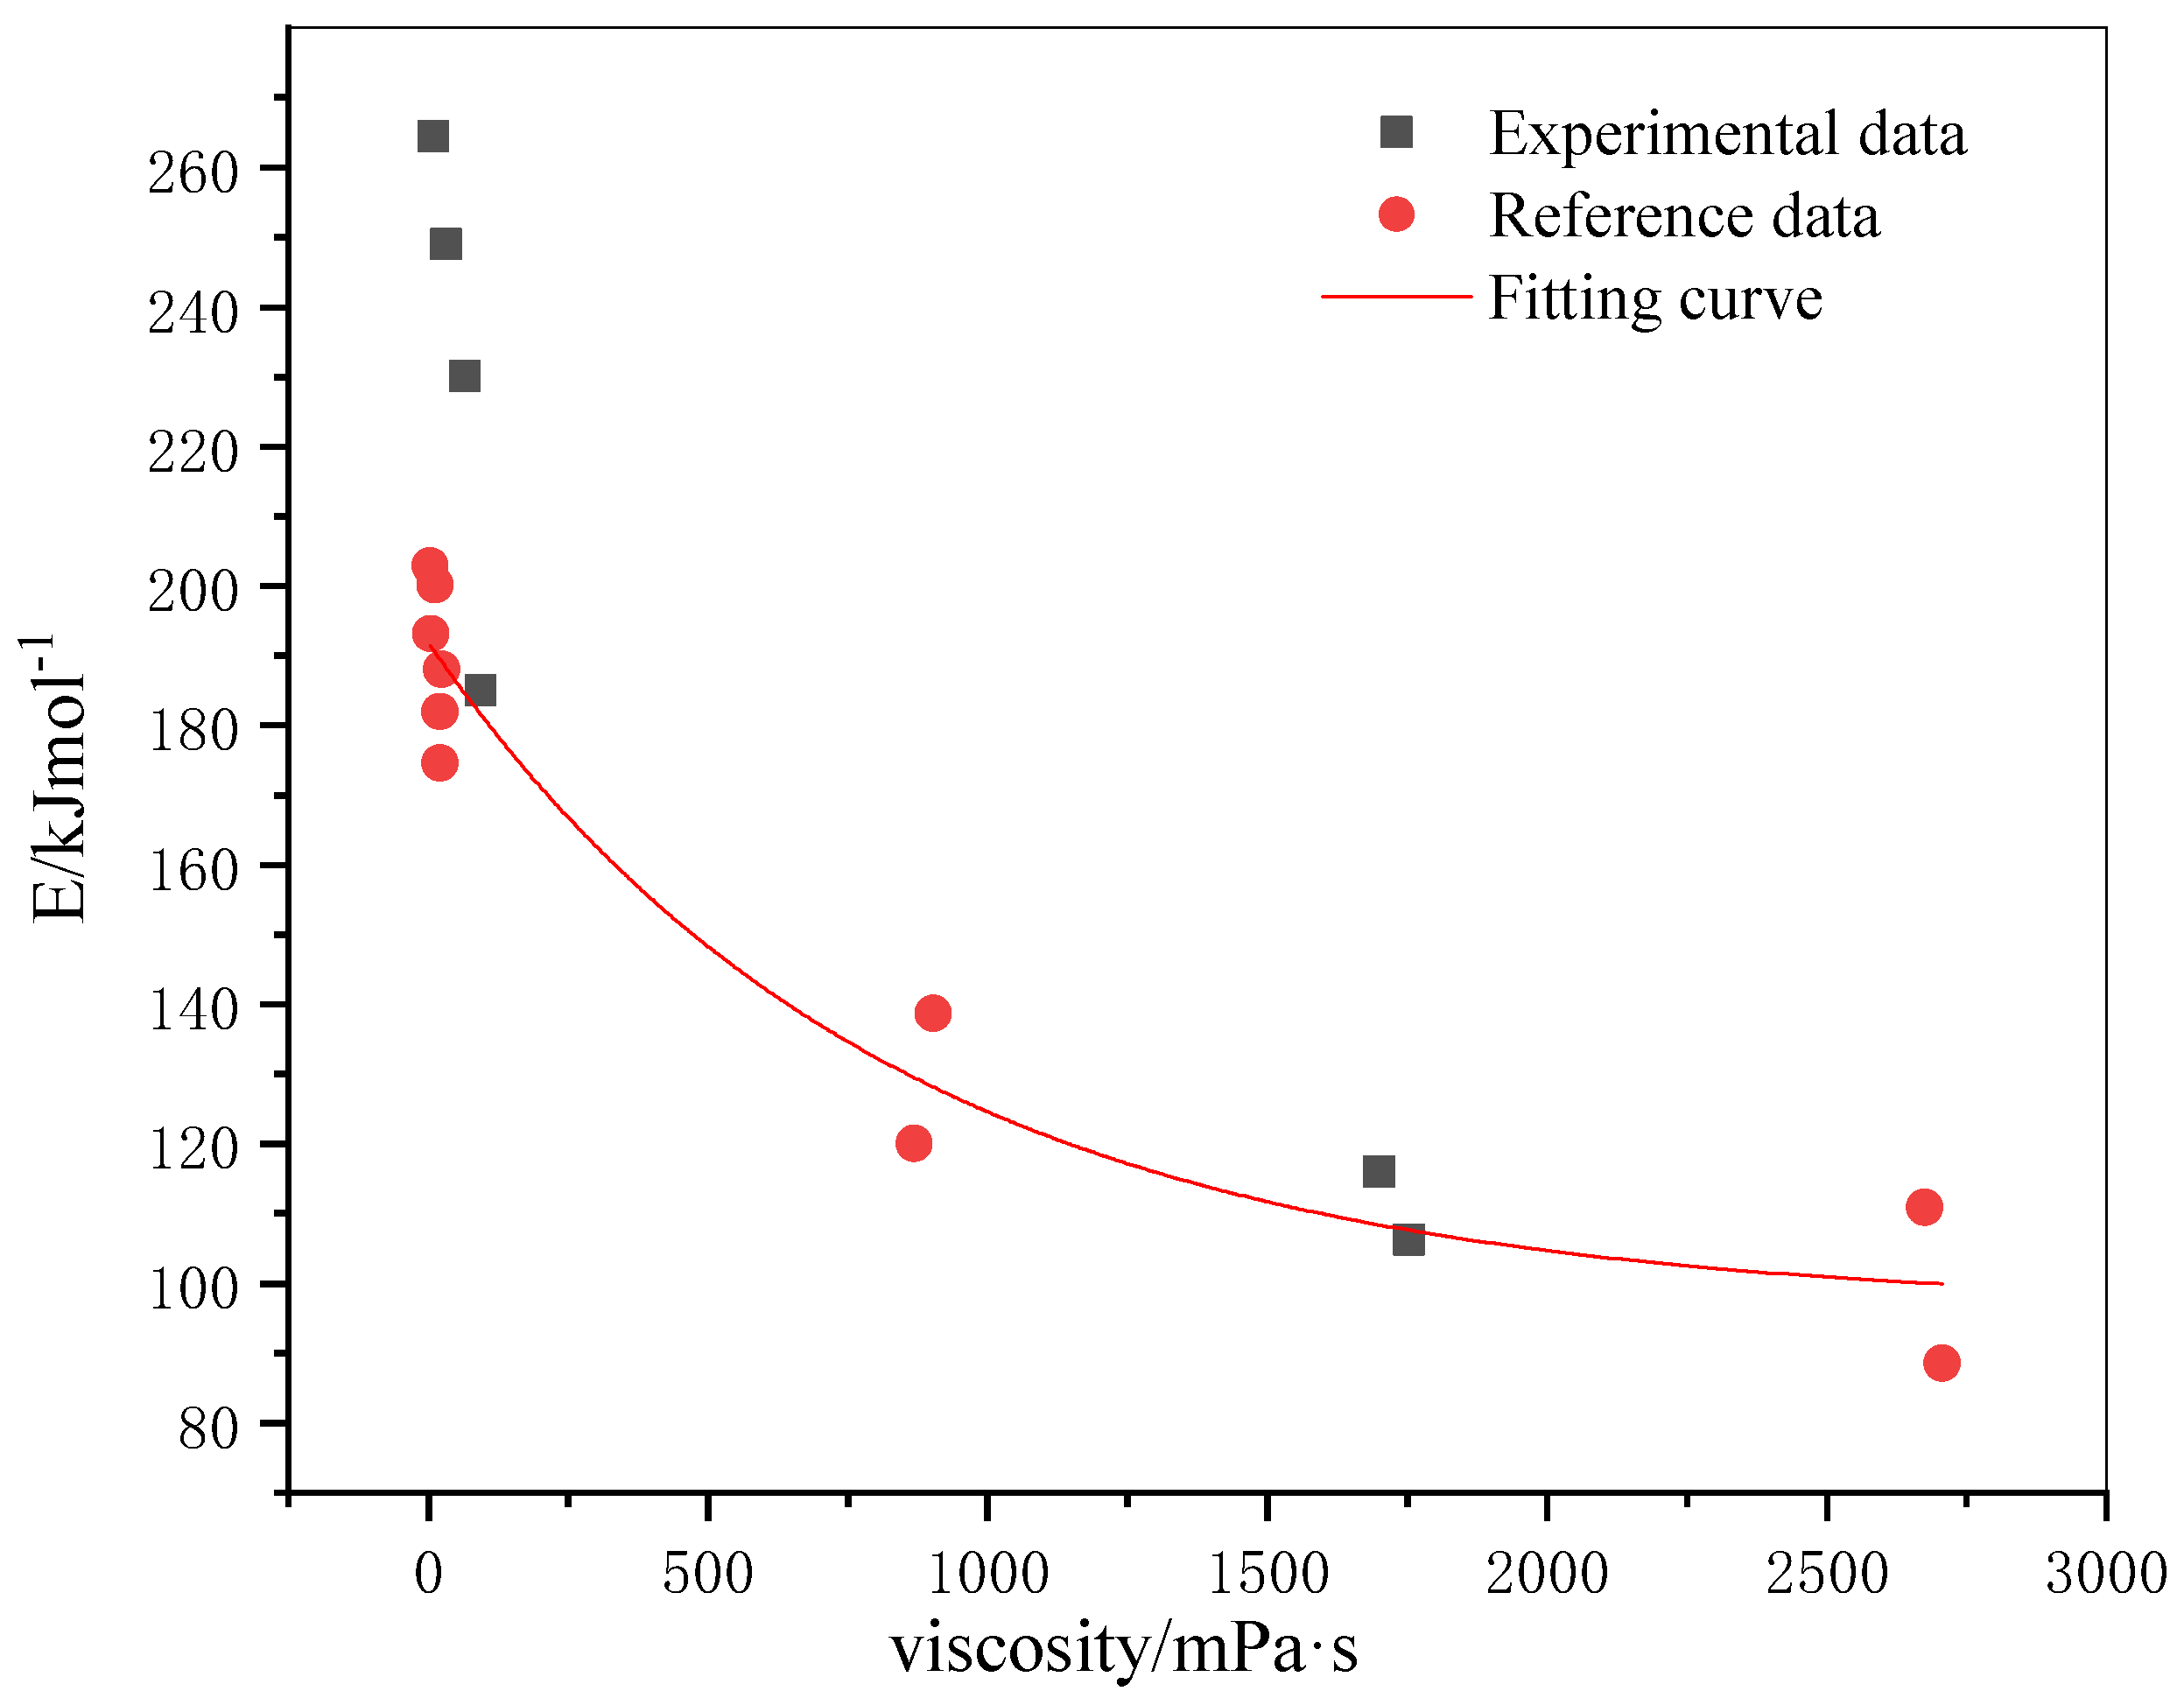
3.5. Effect of Viscosity on Oxidation Kinetics of Crude Oil

With the increase of crude oil viscosity, crude oil of the low-temperature oxidation reaction temperature range is bigger and bigger, and the fuel deposition scope is smaller and smaller. This is mainly because the lower the viscosity, the more light components contained in crude oil, the less heavy components, the higher the reactivity; on the contrary, the higher the viscosity, the more heavy components contained in crude oil, the less light components, the lower the reactivity, so the greater the viscosity of crude oil, the longer the low-temperature oxidation stage.
The Arrhenius method was used to obtain the oxidation kinetic parameters of crude oil with different viscosities, and the fitting comparison was made with the oxidation kinetic parameters of crude oil studied by predecessors. The relationship between viscosity and activation energy at the low-temperature oxidation stage is shown in Figure 6, and the relationship between viscosity and activation energy at the high-temperature oxidation stage is shown in Figure 7; the black dots represent the experimental data in this article, the red dots represent previous literature data, and the curves represent the fitting results of previous data. By comparing with previous literature, the oxidation kinetic parameters of dilute oil obtained in this work are all relatively high, which is because pure oil was selected for the experiment in this work, while oil sand was selected for the ratio experiment in the literature. Previous studies showed that the activation energy of pure oil was higher than that of oil sand [14,17,27,28,29]. At the same time, the heating rate in this paper is 20 °C/min, and the higher the heating rate, the higher the activation energy of crude oil. The results show that the activation energy of crude oil increases with the increase of crude oil viscosity in the low-temperature oxidation stage, decreases with the increase of crude oil viscosity in the high-temperature oxidation stage, and the range of activation energy reduction in the high-temperature oxidation stage is larger. This is because the low-temperature stage mainly involves the volatilization of light components and the occurrence of oxidation reactions, forming aldehydes, ketones, carboxylic acids, and peroxides (peroxides further undergo bond cracking reaction). As the presence of oxygen promotes the reaction and the energy required for bond breaking of straight-chain alkanes is low, the activation energy is lower than the high-temperature oxidation stage. As the viscosity increases, the content of light components decreases, and the content of heavy components increases. Therefore, the activation energy of the reaction in the low-temperature oxidation stage increases with the increase of viscosity. In the high-temperature oxidation stage, the activation energy decreases with the increase of viscosity, which is also due to the generation of highly active substances such as hydroxyl radicals and highly active coke during the fuel deposition stage by the colloid. These substances have high activity and low activation energy. Therefore, the higher the colloid content, the higher the viscosity, and the lower the activation energy during the high-temperature oxidation stage [25].

4. Conclusions

  • Light oil, ordinary heavy oil I, and ordinary heavy oil II can be divided into three reaction stages during the oxidation process: low-temperature oxidation stage, fuel deposition stage, and high-temperature oxidation stage.
  • After the analysis of the TG-DTG-DSC curve, different crude oils show obvious differences. The mass loss rate of light crude oil in the low-temperature oxidation stage is the largest, and the mass loss rate of ordinary heavy crude oil is smaller than that of light crude oil.
  • Arrhenius method calculated that the activation energy of oil samples with different properties was 39.73–77.74 kJ/mol in the low-temperature oxidation stage and 106.27–264.47 kJ/mol in the high-temperature oxidation stage.
  • The activation energy of crude oil increases with the increase of viscosity in the low-temperature oxidation stage and decreases with the increase of viscosity in the high-temperature oxidation stage.

Author Contributions

Methodology, C.Y.; Validation, K.Y.; Investigation, Y.C., K.Y., L.Y. and T.C.; Writing—original draft, B.L.; Writing—review & editing, C.Y.; Supervision, L.Y. All authors have read and agreed to the published version of the manuscript.

Funding

Supported by the Sichuan Science and Technology Program (No. 2022ZHYZ0007; No. 2022YFSY0007) and the Open funds of the State Key Laboratory of Oil and Gas Reservoir Geology and Exploitation (No. PLN2020-22).

Data Availability Statement

All relevant data are within the paper.

Conflicts of Interest

The authors declare no conflict of interest.

References

  1. Ado, M.R. A detailed approach to up-scaling of the Toe-to-Heel Air Injection (THAI) In-Situ Combustion enhanced heavy oil recovery process. J. Pet. Sci. Eng. 2020, 187, 106740. [Google Scholar] [CrossRef]
  2. Huang, S.; Sheng, J.J. Feasibility of spontaneous ignition during air injection in light oil reservoirs. Fuel 2018, 226, 698–708. [Google Scholar] [CrossRef]
  3. Gutierrez, D.; Kumar, V.; Moore, R.G.; Mehta, S.A. Case history and appraisal of the west buffalo red river unit high-pressure air injection project. In Proceedings of the Hydrocarbon Economics and Evaluation Symposium, Dallas, TX, USA, 1–3 April 2007; pp. 178–187. [Google Scholar] [CrossRef]
  4. Mehrabi-Kalajahi, S.; Varfolomeev, M.A.; Yuan, C.; Zinnatullin, A.L.; Rodionov, N.O.; Vagizov, F.G.; Yakimova, L.S. Improving heavy oil oxidation performance by oil-dispersed CoFe2O4 nanoparticles in In-situ combustion process for enhanced oil recovery. Fuel 2021, 285, 119216. [Google Scholar] [CrossRef]
  5. Bartlett, G.; Vossoughi, S.; Willhite, G.P. Development of a Kinetic Model for In-Situ Combustion and Prediction of the Process Variables using TGA/DSC Techniques. In Proceedings of the SPE Annual Technical Conference and Exhibition, New Orleans, LA, USA, 26 September 1982. [Google Scholar]
  6. Kovscek, A.R.R.; Castanier, L.M.M.; Gerritsen, M.G.G. Improved Predictability of In-Situ-Combustion Enhanced Oil Recovery. SPE Reserv. Eval. Eng. 2013, 16, 172–182. [Google Scholar] [CrossRef] [Green Version]
  7. Zhu, Z.; Liu, Y.; Liu, C.; Kovscek, A.R. In-Situ Combustion Frontal Stability Analysis. In Proceedings of the SPE Western Regional Meeting, San Jose, CA, USA, 23–26 April 2019; Volume 26, pp. 2271–2286. [Google Scholar] [CrossRef]
  8. Vossoughi, S.; Ei-Shoubary, Y. Kinetics of Crude-Oil Coke Combustion. In Proceedings of the SPE International Symposium on Oilfield Chemistry, San Antonio, TX, USA, 4–6 February 1987; pp. 271–278. [Google Scholar] [CrossRef]
  9. Srinivasa Reddy, D.; Suresh Kumar, G. Numerical Simulation of Heavy Crude Oil Combustion in Porous Combustion Tube. Combust. Sci. Technol. 2015, 187, 1905–1921. [Google Scholar] [CrossRef]
  10. Tirado, A.; Yuan, C.; Varfolomeev, M.A.; Ancheyta, J. Kinetic modeling of aquathermolysis for upgrading of heavy oils. Fuel 2022, 310, 122286. [Google Scholar] [CrossRef]
  11. Pu, W.; Chen, Y.; Li, Y.; Zou, P.; Li, D. Comparison of Different Kinetic Models for Heavy Oil Oxidation Characteristic Evaluation. Energy Fuels 2017, 31, 12665–12676. [Google Scholar] [CrossRef]
  12. Zhao, S.; Pu, W.; Sun, B.; Gu, F.; Wang, L. Comparative evaluation on the thermal behaviors and kinetics of combustion of heavy crude oil and its SARA fractions. Fuel 2019, 239, 117–125. [Google Scholar] [CrossRef]
  13. Kok, M.V. Characterization of medium and heavy crude oils using thermal analysis techniques. Fuel Process. Technol. 2011, 92, 1026–1031. [Google Scholar] [CrossRef]
  14. Kok, M.V. Thermal behavior and kinetics of crude oils at low heating rates by differential scanning calorimeter. Fuel Process. Technol. 2012, 96, 123–127. [Google Scholar] [CrossRef]
  15. Gundogar, A.S.; Kok, M.V. Thermal characterization, combustion and kinetics of different origin crude oils. Fuel 2014, 123, 59–65. [Google Scholar] [CrossRef]
  16. Hu, F.; Xiong, B.; Huang, X.; Liu, Z. Theoretical analysis and experimental verification of diminish the diffusion influence on determination of char oxidation kinetics by thermo-gravimetric analysis. Energy 2023, 275, 127460. [Google Scholar] [CrossRef]
  17. Liu, P.-G.; Pu, W.-F.; Ni, J.-H.; Ma, X.-P.; Zhang, J.; Liu, M. Thermal investigation on crude oil oxidation kinetics through TG/DTG and DTA tests. Pet. Sci. Technol. 2016, 34, 685–692. [Google Scholar] [CrossRef]
  18. Pu, W.-F.; Wang, L.-L.; Peng, X.-Q.; Li, N.; Zhao, S. Effects of aromatics, resins, and asphaltenes on oxidation behavior and kinetics of heavy crude oil. Pet. Sci. Technol. 2020, 38, 815–822. [Google Scholar] [CrossRef]
  19. Yuan, C.; Emelianov, D.A.; Varfolomeev, M.A.; Rodionov, N.O.; Suwaid, M.A.; Vakhitov, I.R. Mechanistic and kinetic insight into catalytic oxidation process of heavy oil in in-situ combustion process using copper (Ⅱ) stearate as oil soluble catalyst. Fuel 2021, 284, 118981. [Google Scholar] [CrossRef]
  20. Kök, M.V.; Varfolomeev, M.A.; Nurgaliev, D.K. Thermal and mass spectrometer analysis (TG–DTG–MS) of different oAPI gravity crude oils from new oil fields in Turkey. Geoenergy Sci. Eng. 2023, 224, 211598. [Google Scholar] [CrossRef]
  21. Wang, L.; Wang, T.; Bai, Z.; Yuan, C.; Song, W.; Chen, Y.; Wang, J. Thermo-oxidative behavior and kinetics analysis of light and heavy oils based on TG, DSC, and FTIR. Geoenergy Sci. Eng. 2023, 223, 211525. [Google Scholar] [CrossRef]
  22. Kök, M.V.; Pokol, G.; Keskin, C.; Madarász, J.; Bagci, S. Light Crude Oil Combustion in the Presence of Limestone Matrix. J. Therm. Anal. Calorim. 2004, 75, 781–789. [Google Scholar] [CrossRef]
  23. Zhao, S.; Pu, W.; Gao, H.; Wang, R.; Varfolomeev, M.A.; Jiang, Q.; Yuan, C. Isothermal low-temperature oxidation kinetics of heavy crude oil and its oxidized oils. Fuel 2023, 344, 128146. [Google Scholar] [CrossRef]
  24. Clara, C.; Durandeau, M.; Quenault, G. Laboratory Studies for Light-Oil Air Injection Projects: Potential Application in Handil Field. SPE Res. Eval. Eng. 2000, 3, 239–248. [Google Scholar] [CrossRef]
  25. Zhang, H. Kinetics characteristics of the oxidation for different oils in air injection process. Pet. Geol. Oilfield Dev. Daqing 2019, 38, 105–111. [Google Scholar] [CrossRef]
  26. Murugan, P.; Mahinpey, N.; Mani, T.; Freitag, N. Pyrolysis and combustion kinetics of Fosterton oil using thermogravimetric analysis. Fuel 2009, 88, 1708–1713. [Google Scholar] [CrossRef]
  27. Yuan, C.; Varfolomeev, M.A.; Emelianov, D.A.; Eskin, A.A.; Nagrimanov, R.N.; Kok, M.V.; Kopylova, E.V. Oxidation Behavior of Light Crude Oil and Its SARA Fractions Characterized by TG and DSC Techniques: Differences and Connections. Energy Fuels 2017, 32, 801–808. [Google Scholar] [CrossRef]
  28. Kok, M.V.; Gundogar, A.S. DSC study on combustion and pyrolysis behaviors of Turkish crude oils. Fuel Process. Technol. 2013, 116, 110–115. [Google Scholar] [CrossRef]
  29. Kök, M.V.; Varfolomeev, M.A.; Nurgaliev, D.K. TGA and DSC investigation of different clay mineral effects on the combustion behavior and kinetics of crude oil from Kazan region, Russia. J. Pet. Sci. Eng. 2021, 200, 108364. [Google Scholar] [CrossRef]
Figure 1. Mettler Toledo TGA/DSC3+ synchronous thermal analyzer.
Processes 11 02361 g001
Figure 2. TG curves of crude oil samples.
Processes 11 02361 g002
Figure 3. TG/DTG curves of crude oil samples.
Processes 11 02361 g003
Figure 4. TG/DSC curves of crude oil samples.
Processes 11 02361 g004aProcesses 11 02361 g004b
Figure 5. Arrhenius method to calculate the activation energy of different oxidation stages.
Processes 11 02361 g005aProcesses 11 02361 g005b
Figure 6. LTO stage viscosity–activation energy relationship diagram.
Processes 11 02361 g006
Figure 7. HTO stage viscosity–activation energy relationship diagram.
Processes 11 02361 g007
Table 1. Samples viscosities and API gravities (50 °C).
Sample No.Viscosity/(mPa·s)API Gravity
1#9.631.2
2#6622.9
3#10522.1
4#57421.4
5#205319.6
6#292718.3
Table 2. Changes in the quality of crude oil samples.
Sample NameInitial Mass/mgFinal Mass/mgMass Loss Rate/%
Crude oil 126.5950.37898.58
Crude oil 210.30.108598.95
Crude oil 313.2950.160498.79
Crude oil 416.70.636196.19
Crude oil 518.50.38297.94
Crude oil 616.10.41597.42
Table 3. Classification of crude oil samples oxidation stages.
Sample NameLTO/°CFuel Deposition Stage/°CHTO/°C
Crude oil 1280–350350–480480–570
Crude oil 2300–410410–450450–660
Crude oil 3300–360360–450450–610
Crude oil 4310–420420–450450–640
Crude oil 5300–400400–450450–620
Crude oil 6300–410410–420420–650
Table 4. Arrhenius Method to calculate the kinetic parameters of sample crude oil oxidation.
Sample NameE/kJmol−1A/min−1
LTOHTOLTOHTO
Crude oil 150.49264.472.578518.5098
Crude oil 239.73249.041.281212.0165
Crude oil 362.84230.050.262812.4100
Crude oil 466.91185.022.37624.6598
Crude oil 561.08106.271.85820.0876
Crude oil 677.74115.972.80130.2923
Disclaimer/Publisher’s Note: The statements, opinions and data contained in all publications are solely those of the individual author(s) and contributor(s) and not of MDPI and/or the editor(s). MDPI and/or the editor(s) disclaim responsibility for any injury to people or property resulting from any ideas, methods, instructions or products referred to in the content.

