Article

Study on Characteristics of Steam Chamber and Factors Influencing Nitrogen-Assisted Vertical–Horizontal Steam Drainage Development

1
Heavy Oil Development Sub-Company, Xinjiang Oilfield Branch Company, Petro China, Karamay 834000, China
2
Petroleum Engineering School, Southwest Petroleum University, Chengdu 610500, China
3
Tianfu Yongxing Laboratory, Chengdu 610213, China
*
Authors to whom correspondence should be addressed.
Processes 2024, 12(4), 754; https://doi.org/10.3390/pr12040754
Submission received: 6 March 2024 / Revised: 1 April 2024 / Accepted: 3 April 2024 / Published: 8 April 2024
(This article belongs to the Special Issue Process Technologies for Heavy Oils and Residua Upgradings)

Abstract

:
With the notable achievements attained through the implementation of steam-assisted gravity drainage (SAGD), the vertical–horizontal steam drive (VHSD) emerges as a pivotal technological advancement aimed at significantly enhancing the efficiency of thin reservoir heavy oil recovery subsequent to steam cyclic stimulation. The inclusion of nitrogen assistance has proven effective in enhancing the efficacy of gravity drainage techniques in reservoir development. However, it is noteworthy that this method has only led to improvements in approximately 50% of the well groups within the observed field. The comprehensive evaluation index of VHSD was proposed, and as the objective function, it was determined that the greatest contribution to the VHSD technique lies in oil saturation, accounting for 40% of the overall evaluations. This differs from conventional SAGD operations, where reservoir thickness serves as the primary determinant. Building upon an enhanced physical simulation similarity criterion, two comparative injection scheme experiments were conducted to explore the impact of nitrogen injection on the performance of VHSD and the characteristics of the steam chamber. Nitrogen is distributed in the vicinity of the steam chamber, leading to the formation of a dual mechanism characterized by ‘top heat insulation and lateral traction’ on the steam chamber. The lateral traction accounts for approximately 25% of the team chamber volume. Additionally, the inducement of nitrogen causes a downward displacement of crude oil, resulting in its accumulation within the high-temperature region of the steam chamber. This, in turn, enhances the contact area between the high-temperature steam and the crude oil, ultimately leading to improvement in production efficiency. Further validation of the impact of nitrogen on steam lateral traction and interlayer steam drainage within the reservoir was confirmed using Xinjiang oilfield testing. The well temperature increased from 75 °C to 130 °C.

1. Introduction

The commercial development of heavy oil resources has increasingly become a prevalent practice. Among the various techniques available for heavy oil recovery, Steam-Assisted Gravity Drainage (SAGD) [1] holds a prominent position. Since 2010, the Vertical Horizontal well Steam Drive (VHSD) technique has been gradually applied in the oilfield by energy enterprises [2]. The well pattern requires that the vertical wells as steam injection wells are located on both sides of the horizontal wells, the horizontal section is located at the bottom of the oil reservoir, and the perforation position of the vertical wells is 5 m higher than that of the horizontal section. The vertical well continues to inject steam into the reservoir, resulting in its upward movement and subsequent layering to form a steam chamber within the upper region of the reservoir. The crude oil heated by the latent heat of steam vaporization is percolated to the bottom horizontal well due to the combined effects of steam displacement and gravitational potential energy [3,4]. The conventional SAGD technology has excessive heat loss, and the overlapping steam creates a rapid development of the steam chamber in the upward region. Once the steam chamber reaches the uppermost section of the oil layer, the overburden becomes heated, leading to decreased heat utilization efficiency, reduced cumulative oil–steam ratio (cOSR), and a subsequent decrease in economic benefits. In order to address this issue, in [5], the non-condensate gas-assisted steam gravity drainage technology (SAGP) was proposed, with non-condensate gas being injected as an additional injection agent during the SAGD process. Due to the lower density of non-condensate gas compared to wet steam, the non-condensate gas tends to accumulate in the upper region of the steam chamber through gravity differentiation, resulting in the formation of a thermal insulation layer. This phenomenon effectively diminishes the vertical temperature gradient of the advancing steam front, thereby minimizing heat dissipation into the overburden formation. Consequently, the lateral migration and expansion of the steam chamber are significantly enhanced [6,7]. Zhang et al. [8] revealed, through the laboratory physical simulation experiments, that the non-condensing characteristics of non-condensing gas led to gas accumulation and oscillation during the migration of the non-condensing gas slug, resulting in gas pointing and thus accelerating the vertical growth of the steam chamber.
The performance of SAGD is influenced by numerous factors. According to Butler’s classical analytical model [9], reservoir properties constitute one of the primary influential factors. Additionally, production conditions exert a significant impact on the overall performance of SAGD operations. Dong et al. [10] conducted a detailed analysis of the factors impacting the performance of SAGD using production data from the Bohai oilfield. They proposed an empirical formula to predict the SAGD recovery and cOSR. Based on their findings, reservoir thickness, permeability, and pressure were identified as crucial parameters with a significant influence on the performance of SAGD operations. Gao et al. [11] employed a two-dimensional physical model to investigate SAGD production in thick and thin reservoirs within block D of the L oilfield. Their study revealed that, in comparison to thick reservoirs, the steam chamber in thin reservoirs primarily laterally and rapidly reaches the top, resulting in lower cOSR. Therefore, it is widely acknowledged that the thickness of the oil layer plays a critical role in determining the performance of SAGD operations. Water saturation exerts influence on both the reserves and the initial mobility of water. In the case of a certain irreducible water saturation, a higher initial mobile water saturation is associated with increased steam injection capacity, as well as a greater proportion of convective heat transfer in the heat exchange process. Baker et al. [12] conducted numerical simulations on a set of horizontal well pairs within the Athabasca reservoir in Canada. Their study findings indicate that a significantly higher mobile water saturation level compared to the irreducible water saturation has a substantial impact on the SAGD production process. In general, reservoirs with water saturation ranging from 0.2 to 0.25 are deemed more favorable for SAGD production. At the same time, when the water saturation at the bottom of the reservoir is too high, there is substantial heat loss, and the existence of water layer affects the growth height of the steam chamber. The spacing between injection and production wells plays a crucial role in determining both the preheating time and the sub-cool levels. The spacing between adjacent SAGD wells not only determines the individual well production performance, but also influences the duration of steam chamber interaction between adjacent wells. Siavashi et al. [13,14] employed various optimization methods to investigate the impact of different well spacings (9, 14, 20, 27 m) on oil production. The computational results indicated that larger well spacings resulted in higher ultimate oil recovery. Rajan G. Patel et al. [15] employed a non-linear SAGD predictive model, while Sasaki et al. [16] conducted a two-dimensional experimental study. Their research findings indicate that as the well spacing increases, the steam chamber rise rate and the oil production rate also increase. However, considering the combined influence of heavy oil fluid properties and thermal conductivity characteristics, the optimal spacing between well pairs was determined to be 100 m [17]. The amount of steam injection directly determines the magnitude of energy supplied to the reservoir. However, this does not imply that greater steam injection leads to better results, as excessive steam injection may result in steam breakthrough in production wells. Lei Tao et al. [18] discovered that increasing the steam injection rate can result in an increase in oil production rate and a decrease in the oil-to-steam ratio (OSR).
In April 2022, one block in the Xinjiang oilfield initiated a targeted remediation of low-efficiency SAGD well pairs. On 30 July 2022, nitrogen-assisted measures were implemented. The production indicators from the demonstration area, as illustrated in Figure 1, demonstrate a 37.0% increase in the cOSR, rising from 0.180 to 0.247. Additionally, there was a decrease in the water cut, an improvement in oil production levels, and significant savings in steam consumption, amounting to 50,000 metric tons. The cost savings amounted to RMB 420,000. However, the effectiveness of nitrogen-assisted measures in the extension area was found to be inadequate (Figure 2). The cOSR and the production-to-injection ratio exhibited a decline, while the oil production level remained relatively stable. Only a slight downward trend in the water cut was observed after nitrogen injection. The overall production outcome did not meet the expectations set forth in the project plan.
This study aims to identify the key factors influencing VHSD and determine the contribution of each factor to the development effectiveness of VHSD through theoretical analysis. A comprehensive evaluation index for the comprehensive assessment of VHSD was proposed to evaluate the reservoir and fluid characteristics as well as production conditions influence on VHSD development. Furthermore, introducing a mobility correction factor into the original classical SAGD physical simulation time equivalent model, it aims to elucidate the mechanism of nitrogen-assisted VHSD through physical simulations, providing theoretical guidance for optimizing nitrogen-assisted VHSD.

2. Factors Influencing VHSD and Contribution Analysis

Factors such as reservoir thickness, oil saturation, injection temperature, steam quality, and production–injection ratio have significant impacts on performance during steam-assisted gravity drainage development. Investigating the contribution of these factors to the production capacity of VHSD holds practical significance. The comprehensive evaluation index was proposed, denoted as M, as the dependent variable, with reservoir thickness, oil saturation, production-to-injection ratio, injection temperature, and steam quality as independent variables. A comprehensive evaluation method is established to assess the aforementioned factors’ contributions to VHSD.

2.1. Evaluation Indicator

In steam-assisted gravity drainage (SAGD) oil recovery, the cumulative oil-to-steam ratio (cOSR) is commonly used as an economic evaluation indicator, while the cumulative oil production (Co) serves as a technical evaluation indicator. Thus, in designing a comprehensive evaluation index, it is essential to ensure that the index holds both economic and technical significance. Assuming the existence of a comprehensive evaluation index denoted as M, it can be defined as the product of the cOSR and Co at the steam breakthrough:
M p = c O S R p × C o p ,
where c O S R is the cumulative oil-to-steam ratio at the steam breakthrough, m3/m3, C o is the cumulative oil production at the steam breakthrough, m3, and p is the evaluation parameters, namely reservoir thickness, oil saturation, production–injection ratio, injection temperature, and steam quality.
As shown in Table 1, different levels of each influencing factor are selected. Using numerical simulation methods, the cumulative oil-to-steam ratio and cumulative oil production at the steam breakthrough for each level are calculated. Then, the comprehensive evaluation index is calculated using Equation (1). To compare the impacts of different influencing factors on production performance, the comprehensive evaluation index at different levels is normalized. The unit compound evaluation index, denoted as N p , is defined. The calculation formula is as follows:
N p = M n M n 1 Δ p n 1 ,  
where N p is the unit compound index for factor p, n is the number of different levels for each influencing factor, Δ p is the difference between adjacent levels of each factor, and M n , M n 1 are comprehensive evaluation index corresponding to adjacent levels of each factor.
The cumulative oil-to-steam ratio and cumulative oil production forecast results with the operating parameters, including production-to-injection ratio (PIR), steam injection temperature, and steam quality, under different reservoir conditions of oil layer thickness and oil saturation are calculated using Equation (1) to obtain the comprehensive evaluation index. The unit compound evaluation index is then calculated using Equation (2). The results are shown in Table 1.
Based on the comparison of unit compound index for each factor in Figure 3, the contribution degrees of each factor are determined as follows: oil saturation > production-to-injection ratio > steam quality > oil layer thickness > steam injection temperature. A detailed analysis is provided in Section 2.3.

2.2. Validation of the Relationships between Influencing Factors

The relationships of the above influencing factors were validated using the standardized regression coefficient method. A five-factor four-level orthogonal experiment was designed within the ranges of 12–22 m for oil layer thickness, 0.5–0.8 for oil saturation, 1.02–1.3 for production-to-injection ratio, 220–300 °C for steam injection temperature, and 0.6–0.8 for steam quality. As shown in Table 2, a total of 25 sets of experimental models were obtained, with the comprehensive evaluation indicators labeled as M1–25. In addition, the breakthrough timing of steam was determined at the end of each simulation for further analysis of the impact level of breakthrough timing on VHSD recovery performance.
The mathematical relationship for obtaining the comprehensive evaluation index through multiple linear regression is as follows:
i = 1 i = 25 M i = b 0 + j = 1 j = 5 b j × p j ,  
where M i is the unit compound index for each orthogonal experiment group, b 0 is the constant term in the equation, b j is the standardized regression coefficients for each influencing factor, and p j is the evaluation parameters.
Using the SPSS data analysis software, standardized regression coefficients for each factor were obtained using the method of standardized regression coefficients, indicating the contribution degree of influence of each factor. As shown in Figure 4, compared to Figure 3, the relationship of influence contribution degree among factors is consistent: oil saturation > production-to-injection ratio > steam quality > oil layer thickness > steam injection temperature. This demonstrates that using a unit compound evaluation index can effectively determine the contribution of each factor’s influence.

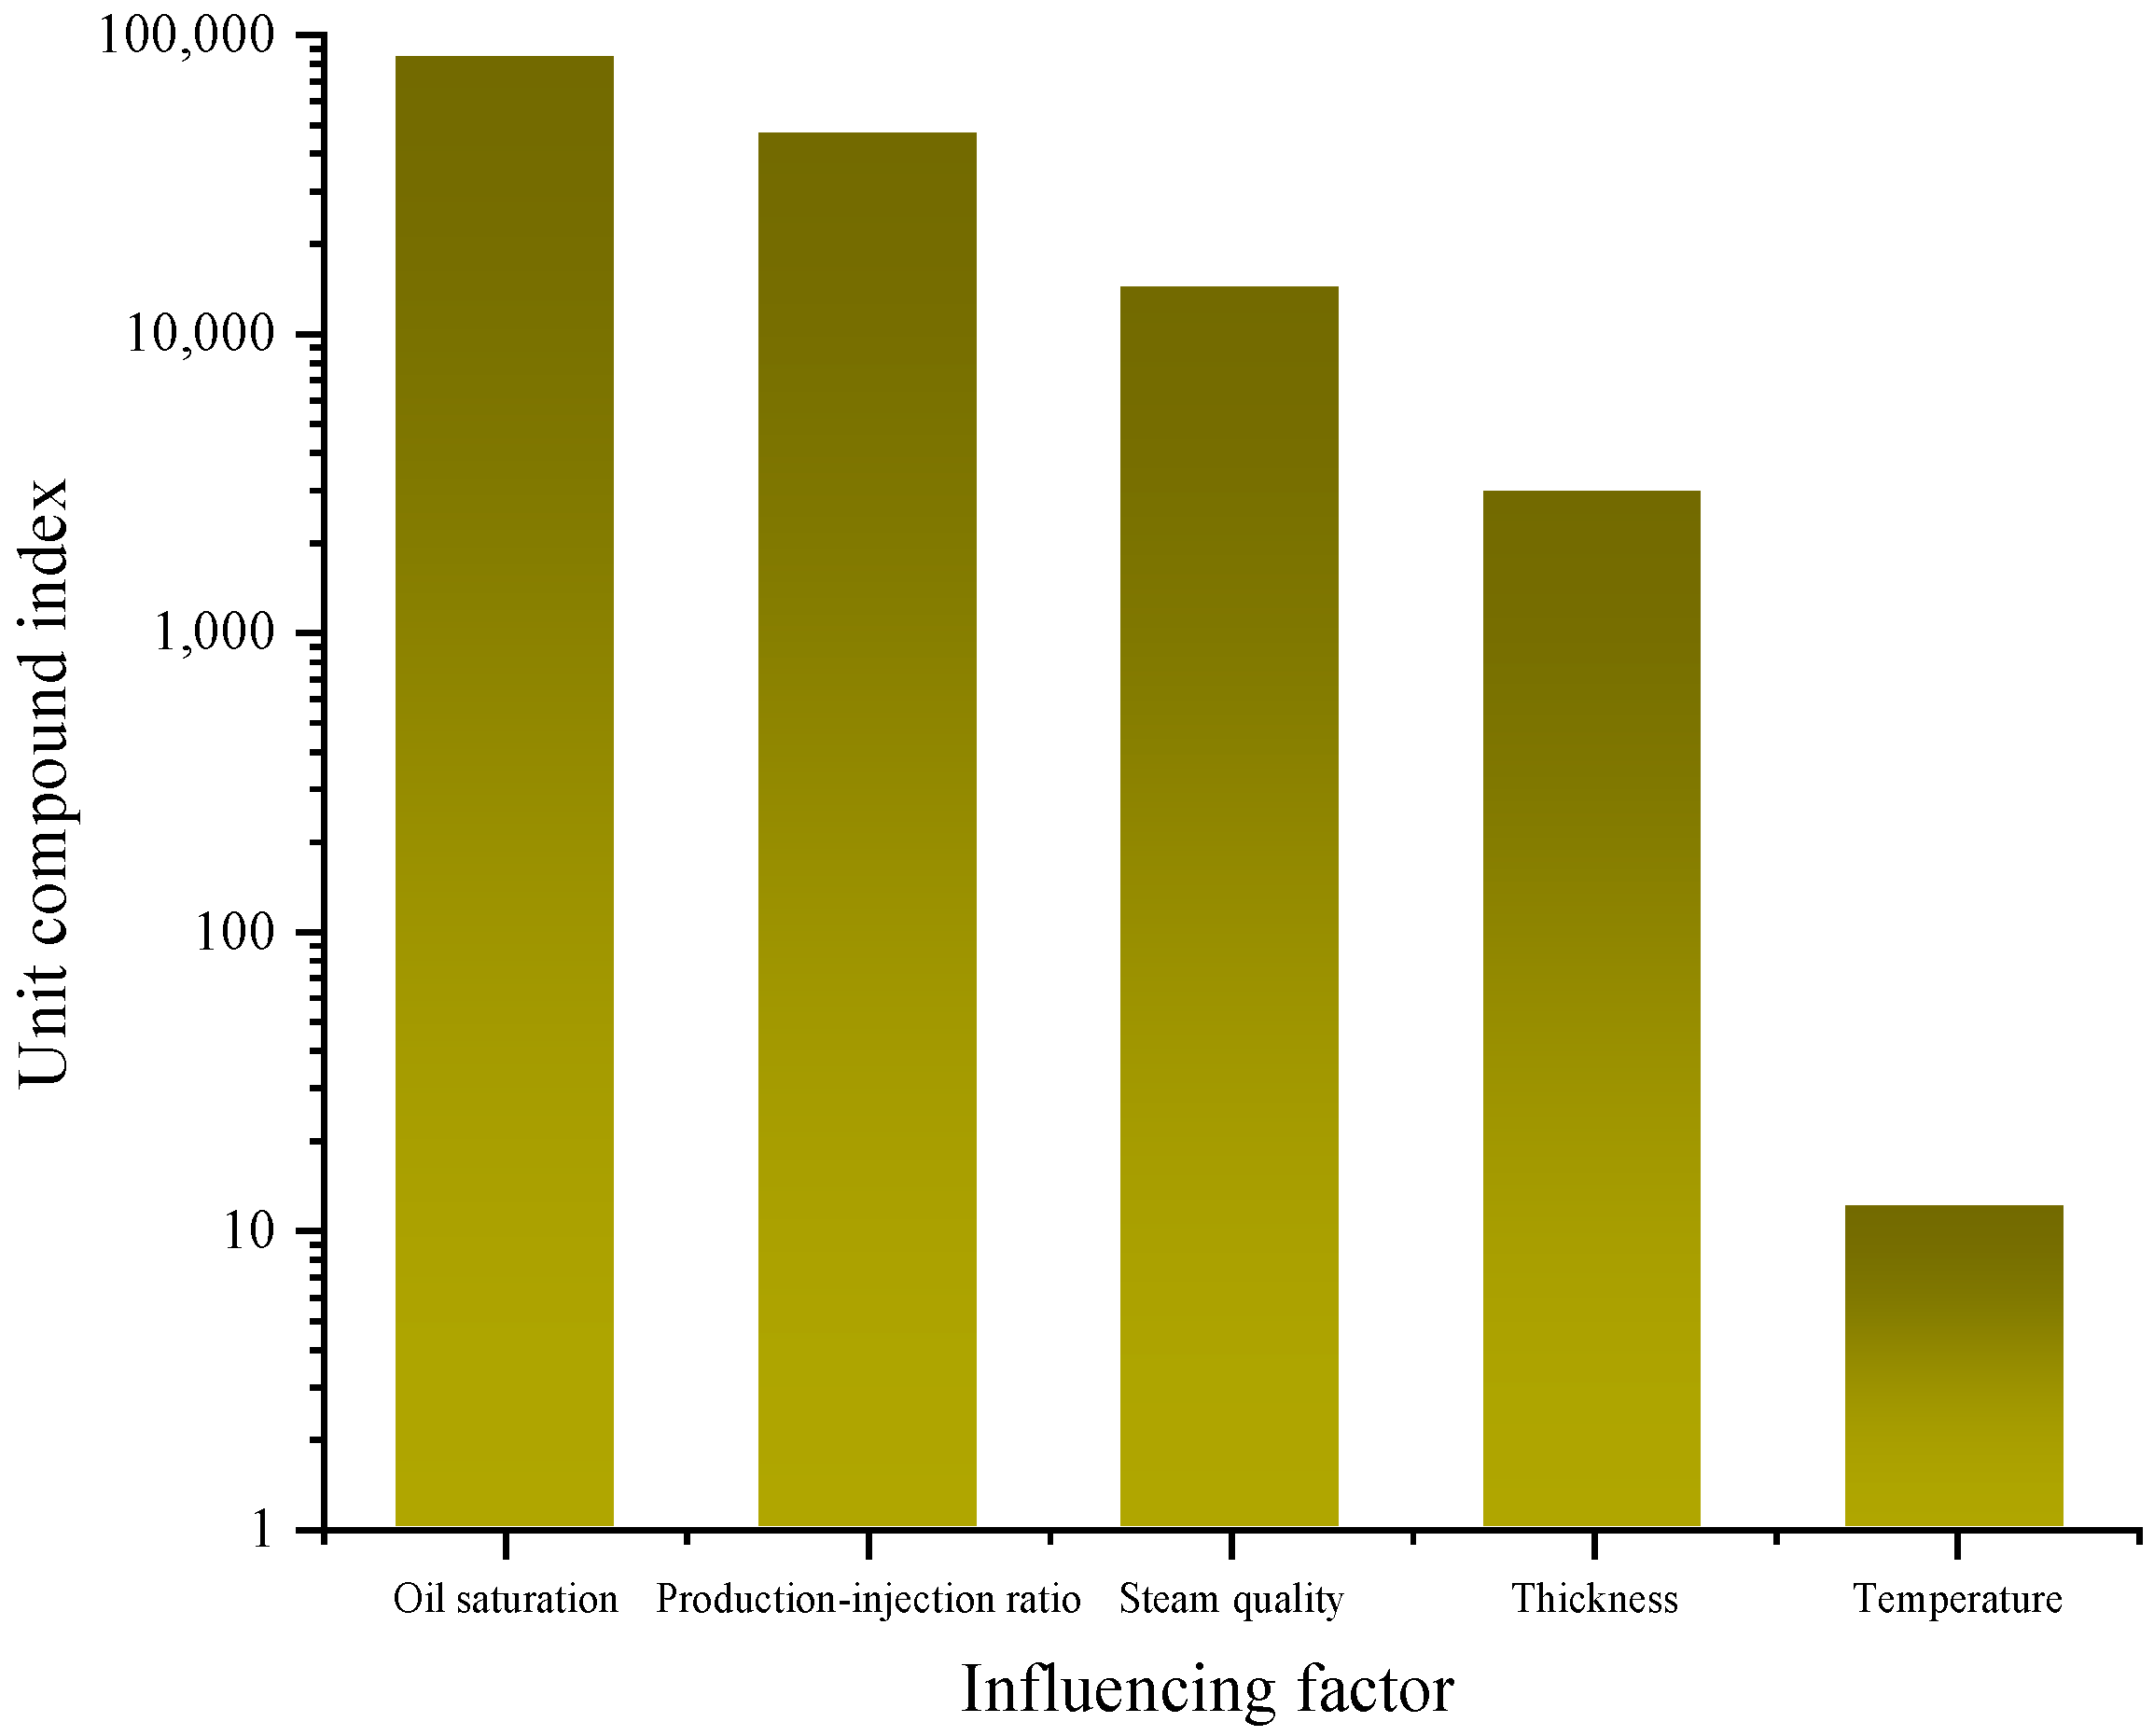
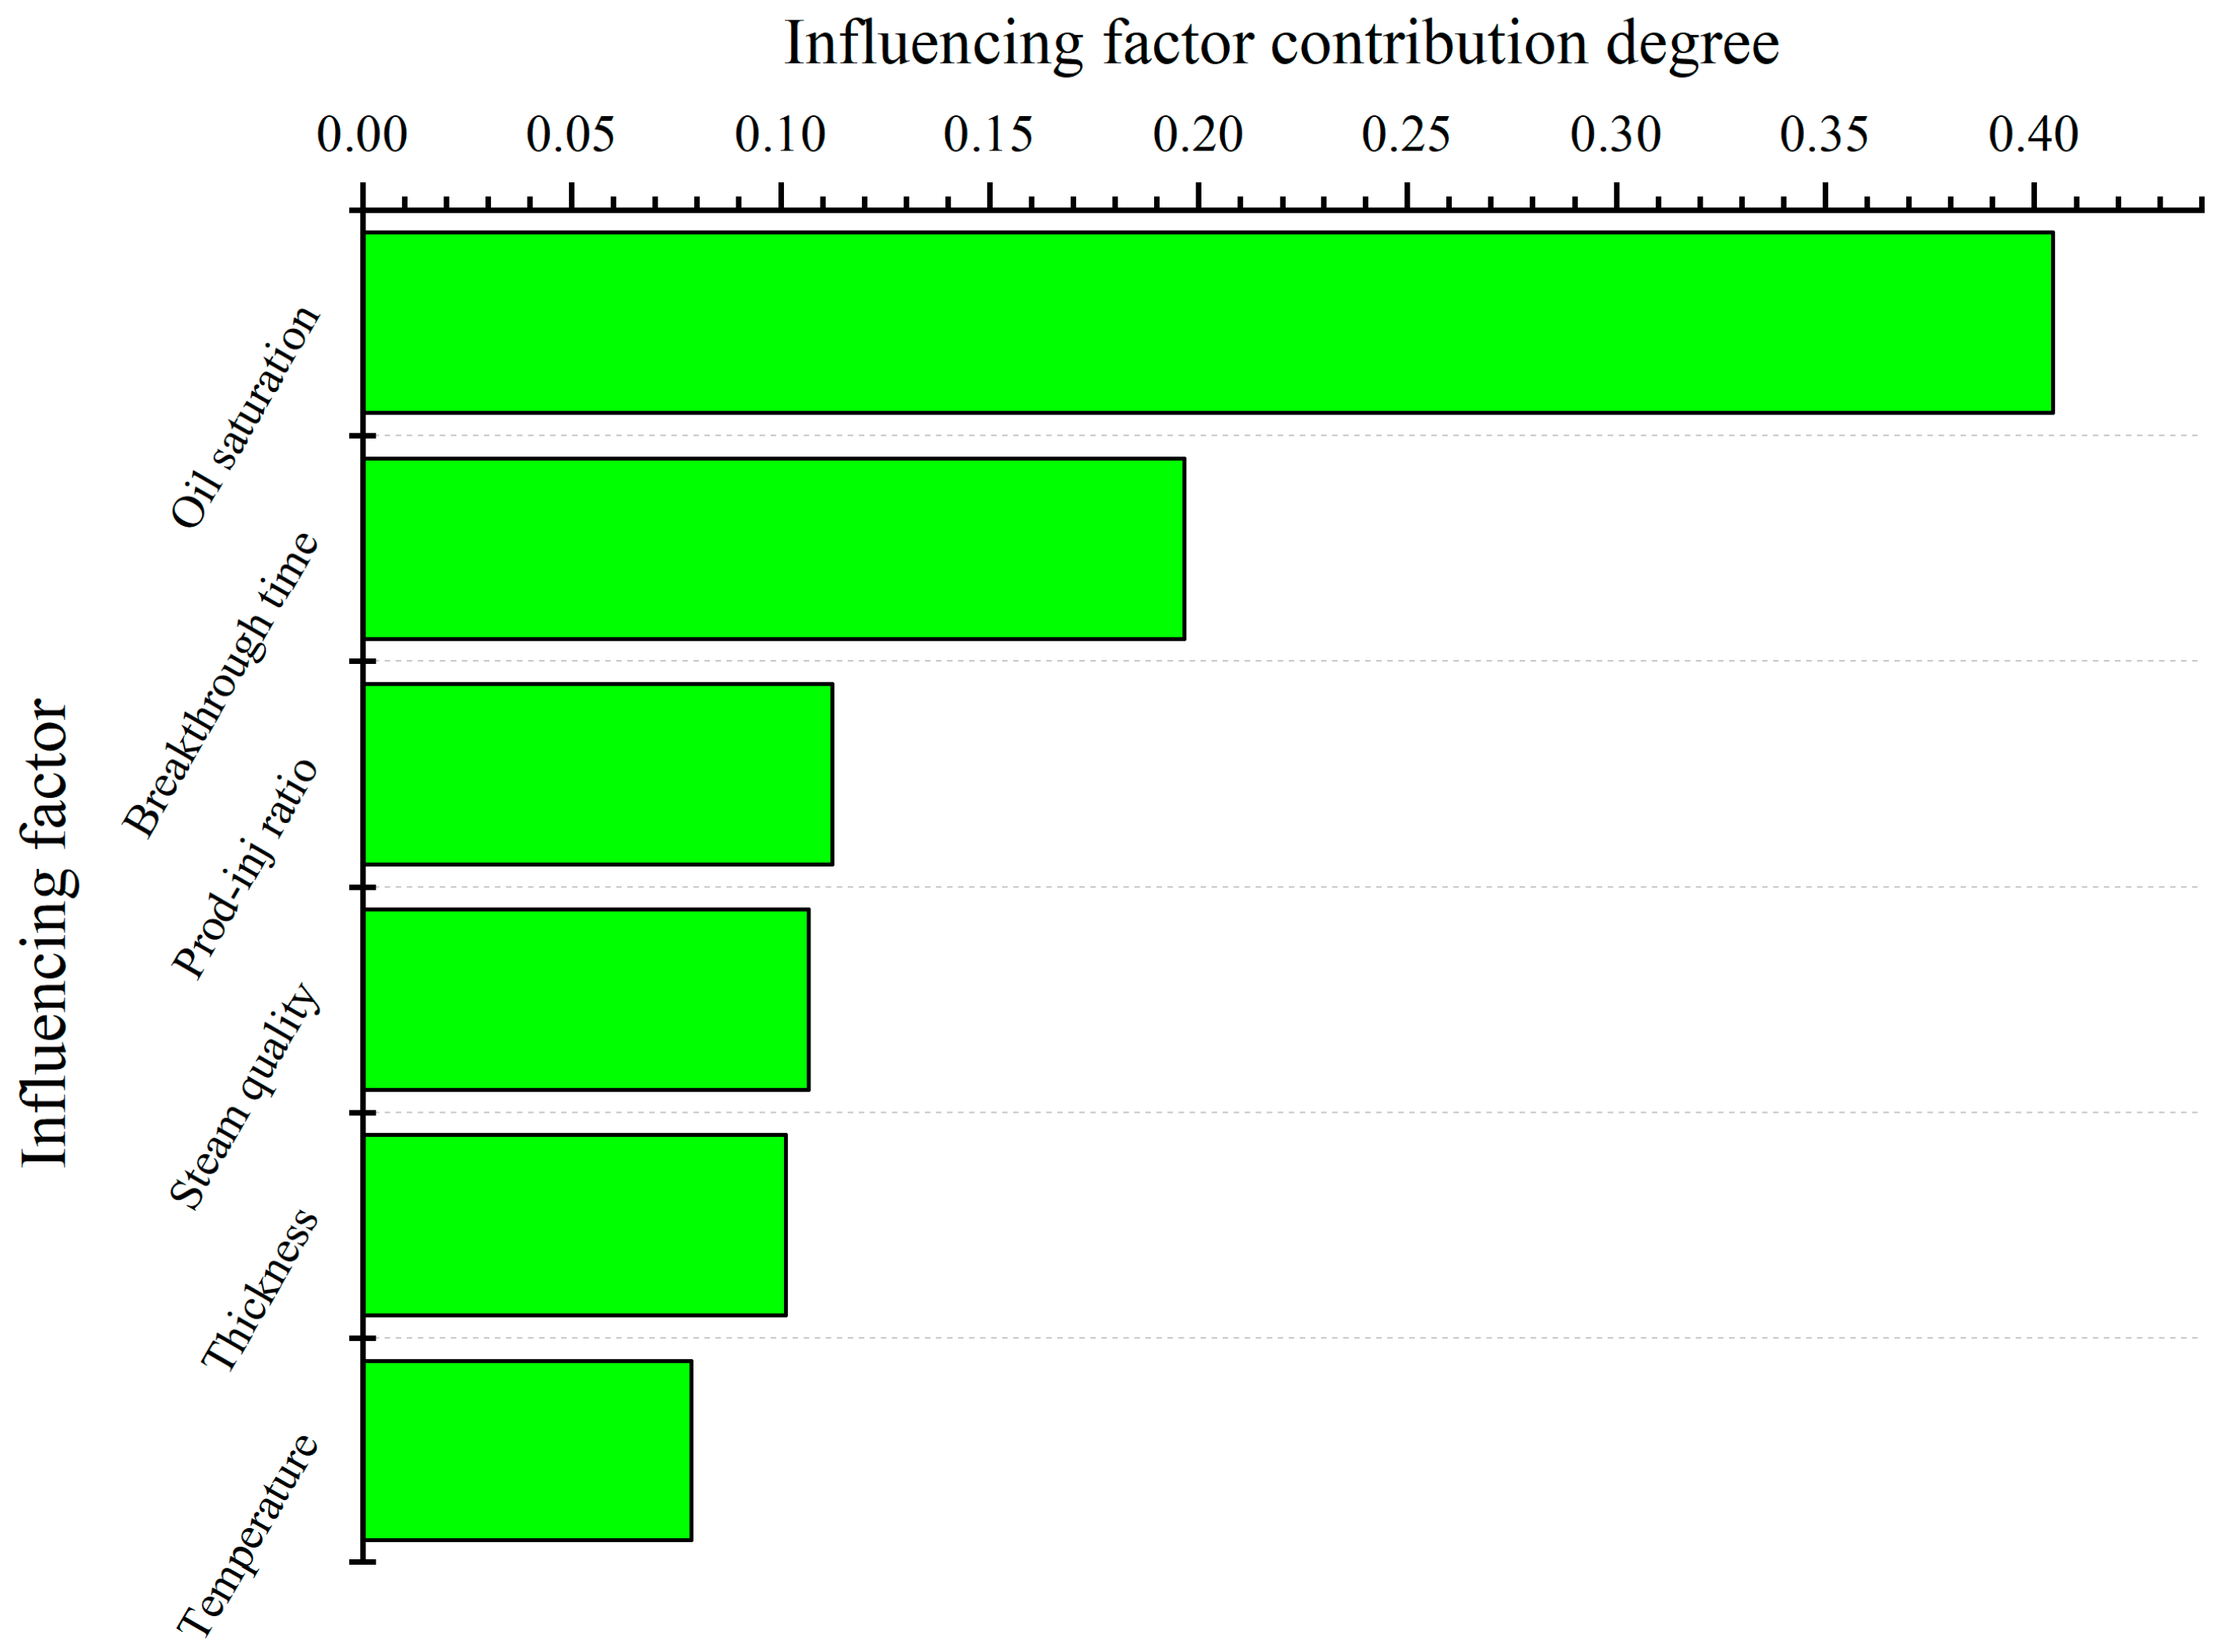
2.3. Analysis of Evaluation Results

The factors that influence VHSD performance can be divided into two categories. The first category includes reservoir and fluid properties, such as oil saturation and oil layer thickness. The oil layer thickness influences both the reserves and the shape of the steam chamber. A thicker oil layer facilitates a higher oil production rate, a more gradual decline in production, and a larger steam chamber height. When the oil saturation is significantly higher than the connate water saturation, it greatly affects the production process of SAGD [12]. The comprehensive evaluation index M is the product of cumulative oil production and cumulative oil-to-steam ratio at the steam breakthrough stage. Oil saturation influences both reserves and thermal efficiency. Therefore, oil saturation directly affects cumulative oil production and cumulative oil-to-steam ratio, making oil saturation the most significant contributing factor. Another category is production conditions, including the production–injection ratio, steam quality, and steam temperature. Production–injection reflects the balance of reservoir pressure. Field development dynamics have shown that maintaining a production–injection ratio between 1.0 and 1.1 can effectively sustain reservoir pressure and steam chamber expansion. Excessive or insufficient production-to-injection ratios can lead to flashing at the bottom of production wells, resulting in steam breakthrough and decreasing thermal efficiency and cumulative oil production. Steam quality refers to the percentage by mass of dry saturated steam in every kilogram of wet steam. A higher steam quality indicates a greater amount of dry steam per unit of steam, resulting in higher latent heat within the steam and greater thermal energy carried by the steam chamber, leading to a wider reach of the steam chamber. The higher the steam temperature, the greater the heat carried by the steam. However, superheated steam has limited latent heat, thus providing limited expansion effects on the steam chamber. Therefore, in terms of VHSD, steam temperature contributes less compared to the production-to-injection ratio and steam quality.
Breakthrough timing refers to the moment when injected steam reaches the production well. The impact of breakthrough timing on the comprehensive evaluation index is greater than that of production conditions and even greater than that of reservoir thickness. This conclusion indicates the critical importance of controlling sub-cool in the VHSD production process.

3. Two-Dimensional Physical Simulation Experiment of VHSD

3.1. Similarity Criteria Modification

Based on the physical simulation similarity criteria of SAGD, the reservoir prototype and the experimental model are interconnected through similarity theory, resulting in the approximation of the simulation results of the experimental model to that of the reservoir prototype. The prototype refers to the actual reservoir system, such as the fluid flow process or configuration within an oil reservoir, while the model represents a scaled-down system of the reservoir parameters in a laboratory setting. Similarity theory refers to the concept of proportionally transferring the geometric dimensions, physical conditions, boundary conditions, and other relevant aspects of the prototype onto a scaled-down indoor model, and then converting the experimental results of the model back to the oil field prototype using the same scaling ratio. This approach enables the conversion between the model and the prototype.
Professor Jiang [19] proposed the physical simulation similarity criteria for SAGD, including geometric similarity, time similarity, and material property similarity.
Geometric similarity:
W L m = W L f
h Z m = h Z f
Material property similarity:
B = k g Z α Δ S 0 μ v s
K m K f = Z α ϕ Δ S 0 μ v s f Z α ϕ Δ S 0 μ v s m
Time similarity:
α t Z 2 m = α t Z 2 f
t m t f = Z m Z f 2 α f α m
The original time equivalent model did not account for the changes in mobility due to the variation in permeability in the similarity criteria, leading to a significant underestimation of the model’s actual equivalent time. By introducing a mobility correction factor into the original time equivalent model, the similarity criteria are made more in line with the field actual conditions:
t m t f = k f μ f k m μ m Z m h f 2 α f α m
t m = t f k f k m Z m h f 2 α f α m
Nomenclature:
W—Distance between vertical and horizontal wells; prototype unit is m, model unit is cm;
L—Horizontal well length; prototype unit is m, model unit is cm;
Z—Reservoir thickness; prototype unit is m, model unit is cm;
t—Production time; prototype unit is year (a), model unit is min;
m—Representative experimental model;
f—Representative field prototype;
ρ—Reservoir fluid density, kg/m3;
B—Similarity number;
K—Permeability, 10−3 μm2;
μ—Oil viscosity, cp;
vs—Dynamic viscosity of oil at steam temperature, m2/s;
ΔS0—Mobile oil saturation;
ϕ —Porosity;
α —Thermal diffusion coefficient; reservoir value: 0.081 m2/d, model value: 0.035 m2/d.
The original model of 60 min is only equivalent to 0.17 years in the actual field condition, while the modified model of 60 min is equivalent to 4.21 years in the actual field condition. The experimental process typically lasts for 2–3 h, and based on the production data from the field blocks, 1 h should be equivalent to approximately 4 years of actual production time. The current model adjustment is thus closer to the actual production conditions (refer to Table 3).

3.2. Experimental Design

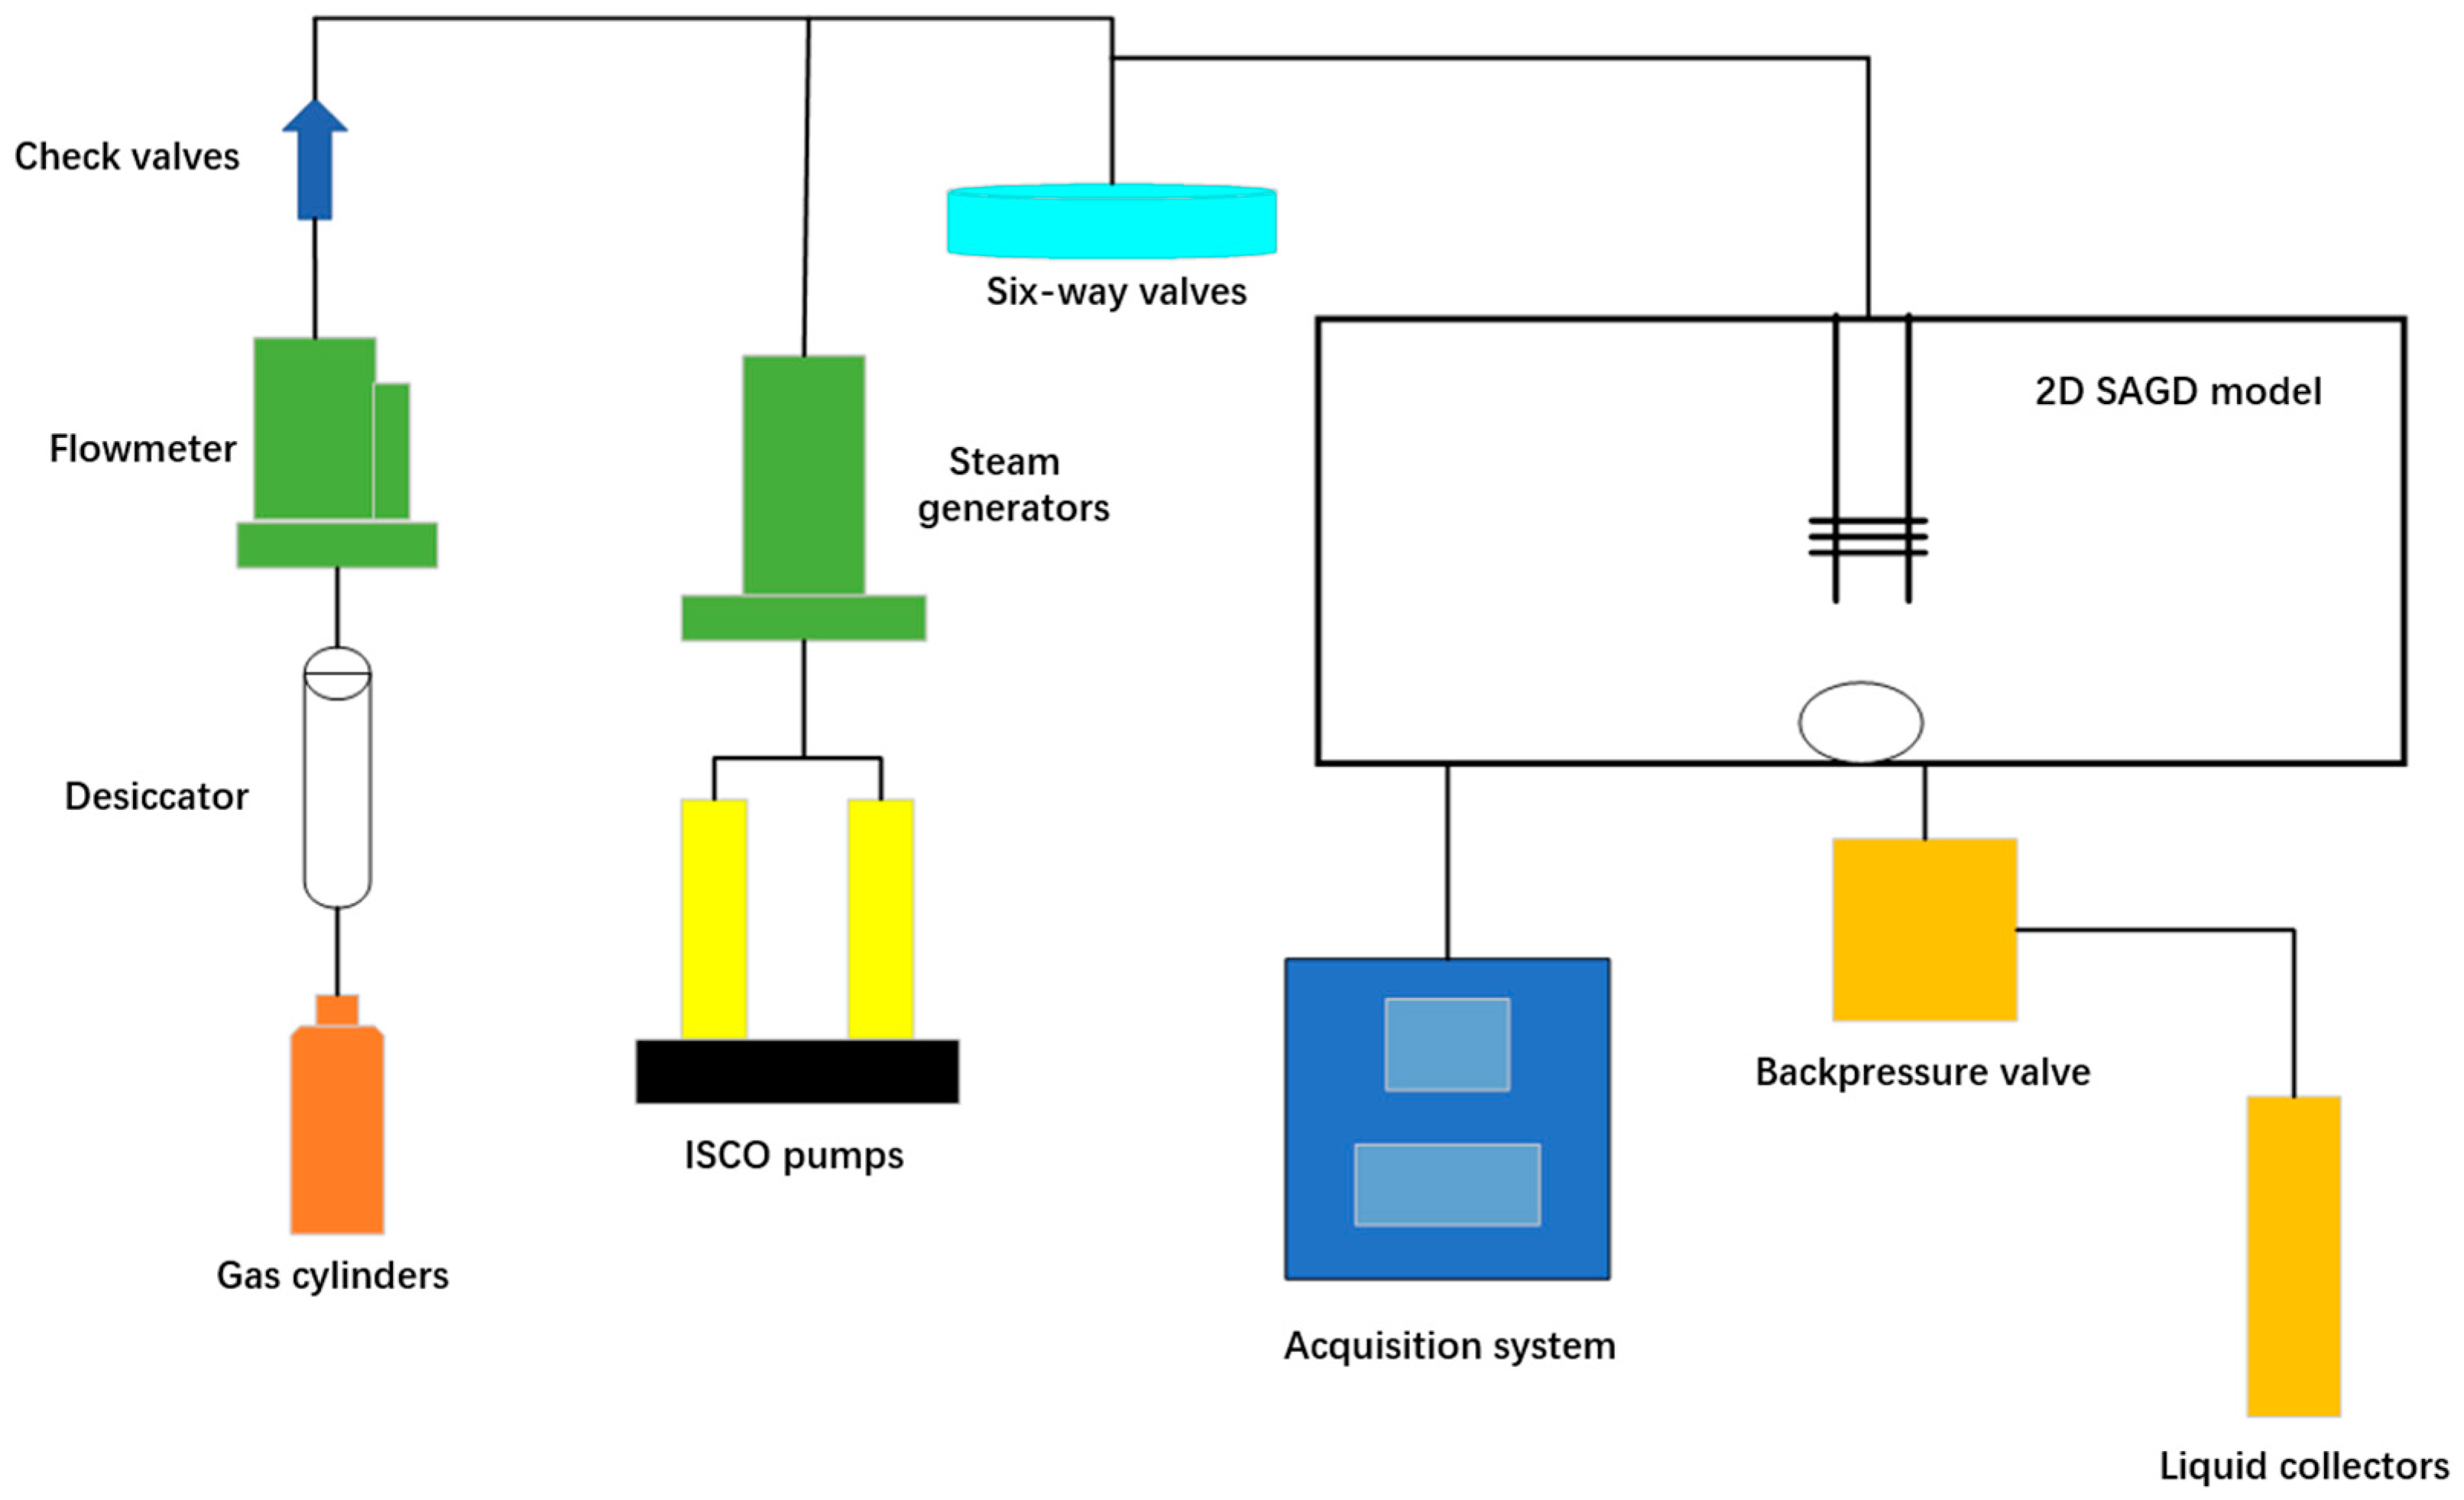
3.2.1. Experimental Instruments and Materials

The experiment utilized a two-dimensional SAGD scaled physical simulation system (Figure 5). The physical simulation system mainly consists of five components: (1) The injection system enables the injection of steam and non-condensable gas. (2) The model itself is a sand-filled model with external insulation. (3) Temperature and pressure data collectors monitor the temperature and pressure at different positions within the system. The temperature field map and pressure field map are visually presented via a computer. (4) The production fluid separation and measurement system are primarily composed of back pressure controllers, liquid collectors, etc. (5) Data acquisition and experimental data processing software. Based on the characteristics of the model, a computer grid model is established to convert analog signals into digital signals. Real-time acquisition and processing of temperature and pressure data during the experimental process are carried out using a computer.
The experimental oil selected for this study is dehydrated crude oil from the Xinjiang oilfield. The viscosity of the degassed crude oil at 50 °C is 9930 mPa·s, and the density is 984.1 kg/m3 at the same temperature. High-purity nitrogen gas is used as the non-condensable gas, and the model is filled with 20–40 mesh quartz sand.

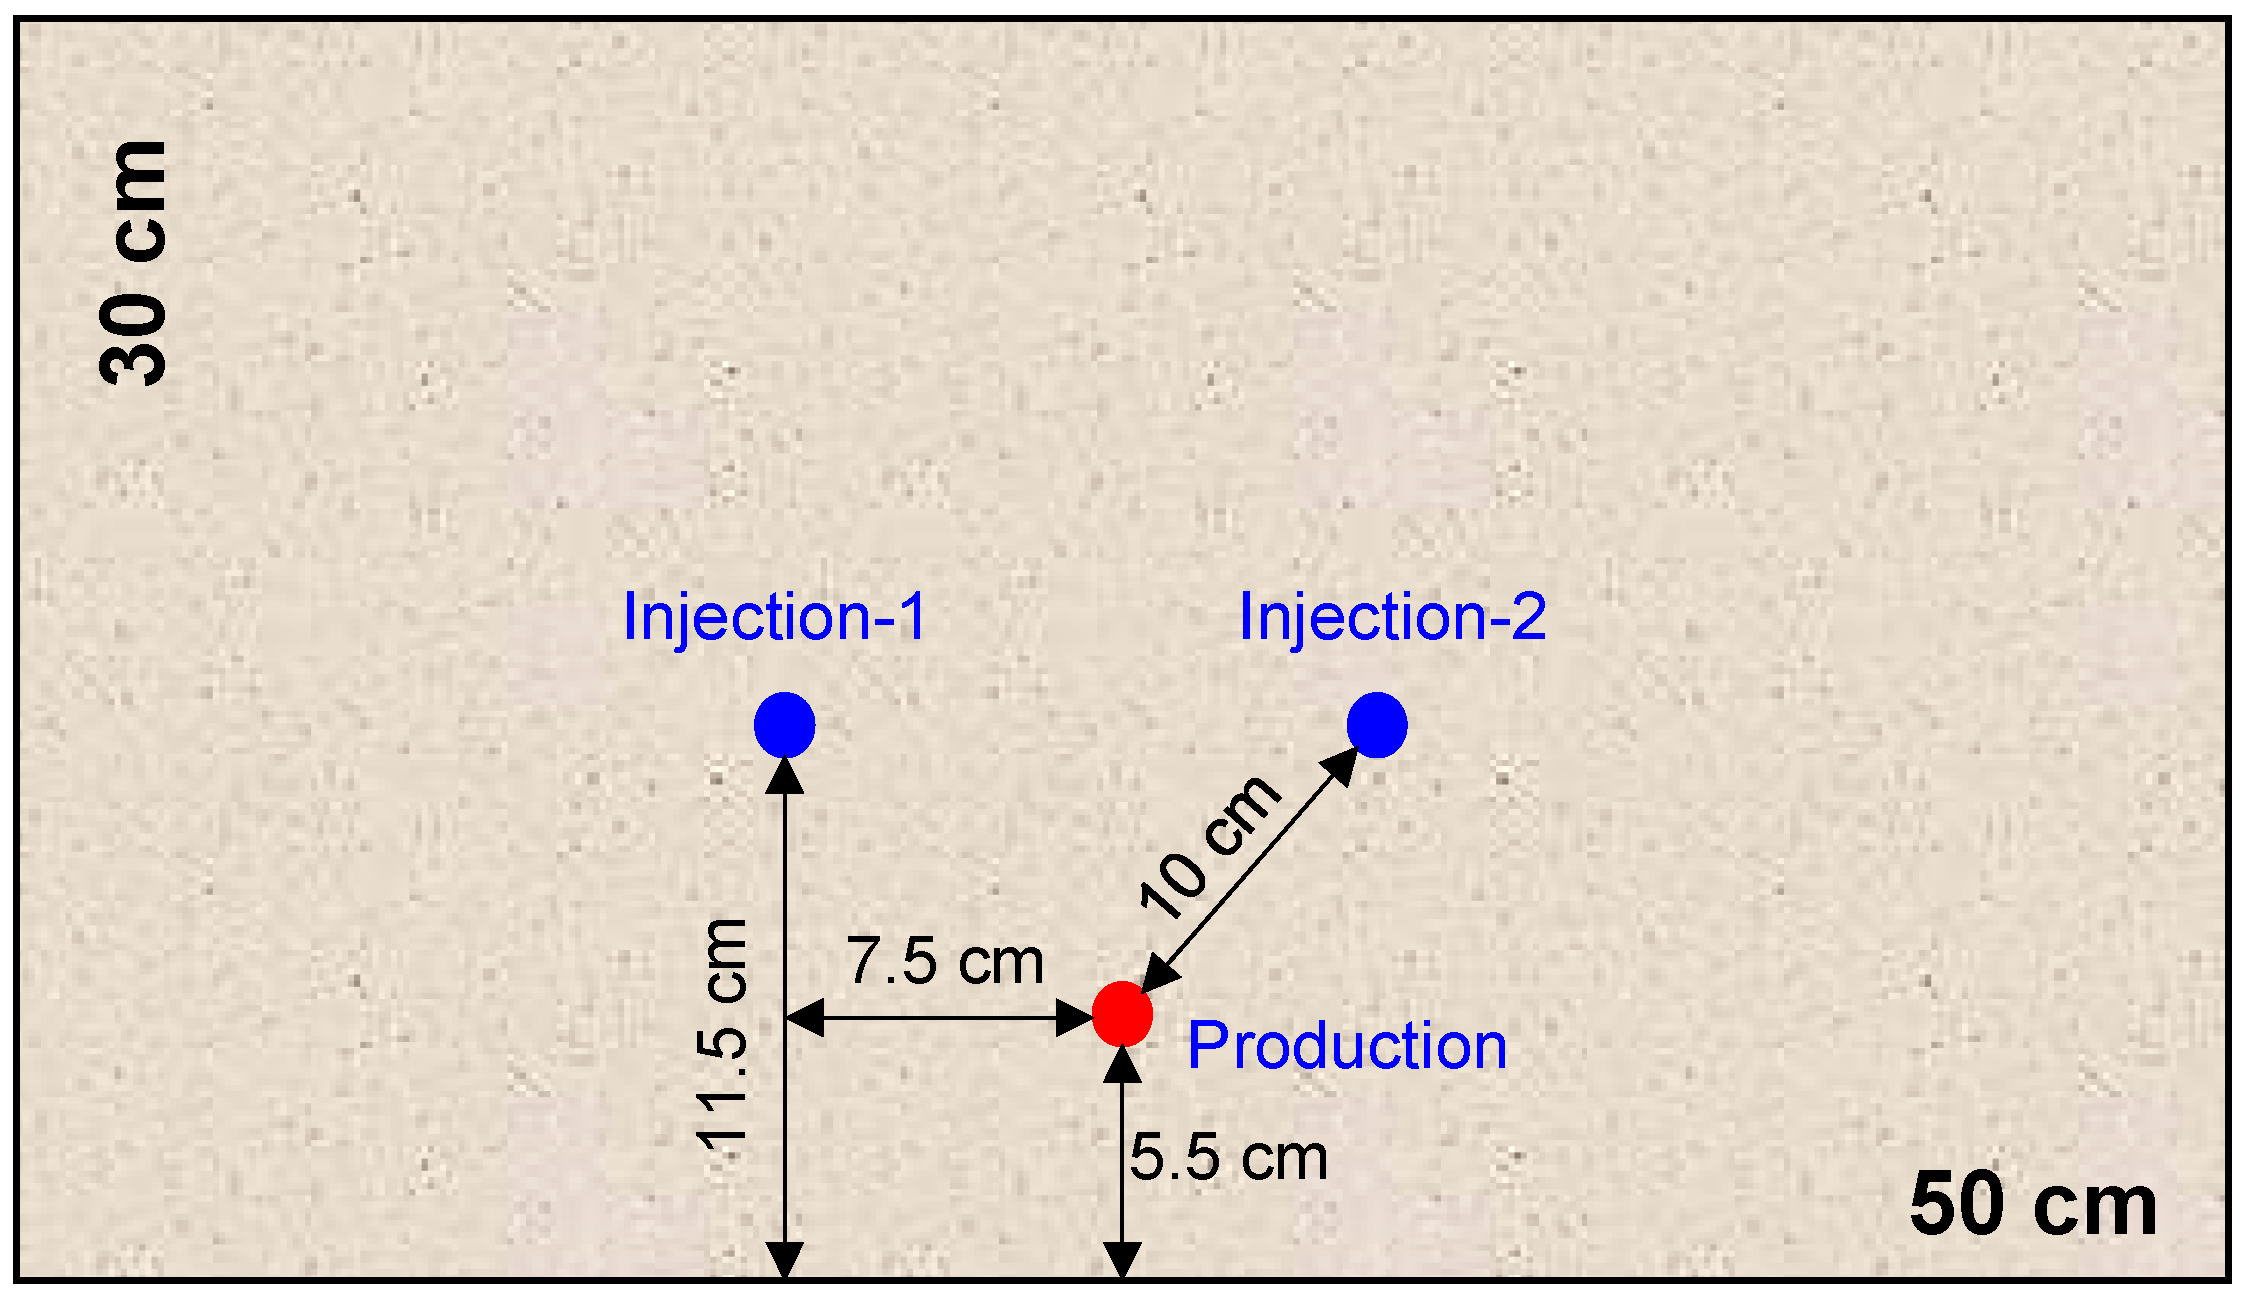
3.2.2. Experimental Model

Figure 6 illustrates the schematic diagram of the two-dimensional physical model for a VHSD system. Two vertical wells are located above a horizontal well, with the distance from the lower boundary of the model to the top of the wells being 11.5 cm. The vertical separation between the injection well and the production well is 7.5 cm, and the production well is located 5.5 cm away from the lower boundary of the model. The length of the two-dimensional model is 50 cm, the height is 30 cm, and the thickness is 5 cm. The pore volume after filling the model with quartz sand and the volume of saturated oil after saturation are provided in Table 4.
In accordance with the similarity criteria, the experimental model parameters corresponding to the parameters of the VHSD reservoir were calculated (Table 5). The reservoir parameters including porosity, oil saturation, crude oil viscosity, crude oil density, and steam quality are equal to the experimental model parameters. The parameters for reservoir thickness, injection and production well spacing, vertical well spacing, and perforation thickness are converted using the principles of geometric similarity. Permeability is transformed using an equivalent permeability model. Time is transformed using a modified time-equivalent model, where 60 min in the experimental model represents a reservoir production time of 4.21 years. In the field, two vertical wells have a combined injection rate of 130 t/d, and the injection rate in the model is calculated as 34.0 mL/min based on steam quality and perforation thickness. The average steam absorption length in the horizontal section is calculated based on the interpretation report of the wellbore temperature profile test. The volume of injected nitrogen is obtained by proportional transformation based on the model volume.

3.2.3. Experimental Scheme

Pure steam VHSD experiment: The cyclic steam stimulation (CSS) stage consists of 2–3 cycles, with an injection rate of 35 mL/min (total for three steam injection wells), an injection time of 60 min, and a soaking period of 5–10 min. In the gravity drainage stage, the injection rate of the two vertical wells is maintained at 35 mL/min, with an injection time greater than 60 min and the back pressure of 2 MPa. While the actual number of CSS cycles is high, in order to prevent equipment pressure disturbances leading to leaks, the CSS design includes 2–3 cycles, transitioning to the gravity drainage stage after achieving a recovery around 25%. Based on the current declining production forecasts, the VHSD development time should be equal to or greater than the production time. Therefore, the design gravity drainage time is set at ≥60 min.
Nitrogen-assisted VHSD experiment: The CSS stage consists of 2–3 cycles, with an injection rate of 35 mL/min (for three steam injection wells), an injection time of 60 min, and a soaking period of 5–10 min. In the nitrogen-assisted gravity drainage stage, the injection rate is 35 mL/min (for two vertical wells). After the steam reaching the top of the steam chamber, two vertical wells switch to inject nitrogen 550 mL, taking 11 min (closing the production well when nitrogen injection). Subsequently, continuous steam injection is carried out for 60 min for two vertical wells, with a production well back pressure of 2 MPa.

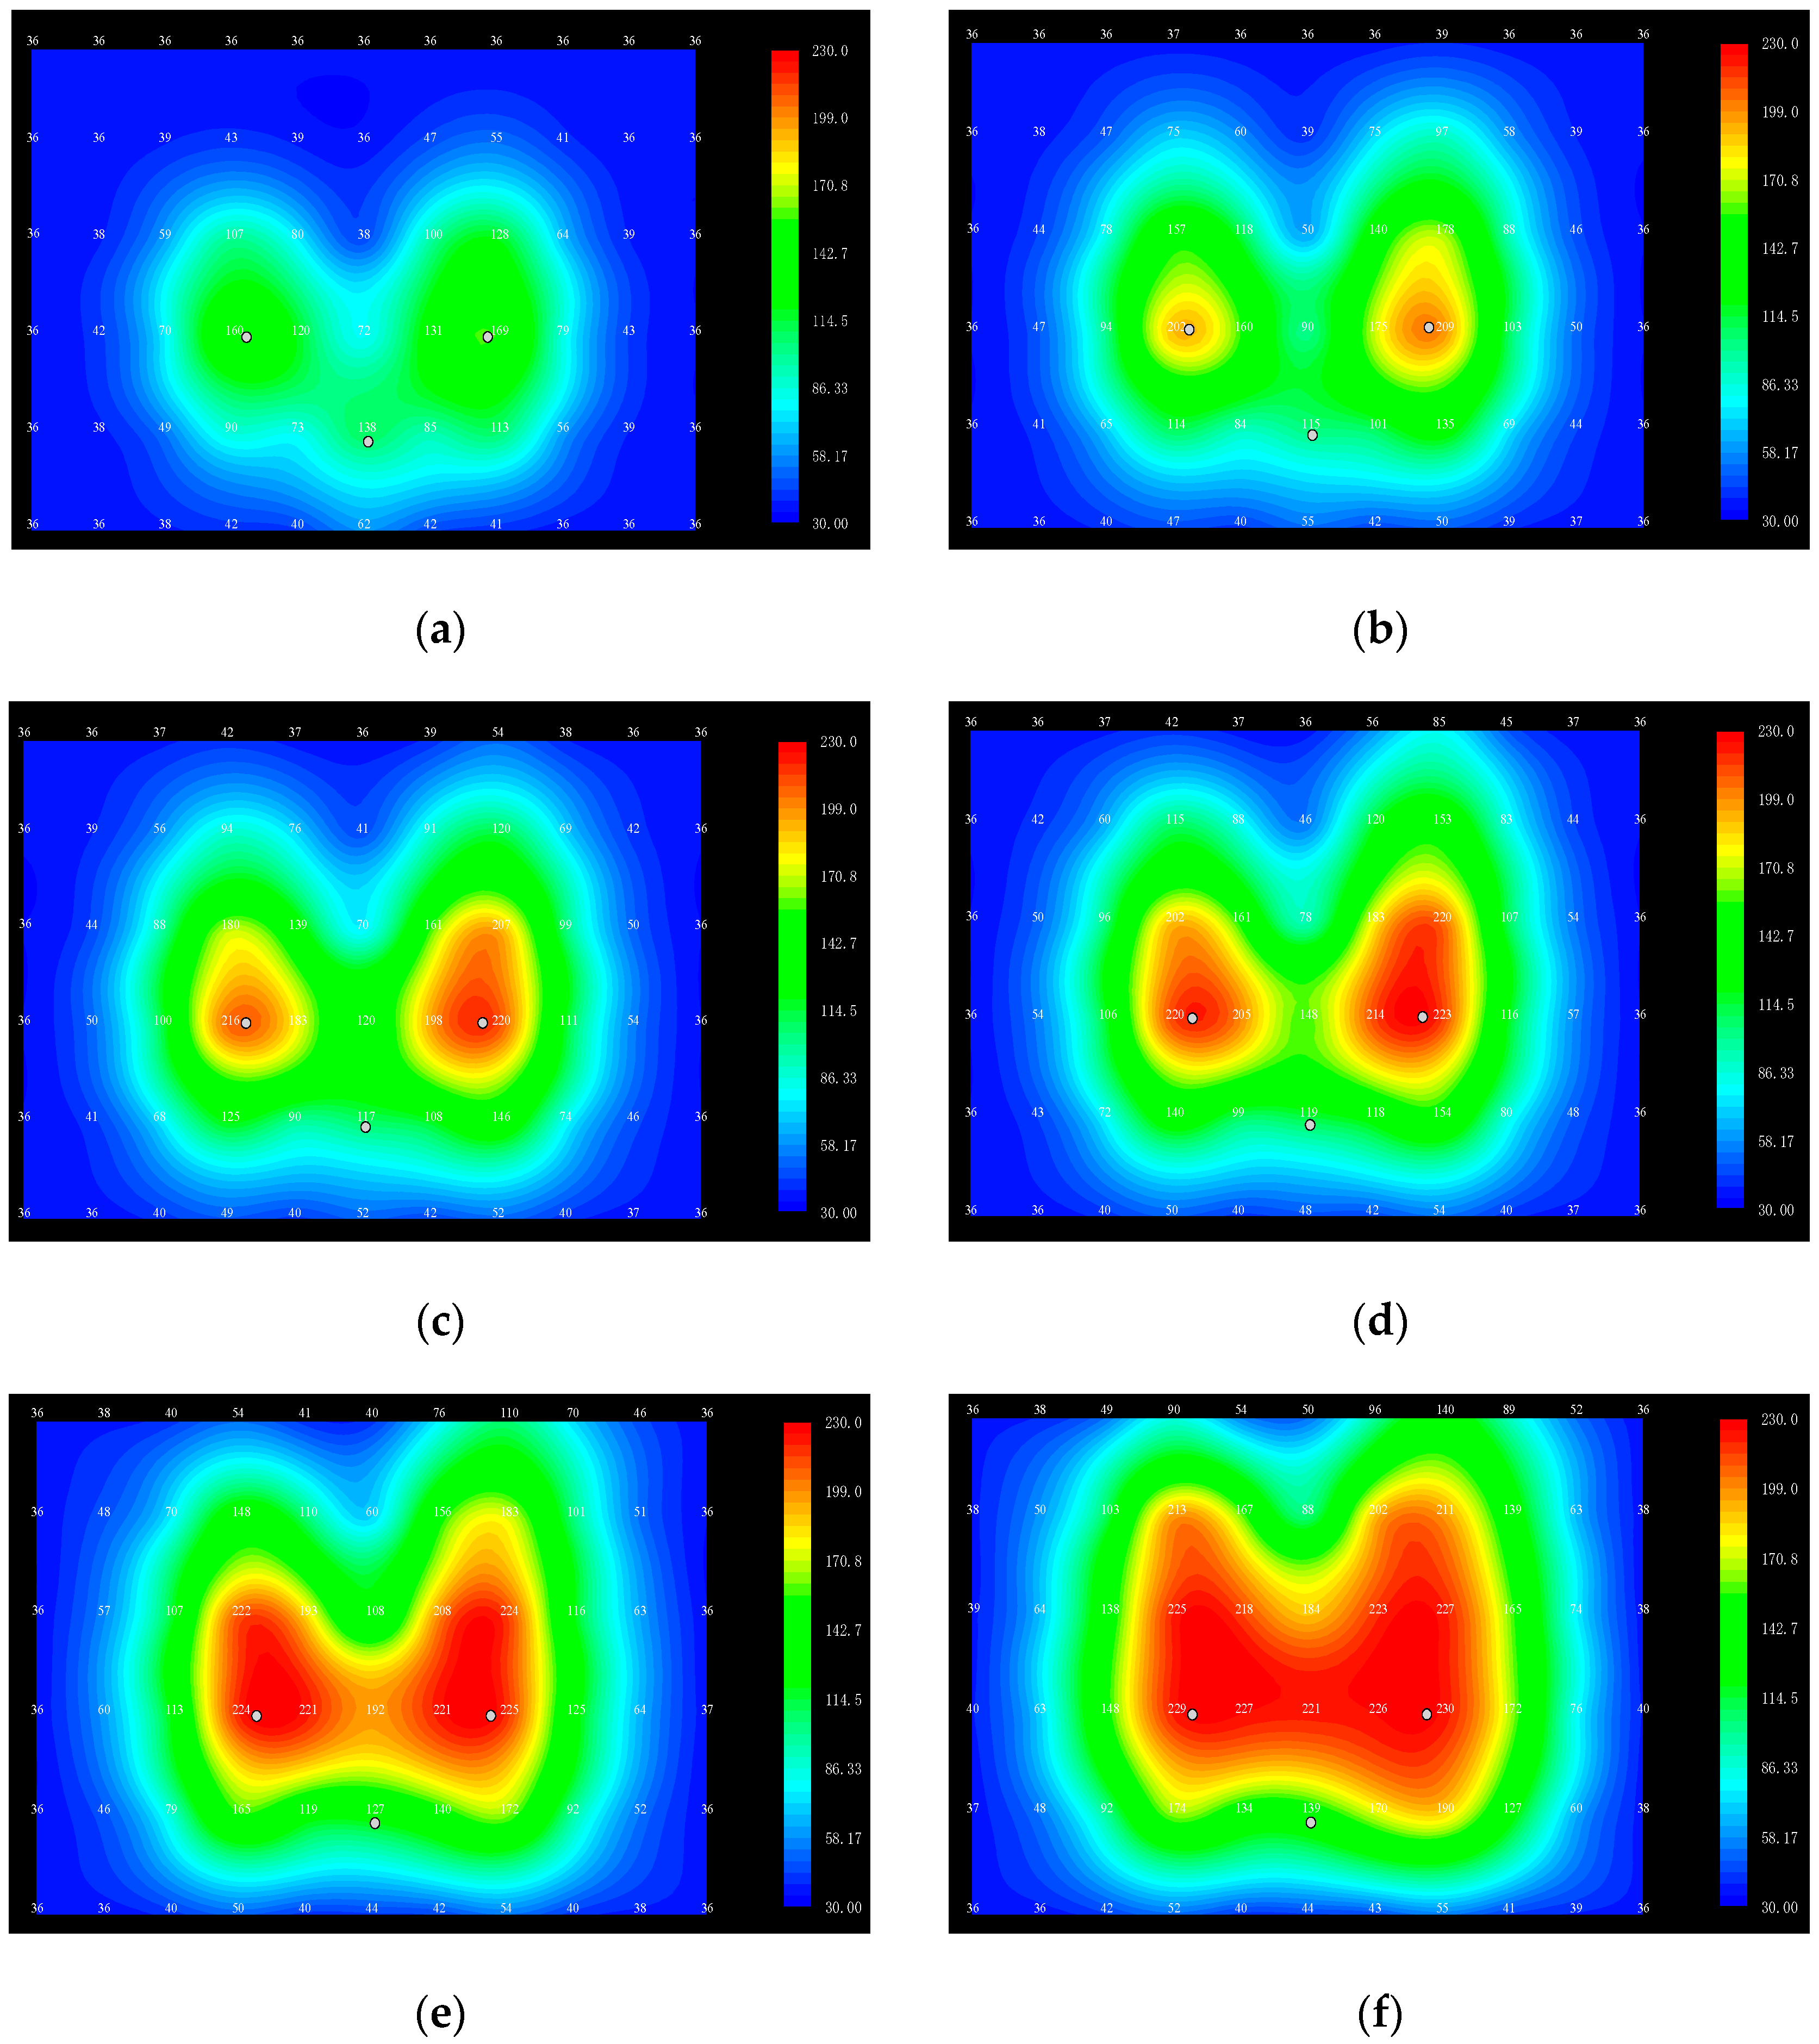
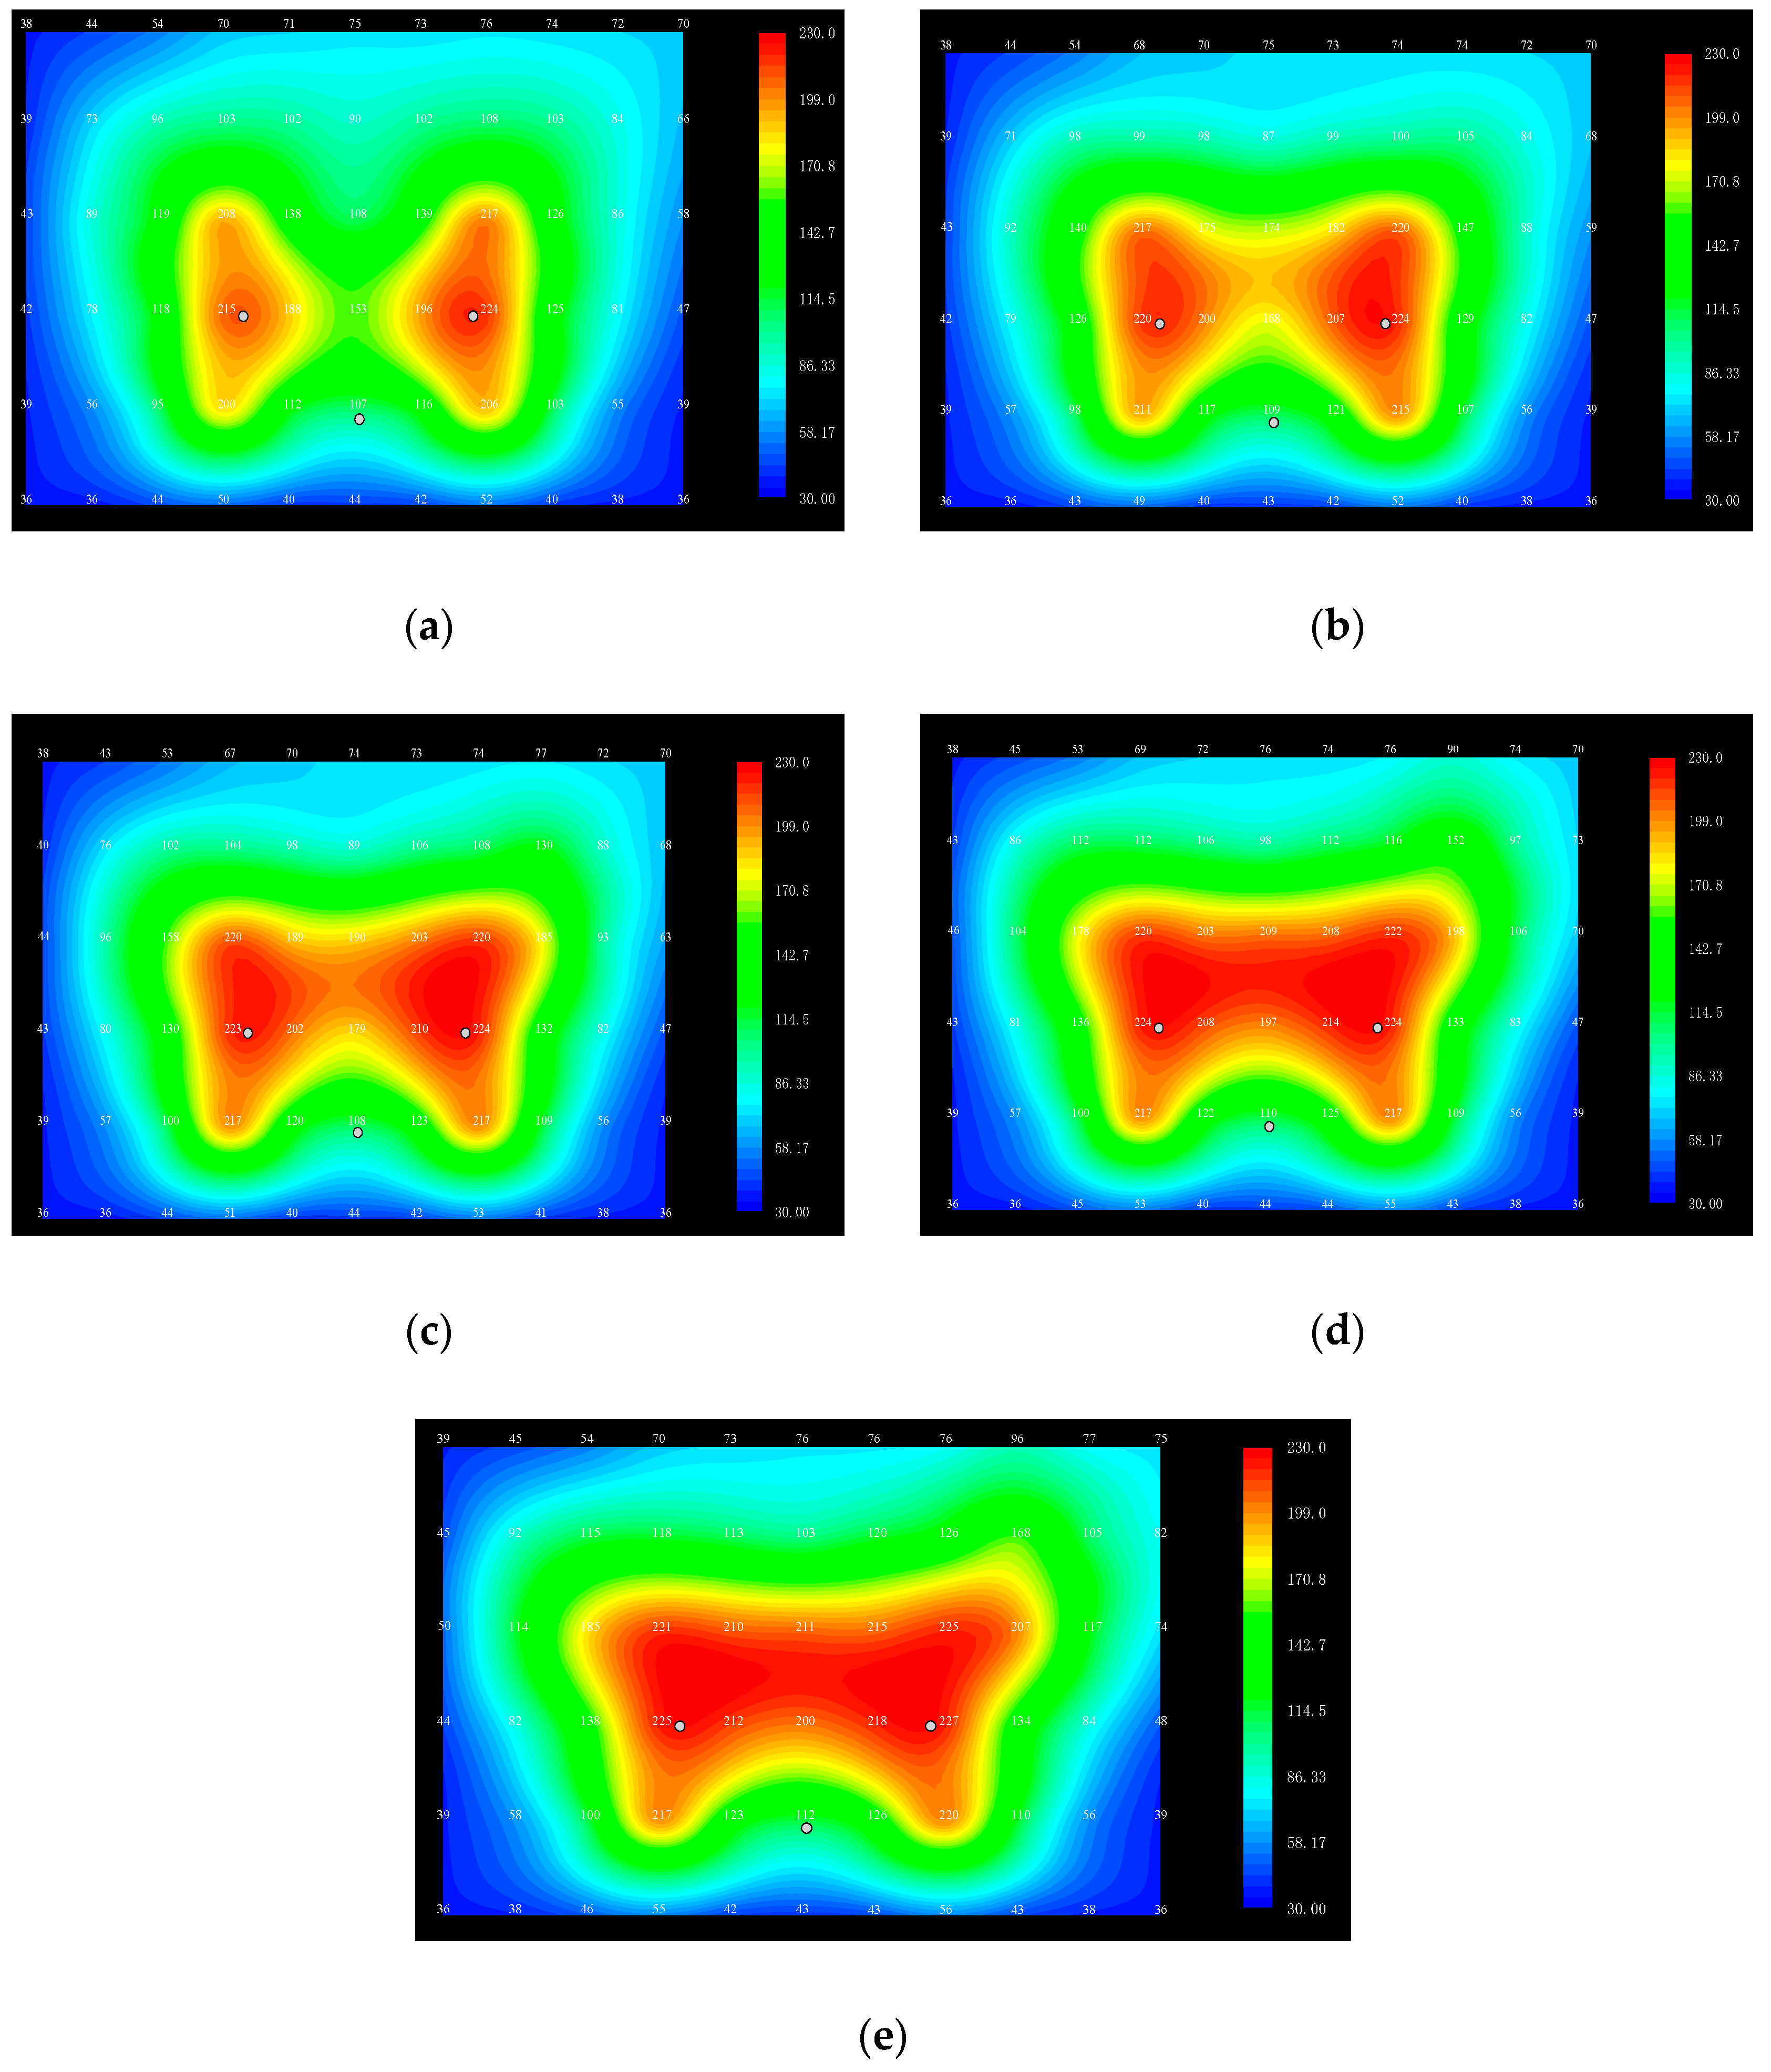
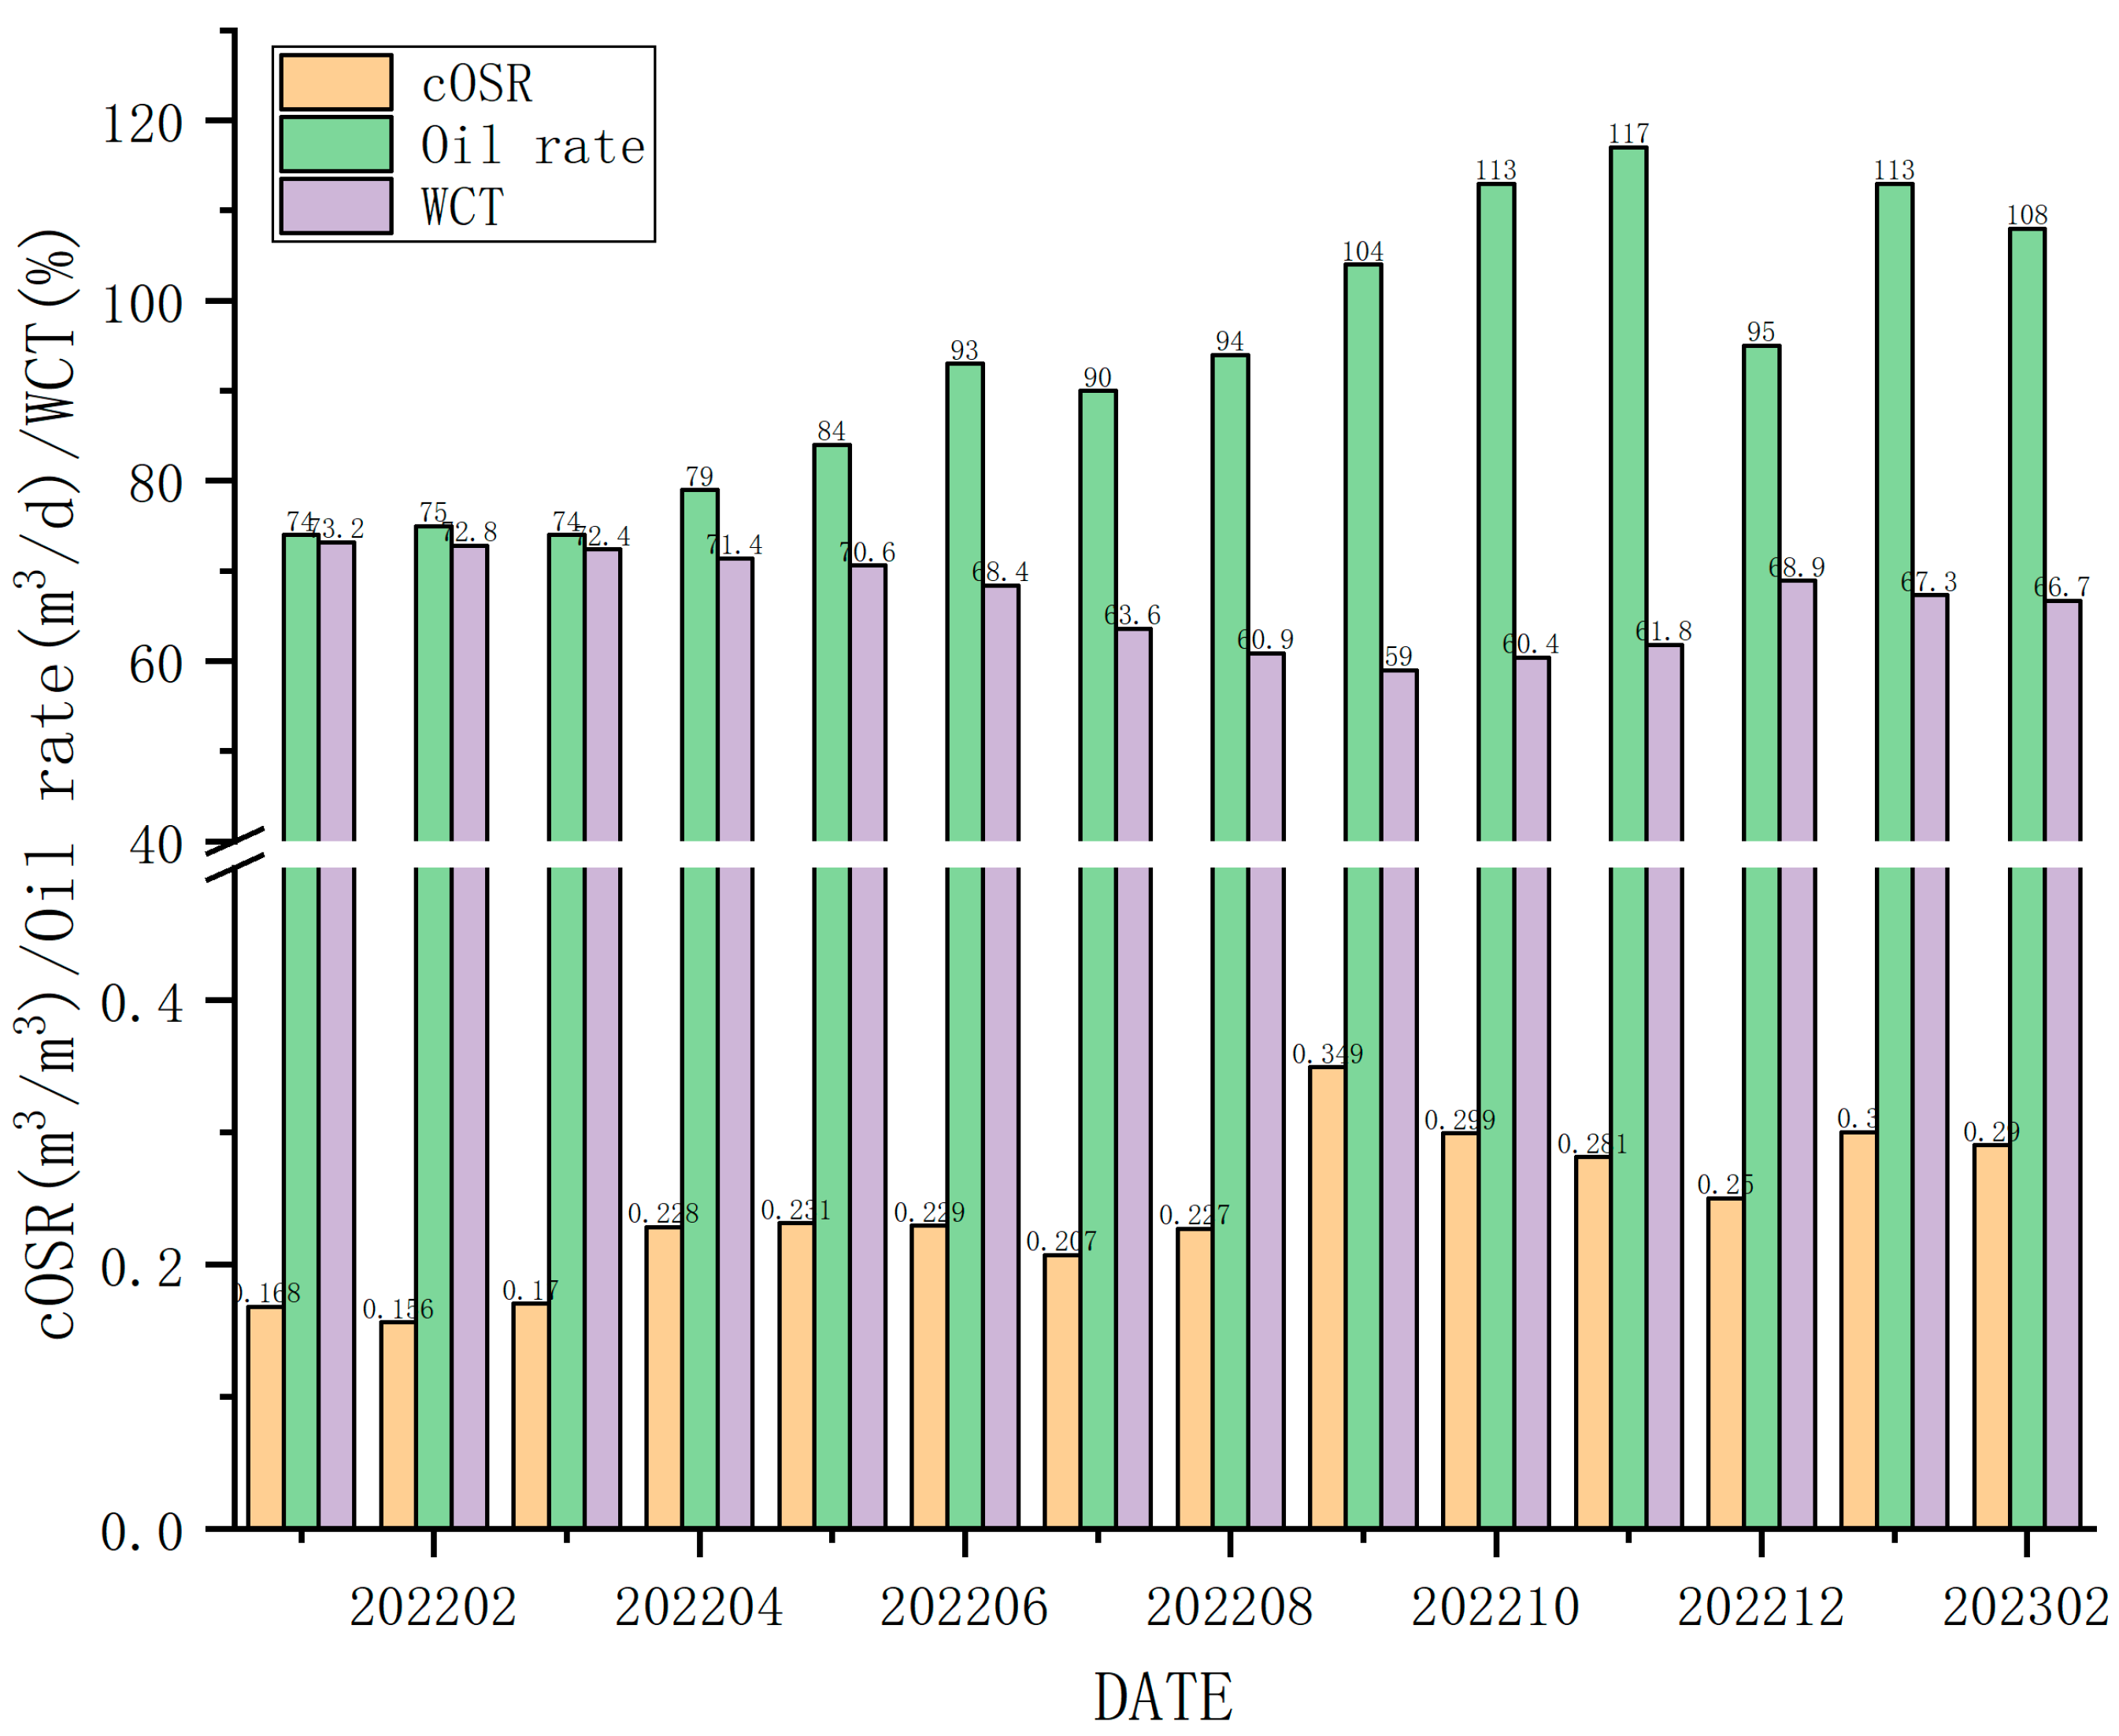
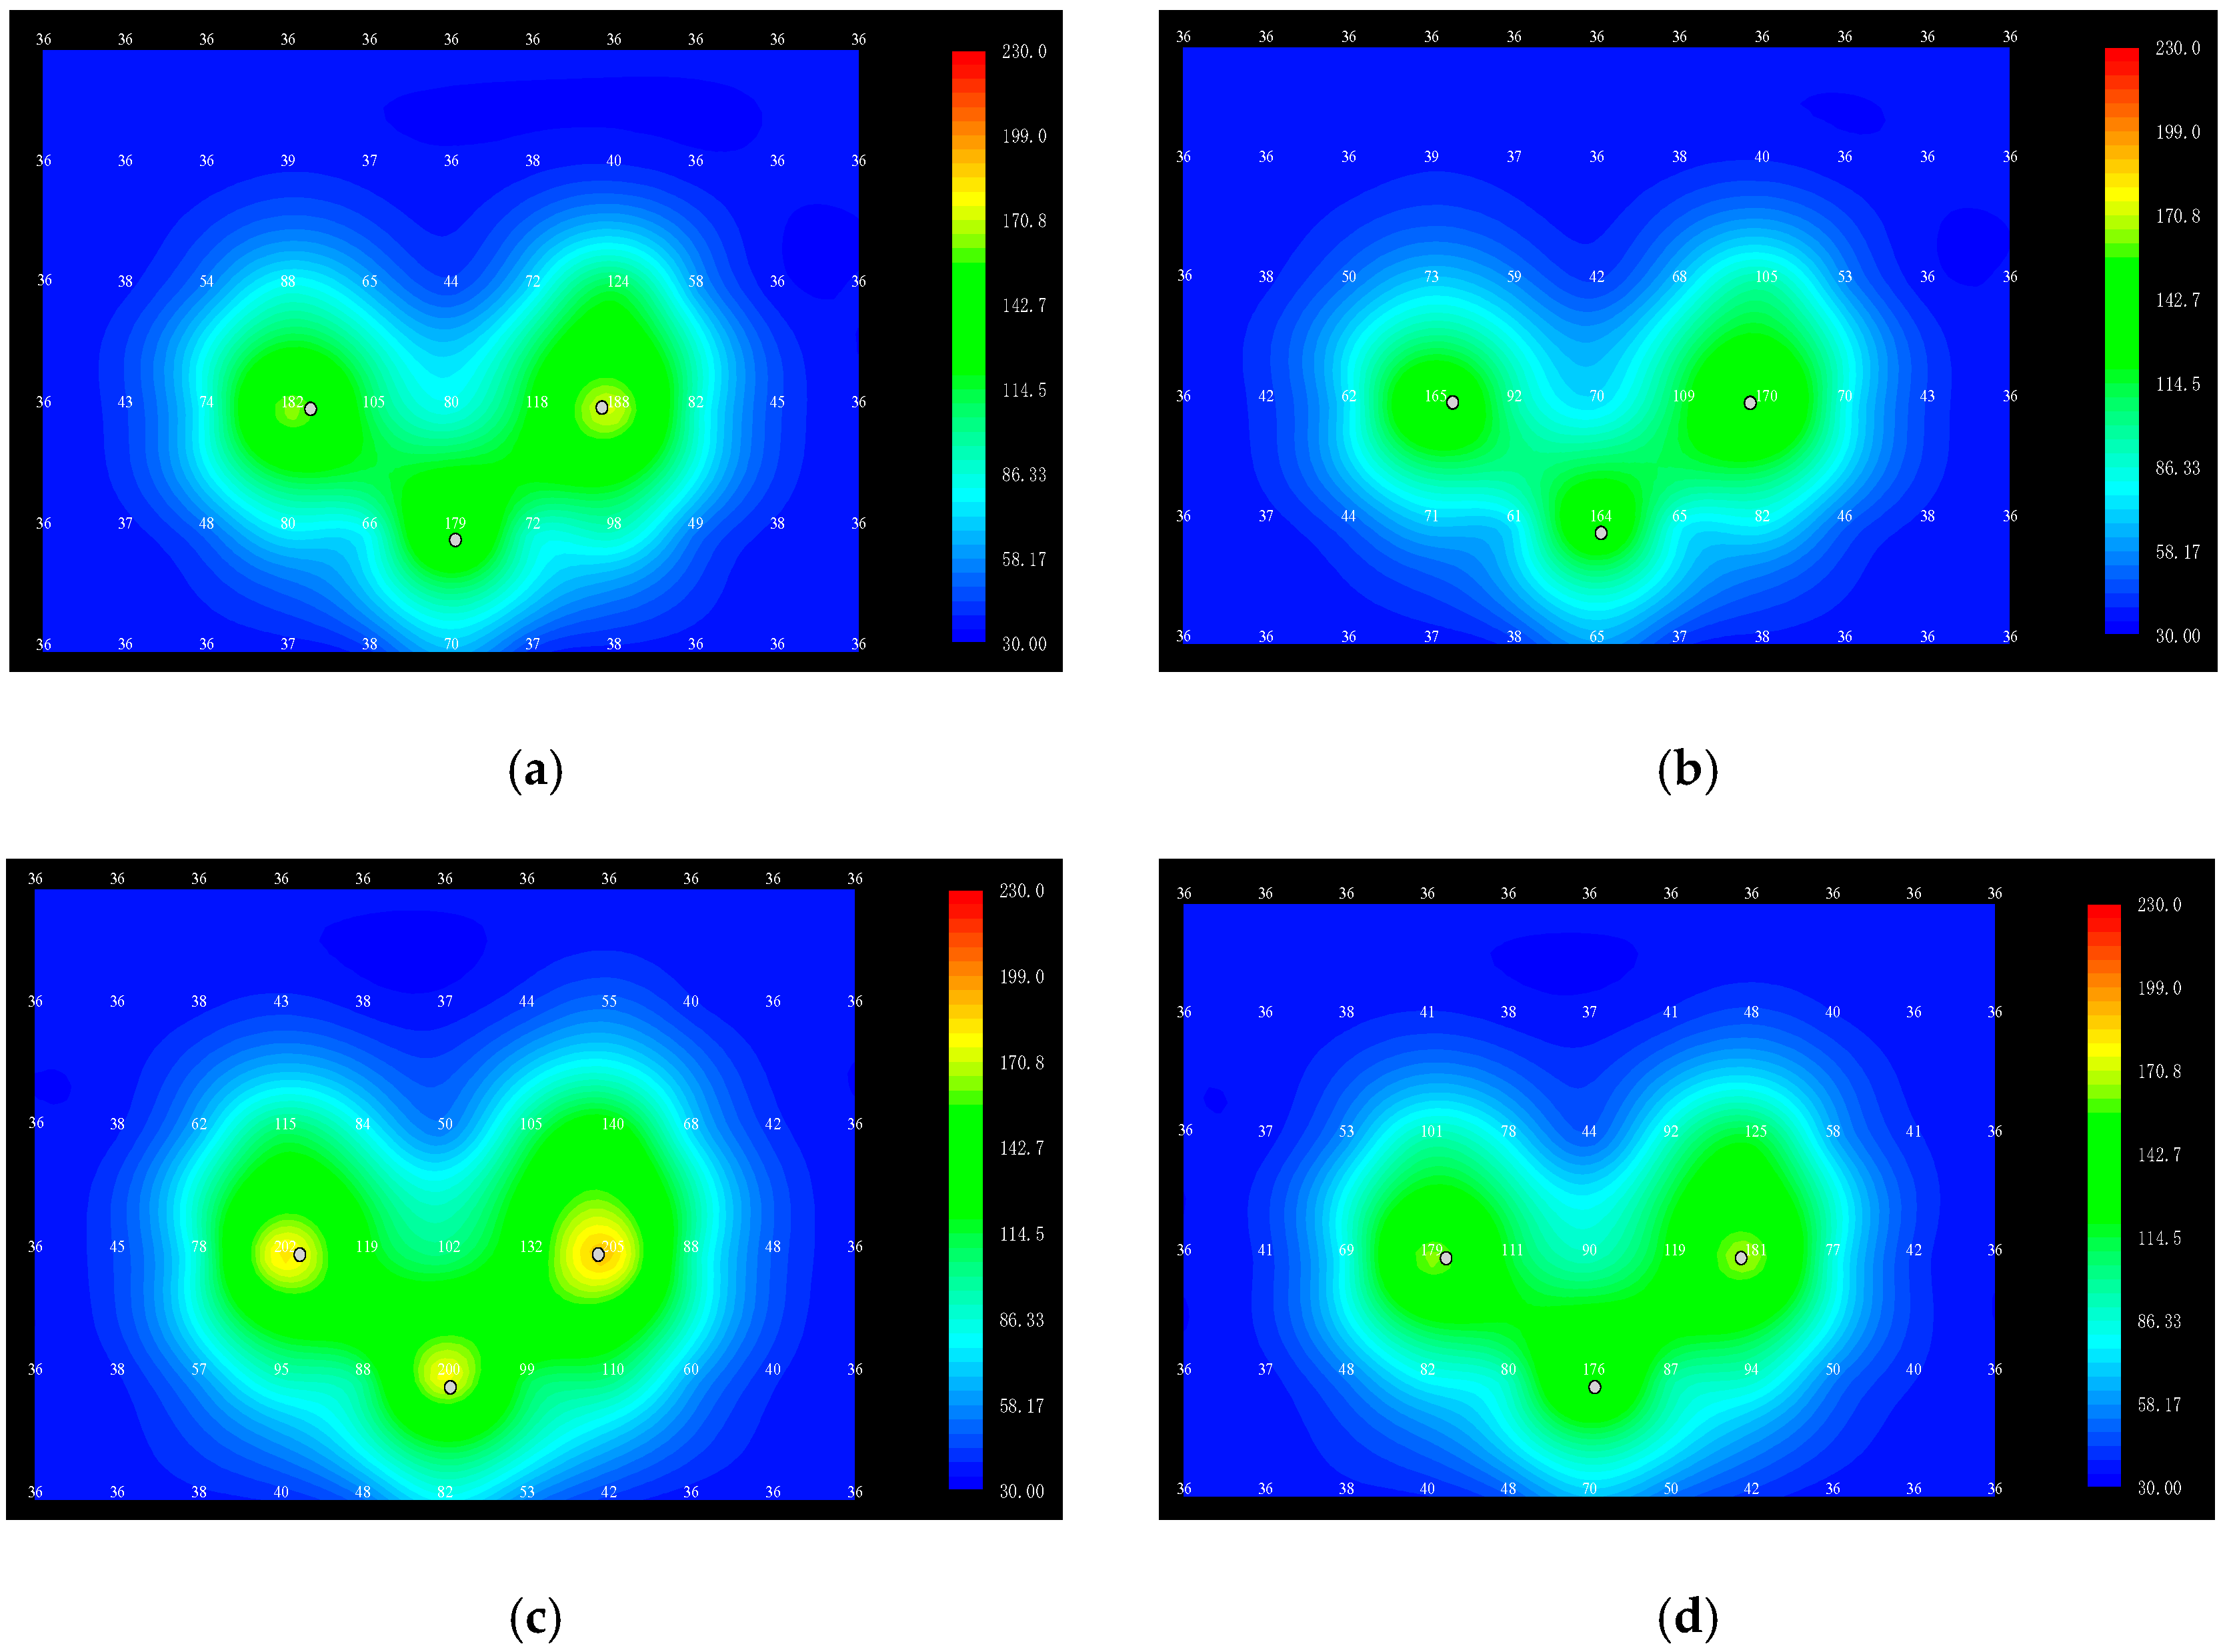
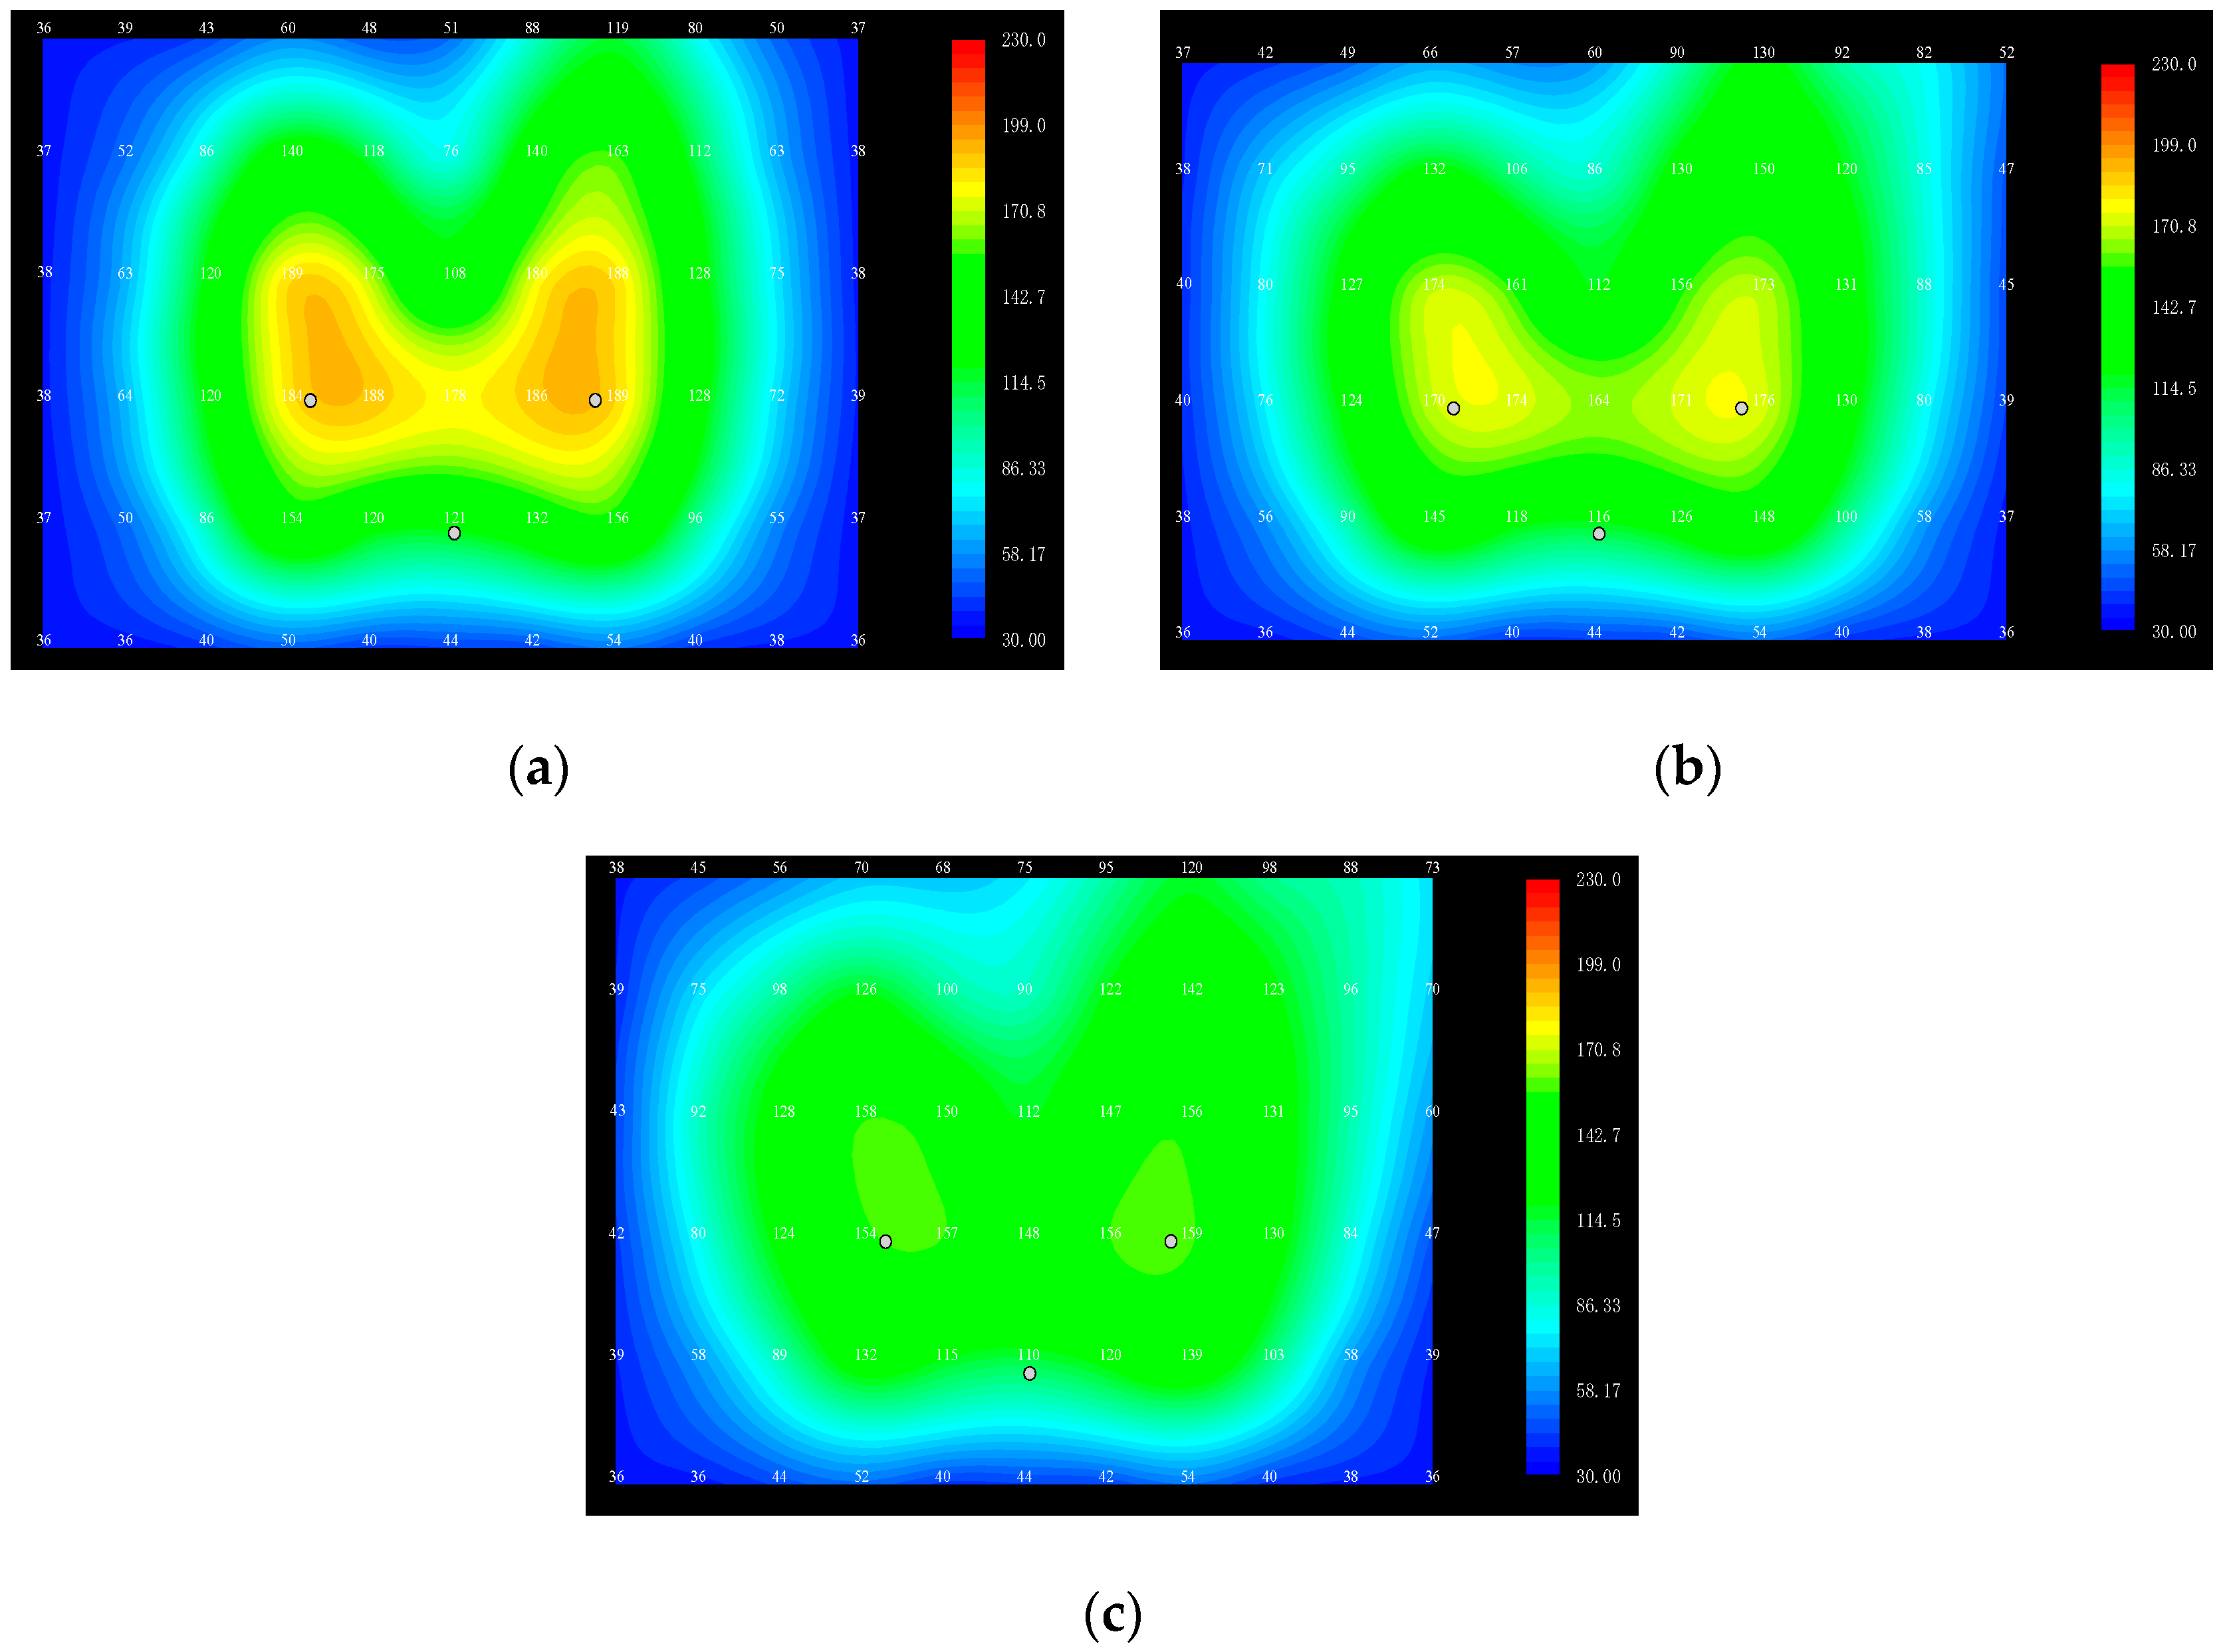
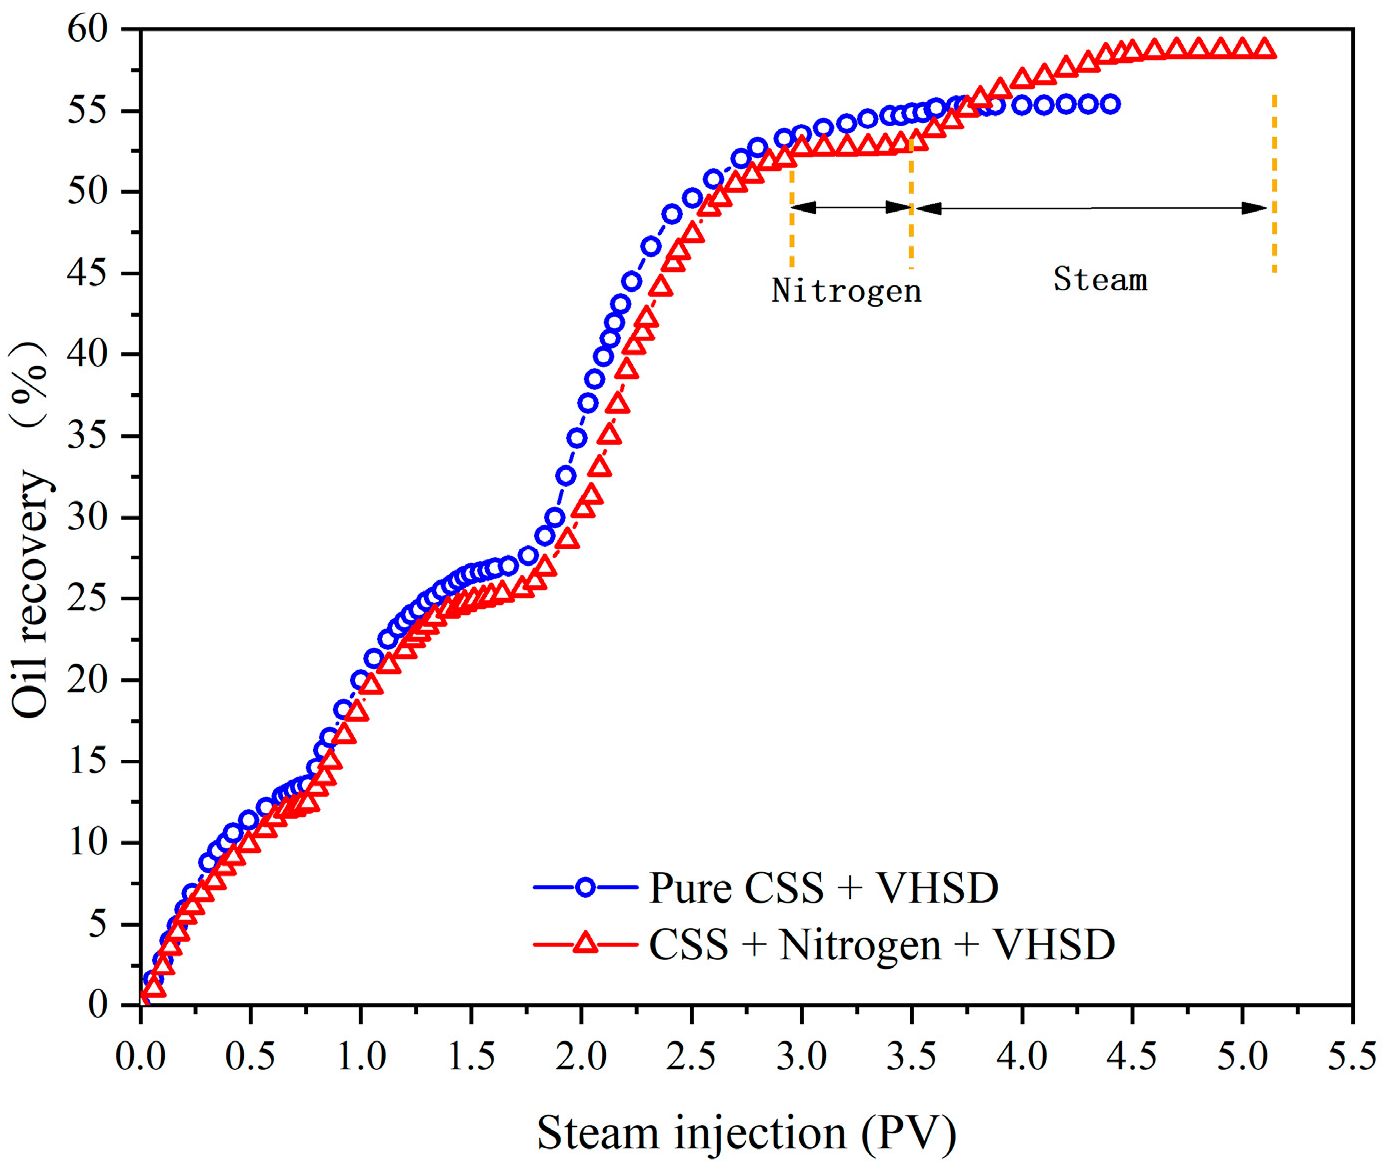
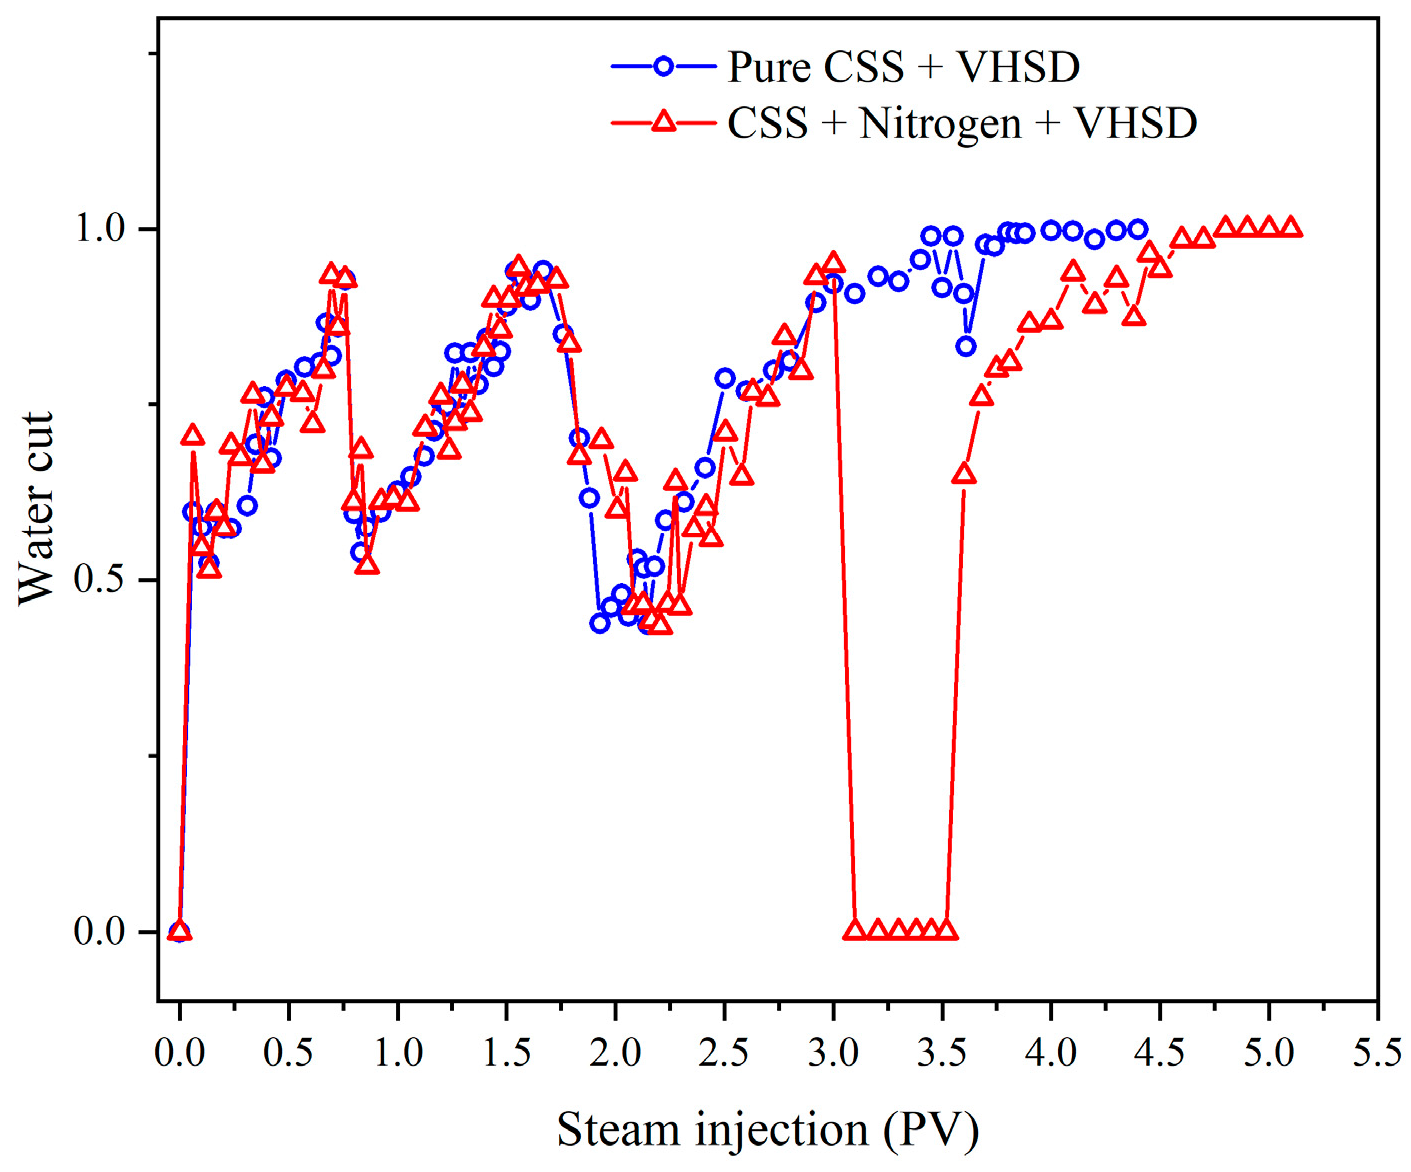
3.3. Analysis of Experimental Results

The steam chamber development during the preheating phase of the CSS stage is illustrated in Figure 7. Upon the steam injection of the first CSS cycle, the steam chamber begins to radially expand from the three steam injection wells, forming a ‘V’-shaped steam chamber composed of three circular regions. By the end of the steam injection of the first CSS cycle, the steam chamber occupies approximately 24% of the experimental model volume, with thermal communication established between the wells, albeit at a lower temperature. At the end of the oil production of the first CSS cycle, the volume of the ‘V’-shaped steam chamber slightly decreases compared to the steam injection phase, with a temperature drop of 6–13 °C, resulting in a recovery of 13.2%. Following the completion of the steam injection of the second CSS cycle, the lower part of the steam chamber horizontally develops, transitioning the chamber shape from ‘V’-shaped to ‘heart’-shaped, increasing the chamber volume to 34% of the experimental reactor volume. The temperature in the middle of the steam chamber rises by 30–40 °C, resulting in a recovery rate of 24.6%, the inter-well temperatures exceeding 75 °C. After oil production ceases, the steam chamber volume slightly decreases, and the average temperature within the chamber drops by 10 °C.
During the gravity drainage phase, the lower horizontal well performs stopped steam injection, and the upper two vertical wells perform continuous steam injection. The steam chamber development is illustrated in Figure 8. With the increasing steam injection volume, the steam chamber expands upward along the injection wells, and upon reaching the top of the model, it begins to spread towards the center. However, the steam chamber struggles to reach the sides of the model. At 5 min of steam injection, due to the cessation of steam injection of the horizontal well, the lower part of the steam chamber loses heat continuously and experiences a gradual decrease in temperature. Consequently, the lower part of the steam chamber contracts towards the center, and overall steam chamber temperature also decreases compared to the CSS phase. The steam chamber volume decreases to approximately 25% of the experimental reactor volume. After 13 min of steam injection, the steam chamber gradually expands upwards, leading to an increase in its volume. Furthermore, there is a notable increase in the temperature of the steam chamber. After 19 min of steam injection, the volume of the steam chamber continues to increase as it further expands upward. Simultaneously, the temperature of the steam chamber continues to rise. At this point, the oil production rate reaches its peak, followed by a subsequent decline in production. At 25 min of steam injection, the steam chamber on the right side reaches the top, forming a right-high–left-low ‘camel hump’-shaped steam chamber. At this stage, the volume of the steam chamber noticeably increases, accounting for approximately 47% of the reactor volume. The temperature at the two injection well points reaches 220 °C. After 40 min of steam injection, the high-temperature areas are connected, resulting in an average temperature of 215 °C in the middle of the steam chamber. The steam chamber continues to expand primarily upwards, and the top area on the right side enlarges. After 55 min of steam injection, the left side of the steam chamber reaches the top, resulting in an ‘apple’-shaped steam chamber. The volume of the steam chamber at this time occupies approximately 62% of the experimental reactor volume. The high-temperature area in the middle of the steam chamber expands, forming a ‘W’ shape, which accounts for approximately 30% of the steam chamber volume.
The characteristics of the steam chamber during the nitrogen injection process are shown in Figure 9. Due to insufficient heat supply, the steam chamber temperature significantly decreases. As the nitrogen injection volume increases, at the 11th minute of nitrogen injection, the temperature further decreases, and the steam chamber area expands. Under the traction of nitrogen, the steam chamber noticeably expands towards the upper-right region. The upper part of the steam chamber expands horizontally. At this point, the volume of the steam chamber occupies approximately 74% of the experimental reactor volume. This indicates that nitrogen has an expanding effect on the steam chamber.
Following nitrogen injection, a second round of steam injection is started (steam chamber as shown in Figure 10). The temperature of the steam chamber rapidly increases. Due to the nitrogen injected in the previous round occupying the top space of the model, the steam chamber does not expand directly towards the top of the model but rather gradually expands to the left and right above the injection well. It is evident that nitrogen effectively delays the phenomenon of steam override, increases the steam chamber area while reducing heat loss, and consequently enhances oil recovery.
Ten minutes after steam injection, the temperatures at the two steam injection well points notably increase. By 20 min of steam injection, the high-temperature zones at the two injection well points connect, forming an ‘M’ shape in the steam chamber, which is in contrast to the CSS phase. After 30 min of steam injection, the high-temperature zones within the steam chamber gradually expand, showing a tendency of downward expansion from the central region, leading to a gradual overall temperature increase in the steam chamber. At 45 min of steam injection, the temperature in the upper-right area of the steam chamber increases faster than in other areas, indicating a trend of tilting towards the upper-right side. After 60 min of steam injection, the volume of the steam chamber reaches over 80% of the experimental reactor volume. The impacted volume of the steam chamber significantly increases compared to the CSS stage. A ‘tooth-shaped’ high-temperature region forms in the middle of the chamber, with an average temperature of 220 °C, occupying approximately 25% of the steam chamber’s volume.
Production characteristics are shown in Figure 11, Figure 12, Figure 13 and Figure 14. For pure steam and nitrogen-assisted injection, the final oil recovery rates are 55.42% and 58.68%, respectively. During the nitrogen injection stage, the production wells are shut in and the recovery rate remains unchanged. After nitrogen injection followed by steam injection, the water cut decreases to below 90%, leading to a slight 3.26% increase in oil recovery. The cumulative oil-to-steam ratios for pure steam and nitrogen-assisted injection are 0.095 and 0.114, respectively, with nitrogen assistance increasing the cumulative oil-to-steam ratio by 0.019. During the early stage of nitrogen injection, while utilizing the residual heat in the steam chamber, increasing the steam chamber pressure expands the steam chamber volume, therefore increasing the instantaneous oil-to-steam ratio and slowing down the decline in the cumulative oil-to-steam ratio.
Research on nitrogen density and saturated steam density (Figure 15) indicates that the density of nitrogen is lower than that of wet steam but higher than that of dry steam. Due to the lower temperature at the top of the steam chamber, wet steam is predominant; as the density of nitrogen is lower than that of wet steam, nitrogen is more likely to distribute in the upper part of the steam chamber. The thermal conductivity of nitrogen is lower than that of oil, water, and rock (nitrogen: 0.02 W/m·K; oil: 0.13 W/m·K; water: 0.6 W/m·K; rock: 2.75 W/m·K) [20,21]. Nitrogen accumulated at the top of the reservoir forms a thermal insulation layer, reducing the upward heat transfer rate to the overburden, minimizing heat loss, improving thermal efficiency, and consequently reducing the steam injection volume and increasing the cumulative oil-to-steam ratio. Two-dimensional experiments demonstrate that the injection of nitrogen forms an approximately 8 cm thick thermal insulation layer, accounting for 22.8% of the height of the steam chamber, with a temperature of around 100 °C, which is approximately 50 °C lower than the top layer without nitrogen (Figure 16a). Due to the higher density of nitrogen compared to dry steam and the higher steam quality in the central high-temperature area of the steam chamber (close to 1.0), part of the nitrogen is squeezed downward toward the side of the steam chamber, as indicated by the arrows in Figure 16b. The presence of nitrogen below the side of the steam chamber leads to concavity in the steam chamber after subsequent steam injection. Overall, the injection of nitrogen promotes a lateral expansion of the steam chamber by approximately 10 cm, accounting for 25% of the width of the steam chamber. The above phenomenon indicates that after injecting nitrogen into the steam chamber, nitrogen is mainly distributed at the top but also partially around the steam chamber, creating a dual effect of ‘top insulation and lateral traction’ on the steam chamber. Research results demonstrate (Figure 4) that the contribution of oil saturation to VHSD is the highest, reaching 40%. The upper thermal insulation layer and lateral expansion effect after nitrogen injection are conducive to enlarging the contact area between high-temperature steam and crude oil, thereby enhancing the effectiveness of the drive drainage combined development.
The compressibility and expansion factors of gases are both relatively large; therefore, the nitrogen distributed at the top and around the steam chamber can help maintain system pressure. The nitrogen located at the top of the steam chamber also plays a role in displacing crude oil downward, thereby enhancing the oil drainage capacity of the reservoir. Additionally, due to the similarity in viscosity between nitrogen and dry steam, as shown in Figure 17 [22], this characteristic can reduce the viscous fingering effect, stabilize the displacement front, and improve oil displacement efficiency.
Within the steam-swept region, the wettability of the reservoir rock changes from oil-wet to water-wet, and the residual oil at the top of steam chamber after gravity drainage is mainly distributed as ‘isolated droplets’ in the pore space [23]. Due to the gas being non-wetting relative to oil, injected gas tends to occupy the center of the pore space, leading to the mobilization and downward movement of residual oil. During this migration process, residual oil from initially different locations coalesces to form accumulation zones. Due to the gravity contrast between gas and liquid, these accumulation zones gradually migrate towards the center of the vapor chamber with the injected gas, resulting in the accumulation of the oil phase in the center of the steam chamber. Residual oil saturation formed by gravity drainage with non-condensable gas is very low, theoretically achieving 100% oil displacement efficiency [24,25]. The downward displacement of crude oil by nitrogen can allow upper zone crude oil to enter the lower high-temperature steam chamber, where the crude oil undergoes secondary heating by the high-temperature steam, resulting in lower viscosity and higher extraction efficiency.
In addition to providing top insulation and lateral traction effects, nitrogen also serves to penetrate low-permeability interlayers to enhance the efficiency of steam injection [26,27]. Nitrogen (N2) is an element, while water molecules (H2O) are compounds. Therefore, nitrogen has low permeation resistance, a large diffusion coefficient, and lower interfacial tension with heavy oil. It can easily penetrate low-permeability layers through the fingering mode, displacing the original heavy oil and significantly reducing the resistance for subsequent steam permeation into low-permeability layers. Steam enters the low-permeability interlayers through breakthrough points of nitrogen, engaging in convective heat exchange with the heavy oil to reduce its viscosity.
The partial pressure effect of non-condensable gases can lower the temperature of saturated steam (Figure 18) [28]. That is, after injecting nitrogen into the reservoir, even in areas with lower temperatures, high-quality steam can be formed. The latent heat carried by high-quality steam is beneficial for heating crude oil and formation, thereby increasing the steam’s spread scope.
The experimental results presented in this study confirm the role of nitrogen in lateral traction steam to expand the steam chamber volume and increase the contact area between steam and crude oil. Li et al. [25] experimentally demonstrated the role of nitrogen penetrating the interlayer to prompt steam penetration into undeveloped areas. Field tests with nitrogen-assisted VHSD in one block of the Xinjiang oilfield reservoir further corroborated the existence of this phenomenon. Observation well 98 A in the HW042 well group had a well temperature of only around 75 °C before nitrogen injection (Figure 19), preventing steam from reaching the well and preventing it from effective production. On 31 July 2022, 45,000 Nm3 of nitrogen was injected into the well group. The well temperature began to rise on 13 August 2022, and by 21 August 2022, the temperature increased to 130 °C. After the well was opened, the wellhead temperature was 85 °C, with a daily oil production of 11 m3 and a water cut of around 30% (see production curve in Figure 20). As of 15 February 2023, the wellhead temperature stabilized around 80 °C, with an average daily oil production of 7.5 m3. Apart from fluctuations in water cut in December 2022 due to wax removal operations in the well, the average water cut remained stable at 30%. The above phenomenon indicates that the injected nitrogen leads subsequent injected steam towards well 98 A, enabling the well to resume production. This confirms the role of nitrogen in the lateral traction steam and penetrating interlayers promoting steam flow, thereby expanding the contact area between steam and reservoir crude oil. This mechanism enhances recovery effectiveness.

4. Conclusions

A comprehensive evaluation index for a full assessment of the VHSD was proposed. The contribution analysis for VHSD was conducted on reservoir and fluid characteristics as well as production conditions that affect development effectiveness using numerical simulation and data statistical methods. The results showed that oil saturation had the highest contribution at 40%, which differs from conventional SAGD operations, where reservoir thickness serves as the primary determinant.
Introduction of a mobility correction factor into the classical SAGD physical simulation time equivalent model increased the time equivalence by 25 times, significantly improving the agreement with the actual field production time.
Nitrogen surrounds the steam chamber, forming a dual effect of ‘top thermal insulation and lateral traction’ on the steam chamber. This causes expansion of the contact area between high-temperature steam and crude oil of more than 25%. Additionally, the viscosity of nitrogen is similar to that of dry steam, which can weaken the fingering phenomena of nitrogen gravity drainage and efficiently displace crude oil downwards. This leads to the accumulation of crude oil in the high-temperature area of the steam chamber, thereby enhancing the effectiveness of the VHSD process.
The field verification of nitrogen-assisted VHSD in one block of the Xinjiang oilfield reservoir demonstrated the lateral traction of nitrogen on steam and its ability to penetrate and prompt steam through interlayers. As a result, the wellbore temperature of well 98 A, which was previously unable to produce effectively, increased from 75 °C to 115 °C, leading to a restoration of daily oil production to 11 m3 with a stable water cut of 30%.

Author Contributions

Methodology, P.W.; Software, T.L., D.S. and Y.L.; Formal analysis, H.H.; Investigation, X.L. (Xuan Li) and X.L. (Xiangjin Liang); Resources, H.L.; Writing—original draft, A.Z.; Writing—review & editing, C.Y. All authors have read and agreed to the published version of the manuscript.

Funding

Supported by the CNPC Projects ‘Key Technology Research on Significantly Increasing Oil Recovery of Heavy Oil (No. 2023ZZ23)’ and Sichuan Science and Technology Program (No. 2022ZHYZ0007; No. 2023YFH0005).

Data Availability Statement

Data are contained within the article.

Conflicts of Interest

Authors Aiping Zheng, Houchuan Huang, Xuan Li, Huan Liu, Tianxiu Li, Dong Song, Pan Wang and Xiangjin Liang were employed by the company Heavy Oil Development Sub-Company, Xinjiang Oilfield Branch Company. The remaining authors declare that the research was conducted in the absence of any commercial or financial relationships that could be construed as a potential conflict of interest.

References

  1. Butler, R.M.; Stephens, D.J. The gravity drainage of steam-heated heavy oil to parallel horizontal wells. J. Can. Pet. Technol. 1981, 20, 90–96. [Google Scholar] [CrossRef]
  2. Hongzhao, T.; Ye, S. Operation parameters optimization of steam flooding with the combination of vertical and horizontal wells. Lithol. Reserv. 2013, 25, 127–130. [Google Scholar]
  3. Yun-Peng, Z.; Geng-Cheng, Y.; Gang, Z.; Zhi-Guo, W.; Zi-Qi, Z.; Wen-Zhe, Y. Principle and application of numerical simulation analysis of vertical well and horizontal well assisted gravity drainage. Sci. Technol. Eng. 2021, 21, 12916–12924. [Google Scholar]
  4. Changhong, Z.; Xinge, S.; Yingbo, L.U.; Li, W.; Pengcheng, H.U.; Xiangrong, X.; Guiqing, W. Physical simulation experiment of steam chamber evolution in compound development of thin-layer ultra-heavy oil flooding and drainage. Lithol. Reserv. 2023, 35, 161–168. [Google Scholar]
  5. Butler, R. The steam and gas push (SAGP). J. Can. Pet. Technol. 1999, 38, 47–54. [Google Scholar] [CrossRef]
  6. Butler, R.M.; Jiang, Q.; Yee, C. Steam and gas push (SAGP); 4, recent theoretical developments and laboratory results using layered models. J. Can. Pet. Technol. 2001, 40, 54–61. [Google Scholar] [CrossRef]
  7. Yuan, Z.; Liu, P.; Zhang, S.; Li, X.; Shi, L.; Jin, R. Experimental study and numerical simulation of nitrogen-assisted SAGD in developing heavy oil reservoirs. J. Pet. Sci. Eng. 2018, 162, 325–332. [Google Scholar] [CrossRef]
  8. Zhang, S.; Li, X.; Jiang, Y.; Zhang, Z.; Sun, X.; Wang, H. Physical modeling of nitrogen slug operation in Xinjiang SAGD projects—Fundamental roles of NCG in SAGD process. J. Pet. Sci. Eng. 2021, 203, 108642. [Google Scholar] [CrossRef]
  9. Butler, R.M. Thermal Recovery of Oil and Bitumen; Prentice Hall: Englewood Cliffs, NJ, USA, 1991. [Google Scholar]
  10. Dong, X.; Liu, H.; Hou, J.; Chen, Z.; Zhang, T. An empirical correlation to predict the SAGD recovery performance. J. Comput. Methods Sci. Eng. 2017, 17, 333–345. [Google Scholar] [CrossRef]
  11. Yang, G. Experimental study on physical simulation of the effect of reservoir thickness on SAGD in l oilfield. China Pet. Chem. Stand. Qual. 2016, 36, 48–49. [Google Scholar]
  12. Baker, R.; Fong, C.; Li, T.; Bowes, C.; Toews, M. Practical considerations of reservoir heterogeneities on SAGD projects. In Proceedings of the International Thermal Operations and Heavy Oil Symposium, Calgary, AB, Canada, 20–23 October 2008. [Google Scholar]
  13. Siavashi, M.; Garusi, H.; Derakhshan, S. Numerical simulation and optimization of steam-assisted gravity drainage with temperature, rate, and well distance control using an efficient hybrid optimization technique. Numer. Heat Transf. Part A Appl. 2017, 72, 721–744. [Google Scholar] [CrossRef]
  14. Mir, H.; Siavashi, M. Whole-time scenario optimization of steam-assisted gravity drainage (SAGD) with temperature, pressure, and rate control using an efficient hybrid optimization technique. Energy 2022, 239, 122149. [Google Scholar] [CrossRef]
  15. Patel, R.G.; Trivedi, J.J. Nonlinear model predictive control of steam-assisted-gravity-drainage well operations for real-time production optimization. SPE Prod. Oper. 2020, 35, 564–578. [Google Scholar] [CrossRef]
  16. Sasaki, K.; Akibayahsi, S.; Yazawa, N.; Doan, Q.; Ali, S.F. Numerical and experimental modelling of the steam assisted gravity drainage (SAGD) process. J. Can. Pet. Technol. 2001, 40, 44–50. [Google Scholar] [CrossRef]
  17. Saikia, B.D.; Rao, D.N. A single-well gas-assisted gravity drainage enhanced oil recovery process for U.S. Deepwater gulf of mexico operations. Energies 2021, 14, 1743. [Google Scholar] [CrossRef]
  18. Tao, L.; Yuan, X.; Cheng, H.; Li, B.; Huang, S.; Zhang, N. Experimental study on well placement optimization for steam-assisted gravity drainage to enhance recovery of thin layer oil sand reservoirs. Geofluids 2021, 2021, 1–18. [Google Scholar] [CrossRef]
  19. Jiang, Q. The steam and gas push (SAGP)-2: Mechanism analysis and physical model testing. In Proceedings of the Annual Technical Meeting, Calgary, AB, Canada, 8–11 June 1998. [Google Scholar]
  20. Pichugin, Z.; Chekhonin, E.; Popov, Y.; Kalinina, M.; Bayuk, I.; Popov, E.; Spasennykh, M.; Savelev, E.; Romushkevich, R.; Rudakovskaya, S. Weighted geometric mean model for determining thermal conductivity of reservoir rocks: Current problems with applicability and the model modification. Geothermics 2022, 104, 102456. [Google Scholar] [CrossRef]
  21. Kutcherov, V.G.; Serovaiskii, A.Y. Thermal conductivity of oil fractions at high pressure. Chem. Tech. Fuels Oils 2023, 58, 1094–1096. [Google Scholar] [CrossRef]
  22. Vogel, E.; Bich, E.; Hellmann, R. Determination of the binary diffusion coefficients and interaction viscosities of the systems carbon dioxide–nitrogen and ethane–methane in the dilute gas phase from accurate experimental viscosity data using the kinetic theory of gases. Int. J. Thermophys. 2023, 44, 129. [Google Scholar] [CrossRef]
  23. Yang, Y.; Peng, X.; Zhang, J.; Hao, H. Experimental research on the effect of residual oil saturation on fire flooding development in the late stage of steam injection. In Springer Series in Geomechanics and Geoengineering; Springer: Singapore, 2021; pp. 649–658. [Google Scholar]
  24. Krivova, N.R. Research results to determine residual oil saturation under steam treatment of the high-viscosity oil pool. EurAsian J. Biosci. 2019, 13, 1335–1342. [Google Scholar]
  25. Gong, H.; Yu, C.; Jiang, Q.; Su, N.; Zhao, X.; Fan, Z. Improving recovery efficiency by CO2 injection at late stage of steam assisted gravity drainage. Adv. Geo-Energy Res. 2022, 6, 276–285. [Google Scholar] [CrossRef]
  26. Li, S.; Yu, T.; Li, Z.; Zhang, K. Experimental investigation of nitrogen-assisted SAGD in heavy-oil reservoirs: A two-dimensional visual analysis. Fuel 2019, 257, 116013. [Google Scholar] [CrossRef]
  27. Yaseen, M.; Rawat, S.K.; Khan, U.; Sarris, I.E.; Khan, H.; Negi, A.S.; Khan, A.; Sherif, E.S.M.; Hassan, A.M.; Zaib, A. Numerical analysis of magnetohydrodynamics in a Eyring-Powell hybrid nanofluid flow on wall jet heat and mass transfer. Nanotechnology 2023, 34, 485405. [Google Scholar] [CrossRef] [PubMed]
  28. Noori Rahim Abadi, S.M.A.; Mehrabi, M.; Meyer, J.P. Numerical study of steam condensation inside a long, inclined, smooth tube at different saturation temperatures. Int. J. Heat. Mass. Transf. 2018, 126, 15–25. [Google Scholar] [CrossRef]
Figure 1. Development performance of nitrogen-assisted VHSD operations in the demonstration area with 4 well pairs.
Processes 12 00754 g001
Figure 2. Development performance of nitrogen-assisted VHSD operations in the extension area with 4 well pairs.
Processes 12 00754 g002
Figure 3. Comparison of unit compound evaluation indicators.
Processes 12 00754 g003
Figure 4. Comparison of the contribution degrees of influencing factors.
Processes 12 00754 g004
Figure 5. SAGD two-dimensional physical simulation system.
Processes 12 00754 g005
Figure 6. The schematic diagram of the two-dimensional VHSD model.
Processes 12 00754 g006
Figure 7. Characteristics of CSS stage for steam chamber development. (a) Completion of the steam injection for the first cycle of CSS (25 min); (b) Completion of the oil production for the first cycle of CSS (35 min); (c) Completion of the steam injection for the second cycle of CSS (55 min); (d) Completion of the oil production for the second cycle of CSS (65 min).
Processes 12 00754 g007
Figure 8. Characteristics of gravity drainage stage for steam chamber development. (a) 5 min of steam injection; (b) 13 min of steam injection; (c) 19 min of steam injection; (d) 25 min of steam injection; (e) 40 min of steam injection; (f) 55 min of steam injection.
Processes 12 00754 g008
Figure 9. Characteristics of nitrogen injection stage for steam chamber development. (a) 4 min of nitrogen injection; (b) 7 min of nitrogen injection; (c) 11 min of nitrogen injection.
Processes 12 00754 g009
Figure 10. Characteristics of the steam chamber during the second steam injection stage. (a) 10 min of steam injection; (b) 20 min of steam injection; (c) 30 min of steam injection; (d) 45 min of steam injection; (e) 60 min of steam injection.
Processes 12 00754 g010
Figure 11. Oil recovery comparison curves.
Processes 12 00754 g011
Figure 12. Water cut comparison curves.
Processes 12 00754 g012
Figure 13. Cumulative oil-to-steam ratio comparison curves.
Processes 12 00754 g013
Figure 14. Instantaneous oil-to-steam ratio comparison curves.
Processes 12 00754 g014
Figure 15. Comparison curves of nitrogen density and saturated steam density at different steam qualities under different temperatures.
Processes 12 00754 g015
Figure 16. Steam chamber characteristics of pure steam VHSD versus nitrogen-assisted VHSD. (a) 55 min of pure steam injection; (b) 52 min of steam injection after nitrogen injected.
Processes 12 00754 g016
Figure 17. Comparison curves of steam and nitrogen viscosity at different temperatures.
Processes 12 00754 g017
Figure 18. Effect of nitrogen addition on steam saturation temperature.
Processes 12 00754 g018
Figure 19. Well temperature profile of well 98 A before and after nitrogen injection.
Processes 12 00754 g019
Figure 20. Production curve of well 98 A after nitrogen injection.
Processes 12 00754 g020
Table 1. Summary of the evaluation indicators for SAGD extraction.
Influencing FactorLevelsM N p
Oil layer thickness
(m)
124336.752940.744
147345.927
1611,466.38
1821,500.5
2028,084.83
2233,412.29
Oil saturation0.511,934.0784,764.93
0.5513,841.56
0.616,234.32
0.6521,146.2
0.727,188.67
0.7531,841.42
0.837,363.55
PIR1.0514,709.1846,897.25
1.117,031.85
1.221,360.27
1.326,455.69
Steam temperature (°C)22019,541.9911.89169
24020,086.57
26019,917.1
28019,934.05
30020,493.33
Steam quality0.652,003.714,331.39
0.747,440.8
0.845,470.5
Table 2. Orthogonal experimental design and results.
Serial NumberOil Layer Thickness
(m)
PIRSteam QualityOil SaturationSteam Temperature
(°C)
Breakthrough TimeM
1121.20.80.824018-Aug-202347,130.56
2181.10.60.624022-Jun-202815,061.66
3121.20.60.726024-Apr-20235135.289
4181.020.60.822025-Feb-202814,164.88
5121.30.70.622024-Jun-202330,161.33
6221.020.60.53002-Apr-20288062.862
7121.30.60.730027-Aug-202332,198.33
8121.020.70.626015-Jul-202324,859.21
9181.020.70.728018-May-202617,168.36
10161.30.60.828010-Jan-202537,604.71
11221.20.60.628011-Jun-202821,435.23
12161.10.60.526026-Jun-202315,556.46
13161.020.80.630017-Aug-202413,015.4
14161.20.70.522013-Aug-202412,192.13
15181.20.70.53003-May-202512,285.01
16221.30.70.524031-Oct-202616,048.23
17181.30.80.526029-Aug-202414,685.22
18221.10.80.722014-Sep-202728,053.29
19121.10.70.528014-Jul-202317,964.59
20121.020.80.528027-Jun-202318,488.32
21161.020.70.72407-Feb-202516,867.82
22221.020.70.826010-Jul-202834,756.96
23121.020.60.524010-Aug-202315,033
24121.020.60.522020-Aug-202314,466.26
25121.10.70.83006-Sep-202341,338.7
Table 3. Comparison of equivalent times before and after model adjustment.
After AdjustmentBefore Adjustment
Model Time
/min
Actual Time
/a
Model Time
/min
Actual Time
/a
604.208600.17
Table 4. The initial parameters of the physical VHSD model.
Experimental SchemePore Volume
(cm3)
Saturated Oil
(mL)
Oil Saturation
(%)
Steam3259230070.6
Steam + N2 assistant3243230971.2
Table 5. Comparison table of reservoir parameters and experimental model parameters.
Physical SignificanceReservoir Parameter ValuesModel Parameter ValuesComments
Reservoir thickness (m)20.380.35Geometric similarity criterion
Distance of injection and production well (m)50.05
Vertical well separation (m)700.07
Perforation thickness of vertical well (m)100.01
Average porosity (%)30.3531.7Equal
Average permeability (mD)98524783Permeability similarity model
Oil saturation (%)7170Equal
Viscosity of degassed crude oil at 50 °C (mPažs)99309930
Oil density at 50 °C (kg/m3)984.1984.1
Steam injection rate (t/d, mL/min)13034.0The model steam injection rate is calculated based on the steam quality, perforation thickness, and the vertical well injection rate of 130 t/d
Steam quality0.80.8Equal
Time (a, min)4.2160Modified time similarity model
Volume of nitrogen injected during the first round (m3, Ncm3)28,000–32,000530–605According to the proportional transformation of the model volume
Average horizon section length of the steam absorption (m)2000.025Based on the interpretation report of the wellbore temperature profile test
Disclaimer/Publisher’s Note: The statements, opinions and data contained in all publications are solely those of the individual author(s) and contributor(s) and not of MDPI and/or the editor(s). MDPI and/or the editor(s) disclaim responsibility for any injury to people or property resulting from any ideas, methods, instructions or products referred to in the content.

