Article

Experimental Studies of Methane Adsorption on Activated Carbon and 3D Graphene Materials

Institute of Marine Engineering, Jimei University, Xiamen 361021, China
*
Author to whom correspondence should be addressed.
Processes 2023, 11(8), 2487; https://doi.org/10.3390/pr11082487
Submission received: 29 July 2023 / Revised: 10 August 2023 / Accepted: 17 August 2023 / Published: 18 August 2023

Abstract

:
Two kinds of slit pore carbon materials, namely activated carbon (AC) and 3D graphene materials (3D-GS), were purchased to examine their methane storage capabilities. The structural analysis and characterization of AC and 3D-GS were carried out using X-ray diffraction (XRD), scanning electron microscopy (SEM), the X-ray energy dispersive spectrum (EDS), and N2 adsorption/desorption isotherms. Additionally, a thermodynamic framework was employed in the Henry’s law region to evaluate the potential well between the adsorbed fluid and adsorbent. The adsorption behavior of methane on two materials at room temperature and high pressure was also investigated. The results show that the Toth equation is the most suitable model for predicting adsorption isotherms than the Langmuir and L-F equations and determines that the absolute uptake of methane storage on AC and 3D-GS are, respectively, 7.86 mmol·g−1 and 8.9 mmol·g−1 at 298 K and 35 bar. In the Henry’s law region, the isosteric heat of methane adsorption on 3D-GS is larger than that of AC. Meanwhile, the potential well between methane and carbon-based materials decreases as the temperature increases. This indicates that the capacity of methane uptake is enhanced at lower temperatures, which is consistent with the measurements of adsorption isotherms. The research concludes that the 3D-GS is more suitable as a material storage medium than AC. This study provides valuable theoretical guidance for exploring the potential of methane storage on slit pore carbon-based material.

1. Introduction

Methane is one of the most important energy sources in natural gas and biogas [1], but the low volumetric and gravimetric storage capacities of methane at room temperature still restrict its application as fuel in mobile vehicles [2,3]. It is still a challenge to safely and effectively improve the capacity of methane storage [4]. Traditional methane storage includes liquefied natural gas (LNG) and compressed natural gas (CNG). Although LNG can store methane with commendable energy density, the additional energy must be consumed for cooling at 112 K [5]. CNG consumes a lot of energy to pressurize over 20 MPa for compressing natural gas since methane is a supercritical gas at room temperature [6]. Adsorbed natural gas (ANG) is considered an alternative method of natural gas storage because it can store natural gas at room temperature and medium pressure (3–4 MPa) [7,8].
Methane adsorption on sorbents with high surface areas, such as carbon materials [4,9], MOFs [10,11,12] and other porous materials, has been extensively researched due to its lightness, fast kinetics, and full reversibility. Developing suitable and excellent adsorbent materials remains a bottleneck issue for the large-scale use of ANG as an energy carrier. Compared with MOFs, the outstanding advantages of carbon materials such as ease of preparation, low cost, chemical and mechanical stability and controllable porosity are important features of their wide availability [13]. According to the pore structure classification, carbon-based materials can be divided into graphite plates (e.g., graphite, carbon black and graphene sheets [14,15]), slit pores (e.g., coal and activated carbon [1,15,16,17,18]), and cylindrical pores (e.g., CMS, nanotubes [19] and nanofibers [20,21,22,23]). Considering the low price, ultra-high specific surface area and easy preparation of activated carbon, it has been widely studied for ANG since the 1980s [24]. However, most activated carbons exhibit a methane adsorption capacity of 50–160 v/v under standard conditions [25,26], which does not meet the goals set by the U.S. Department of Energy (DOE) [27]. In order to maximize the storage capacity of methane, it is still feasible to adjust the pore size distribution and increase the specific surface area of activated carbon [9,28]. Recent research showed that the premix of polypyrrole (PPY) and biomass-derived air-carbonized date seed carbon has been successfully used to adjust the porosity of activated carbon, which achieved higher gravimetric and volumetric methane uptake than MOFs [29]. However, the preparation process is relatively complex compared to commercial activated carbon.
Recently, the family of nanostructured carbons has been expanded to include graphene-related materials as an adsorbent, which have been reported to adsorb methane [30,31]. In general, graphene sheets (GS) have smaller surface areas and micro-pore volumes than activated carbon, and it is often assumed that they have a maximal surface area of about 2630 m2/g, which is many times greater than those in previously published studies performed only on reduced graphene oxide (r-GO) samples [14,30,31]. In a previous study [15], we found that GS and activated carbon have similar isosteric heat of methane adsorption and interaction energy between adsorbates. Therefore, the development of GS-related adsorbents should focus on expanding their specific surface area and pore volume. Activation of graphene promotes the creation of a 3D structure made up of linked (i.e., 3D graphene materials), highly imperfect graphene sheets with a greater surface area required for increased methane adsorption [32]. Due to the ultra-high specific surface area and excellent conductivity, 3D graphene materials are widely studied in energy storage [33]. But the capacity of methane adsorption for 3D graphene materials has not been investigated. Therefore, for this study, we purchased commercial activated carbon and 3D graphene materials to investigate their capacity for methane storage for ANG.
In this paper, the behavior of methane adsorption on activated carbon and 3D graphene materials was studied for the development of a storage medium for ANG. Firstly, the structures of AC and 3D-GS were analyzed and characterized by XRD, SEM, EDS and N2 adsorption/desorption isotherms. Secondly, the thermodynamic framework was used to evaluate the potential well between adsorbents and slit pore adsorbents in the Henry’s law region. Finally, the absolute capacity of methane adsorption on carbon-based materials at room temperature and high pressure ~8 MPa was studied based on engineering applications. This work provides a useful effort to explore the potential of methane storage on carbon-based materials.

2. Materials and Methods

2.1. Materials

Considering engineering applications, carbon materials are all commercial products. The activated carbon and 3D graphene materials used in this paper were, respectively, purchased from Ningde Xinsen Activated Carbon Ltd. (Ningde, China) and ENN Group (Langfang, China) instead of being synthesized. The activated carbon was a kind of coconut shell activated carbon, which was named AC. The 3D graphene materials were named 3D-GS. The three gases that were employed were ultra-high quality (methane, nitrogen, and helium 99.999%). The used gases, LN and LAR, were acquired from Xiamen Linde Gas Co., Ltd. (Xiamen, China).

2.2. Characterization

Both carbon materials were, respectively, studied for their microstructure and composition by SEM and EDS, as shown in Figure 1.
The SEM image in Figure 1 reveals that 3D-GS is composed of a multilayer graphite plate, and its structure is quite different from that of activated carbon. The elemental analysis results of desiccant material from the EDS image are listed in Table 1.
As shown in Table 1, the content of carbon atoms in the 3D-GS is only 67%, and that of the AC is 95.91%. The above results are similar to our previous studies on graphene sheets and carbon black [14].
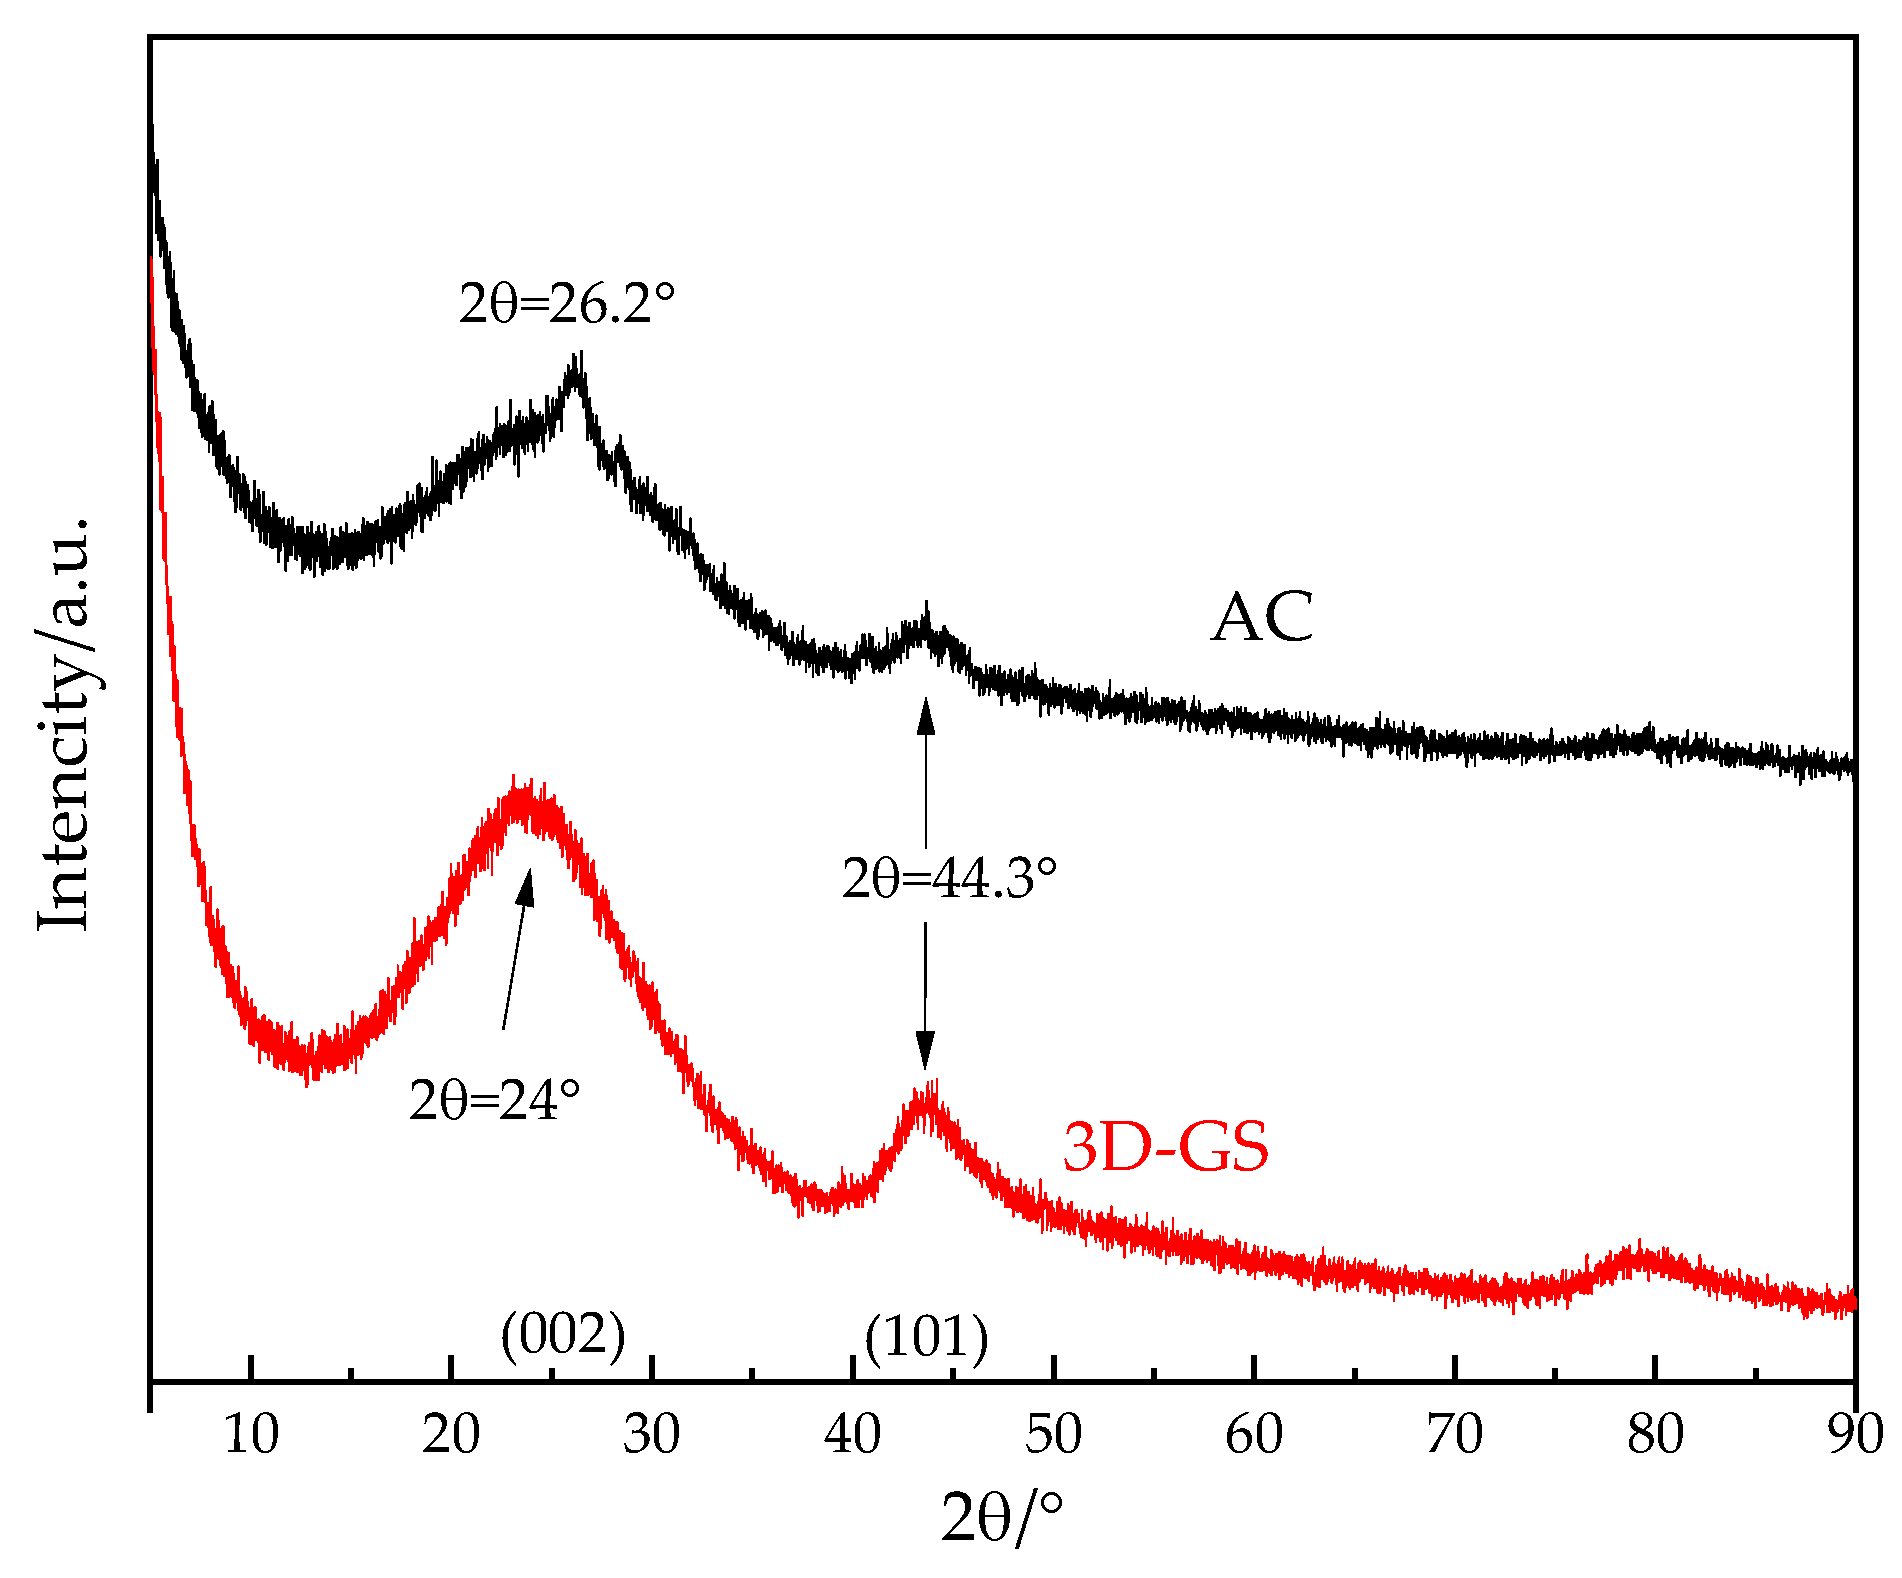
In order to evaluate the structure of carbon-based materials, a Rigaku MiniFlex 600 X-ray diffraction instrument was used to analyze the crystal structure of carbon-based materials with a scanning step size of 0.02° in the 2θ range of 5–90°. Figure 2 shows the XRD spectra of activated carbon AC and porous graphene material 3D-GS. The characteristic peaks of activated carbon and 3D-GS obtained indicate that the two peaks observed on activated carbon are at 26.2° (002) and 44.3° (101), while the most obvious peak of GS is at 24° (002). A peak of 44.3° (101) also exists but is not obvious. The results indicate that both carbon-based materials have amorphous characteristics with a slight crystal structure [34,35].
In this work, the distance of interlayer  d  in carbon materials is determined utilizing Bragg’s law,  d = λ 2 Sin θ . Here,  λ = 0.15406   n m . The calculation results show that the distance of the activated carbon interlayer is 0.34 nm, which is consistent with the theoretical distance of the graphite interlayer [36]. Therefore, it is assumed to be a slit pore composed of two graphite plates.
The distance of the 3D-GS interlayer is 0.37 nm, which indicates that during the preparation process, the interlayer distance of graphene increases. This implies some characteristics of nano-carbon materials, such as graphene sheets and carbon nanotubes [37].

2.3. Gas Adsorption Measurements

Micromeritics 3Flex was used to measure N2 adsorption isotherms at 77 K, from which the BET specific surface area, pore size distribution, and pore volume were determined. Before each test, the samples were subjected to vacuum at 393 K for 24 h to remove any moisture. The specific surface area has been calculated from isothermal data using the BET method. The pore size distribution (PSD) of both carbon-based materials was determined by the 2D-NLDFT method. The detailed process can be found in our previous work [38].
Approximately 0.0338 g AC and 0.0287 g 3D-GS were selected for methane adsorption measurements at low pressure and 283–303 K. Equilibrium data were also volumetrically obtained by Micromeritics 3Flex.
About 0.2581 g AC and 0.2283 g 3D-GS were selected for methane adsorption measurements at high pressure. The adsorption equilibrium data under high pressure were volumetrically measured by Setaram PCTPro E & E, an instrument for accurately measuring gas adsorption equilibrium within a temperature–pressure range, respectively, from 77–673 K and 0–20 MPa, and more testing details can be found in our previous research [39].
Prior to each adsorption test using Micromeritics 3Flex and PCTPro E & E, the sample was placed in a vacuum at 393 K for 12 h to degas any moisture from it. To ensure the accuracy of the experimental data, the test was repeated twice in a bath of liquid nitrogen or oil.

3. Results and Discussion

3.1. Pore Structures

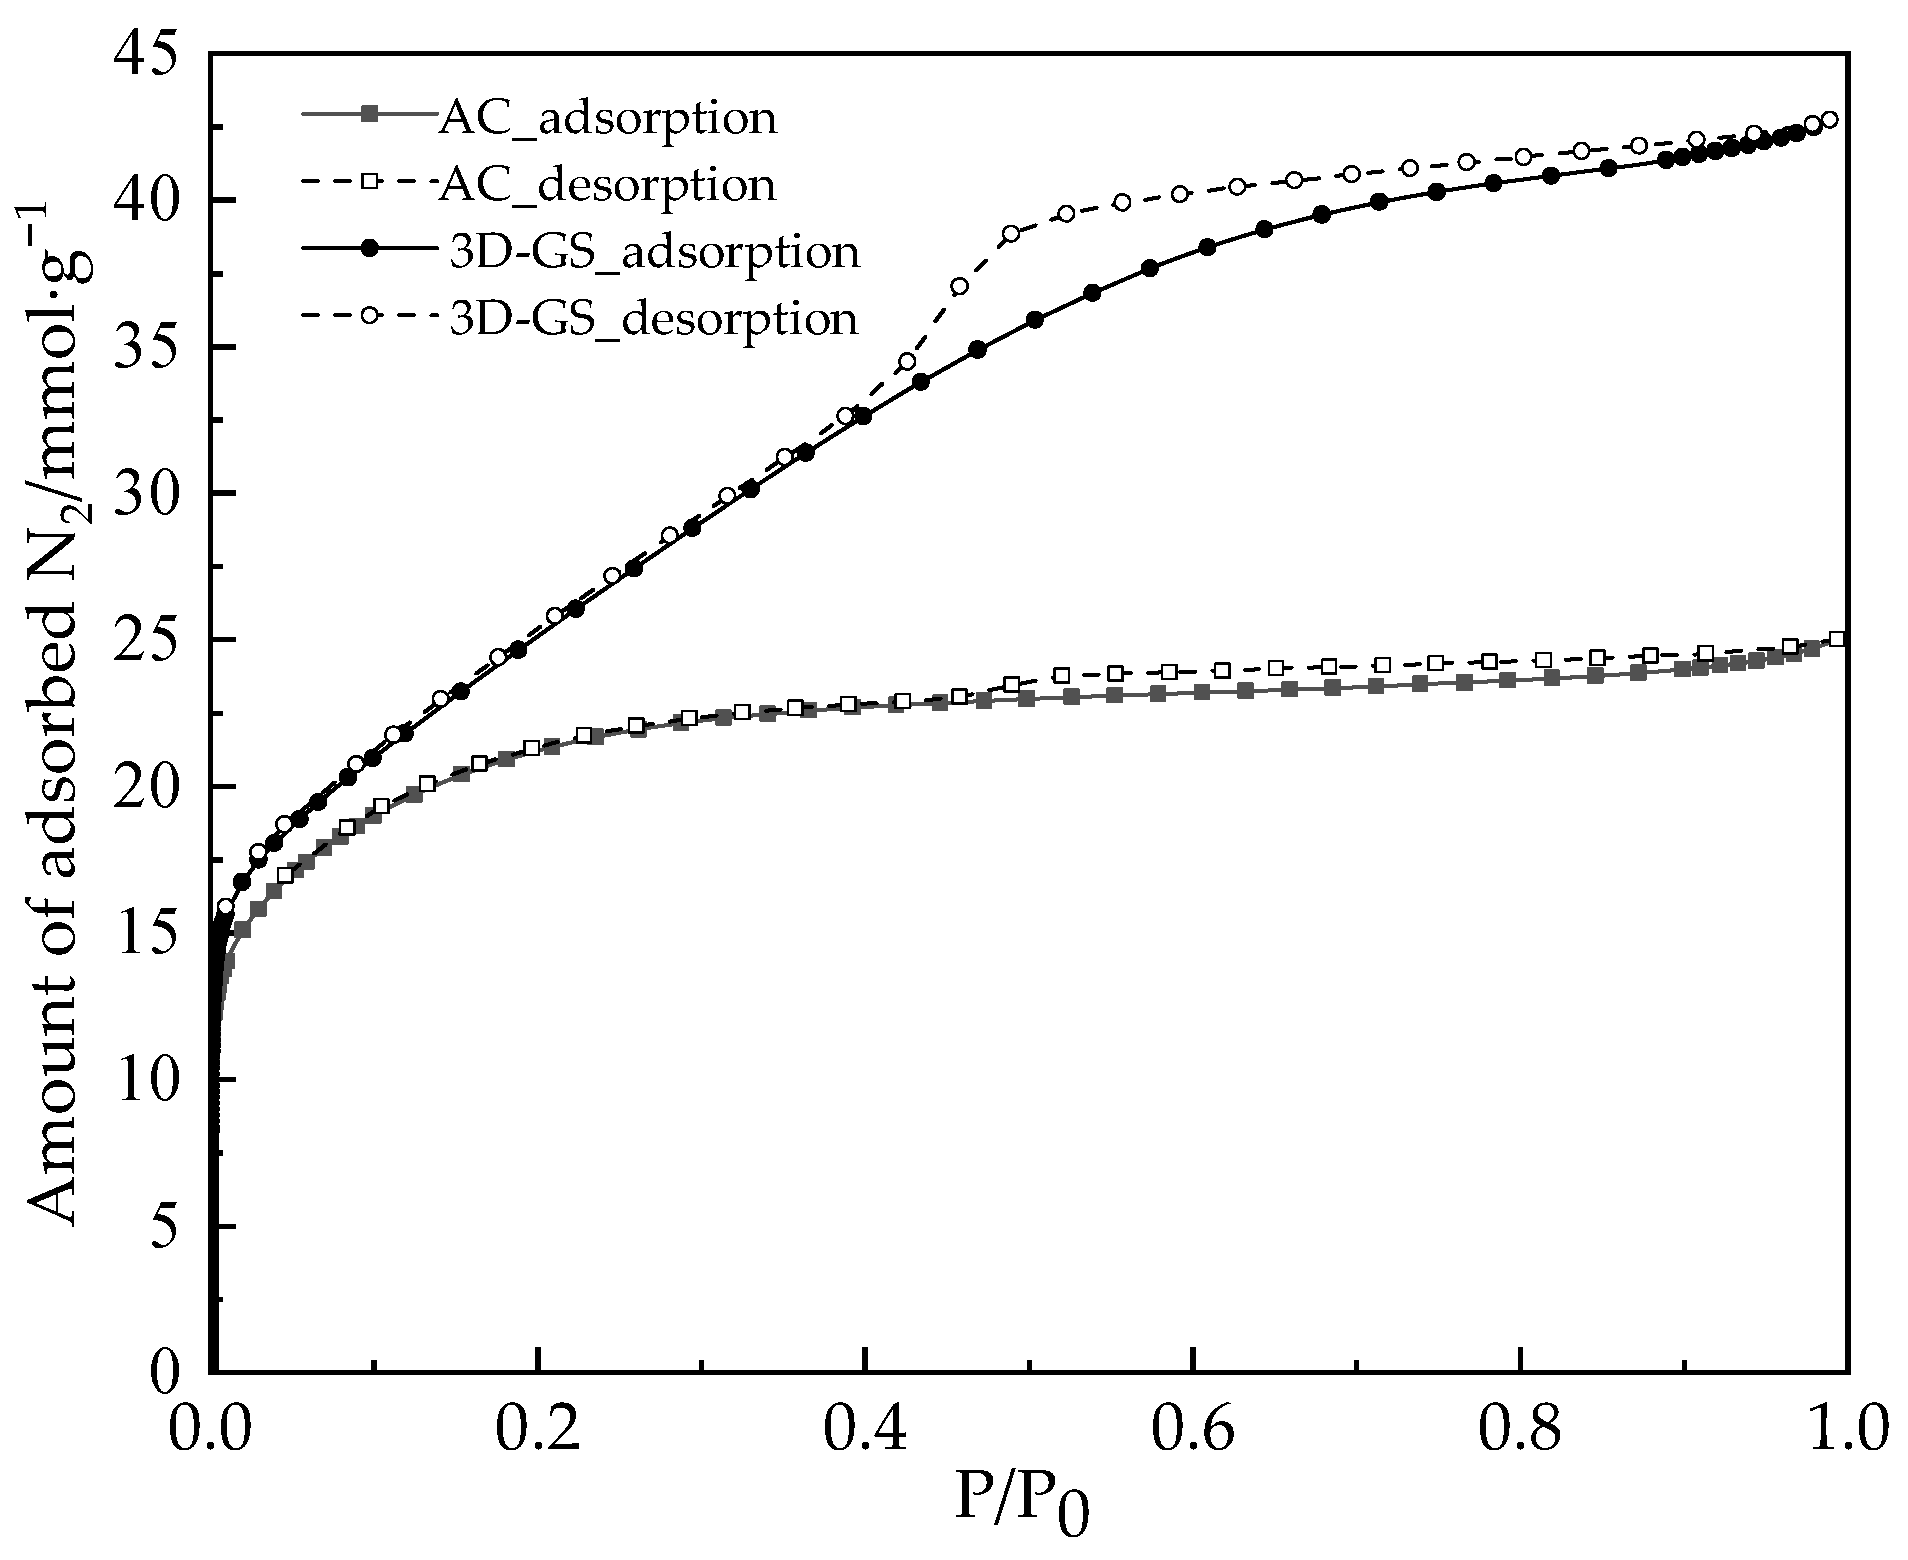
The N2 adsorption data at 77 K were measured by Micromeritics 3Flex; the adsorption isotherms of both carbon-based materials were as shown in Figure 3. The adsorption isotherms of N2 on both carbon materials are typical type I adsorption isotherms according to the IUPAC classification [40]. The adsorption amounts of AC samples are close to saturation after P/P0 = 0.2. It is possible to see that the AC is a typical microporous material. But the desorption isotherm on 3D-GS has an obvious ‘hysteresis loop’ phenomenon, and the desorption isotherm on AC is inconspicuous. It implies that the 3D-GS sample has some mesopores and micropores, and AC can be considered a typical microporous material.
Table 2 shows the results of calculating the SBET of both carbon-based materials using the relative pressure P/P0 = 0.05–0.3; detailed information can be found in the Supplementary Materials.
As listed in Table 2, the SBET of 3D-GS is around 2045 m2·g−1, which is larger than that of AC (1629 m2·g−1). It can be found from Figure 3 that the capacity of N2 adsorption on 3D-GS is also larger than that of AC, which indicates that it has a larger specific surface area and pore volume. For supercritical adsorption, the adsorption capacity is positively correlated with the specific surface area [4]. Therefore, 3D-GS may have a better adsorption potential than AC.
For the characterization of PSD of carbon materials, its pore structure is often approximated as a 1D pore structure. For example, the slit pores of activated carbon are only related to the pore width [41]. When NLDFT was used to solve the PSD of activated carbon in the early stage, it was considered that the fluid was distributed on the graphite plate with a uniform energy distribution, but the surface energy distribution of activated carbon and other porous materials was in fact heterogeneous, which would lead to the deviation between the predicted results and the experimental values. For this reason, Ustinov and Do further consider the surface energy heterogeneous term of a 1D energy distribution in the solution process of NLDFT [42]. Ravikovich et al. regard the rough carbon crystal surface as the carbon atom in the quenched phase state, proposed the QSDFT theory [43,44], solved the contribution of the binary hard sphere fluid repulsion term by using the FMT theory, and predicted the adsorption–desorption equilibrium of nitrogen and argon on the ordered porous silica gel MCM-41 [45]. However, the above research based on NLDFT or QSDFT with a 1D function still cannot accurately describe the surface energy heterogeneous distribution on the adsorbent, so it is necessary to further establish a 2D or 3D surface energy distribution model.
As early as 2013, Jagiello and others studied the 2D-NLDFT [46]. They consider two 2D-NLDFT models: energetically heterogeneous and geometrically corrugated of the graphite plane [47], and the results show that the PSD results of the two hypotheses are similar. This indicates that for activated carbon, the 2D gas–solid surface model can be used to analyze the two basic characteristics of the sample’s micropore geometry and heterogenous surface energy. The quantitative improvement of the original slit pore model can significantly improve the analysis results of the PSD of activated carbon. Subsequently, they used 2D-NLDFT to characterize cylindrical pores such as silica gel and carbon nanotubes. The characterization gases used were nitrogen, oxygen, argon and hydrogen. The model was widely verified [48].
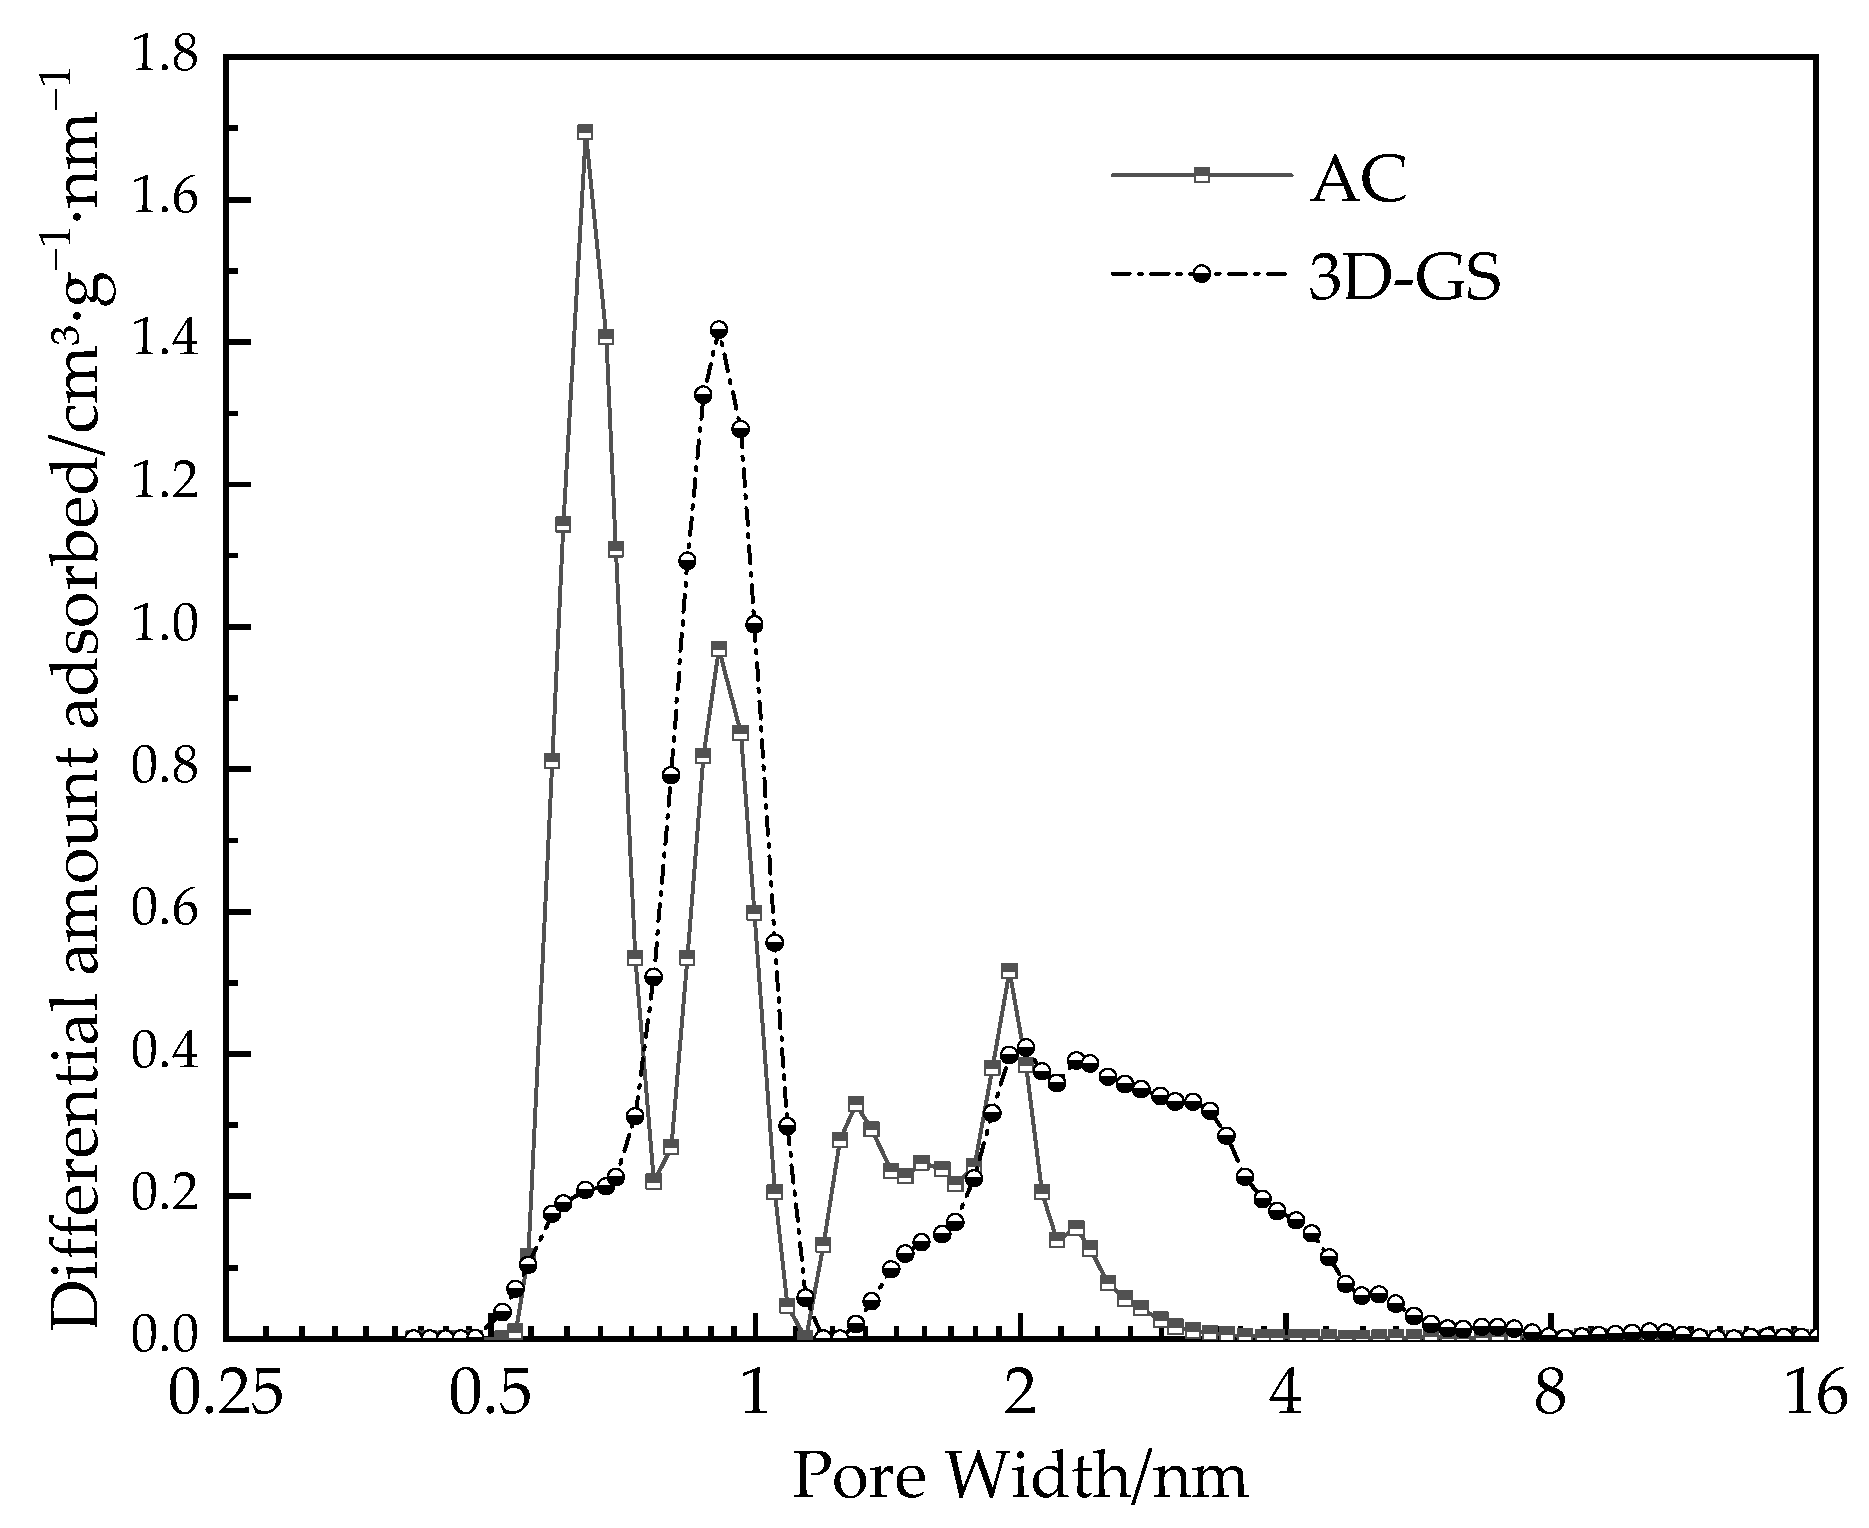
Therefore, considering the heterogeneous surface energy of carbon-based materials, the 2D-NLDFT method was employed to determine the PSD and cumulative micropore volume as shown in Figure 4. The mean pore width of two carbon materials was calculated and is listed in Table 2.
It can be found from Figure 4 and Table 2 that the PSD of activated carbon is concentrated in micropores, and its characteristic pores are concentrated at 0.64 nm, 0.91 nm, 1.3 nm and 2 nm, respectively. However, the micropore volume of 3D-GS is smaller than that of mesopores, and the micropores are mainly concentrated at about 0.91 nm. According to the research [9], methane is suitable for storage in pores 2–3 times the molecular diameter (i.e., between 0.76 and 1.15 nm), while the pore volume of 3D-GS in this region is 0.338  cm 3 · g 1  and that of activated carbon is only 0.185  cm 3 · g 1 . Combined with the SBET value in Table 2, 3D-GS is 1.25 times that of AC, which shows that 3D-GS seems to be more suitable for methane storage. In addition, the mesopores of 3D-GS are concentrated in the range of 2–6 nm, while the activated carbon is concentrated in the range of 2–4 nm.

3.2. Adsorption Equilibrium at Low Surface Coverage Region

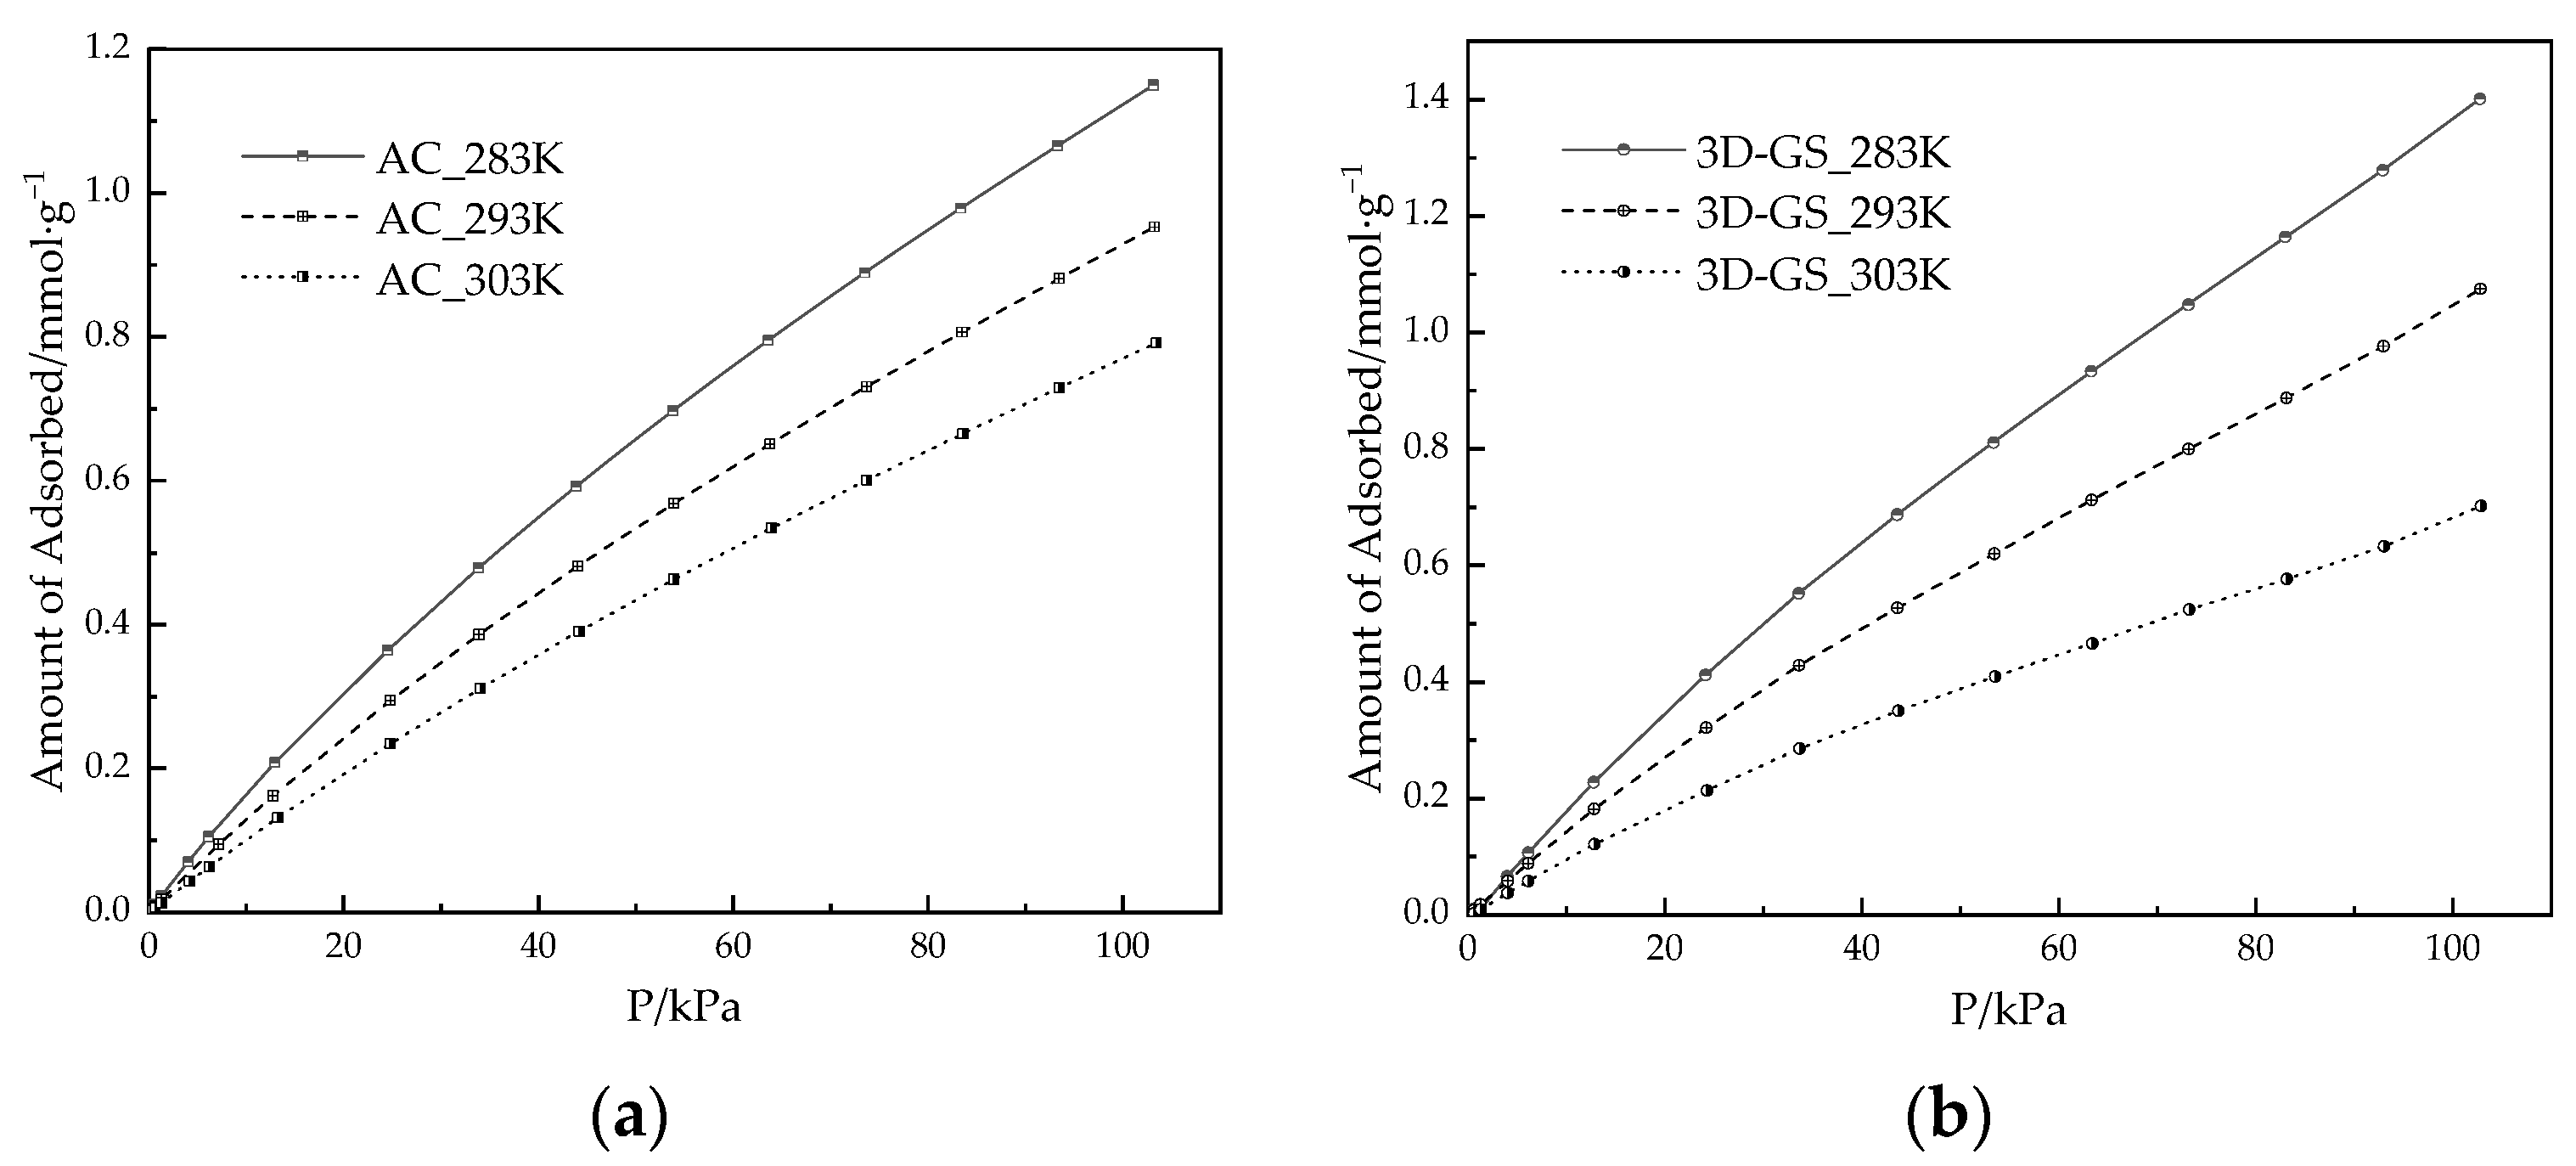
The adsorption isotherms for methane at 283–303 K, which were measured using Micromeritics 3Flex within the low-pressure range of 0–100 kPa, are plotted in Figure 5.
Figure 5 shows that all isotherms of methane adsorption on carbon materials appear to be characteristic of the type I isotherm of adsorption, and  n e x c  of methane adsorption on the AC is smaller than that on the 3D-GS at 100 kPa and all test temperatures (283–303 K). According to Table 2, the SBET of 3D-GS is larger than that of AC, which means that an adsorbent with a larger SBET has a larger methane uptake. In addition, it also indicates the same interaction mechanism between methane and the aforementioned carbon-based adsorbents, with their specific surface area and microporous volume being important contributors to methane adsorption.

3.2.1. Adsorption Equilibrium

According to Gibbs’ definition of adsorption, excess adsorption  n e x c  and absolute adsorption  n a b s  can be correlated as follows:
n e x c = n a b s ρ b u l k v a
where  v a  is the volume of adsorbed phase for carbon-based materials and  ρ b u l k  is the density of the bulk gas phase. Here, the density of the bulk gas phase can be found in the NIST data [49].

3.2.2. Isosteric Heat of Adsorption

Aimed at more accurately comparing the adsorption behavior of methane on carbon-based materials AC and 3D-GS, the isosteric heat of adsorption at zero surface coverage  q s t 0  was determined by experimental data as shown in Figure 4.
In the region of Henry’s law, the excess adsorption is proportional to the equilibrium pressure of adsorption [50],
n e x c H P P
where  H P  is the Henry’s law constant. The process to determine the  H P  by the equilibrium data at 0–1.5 kPa is shown in Figure 6.
q s t 0  is determined by  H p  as [51],
q s t 0 = R d ln H P d 1 T
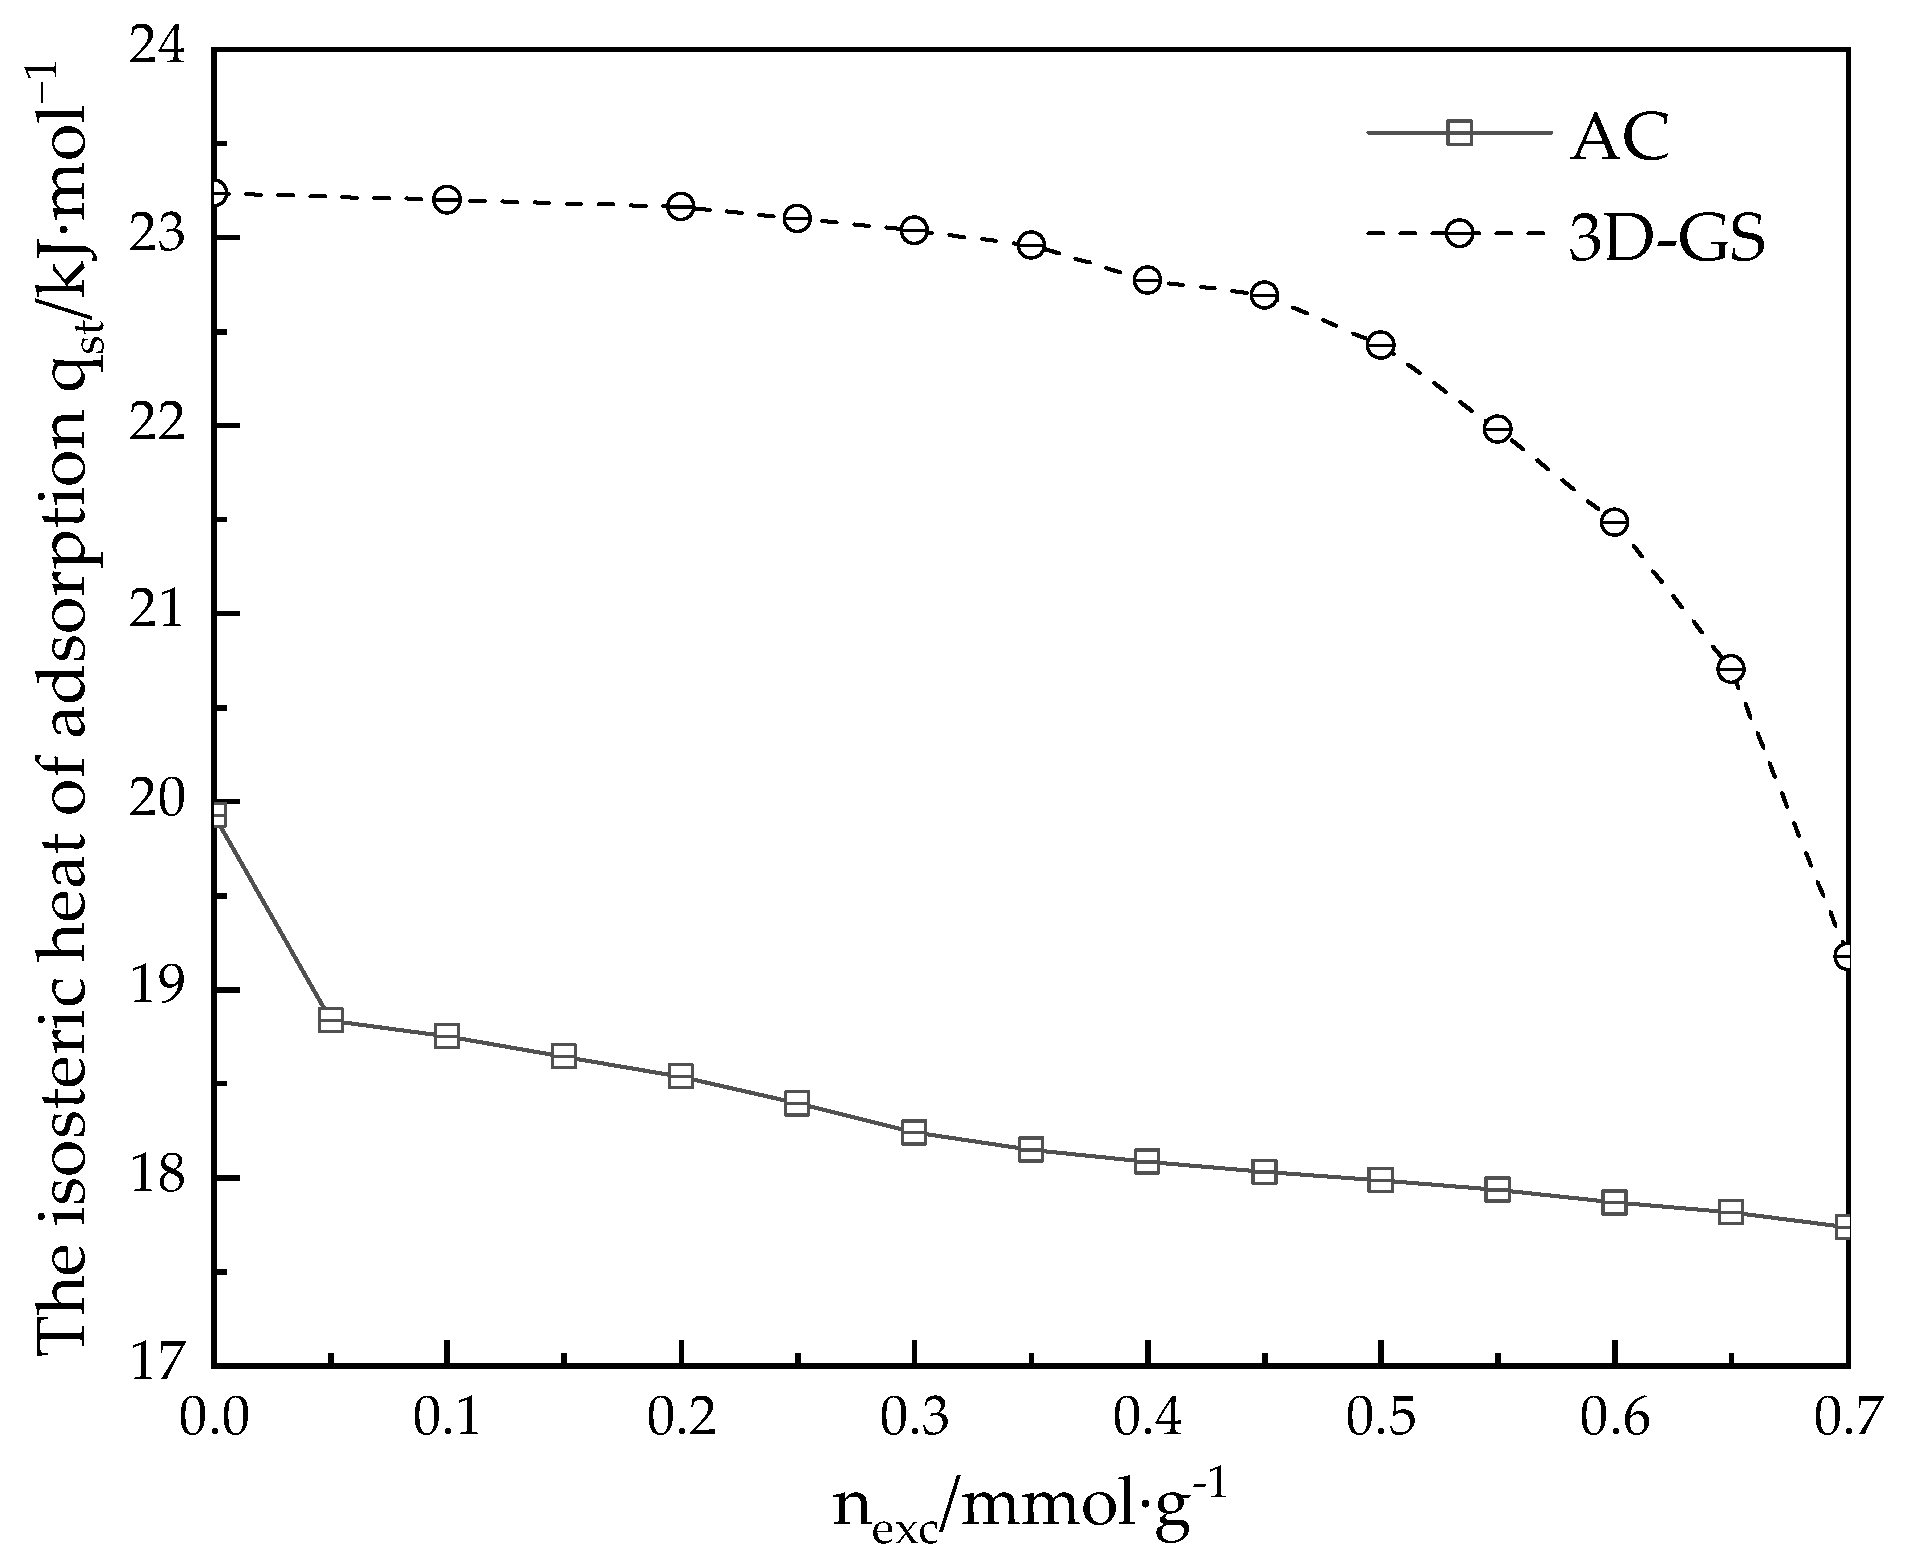
Results are also listed in Table 3. The  q s t 0  of methane adsorption on AC and 3D-GS is about 19.93 kJ·mol−1 and 23.23 kJ·mol−1, respectively. It implies that, in addition to a contribution from a larger SBET of the 3D-GS, the more activation sites of 3D-GS adsorbing methane may be another important reason for its larger adsorption capacity.
As listed in Table 3, the parameters of  H p  were determined using Equation (2) using the experiment data as shown in Figure 6, which decrease as the temperature increases. Since activated carbon has more ultra-micropores (<0.7 nm) as shown in Figure 4, the parameters of  H p  for AC are slightly higher than those of 3D-GS at all test temperatures.

3.2.3. Thermodynamic Framework for Potential Well between Methane-Adsorbent

For a slit pore model of activated carbon and 3D-GS, it cannot be directly solved as a graphite plane as in previous work [14]. In this paper, we introduce 2D-NLDFT to solve the integral adsorption isotherm equation (IAE) of PSD [41],
n e x c = w min w max n e x c w f w d w = i N n e x c w i f w i Δ w
where  w  is the pore width,  f w  is a function about pore size distribution as shown in Figure 3, and  n e x c w  is excess adsorption capacity with pore width  w .
At very low coverage, the adsorbate molecules can be regarded as the Boltzmann distribution relative to the slit pore with the pore width of  w .
n a b s = ρ b u l k v a exp V e x t ( z ) k T d v
The bulk density of fluid under low pressure can be approximated to an ideal state,  ρ b u l k = P R T , and according to Gibbs’ definition of adsorption as listed in Equation (1),
n e x c w i = P R T v a exp V e x t ( z ) k T 1 d v = P R T 0 H exp V e x t ( z ) k T 1 d z
where  V e x t ( z )  is the interaction between fluid and adsorbent in the slit pore with a pore width of  w . The 10-4-3 potential [52] was selected to determine the  V e x t ( z ) , which defines the pore width  H  measured between the centers of carbon atoms composing the surface planes of the opposite walls,  H = w + σ ss .
V e x t ( z ) = A ε s f 2 5 σ s f z 10 σ s f z 4 σ s f 4 3 Δ z + 0.61 Δ 3 + 2 5 σ s f H z 10 σ s f H z 4 σ s f 4 3 Δ H z + 0.61 Δ 3
where  A = 2 π σ s f 2 ρ s Δ ρ s  and  Δ  are the density and interlayer distance of graphite. For methane adsorption on carbon materials, we set the solid–fluid interaction parameters as  σ s f = 0.3605   n m . But the potential well between adsorbate–adsorbent  ε s f  is considered as a variable to be determined as follows.
The excess adsorption  n e x c  can also be associated with the Virial equation [53]
n e x c B 2 S P R T
where  B 2 S  is the second Virial constant. In the very low surface concentration region, one can obtain the following expression from Equations (4), (6), and (8) as
B 2 S = i N 0 H i exp V e x t ( z ) k T 1 d z f w i Δ w
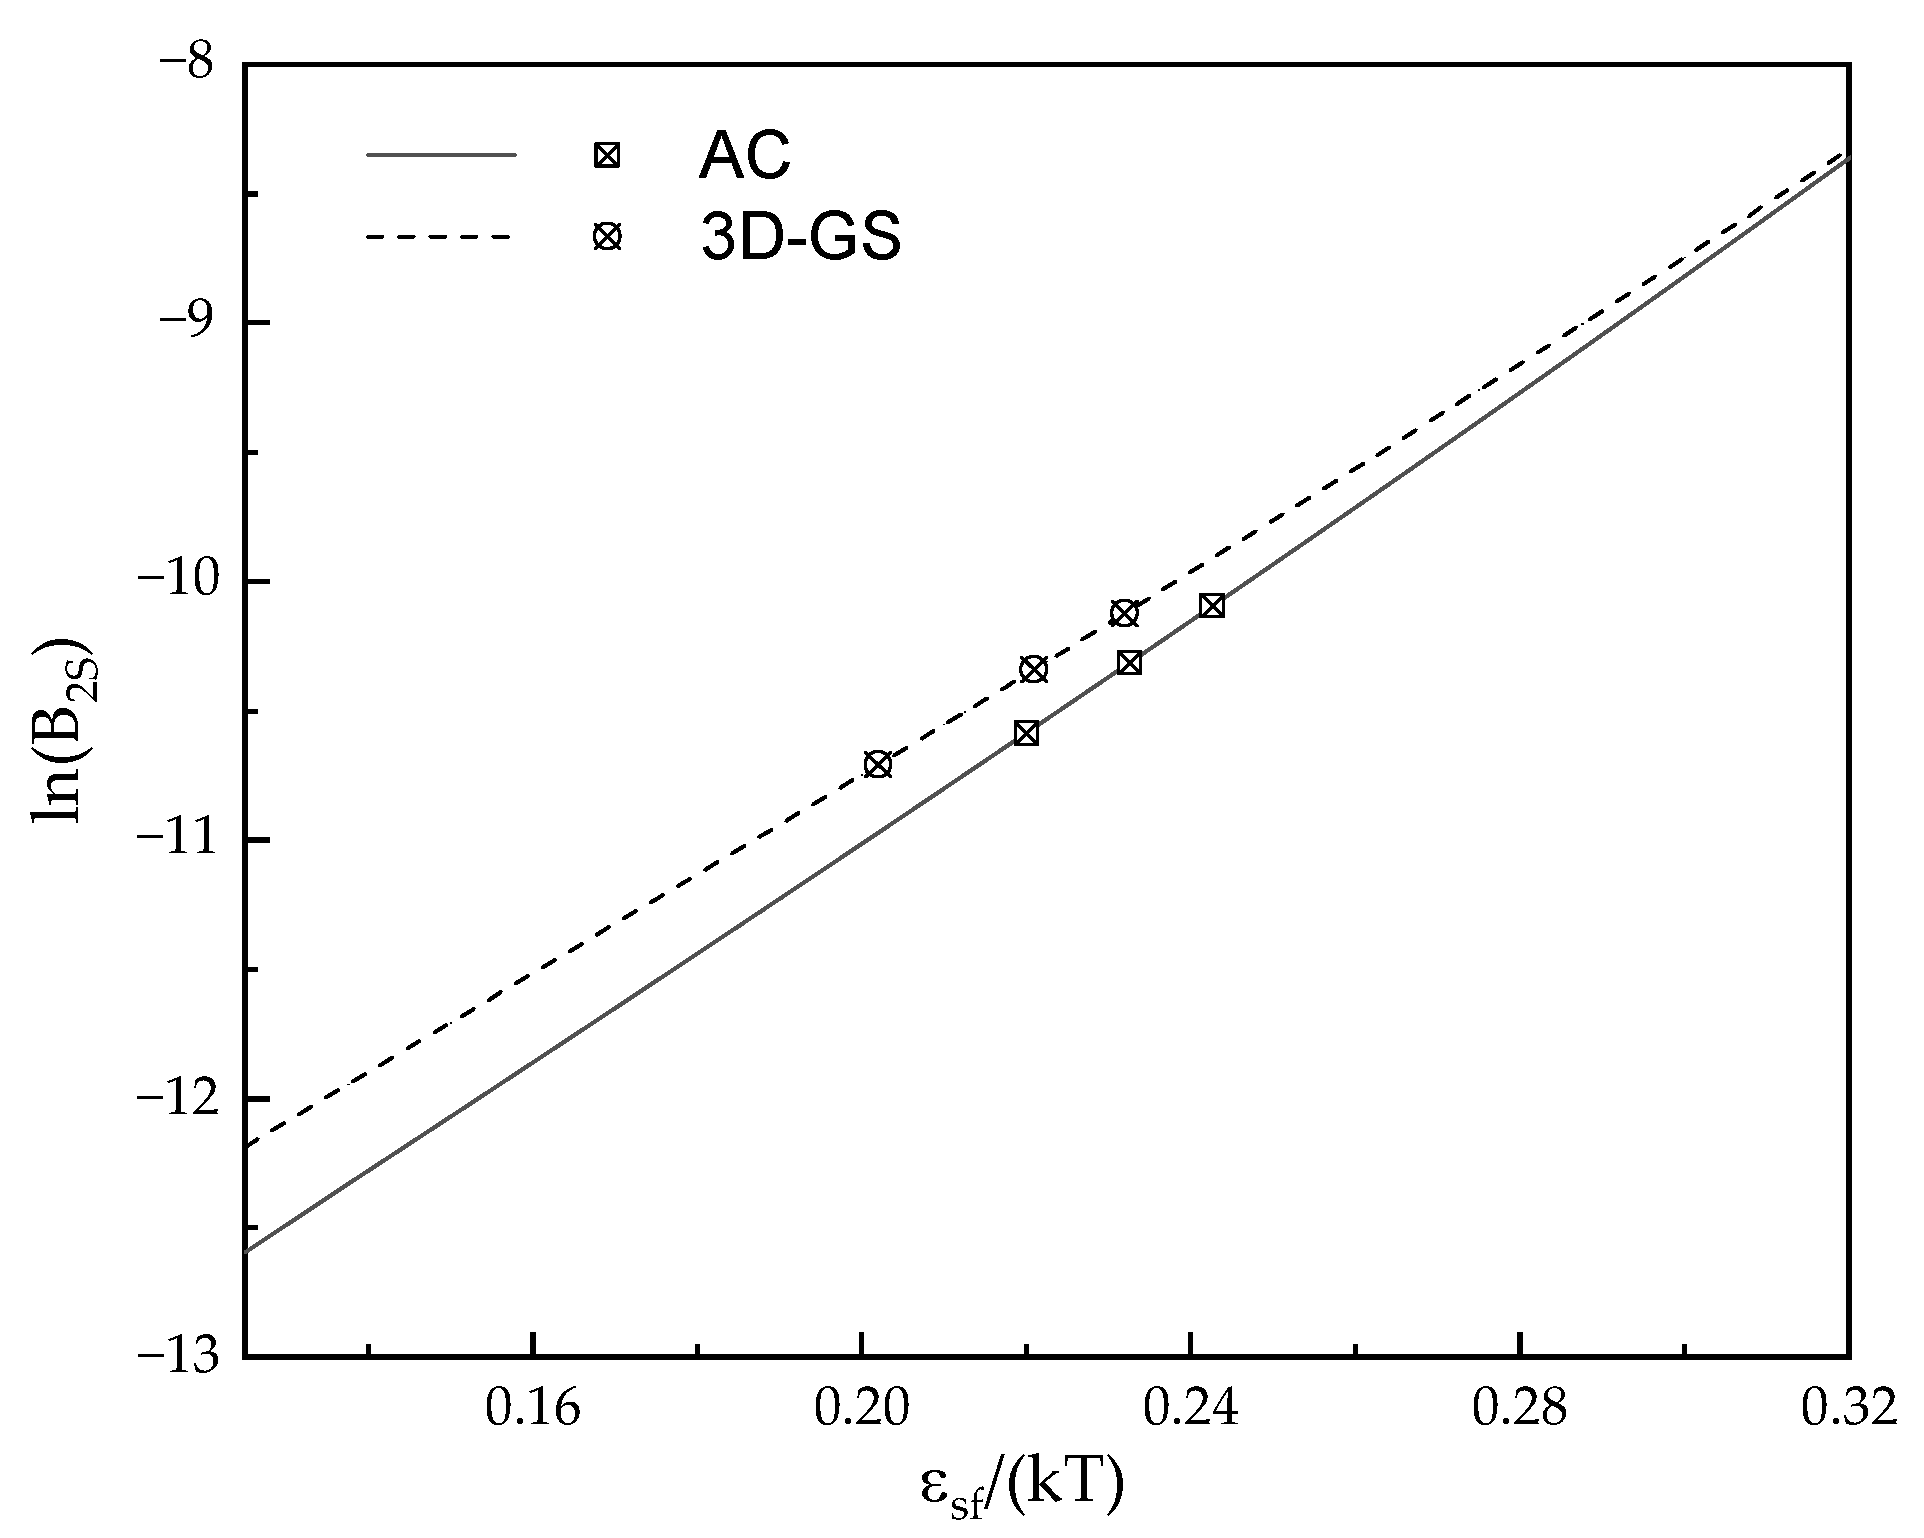
The variation in  ε s f  has a function relationship between  ε s f k T  with  B 2 S  as shown in Figure 7.
As shown in Figure 7 ln ( B 2 S )  and  ε s f  have a satisfactory linear relationship. Then, the adsorbate–adsorbent well depth potential  ε s f  could easily be determined by linear interpolation via linear plot [54]; the results are listed in Table 4.
As listed in Table 4, the well depth potential  ε s f / k  is around 62.11–68.67 K, which is close to that of using the Lorentz–Berthelot combining rules [55],  ε s f = ε s s ε f f  ( ε s f / k = 64.4   K ). This indicates that 2D-NLDFT is accurate in characterizing the PSD of carbon-based materials.
Meanwhile, the well depth potential  ε s f / k  between fluid and AC as well as between the 3D-GS is, respectively, about 68.14 K and 64.73 K at 298 K. This suggests that the interaction energy between methane molecules and the AC is likely stronger than that between 3D-GS. This may be due to the fact that activated carbon has more micropores and provides more adsorption sites at very low pressure. AC has a greater number of methane adsorption activation sites compared to 3D-GS, resulting in a higher well depth potential  ε s f / k  for AC at zero surface coverage. Another significant factor contributing to higher adsorption energy is the smaller mean pore width of AC compared to 3D-GS, as indicated in Table 2.
Meanwhile, the potential well  ε s f / k  between methane and carbon-based materials decreases as the temperature increases. This indicates that the capacity of methane uptake is enhanced at lower temperatures, which is consistent with the measurements of adsorption isotherms as shown in Figure 5.
However, 3D-GS will show a stronger adsorption capacity for methane with the increase in equilibrium pressure. The isosteric heat of adsorption at 0–100 kPa was determined by the Clausius–Clapeyron equation:
q s t = R d ln P d 1 T n
As shown in Figure 8, the isosteric heat of methane adsorption on AC is approximately 17.9–19.93 kJ·mol−1, while that of 3D-GS is around 19.3–23.23 kJ·mol−1. According to Figure 8, the change trend in adsorption heat  q s t  with the adsorption uptake also suggests the adsorption of methane on the carbon materials with a heterogeneous energy surface, wherein  q s t  decreases with the increase in adsorption uptake. At higher pressure, the energy heterogeneity on the surface of 3D-GS is stronger than that on the AC surface. This may be due to the fact that the main component of AC is carbon atoms, then the adsorbent surface is uniform. Meanwhile, the carbon atom content of 3D-GS accounts for about two-thirds and the oxygen content accounts for 32.24%, as listed in Table 1, indicating that it has a large number of functional groups, enhancing the energy heterogeneous of the surface.

3.3. Adsorption Equilibrium at High Pressure

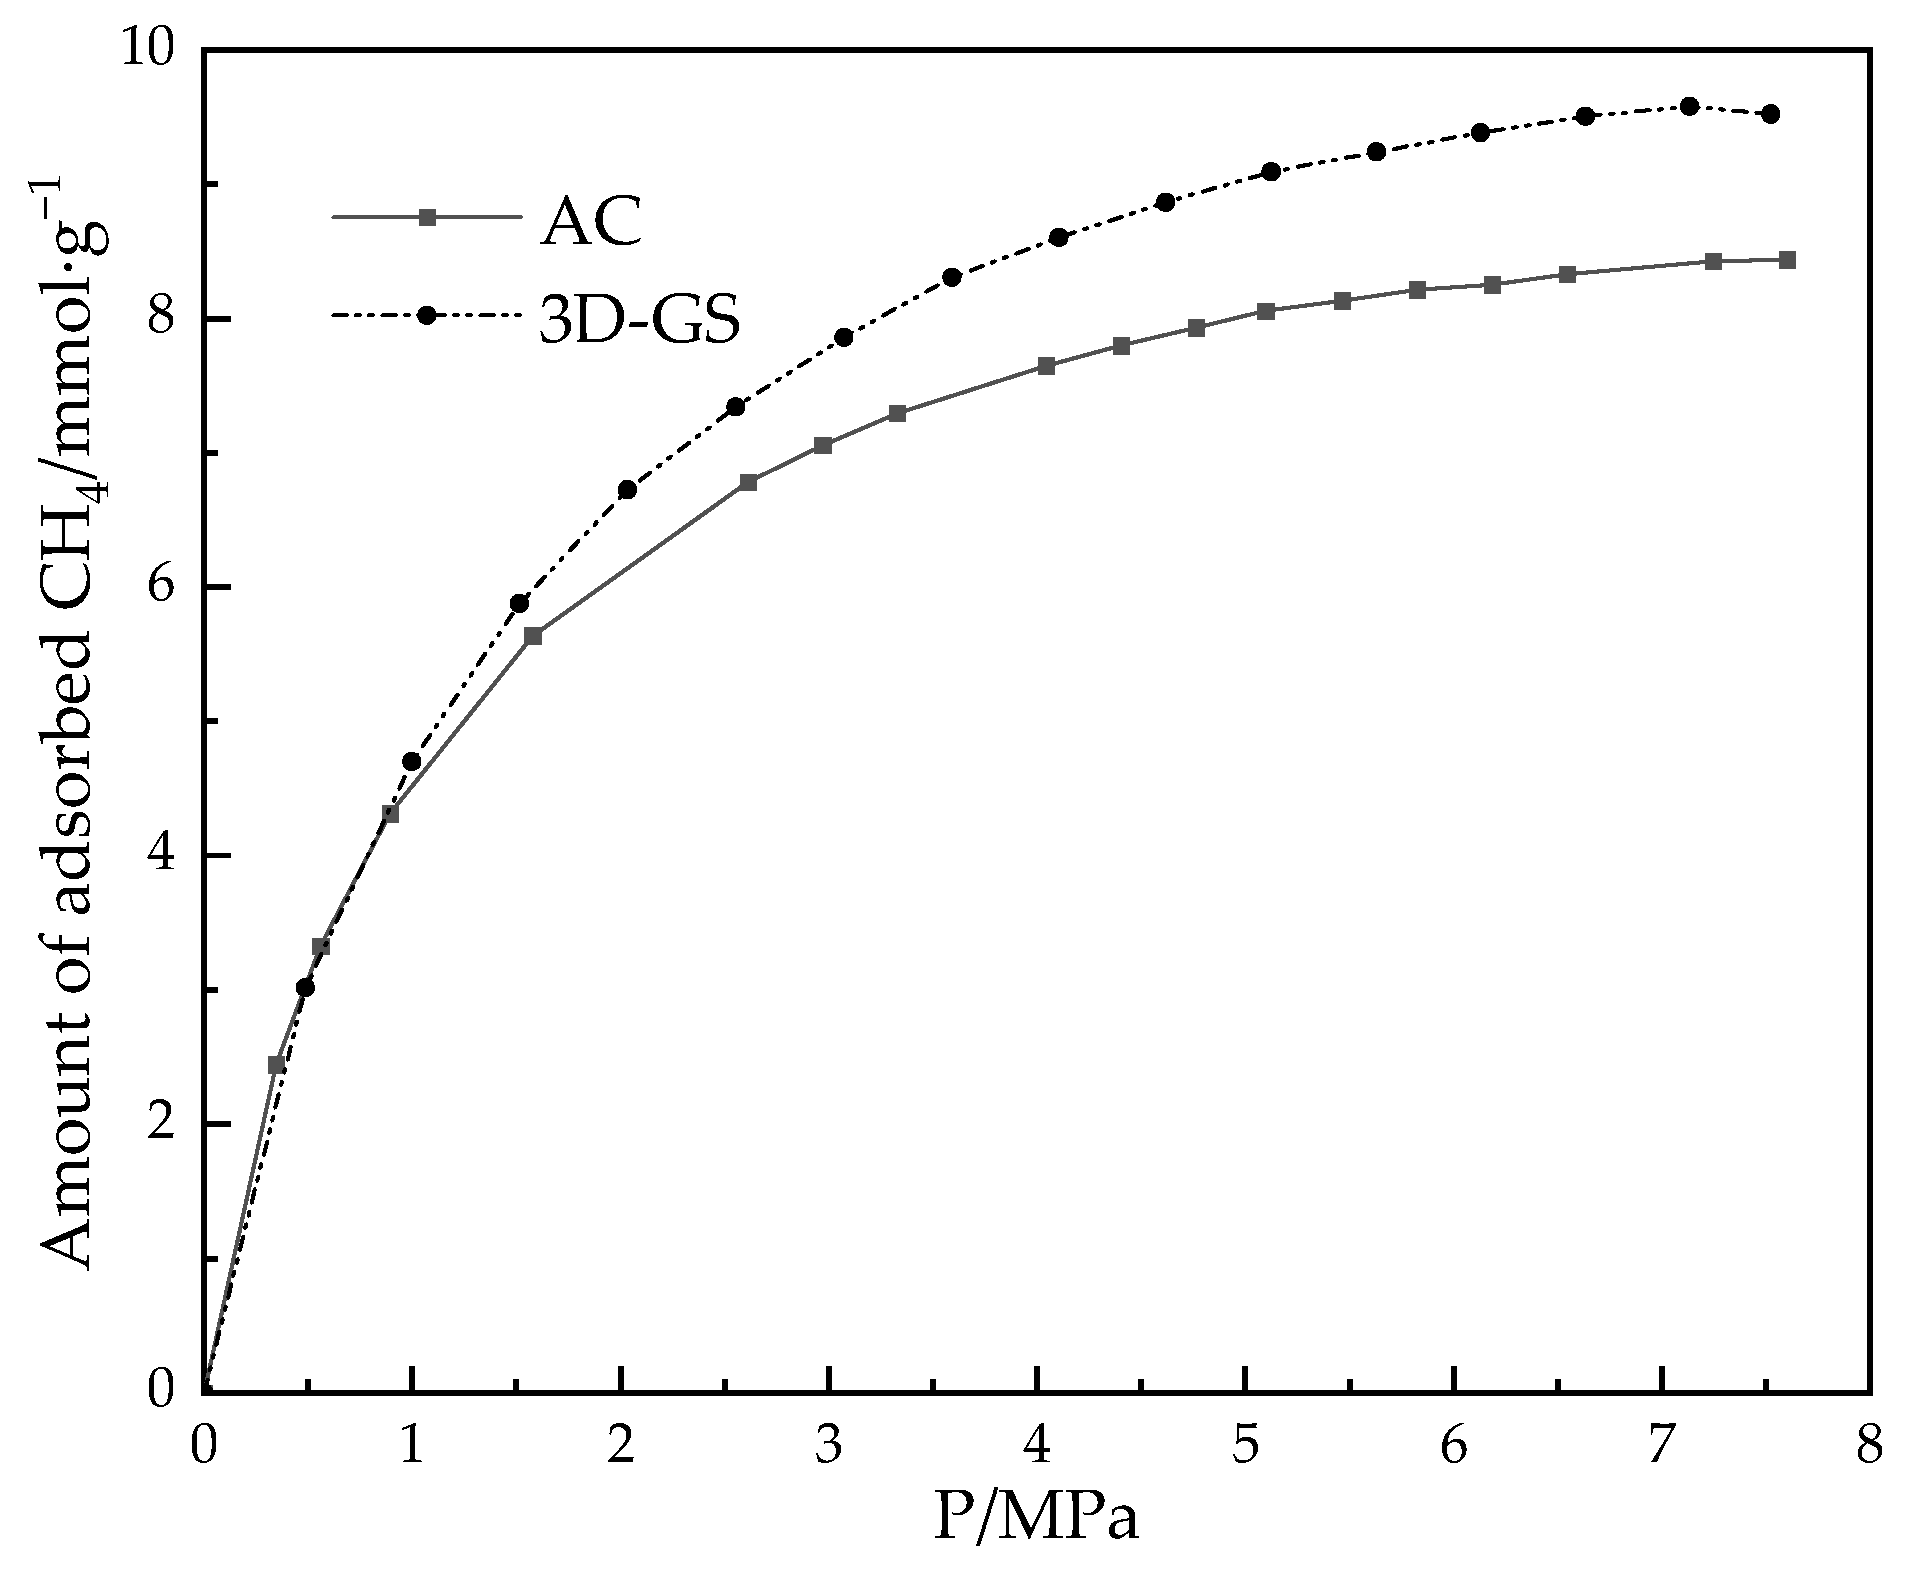
According to DOE storage requirements for ang commercial applications, the storage temperature is room temperature and the storage pressure is 35–80 bar [27]. The experimental data measured by PCTPro E & E were set as the test condition with high pressure 0–8 MPa and 298 K, and the results are shown in Figure 9.
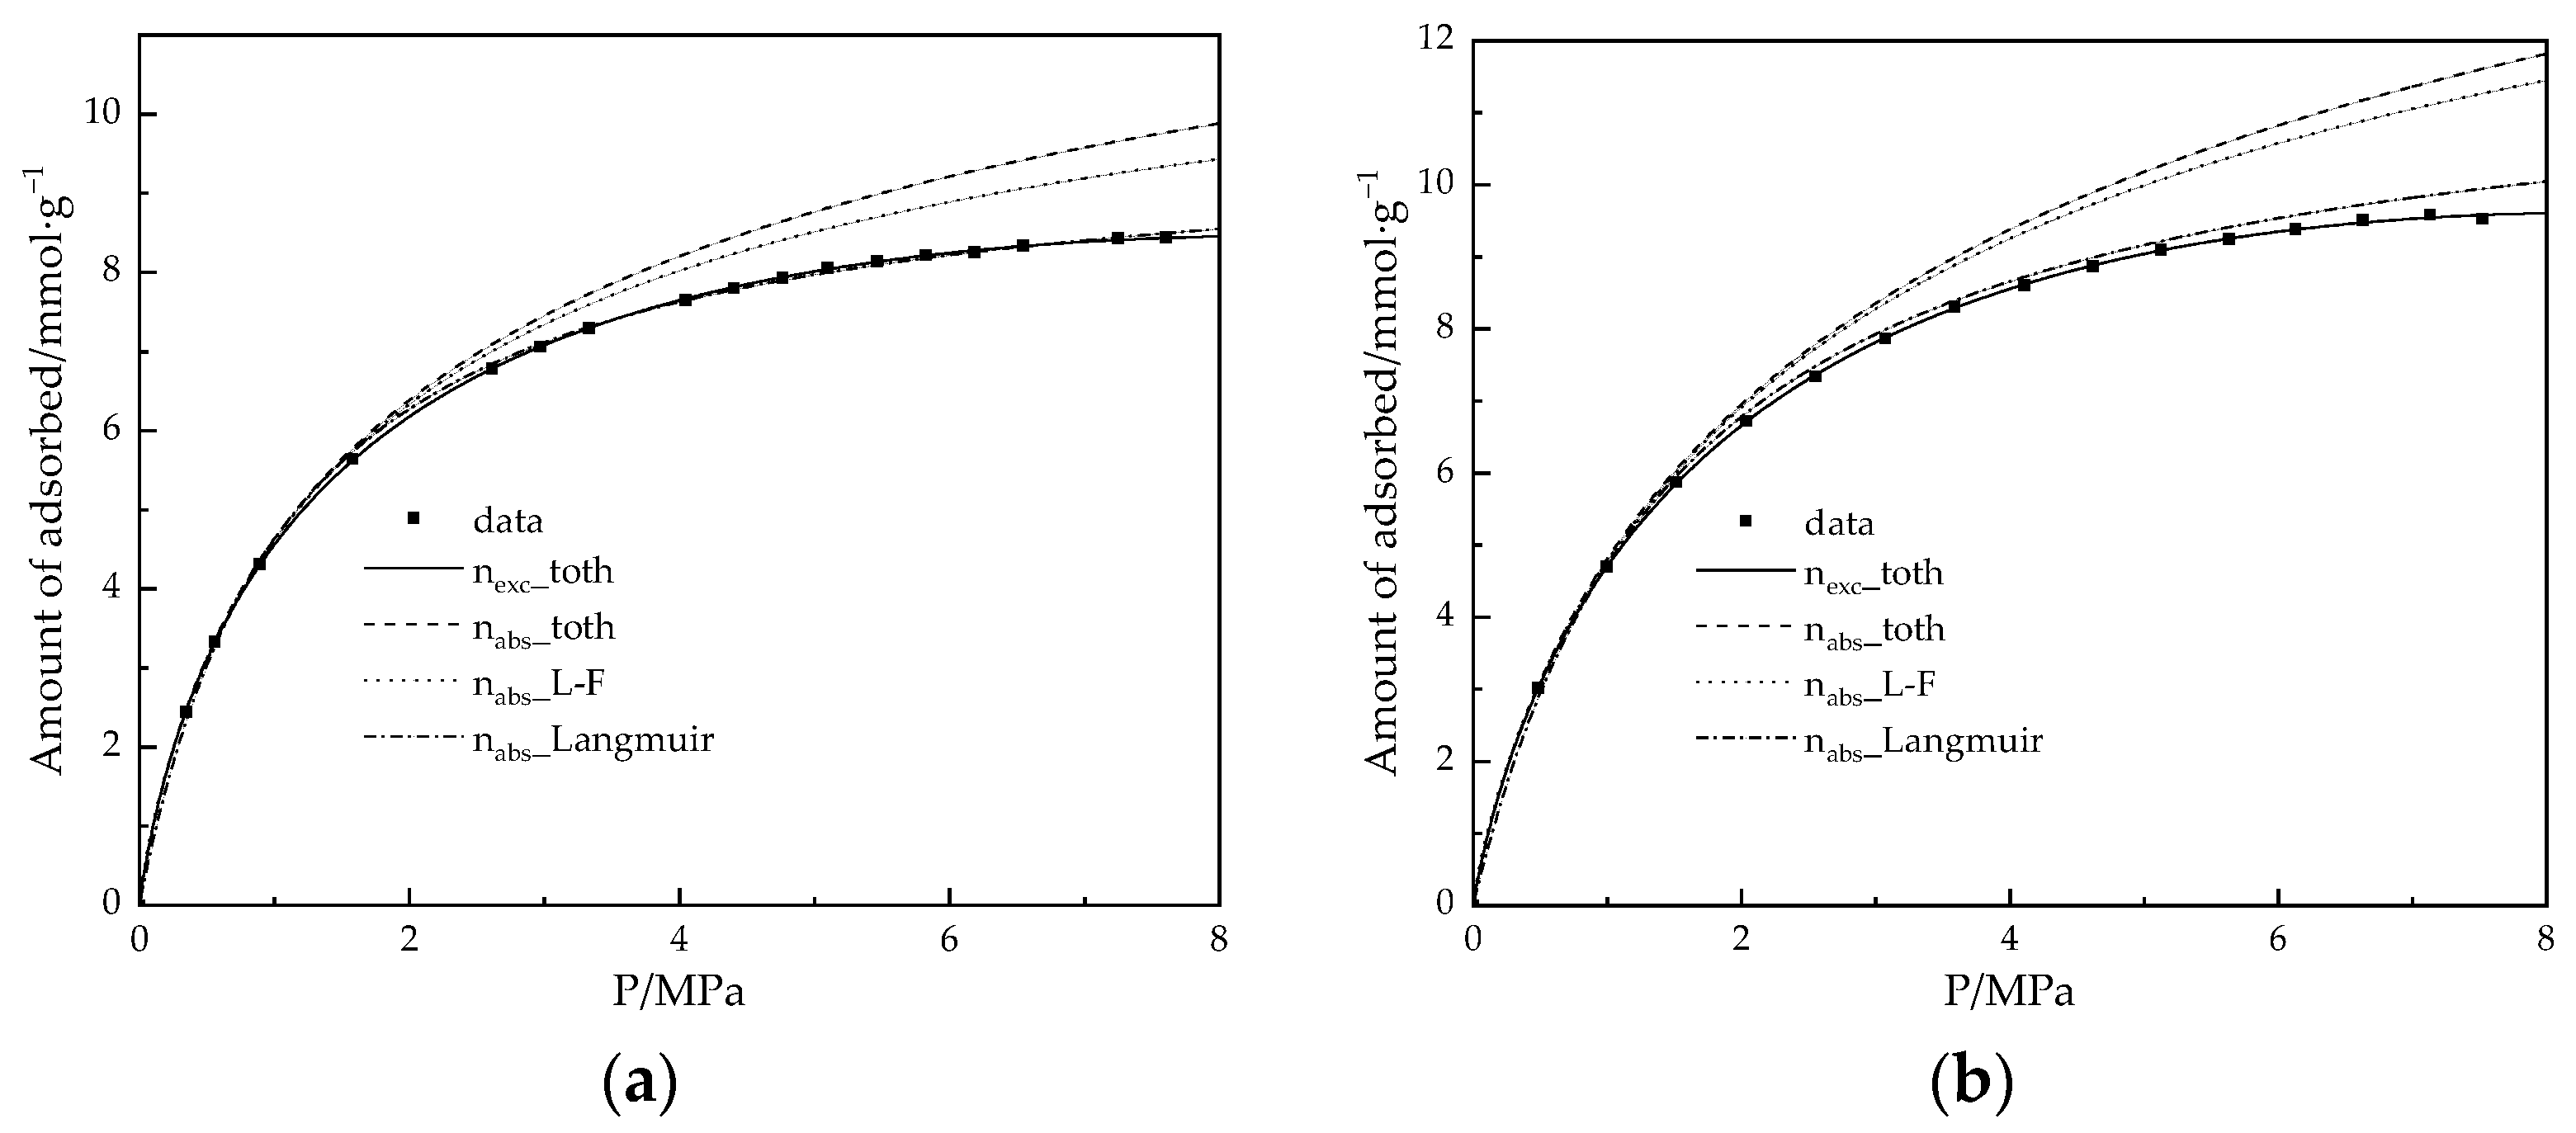
Considering that the absolute adsorption capacity must be determined in engineering applications, the static volumetric measurement determines the excess adsorption capacity. Therefore, we selected the Langmuir, L-F and Toth equations for monolayer adsorption, determined the absolute adsorption capacity from the experimental data, and determined the appropriate model from their accuracy.
n e x c  can be determined by the Langmuir, L-F and Toth equations [56], which are:
n e x c = n 0 b f 1 + b f 1 ρ b u l k ρ a
n e x c = n 0 b f t 1 + b f t 1 ρ b u l k ρ a
n e x c = n 0 b f 1 + b f t 1 t 1 ρ b u l k ρ a
where  n 0  is the saturation adsorption capacity,  ρ a  is the density of adsorbed phase,  f  is the bulk gas fugacity, and  b  and  t  parameters that can be nonlinearly determined by fitting the experimental data via Equations (11)–(13).
The accuracy of fitting was evaluated by the mean deviation δ:
δ = 1 N i N n e x c i n c a l i n e x c i × 100 %
The results are shown in Table 5 and Figure 10.
As shown in Table 5, the δ of the Toth equation is the smallest of the three equations, which verifies the accuracy of the fitting equation. The values of parameter  t  determined by L-F and the Toth equation for AC and 3D-GS are similar. This shows that the structural parameters of the two materials are similar because they are both carbon materials. The adsorption of methane on the carbon-based materials at supercritical temperature is similar to that of compressed gas. After calculating the absolute adsorption capacity and determining the density of the adsorption phase of methane, it is found that the adsorption phase density of methane on the test sample is smaller than that of liquid methane using the Toth equation. This indicates that methane molecules gather in a state similar to compressed gas. However, the parameters of  ρ a  determined by Langmuir and L-F equations may be larger than 26.5 mol/L of the liquid methane. The results also verify the rationality of the Toth equation. Therefore, when selecting the adsorption model, we should consider whether the assumptions made by the model on the adsorption phase of supercritical methane are reasonable.
As shown in Figure 10, the methane storage capacities of the carbon-based materials AC and 3D-GS are 7.86 mmol·g−1 and 8.9 mmol·g−1 at 298 K and 35 bar. This indicates that under high-pressure adsorption conditions, the SBET is still the main factor determining the adsorption amount.

4. Conclusions

This study comparatively investigated the behavior of methane adsorption on carbon-based materials, with the aim of developing a storage medium for adsorbed natural gas (ANG), and the conclusions reached can be summarized as follows:
(1)
The 3D-GS is a more promising storage medium for ANG than AC in terms of the specific surface area and pore volume. The limit isosteric heat of methane adsorption on the AC and 3D-GS is about 19.93 kJ/mol and 23.23 kJ/mol, respectively. The methane storage capacities of both carbon-based materials AC and 3D-GS are, respectively, 7.86 mmol·g−1 and 8.9 mmol·g−1 at 298 K and 35 bar. Meanwhile, the SBET of 3D-GS is around 2045 m2·g−1, which is larger than that of AC (1629 m2·g−1). It can therefore be concluded that under high pressure, the SBET is still the main factor determining the adsorption amount.
(2)
The potential well between methane molecules and the AC is larger than that in the 3D-GS. Considering the heterogeneous surface of carbon-based materials, the framework to determine the potential well between adsorbate–adsorbent is built by PSD determined by 2D-NLDFT. Using Boltzmann distribution approximation for the fluid density on the heterogeneous surface, the adsorption potential well between methane molecules and the AC and 3D-GS was shown to be, respectively, about 68.14 K and 64.73 K. Both values are close to that of using the Lorentz–Berthelot combining rules (64.4 K); this indicates that 2D-NLDFT is accurate in characterizing the PSD of carbon-based materials. Meanwhile, the potential well between methane and carbon-based materials decreases as the temperature increases. This indicates that the capacity of methane uptake is enhanced at lower temperatures.
(3)
The Toth equation is the most suitable model for predicting methane adsorption on carbon-based materials than that of the Langmuir and L-F equation. After determining the values of the parameters by nonlinearly fitting on the experimental data covering the pressure range from 0 to 8 MPa at 298 K, the Toth equation can predict the experimental data of hydrogen adsorption on the carbon-based materials AC and 3D-GS with mean relative deviations of less than 0.25% and can determine that the density of the adsorbed phase is less than 26.5 mol/L of the liquid methane. This indicates that methane molecules gather in a state similar to compressed gas. The results also verify the rationality of the Toth equation.

Supplementary Materials

The following supporting information can be downloaded at: https://www.mdpi.com/article/10.3390/pr11082487/s1, Figure S1: BET surface Area plot for AC; Figure S2: BET surface Area plot for 3D-GS; Table S1: The parameters of BET specific surface area for AC; Table S2: The parameters of BET specific surface area for 3D-GS ([57]).

Author Contributions

Conceptualization, Z.Z. and M.Z.; methodology, Z.Z.; software, Z.Z.; validation, Z.Z. and M.Z.; formal analysis, Z.Z.; investigation, Z.Z.; resources, Z.Z.; data curation, Z.Z.; writing—original draft preparation, Z.Z. and M.Z.; writing—review and editing, Z.Z.; visualization, Z.Z.; supervision, Z.Z.; project administration, Z.Z.; funding acquisition, Z.Z. All authors have read and agreed to the published version of the manuscript.

Funding

This research was funded by the National Natural Science Foundation of China (22108092).

Data Availability Statement

Data are available upon request.

Conflicts of Interest

The authors declare no conflict of interest.

Nomenclature

Symbols
B 2 S the second Virial constants (m3·g−1)
b parameter for Langmuir, L-F and Toth equations (mmol g−1 MPa−1)
d the distance of interlayer determined by Bragg’s law (nm)
f the bulk gas fugacity (MPa)
H the pore width for 10-4-3 potential (nm)
H P Henry’s law constant (mmol·g−1·kPa−1)
i Number of states, 1,2,3…
k Boltzmann constant (J·K−1)
Nsum
n the amount of adsorption (mmol·g−1)
P pressure (MPa)
q adsorption heat (kJ·mol−1)
R Constant for gas
T temperature (K)
V e x t external potential (J)
w pore width (nm)
z the distance from carbon atom at surface (nm)
Greek Symbols
Δ the association strength (nm)
ε energy well depth for L-J fluid and solid (J)
η the weighted packing fraction profile
θ degree (°)
ρ density (nm−3)
σ size well depth for L-J fluid and solid (nm)
Subscripts and superscripts
0saturation
aadsorbed phase
absabsolute
bulkbulk density of fluid
excexcess
fffluid–fluid
ss, sfsolid–solid, solid–fluid
Abbreviations
2D-NLDFT2D non-local density functional theory
EDSenergy dispersive spectrum
PSDpore size distribution
SEMscanning electron microscopy
XRDX-ray diffraction

References

  1. Park, J.E.; Lee, G.B.; Hwang, S.Y.; Kim, J.H.; Hong, B.U.; Kim, H.; Kim, S. The Effects of Methane Storage Capacity Using Upgraded Activated Carbon by KOH. Appl. Sci. 2018, 8, 1596. [Google Scholar] [CrossRef]
  2. Shkolin, A.V.; Strizhenov, E.M.; Chugaev, S.S.; Men’shchikov, I.E.; Gaidamavichute, V.V.; Grinchenko, A.E.; Zherdev, A.A. Natural Gas Storage Filled with Peat-Derived Carbon Adsorbent: Influence of Nonisothermal Effects and Ethane Impurities on the Storage Cycle. Nanomaterials 2022, 12, 4066. [Google Scholar] [CrossRef]
  3. Men’shchikov, I.E.; Shkolin, A.V.; Strizhenov, E.M.; Khozina, E.V.; Chugaev, S.S.; Shiryaev, A.A.; Fomkin, A.A.; Zherdev, A.A. Thermodynamic Behaviors of Adsorbed Methane Storage Systems Based on Nanoporous Carbon Adsorbents Prepared from Coconut Shells. Nanomaterials 2020, 10, 2243. [Google Scholar] [CrossRef]
  4. Memetova, A.; Tyagi, I.; Karri, R.R.; Kumar, V.; Tyagi, K.; Suhas; Memetov, N.; Zelenin, A.; Pasko, T.; Gerasimova, A.; et al. Porous carbon-based material as a sustainable alternative for the storage of natural gas (methane) and biogas (biomethane): A review. Chem. Eng. J. 2022, 446, 137373. [Google Scholar] [CrossRef]
  5. Ruiz Zardoya, A.; Oregui Bengoetxea, I.; Lopez Martinez, A.; Loroño Lucena, I.; Orosa, J.A. Methodological Design Optimization of a Marine LNG Internal Combustion Gas Engine to Burn Alternative Fuels. J. Mar. Sci. Eng. 2023, 11, 1194. [Google Scholar] [CrossRef]
  6. Sapag, K.; Vallone, A.; Blanco, A.G.; Solar, C. Adsorption of methane in porous materials as the basis for the storage of natural gas. In Natural Gas; Intech Open: London, UK, 2010; Chapter 10; pp. 205–244. ISBN 978-953-307-112-1. [Google Scholar]
  7. Braslaw, J.; Nasea, J.J.; Golovoy, A. Low pressure methane storage system for vehicles preliminary concept evaluation. In Proceedings of the 4th International Conference on Alternative Energy Sources, Miami Beach, FL, USA, 14–16 December 1981; Veziroglu, T.N., Ed.; Ann Arbor Science Publishers: Ann Arbor, MI, USA, 1982. [Google Scholar]
  8. Lin, Y.Y.; Nassau, C.J. The MOVE projects and importance of engineering design. In Proceedings of the 10th International Conference on Applied Mechanisms and Machine Science, China (CCAMMS), Sanya, China, 29 November–1 December 2013. [Google Scholar]
  9. Rodríguez-Reinoso, F.; Silvestre-Albero, J. Methane Storage on Nanoporous Carbons, Nanoporous Materials for Gas Storage; Springer: Berlin/Heidelberg, Germany, 2019; pp. 209–226. [Google Scholar]
  10. Ursueguía, D.; Díaz, E.; Ordóñez, S. Metal-Organic Frameworks (MOFs) as methane adsorbents: From storage to diluted coal mining streams concentration. Sci. Total Environ. 2021, 790, 148211. [Google Scholar] [CrossRef]
  11. Li, B.; Wen, H.M.; Zhou, W.; Xu, J.Q.; Chen, B. Porous Metal-Organic Frameworks: Promising Materials for Methane Storage. Chem 2016, 1, 557–580. [Google Scholar] [CrossRef]
  12. Mahmoud, E.; Ali, L.; El Sayah, A.; Alkhatib, S.A.; Abdulsalam, H.; Juma, M.; Al-Muhtaseb, A.H. Implementing Metal-Organic Frameworks for Natural Gas Storage. Crystals 2019, 9, 406. [Google Scholar] [CrossRef]
  13. Mirzaei, S.; Ahmadpour, A.; Shao, Z.; Arami-Niya, A. Rational design of carbon-based materials for purification and storage of energy carrier gases of methane and hydrogen. J. Energy Storage 2022, 56, 105967. [Google Scholar] [CrossRef]
  14. Zhu, Z.W.; Zheng, Q.R.; Wang, Z.H.; Tang, Z.; Chen, W. Hydrogen adsorption on graphene sheets and nonporous graphitized thermal carbon black at low surface coverage. Int. J. Hydrog. Energy 2017, 42, 18465–18472. [Google Scholar] [CrossRef]
  15. Zhu, Z.W.; Zheng, Q.R. Methane adsorption on the graphene sheets, activated carbon and carbon black. Appl. Therm. Eng. 2016, 108, 605–613. [Google Scholar] [CrossRef]
  16. Ertas, A.; Boyce, C.T.R.; Gulbulak, U. Experimental Measurement of Bulk Thermal Conductivity of Activated Carbon with Adsorbed Natural Gas for ANG Energy Storage Tank Design Application. Energies 2020, 13, 682. [Google Scholar] [CrossRef]
  17. Peng, X.; Ji, H. Control mechanism of small organic molecules on methane adsorption capacity of coal. Fuel 2023, 331, 125904. [Google Scholar] [CrossRef]
  18. Wang, W.; Liu, Z.; Zhang, M.; Yang, H. Experimental Study on Fractal Characteristics of Adsorption Pore Structure of Coal. Processes 2023, 11, 78. [Google Scholar] [CrossRef]
  19. Yick, T.; Gangoli, V.S.; Orbaek White, A. Comparing Ultralong Carbon Nanotube Growth from Methane over Mono- and Bi-Metallic Iron Chloride Catalysts. Nanomaterials 2023, 13, 2172. [Google Scholar] [CrossRef]
  20. Li, T.Y.; Wang, Y.S.; Zhang, M.Y.; Liu, B.-Y.; Zheng, Z.; Hao, G.-P.; Lu, A.-H. Carbon nanofibers with gas selective layer containing rich and accessible ultramicropores for methane/nitrogen separation. Chem. Eng. J. 2023, 462, 142118. [Google Scholar] [CrossRef]
  21. Li, S.; Yan, R.; Cai, M.; Jiang, W.; Zhang, M.; Li, X. Enhanced antibiotic degradation performance of Cd0.5Zn0.5S/Bi2MoO6 S-scheme photocatalyst by carbon dot modification. J. Mater. Sci. Technol. 2023, 164, 59–67. [Google Scholar] [CrossRef]
  22. Liu, R.; Hou, L.; Yue, G.; Li, H.; Zhang, J.; Liu, J.; Miao, B.; Wang, N.; Bai, J.; Cui, Z.; et al. Progress of Fabrication and Applications of Electrospun Hierarchically Porous Nanofibers. Adv. Fiber Mater. 2022, 4, 604–630. [Google Scholar] [CrossRef]
  23. Li, S.; Cai, M.; Wang, C.; Liu, Y. Ta3N5/CdS Core-Shell S-scheme Heterojunction Nanofibers for Efficient Photocatalytic Removal of Antibiotic Tetracycline and Cr(VI): Performance and Mechanism Insights. Adv. Fiber Mater. 2023, 5, 994–1007. [Google Scholar] [CrossRef]
  24. Engel, L.J.; Turko, J.W. Gaseous Hydrocarbon Fuel Storage System and Power Plant for Vehicles and Associated Refueling Apparatus. U.S. Patent 4,522,159, 13 April 1983. [Google Scholar]
  25. Sevilla, M.; Mokaya, R. Energy storage applications of activated carbons: Supercapacitors and hydrogen storage. Energy Environ. Sci. 2014, 7, 1250. [Google Scholar] [CrossRef]
  26. Hu, Z.; Srinivasan, M.P.; Ni, Y. Novel activation process for preparing highly microporous and mesoporous activated carbons. Carbon 2001, 39, 877–886. [Google Scholar] [CrossRef]
  27. ARPA-E. List of MOVE Projects Funded ARPA-E MOVE. 2012. Available online: http://arpa-e.energy.gov/?q=arpa-e-programs/move (accessed on 20 June 2023).
  28. Lozano-Castelló, D.; Cazorla-Amorós, D.; Linares-Solano, A.; Quinn, D.F. Influence of pore size distribution on methane storage at relatively low pressure: Preparation of activated carbon with optimum pore size. Carbon 2002, 40, 989–1002. [Google Scholar] [CrossRef]
  29. Altwala, A.; Mokaya, R. Modulating the porosity of activated carbons via pre-mixed precursors for simultaneously enhanced gravimetric and volumetric methane uptake. J. Mater. Chem. A 2022, 10, 13744–13757. [Google Scholar] [CrossRef]
  30. Gadipelli, S.; Guo, Z.X. Graphene-based materials: Synthesis and gas sorption, storage and separation. Prog. Mater. Sci. 2015, 69, 1–60. [Google Scholar] [CrossRef]
  31. Baykasoglu, C.; Mert, H.; Deniz, C.U. Grand canonical Monte Carlo simulations of methane adsorption in fullerene pillared graphene nanocomposites. J. Mol. Graph. Model. 2021, 106, 107909. [Google Scholar] [CrossRef]
  32. Roy, S.; Ghosh, B.D.; Goh, K.L.; Ahn, H.J.; Chang, Y.W. Super expanded freestanding 3D graphene foam as a versatile platform for CO2 capture and hydrogenation. Chem. Eng. J. 2023, 466, 143326. [Google Scholar] [CrossRef]
  33. Umar, E.; Ikram, M.; Haider, J.; Nabgan, W.; Imran, M.; Nazir, G. 3D graphene-based material: Overview, perspective, advancement, energy storage, biomedical engineering and environmental applications a bibliometric analysis. J. Environ. Chem. Eng. 2023, 11, 110339. [Google Scholar] [CrossRef]
  34. Wibawa, P.J.; Nur, M.; Asy’ari, M.; Nur, H. SEM, XRD and FTIR analyses of both ultrasonic and heat generated activated carbon black microstructures. Heliyon 2020, 6, 03546. [Google Scholar] [CrossRef]
  35. Karakehya, N. Effects of one-step and two-step KOH activation method on the properties and supercapacitor performance of highly porous activated carbons prepared from Lycopodium clavatum spores. Diam. Relat. Mater. 2023, 135, 109873. [Google Scholar] [CrossRef]
  36. Lazzarini, A.; Piovano, A.; Pellegrini, R.; Agostini, G.; Rudic, S.; Lamberti, C.; Groppo, E. Graphitization of Activated Carbons: A Molecular-level Investigation by INS, DRIFT, XRD and Raman Techniques. Phys. Procedia 2016, 85, 20–26. [Google Scholar] [CrossRef]
  37. Basheer, A.O.; Odeh, A.A.; Al-Douri, Y. Structural analysis and characterization of date palm fiber-based low-cost carbon nanotubes and nanostructured powder activated carbon. Heliyon 2023, 9, 18811. [Google Scholar] [CrossRef]
  38. Zhu, Z.; Zhang, M. Water Vapor Adsorption on Desiccant Materials for Rotary Desiccant Air Conditioning Systems. Processes 2023, 11, 2166. [Google Scholar] [CrossRef]
  39. Zhu, Z.W.; Zheng, Q.R. Investigation of cryo-adsorption hydrogen storage capacity of rapidly synthesized MOF-5 by mechanochemical method. Int. J. Hydrog. Energy 2023, 48, 5166. [Google Scholar] [CrossRef]
  40. Donohue, M.D.; Aranovich, G.L. Classification of Gibbs adsorption isotherms. Adv. Colloid Interface Sci. 1998, 76, 137. [Google Scholar] [CrossRef]
  41. Landers, J.; Gor, G.Y.; Neimark, A.V. Density functional theory methods for characterization of porous materials. Colloids Surf. A Physicochem. Eng. Asp. 2013, 437, 3–32. [Google Scholar] [CrossRef]
  42. Ustinov, E.A.; Do, D.D.; Fenelonov, V.B. Pore size distribution analysis of activated Carbopacks: Application of density functional theory using nongraphitized Carbopack black as a reference system. Carbon 2006, 44, 653–663. [Google Scholar] [CrossRef]
  43. Neimark, A.V.; Lin, Y.; Ravikovitch, P.I. Quenched solid density functional theory and pore size analysis of micro-mesoporous carbons. Carbon 2009, 47, 1617–1628. [Google Scholar] [CrossRef]
  44. Lucena, S.M.P.; Oliveira, J.C.A.; Gonçalves, D.V.; Silvino, P.F.G.; Dantas, S.; Neimark, A.V. Pore size analysis of carbons with heterogeneous kernels from reactive molecular dynamics model and quenched solid density functional theory. Carbon 2021, 183, 672–684. [Google Scholar] [CrossRef]
  45. Miyasaka, K.; Neimark, A.V.; Terasaki, O. Density Functional Theory of in Situ Synchrotron Powder X-ray Diffraction on Mesoporous Crystals: Argon Adsorption on MCM-41. J. Phys. Chem. C 2009, 113, 791–794. [Google Scholar] [CrossRef]
  46. Jagiello, J.; Olivier, J.P. 2D-NLDFT adsorption models for carbon slit-shaped pores with surface energetical heterogeneity and geometrical corrugation. Carbon 2013, 55, 70–80. [Google Scholar] [CrossRef]
  47. Jagiello, J.; Jaroniec, M. 2D-NLDFT adsorption models for porous oxides with corrugated cylindrical pores. J. Colloid Interface Sci. 2018, 532, 588–597. [Google Scholar] [CrossRef]
  48. Jagiello, J.; Kenvin, J. Consistency of carbon nanopore characteristics derived from adsorption of simple gases and 2D-NLDFT models. Advantages of using adsorption isotherms of oxygen (O2) at 77K. J. Colloid Interface Sci. 2019, 542, 151–158. [Google Scholar] [CrossRef]
  49. Linstrom, P.J.; Mallard, W.G. (Eds.) NIST Chemistry WebBook; NIST Standard Reference Database Number 69; National Institute of Standards and Technology: Gaithersburg, MD, USA, 2022; p. 20899.
  50. Do, D.D.; Do, H.D.; Tran, K.N. Analysis of Adsorption of Gases and Vapors on Nonporous Graphitized Thermal Carbon Black. Langmuir 2003, 19, 5656. [Google Scholar] [CrossRef]
  51. Han, B.; Chakraborty, A.; Saha, B.B. Isosteric Heats and Entropy of Adsorption in Henry’s Law Region for Carbon and MOFs Structures for Energy Conversion Applications. Int. J. Heat Mass Transf. 2022, 182, 122000. [Google Scholar] [CrossRef]
  52. Daniel, D.W.; Gelb, L.D. Extension of the Steele 10-4-3 potential for adsorption calculations in cylindrical, spherical, and other pore geometries. J. Chem. Phys. 2011, 135, 84703. [Google Scholar]
  53. Clark, A. The Theory of Adsorption and Catalysis; Academic Press: New York, NY, USA, 1970. [Google Scholar]
  54. Bénard, P.; Chahine, R. Determination of the Adsorption Isotherms of Hydrogen on Activated Carbons above the Critical Temperature of the Adsorbate over Wide Temperature and Pressure Ranges. Langmuir 2001, 17, 1950–1955. [Google Scholar] [CrossRef]
  55. Duh, D.M.; Henderson, D.; Rowley, R.L. Some effects of deviations from the Lorentz-Berthelot combining rules for mixtures of Lennard-Jones fluids. Mol. Phys. 1997, 91, 1143–1147. [Google Scholar]
  56. Zheng, Q.R.; Ji, X.W.; Gao, S.; Wang, X.H. Adsorption equilibrium of hydrogen on graphene sheets and activated carbon. Cryogenics 2014, 61, 143–148. [Google Scholar] [CrossRef]
  57. Brunauer, S.; Emmett, P.H.; Teller, E. Adsorption of gases in multimolecular layers. J. Am. Chem. Soc. 1938, 60, 309–319. [Google Scholar] [CrossRef]
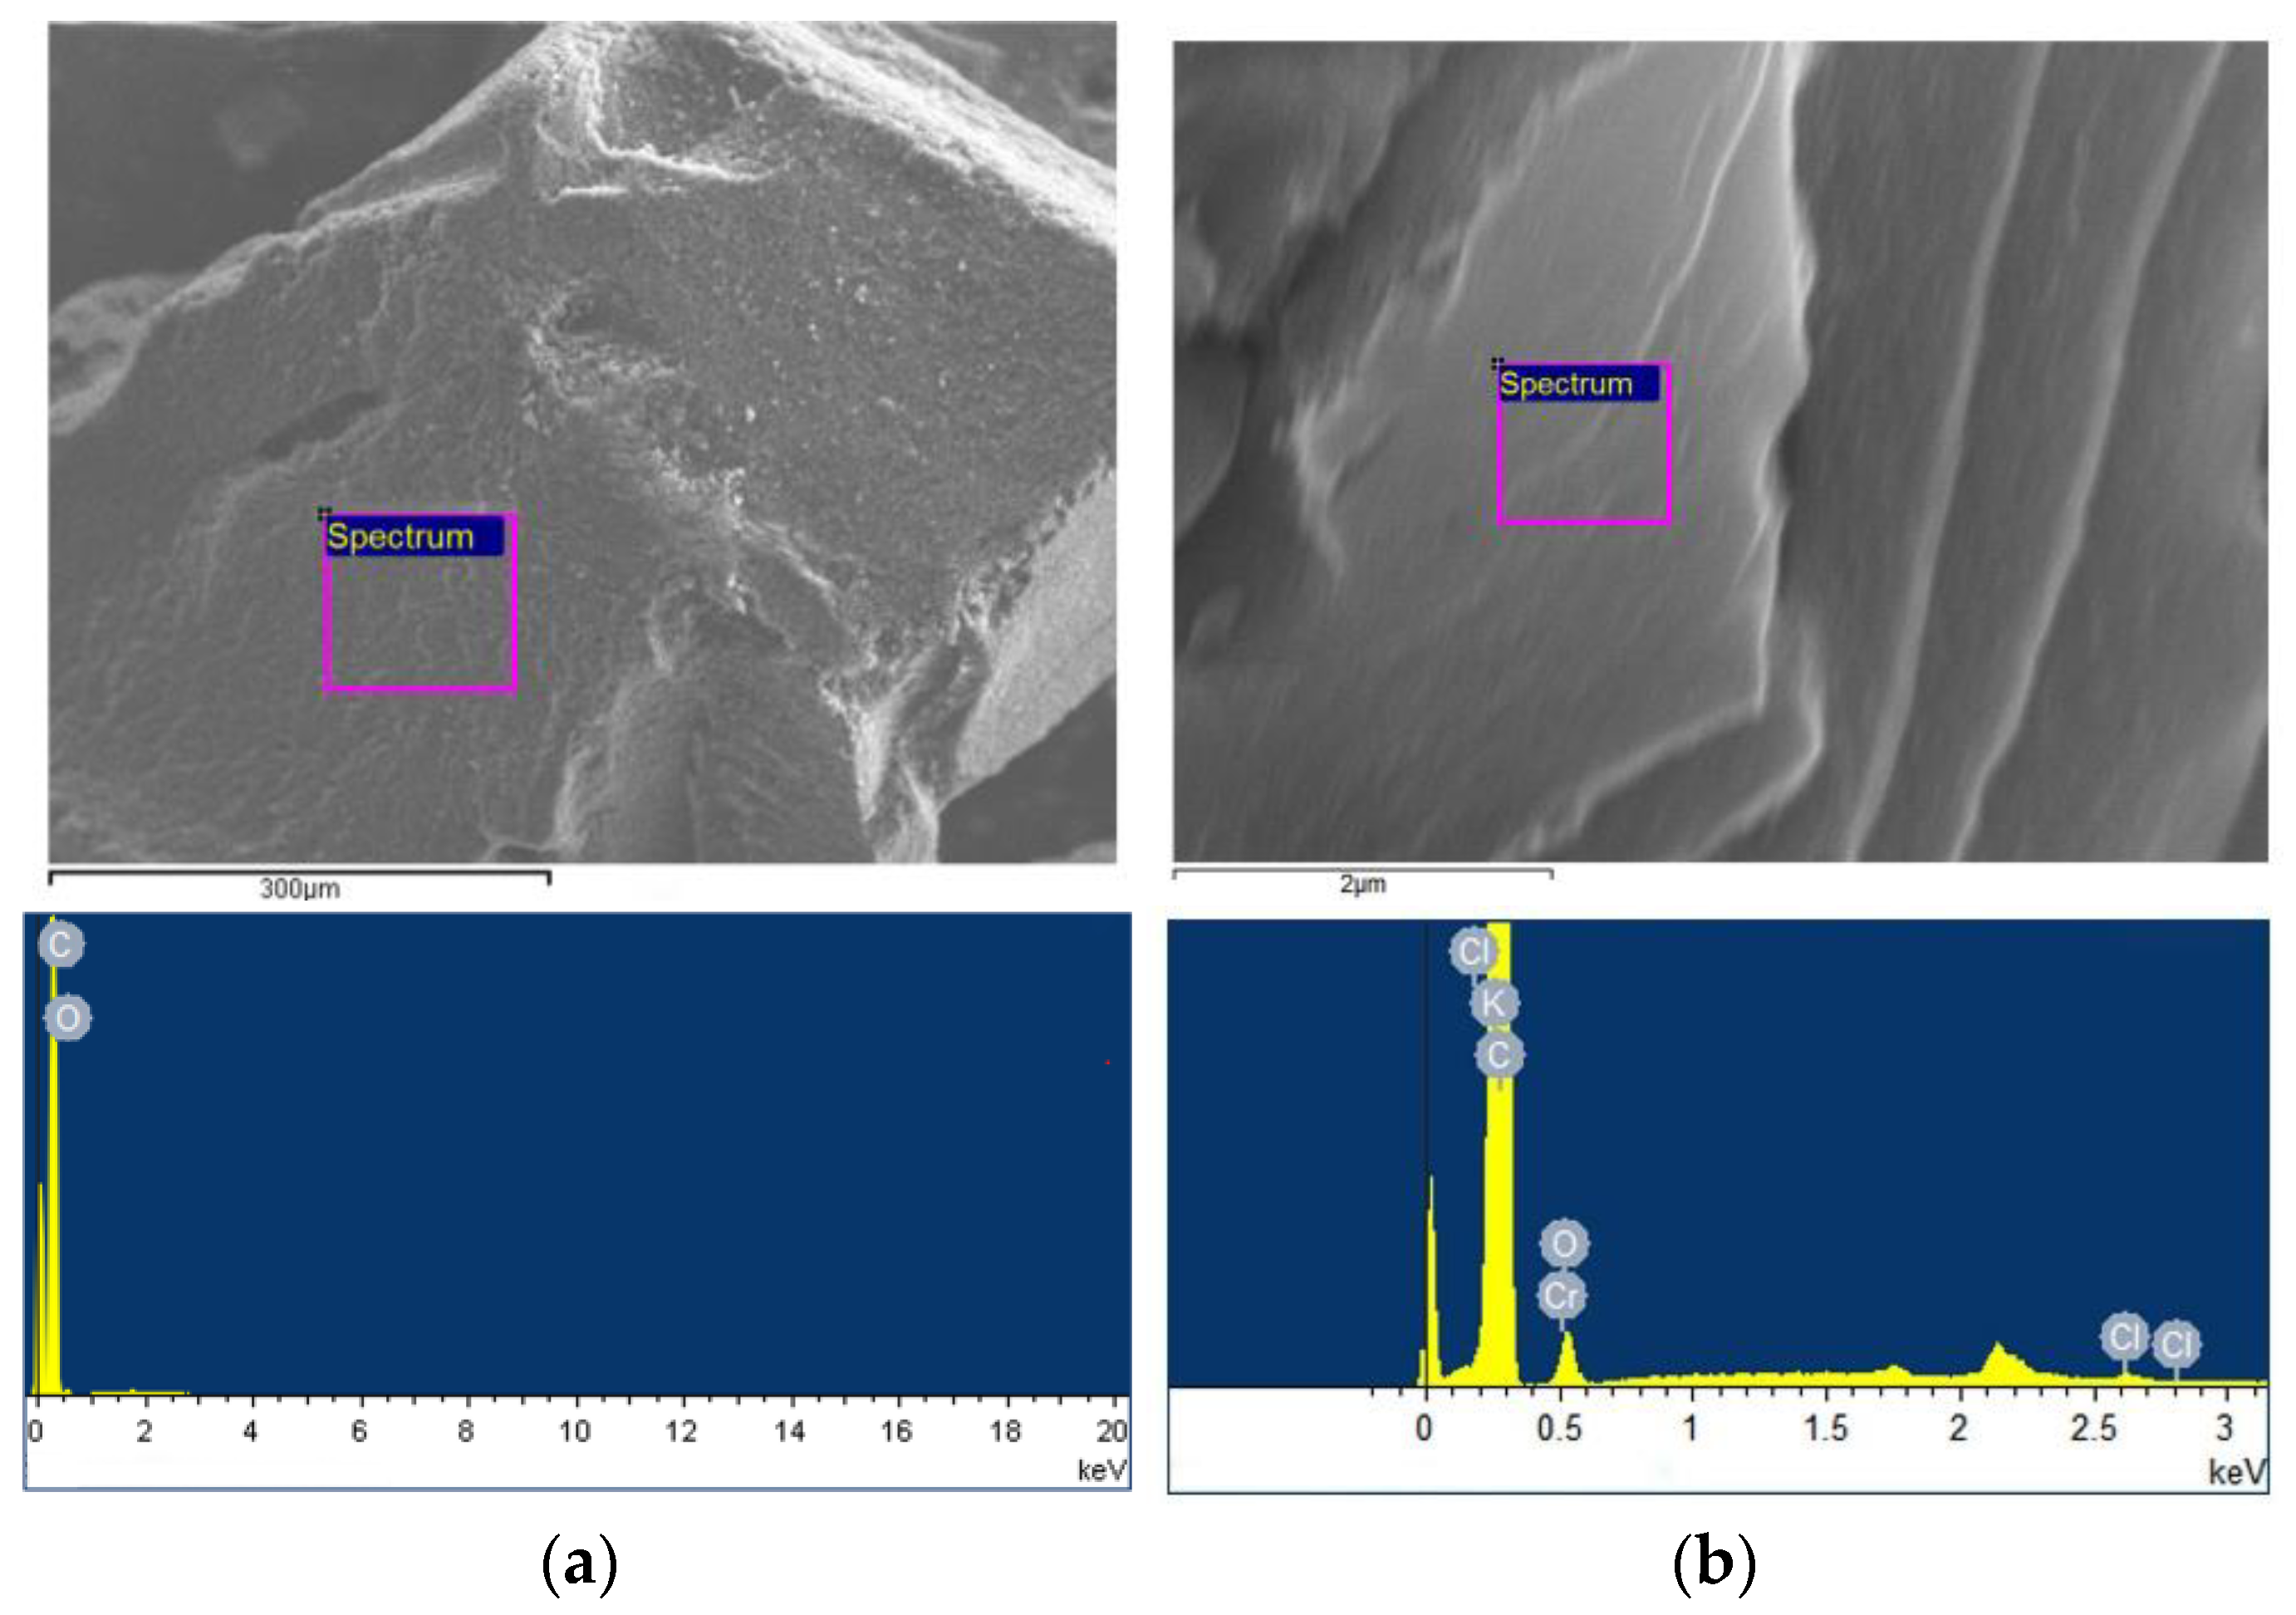
Figure 1. The SEM and the EDS images of carbon material. (a): AC; (b): 3D-GS.
Processes 11 02487 g001
Figure 2. XRD pattern of carbon-based materials AC and 3D-GS.
Processes 11 02487 g002
Figure 3. Adsorption isotherms of N2 at 77 K on the carbon-based materials AC and 3D-GS.
Processes 11 02487 g003
Figure 4. PSD of two carbon materials determined by 2D-NLDFT.
Processes 11 02487 g004
Figure 5. The excess amount of methane adsorption on both carbon-based materials at 0–100 kPa and 283–303 K. (a): AC; (b): 3D-GS.
Processes 11 02487 g005
Figure 6. The uptakes of methane adsorption on the carbon-based materials for the temperature ranging from 283 K to 303 K and pressures up 1.5 kPa. (a): AC; (b): 3D-GS.
Processes 11 02487 g006
Figure 7. Plot of the normalized second Virial constants  B 2 S  determined by the AC and 3D-GS.
Processes 11 02487 g007
Figure 8. The isosteric heat of methane adsorption on carbon-based materials at low surface coverage.
Processes 11 02487 g008
Figure 9. Isotherms of excess amount of methane adsorption on the AC and 3D-GS at 0–8 Mpa and 298 K.
Processes 11 02487 g009
Figure 10. Isotherms of excess and absolute amount of methane adsorption on carbon materials. (a): AC; (b): 3D-GS.
Processes 11 02487 g010
Table 1. Elemental analysis results of carbon materials by the EDS.
AC3D-GS
ElementAtom Concentration/%ElementAtom Concentration/%
C95.91C67.00
O4.09O32.24
----Cl0.31
----K0.15
----Cr0.30
Total100Total100
Table 2. Textural parameters of the as-prepared HKUST-1 samples.
Simple3D-GSAC
BET specific surface area SBET / m 2 · g 1  20451637
Micropore volume  2   n m / cm 3 · g 1  0.5440.65
Mesopore volume  > 2   n m / cm 3 · g 1  0.8380.142
Table 3. Parameters calculated by methane uptake on the AC and 3D-GS in Henry’s law region.
T/K H p / mmol · g 1 · kPa 1 B 2 s E + 6 / m 3 · g 1
AC3D-GSAC3D-GS
2830.017580.0170641.363340.1398
2930.013620.0132733.178332.3257
3030.010040.0088725.292122.3448
Table 4. The potential well between methane and carbon-based materials.
T/K ε s f k / K
AC3D-GS
28368.6765.64
29368.1464.73
30366.6662.11
Table 5. Parameters of Langmuir, L-F and Toth equation determined by non-linear fit of the experimental data of methane adsorption on the carbon materials.
ParametersLangmuir EquationL-F EquationToth Equation
AC3D-GSAC3D-GSAC3D-GS
n 0 /mmol g−19.916112.29212.75817.87516.49824.1
b /mmol g−1 MPa−10.89070.63650.50860.29180.86820.5227
t ----0.81910.80520.58320.554
ρ a /mol·L−145,230113.8636.25222.824825.3119.513
δ/%0.81910.78350.16480.26570.16220.2342
Disclaimer/Publisher’s Note: The statements, opinions and data contained in all publications are solely those of the individual author(s) and contributor(s) and not of MDPI and/or the editor(s). MDPI and/or the editor(s) disclaim responsibility for any injury to people or property resulting from any ideas, methods, instructions or products referred to in the content.