Article

Molecular Modeling of Supercritical Processes and the Lattice—Gas Model

by
Yuri Konstantinovich Tovbin
Kurnakov Institute of General and Inorganic Chemistry, Russian Academy of Sciences, Moscow 119991, Russia
Processes 2023, 11(9), 2541; https://doi.org/10.3390/pr11092541
Submission received: 20 May 2023 / Revised: 27 July 2023 / Accepted: 7 August 2023 / Published: 24 August 2023

Abstract

:
The existing possibilities for modeling the kinetics of supercritical processes at the molecular level are considered from the point of view that the Second Law of thermodynamics must be fulfilled. The only approach that ensures the fulfillment of the Second Law of thermodynamics is the molecular theory based on the discrete–continuous lattice gas model. Expressions for the rates of the elementary stage on its basis give a self-consistent description of the equilibrium states of the mixtures under consideration. The common usage today of ideal kinetic models in SC processes in modeling industrial chemistry contradicts the non-ideal equation of states. The used molecular theory is the theory of absolute reaction rates for non-ideal reaction systems, which takes into account intermolecular interactions that change the effective activation energies of elementary stages. This allows the theory to describe the rates of elementary stages of chemical transformations and molecular transport at arbitrary temperatures and reagent densities in different phases. The application of this theory in a wide range of state parameters (pressure and temperature) is considered when calculating the rates of elementary bimolecular reactions and dissipative coefficients under supercritical conditions. Generalized dependencies are calculated within the framework of the law of the corresponding states for the coefficients of compressibility, shear viscosity, and thermal conductivity of pure substances, and for the coefficients of compressibility, self- and mutual diffusion, and shear viscosity of binary mixtures. The effect of density and temperature on the rates of elementary stages under supercritical conditions has been demonstrated for a reaction’s effective energies of activation, diffusion and share viscosity coefficients, and equilibrium constants of adsorption. Differences between models with effective parameters and the prospects for developing them by allowing for differences in size and contributions from the vibrational motions of components are described.

1. Introduction

Transition to supercritical (SC) conditions of a gas mixture are connected with the increase in temperature and pressure in a system [1,2,3,4]. Processes in supercritical fluids (SCFs) are allocated in a separate area of research and practical applications owing to their physicochemical properties. Many physical properties of SCFs (density, viscosity, and speed of diffusion) are intermediate between the properties of a liquid and gas. SCFs combine properties of gases at high pressures (low viscosity, high diffusion factor) and liquids (high dissolving ability); they possess fast mass transfer carried out thanks to their low viscosity and high factor of diffusion. Further, SCFs possess very small interphase tension, low viscosity and the high factor of diffusion allowing SCF to get into porous environments easier in comparison with liquids, high sensitivity of dissolving ability of SCF to pressure or temperature change, and simplicity of division SCF and the substances dissolved in them at pressure dump.
All these properties have allowed the development of high-pressure technologies involving sub- and supercritical liquids, and have allowed the possibility of receiving products with special features or projecting new processes that are viable and harmless to the environment. Now, SCF processes are an important part of industrial chemistry. Some achievements in this direction are reflected in reviews [5,6,7,8,9,10,11,12,13,14,15,16,17,18,19].
In supercritical (SC) conditions, a wide range of various technological processes is currently implemented. Among them are homogeneous chemical reactions in bulk phases and processes for creating new materials, including nanoparticles, heterogeneous catalytic reactions, physicochemical processes in porous media, chromatography, extraction, and many others. The presence of fluids in the SC system can change the nature of the implementation of chemical reactions in comparison with their flow under normal conditions (i.e., at a temperature below the critical one and a pressure of the order of one atmosphere). This change is due to the increased density of the SCF compared to the density of the gas phase and the rapid dissipation of heat in it. Density changes in the components in reaction systems lead to shifts in all chemical equilibria and allow the occurrence of processes that are unlikely under normal conditions. This is the basis for the search for new ways to implement physical and chemical processes that allow the development of new, more environmentally friendly industries. In the existing set of SCF processes, their various exploiting is possible as an environment (for inert fluids), solvents (for associated fluids) or reagents, and for all these manifestations of SCFs, it is desirable to have a common approach for modeling their implementation, since it affects their fundamental physico-chemical features. The overall flow of the processes can be controlled by changing the pressure in the system. The increase always leads to an increase in the total density of matter in the system. In SCF processes, the temperature also rises. These two factors can influence volumetric and surface processes in different ways. Thus, for adsorption inside porous materials and at open surfaces, the increase in temperature always reduces the adsorption, and adsorption increases with raising pressure.
For the practical realization of technological processes, a search for optimum modes that are carried out by means of modeling methods is required. Modeling questions in different technologies are connected with the necessity of the account of scale transition from process studying in vitro to technological reactors.
In the general case, the same methods that have been developed earlier for other, different technologies are applied to modeling SCF processes. The general equations of nonequilibrium thermodynamics on the macro-level [20,21,22] and the molecular theory on the molecular level [23,24] are usually used for the description of technological processes. Traditionally these methods share the description of the kinetic and equilibrium processes concerning the molecular and above-molecular levels.
The most widespread equations on the above-molecular level are hydrodynamic equations. The equations of a hydrodynamic mode of flows in gases and liquids describing describe the dynamics of the system in terms of concepts the theory of continuous media concerning such equations, and in the more general case, the equations include the following types of the kinetic equations: (1) hydrodynamic Navier–Stokes equations or analogs for complex molecular systems [25,26,27,28,29,30]; (2) chemical kinetics equations within the limits of ideal models (the law of mass action) which operate only with one or partial functions of distributions (or a concentration of reagents) [31,32,33,34,35]; (3) classical thermodynamics equations for the simplification of calculations of nucleation and coagulation processes [36,37,38,39,40]; and (4) thermodynamics equations of irreversible processes which include points (1)–(3) [20,21], containing all types of molecular mechanisms of transport processes in addition to convective flow.
Chemical kinetics equations within the limits of ideal models, i.e., using the law of mass action, comprise information only about a concentration of reagents. These equations also are included in the equations of the hydrodynamic level at any size of volume of the system. The equations of classical thermodynamics are often used for calculations of nucleation processes to simplify or eliminate the calculation of stages of condensation and desorption of single molecules to a formed phase. The new phase (drop) is described through functions of exceeded free energy (through an interface tension).
At the hydrodynamic modeling level, there is a very large number of specific algorithms for specific processes [41,42]. Among them, we can mention the finite element method [43,44], which is focused on calculations of systems with complex geometric configurations and irregular physical structures. In the finite element method, the problem of finding the function is replaced by the problem of finding a finite number of its approximate values at specific points. This may explain the view of the finite element method as a grid method designed for solving microlevel problems, for which the model of the object is defined by a system of differential equations in partial derivatives with given boundary conditions.
The existing statistical physics methods of modeling the molecular level are the following: the molecular dynamics (MD) method [45,46,47,48,49], the kinetic Monte Carlo method [50,51,52,53,54,55], Brownian (or Langevin) dynamics [56,57], the Boltzmann equation (for gases in a continuum) [58,59], the Boltzmann discrete equation [60,61,62,63], the lattice-gas model (LGM) [64,65,66], microscopic hydrodynamics [67,68], and the lattice automata method [69,70,71,72,73]. More detail on different methods of modeling nonequilibrium processes, ranges of intervals of time, and areas of their application is given in Appendix 8 of the monograph [68]. The majority of technological SCF processes are described by means of gas and hydrodynamics equations, and local chemical kinetics equations. For examples of these, see various works on kinetics for SCF extraction [74,75,76,77,78,79,80,81,82,83,84,85,86,87,88,89,90].
For many technological processes in SCFs, the modeling problem is reduced to calculations of molecular distributions of components in different phases in almost equilibrium conditions. In such situations, one can use only thermodynamic models for the equations of state that allow the calculation of factors of interphase distribution of components in processes of solubility or extraction [91,92,93,94,95,96]. So, the Peng–Robinson equation of state [97] and the Mukhopadhyaya and Rao mixing law [98] were actively used in the modeling of solubility in the following research: the phase diagram of the system “CO2—diethylene glycol monoethyl ether (ethylcarbitol)” [99], the phase equilibrium of the propylene glycol–propane/butane system and the solubility of propylene glycol in supercritical propane–butane mixture [100], the solubility of ammonium palmitate in supercritical carbon dioxide [101], the solubility of bio-diesel fuel components (methyl esters of stearic and palmitic acid) in supercritical carbon dioxide [102], and in many other systems.
On the other hand, different equations of states can be used in one work. In [103] 14 equations of states were used; similarly, 13 equations of states were considered in [104].
Modeling questions in all technologies are connected with the transition scale from process studying in vitro to technological reactors. Often, for technological problems, one uses rough or simplified models for a targeted outcome, but a broader range of information can be attained with more correct models based on kinetic models of processes, thermodynamic models, and equations of states of non-ideal systems.
All possible approaches have been used for describing SCF processes. Equilibrium characteristics are described by the equations on concentration (or density) reagents whereas nonequilibrium processes are described by the kinetic equations on changes of these concentration in time. Depending on the intensity of molecular mixing, the considered equations can relate to local volumes or to the system as a whole. In such modeling technological processes, situations arise when two levels of models are used simultaneously: models of non-ideal systems for describing the equilibrium properties of SCFs and kinetic models based on the law of mass action, i.e., models for ideal systems, which does not agree with the second law of thermodynamics [22,23,24]. (1) According to the second law of thermodynamics, there should be unified mathematical models that describe both the relaxation stage of the displacement of the nonequilibrium state of the system to the direction of its equilibrium and the limiting equilibrium state itself during long periods. However, it is obvious that kinetic models based on the law of mass action cannot, in principle, transform during long periods into equations of state for non-ideal systems. To describe such a transition, it is necessary to have kinetic models and their mathematical equations for non-ideal reaction systems.
At the base of all modeling, there are local equilibrium models. The state of the theory and methods of calculation of SCFs are reflected in the collection of works [105]. These reviews deal with the modern theory of critical phenomena, methods to correlate near critical experimental results, and approaches to understanding the behavior of near critical fluids from microscopic theory. However, the question about the connection between kinetic models and equilibrium equations of state in non-ideal systems has not been discussed.
The alternative is approaches in molecular-kinetic theory that are constructed based on the so-called lattice-gas model (LGM) [68,106]. The advantage of the LGM is that this method is the only one of the above methods that provides self-consistency in the description of the rates of stages of non-ideal reaction systems with their equilibrium state in accordance with the second law of thermodynamics. Also, this approach gives a uniform method of the description of three-aggregate systems.
The purpose of this review is to present the possibility of modeling the physicochemical processes occurring at the molecular level in the LGM for the SC phases.
Expressions for the rates of elementary stages in ideal and non-ideal systems are presented in Section 2. These expressions are discussed in Section 3 from the point of view of the fulfillment of the second law of thermodynamics. Also discussed is the area of thermodynamic parameters near the critical point, in which it is inappropriate to carry out technological processes. Section 4, Section 5 and Section 6 present the possibilities of modeling kinetic SCF processes using the theory of non-ideal reaction systems based on the LGM: Section 4 outlines a model of the effective pair potential (Section 4); Section 5 describes the influence of SCFs on equilibrium and kinetic characteristics (5); and Section 6 describes the LGM and dissipative coefficients (6). Extensions of the LGM are indicated in Section 7. Section 8 gives the conclusions.

2. Molecular Level

2.1. Ideal Systems

The law of mass action defines the following expression for the rate of the bimolecular stage [21,22,31,32,33,34,35]:
U i j = k i j n i n j , k i j = k i j 0 e x p ( β E i j ) ,
where k i j is the rate constant of elementary reaction i + jproducts; ni is the concentration of molecules, measured as the number of i-type molecules in a unit volume; k i j 0 is the rate constant pre-exponential factor; E i j is the reaction’s energy of activation between i and j reagents; β = 1 / k B T , k B is the Boltzmann constant, and T is the temperature. In Expression (1), for a heterogeneous process, the area which does not change during the process is expressed in terms of the concentration of adsorbed particles θi [35], which determines the fraction of the surface occupied by component i: U i j = k i j θ i θ j (the product ninj is replaced by the product θiθj). To calculate the rate constants, the theory of absolute reaction rates is used [31]. This theory expresses the rate constants of the elementary steps with the partition functions of the reactants and the activated complex (AC) of the stage. Equation (1) assumes that the stage of chemical transformation is slow, the particles move completely independently, and an equilibrium distribution of components is realized in space. This means two important things: there is no intermolecular interaction in the system and there are no diffusion inhibitions at the micro- and macro-levels.
It also follows from Expression (1) that an increase in temperature exponentially increases the rate of the stage. The effect of SCF molecules as reagents is manifested only through the factor ni. However, the rate of the stage slows down with the increased pressure, even if the SCF component is inert. This pressure effect is due to the filling of the SCF of the volume of the system and a decrease in the probability of approaching the reagents, as well as the fact that, at high molecular densities, the formation of different associates around each reagent is inevitable.
Equation (1) is written for the elementary stage of the chemical transformation. When modeling real systems, it should be taken into account that a chemical process usually consists of several elementary stages, depending on the mechanism of a chemical reaction and on the transport stages of molecular transfer. The rate of each stage is affected by the temperature and concentrations of the components, which complicates the description of the gross SCF process. Almost any chemical process consists of several elementary stages determined by the mechanism of chemical transformation. To model SCF processes in continuous or batch devices, it is important to know the dissipative transfer coefficients.
As the concentration of SCF increases, the influence of intermolecular interactions increases, which affects the nature of all kinetic processes (chemical reactions, transfer coefficients, adsorption, and catalytic processes). Intermolecular interactions in dense gases lead to deviations from the law of mass action and it is necessary to turn to the theory of non-ideal reaction systems. The influence of pressure increase on the rate of the catalytic process of ammonia synthesis was first demonstrated in [107] (see also [35]). An increase in pressure to 300 atmospheres led to a change in all effective rate constants of elementary stages.
The main problem in the theory of non-ideal reaction systems is to take into account the influence of the environment on the rate of the elementary stage [32,33,68,106,108,109,110]. Reagent molecules in the dense phase are constantly surrounded by their neighbors and their intermolecular interactions change the potential surface of the elementary stage. In general, this changes the activation energies of the reaction for each local environment of the reactants.

2.2. Non-Ideal Systems and the Lattice-Gas Model

The theory of non-ideal reaction systems is also based on the theory of absolute reaction rates, which exploits the concept of an activated complex (AC) of an elementary stage. In this case, the AC is a particle with its own interparticle interaction potentials. The spatial distribution of all components of the reaction system (reagents, AC, and SCF) is described within the framework of the lattice-gas model (LGM) on discrete-continuum scales [66,68,106] in the quasi-chemical approximation (QCA). The QCA reflects the effects of direct correlations between all interacting particles. It should be recalled that the LGM allows one to describe the entire range of dimensionless particle densities from zero to one (in mole fractions), which allows it to be used to solve all problems of CSF processes. The choice of QCA as the basic approximation for calculating the equilibrium and kinetic characteristics is associated with full agreement with the second law of thermodynamics—this approximation provides a self-consistent description of the rates of elementary stages and the equilibrium state of the entire system. Below, for simplicity, we restrict ourselves to the equations of the bimolecular stage and take into account the interaction of nearest neighbors.
The entire volume of the system under consideration is divided into separate cells in the LGM. The cell size is chosen on the order of the average particle size so that it can be considered that this cell is occupied or free (vacant). The cell occupancy state is fixed by the index i, where 1 ≤ i ≤ s − 1 (s is the number of system components) and the symbol i = s refers to free cells. Above, the notation for the fraction of cells occupied by particles of type i was introduced as θi (or its number density). Then, the normalization condition will be written as j = 1 s θ i = 1 and the value θ = j = 1 s 1 θ i is the complete occupancy of a lattice system by all i components of the system, 1 ≤ i ≤ s − 1. The quantity is the fraction of free sites (recall that vacancies are not thermodynamic characteristics). The ratio x i = θ i / θ is the mole fraction of component i.
The lattice structure is characterized by the number of nearest neighbors z. Between particles in neighboring cells, lateral interactions are taken into account; the energy parameter of this interaction between a pair of particles ij is denoted by εij. The analogous parameter of any particle with a neighboring vacancy is equal to zero. The probability of finding a pair of particles ij at neighboring nodes is characterized by the value θijthis is the pair distribution function of particles. Such functions are needed to describe the probability that reactants i and j will meet in dense phases so that a chemical reaction can occur.
The rate of a bimolecular reaction of the Langmuir–Hinshelwood type UfgAB is written in the theory of non-ideal reaction systems [66,106] as the following expression (subscripts f and g indicate the numbers of sites where reagents A and B are located):
U f g A B = k f g A B exp ( β ε f g ) θ f g A B Λ f g A B ,
where Λ f g A B is the function of imperfections, defined as
Λ f g A B = h ( z ( f ) 1 ) S f h A h ( z ( g ) 1 ) S g h B ,   S f h A = j = 1 s t f h A j exp ( β ( ε A j * ε A j ) )
The subscript h refers to the nearest neighbors of site f or g. The neighboring sites g or f themselves are not included in the set of values of the index h; the function S g h A is defined similarly to the function S f h A (indices A and f change to indices B and g). Here the symbol ε*ij represents the interaction parameter of the AC reaction for an i-type particle with a neighboring particle of type j.
The function tfhij = θfhijfi is the conditional probability of finding particles j next to particles i. Here, the numbers of neighboring sites (subscripts) are introduced only to indicate differences in positions on the lattice of the reactants: θfhij = θij and tfhij = tij. In non-ideal systems, θij ≠ θiθj, which corresponds to the correlated distribution of components in space. The case of equality θij = θiθj corresponds to the chaotic distribution of components, which is typical for ideal systems (see Formula (1)).
Intermolecular interactions change the probability of encounters of reagents (the factor θAB instead of the product θAθB) and the heights of activation barriers through the functions ΛfgAB. Functions Si take into account the influence of neighbors on the magnitude of activation barriers through the difference in interaction parameters due to the influence of the neighboring particle j (via δ ε i j = ε * i j ε i j ). The exponential factor with β ε f g A B in Formula (2) is necessary for the transition at low system densities from Formula (4) to Expression (1) for the law of mass action, as for an ideal system [66].
Equations (2) and (3) contain the pair function θij that characterizes the probability that two particles i and j can be on neighboring sites. The calculation of pair functions θij in non-ideal reaction systems is always carried out in some particular approximation because the problem cannot be solved exactly [64,65,66]. In this case, the so-called quasi-chemical approximation (QCA) is used [23,64,65,66]. Historically, it was the first approximation in which the effects of direct correlations between interacting molecules were taken into account. There, each pair of neighboring molecules is considered independent of other molecules in the system. The function θij depends on the interaction energy of molecules and concentrations of components.
The pairwise distribution functions are found from the solution of the system of algebraic equations in the QCA together with the normalization condition:
θ i j θ s s = θ i s θ s j exp ( β ε i j ) ,   j = 1 s θ i j = θ i .
It follows from Equations (4) that i and j particles attract one another when εij > 0; analogously, i and j particles repulse one another when εij < 0.
When calculating the rates of reactions on a homogeneous surface, it is necessary to first find the surface concentrations of the reagents, which are determined from the QCA Equation (5) of adsorption in the presence of SCF molecules:
a i P i = θ i θ s S i z ,   S i = 1 + j = 1 s 1 x i j t i j ,
where Pi represents the partial pressures in the gas phase (1 ≤ i ≤ s − 1); θi is the degree of filling the surface with particles i; ai = ai0 exp(βQi), ai0 is the pre-exponential of Henry’s constant; Qi is the binding energy of particle i with the surface; and x i j = exp ( β ε i j ) 1 .
From the terms for the rates of individual stages, the right-hand sides of the kinetic equations of the simulated processes (specified in Appendix A) are formed.
The rates of two-site stages have the form of Equations (2) and (3), and the rates of single-site stages in QCA have the form of Equation (A6) in Appendix A.

3. Thermodynamics and Kinetics

The developed theory of non-ideal reactionary systems [66,106] answers a number of requirements regarding its connection with chemical thermodynamics:
  • The second law of thermodynamics and connection between models of equilibrium and kinetics;
  • A self-consistence of equilibrium and kinetics in ideal systems;
  • A self-consistence of equilibrium and kinetics in non-ideal systems;
  • The equations of a state for non-ideal systems and their connection with kinetic models;
  • Why it is impossible to use factors of activity for the AC in kinetic models;
  • Thermodynamic parameters of the critical area and the requirement of technologies.

3.1. The Second Law of Thermodynamics and Connection between Models of Equilibrium and Kinetics

Clausius’ formulation of the second law of thermodynamics contained a way to consider the transfer of nonmechanical energy in the first law of thermodynamics. This formulation is rather complex to understand because it simultaneously contains both the process of development toward equilibrium in a closed system and the limiting equilibrium state [25,111,112]. The mathematical formulation of the combined equation of thermodynamics is dUTdSPdV, where U is the internal energy, P is pressure, and V is the volume of the system; the sign of the equality corresponds to the equilibrium. A quantitative measure of the process considered in the second law of thermodynamics is entropy S which characterizes the thermal motion of matter. The entropy in the time-limited equilibrium state of a system does not depend on the transition to the equilibrium state and it is maximal with respect to all other states.
Clausius’ statements about the limiting states of equilibrium systems with extreme properties of entropy were adopted as a basis in thermodynamics by Gibbs. This allowed him to deal with various states without specifying transitions between them. Gibbs’s mathematical formulation of the combined equation of thermodynamics (dU = TdSPdV) divided Clausius’ second law of thermodynamics into two parts: equilibrium and nonequilibrium.
Dividing the second law of thermodynamics into two parts [112,113,114], Gibbs omitted the requirements, contained in bases of thermodynamics, about a self-consistence description of reaction rates and an equilibrium condition [115]. The existing law of mass action [21,34] was highlighted, although it is not valid in non-ideal systems that comprise the majority of real processes. The requirement of self-consistence did not become obligatory for the kinetic theory of non-ideal reactionary systems (including all of Prigogine’s works [22]). This requirement is not present either for transport processes where it is absolutely necessary for the calculation of dissipative factors [20,23].
The requirement for the self-consistency of the description of the rates of stages in a non-ideal reaction system and its equilibrium state was introduced only in Ref. [115], as a necessary refinement of the second law of thermodynamics for modeling all kinetic processes.

3.2. Self-Consistence of Equilibrium and Kinetics in Ideal Systems

Irreversible processes take place until either a stationary state or equilibrium is established (excluding the possibility of realization of periodic processes). If several irreversible processes are superimposed and the final state attained corresponds to equilibrium, then in certain cases it is possible to obtain general conditions for the coefficients that describe irreversible processes, without the application of the thermodynamics of irreversible processes.
In the general case of more complex elementary stages of chemical reactions in the gas phase, the law of mass action, which was empirically established by Guldberg and Waage (1867), is used to describe reaction rates. For reversible reactions of a general form, we can write i ν i A i k 2 k 1 j ν j A j , where the symbols Ai and Aj in brackets denote different reacting particles, and the values of νi and νj are equal to the negative and positive values of the stoichiometric coefficient (the sign of the coefficient is determined by their location: on the left or right side of the equation). The constants k1 and k2 are the reaction rate constants in the forward and backward directions. Numerically, they are equal to the reaction rate at single values of the concentration of each of their reagents in the forward direction.
The rate of the considered reaction within the framework of the law of mass action [21,34] will be written as
U = k 1 i n i ν i k 2 j n j ν j
In the equilibrium state, the rate is zero, w = 0, and it follows from (6) that the rate constants in the forward and backward directions are related to each other in the form
k 1 / k 2 = j n j ν j / i n i ν i = K
where K = k1/k2 is the equilibrium constant of the stage.
Let us consider the simplest process of adsorption–desorption of gas phase molecules without dissociation. The rate of desorption of particles A from the occupied areas of the surface will be written as UA = KAθA, where KA is the desorption rate constant and θA is the fraction of the occupied surface. The adsorption rate on free surface areas (V is the symbol of vacancies) will be written as UV = KVV, where KV is the adsorption rate constant, P is the pressure in the gas phase, and θV is the fraction of the free surface (θV = 1 − θA).
At equilibrium UA = UV, it follows that KAθA = KVV, or θA = KVP(1 θA)/KA or θA = KVP/(KA + KVP), and θA = a1P/(1 + a1P), a1 = KV/KA is the adsorption coefficient without dissociation. If the adsorption process proceeds with the dissociation of gas phase molecules, then the rates of desorption and adsorption will be rewritten as UAA = KAAθAA = KAA(θA)2 and UVV = KVVVV = KVVP(1 θA)2. Hence, θA = a2P1/2/(1 + a2P1/2) is the Langmuir isotherm of dissociating molecules and a2 = (KVV/KAA)1/2 is the adsorption coefficient in the presence of dissociation.
In both cases, one can write down one fractionally rational function θA = y/(1 + y), where y = y1 = a1P for adsorption without dissociation and y = y2 = a2P1/2 in the presence of dissociation. It follows that in the coordinates θA = θA(y) both dependencies behave equivalently. The coincidence of both dependences θA = θA(y) means that the equilibrium adsorption of dissociating molecules does not depend on what occurs first: dissociation of molecules in the gas phase or their adsorption. Both of these equilibrium dependences are obtained from the condition that the second law of thermodynamics according to Clausius is satisfied—from equalizing the velocities of the oppositely directed velocities of the stages. As a result, the four different rates of elementary stages give one equilibrium concentration dependence.
This result is obtained within the framework of the law of mass action, which is fulfilled for an ideal gas mixture and dilute solutions. The following expression for the chemical potential can be written μ i = μ i 0 + k Б T   l n n i , where μ i 0 and ni are the chemical potential of the standard state and the molar volume concentration of component i. However, in kinetic models for non-ideal systems it is impossible to use activities or activity coefficients [115] as natural thermodynamic replacements of concentrations (see below).

3.3. Self-Consistence of Equilibrium and Kinetics in Non-Ideal Systems

The theory on the basis of the LGM provides a self-consistent description of an equilibrium condition of a reactionary mixture and rates of elementary stages. This means that by equalizing rates of oppositely directed processes of any stage, the equation of equilibrium distribution of components [66,106] can be derived. These self-consistent processes are only those where local correlations, such as QCA, are taken into account.
Τhe above statement can be formally explained in the following way. The expression for the equilibrium constant K (7) of the two-molecular stage A + B ↔ C + D can be considered as a product of two independent monomolecular processes A ↔ C and B ↔ D. That is, global equilibrium does not depend on the way it is realized in the system—it goes through different equilibrium reactions or coincides with a condition of equilibrium of the environment as a whole. In this case, the theory of non-ideal reactionary systems guarantees that the second law of thermodynamics is realized as it happens in the theory of ideal reactionary systems.
Exactly the same situation with obtaining equilibrium dependences θA = θA(y) in non-ideal reaction systems will be considered for adsorption and desorption processes with (m = 2) and without (m = 1) dissociation. Let us consider the equalities of the rates in both directions, UA = UV and UAA = UVV, expressed by Formulas (2) and (3) in the QCA.
To illustrate the logic of the second law of thermodynamics for a non-ideal system, let us again (as for the ideal system) consider the process of adsorption of dissociating A2 molecules in the form of two routes: the dissociation of A2 molecules into atoms A in the bulk phase followed by their adsorption or the adsorption of A2 molecules followed by the dissociation process. Both routes are described by the rates of stages in the forward (adsorption) and reverse (desorption) directions. At equilibrium, adsorption isotherms for A2 molecules and A atoms should be obtained. Moreover, the degree of surface filling θA must be the same regardless of the route, i.e., the final equilibrium state does not depend on the way the equilibrium is reached. This fact reflects the concept of Clausius twice: the equilibrium state itself follows from the equality of the rates of the stages and for different routes, it receives a single mathematical dependence for the degree of surface filling on pressure.
As a visual illustration, we present Figure 1, which shows the concentration factors of the rates for the four indicated stages and the equilibrium values θA corresponding to the equalities of the rates of the stages for chemisorption (εAA < 0), without dissociation (Figure 1a) and in the presence of dissociation (Figure 1b). Here, Vi = Ui/Ki, Vii = Uii/Kii. Each field consists of three curves for the logarithm of the concentration factors for rates of non-dissociative (Figure 1a) and dissociative desorption (Figure 1b), adsorption (curve 1), desorption (curve 2), and the logarithm of the isotherm of adsorption (curve 3, right y-axis). As in ideal systems (Section 3.2), both curves 3 are identical for non-ideal systems.
A rigorous mathematical proof of the self-consistency of the stage rates and the equilibrium distribution of the components of a non-ideal system in QCA is given in [66,106].
Other approaches, where the distribution of particles is not correlated, do not provide a self-consistent description of the kinetics and equilibrium stages (see more detail in [66,106]). In particular, all one-particle approaches without the effects of correlation are not self-consistent expressions for rates of two-molecular stages processes. These are average field approximation, chaotic approximation, and approximation of functional density.

3.4. The Equations of a State for Non-Ideal Systems and Their Connection with Kinetic Models

In the work of Fisher M.E. [116], it was shown that the van-der-Waals equation for non-ideal gases corresponds in LGM to the approach of an average field. All other constructions for phenomenological equations of a state are derived in the same style [103,104,117,118]; this leads to the obvious contradiction when modeling SCF processes: various phenomenological equations of a state reflect the non-ideality of a reactionary system, whereas the equations for kinetic models do not reflect the non-ideality of systems.
All kinetic models for SCF processes are based on an ideal model with the law of mass action. This breaks the concept of the self-consistent description for the majority of SCF processes. In order to avoid this controversy, it is necessary to use the equations for non-ideal systems in the LGM. Then, all features of the movement of molecules in SCF conditions can be reflected through internal statistical sums of molecules, taking into account the effects of correlations and preservation of the self-consistency description of kinetics and equilibrium.

3.5. Why It Is Impossible to Use Factors of Activity for AC in Kinetic Models

For non-ideal reaction systems, all expressions for the elementary stage rates are interpreted within TARR [31]. So, instead of using Equation (1), the rate of a bimolecular stage is written as
  U i j = k i j * n i n j ,
where k i j * are the rate constants of the elementary stage, written as
k i j * = k i j 0 α i α j α i j * e x p ( β E i j ) = k i j α i α j / α i j * ,
where k i j * is a pre-exponential factor of rate constants; E i j is the energy of activation of the reaction i + j → products; k i j is the rate constant in the ideal reaction system (1); α i is the activity coefficient of i-type reagents; and α i j * denotes the activity coefficients of ACs. Calculating the activity coefficients for reagents and for ACs requires the use of the well-known theory of non-ideal solutions [119,120,121,122].
However, for kinetic models, the above method leads to errors. This is because of the calculation of the activities in a non-ideal mixture with the required averaging on all configurations of all components. The analysis of the applicability of TARR to the condensed phases in the form of Equation (8) has shown [68,115,123] that the basic condition of TARR on the equilibrium presence between the AC and surrounding molecules is violated during the elementary process.
This means that the elementary stage is realized at fixed positions of all neighbors since the relaxation time of each neighbor’s environment is much longer than the time of the AC formation. Therefore, an introduction of the concept for AC activities deforms the basic TARR statement. As a result, the use of Equations (8) and (9) instead of Equations (2) and (3) can lead to appreciable differences in the values of reaction rates, especially at intermediate densities.
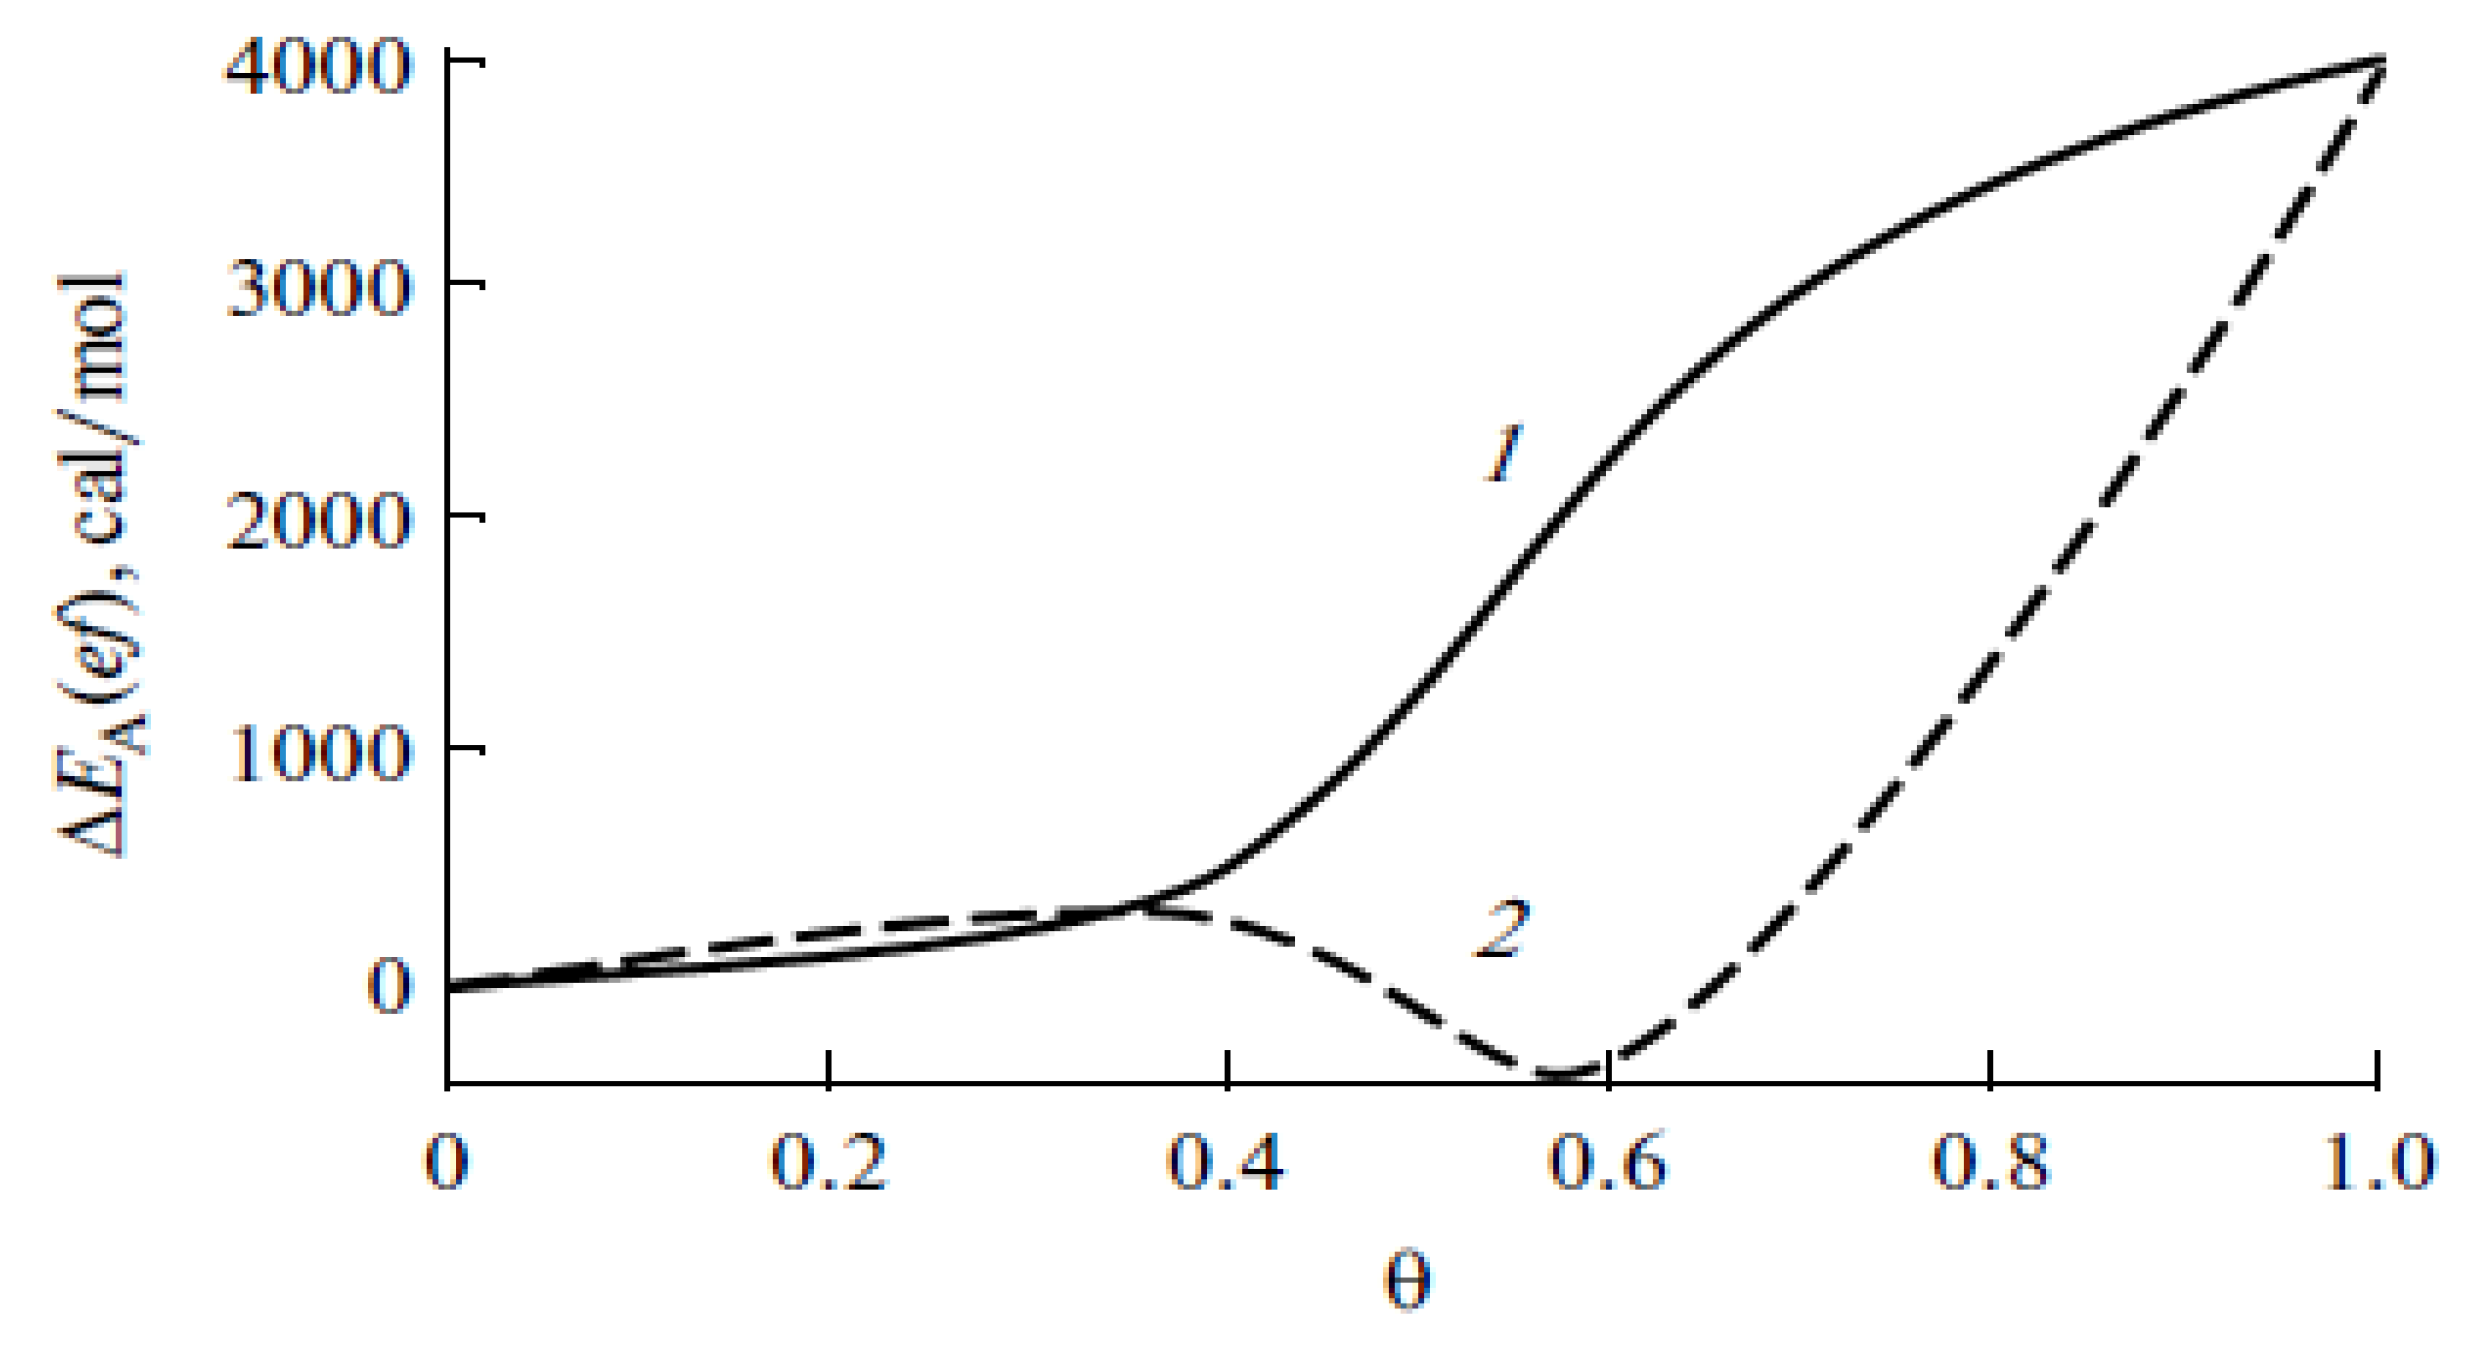
Figure 2 illustrates the qualitative difference in concentration dependences of reaction rates for different environment relaxations in isothermal conditions (the curves describe the desorption system of type CO-Pt).
The effective activation energy of desorption (   e x p ( β E A e f ) = U A / ( θ A K A 0 )   ), and accordingly the reaction rate, increases monotonically with increasing surface coverage when calculated by Equation (A6) for the unimolecular stage with the function S f h A (3) (this stage is fast without taking into account environment relaxation). When calculated by the Formula (9) for the unimolecular stage [123], the effective activation energy for desorption under conditions of equilibrium relaxation of the environment (this stage is slow) varies nonmonotonically. The nonmonotonic behavior of the desorption rate contradicts the physics of the process, especially in view of the fact that, at short distances, chemisorbed species repel each other. In general, in non-ideal systems, the nonmonotonic behavior of the reaction rate is possible only if the potential is attractive [66,106,124]. Furthermore, the negative effective activation energy of the sole desorption reaction does not have a physical sense. The behavior of curve 2 is due to an incorrect procedure for averaging over all configurations of all neighbors with respect to the AC. This drastically changes Equation (3), in which the functions S f h A have a different relationship with the concentrations and functions tij. As a result of this averaging procedure, the nature of the effective interaction between particles changes: instead of repulsion, their effective attraction appears (which distorts the physical nature of the system). When the density of the system changes, the particles behave as in the case of a first-order phase transition with a nonmonotonic concentration dependence of the rate of the desorption stage.
The above comparison shows how much the effect of the environment relaxation influences the rate of a unimolecular process. Therefore, the issue of the correctness of using one or another method for averaging the contribution from the neighbors plays a fundamental role in the dynamics of the elementary stages. So, the incorrect use in TARR representations about AC activity (as in Equation (9)) excludes formal extension of kinetic models on non-ideal reactionary systems via a conception of “activity” instead of a concentration.

3.6. Thermodynamic Parameters of the Critical Area and the Requirement of Technologies

It should be remembered that for successful realization of chemical reactions in SC conditions, it is necessary to displace on temperature upwards from the critical point of phase transitions of the first order both in solid and in liquid phases. Otherwise, near the critical point, processes of alignment of density are slowed down (or diffusion transport stages are at a loss), and this complicates a current of chemical multiphase processes [125,126,127,128]. The reason for such a delay is the general thermodynamic relations connected with the equality to a zero in the critical point derivative of chemical potential μi on concentration components i in the vicinity of the coordinates of the critical point (Pcr, Tcr): ( μ i / n i ) P c r , T c r = 0 and ( 2 μ i / n i 2 ) P c r , T c r = 0 . This peculiarity to the same extent concerns both the average field and the QCA approach in the LGM. It must be valid in any calculation method.
Attention has been paid to the same circumstance in [129] in the analysis of conditions for performing an experiment by definition of the parameters of the “coil–globule” conformational transition for the polymeric chains dissolved in SC–CO2. On the basis of the gas-dynamic model of the impulse jet expansion of a van der Waals gas, a strategy experiment on the determination of the parameters of the “coil–globule” transition of the polymer chain in SC carbon dioxide was developed. To use the condition of constant isochoric heat capacity outside the near-critical point in modeling, it is necessary to determine the structure of the near-critical region.
For such purposes, the authors use techniques [130] based on representations about thermal stability [131] and increases in fluctuations with near-critical areas [132]. Taking into account the isentropic flow of the process and the behavior of CO2 in the near-critical region, the conditions of expansion corresponding to the model was determined. An experimental design (geometry and dimensions of the basic elements of the installation, and the duration of the impulse valve) was developed. Possible variants of the experiment and its data processing were discussed.
The area of thermodynamic parameters that is necessary to exclude from the area of search for carrying out the experiment is specified in Figure 3 (solid lines). This area is limited by curves C-SC—the line of local minima of stability, C-MSC—the line of maxima of fluctuations, and line SC-MSC—the line of a supercritical isotherm [129], where C is the critical point, SC is the super-critical point, and MSC is the point of the maximum of fluctuations on the supercritical diagram.
Taking into account the developments of the authors of [129], Figure 3 shows the general scheme reflecting the combined effects (dashed lines MSC-A and SC-B) of slowing down mass transfer processes near the critical region (lower dashed line AB) and effects with maximum fluctuations (solid lines from [129]) of thermodynamic parameters.
Thus, from the point of view of the implementation of optimal modes of technological processes, the proximity of thermodynamic parameters to the parameters of the critical point is not appropriate. Search for them is required at such a distance from the critical point in order to avoid both the slowdown of the process near the critical point (Pcr, Tcr) and the presence of large fluctuations of parameters on the supercritical isotherm, to ensure the stability of obtaining the target product.

4. Model of the Effective Pair Potential

4.1. Internal Motions of Particles

The initial interpretation of the LGM refers to a rigid lattice with fixed parameters of the lateral interaction. These conditions limit the possibility of using the LGM to describe experimental data even in equilibrium [119,120,121,122]. In order to expand the potential possibilities of the LGM in interpreting different systems, the LGM equations [133] take into account the motions of the center of mass of molecules inside the cells. This led to integral equations [134], similar to the theory of liquid [135,136,137,138], but not without violating the condition of a single filling of each cell.
As a result, the QCA continuum was formulated [133], which made it possible to use traditional ideas about lattice models, including the concepts of the excluded (or accessible) cell volume for the center of mass for molecules, the softness (or deformability) of the lattice structure, and the vibrational motions of molecules. Extensions of models of internal motions of molecules in LGM are associated with different degrees of freedom of molecules in the condensed phase. The free volume of the cell is associated with the translational motion of the center of mass of the molecule. Vibrational motions are always realized in bound ensembles of molecules. The softness of the lattice structure is formed due to the average displacement of molecules relative to each other. Traditionally, the concepts of translational and oscillatory motion refer to a rarefied gas and a solid body. In the SCF system for dense gases and liquids, these concepts have a conventional meaning, since molecules are constantly interacting with each other.
“Excluded” volume [139]. The movement of a selected particle in a dense fluid phase is hindered by neighboring molecules. They block part of the space and it becomes inaccessible for the movement of the selected particles. If the lattice structure is free, then the center of mass of the particle can be located at any point inside the cell. If the lattice structure is filled, then the center of mass of the particle can shift inside the cell only near its center.
The available volume for the movement of the center of mass in this case is equal to the value V(θ~1) = κ3, where the value κ is the root-mean-square displacement of the molecule from the center; it can be estimated from the theory of harmonic motions in a solid for temperatures above the Debye temperature. That is, the value of κ is found from the parameters of the paired Lennard–Jones interaction potential [139]. In the general case, for any fluid densities θ, the available volume can be estimated as the ratio V(θ)/V(θ = 0) = L(θ)3, where L(θ) = tAV + κ tAA, where the function tAA, characterizing the conditional probability of finding two neighboring molecules A, is defined in Section 2.2. More accurate estimates of the available volume V(θ)/V(θ = 0) are possible if a geometric model [139] is used that refines different positions of neighboring molecules [139].
Lattice softness. The softness of the lattice structure means that the average distance between fluid particles determines the average size of the lattice parameter λ. This value is found from the condition of minimum free energy of the system [140]—it is uniquely related to the parameters of potentials of interparticle interactions without introducing additional parameters. (In a number of situations, one can use the virial theorem to find λ [141,142].) For a gas, this λ quantity is related to the properties of a dimer, while, in a solid, all neighbors are taken into account. An increase in fluid density leads to a decrease in the lattice parameter. This fact correlates well with experimental and molecular dynamics data.
Molecular vibrations. Vibrations of molecules affect the average values of intermolecular interactions and all equilibrium distributions. Small deviations of molecules relative to the average size of the value λ lead [143,144,145] to a temperature dependence of the lateral interaction parameter of the type ε = ε0(1 − uT), where the function u reflects the vibrational motion of molecules. Previously, this form of dependence of the interaction parameter was considered as a convenient fitting function [119,120,121,146,147,148]. This approach [133] makes it possible to express the function u in terms of potential functions without introducing additional parameters.
The listed molecular properties of the effective pair parameter of interparticle interaction preserve the technique of calculating traditional lattice models and greatly simplify the consideration of continuum displacements of particles inside the cell. This reduces the calculation time in the LGM compared to using the technique of the integral equation by two to three orders of magnitude.

4.2. Vapor–Liquid Systems

One of the most popular potentials for describing vapor–liquid systems is the Lennard–Jones potential with parameters: σ (hard sphere diameter) and ε0 (isolated dimer potential well depth) [23]. The values of these parameters are actively used in calculations for any density using the Monte Carlo and molecular dynamics methods. They were determined from experimental data for low-density gases (described up to the second virial coefficient). With increasing fluid density, it is necessary to add triple interactions [23,137,149,150]. Therefore, to use the effective pair potential (εef) of the Lennard–Jones type in the LGM for any densities [151,152,153], the following function was used:
ε AA r = 4 ε ef σ r 12 σ r 6 , ε ef = ε 0 1 d tr Δ 1 r t A A 1 uT ,
Equation (10) reflects the dependence of the effective pair potential on temperature (u) and on triple interactions (dtr) for nearest neighbors (Δ1r—Kronecker symbol) in the form dtr = 0.2(z 1)ε3/ε0 [66,154], where ε3 is the triple interaction parameter. The tAA function reflects the presence of a third particle A nearby (it is defined in Section 2.2). For simplicity, it is assumed that the contributions from concentration and temperature are taken into account separately. For a quantitative description of experimental systems, it is possible to involve contributions from several coordination spheres. A similar structure to Equation (10) for effective pair potentials is also preserved for multicomponent mixtures [155].
As an example, the influence of the considered parameters in Figure 4a describes the concentration dependence of the compressibility factor Z = p/nкT, where n* = nσ3 is the reduced number density, for argon in the volume (σ = 0.34 nm and ε0 = 119K [23]). The comparison was made for the virial expansion (curves 2–4) [156] and for the LGM [151] at T = 162 K [157]. Figure 4a shows that at least five terms of the virial expansion are required to agree with the experimental data and with the LGM.
The stratification curve for argon with potential (10) was calculated taking into account the contribution of the calibration function (inset in Figure 4a), which is necessary to describe the critical region (see below). The density of argon is given in the reduced form ρ/ρc, where ρc is the density at the critical point. Throughout the region, there is agreement between the experimental data [158] and the calculation by the LGM, including the value of the critical parameter β equal to 0.37.
The same approach was used to calculate the stratification curves for the Ar-N2 binary mixture [159]. Curves for different compositions of the mole fraction of nitrogen are shown in Figure 4b.
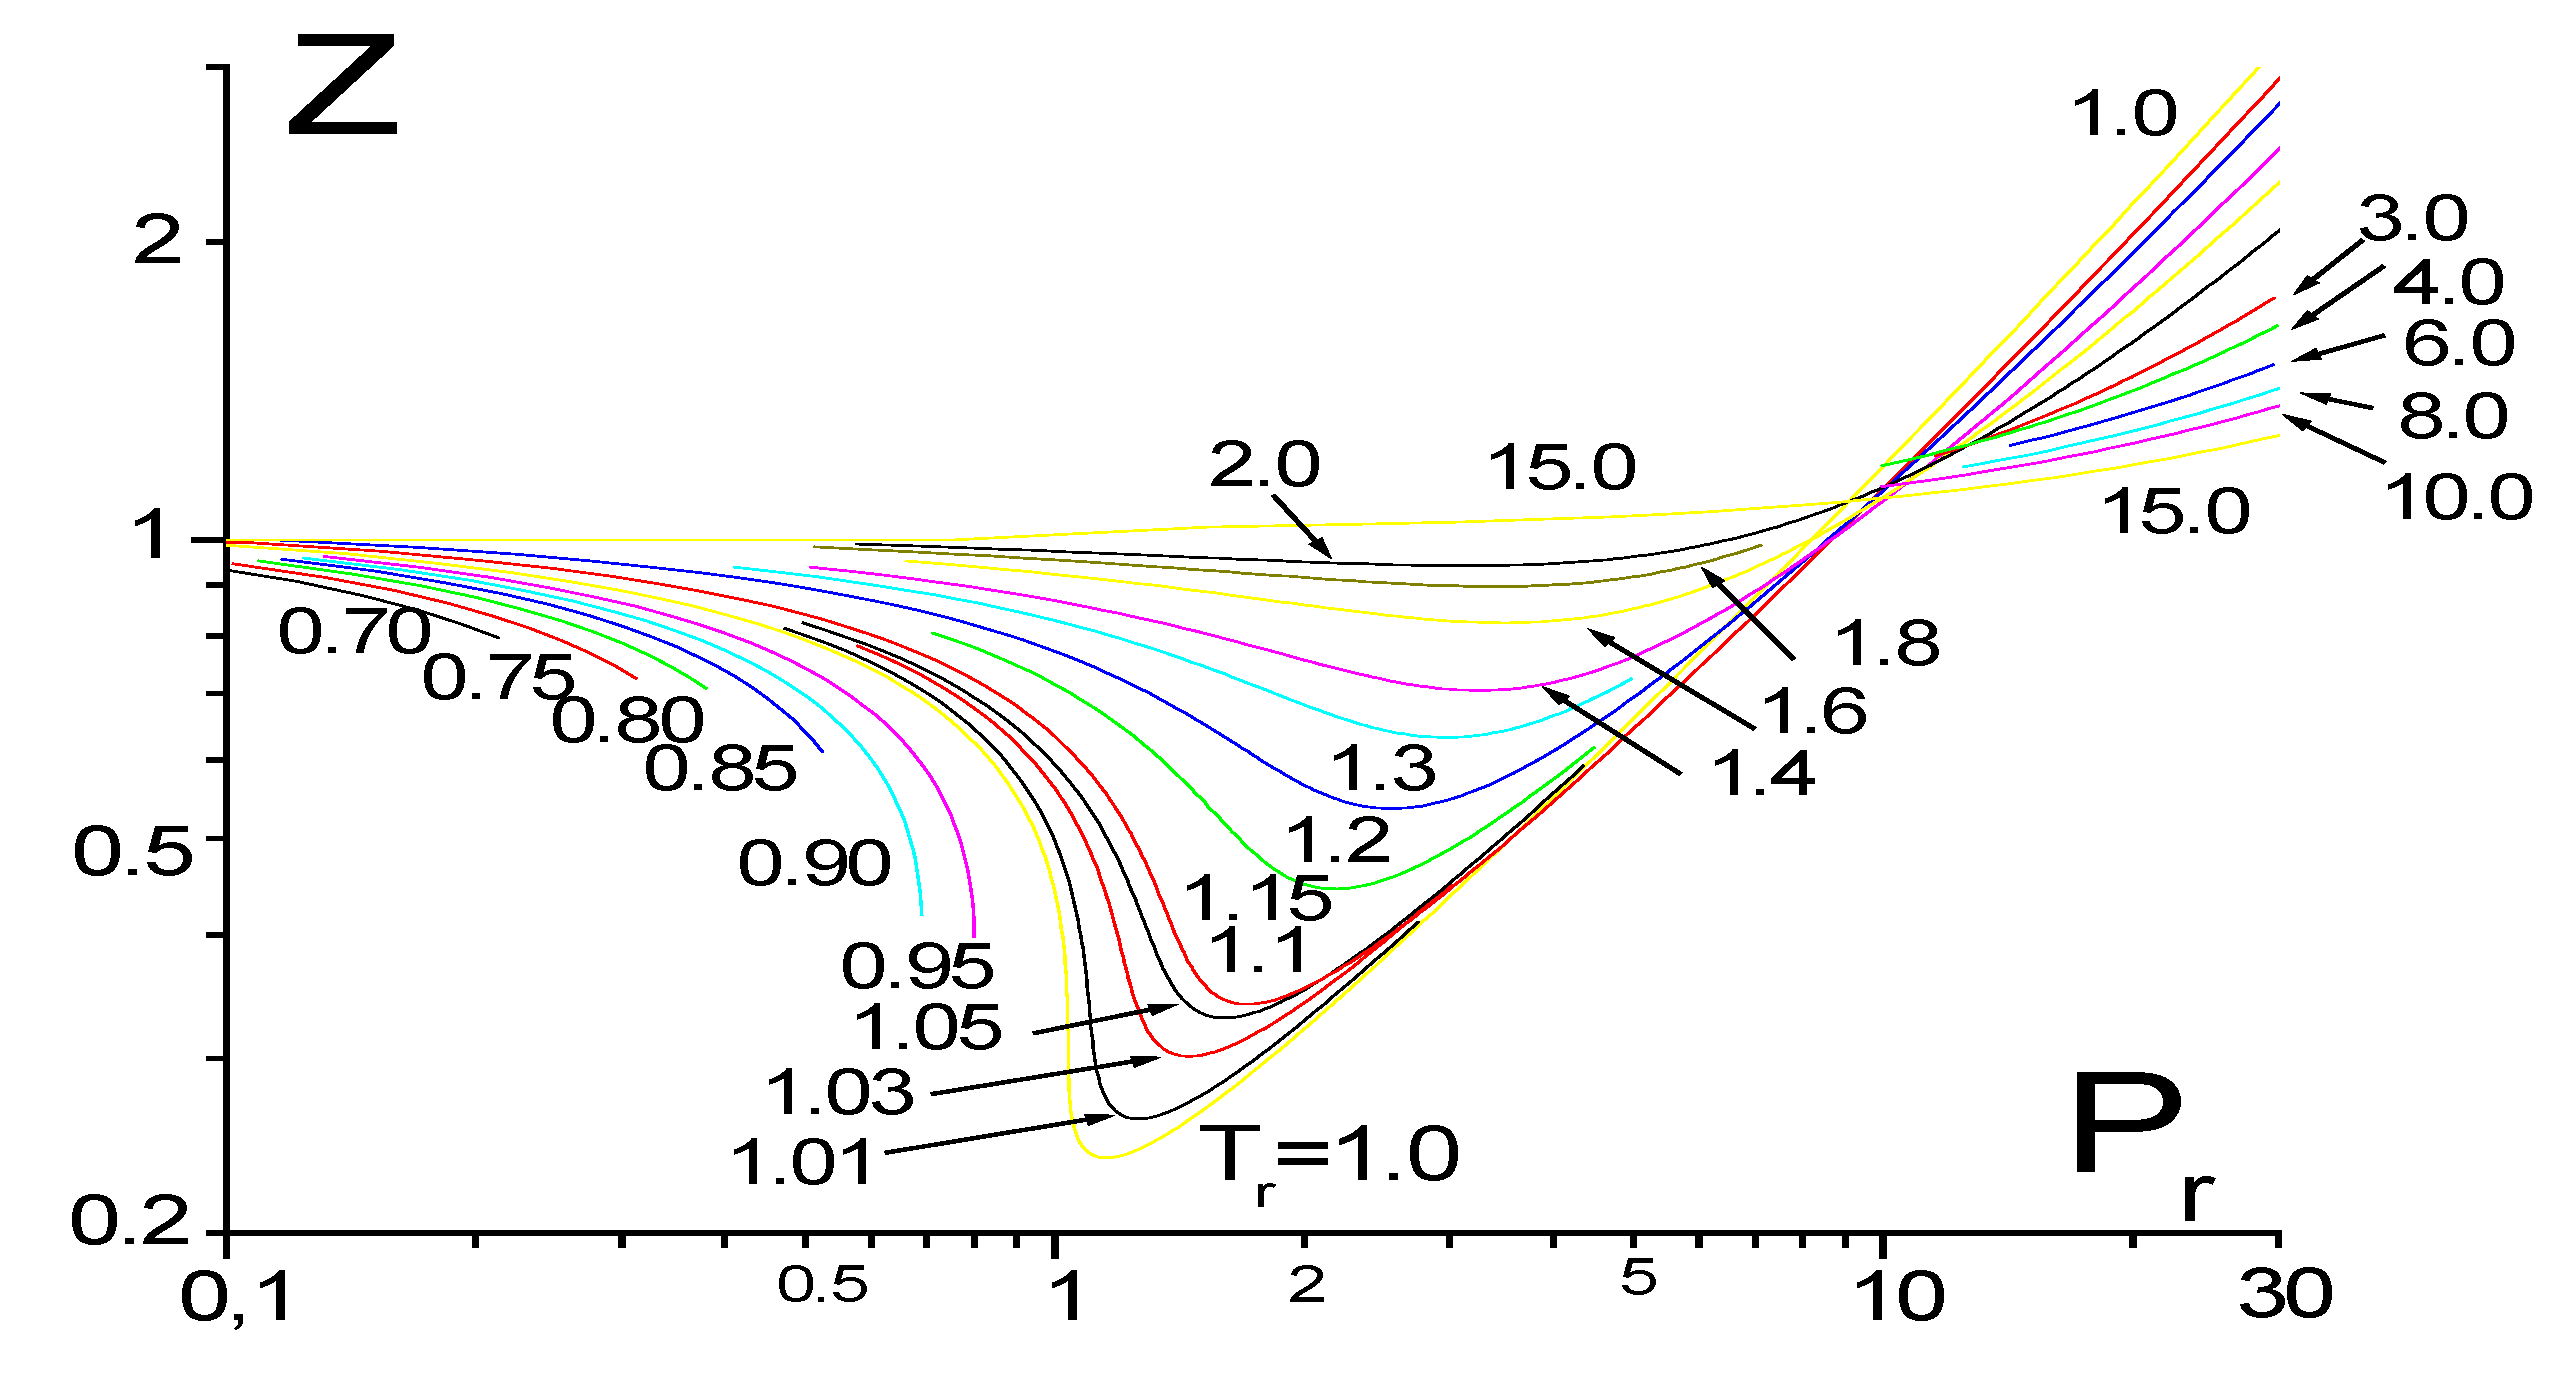
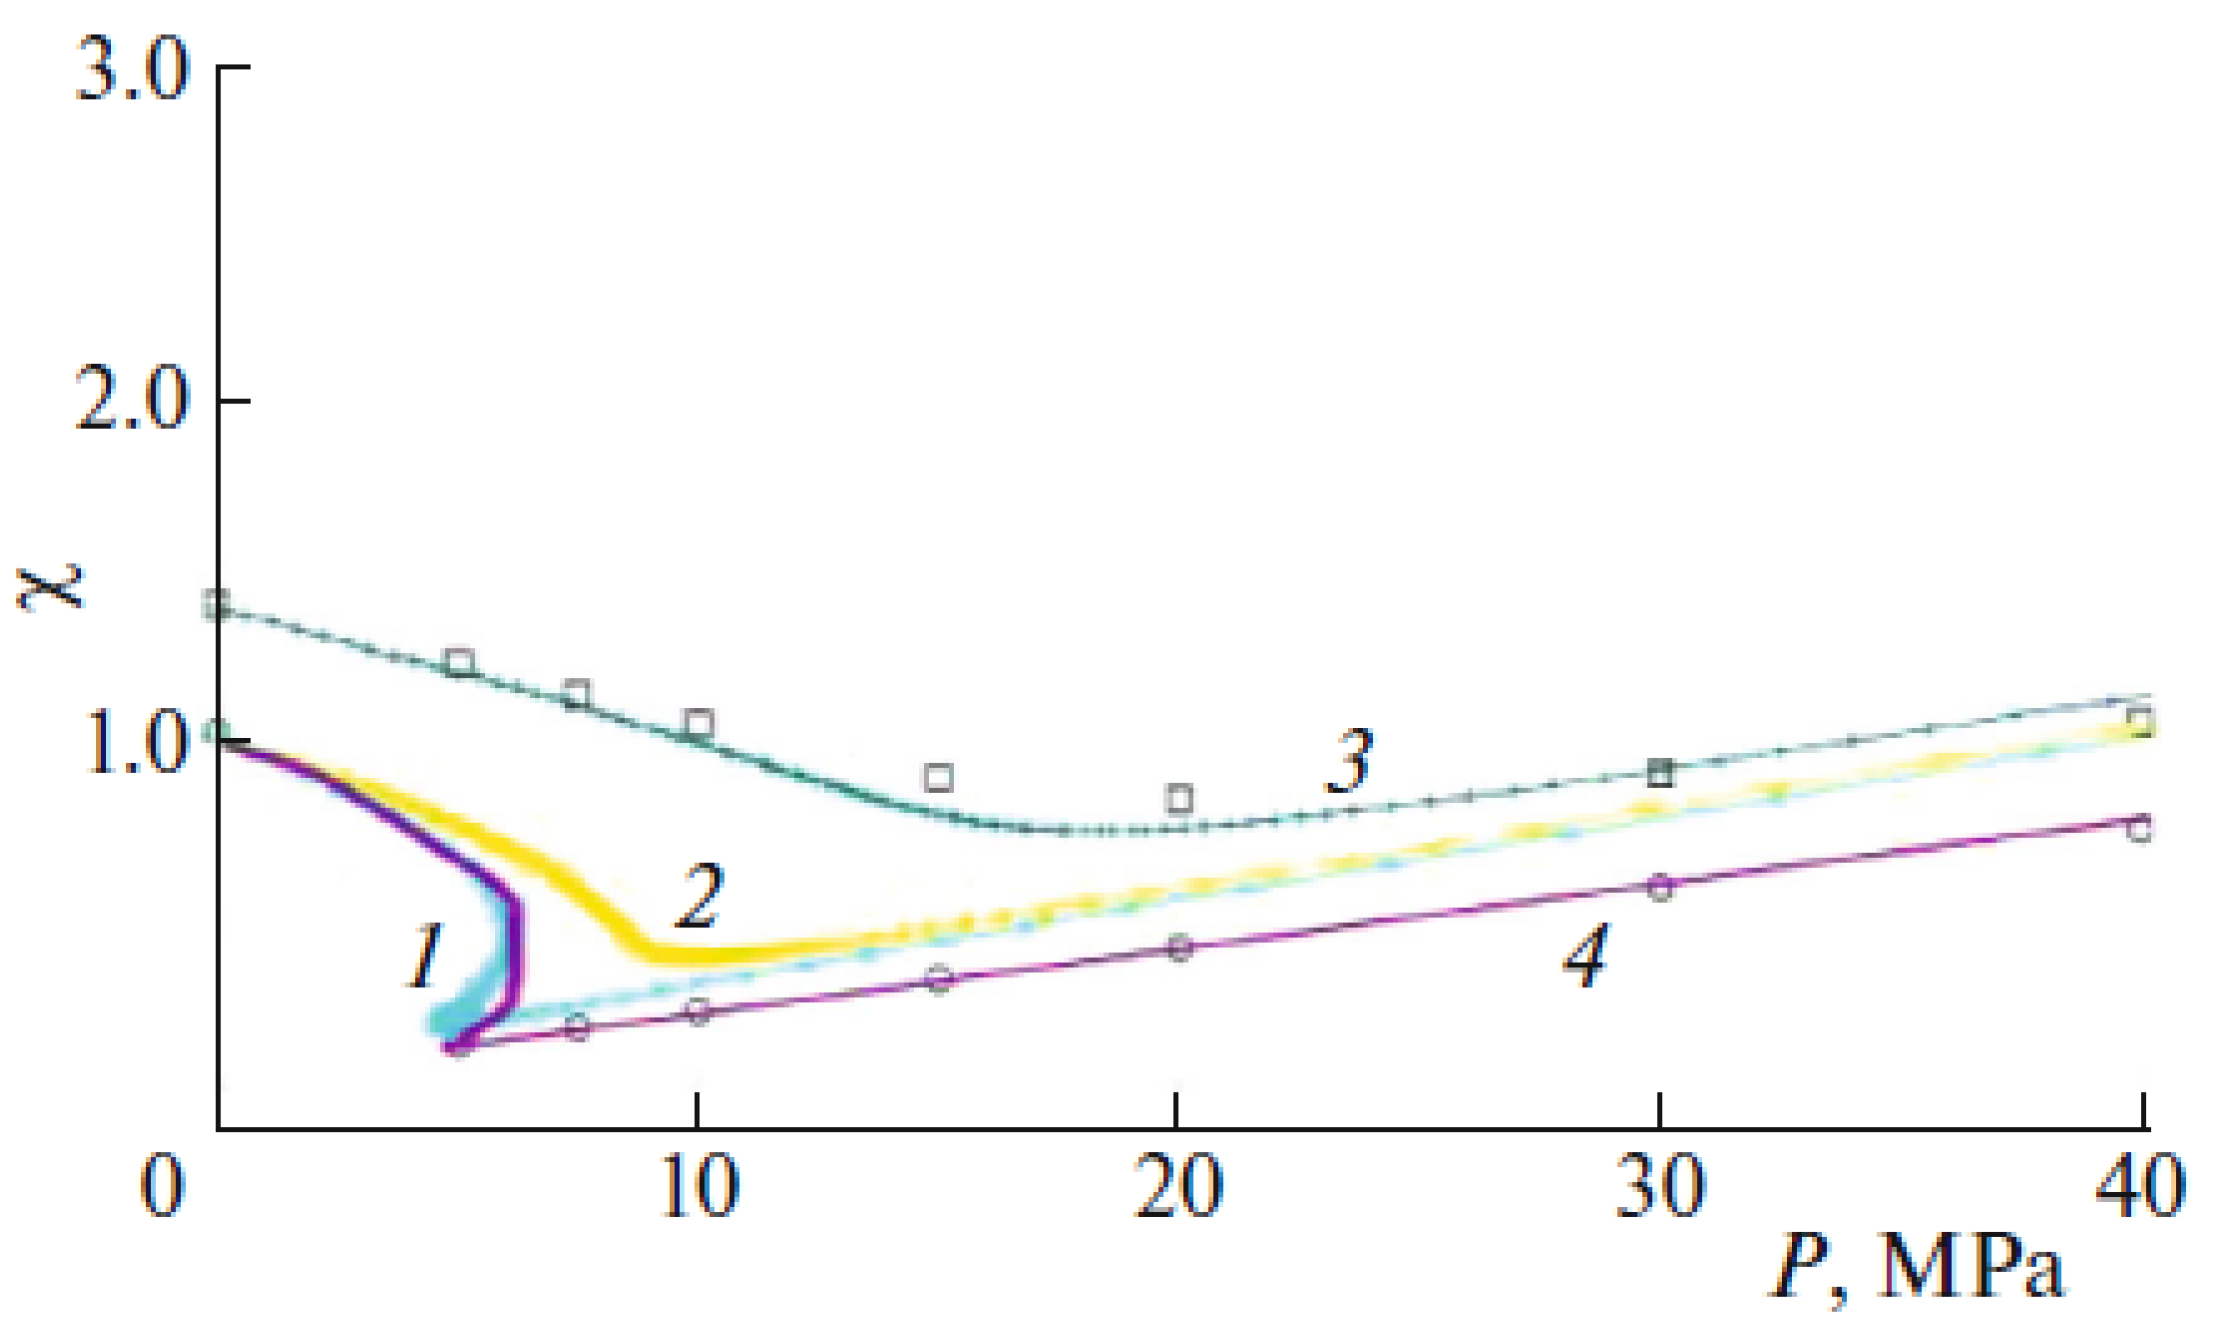
For other gases, the molecular theory based on the LGM gives the same satisfactory agreement with experiments [161]. This is due to a certain extent to the fact that the considered gases do not have specific interactions and obey the law of the corresponding states. For these, a generalized compressibility coefficient was constructed [23,26,156] with the coordinates Z, “reduced” pressure, which is the same for different substances at the correspondingly introduced “reduced” temperatures (all quantities are normalized to their critical parameters). Such a generalized experimental dependence [23,26,156] was described in the LGM with an accuracy of about 3–4% (see Figure 5). These calculations reflect the main properties of Z for different temperatures up to pressures of 1000 atmospheres [152]. If the components of the mixtures do not violate the conditions for using the law of the corresponding states (as in Figure 4b), then the generalized dependences Z can be used for estimates and for mixtures [26]. Curves for different compositions of the mole fraction of nitrogen are shown in Figure 4b.
Figure 5 includes the critical region. In works [134,162,163,164] (based on the ideas of scaling theory [165,166,167]), it was proposed to introduce a calibration function as an approximate method for calculating the equilibrium distributions of components in the LGM near the critical point. This approach separates the contributions in the equation for local isotherms from the short-range potential and from large-scale fluctuations. The last contributions are taken into account by the calibration function. For more details, see [68,134,162,163,164].
Potential functions (10) were also used to calculate the equilibrium characteristics of mixtures at high pressures in the bulk phase [168]. Here, the potential of the LGM to describe the stratification of ammonia–nitrogen gases is shown in Figure 6. The field on the left shows the experimental measurements (abscissa axis—percentage). In the right field, the same points are marked with symbols (abscissa axis—mole fractions) for the same temperatures.
The reason for the deviation of the experimental value from the theoretical one is that the model equations use the rules for combining parameters of the LD-type potential for molecules obeying the law of the corresponding states. This calculation agrees qualitatively with the experiment. The calculation uses the usual concept of the law of corresponding states for all components of the mixture, although for ammonia this assumption is conditional. Nevertheless, the use of LGM provides qualitatively acceptable results, although the degree of deviation of ammonia from the law of corresponding states increases with increasing pressure.

5. Influence of SCFs on Equilibrium and Kinetic Characteristics

While analyzing the specifics of the effect of SCFs on a variety of technological processes, the following three circumstances should be taken into account: (1) an increase in the role of lateral interactions with increasing pressure; (2) shifts in equilibrium concentrations with increasing temperature, which can lead in reaction systems to the implementation of stages that are unlikely for low temperatures (thermal dissociation of water sharply increases the value of the ion product) [2,169]; (3) under SC conditions, the states of the materials of the reaction system change (for example, the state of coke on catalysts or the properties of polymer matrices in membranes change). Nevertheless, the main question remains about changing the rates of the stages that form the gross processes, relating to points two and three. Its decision determines the accuracy of the description of the entire gross process.
The thermodynamic and structural characteristics of condensed systems are described using the methods of statistical thermodynamics based on the knowledge of the potential functions of interparticle interaction. SCF systems are created using CO2 molecules, low molecular weight alkanes, alcohols, freons, water, etc. Such solvents are multicomponent mixtures of low molecular weight substances. To model SC systems, it is necessary to be able to calculate the bulk properties of SCFs and their contacts with the surfaces of solids (non-porous and porous). For polymer matrices, the dissolution of SCF molecules through open surfaces is possible. All these properties of SCF systems can be taken into account within the framework of the unified LGM technique [66,106] discussed above.

5.1. Effect of SCFs on the Characteristics of Adsorption Processes

It was noted above that an increase in pressure always leads to an increase in the density of the mixture components, and this causes a shift in the equilibrium conditions and changes the rates of elementary stages [1,3,170]. This fact affects all surface processes: catalytic, adsorption, membrane, etc. Depending on the composition of the gas mixture, we will conditionally divide practical situations into two cases. The first case refers to a gas mixture with strongly adsorbing particles. For these, an increase in pressure increases the surface concentration of reactants or adsorbed particles.
The second case refers to gas mixtures with weakly adsorbing or inert molecules. In this case, an increase in pressure also increases the near-surface number of molecules, which can affect the competition for filling part of the surface between strongly and weakly adsorbing molecules. This fact is important if the amount of weakly adsorbing molecules in the volume exceeds the proportion of strongly adsorbing molecules. Such competition makes it possible, in principle, to more accurately control the course of the surface process. Many polymeric systems are of this type; their interaction with supercritical carbon dioxide (SC–CO2) has been extensively studied [171,172]. CO2 molecules are a solvent for some polymers, combining many important technological factors such as environmental friendliness, low cost, ease of removal from the polymer, incombustibility, etc.
In paper [173], the processes of chemisorption and physical adsorption were analyzed depending on the degree of surface coverage in the presence in the system of both the main components for the studied surface processes and the influence of the presence of SCF components, which, as a rule, are weakly adsorbing components. Methods for modeling surface processes are given in [66,68].
As an example, typical isotherm curves of the adsorption of component A are shown [173] for a rise in the SCF pressure. As the SCF pressure increases, the surface coverage by component A decreases (see Figure 7); thus, component A is displaced from the adsorbent surface. There is the displacement of the adsorbed molecules of component A from the adsorbent surface upon an increase in the pressure of the SCF for fixed surface coverages θA = 0.05 (1), 0.5 (2), and 0.85 (3). A comparison of Figure 6a,b leads to the conclusion that, on the strongly binding surface, component A is displaced from adsorption sites at higher SCF pressures more slowly and over a broader range of pressures of component SCF than for the weakly binding surface. The same sort of curves will apply for chemisorption—values of partial pressure change (the range of pressure of the basic component A at chemisorption and physical adsorption differs by approximately 4–6 orders of magnitude) and the course of concentration dependences remains similar.
In work [173] the influence of SCFs on the stratification characteristics of the adsorbed particles A is investigated. With adding the component C, isotherms of component A change, and, hence, the phase diagram changes. Additionally, it was found that at a great enough pressure of an inert component C, there is a weakening of the connection between components A. (Here, the two-dimensional situation reflects the real three-dimensional process of SCF interaction with polymeric matrices).

5.2. Effect of an SCF on the Concentration Dependence of the Rate of a Reaction

Relation (2) defines the effective activation energy EABef for a bimolecular reaction [170] as
W12 = UAB/(kAB0θAθB) = exp(βEABef)
where EABef = EABAB − β−1ln(θABAθB) − (z − 1)ln(SA SB).
At low concentrations of reagents, EABef = EAB. At high fluid densities, when the proportion of reagents A and B is small, and the proportion of SCF is large (θC >> θA + θB), then
EABefEAB − (z − 1)(δεAC + δεBC) = EAB + (z − 1)(1 − α)(εAC + εBC).
In this expression, the equivalence αij = α is used for both reagents.
Formula (11) determines the effect of the interaction of the SCF with reagents on the value of EABef. If α < 1, then the presence of the SCF associates around the reagents increases EABef. If α > 1, then the SCF associates decrease EABef. The difference in values of ΔEAB(θ) = EABefEAB indicates the effect of the SCF on the activation energy of the stage.
In that case, when the SCF plays the role of a solvent, then the influence of intermolecular interactions manifests itself in a change in EABef with varying pressure and temperature. In the case of a large value of EABef, the influence of the SCF is small if the rate of the chemical reaction itself remains in the region of the kinetic regime. However, due to the addition of a large amount of inert SCF molecules, with an increase in the pressure in the system, the nature of the flow of the bimolecular reaction can change and move from the kinetic regime to the diffusion regime.
A detailed analysis of the ratios between Eijef for chemical reactions and transport stages was carried out in [170]. The contributions of the total density of the system and the role of intermolecular interactions at different temperatures of the SCF of the system were discussed. The theory of non-ideal reaction systems allows the SCF process to separate into failure contributions from pressure and temperature. In situations where the contribution of temperature predominates, the differences between the values of Eijef and Eij are small, so Equation (1) can be used. If the contribution from pressure is predominant, then the differences between Eijef and Eij limit the region of the SCF for concentrations where the mixture can be considered an ideal one.
Such a molecular interpretation distinguishes the chemical features of reaction systems at high pressures from the collective properties of multicomponent systems. Thus, for water molecules, an increase in temperature of more than ~10 degrees above the critical temperature leads to a decrease in density and water remains as a dense vapor up to very high pressures (almost 10 Pcr) [174].
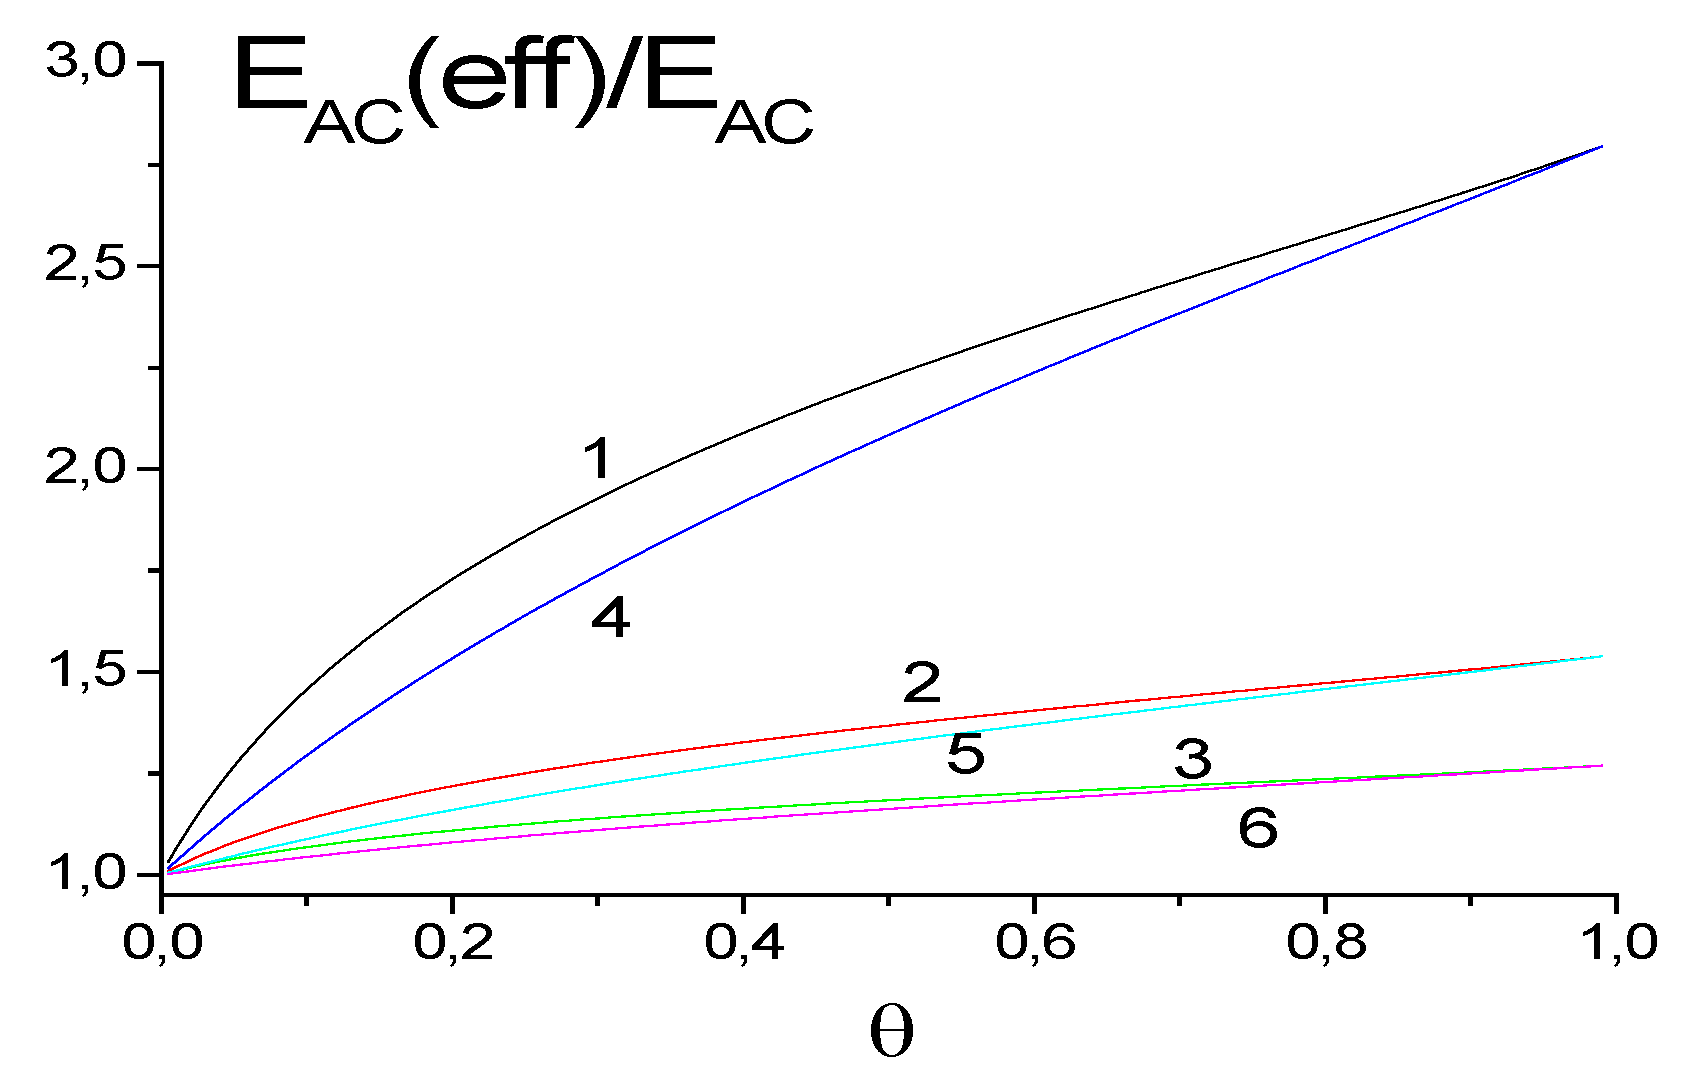
For the case when the SCF is a reactant, the dependence of the effective reaction energy is shown in Figure 8. A three-component system (A, B, C) with the chemical reaction A + B (here θA = θB) is considered, in which the reaction between molecules A and C is also possible (C is the SCF component). The proportion of component C varies and it is demonstrated how the effective activation energy EAC(ef) changes with respect to the energy EAC of the same reaction in an ideal system as a function of the total amount of substance θ = θA + θB + θC.
Here, the SCF manifests itself through lateral interactions and as one reagent; therefore, in general, the role of the SCF component increases, although only lateral interactions make a smaller contribution compared to the contribution from the main chemical reaction A + B (for these, the relative contribution of lateral interactions reaches values of 4–5). Obviously, an increase in the activation energy of the parallel stage A + C reduces the contribution from lateral interactions (curves 3 and 6).
The theory of reaction rates in condensed phases [66,68] demonstrates that, under supercritical conditions, intermolecular interactions cannot be ignored even for an inert supercritical component, which may exert a significant effect on the rates of elementary processes.
The curves shown in Figure 8 indicate the characteristic intervals of possible deviations from the law of mass action in the typical diapasons of supercritical processes in the gas phase, in the temperature and activation energy, which differs from a process in an ordinary gas atmosphere at 1 atm. An increase in the density of the supercritical component decreases the probability of the reactants meeting one another and the SCF–reactant lateral interactions, though comparatively weak, stabilize the initial states and reduce the rates of the reactions. The latter circumstance is significant for most reactive reactants, such as ozone [2,175]. The calculations were carried out for the entire SCF density range, so it can readily be seen from the calculated curves whether it is possible to neglect the interactions between the SCF molecules under the given conditions. (If the lateral interactions can be neglected, then EAB(ef) = EAB at any θC.)
In many cases, such a state may arise with an increase in the density of inert SCF (θ → 1), when the reagent transport stage begins to limit the processes, especially at low concentrations of the main chemical reagents. This problem, however, does not occur if the SCF component is one of the reactants. In this case, the bimolecular stage A + C transforms into a quasi-monomolecular one. In general, when analyzing the role of the SCF, one should take into account the possibility of changing the mechanism of the process under study and the state of the accompanying materials, in addition to traditional ideas about the increase in the rate of stages with increasing temperature and its decrease with increasing pressure, together with a decrease in the self-diffusion coefficient and an increase in the viscosity coefficient.
A comprehensive analysis of the entire system as a whole is required because a change in one of the thermodynamic parameters (pressure or temperature) can worsen the implementation of elementary stages. Using the concepts of specific mechanisms of gross processes, the kinetic equations of non-ideal reaction systems make it possible to relate the characteristics of the SCF processes to similar processes under normal conditions.

5.3. Effect of an SCF on the Concentration Dependence of the Dissipative Coefficients

The theory of non-ideal reaction systems provides ways to consider transport characteristics. The simplest characteristic of molecular transport in mixtures is the self-diffusion coefficient of component i (1 ≤ i ≤ (s − 1)), which characterizes the thermal motion of type i molecules under equilibrium conditions. In practice, the self-diffusion coefficient is usually associated with the motion of an isotopic label locally introduced into some region of the system and the temporal distribution of the label over the rest of the solution is monitored. For labeled type i molecules, we have the following expression for the local partial self-diffusion coefficient [68,176]:
Di* = zfg* UiV/θfi,
where zfg* is the number of possible hops to nearest-neighbor sites g for the fth cell along the direction in which the label moves. The expression for wiV is given by Formula (2). This refers to the bimolecular hop of molecule i, i + V → V + i, in which the first “reactant” is a moving type i molecule, and the second “reactant” is the vacancy into which the molecule i is transferred. The activation energy of this process is EiV = 0 for a bulk phase and EiV > 0 for the surface migration step. With the growth of the full density of a system, the fraction of free volume decreases and the factor of self-diffusion of any particle decreases.
The apparent activation energy of the self-diffusion of component i is written in the form of Formula (11):
EiV(ef) = EiVβ1ln(θiV/θiθV) − (z − 1)ln(Si SV),
For high SCF coverages, it follows from Formula (13) that ΔEiV = EiV(ef) − EiV = (z − 1)(1 − 2α)εAC. For α = 0.5, ΔEiV = 0 and the decrease in the self-diffusion coefficient is only due to the decrease in the free volume fraction.
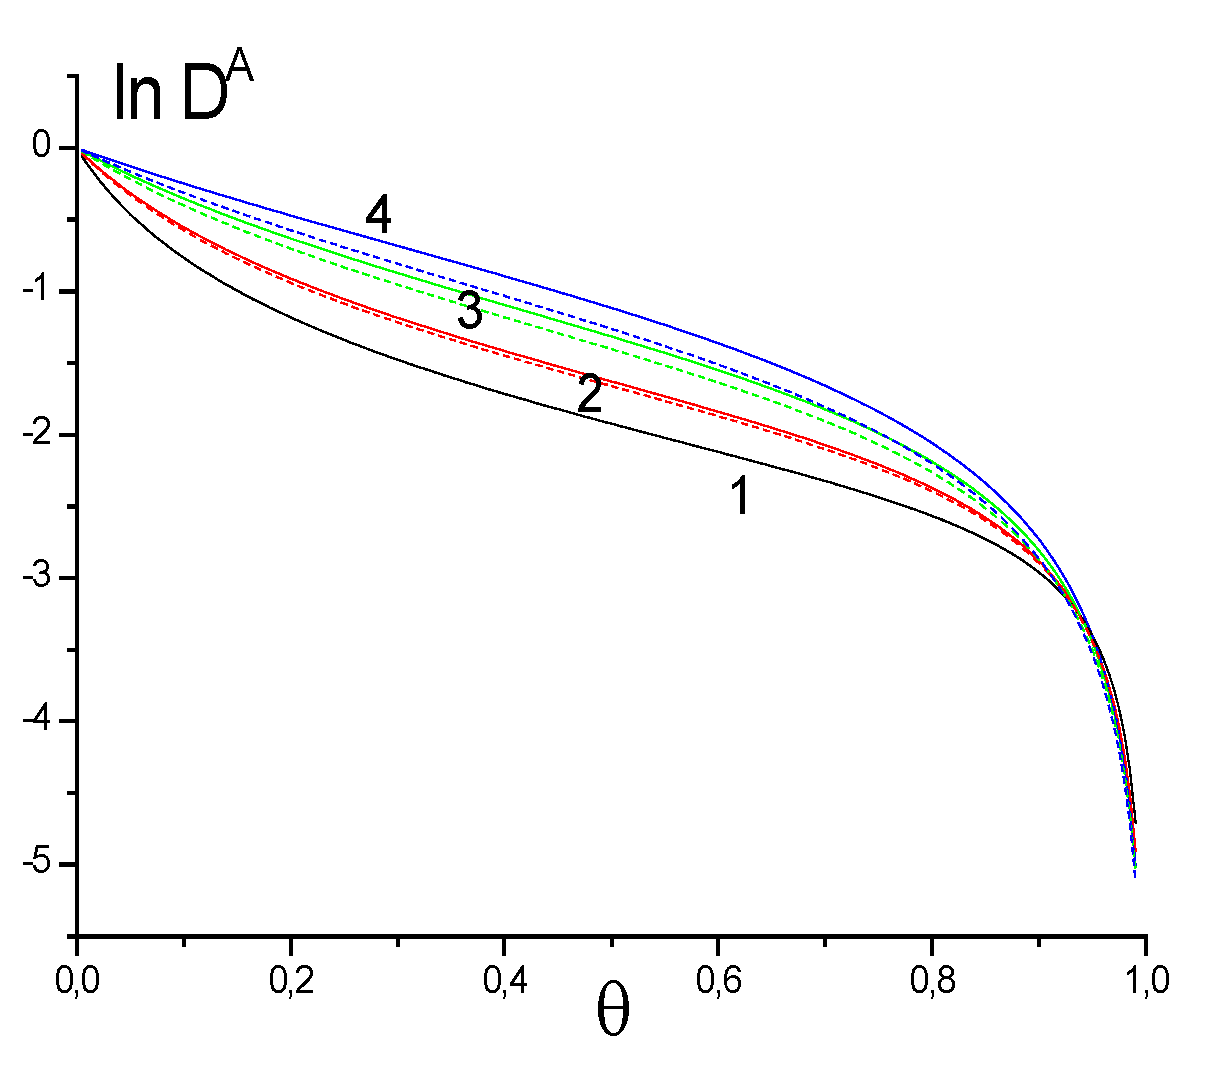
Figure 8 plots the concentration dependences of the self-diffusion coefficient of the main component A (DA) in the SCF bulk (EiV = 0). The effect of the density of the supercritical component was studied as a function of the density θC varying between zero and 1θA for two main component coverages, θA = 0.01 and 0.1.
In these calculations, we fixed the mole fraction of the main component A relative to the supercritical component C; accordingly, all curves begin at θ = 0. The curves descend as the total density increases. This is due to the decrease in the free volume, which is necessary for molecular transport. The self-diffusion coefficients of the SCF in the bulk are similar to those of the main component. The behavior of the DC curves is similar to the behavior of the curves shown in Figure 9. The concentration dependence of the self-diffusion coefficients depends strongly on the nature of the supercritical component. The stronger the interaction between SCF molecules, the greater the extent to which diffusion slows down with an increasing SCF concentration. The self-diffusion coefficient decreases as the temperature is raised.
Shear viscosity. Another important transport characteristic is the shear viscosity. Knowledge of this characteristic is necessary for calculating flow velocities in various reactors. Like the self-diffusion coefficient, viscosity is expressed in terms of the thermal velocities of molecules. The local shear viscosity ηfg for spherical molecules of comparable sizes is expressed as follows [25]:
η = j = 1 s 1 x j η j 1 1 , η j = θ j / U iV , x i = θ i / θ ,   θ = i = 1 s 1 θ i ,
where xi is the mole fraction of component i and θ is the total coverage of the system.
For pure components, it follows from this expression that η depends on temperature as T1/2 and depends linearly on the density. For high densities, we have an exponential temperature dependence, as in Eyring’s conventional model [31]. Equation (14) allows viscosity to be calculated for any composition of a multicomponent mixture.
Figure 10 plots viscosity versus the total mixture density θ. In these calculations, we fixed the mole fraction of the main component A relative to the supercritical component C; accordingly, all curves begin at θ = 0. With this method of expressing the amount of the main component A, the difference between the viscosities at θA= 0.01 and 0.1 is smaller than in the case of the fixed amounts of component A. The concentration dependences of viscosity are normalized to the viscosity of component A in a rarefied gas. The calculations were carried out at a fixed εAA value for component A and a decreasing ε0 value or an increasing γA = εAA/εCC ratio. An increase in γA leads to an increase in the energy of the lateral interactions between the main component A and the SCF. As a result, the viscosity of the system decreases. Therefore, by changing the SCF, it is possible to vary the viscosity of the system in a fairly wide range. This range is temperature-dependent: it widens with increasing temperature.
The calculated data indicate that the self-diffusion coefficients and viscosity characterizing the transport properties of the entire supercritical system depend on the density of the supercritical component to a lesser extent than the reaction rates. This is due to the fact that the thermal velocities of molecular migration, which determine both of the transport coefficients, depend on temperature much less strongly than chemical reactions.
The above results in Section 5 correlate well with the known similar relationships for the same steps occurring at atmospheric pressure. At the same time, they were obtained by an analysis of the processes in a very wide SCF density range. The validity of the above inferences throughout the pressure and temperature ranges typical for supercritical processes suggests that this good correlation is a more general point than a simple corollary of the law of mass action.

6. LGM and Dissipative Coefficients

Real technological SCF processes are implemented in reactors and for their modeling it is necessary to know not only the equations for describing chemical reactions, but also the general thermophysical flows of momentum, energy, and mass transfer. As noted in Appendix A, the dissipative coefficients are directly related to the elementary rates of transport processes; therefore, the same model potentials of intermolecular interaction are used for their calculation, both for chemical reactions and equilibrium distributions (according to Section 3.1). Therefore, the effective pair potential (10) was used to calculate all dissipative coefficients. These calculations were carried out both for individual components (coefficients of self-diffusion, viscosity, and thermal conductivity) and for binary mixtures (coefficients of mutual diffusion and viscosity). These calculations refer to the group properties of simple fluids, which reflect the general patterns for many molecules that obey the law of corresponding states. There are no strong specific bonds for molecules of this kind. Comparisons were made with the so-called generalized diagrams, which were actively used earlier in technological calculations. Specifying the properties of molecules, such diagrams correspond to an accuracy of the order of 3–5%.
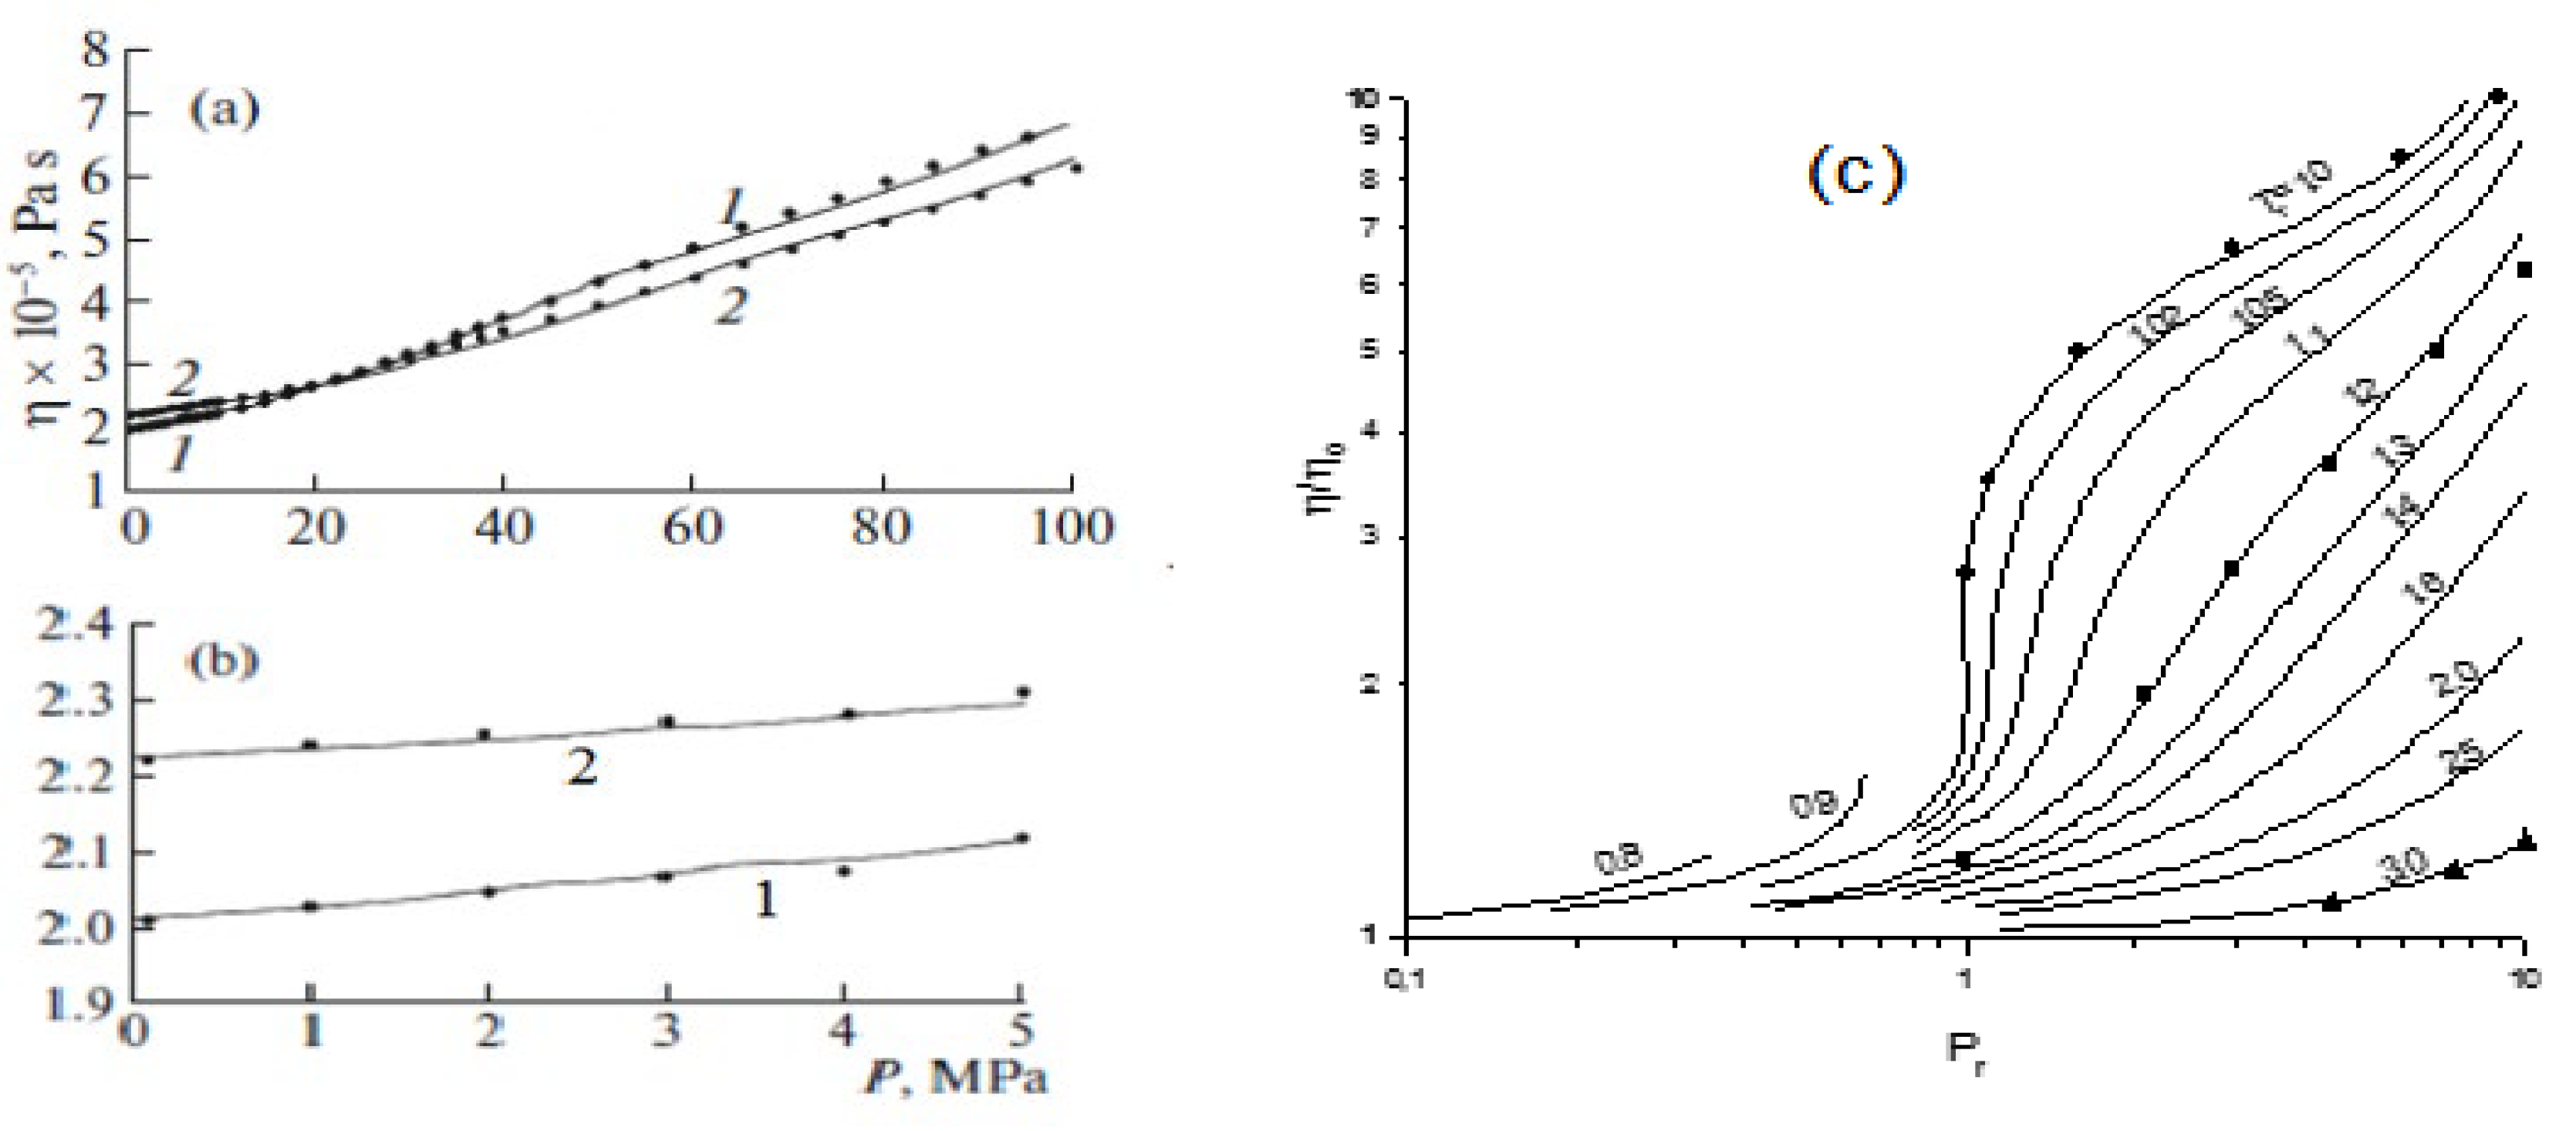
Calculations of shear viscosity coefficients for specific molecules and their generalized normalized values of the coefficients are shown in Figure 11. The accuracy of these calculations is about 5%.
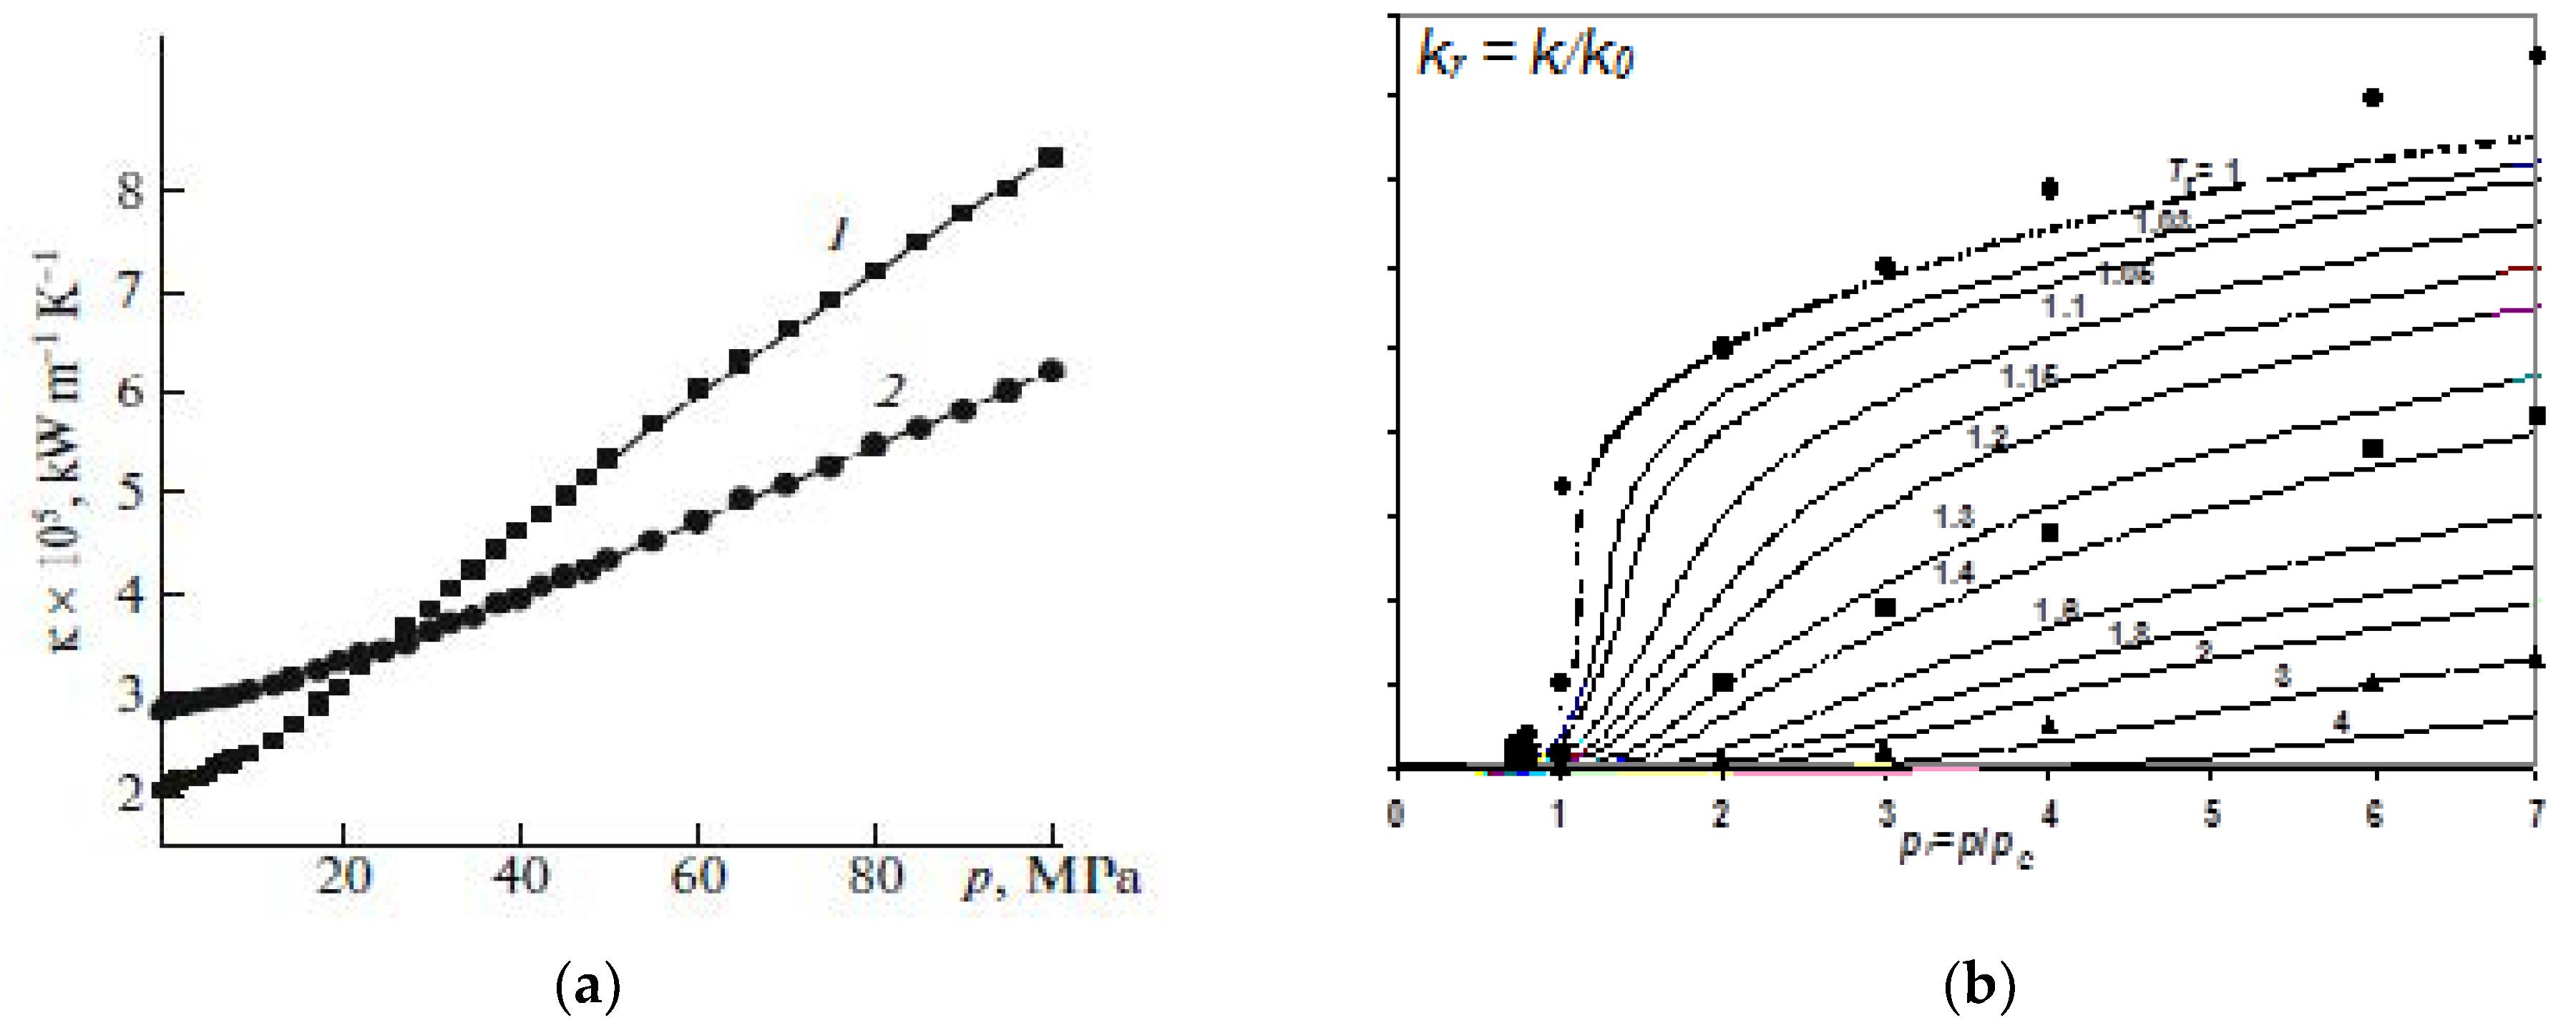
Another important dissipative coefficient is the coefficient of thermal conductivity. For dense gases and liquids, this coefficient is calculated based on the simulation of two channels of heat transfer: the diffusion mechanism of transfer of atoms and/or molecules in space through a selected plane (see Appendix A), and the mechanism of particle collision among themselves, when no movement occurs through a selected plane of particles from different half-spaces (this mechanism was first introduced for rarefied gases by Enskog [178]). Calculations of the thermal conductivity coefficient are demonstrated for the bulk phase [158,177] (Figure 12a) and for its generalized dependence [26] (Figure 12b).
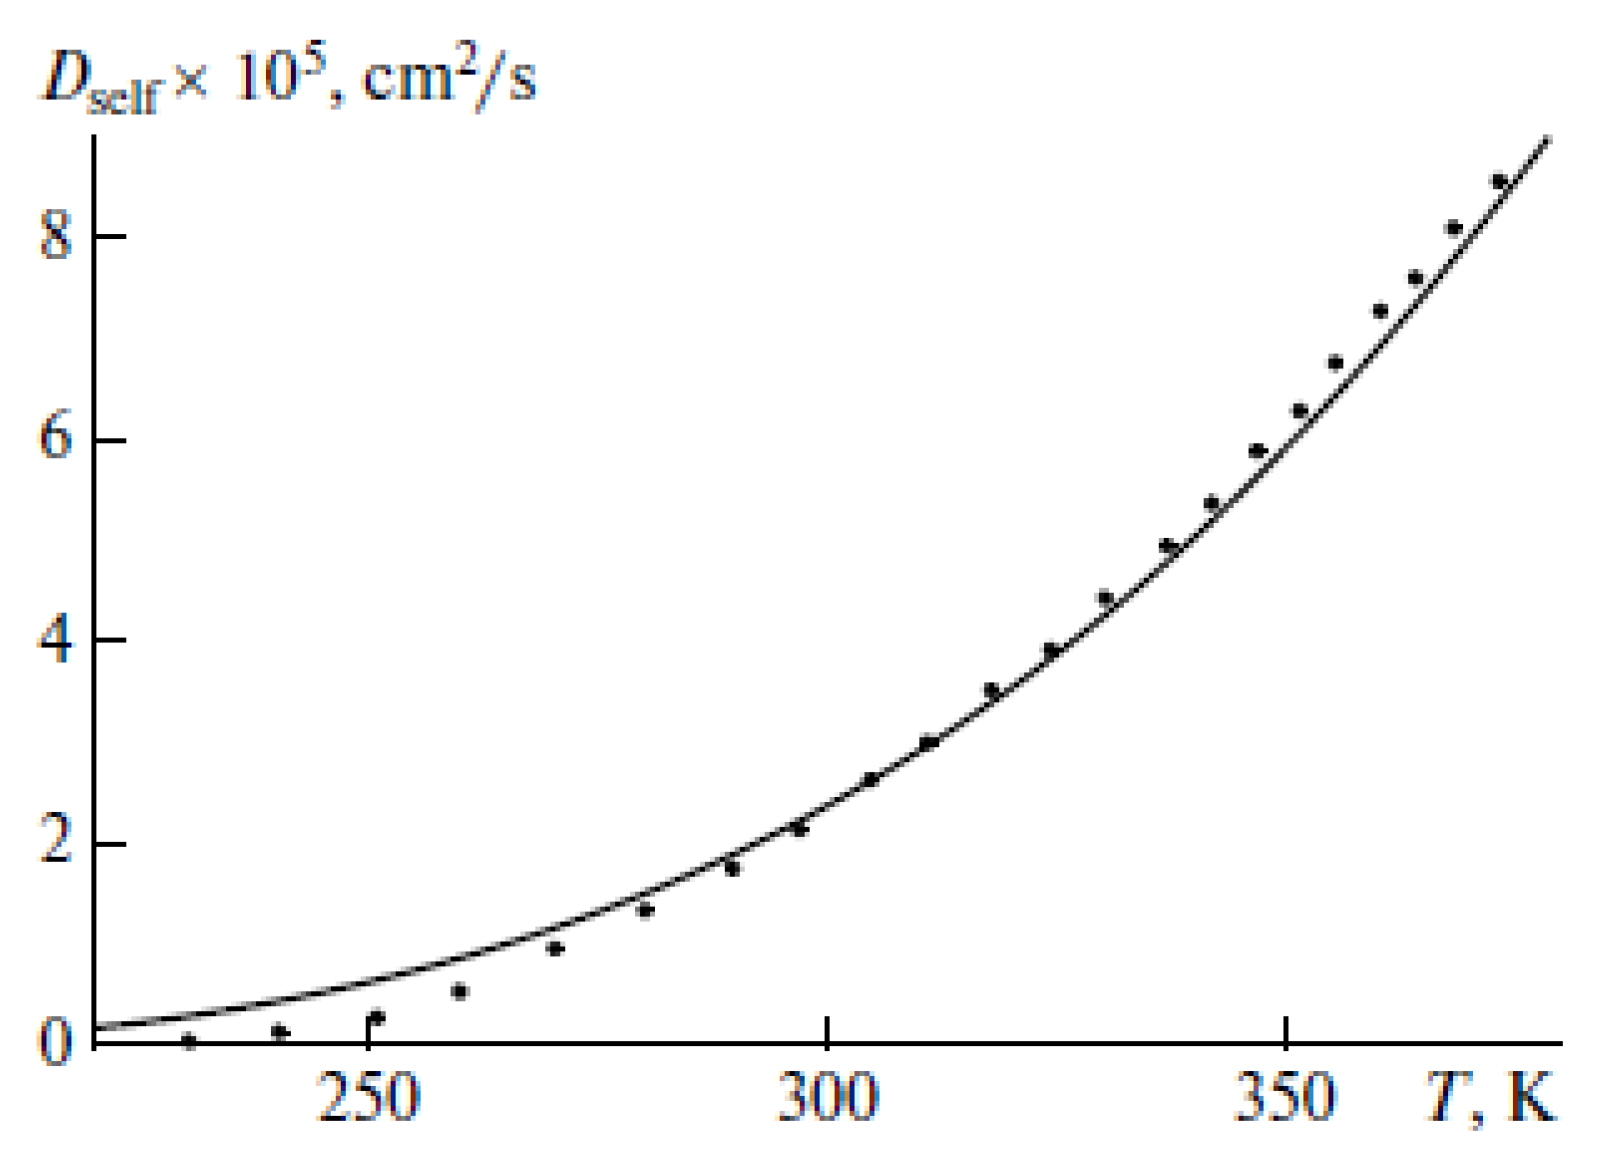
For multicomponent mixtures, the self-diffusion and mutual diffusion coefficients are necessary for modeling mass transfer processes. These coefficients are shown in Figure 13a,b. The self-diffusion coefficient characterizes the motion of a labeled particle in a one-component system under the condition of a complete equilibrium distribution of particles within the system. The coefficient of mutual diffusion characterizes the nonequilibrium of a binary system with respect to its composition. Experimental data on the indicated mass transfer coefficients are presented in [26] with the help of weighted average correlations, which make it possible to display both types of coefficients in wide ranges of temperature and pressure changes. In Figure 13b, the interdiffusion coefficients refer both to individual gases (argon and nitrogen) and to their mixtures.
Weighted average correlations over gas densities were actively used for approximate estimates of various characteristics. For shear viscosity coefficients of binary mixtures, the approach of Dean and Steele was popular (cited in [26]). Based on experimental data for mixtures of non-polar dense gases (light hydrocarbons, and hydrocarbons with inert gases and air components), an approximation expression was proposed that is almost linear in the logarithmic scale. The numerical values of this approximate formula for the experimental data are shown in Figure 14 by thin lines.
Figure 14 compares the dependences ηmm0 (where the denominator ηm0 is a normalization factor to the properties of a rarefied gas) on the reduced density ρrm, obtained for the Ar − N2 binary mixture for three values of τ according to this empirical formula and to the LGM (thick lines are the calculation of the LGM [160]). Here, the reduced temperature τ = T/Tcr = 0.75, 1, and 3, where Tcr is the critical temperature reflecting the change in the value as a function of the composition of the mixture.

7. Extension of the Models

This section briefly mentions the directions where approaches based on the LGM have been developed. Above, the components of the mixture were assumed to be approximately commensurate in size in order to singly occupy a cell of the lattice structure, and a spherically symmetric pair potential was used for the model interaction potential. These restrictions were lifted in subsequent works when nonspherical effective potentials were considered, jointly taking into account electrostatic contributions with the Lennard–Jones potential. Also, the kinetic equations are discussed below in the LGM, which are necessary for describing three-aggregate states.

7.1. Nonspherical Potential Functions

Refusal to use spherically symmetric effective pair functions (10) has been considered in the framework of lattice models since the beginning of their development [119,120,121,122] (see also [179,180,181]). This direction of work made it possible to move to a more accurate accounting of the size of molecules and their shape, which can differ greatly from spherical ones. This includes models of interactions with local atom–atom potential functions for individual functional groups of molecules, as well as their simplified description, which involves the use of energy contact interaction parameters.
As an example of the development of such approaches, a model was considered in [182] that makes it possible to take into account the differences between hard spheres of particles and an integer number of cells. Thus, one of the main SCF components, the CO2 molecule, has noticeable differences in shape from a spherical one. The ratio of its long and short axes is 1.38. As an example, Figure 15 shows the compressibility factor χ = PV/(PV)s of CO2 molecules [183], where the product of pressure and specific volume (PV)s refers to normal conditions. The calculations were carried out for different potential models: curves 1–3 are given for a single-site model; curve 4 reflects the difference in the shape of the hard sphere of the molecule. (For comparison, curve 2 is given for the strong contribution of the triple interaction).
The discussed modification of the potential is better than the experimental curve [184]. (Figure 15 presents the compressibility factor described by the theory with accuracies of up to ~4%). Curves 1 and 4 for a temperature of 272 K reflect the separation of CO2 molecules (Tcr = 304 K). Calculations of the separation curve of CO2 molecules demonstrate a number of differences depending on the interaction potential; their consideration depends on the goal of modeling the processes with their participation.
The [182] approach also reflects the possibility of taking into account different energy contact interactions in nonspherical molecules. Such potential modifications can be proposed for other SCF components of mixtures and for the reactant molecules themselves. The refinement of differences in the shape of molecules from spherical is important for the calculation of all dissipative coefficients. When modeling processes inside porous materials and on open surfaces, the role of molecular asymmetry increases, since the spatial distribution of molecules is additionally affected by the surface potential of the solid. The nonsphericity of molecules is important in the analysis of short-range order and in the transition to the appearance of long-range order.

7.2. Water Molecules

Water is a component that is actively used in SCF processes. To expand the possibility of using LGM approaches with different potential functions, in [185,186] a potential was considered with a combination of the contributions of the dipole potential and the Lennard–Jones potential and simultaneous generalization according to a more general statistical description: direct correlations in the QCA were taken into account instead of the average field description of interacting molecules [187,188]. Previously, it was known [32,33,108,109,110] that the use of only electrostatic interaction is not enough to describe the thermodynamic characteristics of water.
The joint allowance for the dipole potential and the Lennard–Jones potential made it possible to improve the quantitative description of the experimental data [189,190]. In particular, it was found that the LGM describes the stratification curve of water with the same accuracy as for argon. The microscopic nature of the LGM makes it possible to obtain a description of dipole systems without resorting to the macroscopic concept of permittivity. The same approach can be applied to many other polar liquids. On the other hand, the LGM [185,186] used in [191] makes it possible to describe the experimental data on the self-diffusion of water molecules [190].
In this work, we studied the temperature behavior of the water self-diffusion coefficient. This process can be written in the form of the bimolecular reaction (H2O)f + Vg = Vf + (H2O)g, in which the numbers of the neighboring sites f and g are used as indices and the symbol Vg denotes a vacant site with the number g, i.e., the diffusion of water molecules is a special case of a bimolecular reaction occurring on the f and g sites.
The theory allows the determination of the water self-diffusion coefficient and the study of its temperature dependence (Figure 16). Figure 16 presents the water self-diffusion coefficient described by the theory with accuracies of up to ~8%. Our calculations were performed under the condition that the considered jump of a molecule to the neighboring vacancy occurs much more rapidly than the local rearrangement of the overall environment. According to the Frenkel hypothesis [192], the transition to the thermal motion of molecules is associated with the clearly correct hypothesis of a weak change in the state of neighbors when the considered molecule jumps. Assuming [31] an equilibrium distribution of its neighbors would contradict the logic of the process: for a selected molecule to move, it is necessary that its analogous neighbors are quickly attuned to the transition state of this step. Many jumps of the neighbors are required for one jump of the considered molecule to occur.
By comparing the constructed theoretical curve with our experiment’s results [185], we found the optimum value of parameter α for the water molecule energy parameters from [193]: α = 0.65. (Note that the same experiment can also be approximated by molecular dynamics [194].) The obtained good agreement testifies to the adequacy of the lattice model and the validity of its assumptions. The α value above demonstrates the relatively low activation energy that a water molecule must overcome during a jump in the course of this reaction.

7.3. Kinetic Equations

The mathematical formulation of the second law of thermodynamics is written as the inequality dSdQ/T, where Q is the amount of heat [20,21,22,111]. To calculate the change in entropy during the transition processes between different initial and final states, it is necessary to know the state of the system at two points (the equal sign refers to reversible processes). The transition between initial and final states is described by kinetic equations, which determine their key importance in modeling any technological processes [112].
Currently, kinetic theory at the atomic and molecular level in the lattice-gas model (LGM) [66,68] can be used in almost the entire time range, from the characteristic times of atomic vibrations to macroscopic, including equilibration times. The theory considers the full set of elementary processes of movements of molecules and their chemical reactions occurring in the system on the set of lattice sites. To construct the general structure of the kinetic equations of the lattice model, we assume that the lattice sites are not equivalent to each other. The nature of the inhomogeneity of the lattice sites is considered known and constant over time. From a physical standpoint, the nonuniform distribution of particles is due to both the interaction between the particles of the system and the possible additional influence of external fields or interactions. The formulation of the problem under consideration allows covering from a unified point of view a wide range of issues related to the nonuniform distribution of particles at the gas–solid interface: the spatial distribution of the particles on a uniform surface, the presence of ordering in them, changes in the distribution of atoms of the solid adsorbed particles along the normal to the interface, and the distribution of particles laterally interacting on the nonuniform surfaces and, correspondingly, in any three-dimensional volume of the porous body. General ideas about the construction of the kinetic equations in the LGM are described below in Appendix A.
The LGM provides a unified approach to modeling equilibrium and kinetic processes in three states of aggregation. It uses a single set of energy parameters to describe different stages of a multi-stage gross process both in kinetics and in the equilibrium state.
Many practically important circumstances, such as the presence of several heterogeneous phases in systems, the multistage nature of the overall process, the presence of external fields, etc., lead to the complication of the structure of the kinetic equations. Particularly important in this regard are the ratios of the relaxation times of the reactants in nonequilibrium states, which must be taken into account when modeling using kinetic equations.
All these kinetic equations should be built based on the theory of non-ideal reaction systems [66,106], taking into account all possible options for changing the potential functions of intermolecular interaction. Accordingly, equations were adapted to describe the processes in complex porous materials [68], in which phase and supercritical states are realized. For these, their own equations of state and equations for dissipative coefficients were also constructed. Such developments led to the creation of microscopic hydrodynamics [68]. This describes the processes of porous systems, inside which chemical and/or catalytic reactions take place in the fields of pore walls, in the presence of vapor and liquid phases. In the same way, the LGM methods made it possible to develop approaches for the formation of new phases [115] taking into account the microscopic description of their interfaces (such processes are often implemented in SCF). New kinetic equations have also been developed that reflect the consideration discussed above for differences in molecular sizes [195] and the possibility of the presence of charged particles in reaction systems, including electron transfer [196,197].
At present, the kinetic equations in the MGM have reached the general level of describing all three-aggregate states from a unified position [115,196,198], starting from the elementary stages of changing the position of particles in space and/or elementary chemical transformations. This makes it possible to simulate many processes that are implemented in SCFs, associated with a change in the phase state of materials and chemical processes occurring in the SCF conditions. As an example, we can note the development of the fundamentals of the process of swelling of polymer matrices [195]. In this work, a molecular model for the sorption of low molecular weight molecules, accompanied by a change in the volume of the polymer, is proposed. The kinetic equations make it possible to relate changes in the local densities of the sorbate and fragments of polymer chains to each other, although it should be noted that there is, up to now, no complete theory of the swelling of polymers in SCFs. However, the analysis [170,173] of separated stages shows that SCFs can rather strongly affect the state of the adsorbents and catalysts that can qualitatively be observed in the studies of the combined effects of SCF–CO2 and ozone on coke-like deposits on a surface of Pt–Re/γ-Al2O3 bimetallic reforming catalysts [199].

8. Conclusions

This review presents two levels of discussion on the modeling of SCF processes. The traditional level reflects the specific modeling methods used to describe the physicochemical characteristics of the systems under study, the rates of chemical reactions, and dissipative coefficients. In this regard, LGM-based approaches are presented as universal modeling methods for three-aggregate states of systems. A new level of discussion of the applicability of the LGM is associated with the important circumstance of agreement with the second law of thermodynamics when the models for calculating the rates of stages and the equilibrium distribution of components must be consistent with each other. Otherwise, the models will belong to different classes and their molecular parameters will not be preserved when discussing different modes of the process, which makes it difficult to model gross processes. It should be recalled that the historically known expressions for chemical equilibrium according to Guldberg–Waage’s mass action law [34,35] and Langmuir’s adsorption isotherms [200] (Section 3.2) were first obtained based on the Clausius second law of thermodynamics.
In modeling real technological processes using existing methods discussed in the Section 1, situations arise when two levels of models are used simultaneously: models of non-ideal systems for describing the equilibrium properties of SCF and kinetic models based on the law of mass action, i.e., models for ideal systems, which does not agree with the second law of thermodynamics.
This review demonstrates the great potential of the LGM for modeling a wide range of SCF processes, consisting of different elementary stages in the overall processes of chemical transformations and transport stages, which ensure self-consistency of the description of the kinetics of these processes with equilibrium states in non-ideal reaction systems.
The first comparisons of different methods of molecular modeling (integral equations, molecular dynamics methods, Monte Carlo, and LGM) already showed [201] that the LGM is in no way inferior in calculating all thermodynamic characteristics (although it does not give a continuum distribution of molecules inside the cell). It is difficult to give a full account of the practical applications of the LGM (although some of this material is presented in this review). The development of the statistical methods of the LGM [66,106] made it possible to significantly enhance its capabilities, especially for highly inhomogeneous systems (these are problems for phase boundaries, adsorption, and absorption). The introduction of the modifications discussed in this review, taking into account the internal motions of molecules inside the cells [133,134,139], formulated a unified approach to describing the molecular distribution in three-aggregate systems [115]. New developments in the LGM make it possible to perform calculations with more complex multiparticle potentials. Today, joint calculations are available for these using quantum-chemical methods for determining the energy of intermolecular interactions [66,106,154,202], including those with the Coulomb potential [197,203]. The statistical substantiation of initially purely empirical potential functions of the type (10) obtained in the LGM allows one to operate with molecular potentials, similar to all other methods of statistical physics. This makes it possible to search for the parameters of potential functions from the solution of inverse problems by describing the experimental data more quickly and more accurately due to the significant gain in time when using the LGM methods. In particular, the parameters of the “excluded” volume fraction, the cell size, and the vibrational contribution of molecules introduced into the LGM operate only on the properties of potential functions and do not have additional parameters.
Mathematical models developed in the LGM correspond to all times of realization of processes, including their relaxation stages in all three-aggregate systems and reaching equilibrium distributions according to the second law of thermodynamics. In terms of the computing speed, LGM is at least 2–4 orders of magnitude faster than the molecular dynamics method and its accuracy is not inferior to it.
It should be noted that, up to now, modeling based on the LGM has been carried out for the simplest molecular mixtures; however, its extensions make it possible to switch to more complex systems that have more complex phase diagrams and distinct physicochemical properties, including those containing both upper and lower critical points, as well as systems in which there are diagrams without top and right borders. Models for such equilibrium characteristics have been discussed earlier in the literature [118,119,120,121,122] and recent developments in the MGM (Section 7) make it possible to generalize them to the corresponding kinetic models, which will be consistent with the second law of thermodynamics.
Modern approaches based on the LGM [66,68,106,115] can be applied, as well as the thermodynamic approach [114,204], for any phases and from interfaces. They are actively used to simulate many practically important processes in a wide range of pressure and temperature changes. They describe the distribution of components of heterogeneous systems and their phase diagrams, to model the chemical synthesis reactions, and so on. With their help, one can calculate the processes of adsorption, catalysis, and growth of crystals, and the processes of transport of molecules through various polydisperse materials (porous bodies, membranes, and thin films), as well as consider the rheological properties of molecular and other aspects of physical and chemical mechanics, etc.
An important advantage of the LGM is the extension of the theory of chemical transformations to non-ideal reaction systems, which takes into account the influence of interparticle interactions and preserves the effects of correlation between interacting particles. This makes it possible to eliminate the existing contradiction in the modeling of SC processes, when the equations of state describe non-ideal mixtures, and the kinetic models are based on the law of mass action for ideal systems or the dissipative coefficients are built on the basis of Boltzmann-type equations for rarefied gases. The kinetic equations in the LGM give a self-consistent calculation of the equations of state and rates of elementary stages, which satisfies the second law of thermodynamics. This fact is of strategic importance for the organization of the correct modeling of SC processes.
Modeling methods with the help of LGM make it possible to (1) assess the processes of absorption of SCF molecules by polymer matrices, (2) describe the processes of growth of a new phase (nanosized particles in CSF) and analysis of their size dependences, (3) analyze the effect of concentrations of SCF molecules, taking into account their influence on shifts in equilibrium and changes in the rates of stages in bulk phases, (4) study the factors in porous materials that affect the processes of chemical kinetics, and the growth of a new phase inside pores and in near-wall regions under supercritical conditions, and (5) assess the role of critical regions inside porous materials on SCF transfer processes of molecules and their chemical transformations, etc.
Thus, for almost all modeling parameters, the LGM has the most significant potential for describing SC states of fluids and processes with their participation in comparison with all other existing methods of statistical physics in calculating both equilibrium and nonequilibrium characteristics. This provides the basis for using the LGM approach for practical applications to various technological SCF processes.

Funding

This research received no external funding.

Data Availability Statement

The results of research on this topic are reflected in the list of references.

Acknowledgments

Preparing the manuscript for publication was performed as part of a State Contract for the Institute of General and Inorganic Chemistry, Russian Academy of Sciences, in the field of basic scientific research, 2023.

Conflicts of Interest

The author declares no conflict of interest.

Nomenclature

ai0pre-exponential factor of the Henry constant for molecules of type i
dtrtriple interaction parameter associated with its energy ε3
Di*partial self-diffusion coefficient for molecules of type i
Eijreaction’s energy of activation between i and j reagents
EA(ef) effective activation energy of desorption
kBBoltzmann constant
kijrate constant of elementary reaction i + j → products
kij0rate constant pre-exponential factor for elementary reaction i + jproducts
k1 and k2reaction rate constants in the forward and backward directions
Kequilibrium constant of the stage
Mnumber of sites in the system
niconcentration of i-type molecules
Qienergy of i-particle bonding with the surface
Qamount of heat
Qsstatistical sum of the system
Ppressure
Pipartial pressure of i-type molecules
P({γfi},τ) probability of finding the system at the time τ in a state {γfi}. For the sake of brevity, this state is denoted as {I} ≡ {γfi}
snumber of occupation states of any cell or site
Sentropy
Smmolecular property in flow
Ttemperature
tfhij = θfhijfifunction of the conventional probability of j particles being near i particles (fh represents the numbers of sites containing these particles)
Uinternal energy
Uijrate of an elementary stage of a bimolecular reaction i + j → products
Ufi(α) rate of the elementary single-site stage ib with number α in the site f
Ufgij(α) rate of the elementary two- site stage i + jαb + dα with number α in two sites fg
Vvolume of the system
ucontribution from the vibrational motion of molecules to energy parameters
Wα({I} → {II}) probability of the elementary process α which resulted at time τ in the transfer of the system from the initial state {I} to the final state {II}
xi = θi/θmole fraction of component i among all molecules of the mixture.
znearest neighbors of any site or cell
zfg*the number of possible hops to nearest-neighbor sites g for the fth cell along the direction in which the label moves
Zcompressibility factor
αnumber of stages in the total process
αiactivity coefficient of i-type reagents
αij*denotes the activity coefficients of ACs
αij = εij*/εij, for simplicity αij = α is used for both reagents
γfivariable determined the occupation state of site with number f (1 ≤ fM) by particle of type i (1 ≤ is)
εijparameter of this interaction between ij pairs of neighboring particles
εij* interaction parameter for reaction AC using i-type particles and neighboring j-type particles
ηshear viscosity coefficient
κheat capacity coefficient
κDmean square displacement of particles in a solid in the harmonic approximation
λaverage cell size
Λ f g A B non-ideality function for the two-site stage
Λ f i non-ideality function for a one-site stage
μichemical potential of component i
μi0chemical potential of the standard state for component i
ρmean free path of a particle
θiconcentration of particles type i in the (surface or bulk)) system
θ = ∑I = 1s−1θicomplete occupancy of a lattice system by all i components of the system, 1 ≤ is − 1
θfhijprobability of two particles i and j being on nearest neighboring sites f and h (for homogeneous system θij, is the pair particle distribution function)
νistoichiometric coefficient

Appendix A. Kinetics Equation in the LGM

A change in the state of a condensed phase, which we are modeling in the LGM by a lattice structure at a molecular level, is associated with a change in the state of its individual sites as a result of the realization of elementary processes. Fixation of the molecule in the center of the cell corresponds to the state of its occupation. Mathematically, this event is described by γfi, where f is the cell number, 1 ≤ fM, subscript i denotes the state of occupation of the cell with number f, 1 ≤ fs, and s is the number of the states of cell occupation including a vacancy (M is the number of sites) [66]. For the two components of the lattice systems (s = 2) of any site of the lattice structure corresponding to the one-component system for which i = A or V (vacancies). If the site f contains an adsorbed particle A, then γf A = 1 and γfV = 0; if the cell is free, then there is a vacancy, so γfA = 0 and γfV = 1. The random variables γfi are subject to the following relations:
i = 1 s γ f i = 1 , and γfi γfj = Δij γfi, where Δij is the Kronecker symbol, which means that any site is unavoidably occupied by one, but only one, particle.
The state of the sites changes at the expense of two main types of elementary processes, namely, the migration of the particles and their participation in chemical transformations. In the first case, the particles change their position in space while remaining unchanged in a chemical respect. In the second case, the particles transform into their other chemical compounds without changing their position. The description of the process when a particle simultaneously changes its coordinates and partly changes its chemical nature by entering into the composition of a complex or an intermediate does not virtually differ from the description of the two basic types of processes.
We denote by {γfi} = γ1i, γ2j, …, γMn the complete set (or full list) of values γfi of all lattice sites, which uniquely determine the complete configuration of the locations of the particles on the lattice at time τ, and, by P({γfi},τ), the probability of finding the system at this time in a state {γfi}. For the sake of brevity, this state is denoted as {I} ≡ {γfi}. Let the common studied process consist of many stages and through α we denote the number of elementary stages in the process. The master equation for the evolution of the full distribution function of the system in a state {I}, due to the implementation of the elementary processes α in condensed phases, has the following form (the so-called Glauber-type equation) [66,163,205,206]:
d d τ P ( { I } , τ ) = α , { I I }   [ W α ( { II } { I } ) P ( { II } , τ ) W α ( { I } { II } ) P ( { I } , τ ) ] ,
where Wα({I} → {II}) is the probability of the elementary process α (the probability of transition via channel α), which results at time τ in the transfer of the system from the initial state {I} to the final state {II}. In Equation (A1) the sum is taken over the different types of direct processes (index α) and all reversed processes {II}, in the state of occupation of each site in the system changes.
If the elementary process occurs at one site, the lists of states of occupation of the sites of the system {I} and {II} differ only for this site. Single-site processes are processes associated with changes in the internal degrees of freedom of the particle, the adsorption and desorption of non-dissociating molecules, and the reaction by the impact mechanism. If the elementary process occurs in two neighboring lattice sites, then lists of the states {I} and {II} differ in the conditions of occupation of these two sites. Two-site processes are exchange reactions, adsorption, desorption of the dissociating molecules, migration processes by the vacancy and exchange mechanisms, etc. The sum of the states {II} corresponds to the change in states of occupation for all lattice sites. The interconnection of the states {I} and {II} depends on the mechanism of the process that defines a set of elementary stages α.
Equation (A1) is written in the Markov approximation for which it is assumed that the relaxation processes of the internal degrees of freedom of all particles are faster than the process of changes of the state of occupation of different sites of the lattice system. The transition probabilities Wα are subject to the condition of detailed balance:
Wα({I} {II}) exp(–βH({I})) = Wα({II} → {I}) exp(–βH({II})),
where H({I}) is the total energy of the lattice system in the state {I}. In equilibrium, P({γfi}, τ) = exp(–βH({γfi}))/Qs; here, Qs is the statistical sum of the system [66]. Expressions for Wα({I} → {II}) are constructed with all the molecular features of the system taken into account [68].
The large dimension of system (A1) does not allow it to be used to study the dynamics of macroscopic systems by direct integration, so the kinetic equations are based on the functions of distributions of a lower order through which the distribution functions of high order are closed. To this end, instead of the full distribution function P({γfi},τ), the evolution of the system is described using a shortened method of defining it by time distribution function (correlators) determined by
θ f 1 f m i 1 i m ( τ ) = < γ f 1 i 1 γ f m i m > = i 1 = 1 s i N = 1 s n = 1 m γ f n i n P ( { γ f i } , τ ) ,
The closed system of equations for the first (θfi = <γfi>) and second (θfgij = <γfiγgj>) correlations in the general form can be written as
d d t θ f i = α U f b ( α ) U f i ( α ) + h j α U f h b d ( α ) U f h i j ( α ) ,
d d t θ f g i j = α U f g b d ( α ) U f g i j ( α ) + P f g i j + P g f j i , P f g i j = α U f g ( b ) j ( α ) U f g ( i ) j ( α ) + h m α U h f g ( c b ) j ( α ) U h f g ( m i ) j ( α )
where Ufi(α) is the rate of the elementary single-site processes i ↔ b (here hzf), Ufgij(α), and α is the rate of the elementary two-site processes i + jαb + dα (hz) on the nearest sites; the second term in Pfgij describes the stage i + mb + c on neighboring sites f and h (and the term of Pgfji describes the stages on sites g and h and similar stages on sites f and h) [66,106]. All the rates of the elementary stages Ufi(α) and Ufgij(α) are calculated in the framework of the theory of absolute reaction rates for non-ideal reaction systems written in the quasi-chemical approximation of the interparticle interaction. The rates of two-site stages Ufgij(α) have the form of Equations (2) and (3), and the rates of single-site stages Ufi(α) in the QCA are expressed as
U f i ( α ) = k f i ( α ) θ f i Λ f i ( α ) , Λ f i ( α ) = h z ( f ) S f h i ( α ) , S f h i ( α ) = j = 1 s t f h i j exp [ β ( ε i j * ( α ) ε i j ) ]
where Λ f i ( α ) is the non-ideality function. The functions t f h i j are defined in Section 2.2. For Equations (A4) and (A5) we have the normalizing ratios (see also Section 2.2), which are executed at any time.
Equations (A4) and (A5) describe elementary processes at the micro level. To move to macroscopic transport equations, two levels are distinguished: local, which preserves the written equations of chemical kinetics for a non-ideal reaction system, and macroscopic, which describes the transport of molecules and their properties on the hydrodynamic distance and time scales, which makes it possible to construct dissipative coefficients for non-ideal systems. Transfer processes in the LGM correspond to the stage of displacement of molecules in space through free sites (or vacancies), both for gas and for liquids and solids.
From the kinetic theory, it follows [23,24,25,26] that the transport coefficients characterize flows for small deviations from the equilibrium state of the system. We shall characterize the state of the fluid in a bulk by concentration θ and temperature T. The equilibrium distribution of the particles relative to each other will be calculated in the quasichemical approximation taking into account the direct correlations between the interacting particles. (Recall that the simpler mean-field approximation does not account for the correlation effects and does not provide a self-consistent description of the equilibrium distribution of the particles and the rates of elementary processes, so it cannot be used [66,106]).
To calculate the kinetic coefficients as usual [23,207,208], we select a plane in space 0 and consider the particle fluxes and the momentum and energy transferred by them. We use the concept of the average speed of moving particles w. We draw two planes parallel to plane 0 (with x = 0) at distances x = ±ρ, where ρ is the mean free path of a particle; then, the properties of the particles Sm in these planes can be written as Sm(x = +ρ) = Sm(x = 0) ± ρdSm/dx, where the symbol Sm means the concentration, the momentum (in the direction y, for example) or the energy of the particles moving along the axis X. The flow of quantity Sm through plane 0 consists of two oppositely directed movements of particles from the planes x = ±ρ.
Two channels of transfer of momentum and energy operate in dense fluids. The first is connected with the movement of the particles, as in the rarefied phase, and the other is determined by collisions between particles. The particle in question may not cross plane 0 if its path is blocked by other particles in sites on plane 0 or a particle in close proximity on the other side of plane 0 prevents it from crossing a given plane. Both cases are not considered by the elementary kinetic theory of gases and the kinetic theory of condensed systems must be used [66,106].
In this way, the transmission of the property Sm through the selected plane is calculated, where Sm is modified by the following variables: (1) the number of molecules—for calculation of self-diffusion coefficient Di* and mass transfer coefficients Dij, (2) the number of impulses—for the calculation of the shear η and bulk viscosity ξ, and (3) the amount of energy—for the calculation of the thermal conductivity κ. There are two channels of transfer of the property Sm: η = η1 + η2, κ = κ1 + κ2: (1) the transfer of molecules via a separated plane—the calculation of the coefficients Di*, Dij, η1, and κ1; (2) transfer of the property (momentum and energy) through collisions—the calculation of the coefficients η2, ξ, and κ2 [68]. The results of calculating the dissipative coefficients are also shown in Figure 8, Figure 9, Figure 10, Figure 11, Figure 12 and Figure 13.

References

  1. Savage, P.E.; Gopalan, S.; Mizan, T.I.; Martino, C.J.; Brock, E.E. Reactions at supercritical conditions: Applications and fundamentals. AIChE J. 1995, 41, 1723–1778. [Google Scholar] [CrossRef]
  2. Galkin, A.A.; Lunin, V.V. Subcritical and supercritical water: A universal medium for chemical reactions. Russ. Chem. Rev. 2005, 74, 21–35. [Google Scholar] [CrossRef]
  3. Zalepugin, D.Y.; Tilkunova, N.A.; Chernyshova, I.V.; Polyakov, V.S. Development of Technologies based on Supercritical Fluids. Sverhkriticheskie Flyuidy Teor. Prakt. 2006, 1, 27–51. [Google Scholar]
  4. Bogdan, V.I.; Koklin, A.E.; Kazansky, V.B. Regeneration of Deactivated Palladium Catalysts of Selec-tive Acetylene Hydrogenation be the Supercritical CO2. Sverhkriticheskie Flyuidy Teor. Prakt. 2006, 1, 5–12. [Google Scholar]
  5. Knez, Ž.; Markočič, E.; Leitgeb, M.; Primožič, M.; Hrnčič, M.K.; Škerget, M. Industrial applications of supercritical fluids: A review. Energy 2014, 77, 235–243. [Google Scholar] [CrossRef]
  6. Gandhi, K.; Arora, S.; Kumar, A. Industrial applications of supercritical fluid extraction: A review. Int. J. Chem. Stud. 2017, 5, 336–340. [Google Scholar]
  7. Mukhopadhyay, M. Natural Extracts Using Supercritical Carbon Dioxide; CRC Press: Boca Raton, FL, USA, 2000. [Google Scholar] [CrossRef]
  8. Gopaliya, P.; Kamble, P.R.; Kamble, R.; Chauhan, C.S. A Review Article on Supercritical Fluid Chroma-tography. Int. J. Pharma Res. Rev. 2014, 3, 59–66. [Google Scholar]
  9. Martinez, A.C.; Meireles, M.A.A. Application of Supercritical Fluids in the Conservation of Bioactive Compounds: A Review. Food Public Health 2020, 10, 26–34. [Google Scholar]
  10. Bhardwaj, L.; Sharma, P.K.; Visht, S.; Garg, V.K.; Kumar, N. A review on methodology and application of supercritical fluid technology in pharmaceutical industry. Pharm. Sin. 2010, 1, 183–194. [Google Scholar]
  11. Sapkale, G.N.; Patil, S.M.; Surwase, U.S.; Bhatbhage, P.K. Supercritical Fluid Extraction. Int. J. Chem. Sci. 2010, 8, 729–743. [Google Scholar]
  12. Gumerov, F.M.; Gabitov, F.R.; Gazizov, R.A.; Bilalov, T.R.; Yarullin, R.S. Future Trends of Sub- and Supercritical Fluids Appli-cation in Biodiezel Fuel Production. Sverhkriticheskie Flyuidy Teor. Prakt. 2006, 1, 66–76. [Google Scholar]
  13. Gumerov, F.M.; Sabirzyanov, A.N.; Gumerova, G.I. Sub- and Supercritical Fluids in Processes of Polymer Processing; Fan: Kazan, Russia, 2007. [Google Scholar]
  14. Myasoedov, B.F.; Kulyako, Y.M.; Shadrin, A.Y.; Samsonov, M.D. Supercritical Fluid Extraction of Radionuclides. Sverhkriticheskie Flyuidy Teor. Prakt. 2007, 2, 5–24. [Google Scholar]
  15. Ahmad, T.; Masoodi, F.A.; Rather, S.A.; Wani, S.M.; Gull, A. Supercritical Fluid Extraction: A Review. J. Biol. Chem. Chron. 2019, 5, 114–122. [Google Scholar] [CrossRef]
  16. Parhi, R.; Suresh, P. Supercritical Fluid Technology: A Review. J. Adv. Pharm. Sci. Technol. 2013, 1, 13–36. [Google Scholar] [CrossRef]
  17. Zhou, J.; Gullón, B.; Wang, M.; Gullón, P.; Lorenzo, J.M.; Barba, F.J. The Application of Supercritical Fluids Technology to Recover Healthy Valuable Compounds from Marine and Agricultural Food Processing By-Products: A Review. Processes 2021, 9, 357. [Google Scholar] [CrossRef]
  18. Aymonier, C.; Loppinet-Serani, A.; Reverón, H.; Garrabos, Y.; Cansell, F. Review of supercritical fluids in inorganic materials science. J. Supercrit. Fluids 2006, 38, 242–251. [Google Scholar] [CrossRef]
  19. Manjare, S.D.; Dhingra, K. Supercritical fluids in separation and purification: A review. Mater. Sci. Energy Technol. 2019, 2, 463–484. [Google Scholar] [CrossRef]
  20. De Groot, S.R.; Mazur, P. Nonequilibrium Thermodynamics; North-Holland: Amsterdam, The Netherlands, 1962. [Google Scholar]
  21. Haase, R. Thermodynamik der Irreversible Processe; Dr. Dierrich Steinkopff Verlag: Darmstadt, Germany, 1963. [Google Scholar]
  22. Prigogine, I.; Kondepudi, D. Modern Thermodynamics: From Heat Engines to Dissipative Structures; Wiley: New York, NY, USA, 1998. [Google Scholar]
  23. Hirschfelder, J.O.; Curtiss, C.F.; Bird, R.B. Molecular Theory of Gases and Liquids; Wiley: New York, NY, USA, 1954. [Google Scholar]
  24. Balescu, R. Equilibrium and Nonequilibrium Statistical Mechanics; Wiley-Interscience Publication Jonh Wiley and Sons: Hoboken, NJ, USA, 1975. [Google Scholar]
  25. Landau, L.D.; Lifshitz, E.M. Course of Theoretical Physics; Fluid Mechanics; Pergamon: New York, NY, USA, 1987; Volume 6. [Google Scholar]
  26. Bird, R.; Stewart, W.E.; Lightfoot, E.N. Transport Phenomena; Wiley: New York, NY, USA, 1960. [Google Scholar]
  27. Collins, R. Fluid Flow through Porous Materials; Wiley: New York, NY, USA, 1964. [Google Scholar]
  28. Sheydegger, A.E. The Physics of Flow through Porous Media, 3rd ed.; University of Toronto Press: Toronto, ON, Canada, 1974. [Google Scholar]
  29. Nigmatulin, R.I. Fundamentals of Mechanics of Heterogeneous Media; Nauka: Moscow, Russia, 1973. [Google Scholar]
  30. Nicholaevsky, V.N. Mechanics of Porous and Fractured Media; Nedra: Moscow, Russia, 1984. [Google Scholar]
  31. Glasstone, S.; Laidler, K.J.; Eyring, H. The Theory of Rate Processes: The Kinetics of Chemical Reactions, Viscosity, Diffusion, and Electrochemical Phenomena; Van Nostrand: New York, NY, USA, 1941. [Google Scholar]
  32. Entelis, S.G.; Tiger, R.P. Reaction Kinetics in the Liquid Phase; Khimiya: Moscow, Russia, 1973. [Google Scholar]
  33. Moelwyn-Hughes, E.A. The Chemical Statics and Kinetics of Solutions; Academic Press: London, UK; New York, NY, USA, 1971. [Google Scholar]
  34. Benson, S.W. The Foundations of Chemical Kinetics; McGrow–Hill: New York, NY, USA, 1960. [Google Scholar]
  35. Kiperman, S.L. Foundations of Chemical Kinetics in Heterogeneous Catalysis; Khimiya: Moscow, Russia, 1979. [Google Scholar]
  36. Volmer, M.; Flood, H. Tröpfchenbildung in Dämpfen. Z. Phys. Chem. 1934, 170A, 273–285. [Google Scholar] [CrossRef]
  37. Volmer, M.; Vollmer, M. Kinetics of New Phase Formation; Plenum: New York, NY, USA, 1983. [Google Scholar]
  38. Fuchs, N.A. Mechanic of Aerosols; Khimiya: Moscow, Russia, 1959. [Google Scholar]
  39. Erkey, C.; Türk, M. Modeling of particle formation in supercritical fluids (SCF). Supercrit. Fluid Sci. Technol. 2021, 8, 239–259. [Google Scholar] [CrossRef]
  40. Helfgen, B.; Türk, M.; Schaber, K. Hydrodynamic and aerosol modelling of the rapid expansion of supercritical solutions (RESS-process). J. Supercrit. Fluids 2003, 26, 225–242. [Google Scholar] [CrossRef]
  41. Fletcher, K. Methods in Computational Fluid Dynamics; Wiley: New York, NY, USA, 1991; Volumes 1 and 2. [Google Scholar]
  42. Hoffman, K.A.; Steve, T.C. Computation Fluid Dynamics; Engineering Education System: Wichite, KS, USA, 2000; Volumes 1–3. [Google Scholar]
  43. Strang, G.; Fix, G. Theory of Finite Element Method; Wiley: New York, NY, USA, 1977. [Google Scholar]
  44. Zinkevych, O.; Morgan, K. Finite Elements and Approximation; Wiley: New York, NY, USA, 1986. [Google Scholar]
  45. Tovbin, Y.K. (Ed.) Method of Molecular Dynamics in Physical Chemistry; Nauka: Moscow, Russia, 1996. [Google Scholar]
  46. Allen, M.P.; Tildesley, D.J. Computer Simulation of Liquids; Claredon Press: Oxford, UK, 2002. [Google Scholar]
  47. Haile, J.M. Molecular Dynamics Simulation: ElementaryMethods; Wiley: New York, NY, USA, 1992. [Google Scholar]
  48. Coccotti, G.; Hoover, W.G. (Eds.) Molecular Dynamics Simulation of Statistical Mechanics Systems; North-Holland: Amsterdam, The Netherlands, 1986; 610p. [Google Scholar]
  49. Evans, D.J.; Morriss, G.P. Statistical Mechanics of Nonequilibrium Liquids, 2nd ed.; Cambridge University Press: Cambridge, UK, 2008. [Google Scholar]
  50. Binder, K. (Ed.) Monte Carlo Methods in Statistical Physics; Springer: Berlin/Heidelberg, Germany; New York, NY, USA, 1979. [Google Scholar]
  51. Nicolson, D.; Parsonage, N.G. Computer Simulation and The Statistical Mechanics of Adsorption; Academic Press: New York, NY, USA, 1982. [Google Scholar]
  52. Allen, M.P. Introduction to Monte Carlo simulations. In Observation, Prediction and Simulation of Phase Transitions in Complex Fluids; Baus, M., Rull, L.F., Ryckaert, J.-P., Eds.; Kluwer Academic Publishers: Boston, MA, USA, 1995; p. 339. [Google Scholar]
  53. Jorgensen, W.L. Monte Carlo simulations for liquids. In Encyclopedia of Computational Chemistry; Schleyer, P.V.R., Ed.; Wiley: New York, NY, USA, 1998; p. 1754. [Google Scholar]
  54. Jorgensen, W.L.; Tirado-Rives, J. Monte Carlo vs. Molecular Dynamics for Conformational Sampling. J. Phys. Chem. 1996, 100, 14508–14513. [Google Scholar] [CrossRef]
  55. Binder, K.; Landau, D.P. Capillary condensation in the lattice gas model: A Monte Carlo study. J. Chem. Phys. 1992, 96, 1444–1454. [Google Scholar] [CrossRef]
  56. Lemak, A.S.; Balabaev, N.K. A Comparison Between Collisional Dynamics and Brownian Dynamics. Mol. Simul. 1995, 15, 223–231. [Google Scholar] [CrossRef]
  57. Lemak, A.S.; Balabaev, N.K. Molecular dynamics simulation of a polymer chain in solution by collisional dynamics method. J. Comput. Chem. 1996, 17, 1685–1695. [Google Scholar] [CrossRef]
  58. Bird, G.A. Molecular Gas Dynamics; Oxford University Press: Oxford, UK, 1976. [Google Scholar]
  59. Lebowitz, J.K.; Montroll, E.W. (Eds.) Nonequilibrium Phenomena I. The Boltzman Equation. Studies in Statistical Mechanics; North-Holland Publishing Company: Amsterdam, The Netherlands; New York, NY, USA; Oxford, UK, 1983. [Google Scholar]
  60. Gardiner, C.W. Handbook of Stochastic Methods (for Physics, Chemistry and Natural Science), 2nd ed.; Haken, H., Ed.; Springer Series in Synergetics; Springer: Berlin/Heidelberg, Germany; New York, NY, USA; Tokyo, Japan, 1985; Volume 13. [Google Scholar]
  61. Succi, S. The Lattice Boltzmann Equation for Fluid Dynamics and Beyond; Oxford University Press: Oxford, UK, 2001. [Google Scholar]
  62. Mohamad, A.A. Lattice Boltzmann Method: Fundamentals and Engineering. Applications with Computer Codes; Springer: Berlin/Heidelberg, Germany, 2011. [Google Scholar]
  63. Timm, K.; Kusumaatmaja, H.; Kuzmin, A.; Shardt, O.; Silva, G.; Viggen, E. The Lattice Boltzmann Method: Principles and Practice; Springer: Berlin/Heidelberg, Germany, 2016. [Google Scholar]
  64. Hill, T.L. Statistical Mechanics. Principles and Selected Applications; McGraw–Hill: New York, NY, USA, 1956. [Google Scholar]
  65. Huang, K. Statistical Mechanics; Wiley: New York, NY, USA, 1963. [Google Scholar]
  66. Tovbin, Y.K. Theory of Physicochemical Processes at the Gas–Solid Interface; CRC: Boca Raton, FL, USA, 1991. [Google Scholar]
  67. Tovbin, Y.K. Molecular Approach to Micro-dynamics: Transfer of Molecules in Narrow Pores. Russ. J. Phys. Chem. A 2002, 76, 64–70. [Google Scholar]
  68. Tovbin, Y.K. Molecular Theory of Adsorption in Porous Solids; CRC: Boca Raton, FL, USA, 2017. [Google Scholar]
  69. Wolfram, S. Cellular Automata. Los Alamos Sci. 1983, 9, 2. [Google Scholar]
  70. Toffoli, T.; Margolus, N. Cellular Automata Machines; The MIT Press: Cambridge, MA, USA, 1987. [Google Scholar]
  71. Wolfram, S. A New Kind of Science; Wolfram Media: Champaign, IL, USA, 2002. [Google Scholar]
  72. Kier, L.B.; Seybold, P.G.; Cheng, C.-K. Cellular Automata Modeling of Chemical Systems; Springer: Dordrecht, The Netherlands, 2005; 175p. [Google Scholar]
  73. Wolf-Gladrow, D.A. Lattice-Gas Cellular Automata and Lattice Boltzmann Models: An Introduction; Springer: Berlin/Heidelberg, Germany, 2000. [Google Scholar]
  74. Goto, M.; Roy, B.C.; Kodama, A.; Hirose, T. Modeling Supercritical Fluid Extraction Process Involving Solute-Solid Interaction. J. Chem. Eng. Jpn. 1998, 31, 171–177. [Google Scholar] [CrossRef]
  75. Oliveira, E.L.G.; Silvestre, A.J.D.; Silva, C.M. Review of kinetic models for supercritical fluid extraction. Chem. Eng. Res. Des. 2011, 89, 1104–1117. [Google Scholar] [CrossRef]
  76. Al-Jabari, M. Kinetic models of supercritical fluid extraction. J. Sep. Sci. 2002, 25, 477–489. [Google Scholar] [CrossRef]
  77. Sovová, H. Rate of the vegetable oil extraction with supercritical CO2—I. Modelling of extraction curves. Chem. Eng. Sci. 1994, 49, 409–414. [Google Scholar] [CrossRef]
  78. Sovová, H. Mathematical model for supercritical fluid extraction of natural products and extraction curve evaluation. J. Supercrit. Fluids 2005, 33, 35–52. [Google Scholar] [CrossRef]
  79. Sovová, H. Steps of supercritical fluid extraction of natural products and their characteristic times. J. Supercrit. Fluids 2012, 66, 73–79. [Google Scholar] [CrossRef]
  80. Rai, A.; Punase, K.D.; Mohanty, B.; Bhargava, R. Evaluation of models for supercritical fluid extraction. Int. J. Heat Mass Transf. 2014, 72, 274–287. [Google Scholar] [CrossRef]
  81. Promraksa, A.; Siripatana, C.; Rakmak, N.; Chusri, N. Modeling of Supercritical CO2 Extraction of Palm Oil and Tocopherols Based on Volumetric Axial Dispersion. J. Supercrit. Fluids 2020, 166, 105021. [Google Scholar] [CrossRef]
  82. Roodpeyma, M.; Street, C.; Guigard, S.E.; Stiver, W.H. A hydrodynamic model of a continuous supercritical fluid extraction system for the treatment of oil contaminated solids. Sep. Sci. Technol. 2017, 53, 44–60. [Google Scholar] [CrossRef]
  83. Garcia, E.C.C.; Rabi, J.A. Lattice-Boltzmann Simulation of Supercritical Fluid Extraction of Essential Oil from Gorse: Influence of Process Parameters on Yields. In Proceedings of the 14th WSEAS International Conference on Mathematics and Computers in Biology and Chemistry, Baltimore, MD, USA, 17–19 September 2013; pp. 62–67, ISBN 978-960-474-333-9. [Google Scholar]
  84. Duba, K.S.; Fiori, L. Supercritical fluid extraction of vegetable oils: Different approach to modeling the mass transfer kinetics. Chem. Eng. Trans. 2015, 43, 1051–1056. [Google Scholar] [CrossRef]
  85. Markom, M.; Hassim, N.; Hasan, M.; Daud, W.R.W. Modeling of supercritical fluid extraction by enhancement factor of cosolvent mixtures. Sep. Sci. Technol. 2020, 56, 1290–1302. [Google Scholar] [CrossRef]
  86. Gadkari, P.V.; Balaraman, M. Mass transfer and kinetic modelling of supercritical CO2 extraction of fresh tea leaves (Camellia sinensis L.). Braz. J. Chem. Eng. 2017, 34, 799–810. [Google Scholar] [CrossRef]
  87. Dimić, I.; Pezo, L.; Rakić, D.; Teslić, N.; Zeković, Z.; Pavlić, B. Supercritical Fluid Extraction Kinetics of Cherry Seed Oil: Kinetics Modeling and ANN Optimization. Foods 2021, 10, 1513. [Google Scholar] [CrossRef]
  88. Cabeza, A.; Sobrón, F.; García-Serna, J.; Cocero, M. Simulation of the supercritical CO2 extraction from natural matrices in packed bed columns: User-friendly simulator tool using Excel. J. Supercrit. Fluids 2016, 116, 198–208. [Google Scholar] [CrossRef]
  89. Amani, M.; Ardestani, N.S.; Honarvar, B. Experimental Optimization and Modeling of Supercritical Fluid Extraction of Oil from Pinus gerardiana. Chem. Eng. Technol. 2021, 44, 578–588. [Google Scholar] [CrossRef]
  90. Bushnaq, H.; Krishnamoorthy, R.; Abu-Zahra, M.; Hasan, S.W.; Taher, H.; Alomar, S.Y.; Ahmad, N.; Banat, F. Supercritical Tech-nology-Based Date Sugar Powder Production: Process Modeling and Simula-tion. Processes 2022, 10, 257. [Google Scholar] [CrossRef]
  91. Wilhelmsen, Ø.; Aasen, A.; Skaugen, G.; Aursand, P.; Austegard, A.; Aursand, E.; Gjennestad, M.A.; Lund, H.; Linga, G.; Hammer, M. Thermodynamic Modeling with Equations of State: Present Challenges with Established Methods. Ind. Eng. Chem. Res. 2017, 56, 3503–3515. [Google Scholar] [CrossRef]
  92. Salmani, H.J.; Karkhanechi, H.; Moradi, M.R.; Matsuyama, H. Thermodynamic modeling of binary mixtures of ethylenediamine with water, methanol, ethanol, and 2-propanol by association theory. RSC Adv. 2022, 12, 32415–32428. [Google Scholar] [CrossRef]
  93. Congedo, P.M.; Rodio, M.G.; Tryoen, J.; Abgrall, R. Reliable and Robust Thermodynamic Model for Liquid-Vapor Mixture; [Re-search Report] RR-8439, INRIA. hal-00922816; HAL: Lyon, France, 2013. [Google Scholar]
  94. Alanazi, A.; Bawazeer, S.; Ali, M.; Keshavarz, A.; Hoteit, H. Thermodynamic modeling of hydrogen–water systems with gas impurity at various conditions using cubic and PC-SAFT equations of state. Energy Convers. Manag. X 2022, 15, 100257. [Google Scholar] [CrossRef]
  95. Matos, I.Q.; Varandas, J.S.; Santos, J.P. Thermodynamic Modeling of Azeotropic Mixtures with [EMIM][TfO] with Cubic-Plus-Association and Cubic EOSs. Braz. J. Chem. Eng. 2018, 35, 363–372. [Google Scholar] [CrossRef]
  96. Yeoh, H.S.; Chong, G.H.; Azahan, N.M.; Rahman, R.A.; Choong, T.S.Y. Solubility Measurement Method and Mathematical Modeling in Supercritical Fluids. Eng. J. 2013, 17, 67–78. [Google Scholar] [CrossRef]
  97. Peng, D.Y.; Robinson, D.B. A New Two-Constant Equation of State. Ind. Eng. Chem. Fundam. 1976, 15, 59–64. [Google Scholar] [CrossRef]
  98. Mukhopadhyay, M.; Rao, G.V.R. Thermodynamic modeling for supercritical fluid process design. Ind. Eng. Chem. Res. 1993, 32, 922–930. [Google Scholar] [CrossRef]
  99. Bilalov, T.R.; Zavjalova, N.B.; Gumerov, F.M. Phase Diagram of the Supercritical Carbon Dioxide–Ethylcarbitol System. Sverhkriticheskie Flyuidy Teor. Prakt. 2019, 14, 27–33. [Google Scholar] [CrossRef]
  100. Bilalov, T.R.; Gumerov, F.M.; Khairutdinov, V.F.; Khabriev, I.S.; Gabitov, F.R.; Zaripov, Z.I.; Ga-niev, A.A.; Mazanov, C.V. Phase Equilibrium of the Binary System Propylene Glycol—Propane/Butane. Sverhkriticheskie Flyuidy Teor. Prakt. 2020, 15, 79–86. [Google Scholar] [CrossRef]
  101. Zakharov, A.A.; Bilalov, T.R.; Gumerov, F.M. Solubility of Ammonium Palmitate in Supercritical Carbon Dioxide. Sverhkriticheskie Flyuidy Teor. Prakt. 2015, 12, 60–70. [Google Scholar] [CrossRef]
  102. Gumerov, F.M.; Gabitov, F.R.; Gazizov, R.A.; Bilalov, T.R.; Yakushev, I.A. Determination of Phase Equilibria Parameters in Binary Systems Containing Components of Biodiezel Fuel and Supercritical Carbon Dioxde. Sverhkriticheskie Flyuidy Teor. Prakt. 2006, 1, 89–100. [Google Scholar]
  103. Bazaev, A.R.; Karabekova, B.K.; Abdurashidova, A.A. p, ρ, T, and x dependences for supercritical water-aliphatic alcohol mixtures. Sverhkriticheskie Flyuidy Teor. Prakt. 2013, 8, 11–38. [Google Scholar] [CrossRef]
  104. Durakovic, G.; Skaugen, G. Analysis of Thermodynamic Models for Simulation and Optimisation of Organic Rankine Cycles. Energies 2019, 12, 3307. [Google Scholar] [CrossRef]
  105. Bruno, T.J.; Ely, J.F. (Eds.) Supercritical Fluid Technology: Reviews in Modem Theory and Applications; CRC Press Taylor & Francis Group: Boca Raton, FL, USA, 1991. [Google Scholar]
  106. Tovbin, Y. Lattice-gas model in kinetic theory of gas-solid interface processes. Prog. Surf. Sci. 1990, 34, 1–235. [Google Scholar] [CrossRef]
  107. Temkin, M.I. Kinetics of ammonia synthesis at high pressures. Zhurnal Fiz. Khimii 1950, 24, 1312–1323. [Google Scholar]
  108. Marcus, R.A. Chemical and Electrochemical Electron-Transfer Theory. Annu. Rev. Phys. Chem. 1964, 15, 155–196. [Google Scholar] [CrossRef]
  109. Dogonadze, R.R.; Kuznetsov, A.M. Kinetics of heterogeneous chemical reactions in solutions. Itogi Nauki Tekh. Ser. Kinet. Katal. 1978, 5. [Google Scholar]
  110. Kuznetsov, A.M.; Ulstrup, J. Electron Transfer in Chemistry and Biology; John Wiley & Sons, Ltd.: Chichester, UK, 1999; 350p. [Google Scholar]
  111. Clausius, R. Mechanical Theory of Heat; John van Voorst: London, UK, 1867. [Google Scholar]
  112. Tovbin, Y.K. Second Law of Thermodynamics, Gibbs’ Thermodynamics, and Relaxation Times of Thermodynamic Parameters. Russ. J. Phys. Chem. A 2021, 95, 637–658. [Google Scholar] [CrossRef]
  113. Gibbs, J.W. On the Equilibrium of Heterogeneous Substances. Trans. Conn. Acad. Arts Sci. 1878, 16, 441–458. [Google Scholar] [CrossRef]
  114. Gibbs, J.W. The Collected Works of J. W. Gibbs, in 2 Volumes; Longmans Green: New York, NY, USA, 1928; Volume 1. [Google Scholar]
  115. Tovbin, Y.K. Small Systems and Fundamentals of Thermodynamics; CRC Press: Boca Raton, FL, USA, 2019. [Google Scholar]
  116. Fisher, M.E. The Nature of Critical Points; Lectures in Theoretical Physics; University of Colorado Press: Boulder, CO, USA, 1965; Volume VII. [Google Scholar]
  117. Novikov, I.I. Equation of States of Gas and Liquids; Nauka: Moscow, Russia, 1965. [Google Scholar]
  118. Walas, S.M. Phase Equilibria in Chemical Engineering; The C.W. Nofsinger Company Butterworth Publisher: Boston, MA, USA; London, UK; Wellington, New Zealand; Durban, South Africa; Toronto, ON, Canada, 1985. [Google Scholar]
  119. Guggenheim, E.A. Mixtures; Clarendon: Oxford, UK, 1952. [Google Scholar]
  120. Barker, J.A. Cooperative Orientation Effects in Solutions. J. Chem. Phys. 1952, 20, 1526–1532. [Google Scholar] [CrossRef]
  121. Prigogine, I.P. The Molecular Theory of Solutions; Interscience: Amsterdam, The Netherlands; New York, NY, USA, 1957. [Google Scholar]
  122. Smirnova, N.A. The Molecular Theory of Solutions; Khimiya: Leningrad, Russia, 1987. [Google Scholar]
  123. Tovbin, Y.K.; Titov, S.V. Role of local environment relaxation in calculating the reaction rates for nonideal reaction systems. Sverhkriticheskie Flyuidy Teor. Prakt. B 2011, 6, 35–48. [Google Scholar] [CrossRef]
  124. Tovbin, Y.K. Theory of adsorption—Desorption kinetics on flat heterogeneous surfaces. In Equiliblia and Dynamics of Gas Adsorption on Heterogeneous Solid Surfaces; Rudzinski, W., Steele, W.A., Zgrablich, G., Eds.; Elsevier: Amsterdam, The Netherlands, 1997; pp. 201–284. [Google Scholar]
  125. Lifshits, I.M. To the theory of real solutions. Zh. Eksp. Teor. Fiz. 1939, 9, 481–499. [Google Scholar]
  126. Krichevskii, I.R. Phase Equilibria at High Pressures; Goskhimizdat: Moscow, Russia, 1963. [Google Scholar]
  127. Borovskii, I.B.; Gurov, K.P.; Marchukova, Y.E.; Ugaste, Y.E. Interdiffusion Processes in Alloys; Gurov, K.P., Ed.; Nauka: Moscow, Russia, 1973. [Google Scholar]
  128. Gurov, K.P.; Kartashkin, B.A.; Ugaste, Y.E. Mutual Diffusion in Multicomponent Metal Alloys; Nauka: Moscow, Russia, 1981. [Google Scholar]
  129. Lazarev, A.V.; Tatarenko, P.A.; Tatarenko, K.A. Gas-Dynamic Model of the Expansion of a Pulse Jet of Supercritical Carbon Dioxide: The Strategy of the Experiment. Sverhkriticheskie Flyuidy Teor. Prakt. 2017, 12, 3–13. [Google Scholar] [CrossRef]
  130. Nikolaev, P.N. The singular points and phase diagram of the supercritical region of a substance. Mosc. Univ. Phys. Bull. 2014, 69, 146–151. [Google Scholar] [CrossRef]
  131. Semenchenko, V.K. Selected Chapters in Theoretical Physics; EDUCATION: Moscow, Russia, 1966. [Google Scholar]
  132. Nishikawa, K.; Kusano, K.; Arai, A.A.; Morita, T. Density fluctuation of a van der Waals fluid in supercritical state. J. Chem. Phys. 2003, 118, 1341–1346. [Google Scholar] [CrossRef]
  133. Tovbin, Y.K. Molecular Aspects of Lattice Models of Liquid and Adsorption Systems. Russ. J. Phys. Chem. A 1995, 69, 105–113. [Google Scholar]
  134. Tovbin, Y.K. Modern State of the Lattice- Theory of Adsorption. Russ. J. Phys. Chem. A 1998, 72, 675–683. [Google Scholar]
  135. Bogolyubov, N.N. Problems of Dynamic Theory in Statistical Physics; Gostekhizdat: Moscow, Russia, 1946. [Google Scholar]
  136. Fisher, I.Z. Statistical Theory of Liquids; Chicago University: Chicago, IL, USA, 1964. [Google Scholar]
  137. Croxton, C.A. Liquid State Physics–A Statistical Mechanical Introduction; Cambridge University Press: Cambridge, UK, 1974. [Google Scholar]
  138. Martynov, G.A. Classical Static Physics; Fluid Theory; Intellekt: Dolgoprudnyi, Russia, 2011. [Google Scholar]
  139. Tovbin, Y.K.; Senyavin, M.M.; Zhidkova, L.K. Modified cell theory of fluids. Russ. J. Phys. Chem. A 1999, 73, 245–253. [Google Scholar]
  140. Ono, S.; Kondo, S. Molecular Theory of Surface Tension in Liquids, Handbuch der Physik; Springer: Berlin/Heidelberg, Germany, 1960. [Google Scholar]
  141. Zagrebnov, V.A.; Fedyanin, B.K. Spin-phonon interaction in the ising model. Theor. Math. Phys. 1972, 10, 84–93. [Google Scholar] [CrossRef]
  142. Plakida, N.M. The method of two-time Green’s functions in the theory of anharmonic crystals. In Statistical Physics and Quantum Field Theory; Nauka: Moscow, Russia, 1973; pp. 205–240. [Google Scholar]
  143. Batalin, O.Y.; Tovbin, Y.K.; Fedyanin, V.K. Equilibrium properties of a liquid in a modified lattice model. Zhurnal Fiz. Khimii 1979, 53, 3020–3023. [Google Scholar]
  144. Fedyanin, V.K. Thermodynamics of a Lattice System of Particles of Different Sizes with Contact Are-as of Different Types. In Theoretical Methods for Describing the Properties of Solutions; Interschool Collection of Scientific Works: Ivanovo, Russia, 1987; pp. 40–44. [Google Scholar]
  145. Tovbin, Y.K. Allowing for Intermolecular Vibrations in the Thermodynamic Functions of a Liquid Inert Gas. Russ. J. Phys. Chem. A 2019, 93, 603–613. [Google Scholar] [CrossRef]
  146. Barker, J.A. Lattice Theories of the Liquid State; Pergamon Press: Oxford, UK, 1963. [Google Scholar]
  147. Shakhparonov, M.I. Introduction to the Molecular Theory of Solutions; GITTL: Moscow, Russia, 1956. [Google Scholar]
  148. Morachevskii, A.G.; Smirnova, N.A.; Piotrovskaya, E.M.; Kuranov, G.L.; Balashova, I.M.; Pukinskiy, I.B.; Alekseeva, M.V.; Viktoriv, A.I. Thermodynamics of Liquid-Vapour Equilibrium; Morachevskii, A.G., Ed.; Khimiya: Leningrad, Russia, 1989. [Google Scholar]
  149. Kaplan, I.G. Introduction to the Theory of Molecular Interactions; Nauka: Moscow, Russia, 1982; 312p. [Google Scholar]
  150. Kiselev, A.V.; Poshkus, D.P.; Yashin, Y.I. Molecular Basis of Adsorption Chromatography; Khimiya: Moscow, Russia, 1986; 269p. [Google Scholar]
  151. Egorov, B.V.; Komarov, V.N.; Markachev, Y.E.; Tovbin, Y.K. Concentration dependence of viscosity under conditions of its clustering. Russ. J. Phys. Chem. A 2000, 74, 778–783. [Google Scholar]
  152. Tovbin, Y.K.; Komarov, V.N. Calculation of Compressibility and Viscosity of Non-ideal Gases with if Framework of the Lattice Model. Russ. J. Phys. Chem. A 2001, 75, 490–495. [Google Scholar]
  153. Komarov, V.N.; Tovbin, Y.K. Self-Consistent Calculation of the Compressibility and Viscosity of Dense Gases in the Lattice-Gas Model. High Temp. 2003, 41, 181–188. [Google Scholar] [CrossRef]
  154. Tovbin, Y.K. Many-Particle Interactions in Equilibrium Theories of Adsorption and Absorption. Zhurnal Fiz. Khimii 1987, 61, 2711–2716. [Google Scholar]
  155. Tovbin, Y.K.; Komarov, V.N. Calculation of the compressibility coefficient of a mixture of dense gases. Russ. J. Phys. Chem. A 2005, 79, 1807–1813. [Google Scholar]
  156. Reid, R.C.; Sherwood, T.K. The Properties of Gases and Liquids. (The Restimation and Correlation); MeGrav-Hill Boch Company: New York, NY, USA; San Francisco, CA, USA; Toronto, ON, Canada; London, UK; Sydney, Austria, 1966. [Google Scholar]
  157. Sengers, J.M.H.L.; Klein, M.; Gallagher, J. Pressure—Volume Temperature Relationships of Gases—Virial Coefficients, 3rd ed.; American Institute of Physics Handbook; American Institute of Physics: New York, NY, USA, 1972; 2364p. [Google Scholar]
  158. Rabinovich, V.A.; Vasserman, A.A.; Nedostup, V.I.; Veksler, L.S. Thermophysical Properties of Neon, Argon, Krypton, and Xenon; Standartgiz: Moscow, Russia, 1976. [Google Scholar]
  159. Crain, E.W.; Santag, R.E. The P-V-T Behavior of nitrogen, argon and their mixtures. Adv. Cryog. Eng. 1966, 11, 379. [Google Scholar]
  160. Komarov, V.N.; Rabinovich, A.B.; Tovbin, Y.K. Calculation of concentration dependences of the transport characteristics of binary mixtures of dense gases. High Temp. 2007, 45, 463–472. [Google Scholar] [CrossRef]
  161. Tovbin, Y.K. Lattice gas model in the molecular-statistical theory of equilibrium systems. Russ. J. Phys. Chem. A 2005, 79, 1903–1920. [Google Scholar]
  162. Tovbin, Y.K. Calculation of Adsorption Characteristics in the “Quasi-Point” Approximation Based on the Lattice Gas Model. Russ. J. Phys. Chem. A 1998, 72, 2053–2058. [Google Scholar]
  163. Tovbin, Y.K.; Rabinovich, A.B.; Votyakov, E.V. Calibration functions in approximate methods for calculating the equilibrium of adsorption characteristics. Russ. Chem. Bull. 2002, 51, 1667–1674. [Google Scholar] [CrossRef]
  164. Tovbin, Y.K.; Rabinovich, A.B. Phase Diagrams of Adsorption Systems and Calibration Functions in the Lattice-Gas Model. Langmuir 2004, 20, 6041–6051. [Google Scholar] [CrossRef]
  165. Patashinskii, A.Z.; Pokrovskii, V.L. Fluctuation Theory of Phase Transitions; Nauka: Moscow, Russia, 1975. [Google Scholar]
  166. Stanley, H.E. Introduction to Phase Transitions and Critical Phenomena; Clarendon: Oxford, UK, 1971. [Google Scholar]
  167. Ma, S.-K. Modern Theory of Critical Phenomena; W.A.Benjamin, Inc.: London, UK, 1976. [Google Scholar]
  168. Tsiklis, D.S. Dense Gases; Khimiya: Moscow, Russia, 1977. [Google Scholar]
  169. Kruse, A.; Dinjus, E. Hot compressed water as reaction medium and reactant: Properties and synthesis reactions. J. Supercrit. Fluids 2007, 39, 362–380. [Google Scholar] [CrossRef]
  170. Rabinovich, A.B.; Tovbin, Y.K. Supercritical fluid effect on the rates of elementary bimolecular reactions. Kinet. Catal. 2011, 52, 471–479. [Google Scholar] [CrossRef]
  171. Cooper, A.I. Polymer synthesis and processing using supercritical carbon dioxide. J. Mater. Chem. 2000, 10, 207–234. [Google Scholar] [CrossRef]
  172. McHugh, M.A.; Krukonis, V.J. Supercritical Fluid Extraction: Principles and Practice; Butter-Worth Publishers: Stoneham, MA, USA, 1994. [Google Scholar]
  173. Rabinovich, A.B.; Tovbin, Y.K. Effect of a supercritical fluid on the characteristics of sorption processes. Russ. Chem. Bull. 2010, 59, 1–6. [Google Scholar] [CrossRef]
  174. Franck, E.U. Physicochemical Properties of Supercritical Solvents (Invited Lecture). Berichte Bunsengesellschaft Physikalische Chemie 1984, 88, 820–825. [Google Scholar] [CrossRef]
  175. Lemenovskii, D.A.; Yurin, S.A.; Timofeev, V.V.; Popov, V.K.; Bagratashvili, V.N.; Gorbaty, Y.E.; Brusova, G.P.; Lunin, V.V. Reactions of Ozone with Organic Substrates in Supercritical Carbon Dioxide. Sverhkriticheskie Flyuidy Teor. Prakt. 2007, 2, 30–42. [Google Scholar]
  176. Tovbin, Y.K. Molecular grounds of the calculation of equilibrium and transport characteristics of inert gases and liquids in complex narrow-pore systems. Russ. Chem. Bull. 2003, 52, 869–881. [Google Scholar] [CrossRef]
  177. Anisimov, M.A.; Rabinovich, V.A.; Sychev, V.V. Thermodynamics of Critical State; Energoatomizdat: Moscow, Russia, 1990. [Google Scholar]
  178. Chapman, S.; Cowling, T. The Mathematical Theory of Nonequilibrium Gases; Cambridge University Press: Cambridge, UK, 1953. [Google Scholar]
  179. DiMarzio, E.A. Statistics of Orientation Effects in Linear Polymer Molecules. J. Chem. Phys. 1961, 35, 658–669. [Google Scholar] [CrossRef]
  180. Chandrasekhar, S. Liquid Crystals; Cambridge University: Cambridge, UK, 1977. [Google Scholar]
  181. Bazarov, I.P.; Gevorkyan, E.V. Statistical Theory of Solid and Liquid Crystals; Moscow State University: Moscow, Russia, 1983. [Google Scholar]
  182. Tovbin, Y.K. Refinement of taking into account molecule sizes in the lattice gas model. Russ. J. Phys. Chem. A 2012, 86, 705–708. [Google Scholar] [CrossRef]
  183. Tovbin, Y.K. Possibilities of the Molecular Modeling of Kinetic Processes under Supercritical Conditions. Russ. J. Phys. Chem. A 2021, 95, 429–444. [Google Scholar] [CrossRef]
  184. Vukalovich, M.P.; Altunin, V.V. Thermophysical Properties of Carbon Dioxide; Atomizdat: Moscow, Russia, 1965. [Google Scholar]
  185. Titov, S.V.; Tovbin, Y.K. Lattice model of a polar liquid. Russ. Chem. Bull. 2011, 60, 11–19. [Google Scholar] [CrossRef]
  186. Titov, S.V.; Tovbin, Y.K. A molecular model of water based on the lattice gas model. Russ. J. Phys. Chem. A 2011, 85, 194–201. [Google Scholar] [CrossRef]
  187. Bell, G.M. Statistical mechanics of water: Lattice model with directed bonding. J. Phys. C Solid State Phys. 1972, 5, 889–905. [Google Scholar] [CrossRef]
  188. Bell, G.M.; Salt, D.W. Three-dimensional lattice model for water/ice system. J. Chem. Soc. Faraday Trans. 1976, 72, 76–86. [Google Scholar] [CrossRef]
  189. Franks, F. (Ed.) Water: A Comprehensive Treatise; Plenum: New York, NY, USA; London, UK, 1972; Volume 1. [Google Scholar]
  190. Eisenberg, D.; Kautsman, V. Structure and Properties of Water; Gidrometeoizdat: Leningrad, Russia, 1975. [Google Scholar]
  191. Tovbin, Y.K.; Titov, S.V. Role of local environment relaxation in calculating the rates of elementary processes in vapor-liquid systems. Russ. J. Phys. Chem. A 2013, 87, 185–190. [Google Scholar] [CrossRef]
  192. Frenkel, Y.I. Kinetic Theory of Liquids; Oxford University: London, UK, 1946. [Google Scholar]
  193. Angell, C.A. Water: A Comprehensive Treatise; Franks, F., Ed.; Plenum: New York, NY, USA, 1978; Volume 7, p. 23. [Google Scholar]
  194. Malenkov, G.; Tytik, D.; Zheligovskaya, E. Structural and dynamic heterogeneity of computer simulated water: Ordinary, supercooled, stretched and compressed. J. Mol. Liq. 2003, 106, 179–198. [Google Scholar] [CrossRef]
  195. Tovbin, Y.K. Kinetic equations for processes of local rearrangement of molecular systems. Russ. J. Phys. Chem. B 2011, 5, 256–270. [Google Scholar] [CrossRef]
  196. Tovbin, Y.K. Taking environment into account in the theory of liquid-phase reaction rates with electron transfer in the discrete solvent model. Russ. J. Phys. Chem. A 2011, 85, 238–244. [Google Scholar] [CrossRef]
  197. Tovbin, Y.K. Kinetic equation for the processes of local reorganization of molecular systems with charged species. Russ. J. Phys. Chem. B 2012, 6, 716–729. [Google Scholar] [CrossRef]
  198. Tovbin, Y.K. Local equations of state in nonequilibrium heterogeneous physicochemical systems. Russ. J. Phys. Chem. A 2017, 91, 403–424. [Google Scholar] [CrossRef]
  199. Gaydamaka, S.N.; Timofeev, V.V.; Guryev, Y.V.; Lemenovskiy, D.A.; Brusova, G.P.; Parenago, O.O.; Bagratashvili, V.N.; Lunin, V.V. Processing of coked Pt-Re/γ-Al2O3 catalysts with high-concentration ozone dissolved in supercritical carbon dioxide. Sverhkriticheskie Flyuidy Teor. Prakt. 2010, 5, 76–91. [Google Scholar] [CrossRef]
  200. Adamson, A. The Physical Chemistry of Surfaces; Wiley: New York, NY, USA, 1976. [Google Scholar]
  201. Barker, J.A.; Henderson, D. What is “liquid”? Understanding the states of matter. Rev. Mod. Phys. 1976, 48, 587–671. [Google Scholar] [CrossRef]
  202. Tovbin, Y.K. The problem of a self-consistent description of the equilibrium distribution of particles in three states of aggregation. Russ. J. Phys. Chem. A 2006, 80, 1554–1566. [Google Scholar] [CrossRef]
  203. Tovbin, Y.K. A Theory of Liquid-Phase Reaction Rates Including Coulomb Terms in the Lattice Gas Model. Russ. J. Phys. Chem. A 1996, 70, 1655–1660. [Google Scholar]
  204. Prigogine, I.; Defay, R. Chemical Thermodynamics; Longmans Green and Co.: London, UK, 1954. [Google Scholar]
  205. Glauber, R.J. Time-Dependent Statistics of the Ising Model. J. Math. Phys. 1963, 4, 294–307. [Google Scholar] [CrossRef]
  206. Tovbin, Y.K. Kinetics and equilibrium in ordered systems. Dokl. AN SSSR 1984, 277, 917–921. [Google Scholar]
  207. Tovbin, Y.K. Concentration Dependence of the Transfer Coefficients of Molecules in Mesopores in the Capillary-Condensation Region. Russ. J. Phys. Chem. A 1998, 72, 1298–1303. [Google Scholar]
  208. Reif, F. Statistical Physics. Berkeley Physics Course; Mcgraw–Hill Book Company: New York, NY, USA, 1965; Volume 5. [Google Scholar]
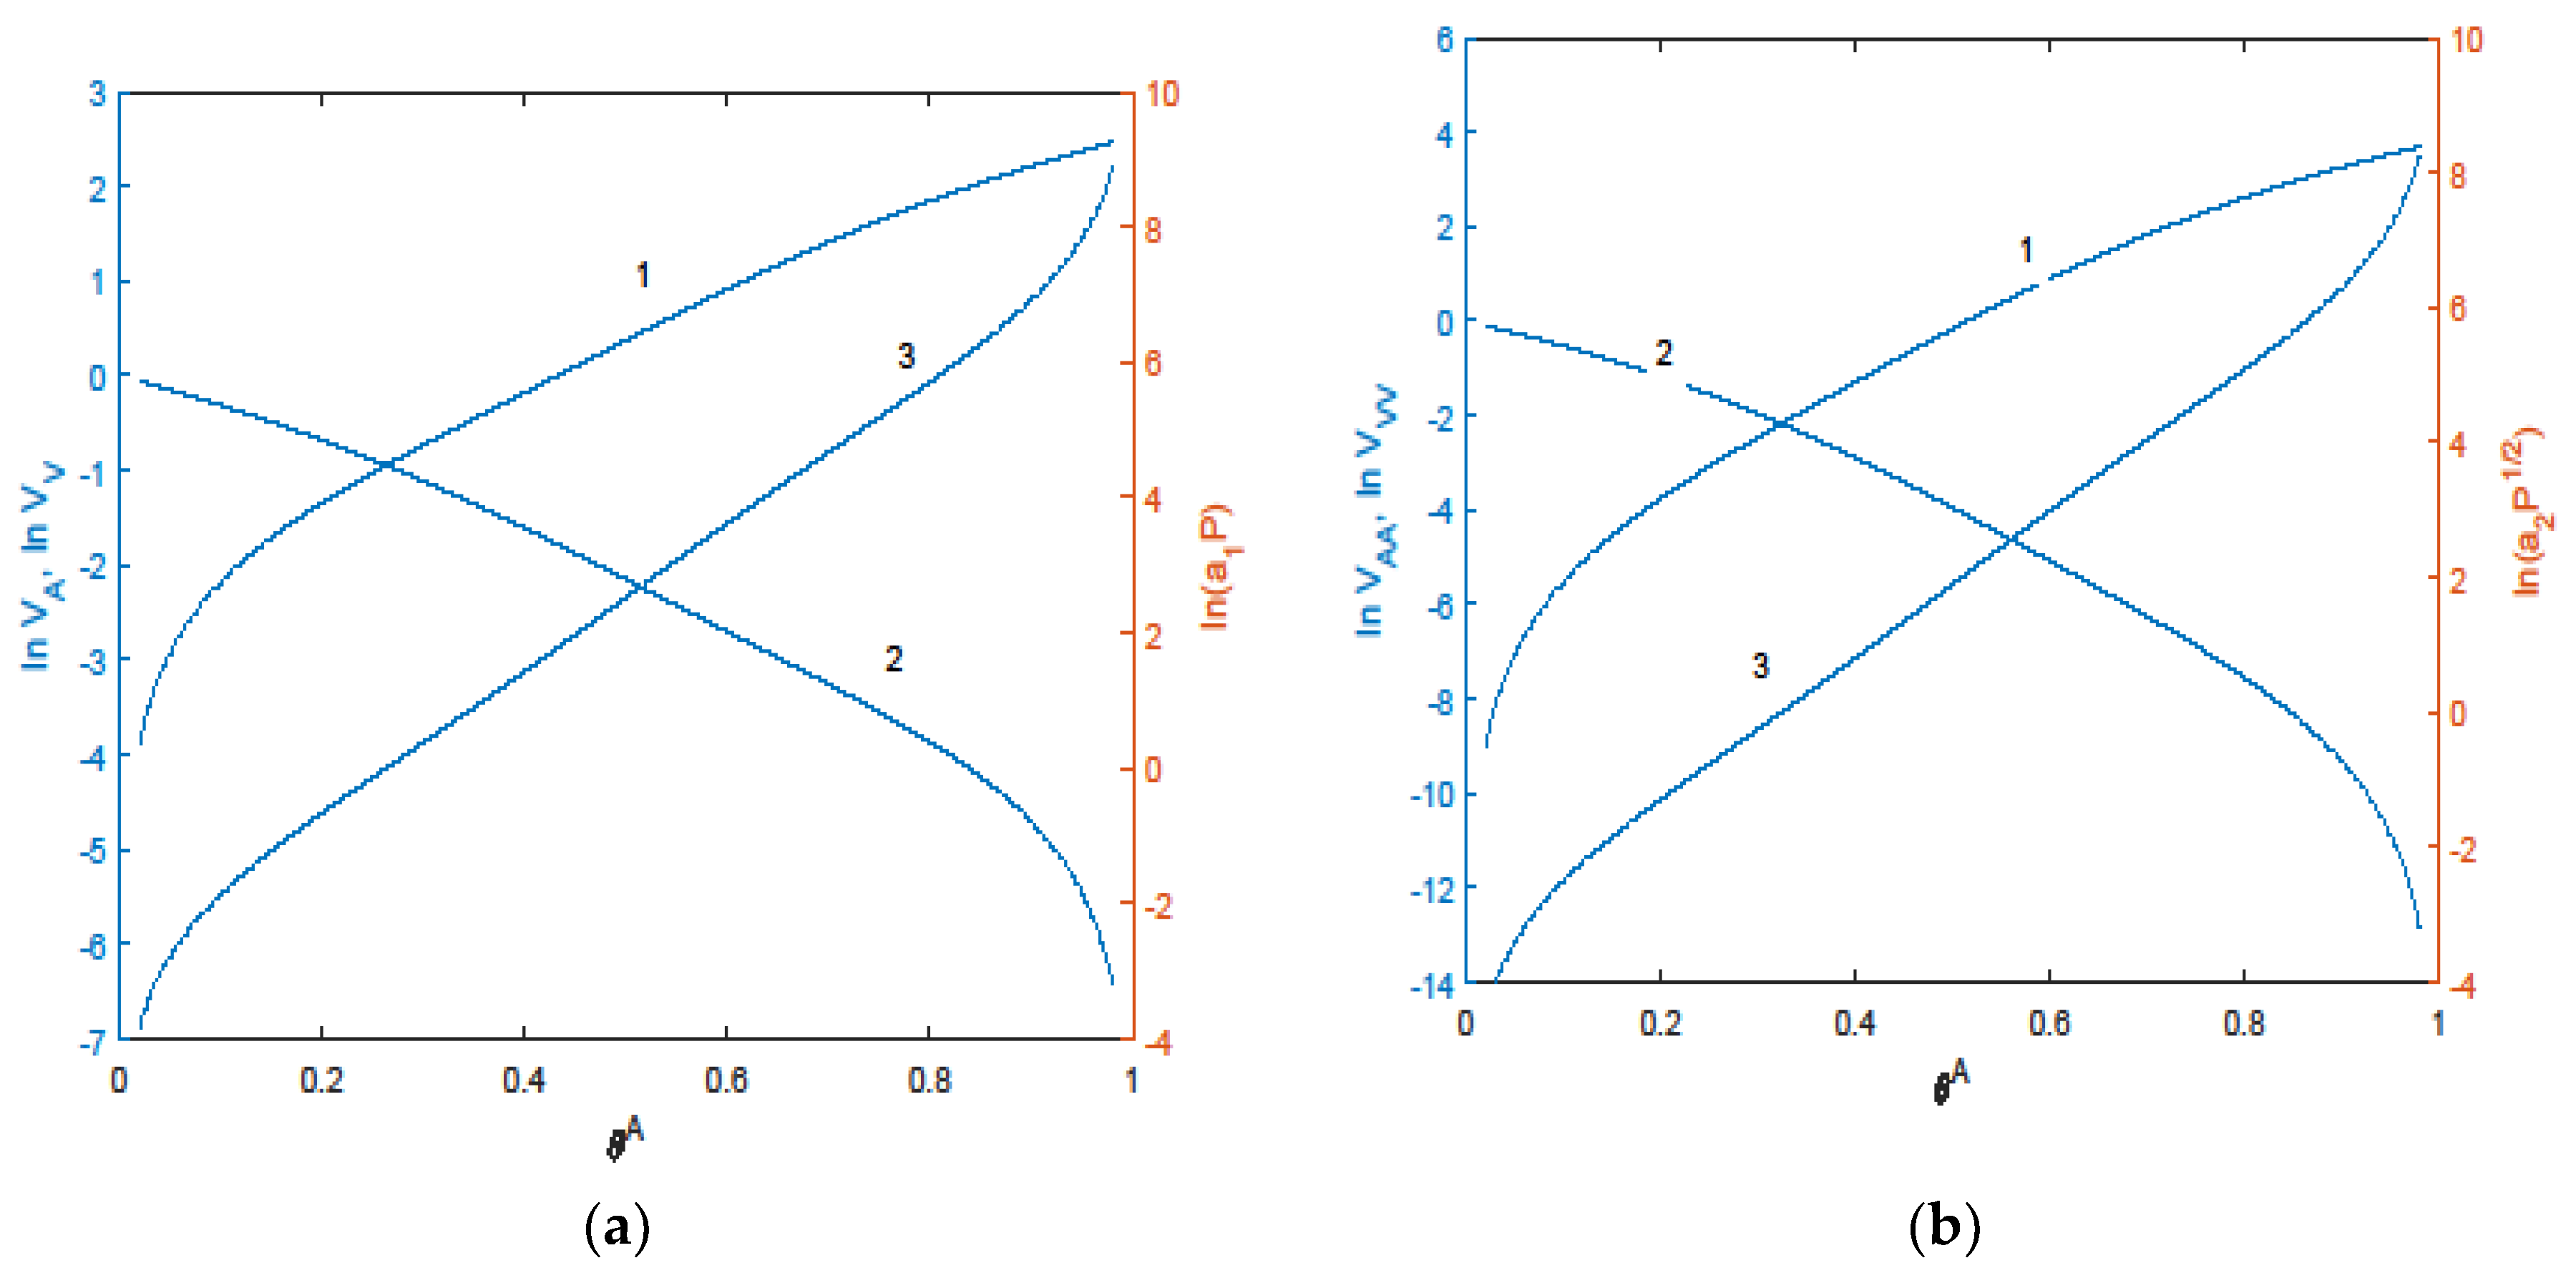
Figure 1. Concentration factors (Vi and Vii) in rates of non-dissociative (a) and dissociative (b) adsorption (curves 1) and desorption (curves 2) for a non-ideal chemisorption (εAA < 0) system (Vi = Ui/Ki, Vii = Uii/Kii). Curves 3 (right y-axis) correspond to the equilibrium isotherm.
Processes 11 02541 g001
Figure 2. Concentration dependence of EA(ef) for monomolecular desorption at 300 K calculated in the case of (1) fast and (2) slow elementary stage [123].
Processes 11 02541 g002
Figure 3. A supercritical area on the phase diagram of the van-der-Waals substances (A-MSC-SC-B-A) for which thermodynamics parameters are not desirable for technological processes.
Processes 11 02541 g003
Figure 4. (a) Concentration dependences of the argon compressibility factor in [151]. Experimental values at 162 K [157] (dots); LGM calculations (1); calculations using the virial equations in [156]; (2) with regard to the second virial coefficient; (3) with regard to the second and third virial coefficients; (4) with regard to the second–fourth virial coefficients. The inset shows the phase diagram of argon. Symbols represent experimental values from [158]; the solid line represents calculations in [155] for dtr = 0.15, u = 0.00075. (b) Phase diagrams of Ar, N2, and an Ar–N2 mixture at different compositions with nitrogen mole fractions xN2 = (1) 0, (2) 0.2, (3) 0.4, (4) 0.6, (5) 0.8, (6) 1.0. Symbols represent experimental values from [159]; solid lines represent calculations in [160].
Processes 11 02541 g004
Figure 5. Generalized compressibility factors of dense gases that obey the law of corresponding states [161].
Processes 11 02541 g005
Figure 6. Dependences of a system’s pressure on the concentration of ammonia in a binary ammonia–nitrogen mixture at different temperatures. Experimental values from [168] are on the left; calculated values are on the right. Temperature values on the right lines from bottom to top: 90, 110, 120, 130, 140, 170, and two lines around 180, and 210°.
Processes 11 02541 g006
Figure 7. Dependence of adsorption of the basic component A in binary mixture of component A and component SCF for rising pressure of SCF for fixed concentration component A corresponding to θA = 0.05 (1), 0.5 (2), and 0.85 (3) for weak (a) and strong (b) adsorption [173].
Processes 11 02541 g007
Figure 8. Dependences EAC on the degree of occupancy θ at εCC = 0.38 (energy, kcal/mol), εAA = 4εCC, and εBB = 2.4εCC for T = 1.1Tc; E12 = (1) 3, (2) 10, (3) 20; and T = 2.5Tc, E12 = (4) 3, (5) 10, (6) 20. Curves correspond to reagent concentrations xA = xB = 0.01-mole fractions.
Processes 11 02541 g008
Figure 9. Self-diffusion coefficient of component A (DA) as a function of θ = (θA + θC) at γA= εAACC = (1) 1, (2) 1.6, (3) 3.2, and (4) 6.4 for τ = 1.15. Solid lines: θA= 0.01; dotted lines: θA = 0.1.
Processes 11 02541 g009
Figure 10. Viscosity as a function of θ at γA = (1) 1, (2) 1.6, (3) 3.2, and (4) 6.4 for τ =1.15. Solid lines: θA = 0.01; dotted lines: θA = 0.1.
Processes 11 02541 g010
Figure 11. (a) Dependences of O2 shear viscosity η on pressure P at different gas temperatures: (1) 289, (2) 328 K. Dots are experimental values from [177]. (b) Analogous dependences for low densities. (c) Generalized diagram of reduced shear viscosity η/η0, depending on reduced pressure Pr at different reduced temperatures Tr. Dots are experimental values from [23,26].
Processes 11 02541 g011
Figure 12. (a) Heat capacity coefficients of argon at (1) 273 and (2) 400 K. Dots represent experimental values [158,177]; lines represent calculations [152]. (b) Experimental data on the generalized heat capacity coefficient in [26]. Dots represent experimental values; lines represent calculations.
Processes 11 02541 g012
Figure 13. (a) Generalized diagrams of the self-diffusion coefficient for the p/pC < 4 range of pressures. Lines represent calculations in [160]; dots represent experimental values from [26] at τ = (1) 1, (2) 1.1, (3) 1.2, (4) 1.3, (5) 1.4, (6) 1.6, (7) 2, and (8) 3. (b) Generalized diagrams of the mutual diffusion coefficients of an Ar–N2 mixture with x N 2 = 0, 0.2, 0.4, 0.5, 0.6, 0.8, and 1.0-mole fractions at τ = (1) 1, (2) 1.3, and (3) 3 in the p/pc < 4 range of pressures. Series of curves calculated for each τ value are displayed from the bottom up as the concentration of nitrogen grows [160]. Dots represent experimental data recalculated according to the rules in [26].
Processes 11 02541 g013
Figure 14. Logarithmic dependences η m / η m 0 on reduced density ρrm, obtained for a binary Ar–N2 mixture at different reduced temperatures τ: (1) 0.75, (2) 1, and (3) 3; thick lines represent the calculated values from [160]; thin lines represent experimental values from [26].
Processes 11 02541 g014
Figure 15. Comparison of experimental [184] (dots) and calculated lines of compressibility factors for CO2 molecules; calculations were made for (1, 2, 4) T = 273 and (3) 373 K.
Processes 11 02541 g015
Figure 16. Comparison of the temperature dependence of the water self-diffusion coefficient. Dots represent the experimental values in [190]; lines represent the calculations performed in the work [191].
Processes 11 02541 g016
Disclaimer/Publisher’s Note: The statements, opinions and data contained in all publications are solely those of the individual author(s) and contributor(s) and not of MDPI and/or the editor(s). MDPI and/or the editor(s) disclaim responsibility for any injury to people or property resulting from any ideas, methods, instructions or products referred to in the content.