Review

Recent Progress in Fill Media Technology for Wet Cooling Towers

1
Department of Mechanical Engineering, National Yang-Ming Chiao Tung University, Hsinchu 300, Taiwan
2
Green Energy & Environment Research Laboratories, Industrial Technology Research Institute, Hsinchu 310, Taiwan
*
Author to whom correspondence should be addressed.
Processes 2023, 11(9), 2578; https://doi.org/10.3390/pr11092578
Submission received: 8 August 2023 / Revised: 21 August 2023 / Accepted: 26 August 2023 / Published: 28 August 2023

Abstract

:
Cooling towers are extensively utilized in diverse industries for efficient heat dissipation. Fill media are a critical component, facilitating heat and mass exchange between water and air, impacting overall cooling tower efficiency. Given its vital importance, this study comprehensively reviews recent advancements in fill media technology, illuminating cooling tower technology progress and exploring the effects of different fill media configurations and materials on cooling tower performance. It should be noted that the majority of research is focused on the Range of 2.5 °C to 25 °C and Approach of 1 °C to 9 °C. Through comprehensive analysis and evaluation, the effects of various fill media on heat transfer efficiency, water cooling capacity, and energy consumption are intensively summarized. By understanding these effects, engineers and designers can make rational decisions to optimize cooling tower performance and ensure efficient heat dissipation. Notably, in some reported cases, new fill media enhanced cooling range, effectiveness, and the Merkel number by 28%, 85%, and 131%, respectively. Ultimately, this paper serves as a valuable resource for academics, researchers, and professionals in the field of cooling tower design and thermal management. The insights provided in this study can help industries achieve greater energy efficiency, sustainability, and overall operational excellence.

1. Introduction

Cooling towers play a pivotal role as the ultimate heat rejection devices for processed water from power plants, industrial processes, HVAC&R (heating, ventilation, air conditioning, and refrigeration) systems, and the like. There are two primary kinds of cooling towers. The first type is the open cooling tower or direct-contact cooling tower (shown in Figure 1), which allows water to come into direct contact with the cooling atmosphere, enabling the heat load source to be directly transferred to the air. The second type is the closed-circuit cooling tower (shown in Figure 2), which involves indirect contact between the heated fluid and the atmosphere. This type essentially combines a heat exchanger and a cooling tower into one relatively small unit.
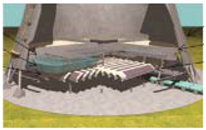
Wet and dry cooling towers (shown in Figure 3 and Figure 4) are two subcategories of cooling towers that differ in their method of heat transfer. Wet cooling towers utilize evaporative cooling, where water is sprayed onto the surface of heat exchange media, such as packing or tubes, and the heat is transferred through evaporation. In contrast, dry cooling towers use air as the cooling medium, and heat is transferred from the hot water passing through the tubes to the ambient air through a heat exchanger. Dry cooling towers, known for their ability to minimize water consumption, are often chosen in the case of water scarcity or environmental considerations. While wet cooling towers are more efficient in terms of cooling, they consume more water than dry cooling towers. On the other hand, dry cooling towers consume less water but are less efficient [1].
The wet cooling towers operate through direct contact between air and processed water, causing water to evaporate and thereby lowering the temperature of the processed water. By employing direct evaporation for heat removal, wet cooling towers use only about 5% of the water consumption rate of a once-through system, making them the most cost-effective option. Moreover, the discharge of heated water (blowdown) is minimal, which greatly reduces the ecological impact. Normally, cooling towers can cool water to within 2.22 to 2.78 °C of the ambient wet-bulb temperature, which is always lower than the ambient dry-bulb temperature and approximately 19.4 °C lower than air-cooled systems of a reasonable size (between 879 to 1758 kW). This lower temperature improves the entire system’s efficiency, thereby significantly reducing energy use and increasing process output [2].
In various HVAC&R systems, one or multiple chillers are utilized to meet the cooling demands of a building. These chillers typically adopt water-cooled condensers, where the water absorbs heat from the condenser, followed by dumping the heat into the atmosphere. This essential heat dissipation process is carried out by a designated cooling tower. Cooling towers employ a combined process of heat and mass transfer to effectively cool the water. The water designated for cooling is uniformly distributed within the tower using spray nozzles, splash bars, or film-type fill. The fill offers a substantial contact surface area with water and the atmospheric air to facilitate effective heat transfer. Upon the direct-contact heat transfer between air and water, a fraction of the water undergoes a phase change from liquid to vapor at a certain water vapor pressure, absorbing heat from the water itself and lowering the temperature accordingly. The driving forces include heat transfer and mass transfer (in this case, water vapor) which are associated with the temperature difference and vapor pressure difference, respectively. The effectiveness of heat and mass transfer is a function of heat and mass transfer coefficients, as well as the extent of the surface area exposed to heat and mass transfer.
Several factors determine the classification of cooling towers. One of the key factors is whether the tower has a fan (mechanical draft) or not (natural draft). Natural draft cooling towers are very large and rely on the natural convection currents created by the temperature difference between the warm air inside the tower and the cooler outside air. They are typically used in large power plants and industrial facilities where large amounts of waste heat need to be dissipated. The size of natural draft towers is significant due to their reliance on buoyancy-driven air flow.
The mechanical draft cooling towers use fans to actively move air through the tower, which can increase the heat exchange rate. They are suitable when precise control over the cooling process is needed or when environmental conditions (such as high ambient temperatures) require extra air flow. Fan-assisted cooling towers are often used in industries with varying heat loads or when the heat load is relatively high. In the case of mechanical draft, the tower can either be forced or induced draft, depending on the location of the fan relative to the filled bed. In forced draft cooling towers, fans are used to force air through the tower, enhancing the heat exchange process. They are often used in applications where a specific amount of cooling needs to be achieved regardless of ambient conditions. Forced draft towers are commonly found in HVAC systems for commercial and industrial buildings. Induced draft towers, on the other hand, have fans located at the top of the tower that create a negative pressure, drawing air upwards through the tower. These towers are versatile and can handle a wide range of cooling needs. They are often used in power plants, refineries, and other industrial processes.
Another important factor is the method of heat transfer. Heat transfer in cooling towers involves various mechanisms such as conduction, convection, and evaporation, but the most significant transfer method is via evaporation or mass transfer. One of the most important factors in enhancing the efficiency of wet cooling towers is to increase the surface area for more contact area and residence time for heat and mass transfer, which is achieved through the use of fill media. Fill media in wet cooling towers are designed to maximize the contact area between the air and water and the resident time for contact, facilitating efficient heat and mass transfer. Since the filling section contributes to 70% of the heat transfer within wet cooling towers [3], careful selection and maintenance of the packing material are essential for maximizing the overall performance of the cooling tower. The characteristics of the fillings directly impact the heat transfer efficiency and operating costs of the cooling towers. The design, arrangement, and material properties of the fillings play a vital role in their heat transfer capabilities.
Over the years, researchers and engineers have been dedicated to improving the design, materials, and functionality of fill media. These improvements are driven by the need to optimize heat and mass transfer processes, reduce energy consumption, and ensure the sustainable operation of wet cooling towers. In this regard, this paper aims to provide a comprehensive review of the recent progress in fill media, including innovations in design and material, progress in manufacturing techniques, and their impact on heat transfer efficiency, and aggregate and present data that can be practically applied in the design of cooling towers. Based on a comprehensive review of the recent literature, an overview on the efficacy of fill media in cooling towers is provided in this paper. Special attention will be given to the incorporation of advanced materials with enhanced thermal properties. Additionally, the utilization of novel geometries and configurations in fill media designs will be explored. Furthermore, the review will examine the impact of fill media on the functioning of the cooling tower and pressure drop issues. The impact of these advancements on the overall cost-effectiveness and reliability of wet cooling towers will also be discussed.

2. Fill Media in Cooling Towers

In industrial applications involving heat and mass transfer, fill media play a critical role in enhancing efficiency and optimizing performance. By utilizing appropriate fill media, cooling towers can achieve higher cooling efficiencies, reduce water consumption, and enhance overall system performance. The selection and design of fill media play a crucial role in maximizing the heat transfer capabilities of cooling towers while minimizing operational costs. This section provides an in-depth overview of fill media, exploring the various types and characteristics available. Understanding the different types of fill media and their unique properties is critical for selecting the most suitable option for specific industrial processes.

2.1. Significance of Fill Media

Fill media, also known as fill packing or filling, contain a large surface area per unit volume to facilitate effective heat transfer and mass transfer. The cooling tower’s effectiveness is enhanced by the fill media, which optimize the heat exchange surface area. When water is distributed over the fill media, it forms thin films or droplets that contact the air passing through the tower. Fill media are typically composed of inexpensive materials with low thermal conductivity, such as plastic, metal, or wood. The use of high thermal conductivity materials like metals is usually not necessary as far as effective heat transfer is concerned; this is because the main objective of the filling is to provide more surface/time for direct contact with water and air. The amount of heat that is transferred across the filling between air and water is usually insignificant. The fillings are structured in a way that provides a large surface area for the water–air interaction.
It should be noted that fill media increase the surface area without significantly altering the volume. This expansion in surface area is expected to enhance both heat and mass transfer, as well as increase the pressure drop. It is customary to define a compactness parameter, called specific area or wettability [4,5,6,7]. This parameter represents the ratio of the total surface area of the fill media to their volume, typically falling within the range of 200 to 500 m2/m3 [5,8]. However, with an increase in specific area, there is also a corresponding rise in pressure drop, leading to higher fan power consumption.
When dealing with high specific area values, it is important to consider the impact of increased air velocity within the fill media, as excessive noise generation must be avoided. Furthermore, cooling towers are typically situated at a considerable distance from populated areas to minimize potential disturbances caused by noise. They are strategically placed in cool areas, preferably in close proximity to the chillers. Whether located on the building’s rooftop or adjacent to the structure on the ground, efforts are made to minimize the cooling tower’s volume and height. This is carried out to align with architectural designs and to optimize land usage, considering that land area can be expensive and valuable.
In summary, the addition of a cost-effective fill media results in a decrease in the required volume of the cooling tower, making it smaller while improving heat and mass transfer. However, it also leads to an increase in pressure drop, subsequently impacting fan power consumption. A trade-off exists between these parameters, which are all subject to engineering rules, regulations, and cost considerations.

2.2. Types of Fill Media

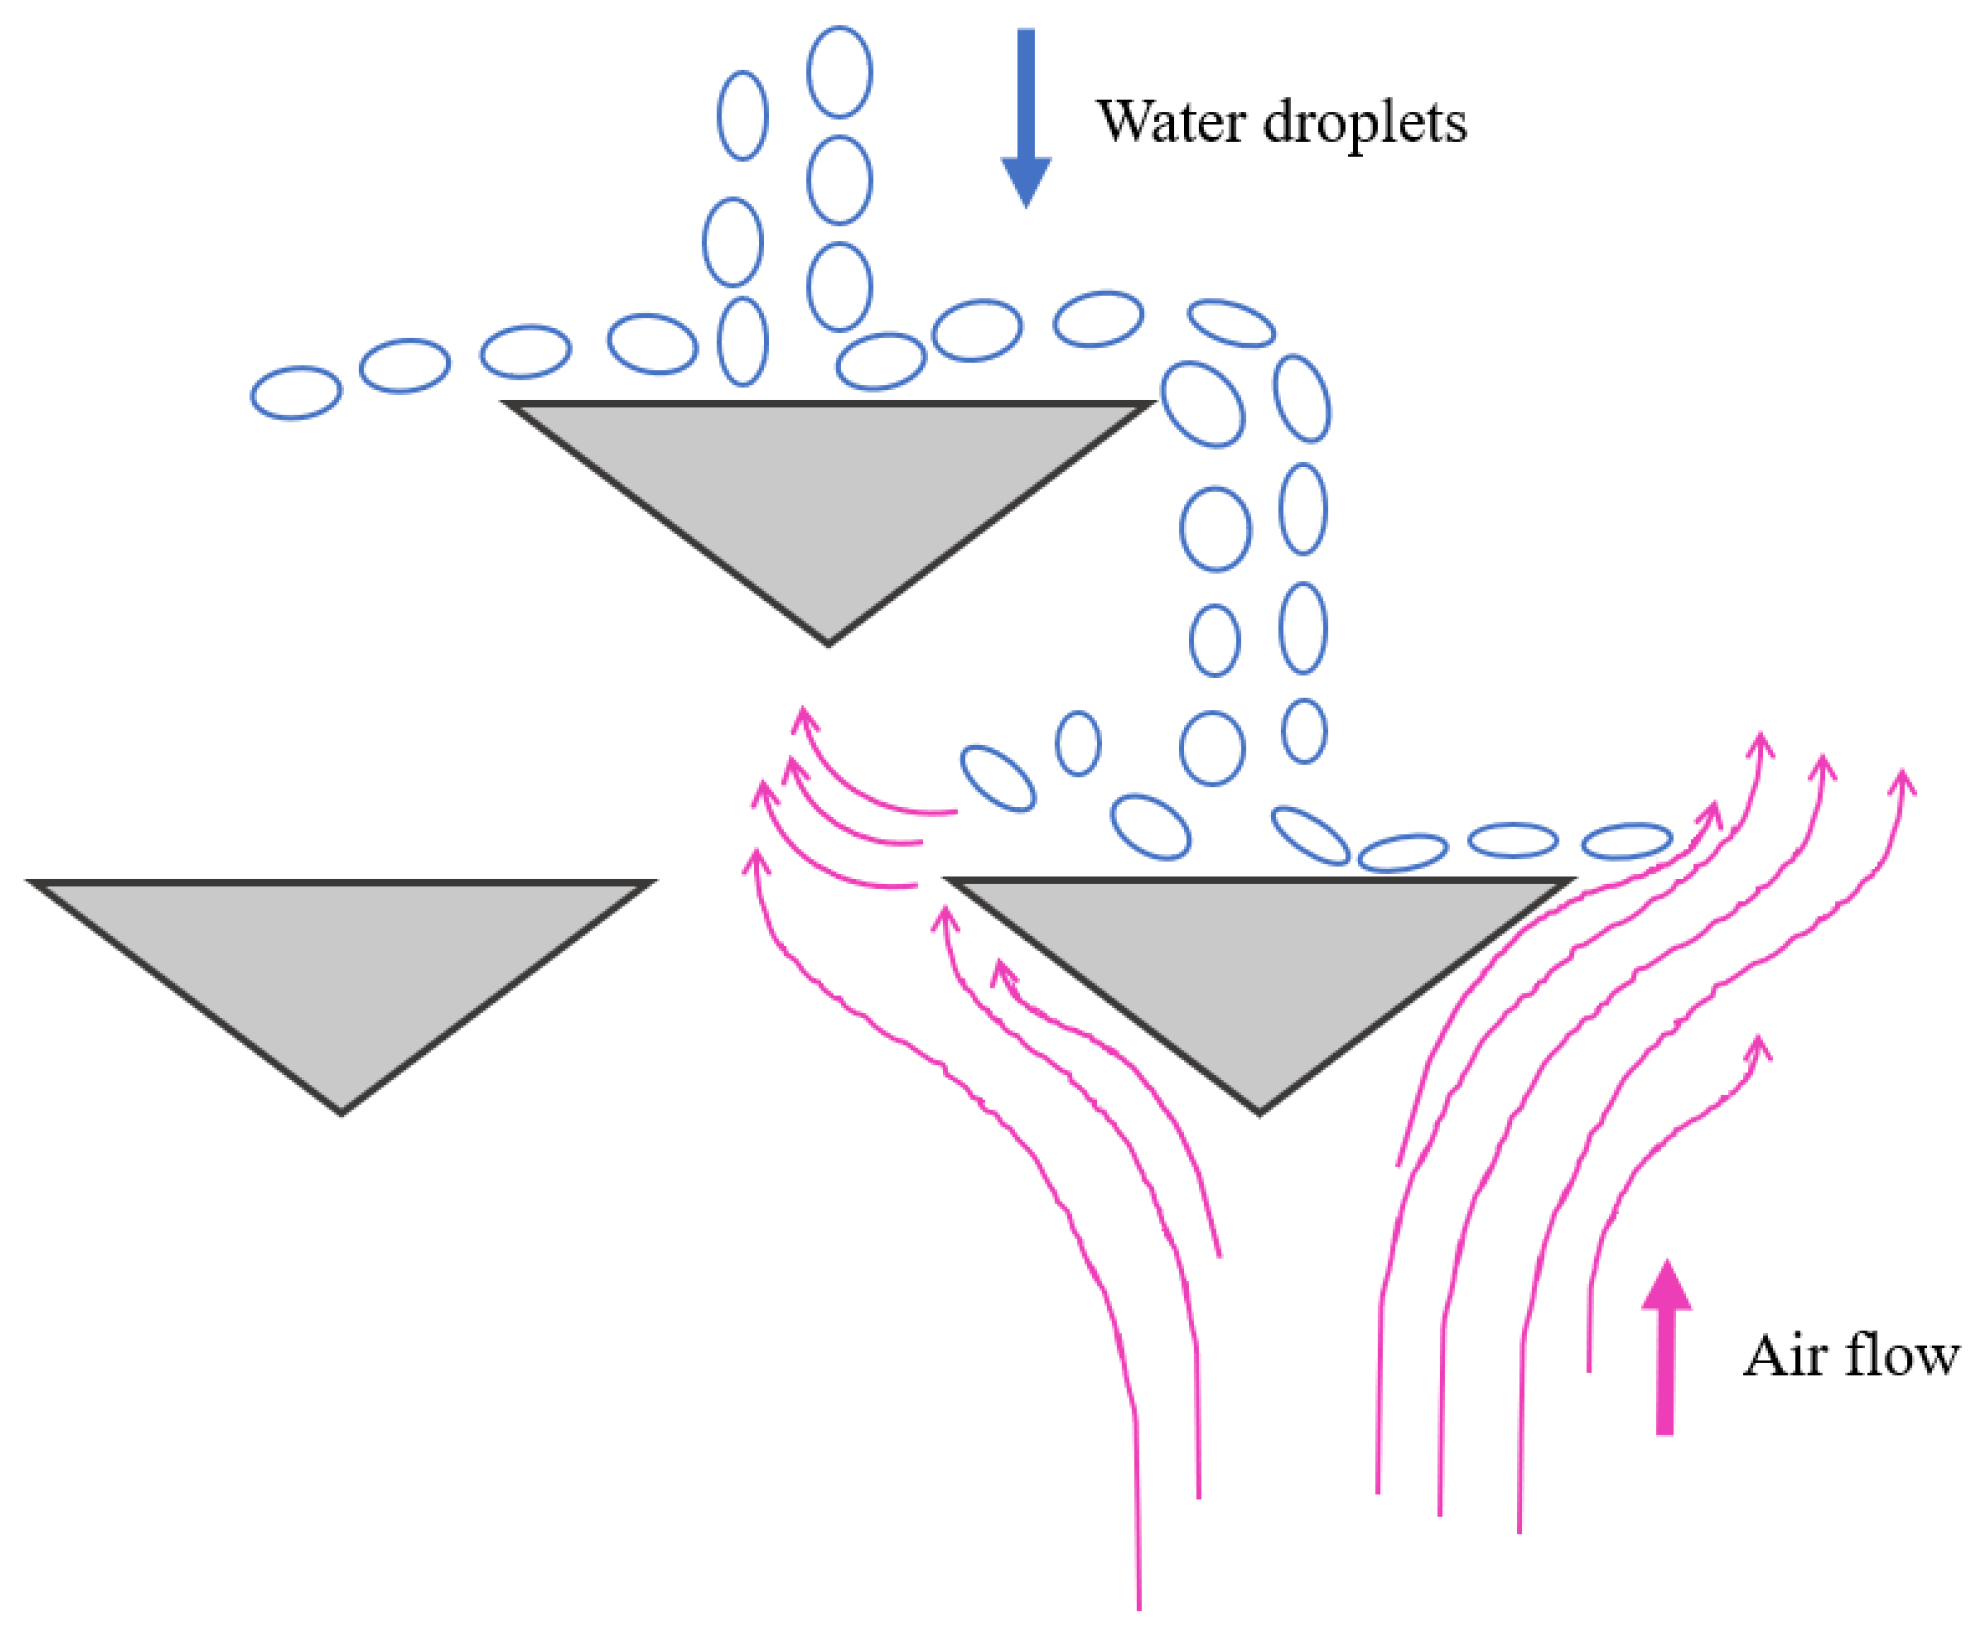
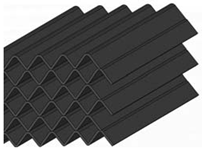
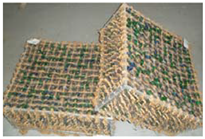
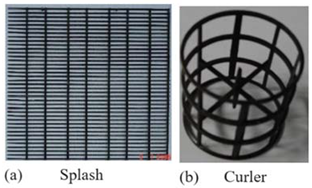
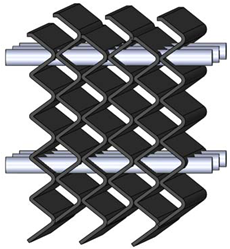
Cooling tower fill is typically made up of thin, closely spaced sheets or elements, often arranged in a honeycomb or corrugated pattern. The two main types of fill are splash-type and film-type [2]. As shown in Figure 5, splash-type fill is designed to enhance the contact area and duration of falling water. This is achieved by directing the water over staggered splash bars arranged at various levels, causing it to cascade through each elevation. This specific type of fill causes the descending water droplets to break up into smaller droplets, which increases the droplet surface area for heat transfer between the water and air. This adds to the surface area provided by the wet film surrounding the fill. Another advantage of the smaller droplets is their propensity to separate dirt particles from the water. Furthermore, this fill type offers the advantage of generating a low-pressure drop across the cooling tower [9].
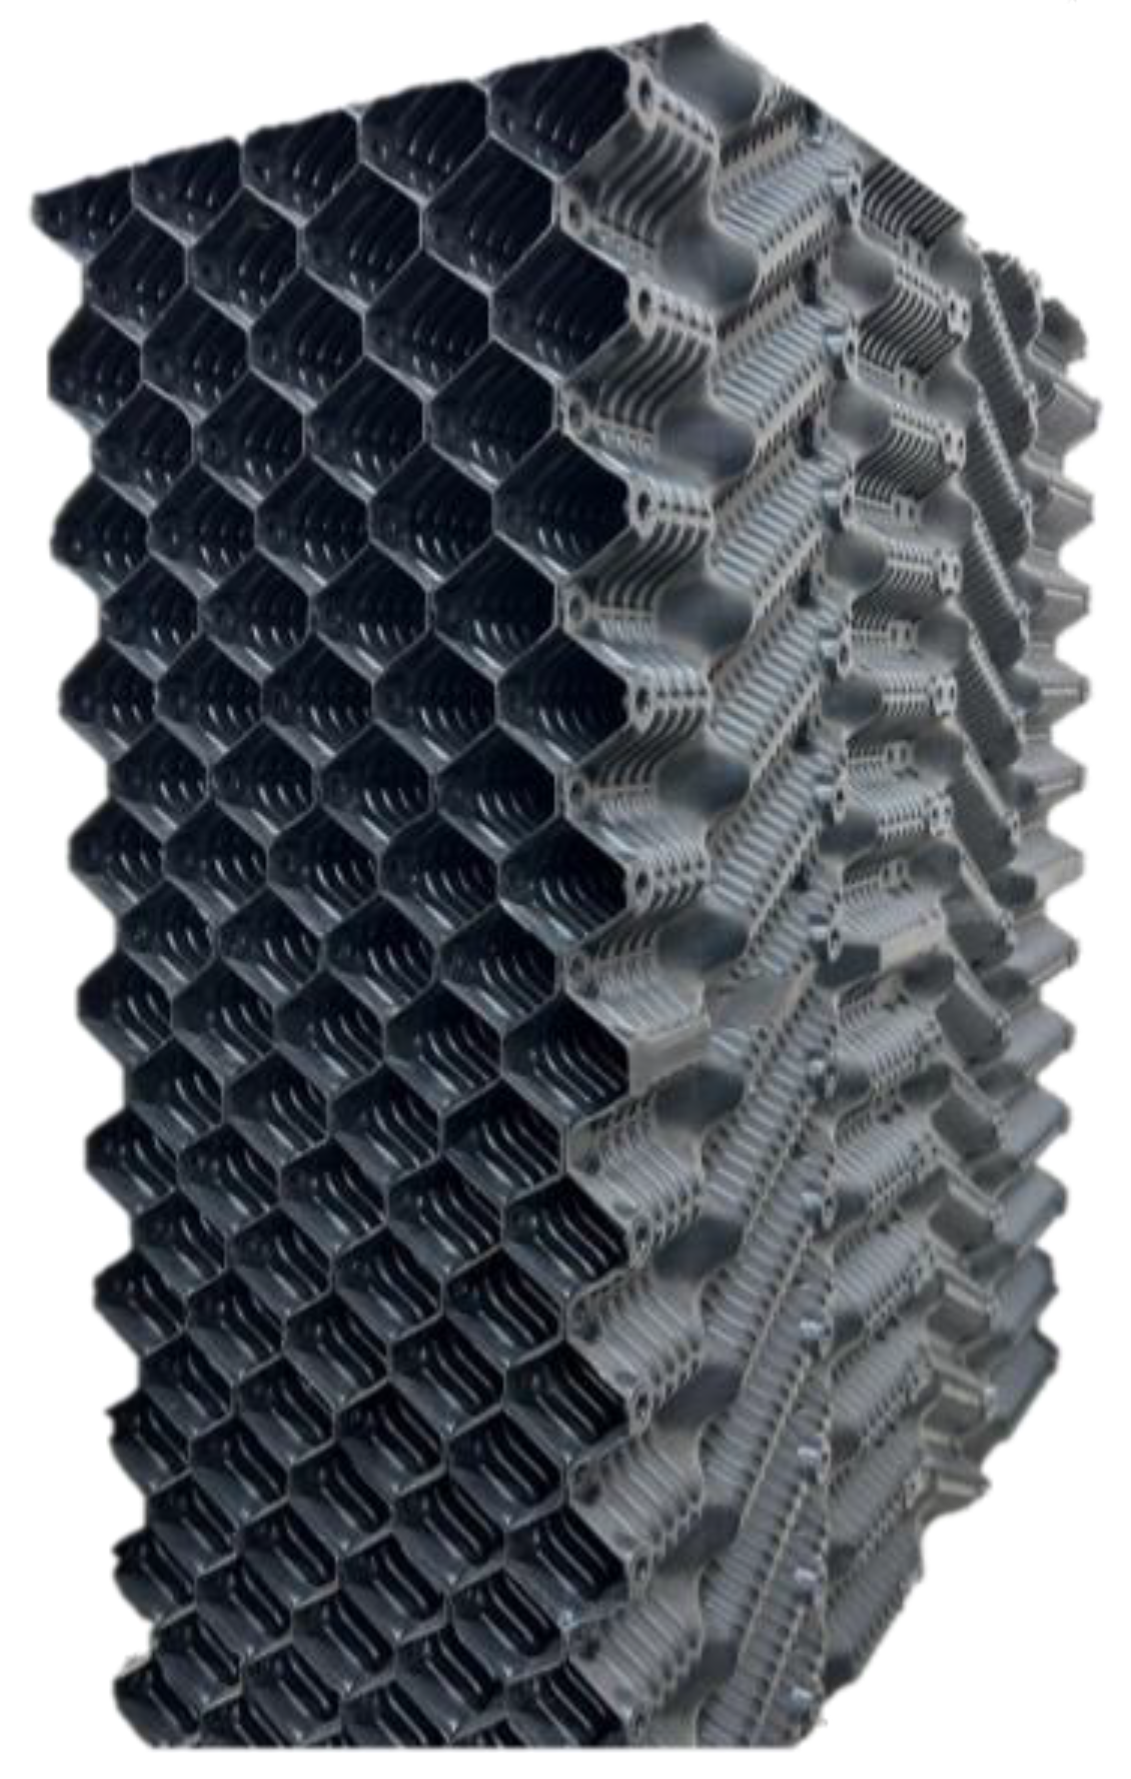
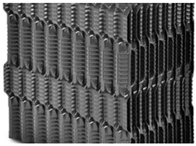
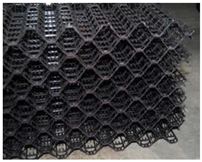
The film-type fill (shown in Figure 6) functions in a similar manner by directing the water over closely spaced vertically arranged sheets, typically made of polyvinyl chloride (PVC). This causes the water to form a thin film over the surface of the sheets to facilitate falling film evaporation [2].
The choice of fill media can significantly impact the performance of a cooling tower, water consumption, and overall system performance. Various types of fill exhibit varying characteristics that impact heat transfer efficiency, pressure drop, and resistance to fouling. Careful selection of fill media based on the specific cooling tower system requirements is vital to optimize its performance.
Numerous studies have examined the effect of various fill types on the thermal/hydraulic performance of cooling towers, along with comprehensive analyses of energy consumption and operating costs. Table 1 presents a concise summary of various fill media based on experimental research. While numerous studies focus on modeling and numerical simulation, this table only includes experimental investigations conducted after the year 2016. The table comprises 14 distinct experiments, which can be classified into two main categories based on the types of fill media: splash and film fill media.
The availability of data from these experimental studies enables a comparative analysis of the fill media’s effectiveness, facilitating the selection of suitable fill types for specific cooling tower applications. Furthermore, the inclusion of experiments conducted after 2016 ensures that the table reflects the most recent advancements in cooling tower technology.

3. Performance Indices

To comprehensively evaluate the effectiveness of various fill media in cooling towers, a variety of performance indices have been developed. These indices act as valuable tools for quantitatively analyzing and comparing the effects of fill media on heat and mass transfer efficiency, pressure drop, fan power consumption, and other crucial factors. This section aims to explore and explain the various performance indices applied in the study of fill media in cooling towers, providing insights into their significance and relevance in optimizing cooling tower performance. Understanding these indices enables researchers and engineers to make informed decisions when choosing the most appropriate fill media for particular cooling tower applications, ensuring enhanced cooling performance and energy efficiency.
In order to evaluate and compare the thermal performance of fills, Merkel [24] introduced a non-dimensional coefficient of performance, known as the Merkel number (Me). This is defined as the ratio of the actual heat transfer rate to the maximum possible heat transfer rate:
M e = h d a fi A fr L fi m w = h d a fi L fi G w = T w , out T w , in c p , w d T w ( i masw i ma )
in which hd is the mass transfer coefficient; afi is the interfacial surface area between air and water per unit volume of fill zone; Afr is the frontal area of fill perpendicular to air flow direction; Lfi is the fill length, mw is the mass flow rate of water; Gw is the mass velocity of water; cp,w is the specific heat of water at constant pressure; ima is the specific enthalpy (per kg dry air); imaew is the specific enthalpy of saturated water; Tw,in and Tw,out are the temperatures of the inlet and outlet water, respectively.
In cooling towers equipped with splash or trickle fills, the resistance to air flow can vary, either being uniform in all directions (isotropic) or directionally dependent (anisotropic). The air flow resistance can be quantified using a loss coefficient Kfdm as follows:
K fdm = 2 [ Δ p fi ( ρ avo v avo 2 ρ avi v avi 2 ) + ( ρ avi ρ av , avg ) g L fi , z ] ρ av , avg A fr 2 / m av , avg 2
where Δpfi is the pressure drop over fill; ρavo and ρavi are the outlet and inlet densities of the air–vapor mixture, respectively; vavo and vavi are the outlet and inlet velocities of the air–vapor mixture, respectively; ρav,avg is average density of the air–vapor mixture; g is the gravitational acceleration; Lfi,z is the fill length in the vertical direction; and mav,avg is the average mass flow rate of the air–vapor mixture.
The hydraulic characteristics of wet cooling towers containing fill media can be described either by the loss coefficient or the pressure drop across the fill. The pressure drop across a fill media is related to the loss coefficient through the following standard equation [25,26,27]:
Δ p = k × 1 2 × ρ u 2
in which Δp is the static pressure drop measured across the fill and k is the pressure loss coefficient of a cooling tower packing that is determined by measuring the pressure drop across the packing.
Another important parameter is the capacity of a cooling tower (CTC), which refers to its ability to handle a specific cooling load, which is the amount of thermal energy that the cooling tower can remove from the system and can be determined according to [28]:
C T C = m w c p , w ( T w , in T w , out )
Capacity represents the cooling tower’s capability to absorb and dissipate heat. A higher capacity indicates that the cooling tower can handle more significant cooling loads.
Consider a scenario in which a condenser must dissipate waste heat into the atmosphere. During the design or simulation stage, the heat load on the condenser is known. The coefficient of performance (COP) for the chiller is typically assumed to be 4, and the condenser’s capacity can be determined based on the capacity of the chiller [2]. Consequently, the thermal capacity of cooling towers available on the market is designed to match the thermal capacity of the chillers.
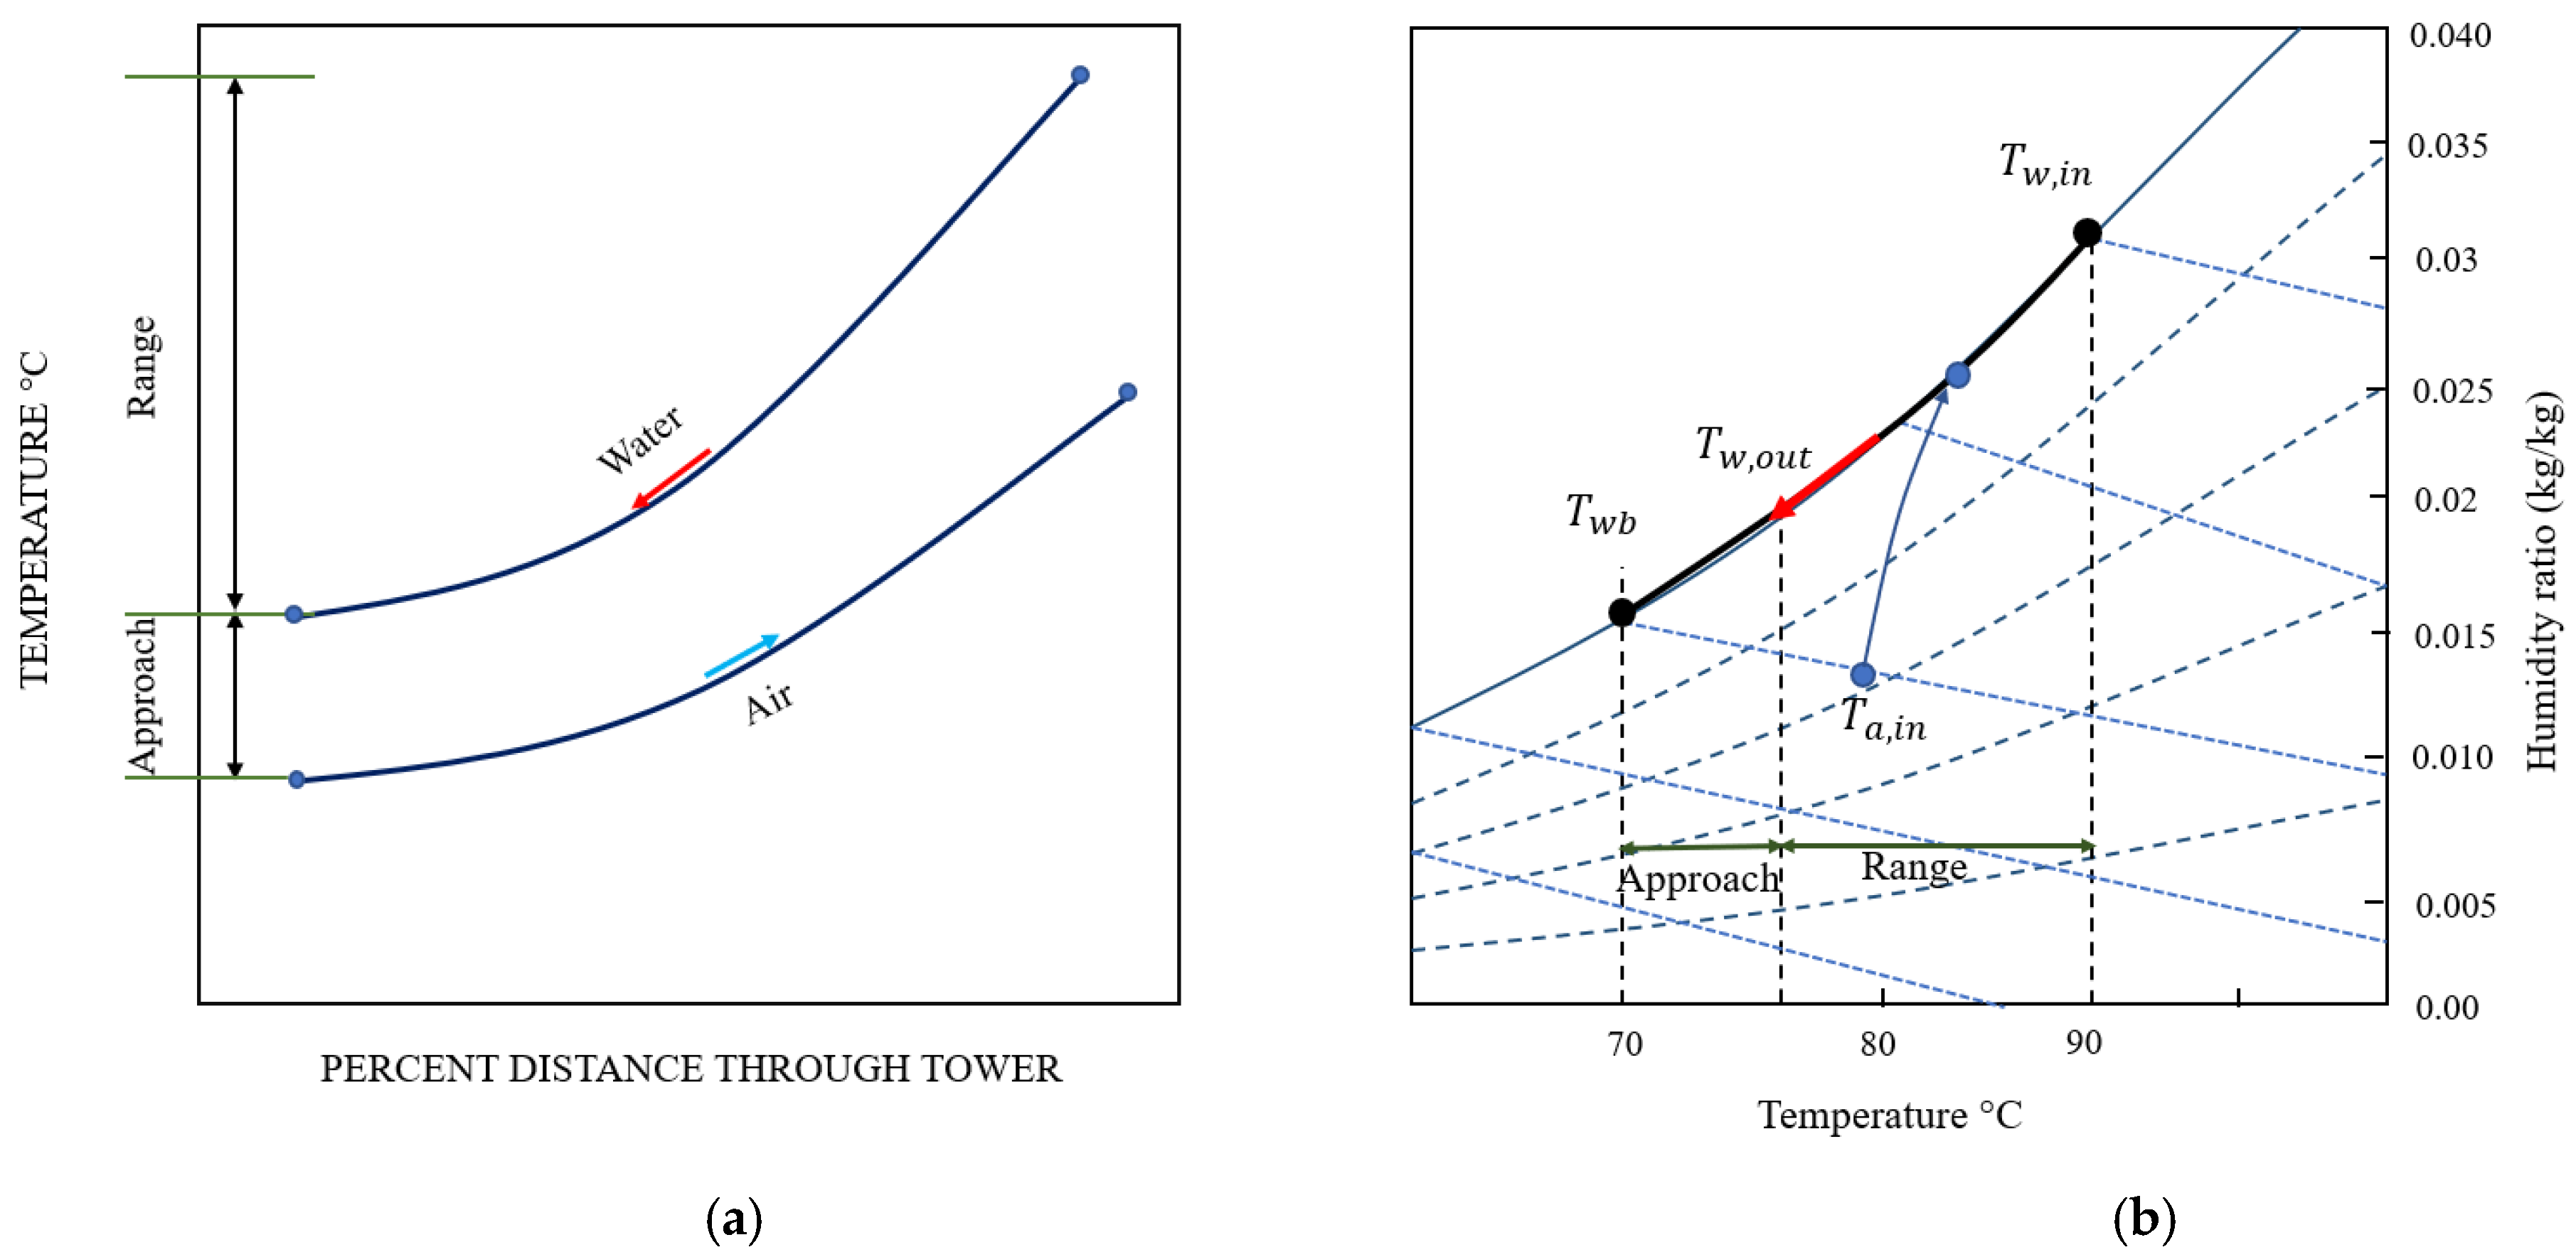
As depicted in Figure 7, both the air and water temperatures experience changes while passing through the cooling tower. It is important to note that the vertical axis in the figure represents the wet-bulb temperature for air. The variation in air and water temperature follows a pattern similar to that of a counterflow heat exchanger. The change in water temperature is known under standard conditions. Typically, and presumably, the system has been well designed to achieve this objective with a well-posed controller in place.
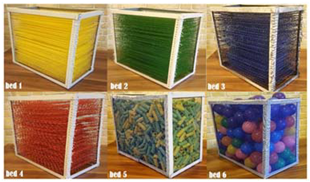
The temperature difference between the water inlet Tw,in and outlet Tw,out in the cooling tower, which must be equal to the temperature difference in the condenser, is referred to as “Range”. On the other hand, the temperature difference between the wet-bulb temperature of the air Twb,in and the water outlet temperature Tw,out is known as “Approach”. The Approach value depends on the specific cooling tower. Apparently, the Approach value can approach zero if the tower size is sufficiently large. As mentioned earlier, the use of fill media can increase the contact area and residence time at a constant volume, resulting in a decrease in the Approach value.
For a more comprehensive understanding of the impact of wet-bulb temperature, dry-bulb temperature, and specific humidity, one can refer to the ASHRAE handbook [2]. However, for brevity, only a few key points will be highlighted. The thermal performance of a cooling tower is primarily determined by the entering air wet-bulb temperature. The incoming air dry-bulb temperature and relative humidity have a negligible individual effect on the thermal performance of mechanical draft cooling towers. However, they do affect the rate of water evaporation within the cooling tower. The ratio of latent to sensible heat is crucial in evaluating the water consumption of a cooling tower. Evaporation, involving mass transfer, occurs only in the latent portion of heat transfer and is directly influenced by changes in specific humidity. The incoming air dry-bulb temperature and relative humidity affect the ratio of latent to sensible heat transfer, consequently influencing the evaporation rate.
In any case, it is necessary to calculate the Approach and fan power consumption when studying the fill media. It is important to mention that in order to calculate the Approach and fan power consumption, it is essential to develop thermal and fluid mechanical models of the fill media.
It should be noted that not all of these considerations and points may be explicitly mentioned in the available published papers, and some studies may examine fill media under unknown or vague scenarios. The goals and objectives of these studies might not be clearly defined. For instance, as it will be discussed in more detail, it is crucial to keep the Range and mass flow rate of the cooling tower constant while studying the fill media, but some studies may overlook this aspect.
To distinguish these studies and uncover valuable insights from the available literature, it is essential to provide an overview of the overall performance of cooling towers. By doing so, all the necessary and useful data can be extracted and reported, enabling a comprehensive analysis of the available papers.
Engineering societies provide standard conditions for conducting experiments and reporting condenser performance. This ensures uniformity in experimental analysis and facilitating designers in selecting appropriate condensers and cooling towers. AHRI is one such reputable pioneer in this field [29].
Based on the standard conditions proposed by AHRI [29], the water temperature at the condenser outlet is set at 35 °C, and the inlet temperature is 27 °C. The mass flow rate is defined as 59 mL/s per 1.25 kW of refrigeration capacity. Furthermore, the air dry-bulb temperature is 35 °C, and the air wet-bulb temperature is 25 °C. It is clear that the specified conditions are more closely linked with the climate conditions in the USA. These standardized conditions provide a consistent basis for experimentation and capacity reporting, eliminating concerns about the impact of diverse experimental conditions on reported outcomes.
Whether following the standards proposed by AHRI or those of other societies and associations, the common aspect is knowing the inlet and outlet temperatures of water, along with the dry-bulb and wet-bulb temperatures of the air. These temperatures are clearly labeled in Figure 7. The outlet water from the condenser is then directed to the inlet of the cooling tower, where it is expected to reach the same temperature as the condenser’s inlet temperature.
It is important to note that, due to the advantages of standardized testing methods, the performance of the fill media should ideally be studied under standard conditions. Typically, the experiments are conducted under these standard conditions, and the results are then extrapolated or interpolated to other conditions using linear correlations. However, it should be acknowledged that not all papers may strictly adhere to this procedure.

4. Recent Progress in Fill Materials

The fill media in a cooling tower can be considered its central component, and its heat transfer capability is crucial to the overall efficiency of the tower. The material of fill media plays a significant role in its thermal performance by providing a large surface area for heat transfer between the water and the surrounding air, as well as increasing the contact time between the two fluids. Consequently, materials science and manufacturing techniques have been employed to develop various types of filling over the years, and research has been conducted to improve the transport phenomena in these devices and, consequently, enhance their performance characteristics. Ultimately, the choice of fill material depends on factors such as cost, durability, thermal performance, and maintenance requirements. In the case of a filling material that is thermodynamically inefficient within a cooling tower, it will require a larger tower space. This not only results in increased pressure drop but also contributes to higher electricity consumption.
The following presents the pros and cons of typical materials used for filling packages in cooling towers:
PVC. PVC is a widely used material used for filling packages due to its durability and cost-effectiveness. It is resistant to corrosion, chemicals, and UV radiation. However, it has a lower heat transfer coefficient than other materials, and its thermal performance deteriorates over time due to fouling.
Polypropylene. Polypropylene is another common material used for fill packing due to its high resistance to corrosion, chemicals, and high temperatures. It has a higher heat transfer coefficient than PVC, which leads to better thermal performance. However, it is more expensive than PVC and can be prone to clogging if not properly maintained.
Wood. Wood was traditionally used for filling packages, and it is still used in some older cooling towers. Wood has a high heat transfer coefficient and is biodegradable, making it an environmentally friendly option. However, it is prone to decay and requires regular maintenance, which can be costly.
Metal. Metal filling packages, such as stainless steel or aluminum, demonstrate remarkable resistance to corrosion and can withstand high temperatures. They also have a high heat transfer coefficient, which leads to good thermal performance. However, they are more expensive than other materials and can be prone to scaling and fouling if not properly maintained.
There are also other materials being investigated in addition to these commonly used ones. Table 2 includes various innovative materials used in recent research. While most researchers and practical applications primarily employ metal, wood, and PVC materials for experimental and academic investigations, other materials provided in the table could offer valuable insights for future designs and utilization by researchers.

5. Effect of Fill Media on Cooling Tower Performance

This section investigates several experiments conducted by previous researchers on the topic of cooling towers, specifically focusing on different types of fillings. To provide detailed explanations and delve deeper into the subject matter, it is recommended to refer to reputable academic papers. These papers will offer comprehensive insights into the conducted experiments, which provide more detailed descriptions of the experimental set-ups, fill types, and outcomes.
In scenarios where the fill loss coefficient is negligible or when the fill reaches the air inlet area, the air moves obliquely or in cross-counterflow to the water flow. As a result, a specific Me or transfer characteristic emerges in the case of cross-counterflow, which falls between the values between purely counterflow and crossflow fills. In order to assess the overall fill performance, considering the isotropic or anisotropic fill resistance, one can use computational fluid dynamics (CFD) as a powerful tool for simulation. However, 2D or 3D numerical models and characteristics of fill media are needed to accurately model the performance of natural-draught wet cooling towers and evaluation of the trickle fill effect.
Grobbelaar et al. [32] presented an experimental set-up, measuring methods, and analytical approaches to specify the fill performance characteristics in both counterflow and crossflow configurations. Specifically, the results obtained for a particular fill are presented and analyzed, providing valuable insights for evaluating the performance of fills under cross-counterflow conditions.
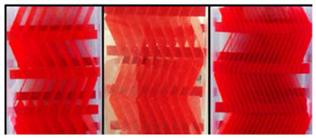
In the comparative experimental tests, the trickle fill employed had cross-fluted channels intended to facilitate air flow in a specific direction. Typically, during installation, the fill is aligned with the expected air flow direction. Specifically, in counterflow installations, the channels are oriented vertically. Three different fill configurations were examined, as shown in Figure 8.
Grobbelaar et al. [32] conducted 376 experimental tests for the three fill configurations to determine fill performance characteristic relations, as given in Table 3 and Table 4.
The fill characteristic equations reveal that the Merkel number shows minimal sensitivity to variations in the water inlet temperature across all tested fill configurations. When the cross-fluted channels are misaligned with the air flow direction, the loss coefficient per meter of fill increases, resulting in an approximately 25% increase in the Merkel number. This increase is attributed to greater turbulence arising from the steeper pressure gradient across the fill. The counterflow configuration generally exhibits a higher Merkel number compared to crossflow, mainly because water droplets spend more time in the cooling zone in counterflow. However, at higher ratios of water mass velocity to air mass velocity, crossflow performance starts to outperform counterflow. The authors speculate that the difference lies in the micro flow pattern of water, with water in counterflow mostly adhering to the perimeter of the channels, causing little channel obstruction, while in crossflow, more water drips through the channels, causing a slightly higher loss coefficient. For this particular fill, the term hdafi (related to heat transfer) is almost independent of water mass velocity in counterflow, indicating a similar behavior to a film fill where water flows mainly in a film. However, in crossflow, the term hdafi does show some weak dependence on water mass velocity, indicating significant dripping within the fill. The researchers suggest that describing fill performance in terms of hdafi rather than the Merkel number may be more appropriate, especially when given characteristic equations in terms of air and water mass velocities. Such an approach would help differentiating between different fill types and their response to varying water flow rates.
Fan et al. [33] proposed a practical experimental set-up for a parallel counterflow Maisotsenko-cycle cooling tower (MCT) with fillings. The Maisotsenko cycle, known as the M-Cycle, holds the promise of decreasing electricity generation expenses by enabling water to be cooled below the wet-bulb temperature of the inlet air, thereby offering potential cost savings. However, traditional wet cooling towers are limited in their cooling capacity, particularly in hot and wet climates. The objective was to gain insights into the ideal length for dry channels, to evaluate the thermal performance of the tower under different conditions, and to analyze pressure drops within MCT. The findings revealed that the optimum length for dry channel is 2.4 m, and effectiveness of the wet-bulb temperature reached a maximum of 180%. Furthermore, the study also examined how the velocity of air flow within the wet channels affects the pressure drops across the innovative fills. These results affirm the significant potential of implementing the M-Cycle technique in thermally wet cooling towers and provide valuable guidelines for industrial applications and enhancing the performance of MCTs.
Based on the review result, very few examples in the literature demonstrate the hydraulic performance of fill media in wet cooling towers. Researchers have explored various configurations of fill media and their impact on cooling tower thermal performance.
In the case of mechanical draft cooling towers, appropriate fans are selected primarily based on the loss coefficient of the fill (i.e., the pressure drop across the fill). In natural draft cooling towers, the draft is also strongly influenced by the loss coefficient of the fill. Overall, understanding the relationship between pressure drop, loss coefficient, and flow rates is crucial for evaluating the hydraulic performance of filled cooling towers and selecting appropriate fans to ensure optimal cooling tower operation.
To correlate the pressure drop across the cooling tower fill, empirical relations are used, which depend on the water and air mass flowrates as well as other relevant parameters. These correlations are derived based on experimental data obtained by testing the cooling tower under different operating conditions. By incorporating the air and water flowrates along with relevant constants into these empirical correlations, engineers and researchers can predict the pressure drop in the cooling tower fill media. This helps in the design and analysis of cooling tower systems. Several equations have been proposed for this purpose [8,26,27,34,35,36]. According to Kloppers and Kröger [26], the following equation is more accurate but is only valid for specific ranges and may not accurately represent a wide range of operating conditions for cooling towers:
k = C 1 ( L ) C 2 ( G ) C 3 + C 4 ( L ) C 5 ( G ) C 6
where ci coefficients are constants that can be determined experimentally for a specific fill media.
Lemouari et al. [37] conducted an experiment focusing on the hydraulic performance of a counterflow wet cooling tower. The tower employed a “vertical grid apparatus” (VGA) type of packing, consisting of four galvanized zigzag-shaped sheets and three metallic vertical grids arranged in parallel within a measurement zone of 0.15×0.148 m2. The study primarily examined the effect of water and air flow rates on the hydraulic characteristics of the cooling tower at several inlet water temperatures. Two hydrodynamic operating regimes were observed during the tower’s air–water contact operation: the pellicular regime (PR) characterized by low pressure drop values during low water flow rates, and the bubble and dispersion regime (BDR) marked by relatively higher pressure drop values associated with larger water flow rates. These regimes revealed two distinct states of pressure drop characteristics. It is anticipated that these two distinct hydrodynamic regimes will give rise to two different thermal regimes within the cooling tower. It is widely recognized that hydrodynamics significantly influence the heat and mass transport processes in such equipment.
The proposed relationship between pressure drop characteristics and combined heat and mass transport (air–water) through the packing inside the wet cooling tower for the PR and BDR regimes are listed in Table 5 [37]. Lemouari et al. [37] also proposed empirical correlations to emphasize the relationship between the hydraulic characteristics and the combined heat and mass transport process represented by a global heat and mass transport coefficient (Ka) within the investigated cooling tower. These correlations, which are listed in Table 6, are developed for each specific hydrodynamic operating regime of the wet cooling tower.
The results obtained from the experiment indicated that this particular type of cooling tower demonstrated notably favorable hydraulic characteristics, resulting in energy savings. It was concluded that the inlet water temperature had no significant impact on the pressure drop, which aligns with earlier research by Kloppers [27], and Kloppers and Kröger [26]. Moreover, the “VGA” fill type showed lower pressure drop values compared to other types of cooling tower fill media [38,39]. This indicates that cooling towers equipped with “VGA” packing have favorable momentum transport characteristics, leading to a reduction in pressure loss and potential energy savings [37].
Table 7 presents a compilation of previous research findings concerning wet cooling towers, with a focus on various aspects. Many researchers have explored wet cooling towers, given their incorporation of fill media. These investigations delve into relevant data and ranges for novel designs or alterations. Moreover, the table includes studies investigating the impact of fill configurations on cooling tower performance.
However, it is essential to acknowledge that the research output can offer practical ranges, even though each cooling tower operates under specific conditions and constraints. Therefore, during the design process, it is advisable to first consider the specific limitations and applications of the cooling tower and then refer to the table to identify the closest operating conditions for better performance prediction. This approach ensures that the design aligns with the tower’s unique operating requirements, leading to more efficient and effective cooling solutions.
In the context of cooling towers, fouling is the phenomenon characterized by the accumulation of unwanted substances, including biological growth on the surface of the plastic water film flow area. This deposition hinders the cooling process and can lead to an excessive build-up of material on the packing. In more severe cases, fouling can even lead to a decrease in the overall efficiency of the cooling tower. An indicative sign of this is when fill fouling disrupts the flow of air and water through the tower. It is noteworthy that plastic fills are more susceptible to fouling compared to the conventional splash bars. The fouling of cooling tower fills stands out as a pivotal determinant influencing the thermal performance of the cooling tower. As time goes by, this fouling progressively reduces the effectiveness and capability of the tower [55]. Among the many reviewed papers concerning wet cooling towers, only a few of them took the effects of fouling into consideration, particularly through experimental approaches. The processes involved in cooling tower fouling are indeed quite complex. Due to the intricate nature of the fouling mechanisms, quantifying the fouling process using conventional models becomes challenging. As a result, there is a rising demand to understand the actual influence of various applications [56]. Qureshi and Zubair [55] conducted an experimental research and simulation study and found that the tower performance experiences some 18% decline compared to the clean condition of fill media. Despite the ongoing increase in weight caused by fouling, the tower’s performance reached a stable state after this decline and can cause an increase in water outlet temperature. In an alternative modeling approach to fouling, Guo et al. [57] analyzed the impact of fouling using neural networks. They focused on PVC fill media and investigated how fouling affects the tower’s performance and efficiency. The study spanned a 250-day period, during which the effectiveness (defined as the ratio of the actual temperature difference to the maximum achievable) decreased from 0.51 to 0.14 for a water inlet temperature of 40 °C, and from 0.41 to 0.11 for a temperature of 50 °C.
In summary, according to what is explained in this section, as the wettability of fill media increases, there is a simultaneous augmentation of the heat and mass transfer area, along with an associated rise in pressure drop. The quantitative aspects of these increments represent critical parameters on which engineers and researchers need to focus. It is essential to note that an increase in the effective heat and mass transfer area results in a reduction in the approach, subsequently leading to a smaller cooling tower size for a constant load. Conversely, an escalation in pressure drop contributes to higher fan power consumption and the potential for noise generation. Furthermore, the potential challenges of fouling and fill media failure, especially at low temperatures, are to be considered. To bridge this knowledge gap, experiments should be conducted by researchers under well-defined standard conditions or tailored to their specific climate. Regrettably, a substantial portion of research papers reviewed did not present data based on such defined conditions. Therefore, not only is this research deficiency highlighted by this paper, but it also provides a comprehensive review of recent studies on fill media in cooling towers, offering data that can be pragmatically applied in design practices.

6. Recent Progress in Fill Configurations

The arrangement of fill packing is a critical parameter influencing a cooling tower’s performance due to its substantial impact on heat and mass transfer. Different fill packing configurations can lead to varying degrees of pressure drop in cooling towers, which can affect the overall performance. The type and size of fill media employed can also affect the optimal fill packing configuration for a given cooling tower. Additionally, the orientation of fill media can impact both the packing configuration and the overall performance of cooling towers.
A well-designed fill media configuration can enhance cooling tower efficiency and minimize operating costs. Optimal fill packing configurations vary and depend on the specific application and operating conditions of a cooling tower. Proper maintenance and cleaning of fill media is essential to maintain the desired packing configuration and performance of cooling towers.
Advances in fill media technology are resulting in novel and innovative fill packing configurations that improve the performance in cooling towers. These designs incorporate high-efficiency media, improved air and water mixing, and reduced pressure drop, resulting in enhanced cooling tower performance and reduced operating costs.
Since the 1940s, researchers have been primarily focused on investigating the thermal efficiency of fill media used in cooling towers [58,59,60]. This section aims to provide an overview of the latest research conducted on this topic. Nevertheless, the current studies presented in Table 8 offer brief explanations of some of these different configurations, most of which have been experimentally investigated over the past few decades.

7. Conclusions

This review study serves as a base of reference for recent efforts, providing a comprehensive overview of the recent advancements and progress in fill media technology used in cooling towers with different materials and configurations. By analyzing existing research and empirical test data, detailed insights into the potential benefits of these innovations are studied. As detailed within this research, the majority of the experimental literature is related to cooling towers concentrated on operations conducted within the Range of 2.5 °C to 25 °C (temperature difference between liquid inlet and outlet) and within an Approach of 1 °C to 9 °C (difference between liquid outlet temperature and air inlet temperature). In conclusion, the investigations revealed that the performance of the fill area in a wet cooling tower is influenced by multiple parameters and operating conditions, such as the fill material type, fill geometry, water flow rate, water temperature, air flow rate, and ambient conditions. Understanding and considering these factors are crucial for designing and maintaining the fill area to optimize the cooling tower’s overall efficiency and to extend its lifespan. The incorporation of improved fill materials and configurations has the potential to significantly enhance cooling tower performance and efficiency. In some reported cases, by utilizing new fill media configurations and material, the cooling range, effectiveness, and Merkel number experienced a substantial increase of 28%, 85%, and 131%, respectively. As industries continue to seek environmentally sustainable and energy-efficient solutions, the proper selection and utilization of fill media technology are of paramount importance. Cooling towers that capitalize on these innovations can contribute to reduced energy consumption and lower environmental impact, thus aligning with the broader goals of sustainable industrial practices. Overall, this study summarizes and emphasizes the importance of ongoing research and development in the field regarding fill media technology for wet cooling towers. By analyzing the potential of novel materials and optimized configurations, engineers and designers can understand the enhanced cooling tower performance, leading them to select a more suitable filling prior to achievement of more efficient industrial processes which cast a positive impact on energy consumption and environmental sustainability.
In terms of future research directions, this study identified a notable gap in the field of filling media investigation. To advance this area, it is advisable to initially explore the impact of fill media under a consistent cooling capacity and subsequently assess the influence of implementing the chosen fill media under well-defined conditions based on available standard like ASHRAE or AHRI or defined by researchers based on their specific climate. Moreover, there is a clear need for comprehensive research focused on the pressure drop caused by the fill media within cooling towers. This aspect is crucial, as it can potentially jeopardize overall performance and may affect other influential parameters.

Author Contributions

Z.H.: conception, writing of the first draft; A.Z.: conception, writing of the first draft; M.G.: conception, writing of the first draft; J.-S.L.: administrative assistance; C.-C.W.: supervision, revising of the first draft. All authors have read and agreed to the published version of the manuscript.

Funding

The principal funding was from the National Science and Technology Council, Taiwan under contract number 112-2221-E-A49-026. The project was partially supported by the Bureau of Energy, Ministry of Economic Affairs, Taiwan.

Data Availability Statement

Not applicable.

Conflicts of Interest

The authors declare no conflict of interest.

References

  1. Ahmed, S.A.; Aljaberi, F.Y.; Makki, H.F. Experimental investigation of the thermal performance of wet cooling tower with splash fills packing. Therm. Sci. 2022, 26, 1603–1613. [Google Scholar] [CrossRef]
  2. American Society of Heating, Refrigerating and Air-Conditioning Engineers. ASHRAE Handbook: HVAC Systems and Equipment; SI ed.; ASHRAE: Atlanta, GA, USA, 2020. [Google Scholar]
  3. Williamson, N.; Behnia, M.; Armfield, S. Comparison of a 2D axisymmetric CFD model of a natural draft wet cooling tower and a 1D model. Int. J. Heat Mass Transf. 2008, 51, 2227–2236. [Google Scholar] [CrossRef]
  4. Zayed, M.E.; Kamal, A.; Diab, M.R.; Essa, F.A.; Muskens, O.L.; Fujii, M.; Elsheikh, A.H. Novel design of double slope solar distiller with prismatic absorber basin, linen wicks, and dual parallel spraying nozzles: Experimental investigation and energic–exergic-economic analyses. Water 2023, 15, 610. [Google Scholar] [CrossRef]
  5. Salins, S.S.; Kumar, S.; González, A.T.; Shetty, S. Influence of packing configuration and flow rate on the performance of a forced draft wet cooling tower. J. Build. Eng. 2023, 72, 106615. [Google Scholar] [CrossRef]
  6. Alsaiari, A.O.; Shanmugan, S.; Abulkhair, H.; Bamasag, A.; Moustafa, E.B.; Alsulami, R.A.; Ahmad, I.; Elsheikh, A. Applications of TiO2/Jackfruit peel nanocomposites in solar still: Experimental analysis and performance evaluation. Case Stud. Therm. Eng. 2022, 38, 102292. [Google Scholar] [CrossRef]
  7. Tejero-González, A.; Franco-Salas, A. Optimal operation of evaporative cooling pads: A review. Renew. Sustain. Energy Rev. 2021, 151, 111632. [Google Scholar] [CrossRef]
  8. Goshayshi, H.; Missenden, J. The investigation of cooling tower packing in various arrangements. Appl. Therm. Eng. 2000, 20, 69–80. [Google Scholar] [CrossRef]
  9. Ahmed, S.A.; Kareem, S.B.A.; Makki, H.F. Investigation hydraulic performance of splash fills packing in cooling tower. In AIP Conference Proceedings; AIP Publishing: Melville, NY, USA, 2020; p. 020156. [Google Scholar]
  10. Pradana, M.R.; Dewi, A.K.; Septiani, N.A.; Wardhana, A.S.; Ramdhan, M.; Nugroho, W.T. Performance Analysis Cooling Tower Type Induced Draft with PVC Plate Filling Material. J. Polimesin 2023, 21, 152–157. [Google Scholar]
  11. Kariem, N.O.; Rasheed, M.A.; Al-Sharify, Z.T. Performance of a cooling tower with the use of a new kind of high-density polyethylene (HDPE) packing. J. Eng. Res. 2022, 10, 72–83. [Google Scholar] [CrossRef]
  12. Jourdan, N.; Kanniche, M.; Neveux, T.; Potier, O. Experimental characterization of liquid flows in cooling tower packing. Ind. Eng. Chem. Res. 2022, 61, 2926–2936. [Google Scholar] [CrossRef]
  13. Bakhtiyar, N.K.; Javadpour, R.; Heris, S.Z.; Mohammadpourfard, M. Improving the thermal characteristics of a cooling tower by replacing the operating fluid with functionalized and non-functionalized aqueous MWCNT nanofluids. Case Stud. Therm. Eng. 2022, 39, 102422. [Google Scholar] [CrossRef]
  14. Chomiak, M.; Rojek, M.; Stabik, J.; Szymiczek, M. Prediction of Strength Properties of Filling Packets in Selected Cooling Towers. Polymers 2021, 13, 3840. [Google Scholar] [CrossRef]
  15. Amini, M.; Zareh, M.; Maleki, S. Thermal performance analysis of mechanical draft cooling tower filled with rotational splash type packing by using nanofluids. Appl. Therm. Eng. 2020, 175, 115268. [Google Scholar] [CrossRef]
  16. Dang, Z.; Gao, M.; Long, G.; Zou, J.; He, S.; Sun, F. Crosswind influence on cooling capacity in different zones for high level water collecting wet cooling towers based on field test. J. Wind. Eng. Ind. Aerodyn. 2019, 190, 134–142. [Google Scholar] [CrossRef]
  17. Kong, Q.J.; Liu, D.Y.; Wang, P.; Xie, D.Q.; Wu, Q.; Zhao, X.Y. Experimental study on the heat and mass transfer characteristics of a counter-flow wet cooling tower with foam ceramic packing. Thermophys. Aeromechanics 2019, 26, 267–279. [Google Scholar] [CrossRef]
  18. Tomás, A.; Araujo, S.; Paes, M.D.; Primo, A.R.; Da Costa, J.; Ochoa, A. Experimental analysis of the performance of new alternative materials for cooling tower fill. Appl. Therm. Eng. 2018, 144, 444–456. [Google Scholar] [CrossRef]
  19. Vitkovicova, R.; Vitkovic, P. Control of droplet size in rain-zone in wet cooling tower. In EPJ Web of Conferences; EDP Sciences: Les Ulis, France, 2018; p. 02119. [Google Scholar]
  20. Gao, M.; Guo, C.; Ma, C.; Shi, Y.; Sun, F. Thermal performance for wet cooling tower with different layout patterns of fillings under typical crosswind conditions. Energies 2017, 10, 65. [Google Scholar] [CrossRef]
  21. Lu, J.; Li, W.; Li, Y.; Zeng, L.; Yang, L.; Xie, L.; Li, Q.; Wang, M. Numerical study on heat and mass transfer characteristics of the counter-flow heat-source tower (CFHST). Energy Build. 2017, 145, 318–330. [Google Scholar] [CrossRef]
  22. Rahmati, M.; Alavi, S.R.; Tavakoli, M.R. Experimental investigation on performance enhancement of forced draft wet cooling towers with special emphasis on the role of stage numbers. Energy Convers. Manag. 2016, 126, 971–981. [Google Scholar] [CrossRef]
  23. Singla, R.K.; Singh, K.; Das, R. Tower characteristics correlation and parameter retrieval in wet-cooling tower with expanded wire mesh packing. Appl. Therm. Eng. 2016, 96, 240–249. [Google Scholar] [CrossRef]
  24. Merkel, F. Verdunstungskühlung. Z. Des Vereines Dtsch. Ingenieure 1925, 70, 123–128. [Google Scholar]
  25. Picón-Núnez, M.; Polley, G.T.; Canizalez-Dávalos, L.; Medina-Flores, J.M. Short cut performance method for the design of flexible cooling systems. Energy 2011, 36, 4646–4653. [Google Scholar] [CrossRef]
  26. Kloppers, J.C.; Kröger, D.G. Loss coefficient correlation for wet-cooling tower fills. Appl. Therm. Eng. 2003, 23, 2201–2211. [Google Scholar] [CrossRef]
  27. Kloppers, J.C. A Critical Evaluation and Refinement of the Performance Prediction of Wet-Cooling Towers; University of Stellenbosch: Stellenbosch, South Africa, 2003. [Google Scholar]
  28. Mitchell, J.W.; Braun, J.E. Principles of Heating, Ventilation, and Air Conditioning in Buildings; John Wiley & Sons: Hoboken, NJ, USA, 2012. [Google Scholar]
  29. AHRI 450-2007; Water-Cooled Refrigerant Condensers, Remote Type. Air-Conditioning, Heating, and Refrigeration Institute: Arlington, VA, USA, 2007.
  30. Kusin, A.S.A.; Zahari, S.A.A.; Hatim, M.I.; Ruslan, M.A.M.; Adzim, M.N.; Omar, R.; Jamailudin, M.S.; Yaakub, A.R.W.; Puzi, S.M. Transport Properties of Evaporative Cooling in a Seashell Packed Bed Cooling Tower. In IOP Conference Series: Materials Science and Engineering; IOP Publishing: Bristol, UK, 2020; p. 012026. [Google Scholar]
  31. Elsaid, A.M. A novel approach for energy and mass transfer characteristics in wet cooling towers associated with vapor-compression air conditioning system by using MgO and TiO2 based H2O nanofluids. Energy Convers. Manag. 2020, 204, 112289. [Google Scholar] [CrossRef]
  32. Grobbelaar, P.; Reuter, H.; Bertrand, T. Performance characteristics of a trickle fill in cross-and counter-flow configuration in a wet-cooling tower. Appl. Therm. Eng. 2013, 50, 475–484. [Google Scholar] [CrossRef]
  33. Fan, X.; Lu, X.; Wang, J.; Li, Z.; Wang, Q.; Dong, Z.; Zhang, R. Performance Evaluation of a Maisotsenko Cycle Cooling Tower with Uneven Length of Dry and Wet Channels in Hot and Humid Conditions. Energies 2021, 14, 8249. [Google Scholar] [CrossRef]
  34. Milosavljevic, N.; Heikkilä, P. A comprehensive approach to cooling tower design. Appl. Therm. Eng. 2001, 21, 899–915. [Google Scholar] [CrossRef]
  35. Johnson, B. Cooling Tower Performance Prediction and Improvement, Volume 1: Applications Guide; EPRI Report GS-6370; EPRI: Washington, DC, USA, 1989. [Google Scholar]
  36. Lowe, H.; Christie, D. Heat transfer and pressure drop data on cooling tower packings, and model studies of the resistance of natural draft towers to air flow. In Proceedings of the International Heat Transfer Conference, Boulder, CO, USA, 28 August–1 September 1961; p. 5. [Google Scholar]
  37. Lemouari, M.; Boumaza, M.; Kaabi, A. Experimental investigation of the hydraulic characteristics of a counter flow wet cooling tower. Energy 2011, 36, 5815–5823. [Google Scholar] [CrossRef]
  38. Goshayshi, H.; Missenden, J.; Tozer, R. Cooling tower—An energy conservation resource. Appl. Therm. Eng. 1999, 19, 1223–1235. [Google Scholar] [CrossRef]
  39. McAdams, W.; Pohlenz, J.; John, R.S. Transfer of heat and mass between air and water in a packed tower. Chem. Eng. Prog. 1949, 45, 241. [Google Scholar]
  40. Kong, Q.J.; Zhao, X.Y.; Xie, D.Q.; Zhang, B.; Wang, P. Experimental investigation of the heat and mass transfer phenomena in a counterflow wet cooling tower with foam ceramic packing. Adv. Mech. Eng. 2018, 10, 1687814017752579. [Google Scholar] [CrossRef]
  41. Zhou, Y.; Zhu, X.; Ding, X. Theoretical investigation on thermal performance of new structure closed wet cooling tower. Heat Transf. Eng. 2018, 39, 460–472. [Google Scholar] [CrossRef]
  42. Wang, M.; Wang, J.; Wang, J.; Shi, C. Contrastive analysis of cooling performance between a high-level water collecting cooling tower and a typical cooling tower. J. Therm. Sci. 2018, 27, 39–47. [Google Scholar] [CrossRef]
  43. Keshtkar, M.M. Performance analysis of a counter flow wet cooling tower and selection of optimum operative condition by MCDM-TOPSIS method. Appl. Therm. Eng. 2017, 114, 776–784. [Google Scholar] [CrossRef]
  44. Zili-Ghedira, L.; Gouider, H.; Nasrallah, S.B. Numerical simulation of heat and mass transfer in humidifiers and cooling towers. J. Porous Media 2017, 20. [Google Scholar] [CrossRef]
  45. Singh, K.; Das, R. Simultaneous optimization of performance parameters and energy consumption in induced draft cooling towers. Chem. Eng. Res. Des. 2017, 123, 1–13. [Google Scholar] [CrossRef]
  46. Ning, T.; Chong, D.; Jia, M.; Wang, J.; Yan, J. Experimental investigation on the performance of wet cooling towers with defects in power plants. Appl. Therm. Eng. 2015, 78, 228–235. [Google Scholar] [CrossRef]
  47. Ramkumar, R.; Ragupathy, A. Thermal performance investigation of mechanical draft cooling tower using psychrometric gun technique. Heat Transf. Eng. 2014, 35, 1344–1353. [Google Scholar] [CrossRef]
  48. Shahali, P.; Rahmati, M.; Alavi, S.R.; Sedaghat, A. Experimental study on improving operating conditions of wet cooling towers using various rib numbers of packing. Int. J. Refrig. 2016, 65, 80–91. [Google Scholar] [CrossRef]
  49. Imani-Mofrad, P.; Saeed, Z.H.; Shanbedi, M. Experimental investigation of filled bed effect on the thermal performance of a wet cooling tower by using ZnO/water nanofluid. Energy Convers. Manag. 2016, 127, 199–207. [Google Scholar] [CrossRef]
  50. Zhao, Z.; Gao, J.; Zhu, X.; Qiu, Q. Experimental study of the corrugated structure of film packing on thermal and resistance characteristics of cross-flow cooling tower. Int. Commun. Heat Mass Transf. 2023, 141, 106610. [Google Scholar] [CrossRef]
  51. Javadpour, R.; Heris, S.Z.; Meyer, J.P. Experimental study of the effect of filled bed type on the performance of a cross-flow cooling tower with the approach of using nanofluids. Energy Rep. 2022, 8, 8346–8360. [Google Scholar] [CrossRef]
  52. Fan, X.; Lu, X.; Nie, H.; Zhu, H.; Wang, Q.; Kang, Y.; Liu, S.; Zheng, X.; Liu, Z.; Zhang, Y. An experimental study of a novel dew point evaporative cooling tower based on M-cycle. Appl. Therm. Eng. 2021, 190, 116839. [Google Scholar] [CrossRef]
  53. Rahmati, M. Effects of ZnO/water nanofluid on the thermal performance of wet cooling towers. Int. J. Refrig. 2021, 131, 526–534. [Google Scholar] [CrossRef]
  54. Zengin, G.; Onat, A. Experimental and theoretical analysis of mechanical draft counterflow wet cooling towers. Sci. Technol. Built Environ. 2020, 27, 14–27. [Google Scholar] [CrossRef]
  55. Qureshi, B.A.; Zubair, S.M. A complete model of wet cooling towers with fouling in fills. Appl. Therm. Eng. 2006, 26, 1982–1989. [Google Scholar] [CrossRef]
  56. Mrisky, G.; Monjoie, M.; Noble, R. Research of Fouling Film Fill. In Proceedings of the Cooling Tower Institute Annual Meeting, New Orleans, LA, USA, 17–19 February 1993. [Google Scholar]
  57. Guo, Q.; Qi, X.; Wei, Z.; Yin, Q.; Sun, P.; Guo, P.; Liu, J. Modeling and characteristic analysis of fouling in a wet cooling tower based on wavelet neural networks. Appl. Therm. Eng. 2019, 152, 907–916. [Google Scholar] [CrossRef]
  58. Bedekar, S.; Nithiarasu, P.; Seetharamu, K. Experimental investigation of the performance of a counter-flow, packed-bed mechanical cooling tower. Energy 1998, 23, 943–947. [Google Scholar] [CrossRef]
  59. Kelly, N.; Swenson, L. Comparative performance of cooling tower packing arrangements. Chem. Eng. Prog. 1956, 52, 263–268. [Google Scholar]
  60. Simpson, W.; Sherwood, T. Performance of small mechanical draft cooling towers. Refrig. Eng. 1946, 52, 525–543. [Google Scholar]
  61. Zhou, Y.; Wang, K.; Gao, M.; Dang, Z.; He, S.; Sun, F. Experimental study on the drag characteristic and thermal performance of non-uniform fillings for wet cooling towers under crosswind conditions. Appl. Therm. Eng. 2018, 140, 398–405. [Google Scholar] [CrossRef]
  62. Vitkovic, P. Droplet Measurement below Single-Layer Grid Fill. In EPJ Web of Conferences; EDP Sciences: Les Ulis, France, 2016; p. 02137. [Google Scholar]
  63. Ozgur, A.E.; Bayrakci, H.C. Experimental investigation of air side pressure loss for wet-cooling tower fills. Therm. Sci. 2020, 24, 2047–2053. [Google Scholar] [CrossRef]
  64. Ramkumar, R.; Ragupathy, A. Optimization of cooling tower performance with different types of packings using Taguchi approach. J. Braz. Soc. Mech. Sci. Eng. 2015, 37, 929–936. [Google Scholar] [CrossRef]
Figure 1. A schematic of direct-contact or open evaporative cooling tower.
Processes 11 02578 g001
Figure 2. A schematic of indirect-contact or closed-circuit evaporative cooling towers.
Processes 11 02578 g002
Figure 3. A schematic of wet cooling tower.
Processes 11 02578 g003
Figure 4. A schematic of a dry cooling tower.
Processes 11 02578 g004
Figure 5. Triangular slat splash fill for cooling tower.
Processes 11 02578 g005
Figure 6. Typical film fill for a cooling tower.
Processes 11 02578 g006
Figure 7. (a) Temperature relation between air and water and definition of Range and Approach; (b) psychrometric diagram for air passing through cooling tower.
Processes 11 02578 g007
Figure 8. Three configurations of trickle fill: (1) counterflow with vertically oriented channels; (2) crossflow with horizontally oriented channels; (3) crossflow (counterflow config.) with vertically oriented channels [32].
Processes 11 02578 g008
Table 1. Various types of fill media in wet cooling towers—materials and configurations.
AuthorCooling Tower TypeConfigurationMaterial
Processes 11 02578 i001
Pradana et al. [10]
Induced draft counterflow/direct contact A 20 cm tall, 0.5 mm thick rolled platePVC plate
Processes 11 02578 i002
Kariem et al. [11]
Mechanical forced draught counterflow cooling tower—closedSheets arranged in splash typeHigh-density polyethylene
Processes 11 02578 i003
Jourdan et al. [12]
Wet cooling towers Various thermoformed sheets with sinusoidal pattern: 0.06 cm thickness; 5 cm period; 1.7 cm amplitude PVC
Processes 11 02578 i004
Bakhtiyar et al. [13]
Crossflow cooling towerSplash fill media
(16 × 16 cm2 mesh)
Several mesh plates
Processes 11 02578 i005
Chomiak et al. [14]
Wet cooling tower, natural draftFilling packets with drip blocksPolypropylene
Processes 11 02578 i006
Amini et al. [15]
Mechanical draft/counterflow wet cooling towerNon-uniform rotational splash-type: six circular horizontal platesAluminum
Processes 11 02578 i007
Dang et al. [16]
Wet cooling towerFilm-type fill with area of 12,800 m2 and thickness of 1.5 m---
Processes 11 02578 i008
Kong et al. [17]
Counterflow wet cooling tower Corrugated sheets composed of sine wave, wave distance: 60 mm, height of wave: 35 mm, inclination of wave: 50°New type FCP-08 foam ceramic
Processes 11 02578 i009
Tomás et al. [18]
Forced counterflow wet cooling towerFilm-type fill with total dimension 57 × 64 × 25 cm3Coconut fiber, coconut husk and PET
Processes 11 02578 i010
Vitkovicova et al. [19]
Wet cooling tower Film fill (straight, slope, offset) and splash fill (trickle, grid)PVC and metal
Processes 11 02578 i011
Gao et al. [20]
Wet cooling towerFive kinds of layout patterns, uniform and non-uniform---
Processes 11 02578 i012
Lu et al. [21]
Counterflow cooling tower Film-type fill
Commercial corrugated packing with 98% porosity and dimensions: 5000 × 3300 × 2900 mm3
---
Processes 11 02578 i013
Rahmati et al. [22]
Forced draft wet cooling towerFilm-type fill,
VGA (vertical grid apparatus), height of 95 cm
PVC
---
Singla et al. [23]
Counterflow forced draft cooling towerExpanded wire meshed fill ---
Table 2. Innovative material for fill media in wet cooling towers.
AuthorMaterial and Major Effects on Performance
Kariem et al. [11]Material: high-density polyethylene (HDPE)
The results suggest that maintaining a constant air flux while increasing the water-to-air ratio results in a decline in the tower’s performance. This can be attributed to the higher water flow contributing to an increased heat load, which subsequently hinders the tower’s fill from effectively dissipating the excess heat.
Kusin et al. [30]Material: cockle shell, seashell-packed bed and HDPE pipe
The findings indicated that seashell packing demonstrated superior cooling efficiency compared to HDPE pipe packing due to its larger surface area and longer retention time. Moreover, treated seashell packing outperformed untreated packing. As for the cooling system, both the range of cooling water and the efficiency of tower decreased with higher water to air ratio, while the heat transfer coefficient decreased with an increase in the L/G (liquid-to-gas) ratio.
Kong et al. [17]Material: new type of packing named “FCP-08”—foam ceramic
Increasing the water/air mass flow ratio (L/G) leads to lower cooling tower efficiency (e) and cooling water range (R). However, the cooling characteristic coefficient (KαV/L) decreases slightly with higher L/G ratios but outperforms other packing types. Foam ceramic packing demonstrates superior cooling performance compared to alternatives, influencing thermal efficiency through effective heat and mass transfer. The study explores these aspects to aid engineering design and practical applications of cooling towers with foam ceramic packing.
Tomás et al. [18]Material: coconut fiber, coconut husk and PET
Based on the experimental data, it was observed that the alternative fills investigated were capable of cooling water up to 8 K, whereas the commercial fill achieved a higher cooling capacity of 10 K under identical operating conditions.
Elsaid et al. [31]Material: polypropylene (PP), paper cellulose (PC).
The study highlights the benefits of using PVC fill and a spiral sprayer with a 90° spray angle in improving the cooling tower’s effectiveness and coefficient of performance (COP). It also emphasizes that the overall system performance index increases with decreased filling sheet spacing and increased nanomaterial concentrations. The research predicts that the maximum overall system performance index is attained when employing PVC fill, a 1% concentration of MgO-based water nanoparticles, and a 90° spray angle. The investigation focuses on understanding the thermal conductivity characteristics and geometric design parameters of the fill material and their influence on the cooling tower’s characteristics and the COP of the vapor compression air conditioning cycle.
Table 3. Fill characteristic equations for Me per meter of fill for different fill configurations [32].
Fill ConfigurationFill Characteristic Equations for Me/Lfi, zCorrelation Coefficient
CrossflowMe/Lfi, z = 1.2330 Gw−0.7550 Ga0.3450 Twi−0.02790.987
CounterflowMe/Lfi, z = 1.6293 Gw−0.9250 Ga0.7760Twi−0.09860.994
Crossflow (counterflow config.)Me/Lfi, z = 1.5258 Gw−0.7754 Ga0.7996 Twi−0.07300.983
Table 4. Fill characteristic equations for loss coefficient per meter of fill for different fill configurations [32].
Fill ConfigurationFill Characteristic Equations for Kfdm/LfiCorrelation
Coefficient
CrossflowKfdm/Lfi, x = 11.007Gw0.2458Ga−0.0974 + 3.4886 × 10⁻⁷ Gw5.6876 Ga6.50110.994
CounterflowKfdm/Lfi, z = 3.1980 Gw0.4920 Ga−1.4110 + 7.6960 Gw0.1100 Ga0.09100.982
Crossflow (counterflow config.)Kfdm/Lfi,x = 29.0167 Gw0.1332 Ga−0.0774 + 2.9590 × 10⁻⁷ Gw8.9749 Ga2.00270.939
Table 5. Pressure drop characteristic equations for two operating regimes of the wet cooling tower [37].
Operating Regime Pressure Drop Characteristic EquationCorrelation Coefficient
Pellicular regime (PR) Δ p w / Z = 44.2 × ( G ) 1.77 + 82.9738 × ( L ) 1.20906 ( G ) 1.545156 0.900
Bubble and dispersion regime (BDR) Δ p w / Z = 44.2 × ( G ) 1.77 + 1016.39 × ( L ) 0.470852 ( G ) 0.844056
L′ = 0.45–2.027 kg/s m2 and G′ = 0.455–2.37 kg/s m2
0.840
Table 6. Global heat and mass transport coefficient equations for two operating regimes of the wet cooling tower [37].
Operating Regime Ka Equation
Pellicular regime (PR) K a = 0.183 × ( Δ p w / Z ) 0.434
Bubble and dispersion regime (BDR) K a = 0.184 × ( Δ p w / Z ) 0.442
Table 7. Various cooling towers with different fill media and some applicable operating conditions.
AuthorSpecificationMajor Finding
Ahmed et al. [1]
2022
Fill type: splash
Rang (°C): 8–11
Approach (°C): -
Air flow rate: 5000–6300 kg·m3·h−1
Water flow rate: 4000–8000 kg·m3·h−1
Applications: local stations in Baghdad
Major finding: Fix fill media and change the water inlet temperature. Considered the effects on characteristic of cooling tower by increasing the ratio of water/air flow rate. Performance will decrease, and by increasing the water inlet temperature, the range and heat dissipation will also increase.
Fan et al. [33]
2021
Fill type: film
Rang (°C): 5–14
Approach (°C): 0–5
Air flow rate: 12 ton·m−2·h−1
Water flow rate: 518–2073 m3·h−1
Applications: a guideline for industries
Major finding: Proposed new fill media for industrial applications. Could increase cooling performance up to 50% by increasing dry length from 1.5 to 2.4 m. Compared to the conventional fill, the pressure drop is larger and so optimum value needs to be found for specific industries.
Kong et al. [40]
2018
Fill type: pack
Rang (°C): 4–15
Approach (°C): 0–5
Air flow rate: L/G 0.5–1.7
Water flow rate: 518–2073 m3·h−1
Applications: a guideline for industries
Major finding: Explored how alterations in the ratio of water to air mass flow impact the heat and mass transfer traits of the cooling tower under varying inlet water temperatures. The findings indicate that as the water-to-air mass flow ratio (L/G) rises, both the cooling water range (R) and the efficiency of the cooling tower decline.
Zhou et al. [41]
2018
Fill type: film
Rang (°C): 4–9
Approach (°C): 2–10
Air flow rate: 0.2–0.5 kg·s−1
Water flow rate: 0.5–3.7 kg·s−1
Applications: theoretical approach
Major finding: Under the same operating conditions, applying pack fill media brings 0.6 °C and 1.5 °C benefits for outlet temperature. Also, for efficiency, packing adds 6.0% and 14.8% compared to cooling tower without pack.
Wang et al. [42]
2018
Fill type: film-S wave
Rang (°C): 10
Approach (°C): -
Air flow rate: 11,500–14,500 kg·s−1
Water flow rate: 95,027 kg·s−1
Applications: Chongqing power plant
Major finding: Cooling performance of four kinds of fill height (1.25 m, 1.5 m, 1.75 m, and 2 m) was numerically simulated. The results demonstrate that the S wave has the highest cooling efficiency in three fills for both towers, indicating that fill characteristics are crucial to cooling performance.
Keshtkar [43]
2017
Fill type: film
Rang (°C): 7.63
Approach (°C): 3.5
Air flow rate: 1.265 kg·s−1
Water flow rate: 1.008 kg·s−1
Applications: optimization
Major finding: The energetic performance of the cooling tower was used to describe the given problem. From the calculations, it can be seen that water exergy decreases from top to bottom of the fill. It reveals that the evaporative exergy of air mainly controls exergy of air.
Zili-Ghedira et al. [44]
2017
Fill type: pack
Rang (°C): 8
Approach (°C): -
Air flow rate: 0.4–0.64 kg·s−1
Water flow rate: 0.2–0.3 kg·s−1
Applications: numerical investigation
Major finding: Different packs were investigated numerically and the effect of pack on cooling tower was considered. Influences of the thermophysical properties of packing materials, along with the water–air exchange surface and humidifier aspect ratio, were studied in detail.
Singh and Das [45]
2017
Fill type: splash fill
Rang (°C): 3
Approach (°C): 6
Air flow rate: 0.1-0.25 kg·s−1
Water flow rate: 0.1-0.25 kg·s−1
Applications: numerical investigation
Major finding: Numerical modeling exergy investigation of wooden splash fill. Different from previous neglecting of the five performance parameters, this study developed an unconstrained optimization of all objective functions with satisfactory results.
Gao et al. [20]
2017
Fill type: pack
Rang (°C): -
Approach (°C): -
Air flow rate: -
Water flow rate: 6 Liter·min−1
Applications: -
Major finding: The experimental findings demonstrated that in calm wind conditions, the heat transfer coefficient and total heat rejection of circulating water significantly improved by about 40% and 28%, respectively, when using the optimal non-uniform layout pattern, as opposed to the uniform layout pattern.
Ning et al. [46]
2015
Fill type: pack
Rang (°C): 4–18
Approach (°C): 1–4
Air flow rate: 5880–36,480 kg·h−1
Water flow rate: 8000–14,000 kg·h−1
Applications: power plant
Major finding: Based on the results, under normal and defect conditions, the cooling tower characteristic (KaV/L) and the efficiency coefficient (h) decrease as the water-to-air ratio increases. Compared to normal conditions, the cooling tower characteristics only decrease under nozzle and filling blockage but undergo remarkable decrease of over 60% when subjected to conditions involving nozzle drop.
Ramkumar and Ragupathy [47]
2014
Fill type: pack
Rang (°C): 4–18
Approach (°C): 1–4
Air flow rate: 100–200 kg·h−1
Water flow rate: 100–200 kg·h−1
Applications: effect of pack geometry
Major finding: This research focuses on utilizing the Taguchi method to evaluate the maximum cooling tower efficiency in a counterflow cooling tower while employing various packing types. The study explores the application of the Taguchi method in this context.
Shahali et al. [48]
2016
Fill type: pack
Rang (°C): 2.5–25
Approach (°C): -
Air flow rate: 0.03–0.05 kg·s−1
Water flow rate: 40–140 L·h−1
Applications: effect of pack geometry
Major finding: This study aimed to experimentally examine the performance of a wet cooling tower (WCT). To achieve this, the thermal efficiency of the WCT was analyzed to consider the influence of water flow rate, inlet water temperature, rib numbers of packing, and mass flow rate of air.
Rahmati et al. [22]
2016
Fill type: pack
Rang (°C): 2.5–5.5
Approach (°C): -
Air flow rate: 0.02–0.07 kg·s−1
Water flow rate: 0.06–0.1 m3·h−1
Applications: effect of pack geometry
Major finding: Investigation of effect of rib number on efficiency and thermal performance. Results showed that the efficiency is strongly related to hot water temperature, stage numbers of packing, and air mass flow rate, and it diminishes by raising the water flow rate.
Imani-Mofrad et al. [49]
2016
Fill type: pack
Rang (°C): 12–16
Approach (°C): -
Air flow rate: 1.8 kg·min−1
Water flow rate: 1.8 kg·min−1
Applications: different types of fill
Major finding: Considered effect of nanofluid on water inlet and different fill types. Via nanofluids, cooling range, tower characteristic (TC), and effectiveness of cooling tower, TC enhanced by 21.5% and 22.5% for ZnO/water nanofluid with concentrations of 0.02 wt% and 0.05 wt%, respectively.
Lemouari et al. [37]
2011
Fill type: pack
Rang (°C): -
Approach (°C): -
Air flow rate: 2000–10000 kg·m−2h−1
Water flow rate: 0.01–0.045 kg·s−1
Applications: nuclear electric power
Major finding: The relationship between the pressure drop behavior and the combined heat and mass transfer (air and water) within the cooling tower’s packing material was emphasized. The findings suggest that this particular tower demonstrates favorable hydraulic properties, resulting in energy conservation.
Zhao et al. [50]
2023
Fill type: pack
Rang (°C): 3–5
Approach (°C): 6–9
Air flow rate: 77.87 kg·s−1
Water flow rate: 52.1–53.2 kg·s−1
Applications: actual cooling tower
Major finding: Incorporating four parallel small grooves into the packing design of a crossflow cooling tower was shown to enhance thermal performance by up to 12.2% compared to traditional corrugated packing. Conversely, the addition of less than four small grooves results in a decline in the cooling performance of the packing.
Javadpour et al. [51]
2022
Fill type: pack
Rang (°C): 4–18
Approach (°C): 6-9
Water flow rate/ Air flow rate:
0.4–2
Applications: actual cooling tower
Major finding: This research explored the choice of an appropriate filled bed for a crossflow cooling tower when using either water or nanofluids as the fluid. Two types of fillers were examined: splash beds and film beds, which consisted of four grid splash fillers and two cylindrical and spherical film fillers.
Fan et al. [52]
2021
Fill type: pack
Rang (°C): -
Approach (°C): -
Air flow rate: 15 ton·h·m−2
Water flow rate: -
Applications: actual cooling tower
Major finding: The DPECT (dew point evaporative cooling tower) demonstrated an impressive wet-bulb effectiveness of up to 1.10 under specific conditions, including a dry-bulb temperature of 30 °C, relative humidity of 30%, and inlet water temperature of 30 °C. It was evident that the DPECT, based on the M-cycle, had the capability to cool the water below the wet-bulb temperature of the surrounding air, a feat not attainable with conventional cooling towers. This highlights the DPECT’s potential to surpass the temperature limitations of traditional cooling towers and further reduce the water temperature.
Rahmati et al. [53]
2021
Fill type: pack
Rang (°C): 12–15.5
Approach (°C): -
Air flow rate:
Water flow rate: -
Applications: laboratory cooling tower
Major finding: The study findings suggest that increasing the number of packing layers in the WCT (wet cooling tower) can enhance thermal performance, regardless of whether water or nanofluid is used. This effect is particularly prominent when nanofluid is employed, especially with denser packing. Moreover, the results demonstrate that elevating the nanofluid concentration also improves the WCT’s thermal performance.
Zengin et al. [54]
2020
Fill type: pack
Rang (°C): 10
Approach (°C): -
Air flow rate: 13–34 m3·h−1
Water flow rate: 17–52 m3·h−1
Applications: research
Major finding: This research examines the pressure losses and thermal efficiency of mechanical draft counterflow water cooling towers with varying cooling fill heights. The study conducted separate measurements of pressure losses through the cooling fill for each condition during the thermal performance tests. The researchers plotted the variation of pressure losses with air velocity across cooling fills at different loading heights. Performance curves were generated and compared, presenting graphs that illustrate the relationship between the liquid-to-gas ratio (L/G) and the Merkel number for cooling fills at heights ranging from 1500 mm to 2400 mm. Interestingly, despite the lowest and highest flow resistances being observed at fill heights of 1500 mm and 2400 mm, respectively, the cooling tower’s lowest and highest performances were calculated at fill heights of 1500 mm and 2400 mm, respectively. This suggests that the cooling tower’s thermal performance is not directly linked to flow resistance.
Table 8. Various types of configurations for fill media in wet cooling towers.
ConfigurationsSpecifications
Processes 11 02578 i014
Kong et al. [17]
Material: Foamed ceramic
Specifications: The fill media consists of foamed ceramic corrugated board with sine waves, and surface retention groove is 1.0 m high and has a cross-sectional test area of 0.68 × 0.68 m2.
Finding: Investigated how alterations in the ratio of water-to-air mass flow impact the heat and mass transfer traits of the cooling tower under varying inlet water temperatures. The findings indicate that as the water-to-air mass flow ratio (L/G) rises, both the cooling water range (R) and the efficiency of the cooling tower decline.
Processes 11 02578 i015
Javadpour et al. [51]
Material: Carbon nanotubes
Specifications: The study involved the utilization of titanium dioxide nanofluids (TiO2), multi-walled carbon nanotubes (MWCNT), along with six different types of fill media categorized into films and splashes.
Finding: The cooling range, effectiveness, and Merkel number experienced a substantial increase of 28%, 85%, and 131%, respectively. The cases of Bed 3 and Bed 5 were selected as the appropriate fill media.
Processes 11 02578 i016
Shahali et al. [48]
Material: PVC pack
Specifications: Three distinct PVC fill media (7, 9, and 18 ribs) are individually examined to explore the effects of rib numbers. The cooling tower was filled with the GA (vertical grid apparatus) packing.
Finding: The research focused on examining the impact of rib numbers on three types of PVC packing. The findings indicate that both water temperature difference and cooling efficiency are influenced by several factors, including the inlet water temperature, the rib numbers of the packing, and the mass flow rate of air.
Processes 11 02578 i017
Zhou et al. [61]
Material: Non-uniform pack
Specifications: Fills have non-uniform layout and adopt different heights at the different radii.
Finding: The study found that non-uniform fillings can alleviate the adverse effect of crosswind on thermal performance. Among the considered fills, the optimal non-uniform pattern from the perspective of drag characteristic and thermal performance under crosswind conditions and relatively water-saving fill were determined. It recommends selecting optimal non-uniform filling pattern by taking both energy conservation and water savings into account.
Processes 11 02578 i018
Imani-Mofrad et al. [49]
Material: Metal, plastic, metal grid, metal wavy.
Specifications: ---
Finding: The metal reticular bed, known as Bed 1, was identified as the most appropriate option for utilizing nanofluids. Subsequently, the study focused on assessing the enhanced performance of the cooling tower when employing the metal reticular bed with various concentrations of ZnO/water nanofluid (ranging from 0.02% to 0.1%) in comparison to pure water.
Processes 11 02578 i019
Vitkovic [62]
Material: Single-layer grid fill
Specifications: ---
Finding: Cooling towers generally employ film fill, grid fill, or splash fill. Compared to film fill, grid fill usually exhibits lower heat transfer performance. However, it offers the advantage of being highly resistant to blockage. Grid fill is constructed with separate layers made from plastic, typically featuring several interconnected bars in different shapes. In the experiment, the rhombus shape was utilized. The diameter of droplets was measured both above and below the grid fill.
Processes 11 02578 i020
Ozgur and Bayrakci [63]
Material: Metal wire
Specifications: The diameter of each curler filling material was 63 mm. However, each curler filling had 24 rectangular spacings.
Finding: Among the parameters studied, air mass flux was identified as the most influential, followed by fill height and water mass flux. For fill heights of 0.6 m and 0.8 m, splash fill demonstrated lower pressure loss values. These findings offer valuable insights for cooling tower designers and have practical implications in various industrial applications, including cooling with dirty and limy water, dusty ambient air flow, and inlet water temperatures exceeding 60 °C.
Processes 11 02578 i021
Zhao et al. [50]
Material: Commercial corrugated packing
Specifications: Five kinds of fill media were made, incorporating small grooves with varying orientations and quantities.
Finding: Incorporating four parallel small grooves led to an enhancement in the thermal performance of packing, with improvements of up to 12.2%. However, the addition of a lower number of grooves can result in a decline in cooling performance. Furthermore, when multiple crossed grooves are present, the cooling performance may decrease by 14.4% under specific conditions.
Processes 11 02578 i022
Jourdan et al. [12]
Material: PVC
Specifications: It is composed of various thermoformed PVC sheets of 0.06 cm thickness and forms a sinusoidal pattern with a period of 5 cm and an amplitude of 1.7 cm.
Finding: The primary aim of this study was to fill the existing data gap concerning liquid flows in structured packings utilized in industrial cooling towers. To accomplish this goal, the researchers designed and constructed an experimental device specifically tailored to characterize the flows within the packings.
Processes 11 02578 i023Ramkumar and Ragupathy [64]Material: Metal Specifications: The experiments were planned based on Taguchi’s L9 orthogonal array.Finding: The packing factor exerts the most significant influence on the total variation, accounting for 59.2% of the overall impact. Following closely, the liquid-to-gas ratio contributed to 29.1% of the variation, while water temperature had a relatively smaller effect at 9.6%.
Disclaimer/Publisher’s Note: The statements, opinions and data contained in all publications are solely those of the individual author(s) and contributor(s) and not of MDPI and/or the editor(s). MDPI and/or the editor(s) disclaim responsibility for any injury to people or property resulting from any ideas, methods, instructions or products referred to in the content.