Article

Spatial Structure Characteristics of Underground Reservoir Water Storage Space in Coal Mines Considering Shape Characteristics of Crushed Rock

1
State Key Laboratory of Water Resource Protection and Utilization in Coal Mining, Beijing 102211, China
2
China Academy of Safety Science and Technology, Beijing 100012, China
3
School of Civil and Resource Engineering, University of Science and Technology Beijing, Beijing 100083, China
4
Shendong Coal Group Co., Ltd., Erdos 017219, China
*
Author to whom correspondence should be addressed.
Processes 2023, 11(9), 2611; https://doi.org/10.3390/pr11092611
Submission received: 10 August 2023 / Revised: 24 August 2023 / Accepted: 26 August 2023 / Published: 1 September 2023

Abstract

:
In order to investigate the impact of a crushed rock shape on the storage coefficient of underground reservoirs in coal mines, statistical analysis of the shape characteristics of crushed rocks was conducted, which was followed by numerical packing tests using the rigid block model. These tests aimed to investigate the spatial structure characteristics of underground reservoir water storage space in coal mines under the influence of different shapes of crushed rock. The results demonstrated the following: (1) Crushed rock exhibits a lognormal distribution in its shape characteristic parameters at different scales with a predominant discoid shape. The shape coefficient M can be utilized as a comprehensive indicator to characterize the shape characteristics of crushed rock. (2) The average storage coefficient of crushed rock increases exponentially as the shape coefficient M increases. There is a 50.1% increase in the storage coefficient from M = 1 to 3.5. (3) The spatial structure of the water storage space exhibits self-similarity, and both the void fractal dimension and the void boundary fractal dimension increase with an increase in the shape coefficient M. (4) When comparing the non-spherical particle system with the spherical particle system, it is observed that the spherical particle system has smaller water storage space, lower connectivity among voids, and more irregular void space. In the non-spherical particle system, the water storage space becomes larger as the shape of crushed rock becomes more irregular, resulting in more irregular void space. However, there is no significant effect on void connectivity.

1. Introduction

Addressing technical challenges such as limited water storage capacity, high cost of water storage, wastage due to evaporation, and severe water pollution in the coal industries in western China, Gu [1] has been actively involved in technical research and engineering experiments on the underground storage of mine water. He has introduced the innovative concept of coal mine underground water reservoir storage and has also proposed the concept of the “storage coefficient” for the first time. The storage coefficient refers to the amount of water stored per unit volume of goaf. Underground reservoir water storage space in coal mines not only enables the storage and utilization of mine water but also utilizes the crushed gangue to filter, precipitate, adsorb, and undergo ion exchange for the self-purification treatment of mine water. This innovative approach addresses the challenges associated with the low efficiency, poor benefits, and low resource recovery rate observed in traditional water-retaining mining technology. The crushed rocks in coal mines form a complex particle packing system, with the voids in this system being the most important spaces for water storage underground. The shape of the crushed rocks influences the packing structure and subsequently affects the structure of the water storage space in the goaf [2,3,4]. Therefore, it is essential to study the spatial structure characteristics of the underground reservoir water storage space in coal mines, taking into account the shape characteristics of the crushed rocks.
In recent years, there have been several investigations conducted to study the spatial structure characteristics of underground reservoir water storage space in coal mines. These investigations have utilized theoretical analysis, laboratory experiments, and numerical simulations. In theoretical analysis research, Song et al. [5] employed the key layer theory to quantitatively describe the subsidence of the overlying rock mass in the goaf. They also examined the distribution characteristics of overburden fractures under the influence of mining. Based on the relative amount of subsidence, they derived an approximate formula for the void ratio of the overlying regular movement zone. Wang et al. [6] established the void structure model of crushed rock based on fractal theory, and the research results showed that the water storage performance is good. Ju et al. [7] used the “O” ring theoretical model of overburden fractures distribution to establish the mathematical expression of underground reservoir storage capacity and guided the underground reservoir engineering practice in the Lijiatou Coal Mine. Fang et al. [8] established a model for calculating the storage coefficient of underground reservoir considering the influence of effective stress and determined the analytical solution of the model. In laboratory experimental research, Szlazak [9] conducted numerous experiments on the void ratio of the goaf in a longwall face. The study also examined the spatial distribution patterns of the void ratio at various positions along the longwall face. A testing system used for a bearing deformation test of large-size broken rock was developed by Zhang et al. and the typical sandstone from the roof was chosen as a sample. The test results indicated that along with the increase in axial load, the residual bulking coefficient and void decrease gradually [10]. In order to study the effects of the water-saturated state on crushed stone, the compaction tests on sandstone, mudstone and sandy mudstone from the #3 coal seam roof of the Yima Xin’an Mine were conducted by using a self-developed apparatus. Chen et al. [11] founded that the strength of crushed rock was negatively correlated with the decreases of the residual swelling coefficient, residual void ratio and compaction. Deng et al. [12] conducted physical experiments to investigate the laws of overburden rock mass breakage, the development of off-seam cracks, and the swelling of mined rock mass. They found that the swelling coefficient of mined rock mass increases near the mined coal seam. However, as the distance from the coal seam increases, the swelling coefficient gradually decreases and eventually reaches a constant value. Ma et al. [13,14] and Su et al. [15] conducted a study on the variation laws of the swelling coefficient, void ratio, and connectivity during the compaction process of crushed rock in the coal seam roof of the goaf. They observed that the reduction in swelling coefficient and void ratio increases with the higher compaction stress and larger size of crushed rock. In numerical simulation research, Li et al. [16] conducted a CT scanning to extract the actual shape information of crushed gangue. They then analyzed the impact of particle gradation and shape on the void ratio of the natural packing system using discrete element numerical software. The results revealed that the irregularity of the crushed gangue shape directly affects the void ratio of the particle packing system. Zhang et al. [17] employed PFC software and a spherical particle model to investigate the stress, void structure, and crushing evolution characteristics of crushed coal and rock samples during the compaction process. However, their simulation process overlooked the influence of particle size and shape of the crushed coal and rock samples. Pang et al. [18] examined the fracture structure of the overlying rock mass on the working surface by utilizing fracture mechanics theory and UDEC software. They also derived the temporal and spatial evolution patterns of the effective storage coefficient through the vertical displacement trajectory curves of the subdivided overburdens of the underground reservoir. Additionally, the results of basic experiments and numerical simulation studies on packing density [19], local order degree [20], bridge structure [21], topological structure [22], porosity structure fraction [23] and non-spherical particle packing [24] were published, exploring the intrinsic nonuniformity of particle packing systems from different perspectives.
The current research on the storage coefficient lacks consideration of the influence of shape characteristics of crushed rock on the spatial distribution law of the storage coefficient. This leads to unreliable analysis depth and calculation results of the spatial structure characteristics of water storage space. The shape of crushed rock can affect the water storage capacity of an underground reservoir by influencing the size, connectivity, non-uniformity and other structure characteristics of water storage space. To address this, this paper utilizes 3D laser scanning to statistically analyze the shape characteristics of crushed rock. It also investigates the spatial structure characteristics of underground reservoir water storage space in coal mines, taking into account the influence of different shapes of crushed rock using the Rigid Block Model (RBM). The main objective of this study is to conduct basic research on the spatial structure characteristics of underground reservoir water storage space based on the shape of crushed rock, which is often overlooked. Factors such as particle gradation and water absorption characteristics are not considered. The results of this study are a kind of useful supplement and improvement to the existing research ideas and means of underground water reservoir storage problems in coal mines, and they provide theoretical and technical support for the design and planning of underground water reservoir capacity and the coordinated development of coal mining and water resources protection in western China. Furthermore, they provide a scientific basis for both basic theoretical research and practical applications in particle packing systems. These systems encompass various materials such as caved ore and rock in metal mines, sand, grain, and chemical particles. The findings aim to enhance the safety and efficiency of granular materials throughout their storage, packing, transportation, and other related processes.

2. Materials and Methods

2.1. Materials

The crushed rocks used in this study were taken from Haragou Coal Mine, Daliuta Town, Shenmu County, Shaanxi Province, with a size range of 5–45 mm and a solid density of 2300 kg/m3 (Figure 1a). The crushed rocks were divided into 8 groups based on particle size sieving, with each group having a particle size interval of 5 mm. From each group, 200 blocks were randomly chosen and scanned using an EiScan-SE 3D laser scanner equipped with the SHINING 3D software (Figure 1b). Subsequently, a 3D model of the crushed rock was created (Figure 1c). The 3D model construction process of crushed rock mass is shown in Figure 1.

2.2. Shape Indicators of Crushed Rock

Particle shape plays a crucial role in determining the void distribution law of a particle packing system [25]. To investigate how different shapes of crushed rocks affect the spatial structural characteristics of underground reservoir water storage space in coal mines, it is essential to quantitatively characterize the shape of the crushed rock. In general, the particle shape can be quantitatively described in three scales: overall shape, angular features and surface texture [26]. The first scale indicators describe the overall shape characteristics of particles, including the long-to-medium axis ratio e, the medium-to-short axis ratio f and the sphericity ψ; the second scale indicator describes the angular characteristics of particles, which is usually expressed by the convexity Cv; and the third scale indicator describes the surface texture of particles, which is characterized by the roughness. Relevant research results indicate that the third scale shape indicator does not significantly affect the packing structure and mechanical properties of particle systems [27,28,29,30], as typically characterized by the friction coefficient in discrete element numerical simulations [31]. Therefore, this study focuses solely on the first and second scale shape indicators of crushed rock. Table 1 presents the shape indicators of crushed rock used in this study.

2.3. Test Design

The shape of crushed rock can have a significant impact on the size, connectivity, and stability of underground reservoir water storage space in coal mines. As introduced in Section 2.1, the laser-scanning technique was used to create 3D models of crushed rock in various shapes. These models were then imported into PFC3D software to generate irregular particle shape templates, which were further utilized to construct rigid block models of different shapes. In order to investigate the spatial structure characteristics of water storage space under the influence of different shapes of crushed rock, numerical packing tests were conducted using the rigid block model in PFC3D, which can reliably characterize the shape characteristics of irregular particles while ensuring high simulation efficiency compared with other numerical software based on the finite element method and finite difference method. To ensure the uniqueness of each shape characteristic, each numerical packing test was conducted using only one crushed rock shape. In this study, six sets of numerical packing tests were designed based on the statistical results of the typical shape characteristic of crushed rock mentioned in Section 3.1, and the average shape coefficients M were set to 1.0, 1.5, 2.0, 2.5, 3.0, and 3.5, with a variance range of M ± 0.1. We note the following: (1) The numerical packing test based upon spherical particles (M = 1) is considered as a controlled test. (2) Considering the simulation accuracy and computational efficiency, the shape of the real crushed rock is appropriately simplified to reduce the number of invalid contacts between irregular rigid blocks [32,33].
The rigid block gradation in these numerical tests was determined by the Fuller equation of gradation curve [34]:
P = 100 × d d max n
Here, P denotes the passing percentage of the rigid block on the sieve diameter d, dmax denotes the maximum particle size, and n denotes the Talbol power index. n = 0.6 [34] was taken here, and the size range of crushed rock is 0.1–1.2 m.
The 52,304 fully mechanized mining face of Haragou Coal Mine in Shenmu County, Shaanxi Province, is taken as the research object, and the height of its caving zone is about 15 m, the burial depth ranges from 150 to 268 m, the self-weight stress of overlying rock mass ranges from 3.0 to 6.5 MPa, and the density of crushed rock is 2300 kg/m3. Therefore, in these numerical tests, the goaf was abstracted as a characterization unit model of crushed rock of 15 m × 15 m × 15 m (about 20 times of the average size) [31], and the overlying stress was set 5 MPa, as shown in Table 2. The friction coefficients of wall and rigid block were determined to be 0.50 and 0.55, respectively, based on the natural repose angle tests shown in Figure 2, and the specific meso-mechanical parameters of the wall and rigid block are presented in Table 3.

2.4. Test Procedures

Numerical packing tests of crushed rock with different shapes were carried out as follows. (1) Initial packing: Based on the linear contact model and after gravity settling [35], an initial packing model of crushed rock with different shapes was created, and the walls and rigid blocks were assigned with the meso-mechanical parameters as presented in Table 3. (2) Applying overlying stress: The side and bottom walls of the model were fixed, and the top wall started to move down and compress the crushed rocks until the vertical stress σz reaches 5 MPa. (3) The average void ratios (storage coefficients) of the packing system of crushed rock with different shapes were calculated based on the FISH language in PFC3D. Six tests were conducted to obtain these ratios. Additionally, the storage coefficients of each layer within the model height range of 1–14 m were calculated at intervals of 1 m from the vertical height in all six tests. Taking the numerical packing test M = 3.0 as an example, the final packing model of crushed rock is shown in Figure 3.

3. Results

3.1. Statistical Analysis of the Shape Characteristics of Crushed Rock

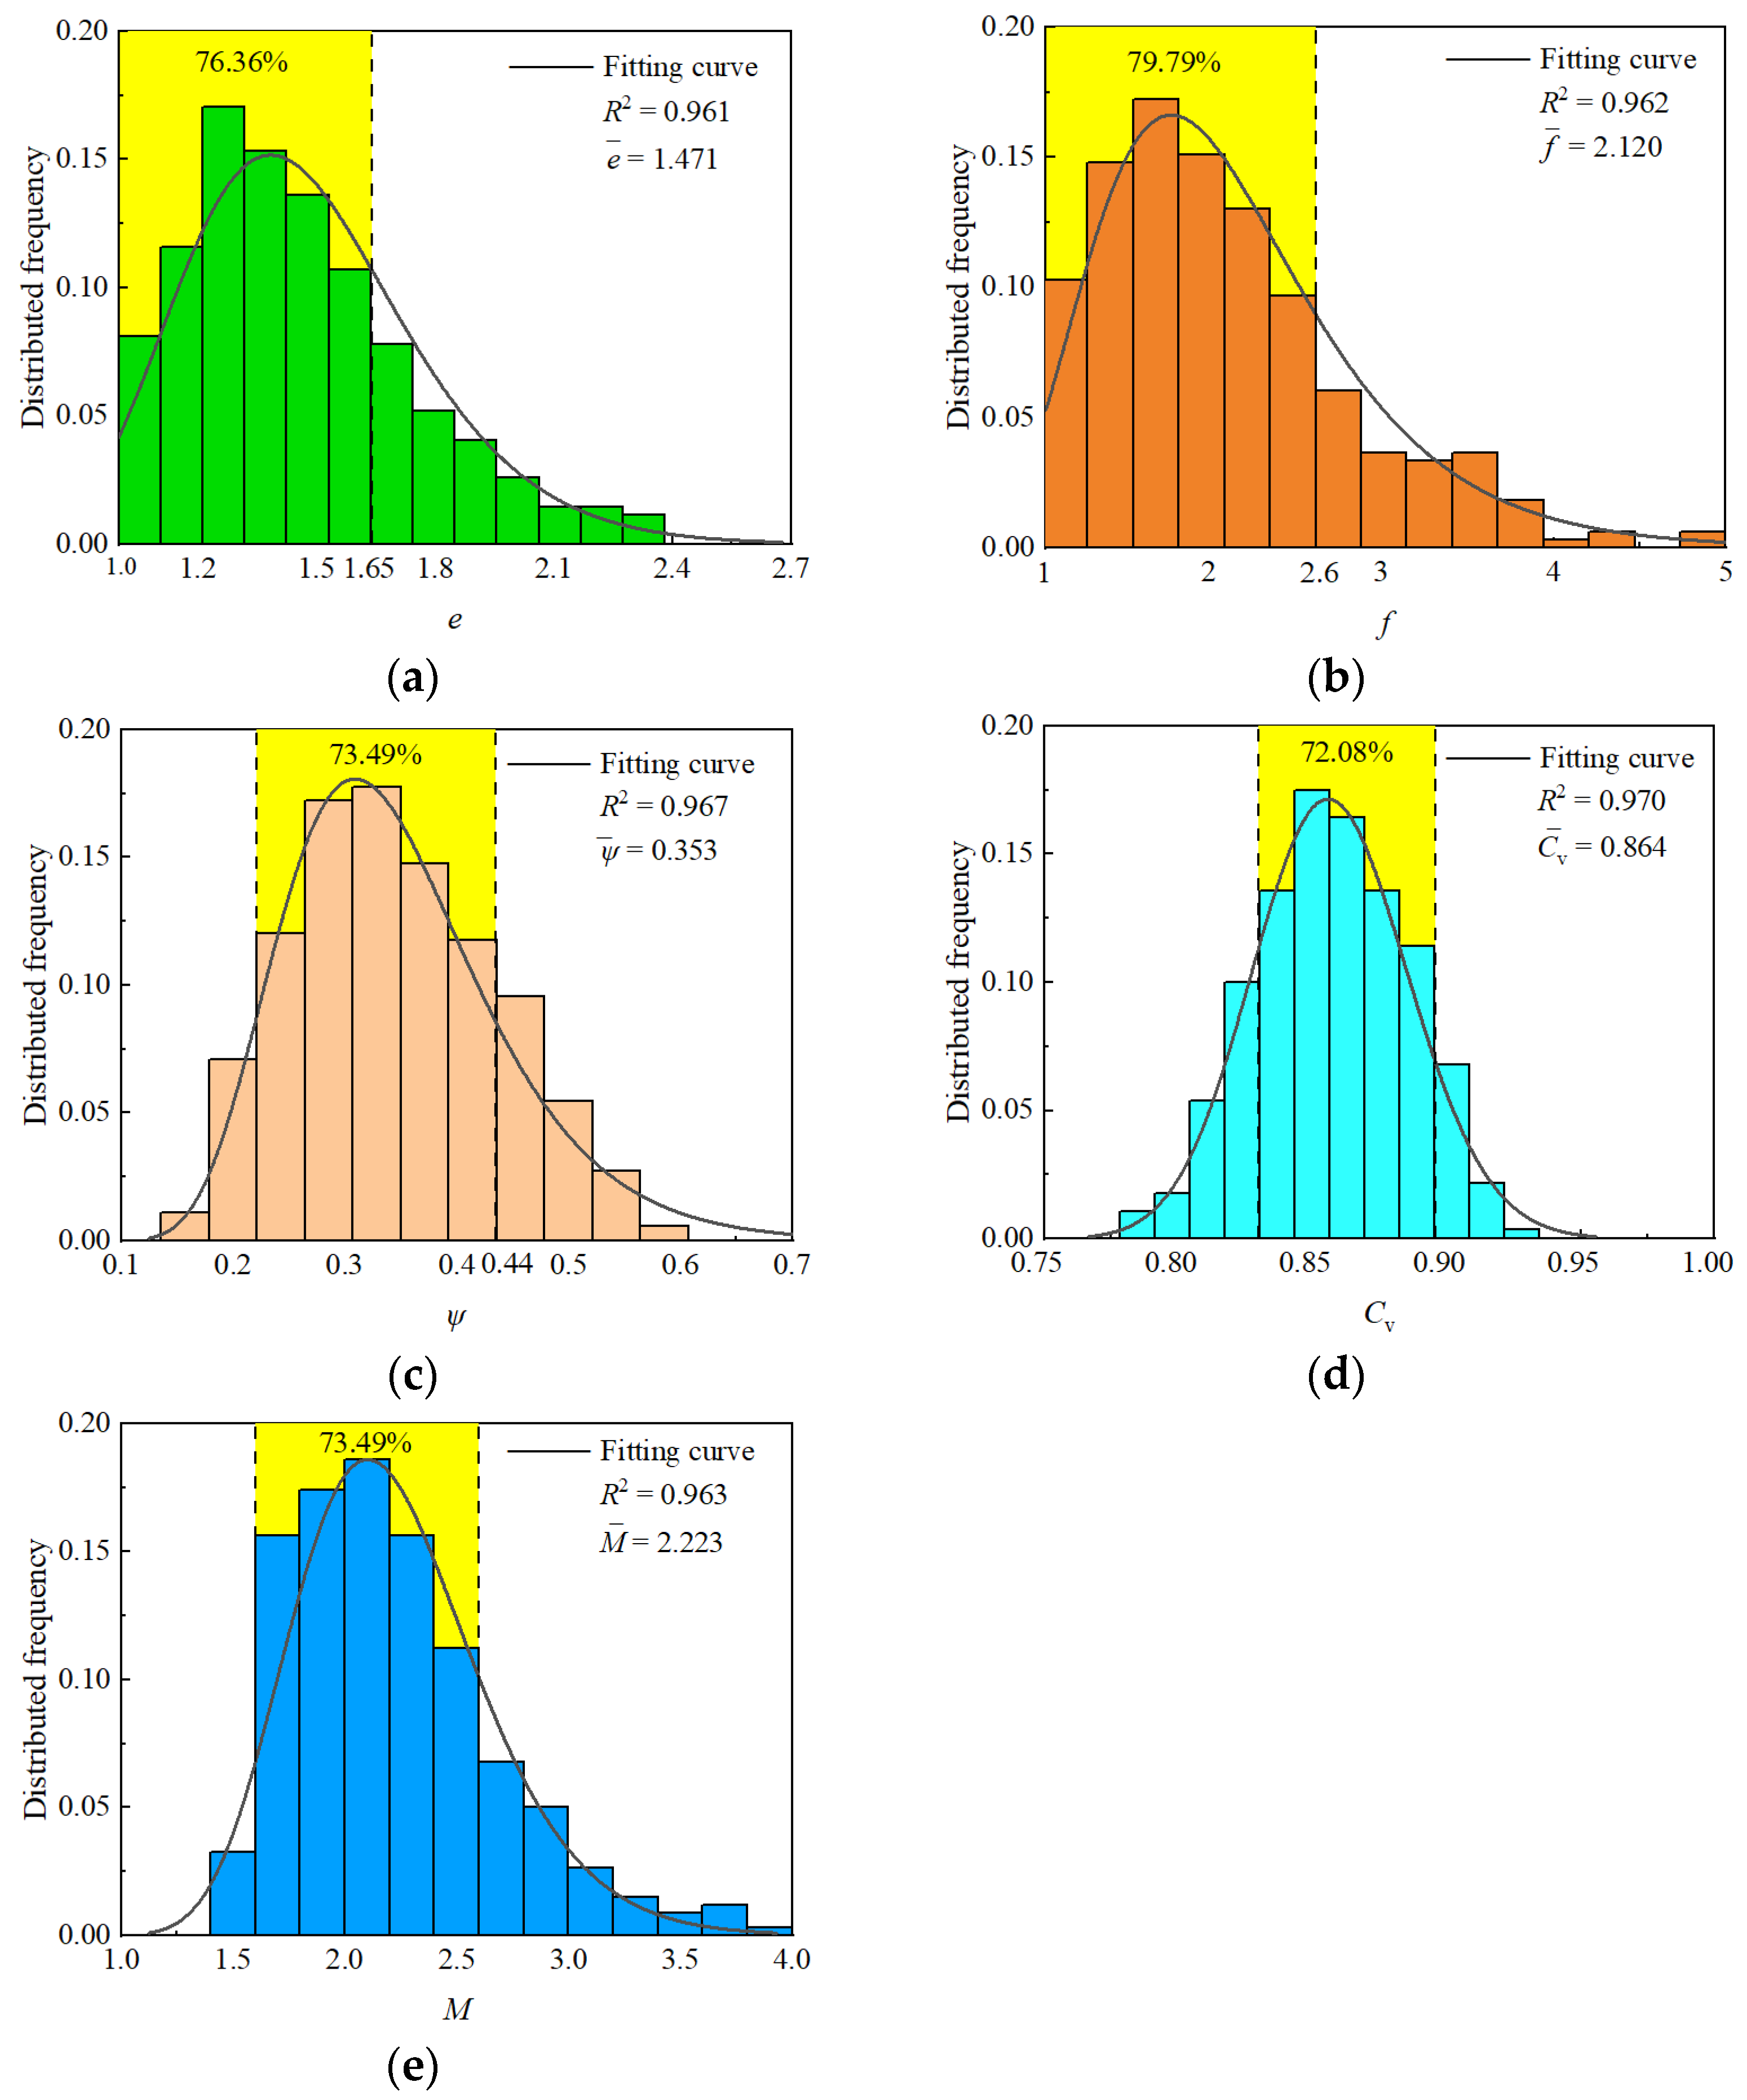
The quantitative characterizations of the long-to-medium axis ratio e, the medium-to-short axis ratio f, the sphericity ψ, the convexity Cv, and the shape coefficient M as shown in Table 1 were achieved using MATLAB software, based on the 3D model of crushed rock obtained through 3D laser scanning. Figure 4 depicts the statistical distributions of various shape indicators of crushed rock. The curves in the figure represent the fitting results obtained using the lognormal distribution model. As shown in Figure 4, (1) the long-to-medium axis ratio e ranges from 1 to 2.4, with a mean value of 1.471. The majority of values are concentrated in the range of 1 to 1.65, accounting for 76.36% of the data. The middle-to-short axis ratio f ranges from 1 to 5, with a mean value of 2.120. The majority of values are concentrated in the range of 1 to 2.6, accounting for 79.79% of the data. The sphericity ψ ranges from 0.15 to 0.6, with a mean value of 0.353. The majority of values are concentrated in the range of 0.22 to 0.44, accounting for 73.49% of the data. The convexity Cv ranges from 0.78 to 0.92, with a mean value of 0.864. The majority of values are concentrated in the range of 0.83 to 0.90, accounting for 72.08% of the data. And the shape coefficient M ranges from 1.3 to 4.0, with a mean value of 2.223. The majority of values are concentrated in the range of 1.6 to 2.6, accounting for 73.49% of the data. (2) The correlation coefficient R2 values are all greater than 0.961, indicating that the lognormal distribution model accurately describes the distribution laws of the long-to-medium axis ratio e, the short-to-medium axis ratio f, the sphericity ψ, the convexity and concavity Cv, and the shape coefficient M of crushed rock.
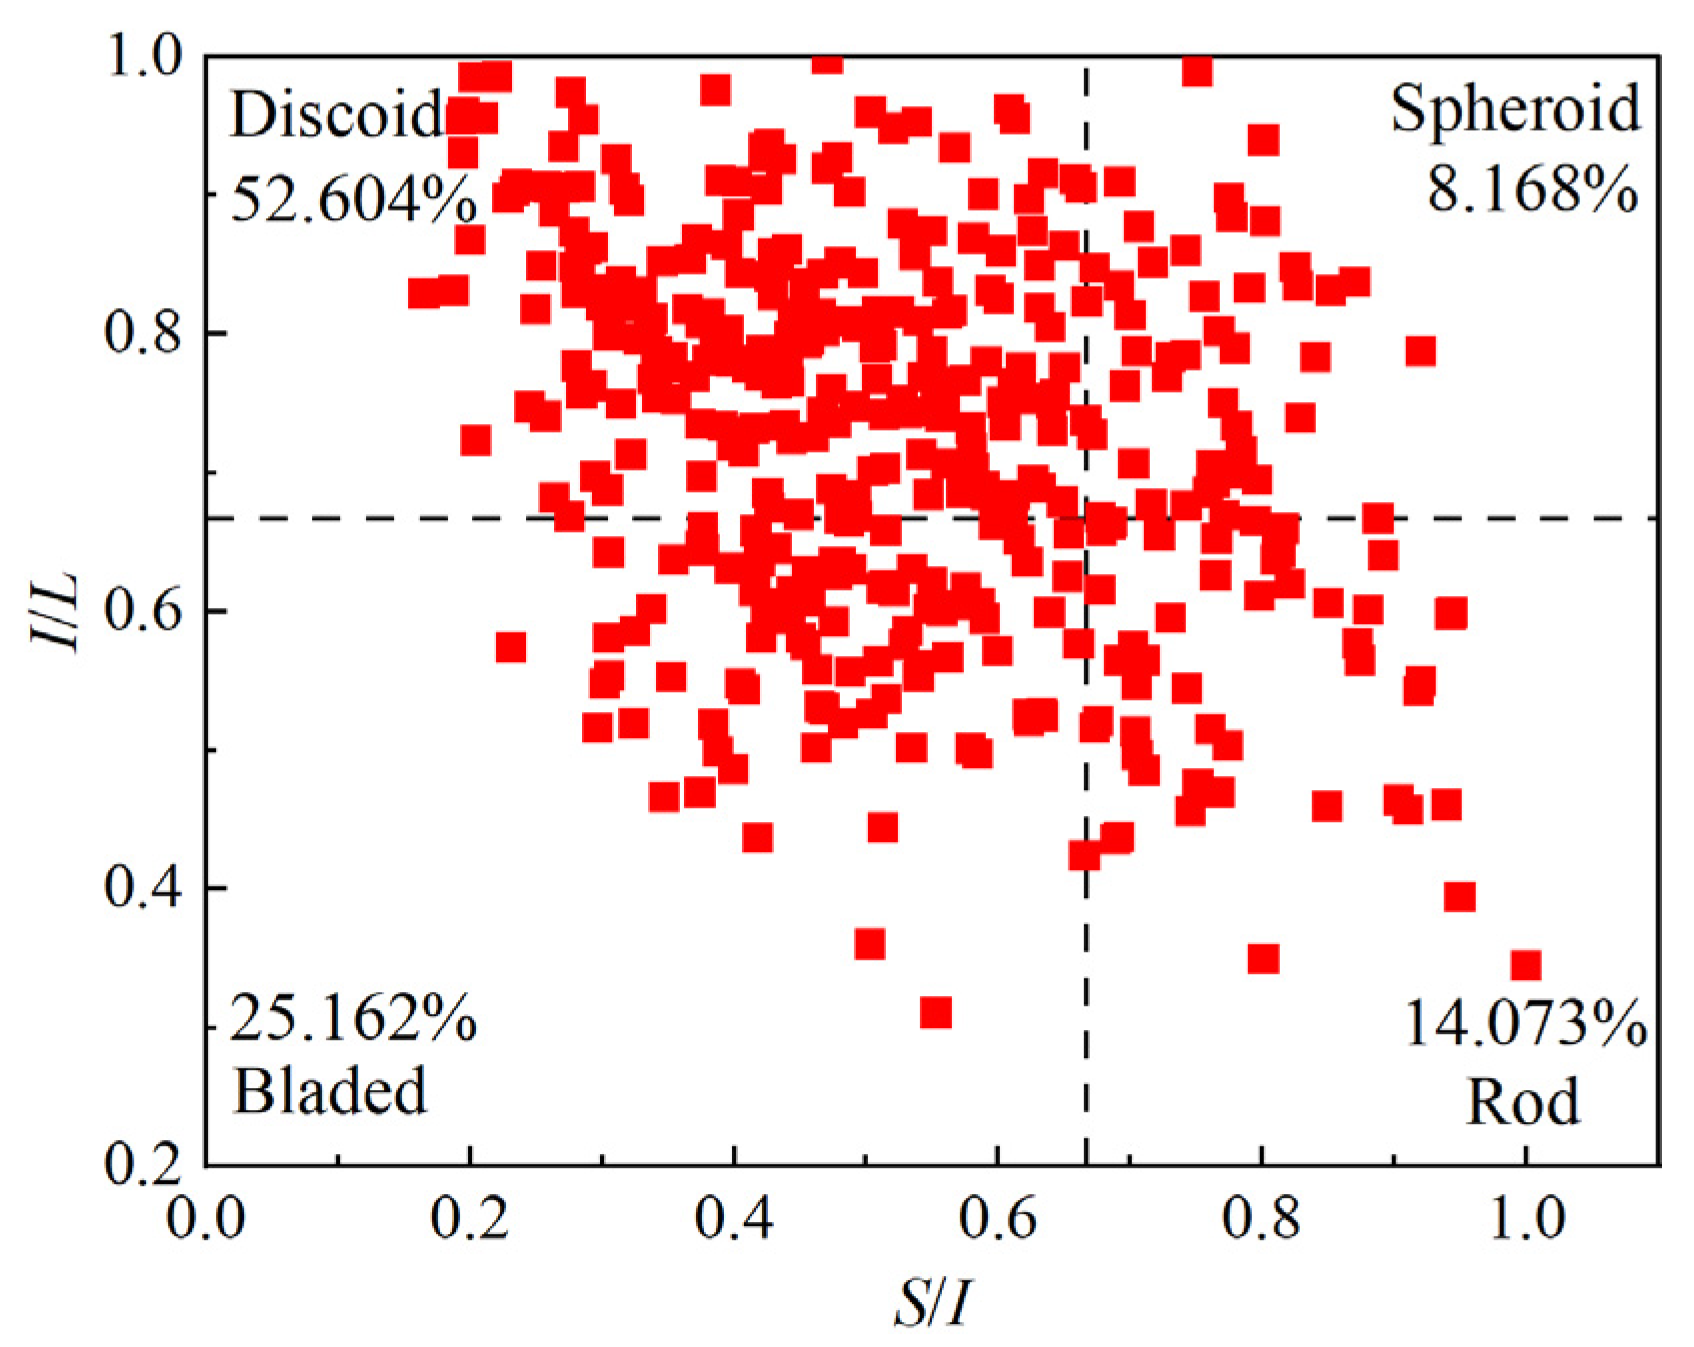
The Zingg classification method [36] was employed to categorize the crushed rocks into four groups: discoids, spheroids, blades, and rods. The statistical findings of the proportion are presented in Figure 5. As depicted in the figure, the distribution of the four categories is as follows: discoids (52.604%), spheroids (8.168%), blades (25.162%), and rods (14.073%). These results suggest that the discoid characteristics of the crushed rocks are more prominent overall. This is mainly caused by geological processes; namely, the overlying strata are layered sedimentary rocks. In addition, the establishment of a quantitative relationship between particle shape and the structure of a particle packing system is hindered by an excessive number of shape indicators. Consequently, many scholars have attempted to use a single shape indicator to characterize particle shape. For instance, they have used the mean value of sphericity and roundness or the dimensionless indicator shape coefficient M to describe the degree of irregularity in the particle shape [37,38]. Therefore, in this study, the Pearson correlation coefficient method [39] was employed to analyze the correlation between the equivalent diameter D of crushed rock and its shape indicators. The correlation hotspot maps of different shape indicators of crushed rock were obtained, as shown in Figure 6. Typically, when the absolute value of the Pearson correlation coefficient between two parameters is less than 0.2, there is considered to be no correlation. Conversely, when the absolute value of the correlation coefficient exceeds 0.6, a strong correlation between the two parameters is observed. The following points are shown in Figure 6. (1) The correlation coefficients of equivalent diameter D with the long-to-medium axis ratio e, medium-to-short axis ratio f, sphericity ψ, convexity Cv and shape coefficient M are 0.099, −0.182, 0.068, 0.011, and −0.051, respectively, and the absolute values of the correlation coefficients are less than 0.2, indicating that there is no significant correlation between the shape indicators of crushed rocks and their particle size. (2) The correlation coefficients between the shape coefficient M and e, f, ψ, and Cv are 0.627, 0.707, −0.817 and −0.792, respectively, and the absolute values of the correlation coefficients are greater than 0.6, indicating that the shape coefficient M is an effective indicator to characterize the shape characteristics of crushed rock in different scales. Therefore, it is particularly useful in studying the spatial structure characteristics of underground reservoir water storage space in coal mines.

3.2. Variation Law of Storage Coefficient

Figure 7 shows the relationship curves between the average storage coefficient, average contact force of the packing model and shape coefficient M of crushed rock. The results in Figure 7 demonstrate that the average storage coefficient and average contact force of the packing model increase exponentially as the shape coefficient M increases. The correlation coefficient R2 values are all above 0.996. The laboratory test measured an average storage coefficient of 0.322, which aligns with the average storage coefficient obtained through these numerical packing tests using irregular rigid blocks. This verifies the reliability of the numerical simulation results. Within the range of the values studied, the maximum increase in the storage coefficient is 50.1%, and the maximum increase in the average contact force is 11.7%. This indicates that the irregular shape of crushed rock leads to a stronger average contact force and a larger water storage space. When the shape of particles changes from spherical to non-spherical (e.g., with a shape coefficient M of 1–2.5), the irregularity of particle shape has a significant impact on the void structure and contact force. Consequently, the average storage coefficient of crushed rock increases rapidly as the shape coefficient M increases. As the particle shape becomes more irregular (e.g., with a shape coefficient M of 2.5–3.5), the influence of particle shape irregularity on the void structure and contact force gradually decreases. In other words, the shape effect of the particle diminishes, resulting in a slow increase in the average storage coefficient with the increase in the shape coefficient M. By combining statistical analysis of the shape characteristics of crushed rock in coal mine underground reservoirs, the quantitative relationship between the shape coefficient M and the storage coefficient can offer a scientific basis for predicting the average storage coefficient. This relationship can also assist in designing and planning the storage capacity of underground reservoirs, among other applications.
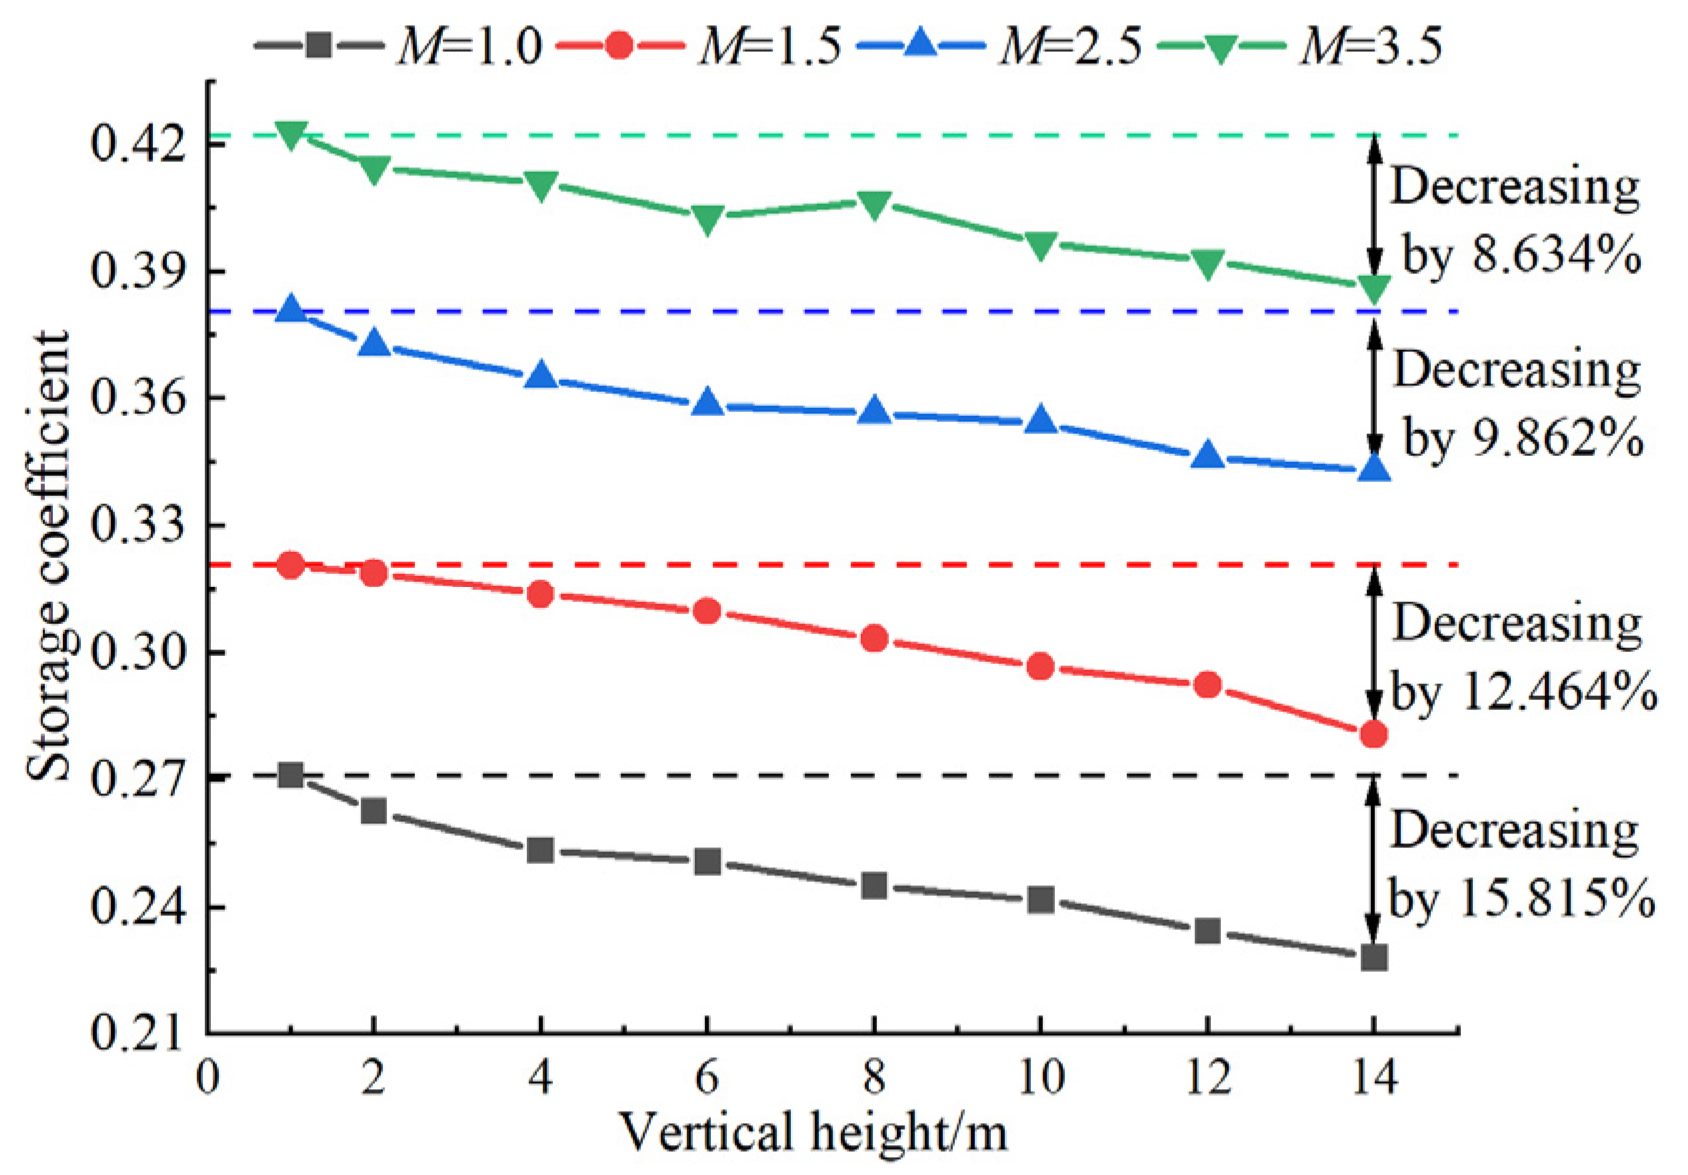
Figure 8 shows the distributions of storage coefficient at different spatial heights in the packing system of crushed rock. As depicted in Figure 8, the storage coefficient of each layer in the packing model decreases approximately linearly as the spatial height increases. Moreover, the decrease is smaller when the shape coefficient M is larger. Specifically, when M equals 1.0, 1.5, 2.5, and 3.5, the maximum decrease in the storage coefficient is 15.815%, 12.464%, 9.862%, and 8.634%, respectively. This phenomenon can be attributed to the fact that the overlying stress on the packing system of crushed rock is significantly higher than its self-weight stress (which is less than 0.5 MPa). Consequently, the lower part of the packing model is less affected by the overlying stress, resulting in a looser configuration compared to the upper part. Therefore, the storage coefficient decreases as the spatial height increases.

3.3. Variation Law of Fractal Dimension of Water Storage Space

Fractal dimension has been widely used to describe the structural characteristics of complex voids in real porous media and geotechnical particle systems [40]. The void fractal dimension is generally larger when the void is larger and more uniformly distributed. However, the void fractal dimension is mainly affected by the variation of void ratio and may not accurately reflect the complexity of the void structure. On the other hand, the void boundary fractal dimension describes the shape of the boundary between particles and voids, and it focuses on the characteristics of void size and distribution [41]. Therefore, this study specifically examines the void fractal dimension Fp and void boundary fractal dimension Fi of water storage spaces to better understand the complexity of the void structure.
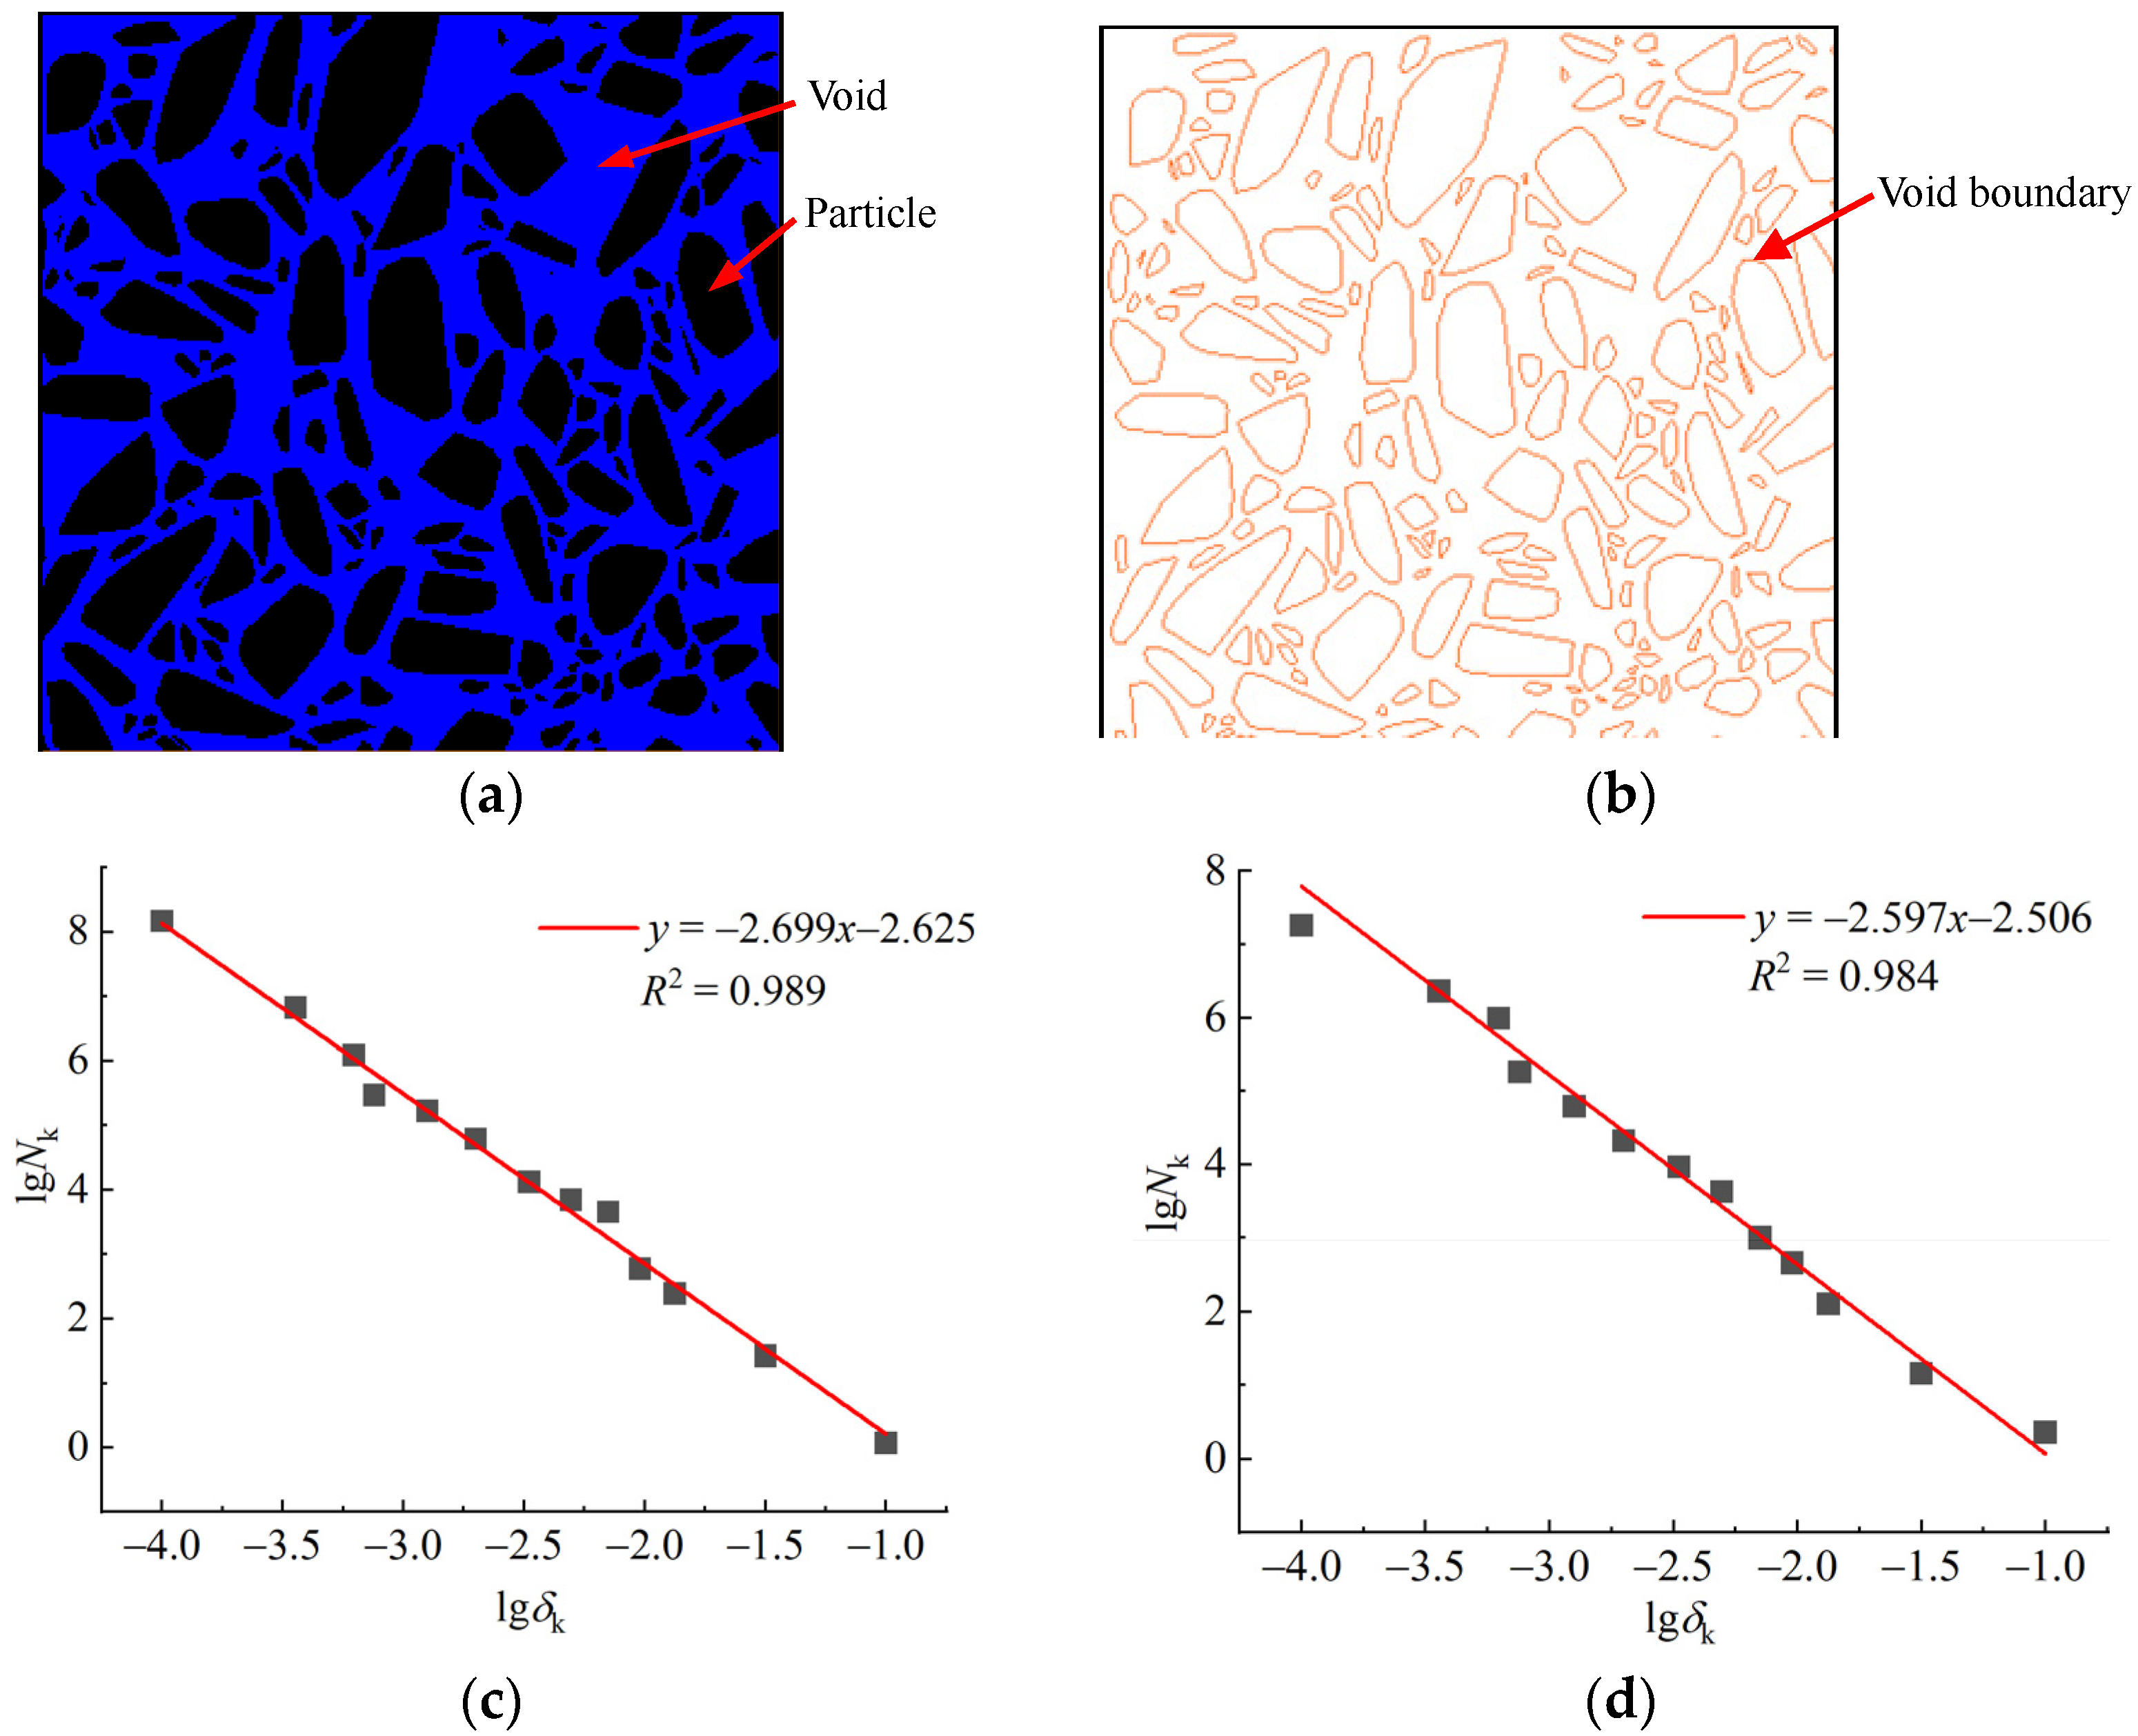
The three-dimensional box counting dimension method [42] was used to calculate the void fractal dimension Fp and the void boundary fractal dimension Fi of water storage space in six numerical packing tests. The grid edge length was set to be δk, and the number of grids needed to cover the void area Nk was counted. The spatial structure of water storage space is considered to have self-similarity when a linear relationship is shown in the bi-logarithmic coordinates (lgδk, lgNk). Taking the numerical test M = 2.5 as an example, local voids and void boundaries in packing systems of crushed rock and their δk-Nk logarithmic curves are shown in Figure 9. The relationship between δk and Nk can be observed in Figure 9, where both variables exhibit a linear decrease. The correlation coefficients R2 values for all cases are greater than 0.984, indicating that the spatial structure of water storage space demonstrates self-similarity and exhibits clear fractal characteristics. Consequently, the void fractal dimension Fp and the void boundary fractal dimension Fi can be utilized to quantitatively depict the distribution and complexity of voids in water storage space.
The relationship curves between the fractal dimensions of water storage space and shape coefficient M of crushed rock are shown in Figure 10. The following can be seen. (1) The void fractal dimension Fp and the void boundary fractal dimension Fi exhibit a power exponential growth trend with the shape coefficient M. The correlation coefficients R2 values are greater than 0.986, indicating that as the shape coefficient M increases, the water storage space gradually expands and the internal voids become more unevenly distributed. This implies that the structure of the water storage space becomes more complex. This complexity arises from the fact that irregular particle shapes facilitate the formation of larger cavities within the packing model, thereby increasing the overall voidage and its complexity. Within the range of values studied, the influence of the shape coefficient M, which represents the irregularity of crushed rock shape, on the void fractal dimension and the void boundary fractal dimension gradually decreases. Therefore, it can be concluded that the influence of shape coefficient M has a saturation effect. (2) The void fractal dimension Fp ranges from 2.659 to 2.711, and the void boundary fractal dimension Fi ranges from 2.489 to 2.645, so the void connectivity and water storage space performance are poor [6]. The increase in void fractal dimension Fp is limited to a maximum of 1.953%, whereas the void boundary fractal dimension Fi can increase up to 6.433%. This discrepancy occurs because the void fractal dimension is influenced by both the void ratio and the complexity of the void structure. On the other hand, the void boundary fractal dimension is more effective in representing the spatial complexity of water storage space. It is important to note that the fractal dimension provides an overall characterization of the void structure in water storage space. However, it does not provide information about the local void structure characteristics or allow for a comparison of connectivity between different water storage spaces. Therefore, in the next section, we will quantitatively characterize the local structure of water storage space using a void network model.

3.4. Variation Law of Void Network Structure

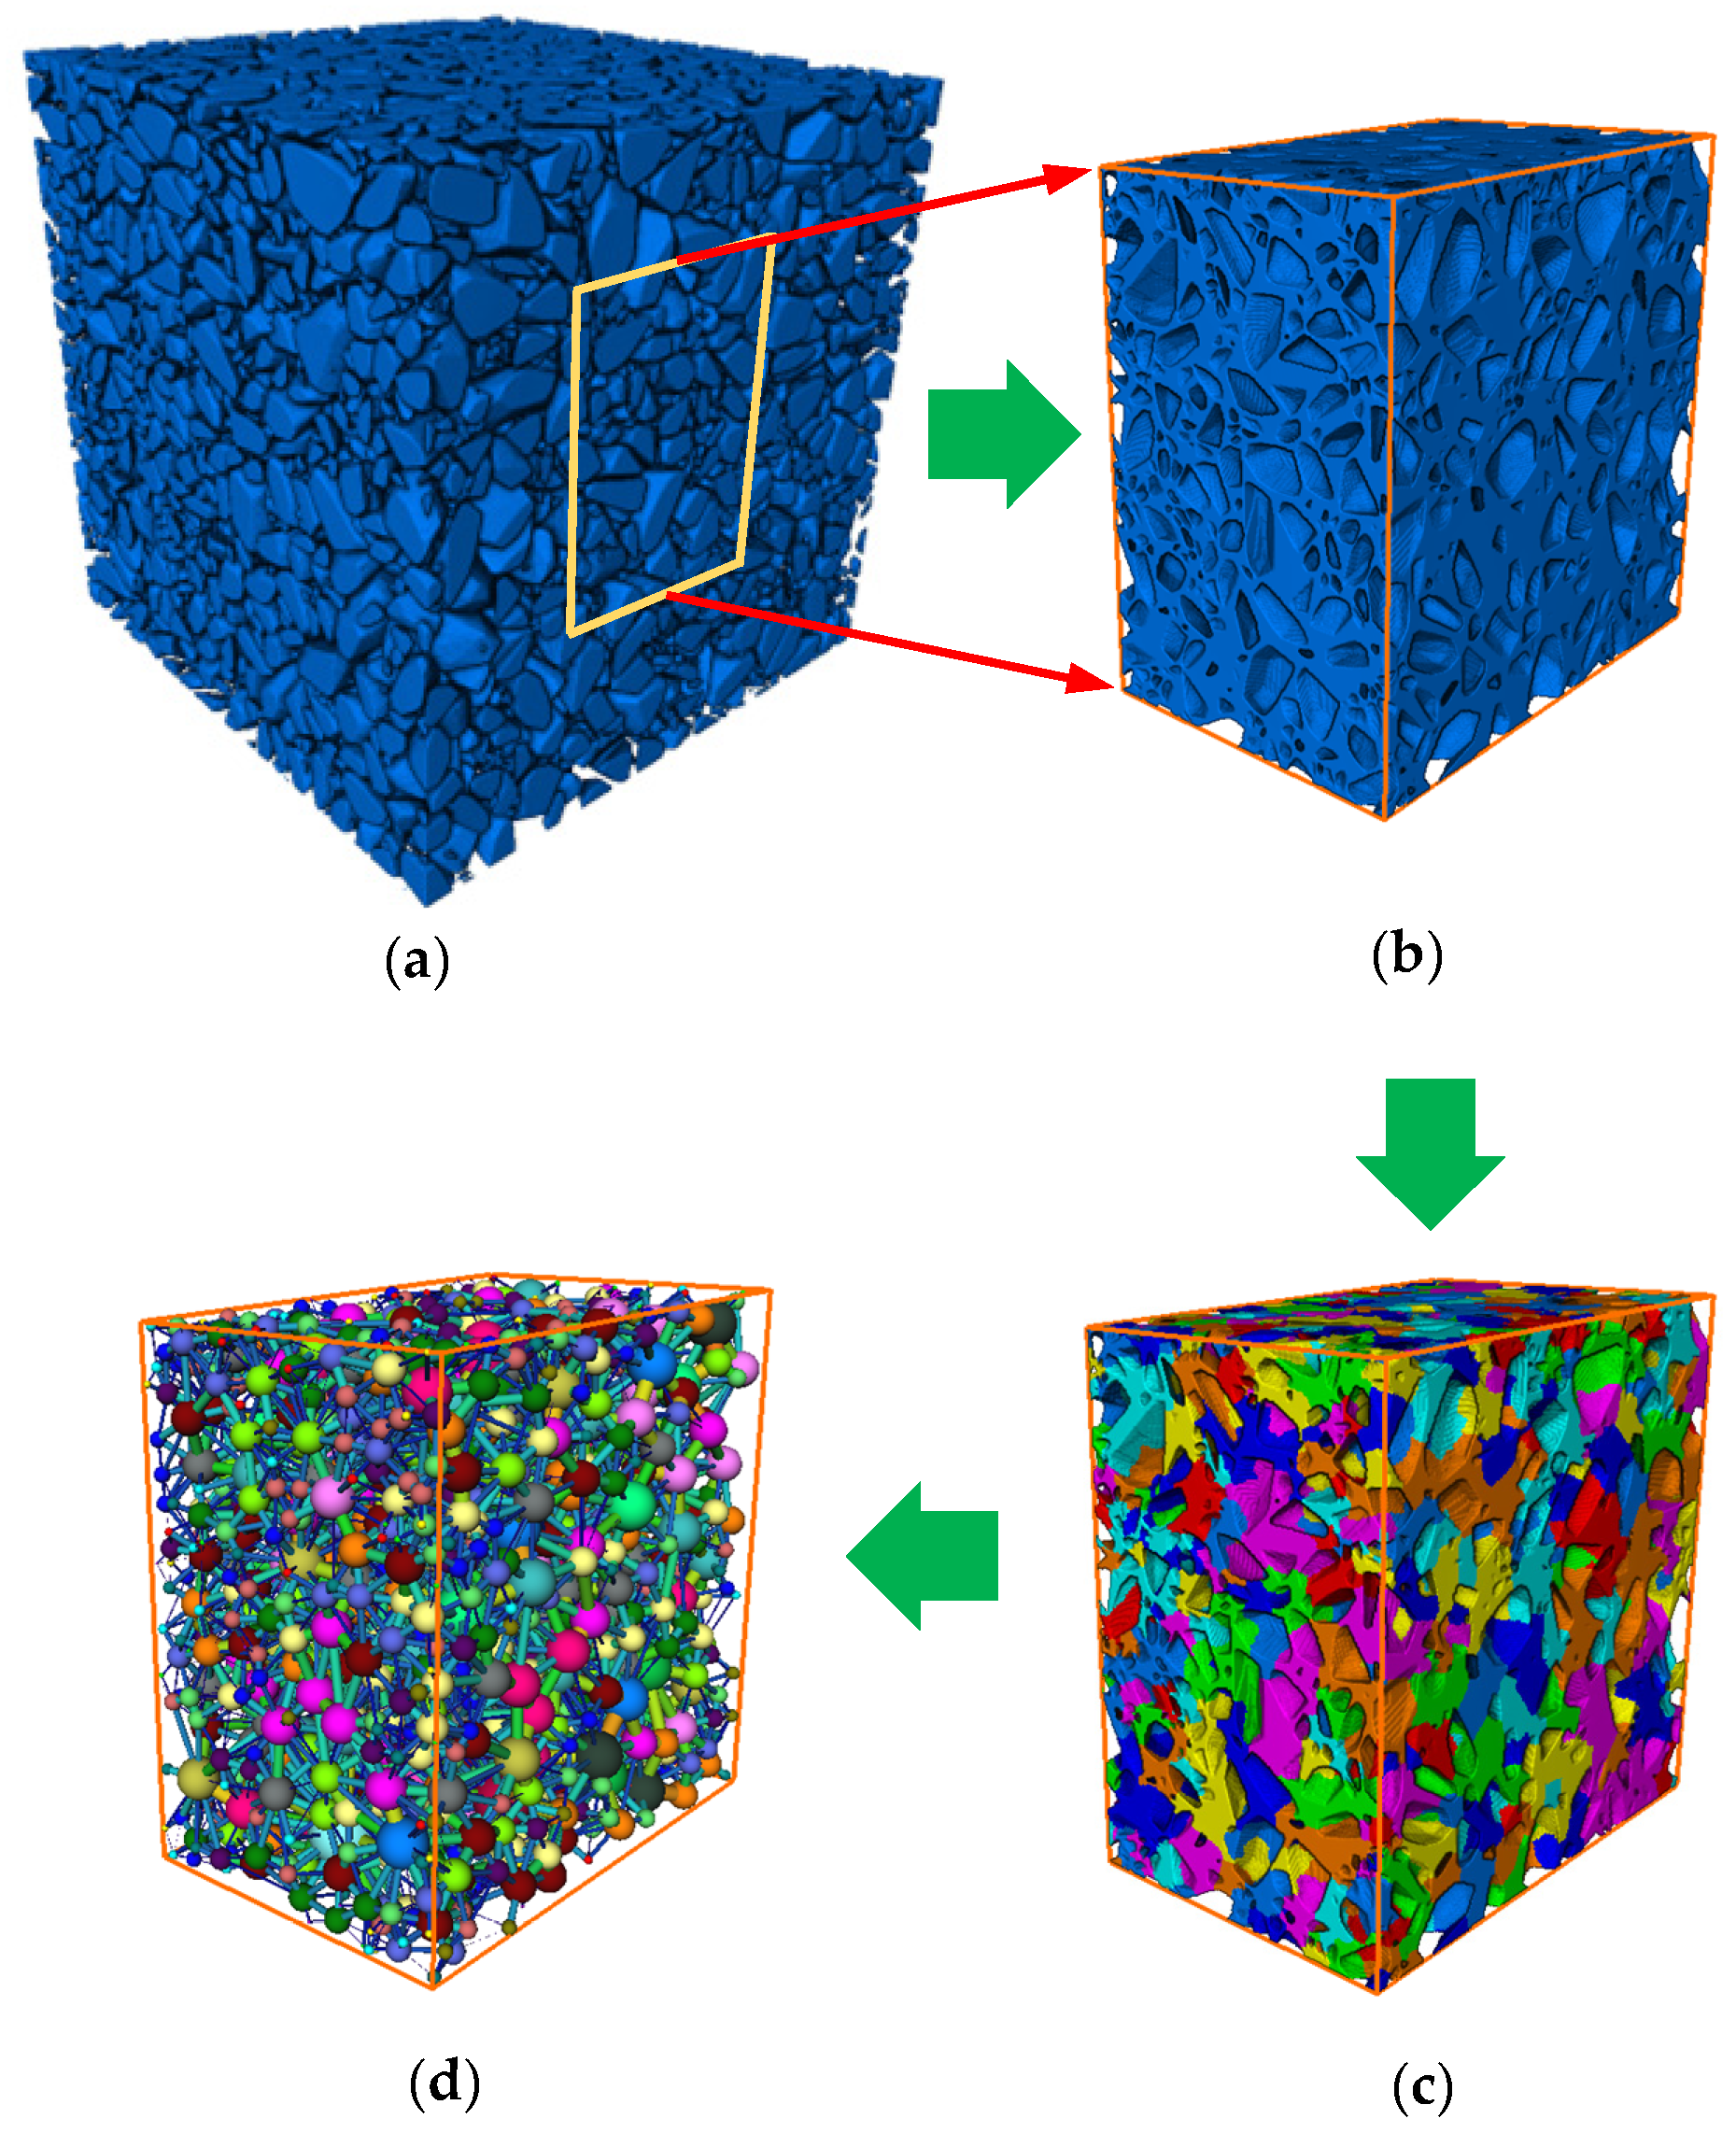
The void network model is an equivalent model for reconstructing the complex void space structure, where the void is simplified as a sphere, the throat is simplified as a thin rod, and the void space is simplified as a series of sphere–rod-connected network structures [43,44]. Using the void network model, the void geometry topology and spatial distribution characteristics of water storage space can be effectively described.
The water storage space is divided into “sphere” voids and “stick” throats to analyze its spatial structure characteristics. The specific construction process of the void network model for water storage space is shown in Figure 11. The water storage space (void structure) of the packing system of crushed rock was extracted first. Then, the void network model of the water storage space was obtained using the Maximal Ball method [43]. Voids and throats were divided by setting a sphere radius ratio of 0.7. If a maximum sphere radius is 0.7 times or more of the maximum sphere radius of its previous generation, it was identified as a void. Vice versa, if it was less than 0.7 times, it was considered as a throat. The minimum segmentation threshold value was set at 0.7 for the throat channel. Additionally, the minimum segmentation threshold was set to 0.017 m, which is approximately 1/6 of the smallest particle size [45]. Finally, the main characteristic parameters of the void network model (void radius, void coordination number, void shape factor, and throat radius) were calculated and analyzed. The void radius represents the size of a void, while the throat radius represents the size of the connecting channel between voids, which determines the connectivity between voids. The void coordination number indicates the number of connected throats, effectively reflecting the strength of void connectivity. The void shape factor describes the degree of irregularity in the void space and affects the manner and speed of fluid flow in water storage space. A larger void shape factor indicates a more regular void shape.
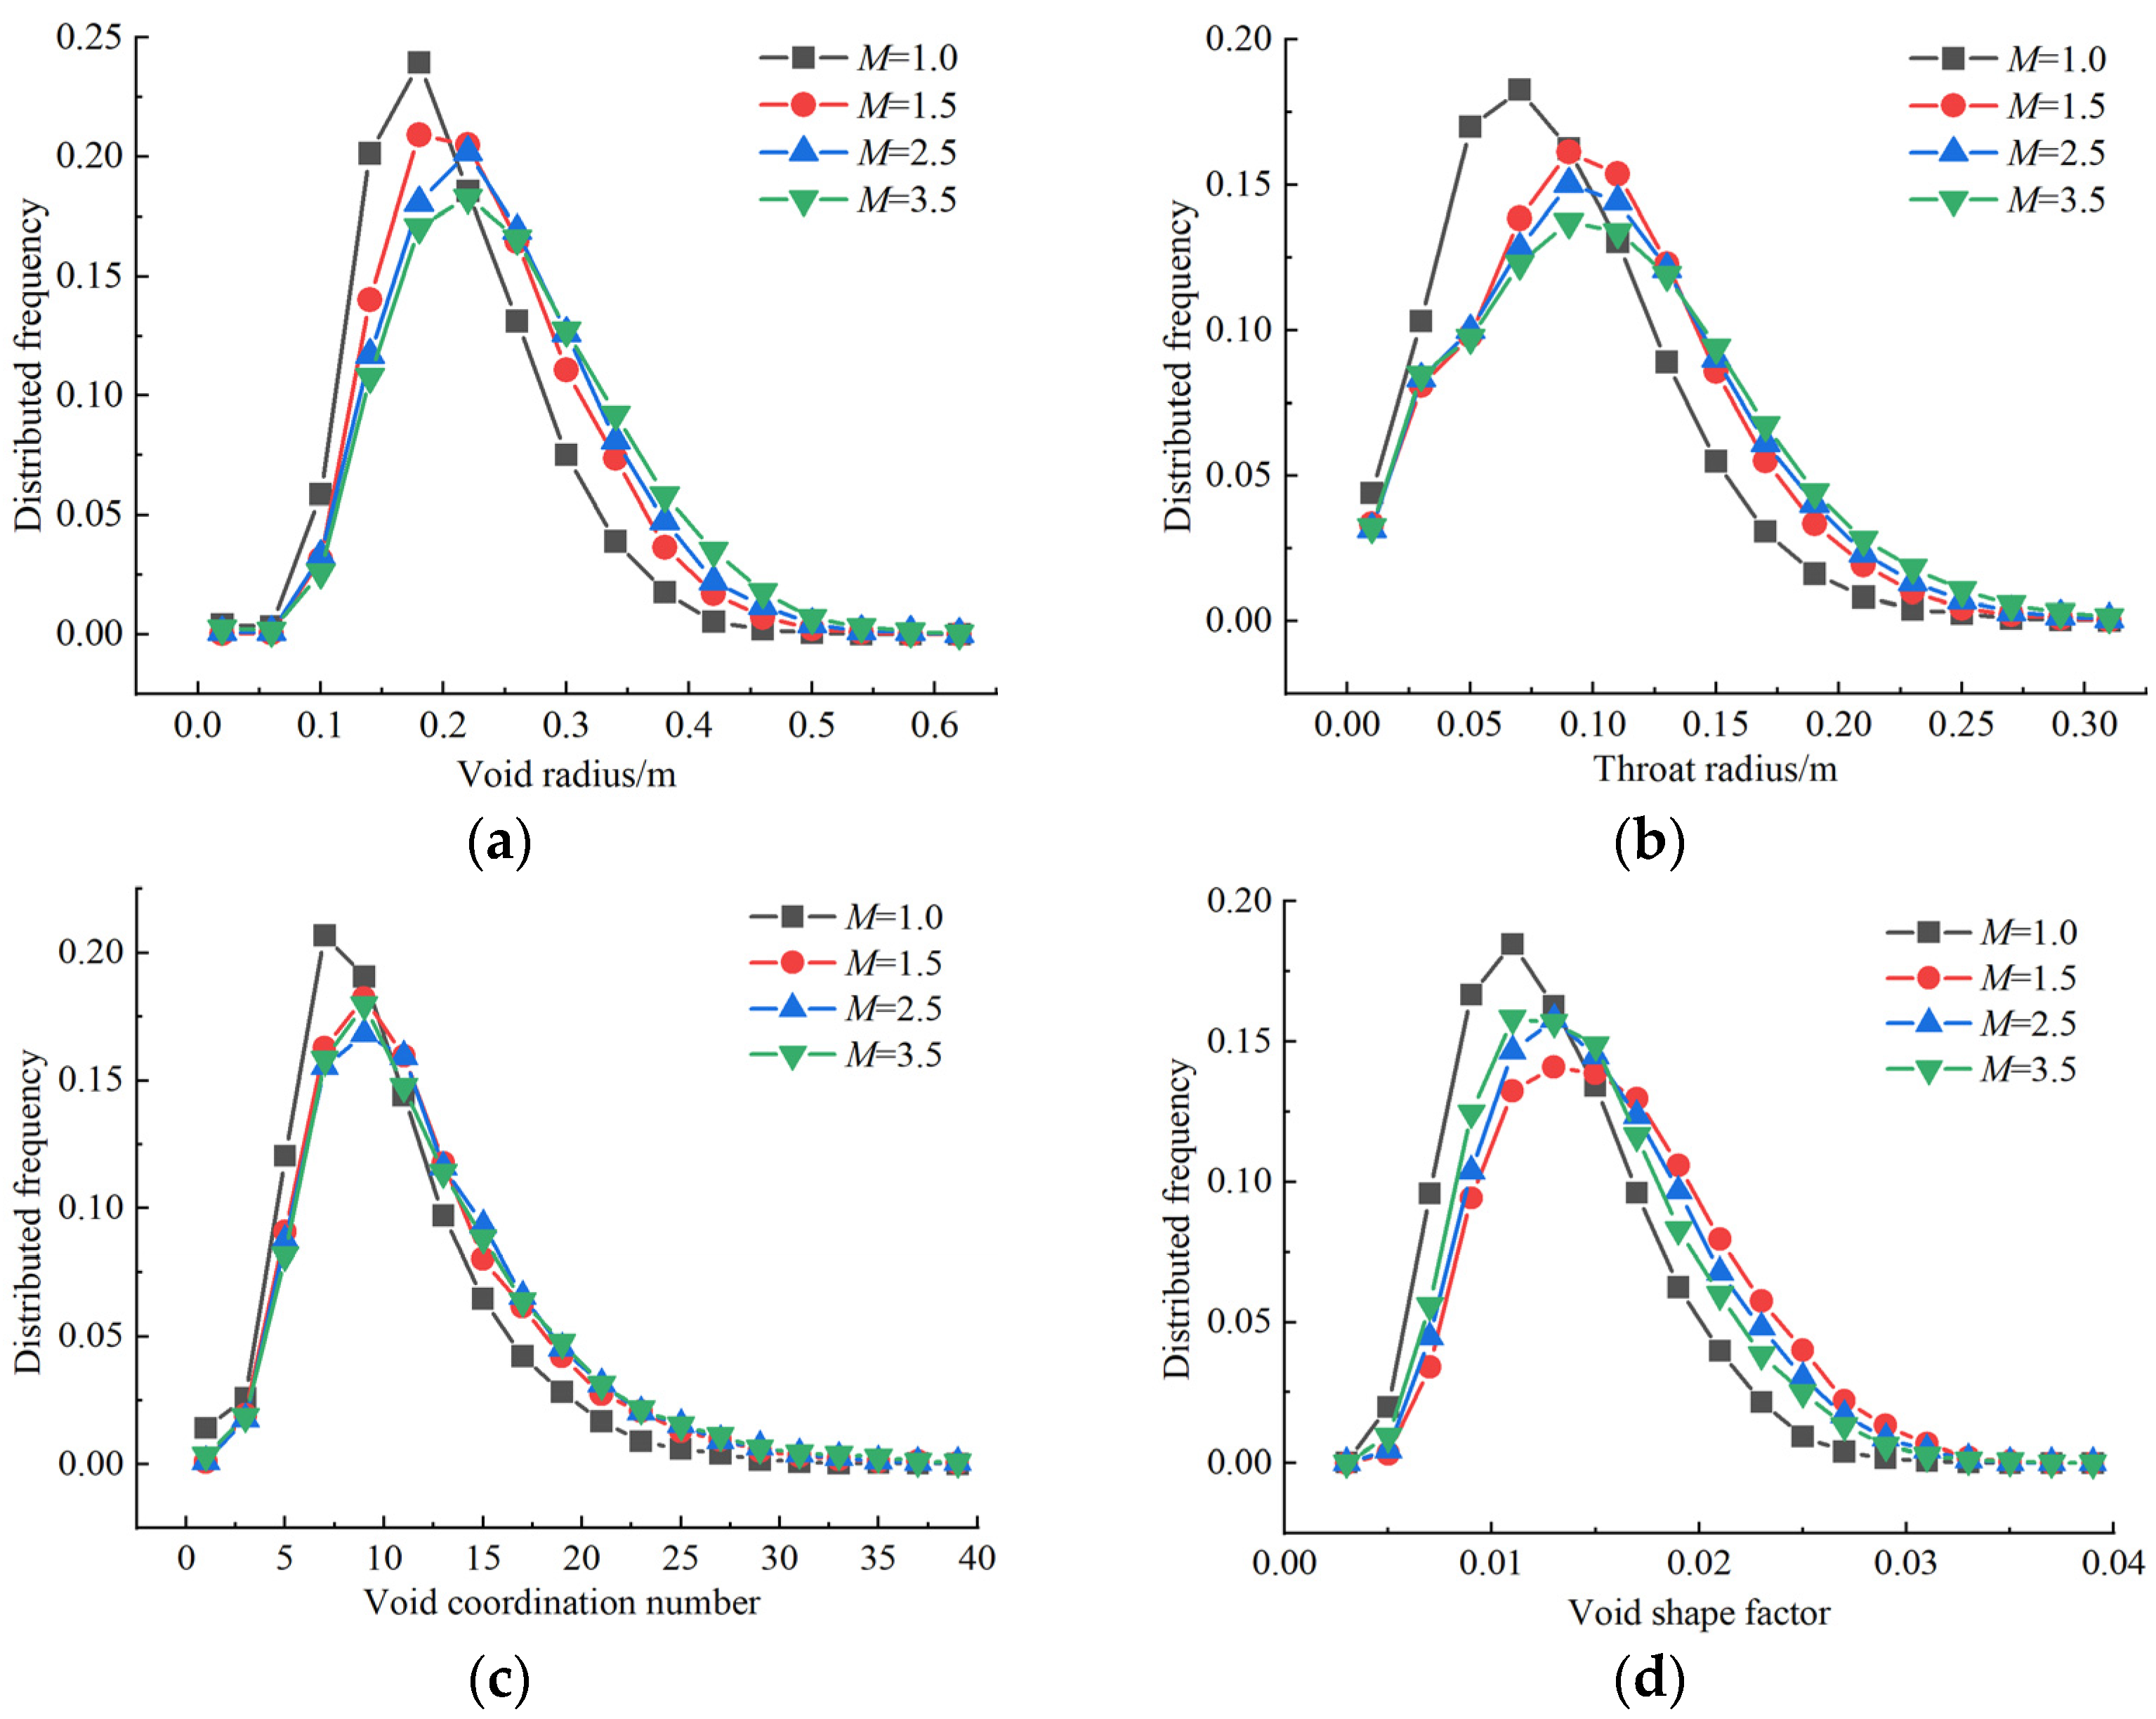
The packing system of crushed rock with shape coefficients M = 1.0, 1.5, 2.5, and 3.5 were used as examples to construct a void network model. The main characteristic parameters of the model were statistically calculated, and the results are shown in Figure 12. By comparing Figure 12a–d, the following can be observed. (1) Compared to the non-spherical particle system, the distributions of the void radius, throat radius, void coordination number, and void shape factor in the spherical particle system are more concentrated. The peak values of the distribution curves are also larger. This indicates that the small-scale void radius and throat radius in the spherical particle system are higher than those in the non-spherical particle system. Additionally, the water storage space is smaller, the connectivity among voids is lower, and the void space is more irregular. (2) For non-spherical particles (real crushed rock), the distribution curves of the void radius and throat radius gradually become wider with the increase in shape coefficient M (Figure 12a,b). The void radius distribution is mainly concentrated around 0.2 m, while the throat radius distribution is mainly concentrated around 0.1 m. On the other hand, the distribution curves of the void shape factor show a trend of gradual concentration (Figure 12d) with the main concentration around 0.01–0.015. The distributions of void coordination number remain relatively unchanged with a concentration around 9.0 (Figure 12c). This means that as the shape of crushed rock becomes more irregular, there is a higher proportion of large-scale void radius and throat radius in the packing system, indicating a more irregular void space. However, there is no significant effect on the connectivity of voids.

4. Discussion

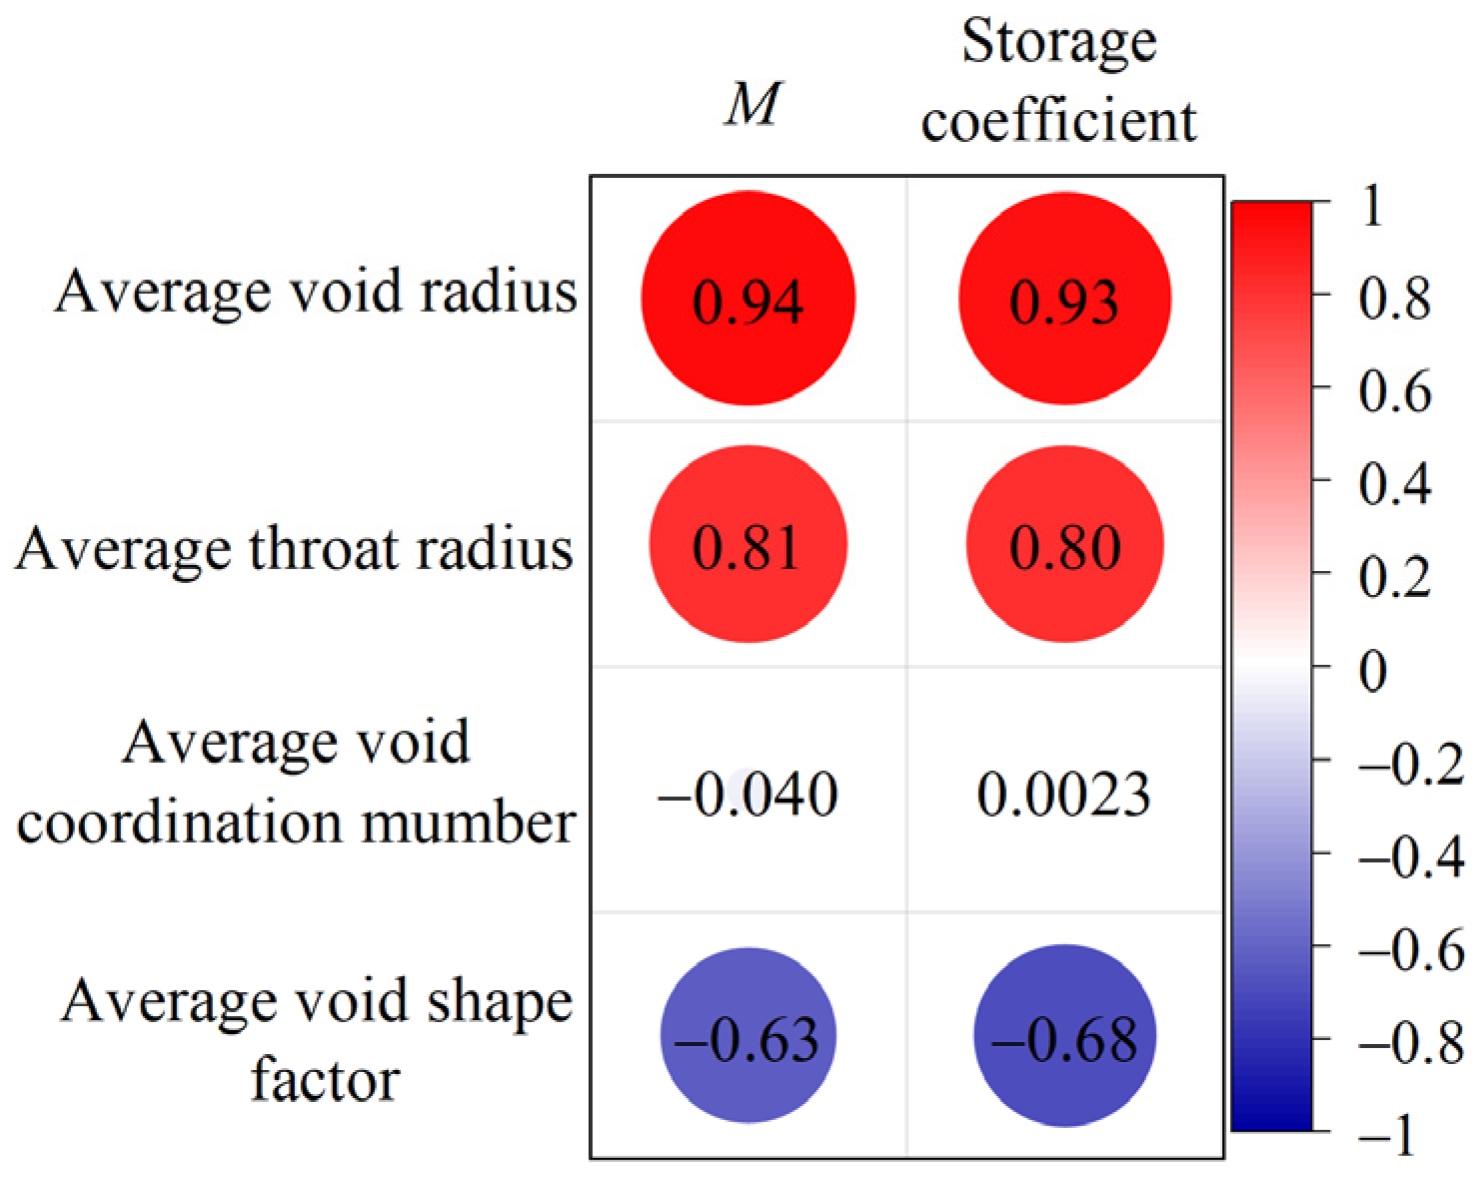
The macroscopic properties of the particle system always depend on its own local structure characteristics [46], and the particle shape directly affects the interparticle contact behaviors [47], which in turn leads to significant differences in its local structure. In order to further investigate the impact of different shape coefficients on the spatial structure characteristics of underground reservoir water storage space in coal mines, a correlation analysis was conducted. This analysis examined the relationship between the shape coefficient M of crushed rock, the storage coefficient, and the average characteristic parameters of the void network model. The results, shown in Figure 13, indicate that both the shape coefficient M and storage coefficient are positively correlated with the average void radius and average throat radius, with correlation coefficients exceeding 0.8. Additionally, they are negatively correlated with the average void shape factor, with correlation coefficients less than −0.6. However, there is no significant correlation between the shape coefficient and the average void coordination number. The shape of crushed rock plays a significant role in determining the overall structure characteristics of water storage space. It affects the local void radius, throat radius, and void shape factor of the packing system. Irregularly shaped crushed rocks have a greater ability to prevent sliding and rotation within a specific area [48], thus enhancing the interlocking effect among them. This interlocking effect [49] facilitates the formation of larger cavities. Consequently, larger local voids result in larger connecting channels among voids, leading to increased inhomogeneity in the distribution of water storage space and voids. The complex structure characteristics of underground reservoir water storage space are underpinned by interactions between crushed rocks and between crushed rocks and their geological environment. Therefore, a comprehensive consideration of the specific engineering geological conditions, stress environment and crushed rock shape has a crucial role in the deep understanding and utilization of the spatial structure characteristics of water storage space.

5. Conclusions

(1)
Crushed rock exhibits a lognormal distribution in its shape characteristic parameters at different scales, with a predominant discoid shape, which accounts for more than 50%. The shape coefficient M can be utilized as a comprehensive indicator to characterize the shape characteristics of crushed rock.
(2)
Within the range of the values studied, the average storage coefficient and average contact force of the packing system of crushed rock both increase exponentially as the shape coefficient M increases, and the increase is 50.1% and 11.7% from M = 1 to 3.5, respectively. The storage coefficient decreases as the spatial height of the packing model increases. Additionally, the decrease is smaller when the shape coefficient M is smaller.
(3)
Within the range of the values studied, the spatial structure of water storage space exhibits self-similarity, the void fractal dimensions are all distributed in the range of 2.659 to 2.711, and the void boundary fractal dimensions are all distributed in the range of 2.489 to 2.645. The void fractal dimension is influenced by both the void ratio and the complexity of the void structure, while the void boundary fractal dimension is more effective in representing the spatial complexity of water storage space. The complexity of the water storage space structure and the inhomogeneity of void distribution both increased gradually with the increase in the shape coefficient M.
(4)
When comparing the non-spherical particle system with the spherical particle system, it is observed that the spherical particle system has smaller water storage space, lower connectivity among voids, and more irregular void space. In the non-spherical particle system, the water storage space becomes larger as the shape of crushed rock becomes more irregular, resulting in more irregular void space. However, there is no significant effect on void connectivity. The shape of crushed rock has a significant impact on the overall structure characteristics of water storage space. It influences the local void radius, throat radius, and void shape factor of the packing system.
This study is more conceptual and does not pay attention to the geology and that the lithological and structural geological peculiarities may influence the results of the spatial structure characteristics of underground reservoir water storage space. Therefore, the influence of particle gradation, strength, lithology and other factors on the storage coefficient, water storage spatial structure and mechanical characteristics in more coal mines will be further investigated to reveal its meso-control mechanism.

Author Contributions

Conceptualization, H.S. and Z.C.; methodology, H.S. and X.Q.; software, X.Q.; validation, X.Q., Z.C. and L.W.; investigation, P.L.; resources, Z.C.; data curation, X.Q.; writing—original draft preparation, X.Q.; visualization, L.W. and P.L.; supervision, H.S.; funding acquisition, Z.C. All authors have read and agreed to the published version of the manuscript.

Funding

This work was funded by the National Natural Science Foundation of China (Grant No. 52004017) and Open Fund of the State Key Laboratory of Water Resource Protection and Utilization in Coal Mining (Grant No. WPUKFJJ2019-04).

Data Availability Statement

The data that support the findings of this study are available from the corresponding author upon reasonable request.

Conflicts of Interest

The authors declare that the research was conducted in the absence of any commercial or financial relationships that could be construed as a potential conflict of interest.

References

  1. Gu, D.Z. Theory framework and technological system of coal mine underground reservoir. J. China Coal Soc. 2015, 40, 239–246. [Google Scholar]
  2. Reisi, M.; Mostofinejad, D.; Ramezanianpour, A. Computer simulation-based method to predict packing density of aggregates mixture. Adv. Powder Technol. 2018, 29, 386–398. [Google Scholar] [CrossRef]
  3. Zhao, L.; Zhang, S.; Huang, D.; Wang, X.; Zhang, Y. 3D shape quantification and random packing simulation of rock aggregates using photogrammetry-based reconstruction and discrete element method. Constr. Build Mater. 2020, 262, 119986. [Google Scholar] [CrossRef]
  4. Xiang, P.; Sun, L.H.; Ji, H.G.; Gao, Y.; Liu, Y.J. Dynamic distribution characteristics and determination method of caving zone in large mining height working face. J. Min. Saf. Eng. 2017, 34, 861–867. [Google Scholar]
  5. Song, Y.J.; Cheng, G.Q.; Guo, W.J. Study of distribution of overlying strata fissures and its porosity characteristics. Rock Soil Mech. 2011, 32, 533–536. [Google Scholar]
  6. Wang, B.F.; Liang, B.; Jiang, L.G.; Li, G.; Li, C.Y. Fractal calculation and application of water storage in void of crushed rock mass. Chin. J. Rock Mech. Eng. 2015, 34, 1444–1451. [Google Scholar]
  7. Ju, J.F.; Xu, J.L.; Zhu, W.B. Storage capacity of underground reservoir in the Chinese western water-short coalfield. J. China Coal Soc. 2017, 42, 381–387. [Google Scholar]
  8. Fang, J.; Song, H.Q.; Xu, J.J.; Yang, L.Z.; Li, Z.Y. Storage coefficient calculation model of coal mine underground reservoir considering effect of effective stress. J. China Coal Soc. 2001, 46, 451–468. [Google Scholar]
  9. Szlazak, J. The determination of a coefficient of longwall gob permeability. Arch. Min. Sci. 2019, 44, 3750–3759. [Google Scholar]
  10. Zhang, J.W.; Wang, H.L.; Chen, S.J.; Li, Y.L. Compressive deformation characteristics of large-size crushed rock. J. China Coal Soc. 2018, 43, 1000–1007. [Google Scholar]
  11. Chen, X.X.; Su, C.D.; Tang, X.; Gu, W.B. Experimental study of effect of water-saturated state on compaction property of crushed stone from coal seam roof. Chin. J. Rock Mech. Eng. 2014, 33, 3318–3326. [Google Scholar]
  12. Deng, K.Z.; Zhou, M.; Tan, Z.X. Study on laws of rock mass breaking induced by mining. J. China Univ. Min. Technol. 1998, 27, 261–264. [Google Scholar]
  13. Ma, Z.G.; Lan, T.; Pan, Y.G.; Ma, J.G.; Zhu, F.H. Experimental study on porous change law of saturated broken mudstone during creep. Chin. J. Rock Mech. Eng. 2009, 28, 447–454. [Google Scholar]
  14. Ma, Z.G.; Miao, X.X.; Chen, Z.Q.; Li, Y.S. Experimental study on permeability of broken coal. Rock Soil Mech. 2009, 30, 985–988+996. [Google Scholar]
  15. Su, C.D.; Gu, M.; Tang, X.; Gu, W.B. Experimental study of compaction characteristics of crushed stones from coal seam roof. Chin. J. Rock Mech. Eng. 2012, 31, 18–26. [Google Scholar]
  16. Li, J.M.; Huang, Y.L.; Pu, H.; Gao, H.; Li, Y.; Ouyang, S.; Guo, Y. Influence of block shape on macroscopic deformation response and meso-fabric evolution of crushed gangue under the triaxial compression. Powder Technol. 2021, 384, 112–124. [Google Scholar] [CrossRef]
  17. Zhang, C.; Zhao, Y.X.; Tu, S.H.; Zhang, T. Numerical simulation of compaction and re-breaking characteristics of coal and rock samples in goaf. Chin. J. Geotech. Eng. 2020, 42, 696–704. [Google Scholar]
  18. Pang, Y.H.; Li, Q.S.; Cao, G.M.; Zhou, B.J. Analysis and calculation method of underground reservoir water storage space composition. J. China Coal Soc. 2019, 44, 557–566. [Google Scholar]
  19. Landauer, J.; Kuhn, M.; Nasato, D.S.; Foerst, P.; Briesen, H. Particle shape matters—Using 3D printed particles to investigate fundamental particle and packing properties. Powder Technol. 2021, 361, 711–718. [Google Scholar] [CrossRef]
  20. Seidler, G.T.; Martinez, G.; Seeley, L.H.; Kim, K.H.; Behne, E.A.; Zaranek, S.; Chapman, B.D.; Heald, S.M.; Brewe, D.L. Granule-by-granule reconstruction of a sandpile from X-ray microtomography data. Phys. Rev. E 2000, 62, 8175–8181. [Google Scholar] [CrossRef]
  21. Cao, Y.X.; Chakrabortty, B.; Barker, G.C.; Mehta, A.; Wang, Y.J. Bridges in three-dimensional granular packings: Experiments and simulations. EPL 2013, 102, 24004. [Google Scholar] [CrossRef]
  22. Lin, M.C.; Zhou, W.; Liu, J.Y.; Ma, G.; Cao, X.X. A topological view on microscopic structural evolution for granular material under loading and unloading path. Comput. Geotech. 2022, 141, 104530. [Google Scholar] [CrossRef]
  23. Karpenko, M.; Stosiak, M.; Deptuła, A.; Urbanowicz, K.; Nugaras, J.; Krolczyk, G.; Zak, K. Performance evaluation of extruded polystyrene foam for aerospace engineering applications using frequency analyses. Int. J. Adv. Manuf. Technol. 2023, 126, 5515–5526. [Google Scholar] [CrossRef]
  24. Shepherd, R.F.; Conrad, J.C.; Sabuwala, T.; Gioia, G.G.; Lewis, J.A. Structural evolution of cuboidal granular media. Soft Matter 2012, 8, 4795–4801. [Google Scholar] [CrossRef]
  25. Zhang, L.H.; Deng, M.; Zhang, S.H.; Huang, D.L.; Qiao, N.; Gong, J. Effects of particle shape on triaxial compression behaviours of realistic ballast particles based on M-A-V-L particle shape evaluation system. Granul. Matter 2023, 25, 4. [Google Scholar]
  26. Mo, P.Q. Internal rolling method for particle shape evaluation and reconstruction. PLoS ONE 2020, 15, e0242162. [Google Scholar] [CrossRef]
  27. Pan, J.H.; Zhang, J.M.; Wang, R. Influence of small particle surface asperities on macro and micro mechanical behavior of granular material. Int. J. Numer. Anal. Met. 2022, 46, 961–978. [Google Scholar] [CrossRef]
  28. Suhr, B.; Six, K. Simple particle shapes for DEM simulations of railway ballast: Influence of shape descriptors on packing behaviour. Granul. Matter 2020, 22, 112–124. [Google Scholar] [CrossRef]
  29. Xie, Y.H.; Yang, Z.X.; Barreto, D.; Jiang, M.D. The influence of particle geometry and the intermediate stress ratio on the shear behavior of granular materials. Granul. Matter 2017, 19, 35. [Google Scholar] [CrossRef]
  30. Nie, J.Y.; Zhao, J.; Cui, Y.F.; Li, D.Q. Correlation between grain shape and critical state characteristics of uniformly graded sands: A 3D DEM study. Acta Geotech. 2022, 17, 2783–2798. [Google Scholar] [CrossRef]
  31. Zheng, J.; Hryciw, R.D. A corner preserving algorithm for realistic DEM soil particle generation. Granul. Matter 2016, 18, 84. [Google Scholar] [CrossRef]
  32. Sun, H.; Gao, Y.T.; Elmo, D.; Jin, A.B.; Wu, S.C.; Leonardo, D. A study of gravity flow based on the upside-down drop shape theory and considering rock shape and breakage. Rock Mech. Rock Eng. 2019, 52, 881–893. [Google Scholar] [CrossRef]
  33. Sun, H.; Zhu, D.F.; Jin, A.B.; Wu, S.C.; Yin, Z.S. Flow characteristics of caved ore and rock based on inhomogeneous particle size distribution. Chin. J. Nonferrous Met. 2022, 32, 2433–2445. [Google Scholar]
  34. Naderi, S.; Zhang, M. An integrated framework for modelling virtual 3D irregulate particulate mesostructured. Powder Technol. 2019, 355, 808–819. [Google Scholar] [CrossRef]
  35. Sun, H.; Jin, A.B.; Elmo, D.; Wu, S.C.; Gao, Y.T. A numerical based approach to calculate ore dilution rates using rolling resistance model and upside-down drop shape theory. Rock Mech. Rock Eng. 2020, 53, 4639–4652. [Google Scholar] [CrossRef]
  36. Zhou, B.; Ku, Q.; Wang, H.B.; Wang, J.F. Particle classification and intra-particle void structure of carbonate sands. Eng. Geol. 2020, 279, 105889. [Google Scholar] [CrossRef]
  37. Cho, G.C.; Dodds, J.; Santamarina, J.C. Particle shape effects on packing density, stiffness, and strength: Natural and crushed sands. J. Geotech. Geoenviron. 2006, 133, 591–602. [Google Scholar] [CrossRef]
  38. Se, Y.F.; Bhattachary, S.; Lee, S.J.; Lee, C.H.; Shin, M. A new interpretation of three-dimensional particle geometry: M-A-V-L. Transp. Geotech. 2020, 23, 100328. [Google Scholar]
  39. Jebli, I.; Belouadha, F.Z.; Kabbaj, M.I.; Tilioua, A. Prediction of solar energy guided by pearson correlation using machine learning. Energy 2021, 224, 120109. [Google Scholar] [CrossRef]
  40. Li, X.B.; Wei, W.; Wang, L. Fractal dimension of digital 3D rock models with different void structures. Energies 2022, 15, 7461. [Google Scholar] [CrossRef]
  41. Li, X.B.; Luo, M.; Liu, J.P. Fractal characteristics based on different statistical objects of process-based digital rock models. J. Pet. Sci. Eng. 2019, 179, 19–430. [Google Scholar] [CrossRef]
  42. Li, X.B.; Wei, W.; Wang, L. A new method for evaluating the pore structure complexity of digital rocks based on the relative value of fractal dimension. Mar. Pet. Geol. 2022, 141, 105694. [Google Scholar] [CrossRef]
  43. Zhang, W.B.; Hu, X.L.; Tannant, D.D.; Zhou, B. Quantifying the influence of grain morphology on sand hydraulic conductivity: A detailed pore-scale study. Comput. Geotech. 2021, 135, 104147. [Google Scholar] [CrossRef]
  44. Silin, D.; Patzek, T. Void space morphology analysis using maximal inscribed spheres. Phys. A 2006, 371, 336–360. [Google Scholar] [CrossRef]
  45. Wang, H.M. Study on Fractal Characteristics and Network Model of Porous Media Pore Structure. Master’s Thesis, Dalian University of Technology, Dalian, China, 2013. [Google Scholar]
  46. Fei, W.B.; Guillermo, A.N. Impact of three-dimensional sphericity and roundness on coordination number. J. Geotech. Geoenviron. 2020, 146, 06020025. [Google Scholar] [CrossRef]
  47. Nadimi, S.; Fonseca, J. A micro finite-element model for soil behaviour. Geotechnique 2017, 68, 290–302. [Google Scholar] [CrossRef]
  48. Zhou, Y.X.; Ma, G.; Mei, J.Z.; Zhao, J.D.; Zhou, W. Microscopic origin of shape-dependent shear strength of granular materials: A granular dynamics perspective. Acta Geotech. 2021, 17, 2697–2710. [Google Scholar] [CrossRef]
  49. Kandasami, R.K.; Murthy, T.G. Manifestation of particle morphology on the mechanical behaviour of granular ensembles. Granul. Matter 2017, 19, 21. [Google Scholar] [CrossRef]
Figure 1. Three-dimensional (3D) model construction process of crushed rock: (a) Particle size sieving of crushed rock; (b) 3D laser scanning of crushed rock; (c) 3D model of crushed rock.
Processes 11 02611 g001
Figure 2. Physical and numerical natural repose angle test results: (a) Physical test; (b) Numerical test.
Processes 11 02611 g002
Figure 3. Packing model of crushed rock in numerical test of M = 3.
Processes 11 02611 g003
Figure 4. Statistical distributions of various shape indicators of crushed rock: (a) Long-to-medium axis ratio e; (b) Medium-to-short axis ratio f; (c) Sphericity ψ; (d) Convexity Cv; (e) Shape coefficient M.
Processes 11 02611 g004
Figure 5. Shape classification Zingg chart of crushed rocks.
Processes 11 02611 g005
Figure 6. Correlation hotspot map of different shape indicators of crushed rock.
Processes 11 02611 g006
Figure 7. Relationship curves between average storage coefficient, average contact force and shape coefficient M of packing system of crushed rock.
Processes 11 02611 g007
Figure 8. Distributions of storage coefficient at different spatial heights in packing system of crushed rock.
Processes 11 02611 g008
Figure 9. Local voids and void boundaries in packing systems of crushed rock and their δk-Nk logarithmic curves in a numerical test of M = 2.5: (a) Local voids; (b) Void boundaries; (c) δk-Nk logarithmic curve of voids; (d) δk-Nk logarithmic curve of void boundaries.
Processes 11 02611 g009
Figure 10. Relationship curves between fractal dimensions of water storage space and shape coefficient M of crushed rock.
Processes 11 02611 g010
Figure 11. Construction process of void network model for water storage space: (a) Packing system of crushed rock; (b) Extraction of water storage space; (c) Division of water storage space; (d) Void network model.
Processes 11 02611 g011
Figure 12. Distributions of characteristic parameters of void network model with different shape coefficients M: (a) Void radius; (b) Throat radius; (c) Void coordination number; (d) Void shape factor.
Processes 11 02611 g012
Figure 13. Correlation hotspot map of shape coefficient M of crushed rock, storage coefficient and average characteristic parameters of the void network model.
Processes 11 02611 g013
Table 1. The shape indicators of crushed rock.
Shape
Description Scale
Shape
Indicators
FormulasValue RangesDescriptive Features
The first scaleLong-to-medium axis ratio e e = L I ≥1It represents the needle-like degree of the particle, and the larger the value, the more elongated the particle.
Medium-to-short axis ratio f f = I S ≥1It represents the flaky degree of the particle, and the larger the value, the more flaky the particle.
Sphericity ψ ψ = R i R c 0~1It represents the proximity of the particle to the sphere, and the closer the value is to 1, the closer the particle shape is to the sphere.
The second scaleConvexity Cv C v = V V h 0~1It represents the angular characteristics of the particle, and the smaller the value, the more angular the particle.
Shape coefficient M M = ( A / V × D ) 6 ≥1The value is 1 for spheres and greater than 1 for non-spherical particles, and the larger the value, the more irregular the particle.
Noted: L, I, and S denote the longest, intermediate, and shortest axes of the smallest external rectangle of the particle (Figure 1c), respectively; Ri and Rc denote the largest internal and smallest external circular radii of the particle, respectively; V and Vh denote the volume and non-concave volume of the particle, respectively; D denotes the equivalent diameter of the particle; and A denotes the surface area of the particle.
Table 2. Comparison of caving zone height and overlying stress in numerical tests and parameters of 52,304 fully mechanized mining face.
Parameters of 52,304 Fully-Mechanized Mining Face of Daliuta Coal MineNumerical Model Parameters
Height of caving zone15 mCharacterization unit model of crushed rock15 m
Overlying stress3.0–6.5 MPaOverlying stress5 MPa
Table 3. Meso-mechanical parameters of wall and rigid block.
WallRigid Block
Normal
Stiffness/
(N·m−1)
Shear
Stiffness/
(N·m−1)
Friction
Coefficient
Normal
Stiffness/
(N·m−1)
Shear
Stiffness/
(N·m−1)
Density/
(kg·m−3)
Friction
Coefficient
1 × 1091 × 1090.505 × 1085 × 10823000.55
Disclaimer/Publisher’s Note: The statements, opinions and data contained in all publications are solely those of the individual author(s) and contributor(s) and not of MDPI and/or the editor(s). MDPI and/or the editor(s) disclaim responsibility for any injury to people or property resulting from any ideas, methods, instructions or products referred to in the content.