Article

Unraveling Oxygen Transfer Behavior in Submerged Arc Welding Using CaF2-SiO2-CaO Fluxes

1
School of Mechanical and Electrical Engineering, Suqian University, Suqian 223800, China
2
School of Metallurgy, Northeastern University, Shenyang 110819, China
*
Authors to whom correspondence should be addressed.
These authors contributed equally to this work.
Processes 2023, 11(9), 2622; https://doi.org/10.3390/pr11092622
Submission received: 3 August 2023 / Revised: 24 August 2023 / Accepted: 29 August 2023 / Published: 2 September 2023
(This article belongs to the Section Materials Processes)

Abstract

:
The purpose of this study is to investigate the transfer behavior of oxygen during the submerged arc welding process using CaF2-SiO2-CaO fluxes. In contrast to previous research that only focused on the final oxygen content in the final weld metal, this study introduces two new parameters, ΔdO and ΔwO, to quantify the oxygen transfer in essential regions: the droplet and weld pool zones, respectively. The transfer behavior of oxygen is analyzed by using typical Multi-Zone and equilibrium models. The results indicate that the Multi-Zone model is capable of capturing the metallurgical processes of oxidation and subsequent reduction during the submerged arc welding process. Moreover, the Multi-Zone model demonstrates superior predictive accuracy in estimating oxygen content in the metal compared to the equilibrium model. Based on measured values and metallurgical data, this article analyzes the oxygen transfer mechanism and non-equilibrium state in the submerged arc welding process from both thermodynamic and kinetic perspectives. Then, scientific hypotheses previously put forward are validated and discussed, which may offer valuable insights and practical guidance for flux design.

1. Introduction

Lately, due to its high deposition rate and consistent welding quality, submerged arc welding (SAW) has emerged as the foremost technique for joining steels in heavy production fields [1]. During such welding process, the arc plasma and weld pool remain hidden as they are covered by a layer of flux and slag [2]. Flux serves multiple functions in the SAW process [2]. Specifically, the chemical interactions among the arc plasma, flux, and weld pool have a profound influence on the metal’s composition, subsequently altering the mechanical properties of the weld metal (WM) [3].
Oxygen (O) is an essential element that markedly affects the microstructure and mechanical characteristics of the weldment [4]. Excessive O content tends to result in reduced toughness and/or diminished hardenability [5]. On the other hand, WM possessing low O levels displays subpar mechanical characteristics, particularly regarding toughness, because of insufficient inclusions that promote the development of acicular ferrite (a microstructure known for its interlocking features that effectively prevent crack spread via cleavage) [6].
The primary function of flux is to form a slag layer during the SAW process, protecting the weld pool from the atmosphere [7]. Additionally, flux helps to control the chemical composition of WM, thereby improving the quality and performance of the weldment [8]. It’s commonly understood that the flux acts as the primary supplier of O to the metal in the SAW process [9]. Within welding metallurgy, the idea of flux O potential is used to elucidate the driving force for the O transition from the flux to the metal [4,10]. Flux primarily consists of oxides and CaF2. SiO2, as an essential component, plays a crucial role in forming the network structure of the molten slag [3]. However, due to its inherent susceptibility to decomposition, SiO2 tends to release O2, consequently elevating the O content within the droplet and weld pool via Reaction (1) [4,11,12].
( SiO 2 ) = SiO ( g ) + 1 2 O 2 ( g )
To prevent excessive O absorption from the flux, CaF2 and CaO are commonly incorporated into the flux due to the fact that [11]:
  • CaF2 is the flux component free of O.
  • The addition of CaO can effectively decrease the activity of SiO2.
Based on the above design concept, the CaF2-CaO-SiO2 system has become a classic flux system [4,13]. The characteristic of this flux system is that it can avoid excessively high flux O potential while ensuring good welding processability, which has been documented in previous studies [4,13].
Nonetheless, as highlighted in earlier research, a significant scientific challenge revolves around the intricacy of estimating the oxygen potential within the CaF2-CaO-SiO2 flux system [13]. It is well known that the basicity index (BI) model has been widely applied in SAW engineering to estimate the flux O potential [7,14]. The BI, as illustrated by Equation (2) (wt pct), is a practical measurement used to approximate the flux O potential, with a tendency for lower O content in submerged arc welded metal as the BI value increases [2]. The flux O potential can be estimated based on the BI value, allowing for a predictive relationship between the two variables [15].
BI = CaO + CaF 2 + 0 . 5 × ( MnO + FeO ) SiO 2 + 1 / 2 ( Al 2 O 3 + TiO 2 )
However, it should be noted that the BI model is essentially an empirical model and cannot accurately represent the chemical characteristics of flux O potential [7]. As shown in Equation (2), the flux BI model assumes that the effects of CaF2 and CaO on flux O potential are the same [14]. In subsequent work, Eagar [16] considered CaF2 as a neutral substance and suggested that it only plays a dilution role in flux O potential [16]. Later, with the development of Calphad technology, researchers combined the assumption of local thermodynamic equilibrium within the weld pool in SAW to propose thermodynamic equilibrium models [4]. However, when these equilibrium models are used for predicting the O potential of CaF2-SiO2-CaO flux, they still produce significant prediction errors [4].
The CaF2-SiO2-CaO flux system for SAW was initially proposed by Dallam et al. [13] They combined design principles of flux composition with the CaF2-SiO2-CaO ternary phase diagram to demonstrate that the flux in such system is able to provide suitable O potential yet ensure good weldability. However, Dallam et al. [13] also concluded that it is not feasible to predict the O potential of the CaF2-SiO2-CaO flux using the BI model. Therefore, despite their extensive research on the CaF2-SiO2-CaO flux system, they still didn’t provide an in-depth explanation for the transfer mechanism of O element induced by the flux due to technological limitations at that time.
Given the significance of the CaF2-SiO2-CaO flux system in SAW metallurgy, this study aims to conduct an in-depth investigation into the O transfer mechanisms when CaF2-SiO2-CaO fluxes are utilized. The transfer behavior of the O element is evaluated and predicted using both equilibrium and Multi-Zone models. Moreover, the study endeavors to meticulously analyze the mechanism governing the transfer behavior of O induced by the CaF2-CaO-SiO2 flux. In this research on SAW, the study goes beyond traditional methodologies by introducing two novel parameters, ΔdO and ΔwO, to quantify O transfer in crucial zones, namely the droplet and weld pool zones. By adopting such an approach, the research not only enhances the understanding of the O transfer mechanisms induced by the CaF2-SiO2-CaO flux system but also addresses the limitations of the prevailing BI model. Moreover, through the integration of equilibrium and Multi-Zone models, this study aims to enhance the understanding of the complex interactions between elements within the SAW process, further improving predictions and the efficiency of the welding process.

2. Materials and Methods

In order to minimize the influence of binders and ensure the uniformity of the overall flux, this study focuses on the investigation of the fused flux [4]. To facilitate the quantification of element transition behaviors, this study employs the bead-on-plate SAW method for experimentation. Specific experimental details, including welding parameter settings, composition detection methods, and composition detection results, can be found in the previous literature, which will be used for model validation in this article [17].

2.1. Modeling Tools

In the field of SAW engineering, it is frequently assumed that local thermodynamic equilibrium is achieved [5,11,12,18,19]. Utilizing this insight into thermodynamic equilibrium, one may explore chemical interactions in the SAW process, such as elemental transfer and predicting composition [4]. Calphad, which stands for “computer coupling of phase diagrams and thermochemistry,” is an approach that employs thermodynamic models to predict material system properties. It relies on fundamental thermodynamic data from binary and/or ternary material systems to achieve this forecasting [20]. Since the temperatures during SAW exceed 1900 °C, direct measurement of thermodynamic data is unfeasible [4]. Nevertheless, the thermodynamic models employed in the Calphad approach have demonstrated their reliability in acquiring thermodynamic data at high temperatures surpassing 1900 °C [21]. Considering that SAW involves multiple phases and extremely high temperatures, the Calphad technique is employed in this research to simulate the chemical interactions within the SAW process.
In this work, thermodynamic modeling will be performed using Factsage, which is a widely recognized thermodynamic software based on the Calphad technique [22]. Factsage, known for its reliability and accuracy, offers a comprehensive set of calculation and manipulation modules. These modules allow access to various databases containing information on pure substances and solutions [20,22]. Data from the study of Polar et al. [17] will be used for modeling and result verification. The fluxes to be investigated have been summarized in Table 1 and Table 2 [17].

2.2. Modeling Details

Based on the characteristics of chemical interactions, Figure 1 illustrates the division of the SAW process into three zones: the Droplet Reaction Zone, the Weld Pool Reaction Zone, and the Weld Pool Solidification Zone.

2.2.1. Droplet Reaction Zone

In this zone, the droplet separates from the electrode tip and then travels through the arc cavity. The temperature within this region reaches an astounding 2500 °C [8,23,24]. It has been postulated that the O in the droplet metal is primarily attributed to the O2 generated from the decomposition of the oxide in flux [9,11]. Preliminary experiments have shown that there is an insignificant transfer of alloy elements in this Zone [8,23,24]. Mitra et al. [8,23,24] presumed that a dynamic O layer forms at the metal-plasma interface, effectively preventing the alloy elements from reaching the interface, as illustrated in Figure 1b. The plasma parameters, including temperature, have been well discussed in previous findings [25,26].
The Equilib module is utilized for modeling purposes [21]:
  • The databases FToxid, Fstel, and FactPS were chosen. The molten slag and steel phases were simulated by selecting the solution phases of ASlag-liq all oxides, S (FToxid-SLAGH), and LIQUID (FStel-Liqu).
  • The equilibrium temperature for the SAW process was set at 2500 °C, which corresponds to the temperature of the arc plasma. The input metal chemistries were obtained from the BM compositions.
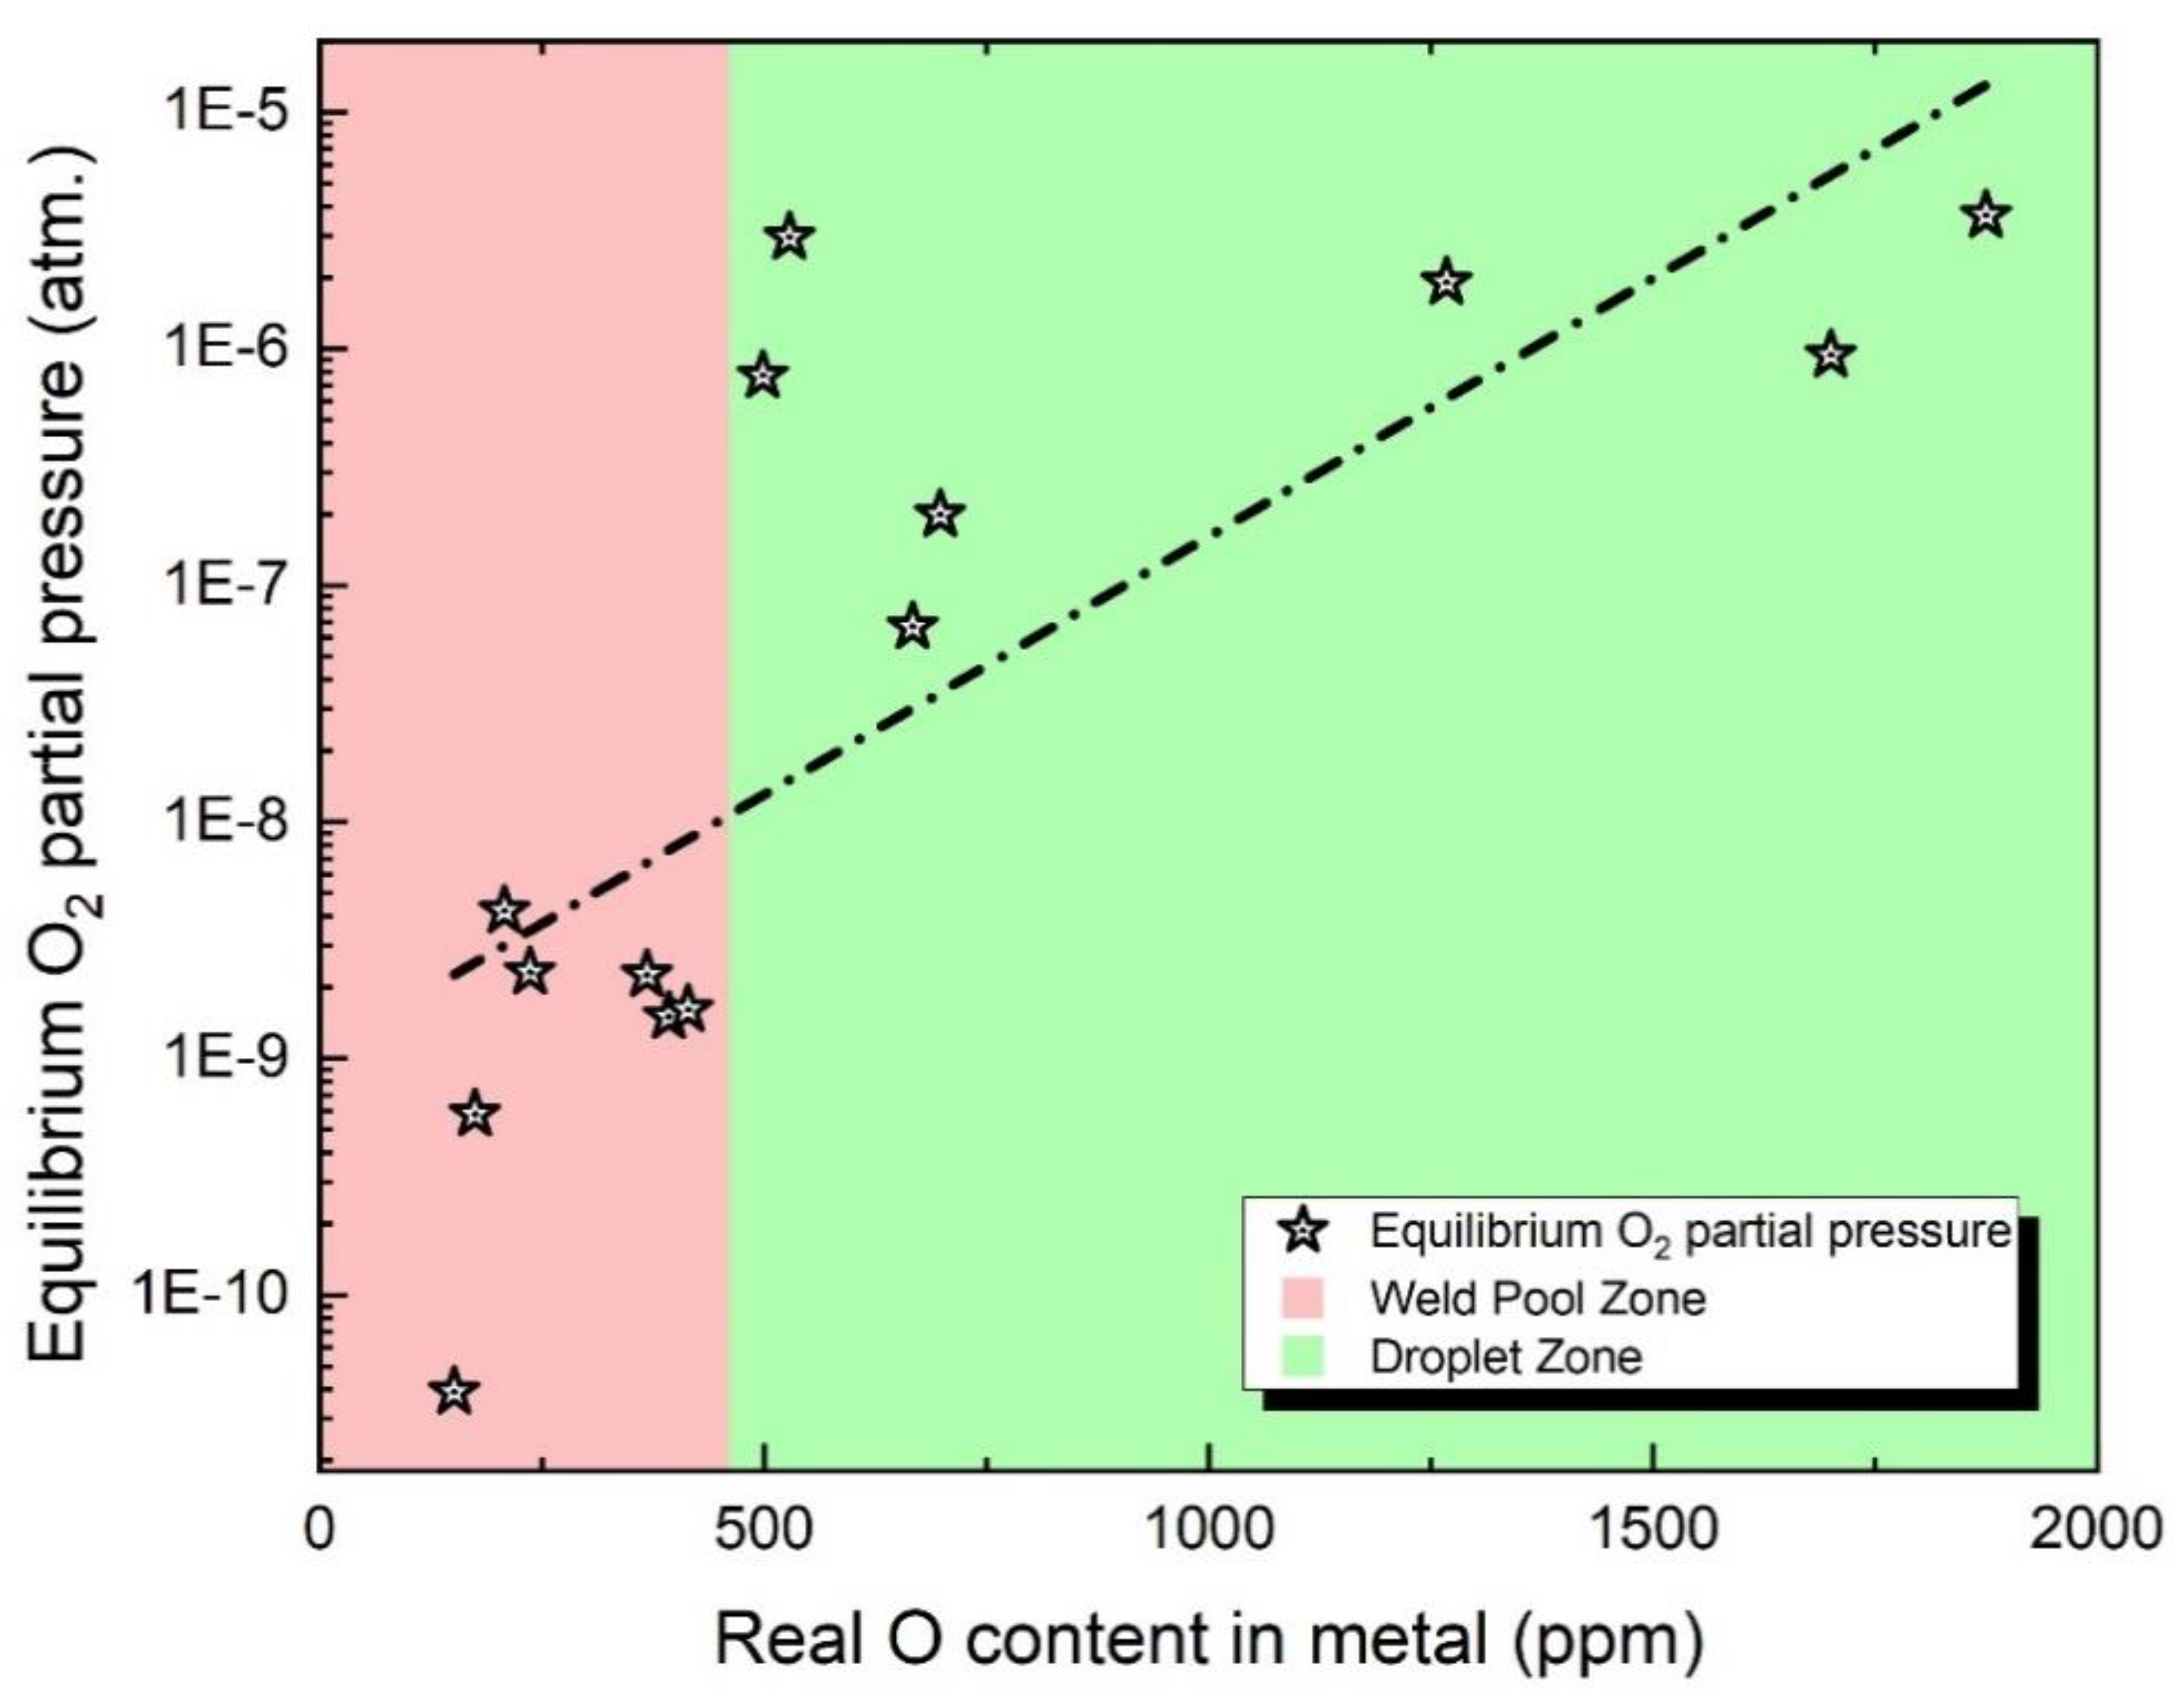
  • To predict the O concentration in the droplet, an equilibrium calculation was conducted using iron (Fe) and O as the input metal constituents. The PO2 value provided in Table 3 was employed for this calculation. Table 3 presents the concentration of Oin molten droplets and the corresponding partial pressure of O2 in equilibrium.

2.2.2. Weld Pool Reactions

As depicted in Figure 1a, before the weld pool gets covered by the liquid slag, the arc plasma causes the evaporation of Si and Mn. Since Si and Mn are foundational dioxides for the weld pool, the depletion of these elements needs to be taken into account [5,12]. Multiple studies have shown that depending solely on thermodynamics is not adequate to precisely forecast the extent of alloy evaporation in this zone [2]. A recent contribution by Zhu et al. [27] put forward models to forecast the loss of Si and Mn induced by evaporation at the plasma-metal interface. The scientists found a significant link between the concentrations of Si and Mn and the observed data, as illustrated by Equations (3) and (4) [21,27]. In Equations (3) and (4), η represents the mass percentage, while M implies the contents of Si and Mn after the dilution of the weld pool by the droplet.
η Si = 38.55 0.33 M Mn 0.58 M Si
η Mn = 49.04 0.23 M Mn 0.49 M Si
As such, considering the evaporation of Si and Mn and the dilution effect, the compositions given in Table 4 are set as input for the thermodynamic equilibrium model. For the purpose of comparing with the previous model, the O content is also predicted by using the gas-slag-metal equilibrium model reported in previous studies, with the metal compositions in Table 5 as input stream [10,21].
The Equilib module was employed for modeling purposes [10]:
  • To simulate the molten slag and steel phases, the FToxid, Fstel, and FactPS databases were utilized, selecting the solution phases of ASlag-liq for all oxides, S (FTox-id-SLAGH) for slag, and LIQUID (FStel-Liqu) for steel.
  • The input metal compositions were configured based on the contents presented in Table 4, while the flux compositions were derived from those specified in Table 1.
  • A modeling temperature of 2000 °C was chosen.

2.2.3. Solidification Zone

In the zone of solidification, the hot weld pool undergoes cooling and solidification. As oxides become more stable at lower temperatures, there is a slight reduction in the O content near the slag-metal interface [23,24]. Since the O content in SAW engineering refers to the bulk composition of the submerged arc welded metal, such slight reduction is ignored during modeling [10].

2.2.4. Viscosity Simulation

Taking into account that all SAW experiments were carried out under identical circumstances except for the flux, the primary emphasis of this investigation lies in analyzing the impact of flux composition on O content. More precisely, the study delves into the transfer characteristics of the O element [17]. It is well known that the viscosity of the flux is an essential factor determining the transfer behavior of the elements [7]. However, from a technical perspective, it is not possible for people to directly measure the viscosity of the flux at temperatures as high as 2000 °C [4].
Herein, the Viscosity module in FactSage is employed to simulate the high-temperature viscosity of the flux, in order to assist in the analysis [20,22]. The Viscosity module in FactSage computes the viscosity of a glass or slag solution based on the provided temperature and composition [20,22]. Due to the high temperature attained in SAW, the database of “Glasses” is selected. The temperature of 2000 °C is set, which is the effective temperature subject to the weld pool zone in SAW. The simulated data is summarized in Table 6.

3. Results and Discussion

3.1. Transfer Behavior of O

SAW is a semi-enclosed yet high-temperature metallurgical system [1]. During the welding process, the slag, molten pool, and plasma arc are all covered under the flux particles, which makes it difficult for researchers to conduct in-depth observation and study of its physical and chemical processes.
Within this framework, ΔdO and ΔwO are employed to quantify the transfer level of O within the droplet and weld pool zones. Values of ΔdO and ΔwO are calculated from Equations (5) and (6), where ΔD presents the level of elemental transfer in the droplet zone, MD presents the content in the droplet, ΔW presents the level of elemental transfer in the weld pool zone, MW presents the content in the WM, MN presents the nominal composition.
ΔdO and ΔwO are utilized to assess the extent of O transfer in the droplet zone and weld pool zone. The values of ΔdO and ΔwO are determined by using Equations (5) and (6) respectively. ΔdO implies the level of O transfer in the droplet zone, while MDO represents the content within the droplet. Similarly, ΔwO represents the level of O transfer in the weld pool zone, with MWO representing the O content in the WM, and MNO denoting the nominal O content. The quantified data subject transfer of O at various reaction zones has been summarized in Table 7.
Δ D O   =   M D O     M N O
Δ W O   =   M W O     M D O
For the SAW process, a profound understanding of the O transfer mechanism is essential since it serves as an essential parameter influencing the mechanical properties of the weld joint [4]. In the early stages, people drew on the concept of BI in steelmaking to assess the O potential of flux in SAW [16]. However, such an evaluation method is empirical and does not reflect the thermodynamic relationship between the flux O potential and flux formulas [2]. In the following research, Indacochea et al. [18] proposed that flux O potential, which suggests that the O content in the submerged arc welded metal, should be controlled by the partial pressure of O2 in the arc cavity. Lau et al. [9,28], on the other hand, discovered that the O content in the molten droplets is an order of magnitude higher than the O content in the submerged arc welded metal. Even though Lau et al. [9,28] did not present thermodynamic evidence, they believe that during the molten droplet stage, there is a significant increase in O content; however, during the molten pool stage, it is essentially a deoxidation process for the molten metal.
To elucidate the scientific hypotheses stated above, the O content levels have been plotted in Figure 2. This figure illustrates the variation in O content within the metal as it undergoes distinct reaction zones during SAW process.
Specifically, Figure 2a presents the actual measured O content values, while Figure 2b portrays the O content values predicted through the conventional thermodynamic equilibrium model. Additionally, Figure 2c displays the anticipated O content values derived from the Multi-Zone model.
In summary, Figure 2a illustrates the O content variation trend across different SAW stages. Notably, a significant increase in O content within the droplet indicates a prominent oxidation process in the droplet reaction zone. During the weld pool reaction zone, deoxidation primarily occurs through the presence of alloying elements in the weld pool. In essence, the metallurgical SAW process involves two distinct steps: a substantial oxidation phase followed by a minor deoxidation phase.
Moving to Figure 2b, it demonstrates the O content variation trend assessed via the thermodynamic equilibrium model. This model confines its analysis to chemical reactions within the weld pool zone, assuming the O content is determined by local thermodynamic equilibrium reactions at the gas-slag-metal interface. Considering the flux’s oxidation effect during the weld pool reaction zone, the model predicts O content increases solely within this region.
Contrastingly, Figure 2c portrays the O content trend evaluated by the recently developed Multi-Zone model. Impressively, in contrast to thermodynamic equilibrium models, the Multi-Zone model precisely captures the intricate metallurgical dynamics of SAW. It adeptly illustrates the sequential pattern of oxidation followed by deoxidation. Furthermore, the Multi-Zone model’s predicted Δ value, a quantitative measure of oxidation and deoxidation levels, closely correlates with experimental findings, further substantiating its reliability and effectiveness in comprehending the fundamental chemical reactions governing the SAW process.

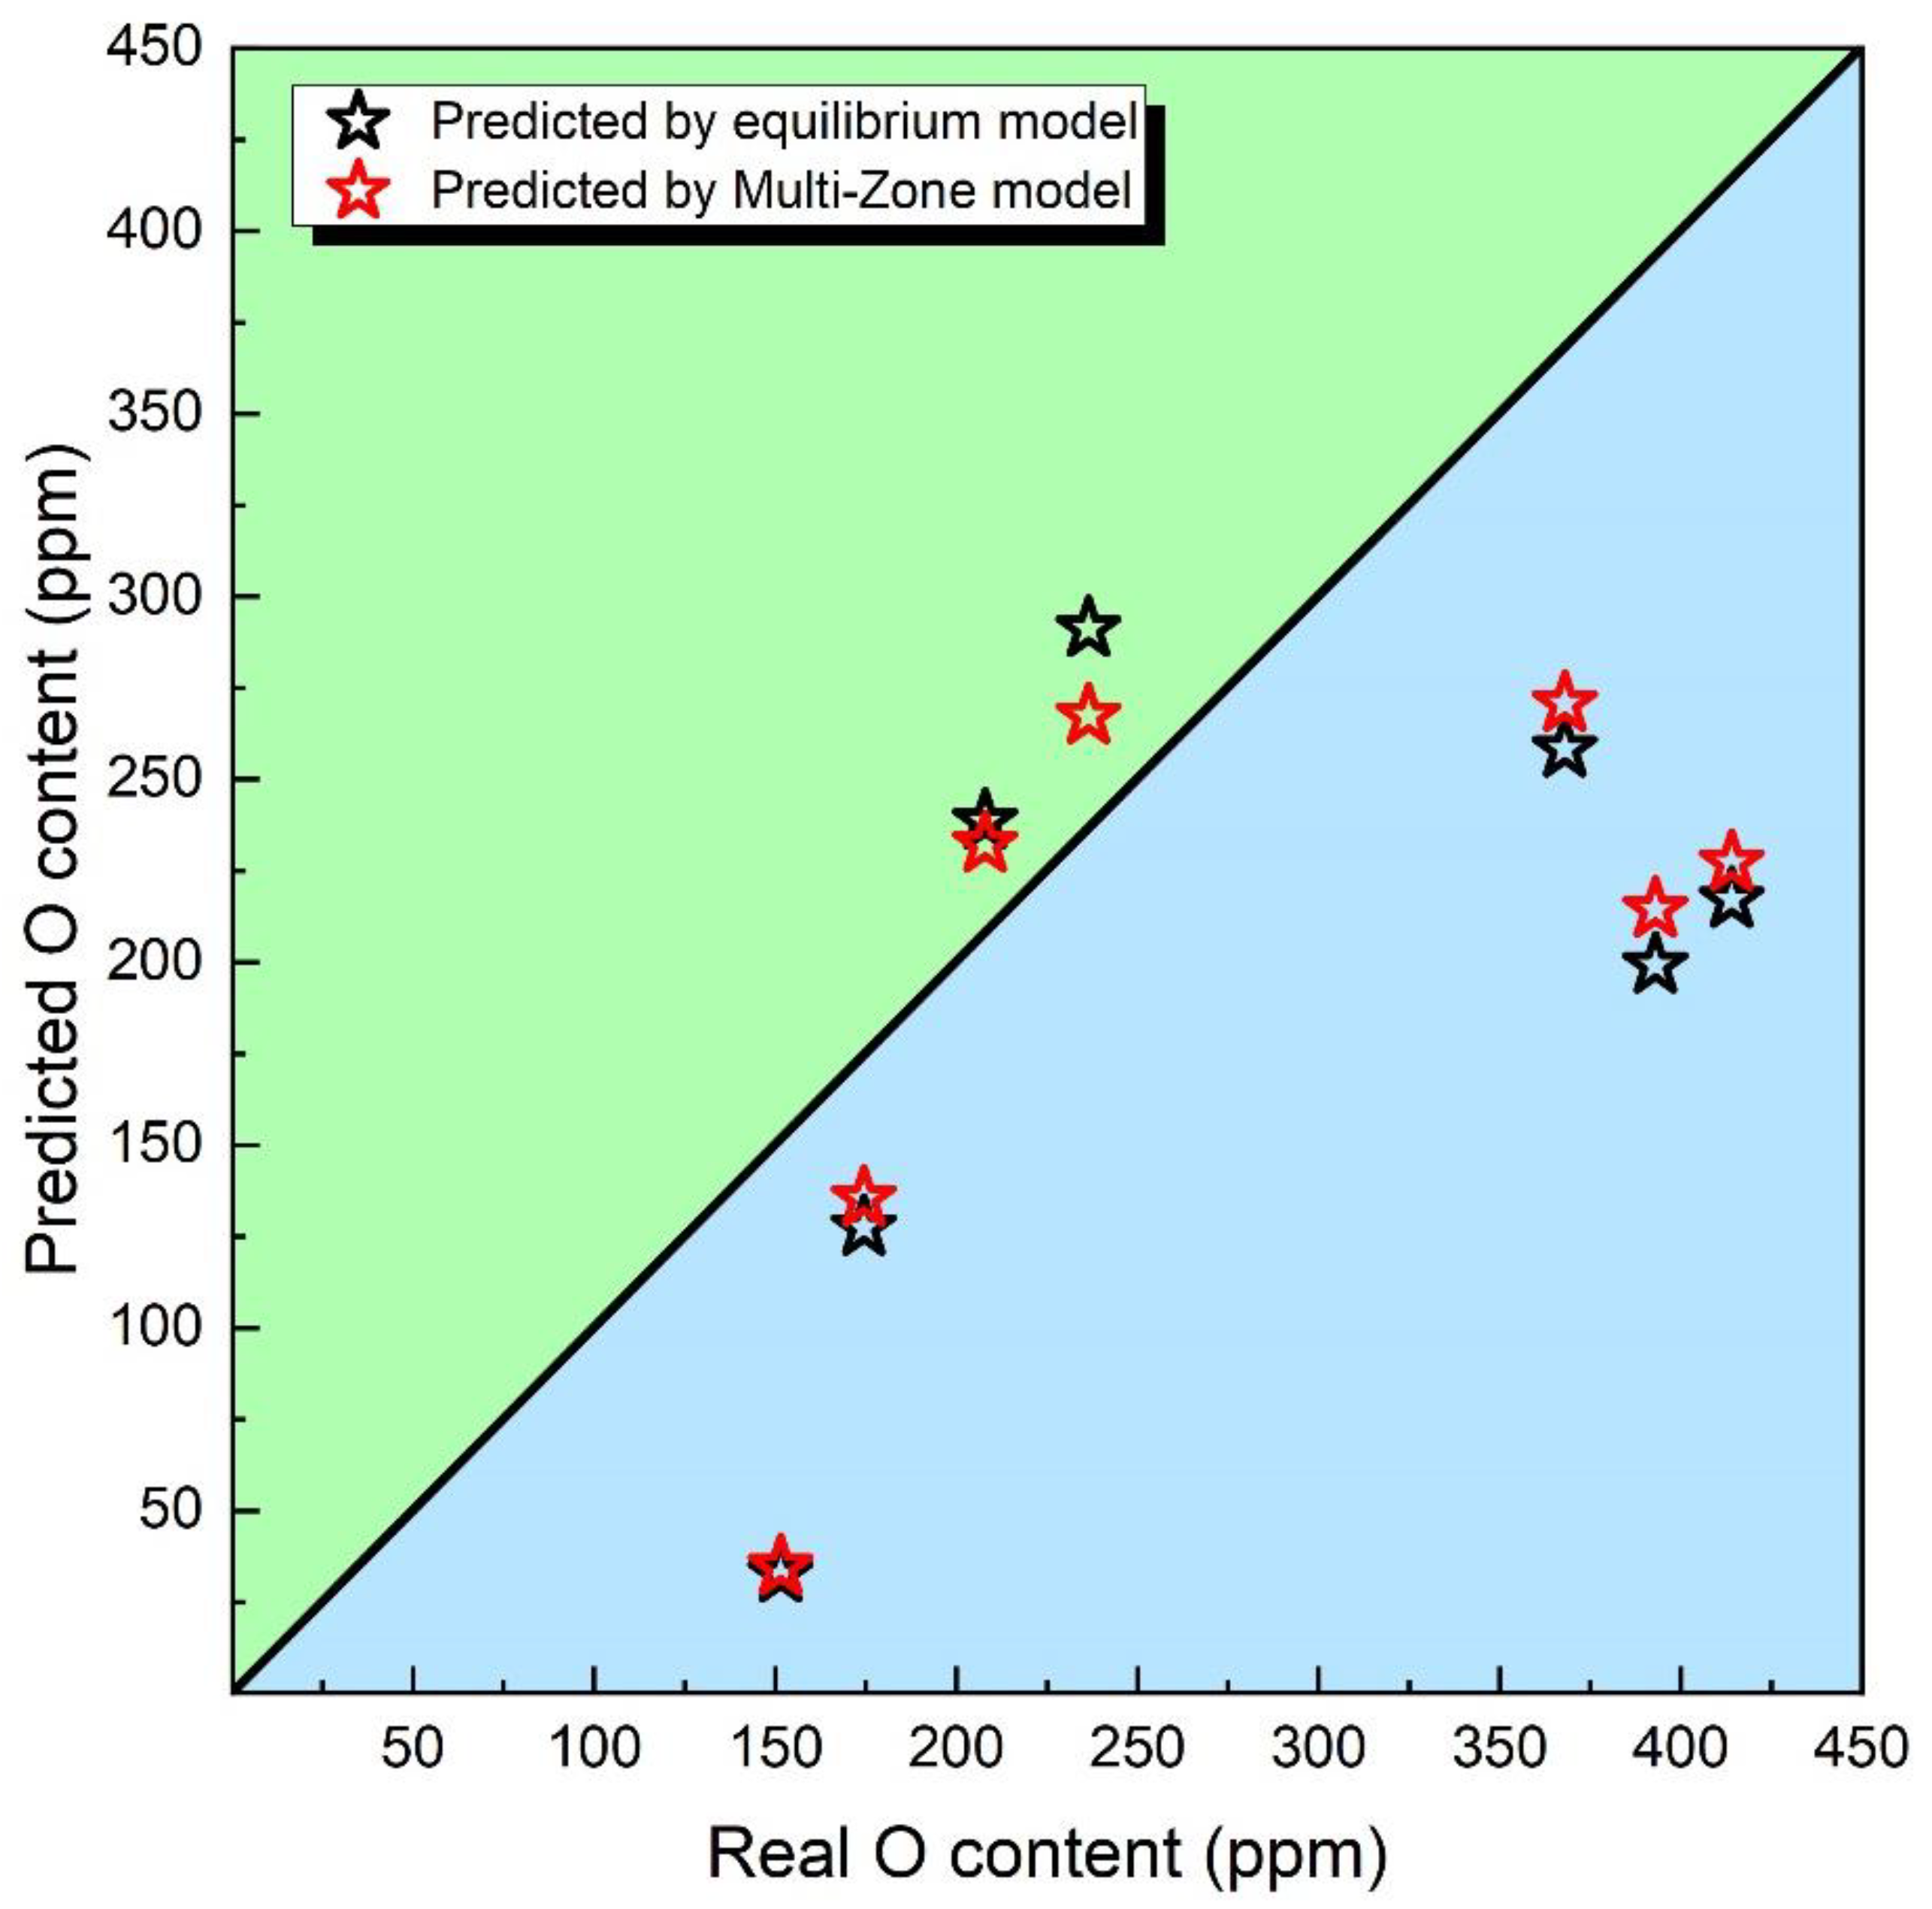
3.2. Prediction of O Content

In the early stages of academic research, attempts were made to approximate the O content in submerged arc welded metal by adopting a concept similar to “basicity” from steelmaking practices, despite the significant inherent inaccuracies associated with such approach [14]. Subsequently, the basicity model was upgraded to a thermodynamic equilibrium model. However, although the thermodynamic equilibrium model demonstrated higher predictive accuracy compared to the basicity model, it still exhibited errors [2]. This was primarily due to the model’s neglect of the chemical reactions occurring in the droplet reaction zone of SAW [10].
Indeed, the prediction of O content is of utmost importance for weld flux design and post-weld metal performance regulation, as it plays a critical role in determining the mechanical properties of the submerged arc welded metal [4]. In order to assess the predictive capabilities of the latest Multi-Zone model, the oxygen content predicted by the thermodynamic equilibrium model and the Multi-Zone model is plotted in Figure 3.
Upon examination of Figure 3, it becomes apparent that the Multi-Zone Model demonstrates superior precision when contrasted with the Equilibrium Model. As previously highlighted, the Multi-Zone Model not only encompasses the chemical reactions within the weld pool zone but also incorporates the chemical interactions engendered by the arc plasma of the droplet zone [29]. Consequently, the Multi-Zone Model showcases elevated accuracy in its prognostication of the O potential of the flux.
Even though there have been controversies among scholars in the past, it has always been widely acknowledged that the partial pressure of O2 in the arc cavity is a crucial parameter determining the flux O potential [4]. However, in the SAW process, the arc cavity is covered by flux particles and molten slag, making it challenging for researchers to directly measure the partial pressure of O2 [1]. Additionally, previous studies did not take into account the measured O content in the molten droplets [4]. To investigate this scientific inquiry, the equilibrium O2 partial pressure (derived through the Multi-Zone Model) has been correlated with the measured O content in the metal in Figure 4.
By observing Figure 4, it can be noticed that the O content in the metal increases with the rise of O2 partial pressure in the arc cavity, both in the droplet reaction zone and the weld pool zone. This validates the scientific hypothesis mentioned earlier. However, it should be pointed out that the relationship between O2 partial pressure and the O content in the metal is not strictly proportional due to the non-equilibrium nature of the SAW system, which affects this correlation [8,23,24,30].

3.3. Non-Equilibrium Status of O Transfer Behavior

The Non-equilibrium status of the overall SAW process has been extensively confirmed [31]. Conventionally, scholars perceive the non-equilibrium aspects within the SAW process as an exploration into the kinetics of metallurgical processes [30]. Specifically, Mitra et al. [8,23,24] conducted a systematic study on the metallurgical kinetics of the SAW process. Based on Mitra’s research findings, the viscosity of the flux is a crucial factor influencing the non-equilibrium behavior of O transfer during the SAW process [8,23,24]. This is because the experiments were conducted under constant welding parameters, except for variations in the flux composition.
This study introduces a novel symbol, denoted as δ, to quantify the absolute discrepancy between the equilibrium state (E) and the actual value (A). This discrepancy is defined as Equation (7). This measure provides a magnitude of deviation from the equilibrium, irrespective of the direction of change. This notation will maintain consistency across the paper, serving to represent the absolute disparity between the current state and the state of equilibrium.
δ = | A E |
In general, the viscosity of the flux plays a crucial role in determining the extent of chemical reactions. Although the precise reaction mechanism of SAW remains unclear, it is widely believed that increasing the flux viscosity leads to a greater deviation between the actual observed values and the thermodynamic equilibrium point. To verify such a scientific hypothesis, the relationship between δ and the viscosity of the flux (slag) was depicted in Figure 5.
As depicted in Figure 5, an escalation in viscosity results in greater deviations between actual values and the thermodynamic equilibrium point. This observation resonates with the earlier-mentioned scientific proposition. Consequently, from a flux design perspective, it becomes imperative to factor in flux viscosity to estimate the magnitude of deviation between actual and predicted compositions within the weld metal. This comprehensive understanding bridges the gap between theoretical considerations and practical application, offering valuable insights for optimizing SAW processes.

3.4. Scientific Explanation

  • SAW is a typical oxygen process. However, there has been debate about the oxygen mechanism in the SAW process. From the perspective of the BI model or the thermodynamic equilibrium model in the molten pool zone, O enhancement in the SAW process primarily occurs within the molten pool zone. However, experimental findings indicate that O enhancement in the SAW process predominantly takes place in the droplet reaction zone, and the molten pool region is essentially a deoxidation process [9,28]. Therefore, through comparative analysis with empirical data, this model identifies shortcomings in the traditional BI model and thermodynamic equilibrium model, revealing that the predicted O content trend of the Multi-Zone model aligns with the observed trend. Furthermore, the Multi-Zone model demonstrates higher accuracy in the ultimate prediction of O content composition.
  • Regarding the non-equilibrium aspects of the SAW process, a simulation of ultra-high-temperature slag viscosity has been performed, validating the quantitative relationship between high-temperature viscosity and the non-equilibrium nature of the SAW process.
  • In terms of quantifying the elemental transfer behavior in SAW, the research findings indicate that the traditional quantification method (Δ) deviates from the actual O transfer process in the droplet zone due to its neglect of chemical reactions occurring there. Thus, it is necessary to separately consider O transfer in both the droplet and the molten pool zones, thereby achieving a more accurate prediction and simulation of the O transfer mechanism subject to the overall SAW process.

3.5. Plans for Further Research

Although the Multi-Zone model provides a more accurate assessment of the transitional behavior of O than traditional models, further research is necessary to enhance the predictive precision of the model in the following aspects:
  • Both the Multi-Zone model and thermodynamic models are based on chemical thermodynamics theory. However, they do not account for the influence of physical factors on the transfer behavior of O, particularly the impact of physical slag entrapment on composition. Therefore, incorporating essential physical models will further enhance the overall predictive accuracy of the model.
  • Currently, the Multi-Zone model still relies on local thermodynamic equilibrium as its modeling foundation. However, in reality, the SAW process exists in a global non-equilibrium state. While Mitra et al. [8,23,24,30] have proposed a dynamic model for the SAW process, this model only addresses the molten pool reaction zone. Therefore, developing metallurgical dynamic models for the droplet reaction zone and solidification reaction zone is imperative.

4. Conclusions

Within this framework, the transfer behavior of O has been qualified by a new method and interpreted for CaF2-SiO2-CaO flux subject to the SAW process. Utilizing empirical data and metallurgical insights, this study conducts a comprehensive examination of the O transfer mechanism and the non-equilibrium state within the SAW process. This analysis encompasses both thermodynamic and kinetic viewpoints. The key findings derived from this investigation can be summarized as follows:
  • The O transfer mechanism in SAW is elucidated as a dual-stage process, involving an initial oxidation in the droplet zone followed by deoxidation in the weld pool zone. Two new parameters, ΔdO and ΔwO, have been introduced to quantify the O transfer in droplet and weld pool zones.
  • The Multi-Zone model is capable of capturing the metallurgical processes of oxidation and subsequent deoxidation during the SAW process yet demonstrates superior predictive accuracy in estimating the O content in the metal compared to the equilibrium model.
  • The role of flux viscosity in influencing the non-equilibrium O transfer behavior has been emphasized, showing that an increase in flux viscosity leads to a greater discrepancy from the equilibrium point.

Author Contributions

Conceptualization, J.Z., J.F. and D.Z.; funding acquisition, J.F. All authors have read and agreed to the published version of the manuscript.

Funding

This work was financially supported by the National Natural Science Foundation of China (No. 50474085), the Initial Fund of Suqian University (No. 2022XRC040), Suqian Science & Technology Project (No. K202239).

Conflicts of Interest

The authors declare no conflict of interest.

References

  1. Sengupta, V.; Havrylov, D.; Mendez, P. Physical Phenomena in the Weld Zone of Submerged Arc Welding—A Review. Weld. J. 2019, 98, 283–313. [Google Scholar] [CrossRef]
  2. Kou, S. Welding Metallurgy, 3rd ed.; JohnWiley & Sons, Inc.: Hoboken, NJ, USA, 2003; pp. 22–122. [Google Scholar]
  3. Olson, D.; Liu, S.; Frost, R.; Edwards, G.; Fleming, D. Nature and Behavior of Fluxes Used for Welding; ASM Handbook; ASM International: Detroit, MI, USA, 1993; Volume 6, pp. 55–63. [Google Scholar] [CrossRef]
  4. Zhang, J.; Shao, G.; Fan, J.; Wang, L.; Zhang, D. A Review on Parallel Development of Flux Design and Thermodynamics Subject to Submerged Arc Welding. Processes 2022, 10, 2305. [Google Scholar] [CrossRef]
  5. Chai, C.-S. Slag-Metal Reactions during Flux Shielded Arc Welding. Ph.D. Thesis, Massachusetts Institute of Technology, Cambridge, MA, USA, 1980. [Google Scholar]
  6. Mills, A.; Thewlis, G.; Whiteman, J. Nature of inclusions in steel weld metals and their influence on formation of acicular ferrite. Mater. Sci. Technol. 1987, 3, 1051–1061. [Google Scholar] [CrossRef]
  7. Natalie, C.A.; Olson, D.L.; Blander, M. Physical and Chemical Behavior of Welding Fluxes. Annu. Rev. Mater. Sci. 1986, 16, 389–413. [Google Scholar] [CrossRef]
  8. Mitra, U.; Eagar, T. Slag-metal Reactions during Welding: Part I. Evaluation and Reassessment of Existing Theories. Metall. Trans. B 1991, 22, 65–71. [Google Scholar] [CrossRef]
  9. Lau, T.; Weatherly, G.; McLean, A. The Sources of Oxygen and Nitrogen Contamination in Submerged Arc Welding using CaO-Al2O3 Based Fluxes. Weld. J. 1985, 64, 343–347. [Google Scholar]
  10. Zhang, J.; Zhang, D. Thermodynamic Simulation of O Content Variation Roadmap in Submerged Arc Welding Process: From Droplet to Weld Metal. Processes 2023, 11, 784. [Google Scholar] [CrossRef]
  11. Chai, C.; Eagar, T. Slag Metal Reactions in Binary CaF2-Metal Oxide Welding Fluxes. Weld. J. 1982, 61, 229–232. [Google Scholar]
  12. Chai, C.; Eagar, T. Slag-metal Equilibrium during Submerged Arc Welding. Metall. Trans. B 1981, 12, 539–547. [Google Scholar] [CrossRef]
  13. Dallam, C.; Liu, S.; Olson, D. Flux Composition Dependence of Microstructure and Toughness of Submerged Arc HSLA Weldments. Weld. J. 1985, 64, 140–151. [Google Scholar]
  14. Tuliani, S.; Boniszewski, T.; Eaton, N. Notch Toughness of Commercial Submerged Arc Weld Metal. Weld. Met. Fabr. 1969, 37, 327–339. [Google Scholar]
  15. Shao, G.; Liu, Z.; Fan, J.; Guo, Y.; Xu, Q.; Zhang, J. Evaluation of Flux Basicity Concept Geared toward Estimation for Oxygen Content in Submerged Arc Welded Metal. Metals 2022, 12, 1530. [Google Scholar] [CrossRef]
  16. Eagar, T. Sources of Weld Metal Oxygen Contamination during Submerged Arc Welding. Weld. J. 1978, 57, 76–80. [Google Scholar]
  17. Polar, A.; Indacochea, J.; Blander, M. Electrochemically generated oxygen contamination in submerged arc welding. Weld. J. 1990, 69, 69–74. [Google Scholar]
  18. Indacochea, J.E.; Blander, M.; Christensen, N.; Olson, D.L. Chemical Reactions During Submerged Arc Welding with FeO-MnO-SiO2 Fluxes. Metall. Trans. B 1985, 16, 237–245. [Google Scholar] [CrossRef]
  19. Chai, C.; Eagar, T. Prediction of Weld-metal Composition during Flux-shielded Welding. J. Mater. Energy Syst. 1983, 5, 160–164. [Google Scholar] [CrossRef]
  20. Bale, C.W.; Bélisle, E.; Chartrand, P.; Decterov, S.; Eriksson, G.; Gheribi, A.; Hack, K.; Jung, I.-H.; Kang, Y.-B.; Melançon, J. Reprint of: FactSage Thermochemical Software and Databases, 2010–2016. Calphad 2016, 55, 1–19. [Google Scholar] [CrossRef]
  21. Zhang, J.; Liu, P.; Zhang, D. Advancing Manganese Content Prediction in Submerged Arc Welded Metal: Development of a Multi-Zone Model via the Calphad Technique. Processes 2023, 11, 1265. [Google Scholar] [CrossRef]
  22. Jung, I.-H. Overview of the Applications of Thermodynamic Databases to Steelmaking Processes. Calphad 2010, 34, 332–362. [Google Scholar] [CrossRef]
  23. Mitra, U.; Eagar, T. Slag-metal Reactions During Welding: Part II. Theory. Metall. Trans. B 1991, 22, 73–81. [Google Scholar] [CrossRef]
  24. Mitra, U.; Eagar, T. Slag-metal Reactions during Welding: Part III. Verification of the Theory. Metall. Trans. B 1991, 22, 83–100. [Google Scholar] [CrossRef]
  25. Saifutdinov, A. Numerical study of various scenarios for the formation of atmospheric pressure DC discharge characteristics in argon: From glow to arc discharge. Plasma Sources Sci. Technol. 2022, 31, 094008. [Google Scholar] [CrossRef]
  26. Baeva, M.; Loffhagen, D.; Becker, M.M.; Siewert, E.; Uhrlandt, D. Plasma parameters of microarcs towards minuscule discharge gap. Contrib. Plasma Phys. 2020, 60, e202000033. [Google Scholar] [CrossRef]
  27. Zhu, J.; Wang, Y.; Shi, H.; Huang, L.; Mao, Z. Element Loss Behavior and Compensation in Additive Manufacturing of Memory Alloys. Trans. China Weld. Inst. 2022, 43, 50–55. [Google Scholar] [CrossRef]
  28. Lau, T.; Weatherly, G.; McLean, A. Gas/metal/slag Reactions in Submerged Arc Welding Using CaO-Al2O3 Based Fluxes. Weld. J. 1986, 65, 31–38. [Google Scholar]
  29. Zhang, J.; Shao, G.; Guo, Y.; Xu, Q.; Liu, Z. Facilitating flux design process geared towards submerged arc welding via thermodynamic approach: Case study into CaF2–SiO2–Na2O–Al2O3–TiO2 agglomerated flux. Calphad 2022, 79, 102483. [Google Scholar] [CrossRef]
  30. Mitra, U. Kinetics of Slag Metal Reactions during Submerged Arc Welding of Steel; Massachusetts Institute of Technology: Cambridge, MA, USA, 1984. [Google Scholar]
  31. Eagar, T.W. Thermochemistry of joining. In Proceedings of the Elliott Symposium on Chemical Process Metallurgy, Cambridge, MA, USA, 10–13 June 1991. [Google Scholar]
Figure 1. Reaction zones responsible for controlling the O content in the metal during the SAW process [10]: (a) Overall schematic diagram of the SAW process, (b) Droplet reaction zone, (c) Weld pool reaction zone, and (d) Weld pool solidifying zone.
Processes 11 02622 g001
Figure 2. Simulation of O content variation roadmap during the welding process. (a) Real data. (b) Predicted data by equilibrium model. (c) Predicted data by Multi-Zone model.
Processes 11 02622 g002
Figure 3. O content predicted via equilibrium and Multi-Zone models.
Processes 11 02622 g003
Figure 4. O content and O2 partial pressure predicted via equilibrium and Multi-Zone models.
Processes 11 02622 g004
Figure 5. Relationship between δ and the flux viscosity.
Processes 11 02622 g005
Table 1. Chemical composition of the fluxes utilized in this study (wt pct) [17].
FluxWMCaF2SiO2CaO
F-1WM-1104050
F-2WM-2204040
F-3WM-3304030
F-4WM-4402040
F-5WM-5502030
F-6WM-6602020
F-7WM-7702010
Table 2. Compositions of base metal and electrode (wt pct) [17].
COSiMnFe
Base metal (BM)0.040.0050.030.37Balanced
Electrode0.090.020.581.18Balanced
Table 3. Predated droplet O content and equilibrium O2 partial pressure within the arc.
WMPO2 (atm.)Droplet O Content (wt pct)
WM-19.39 × 10−70.128
WM-21.91 × 10−60.182
WM-33.66 × 10−60.252
WM-46.69 × 10−80.034
WM-51.99 × 10−70.059
WM-67.68 × 10−70.115
WM-72.96 × 10−60.227
Table 4. Compositional input of thermodynamic equilibrium model (wt pct).
WMCSiMnOFe
WM-10.0650.190.40.064Balanced
WM-20.0650.190.40.091Balanced
WM-30.0650.190.40.126Balanced
WM-40.0650.190.40.017Balanced
WM-50.0650.190.40.030Balanced
WM-60.0650.190.40.058Balanced
WM-70.0650.190.40.113Balanced
Table 5. Compositional input of gas-slag-metal equilibrium model (wt pct).
WMCSiMnOFe
WM-10.070.310.780.01Balanced
WM-20.070.310.780.01Balanced
WM-30.070.310.780.01Balanced
WM-40.070.310.780.01Balanced
WM-50.070.310.780.01Balanced
WM-60.070.310.780.01Balanced
WM-70.070.310.780.01Balanced
Table 6. Simulated viscosity of the molten flux at 2000 °C (poise).
FluxCaF2SiO2CaOViscosity
F-11040500.064
F-22040400.059
F-33040300.056
F-44020400.02
F-55020300.019
F-66020200.018
F-77020100.017
Table 7. Quantified data subject O transfer at various reaction zones (ppm).
WMMulti-Zone ModelEquilibrium ModelReal Data
ΔDOΔWOΔDOΔWOΔDOΔWO
WM-11275−106101991700−1307
WM-21819−159202171268−854
WM-32519−224802581875−1507
WM-4340−305033667−516
WM-5590−4550127698−524
WM-61153−8860291499−262
WM-71265−10330339529−321
Disclaimer/Publisher’s Note: The statements, opinions and data contained in all publications are solely those of the individual author(s) and contributor(s) and not of MDPI and/or the editor(s). MDPI and/or the editor(s) disclaim responsibility for any injury to people or property resulting from any ideas, methods, instructions or products referred to in the content.

