Article

Process Optimization of Sea Buckthorn Fruit Powder Effervescent Tablets by Random Centroid Methodology Combined with Fuzzy Mathematical Sensory Evaluation

1
Institute of Agro-Products Storage and Processing, Xinjiang Academy of Agricultural Sciences, Urumqi 830091, China
2
Xinjiang Deeper Processing and Engineering Technology Research Centre of Main Byproducts, Urumqi 830091, China
3
College of Food Science and Pharmacy, Xinjiang Agricultural University, Urumqi 830052, China
4
College of Food Science and Engineering, Key Laboratory of Food Processing Technology and Quality Control of Shandong Higher Education Institutes, Shandong Agricultural University, Taian 271002, China
*
Authors to whom correspondence should be addressed.
Processes 2023, 11(9), 2639; https://doi.org/10.3390/pr11092639
Submission received: 4 August 2023 / Revised: 25 August 2023 / Accepted: 28 August 2023 / Published: 4 September 2023

Abstract

:
Solid beverages of effervescent tablets have good taste and portable features and are favored by consumers, but product quality and nutrition cannot meet the need of increasing nutritional requirements. Sea buckthorn fruit has a special flavor and nutrient-rich characteristics, but the related products of effervescent tablets have not been developed. In this paper, different additive contents (sea buckthorn fruit powder, erythritol, disintegrant, maltodextrin, polyvinylpyrrolidone (PVP)) were optimized using the random centroid method; the obtained effervescent effect sensory evaluation characteristics (appearance, beverage, appearance, taste, solubility) were used to establish a fuzzy mathematic model for sensory evaluation method of process optimizing; and the nutritional components and characteristics of optimized sea buckthorn powder effervescent tablets were compared to the ones of the commercial product. The results show that the optimal process conditions (47.7% sea buckthorn fruit powder, 1.3% erythritol, 1:1 disintegrant ratio, 2% maltodextrin and 2.9% PVP) were obtained according to the highest fuzzy comprehensive sensory score (87.76). Moreover, the optimized one contains a higher content of vitamin C (50.36 mg/100 g), carotenoids (10.18 mg/100 g), total phenols (11.52 GAE/g), and total flavonoids (28.46 mg RE/100 g), as well as a shorter disintegration time (10 s). The results indicate the RCO, combined with fuzzy mathematical sensory evaluation, is preferably suitable for effervescent tablet process optimization, and the quality indicators met the requirements of the effervescent tablet.

1. Introduction

Sea buckthorn (SBT, Hippophae rhamnoides L.) is a deciduous shrub that belongs to the Eleagnaceae family (Rosales) [1], naturally distributed in Asia and Europe; the total area of sea buckthorn in China accounts for 90% of the total area in the world [2,3,4]. Its nutritional value is high and rich in 428 bioactive compounds, such as vitamin C, flavonoids, and total phenols [5,6,7]. Moreover, it is also known as a precious medicinal and edible plant resource and is proven to have the pharmacological functions of lowering blood pressure, blood lipid, and blood sugar, as well as anti-oxidation benefits [8,9]. But sea buckthorn fruit is quick to decay after picking, causing the loss of the functional ingredients and lowering the related qualities. Vacuum freeze-drying is regarded as one of the most widely used methods of food processing for retaining nutrients to a great extent, and our previous study also prepared sea buckthorn fruit powder by vacuum freeze-drying, with better quality characteristics. It can be developed as a ready-to-drink product [10].
As a new type of solid beverage in recent years, effervescent tablets have the advantages of convenient carrying, simple technology, rich nutrition, unique flavor, rapid dissolution, good stability, low transportation and storage costs, and long shelf life [11]. Its unique experience and special flavor are more favored by consumers in the market [12,13], so the fruit of barberry [10], guava [14], mango [13], pineapple [15], barberry fruit pulp [16], pitaya [17], and watermelon [18] have been selected for preparation effervescent tablets, with unique flavors and characteristics.
Sea buckthorn fruit powder is dehydrated and hygroscopic, and it imposes high costs of storage and transportation [10,14]. To avoid this, a more effective utilization method of sea buckthorn fruit powder is to process the corresponding effervescent tablet. Current research focusing on juice effervescent tablet processing is usually optimized by the orthogonal experiment and response surface methodology (RSM) [19], relying on a single-factor test to find the optimal center point. But this optimization process needs a large amount of testing and cumbersome operation [20,21], and a more efficient preparation process of effervescent tablets has not been reported. Furthermore, the target variable of sensory evaluation is one of the most intuitive and important indicators of product quality, and it is difficult to quantify because it is easily interfered by subjective factors of sensory evaluators.
The comprehensive evaluation method of fuzzy mathematics is an ideal evaluation model based on fuzzy mathematics, which realizes the quantification of influencing factors and can reflect the importance of various factors more objectively and accurately. It can reduce the subjective assessment error between sensory evaluation indexes and sensory evaluation subjects, improve the scientific rationality and objectivity of evaluation results, and is widely used in food sensory evaluation. Based on the research, this study tried to optimize the processing conditions of sea buckthorn fruit powder effervescent tablets by combining the fuzzy mathematical evaluation and random centroid optimization (RCO) methodology, evaluate the sensory and nutritional properties, and acquire good-quality effervescent tablets. This study aimed to provide certain technical guidance and a theoretical basis for the industrial production of powder effervescent tablets.

2. Materials and Methods

2.1. Materials and Chemicals

Sea buckthorn fruit powder was produced with freeze-drying at Xinjiang Kangyuan Biotechnology Group Co., Ltd. (Xinjiang, China), then the fruit powder was vacuum-packaged and stored in dryers at 4 °C. Erythritol, citric acid, maltodextrin, polyvinylpyrrolidone, and sodium bicarbonate were of chemical grade and purchased from Beijing Solarbio Technology Co., Ltd. (Beijing, China). The standard samples of sodium ascorbate, 2,6-dichlorophenol indophenol sodium salt and rutin were of chromatographic grade and purchased from Shanghai Hengyuan Biotechnology Co., Ltd. (Shanghai, China), Shanghai chuangsai Technology Co., Ltd. (Shanghai, China) and Shanghai Yuanye Biotechnology Co., Ltd. (Shanghai, China), respectively. All other chemicals and reagents used were of analytical grade and purchased from Beijing Solarbio Technology Co., Ltd.

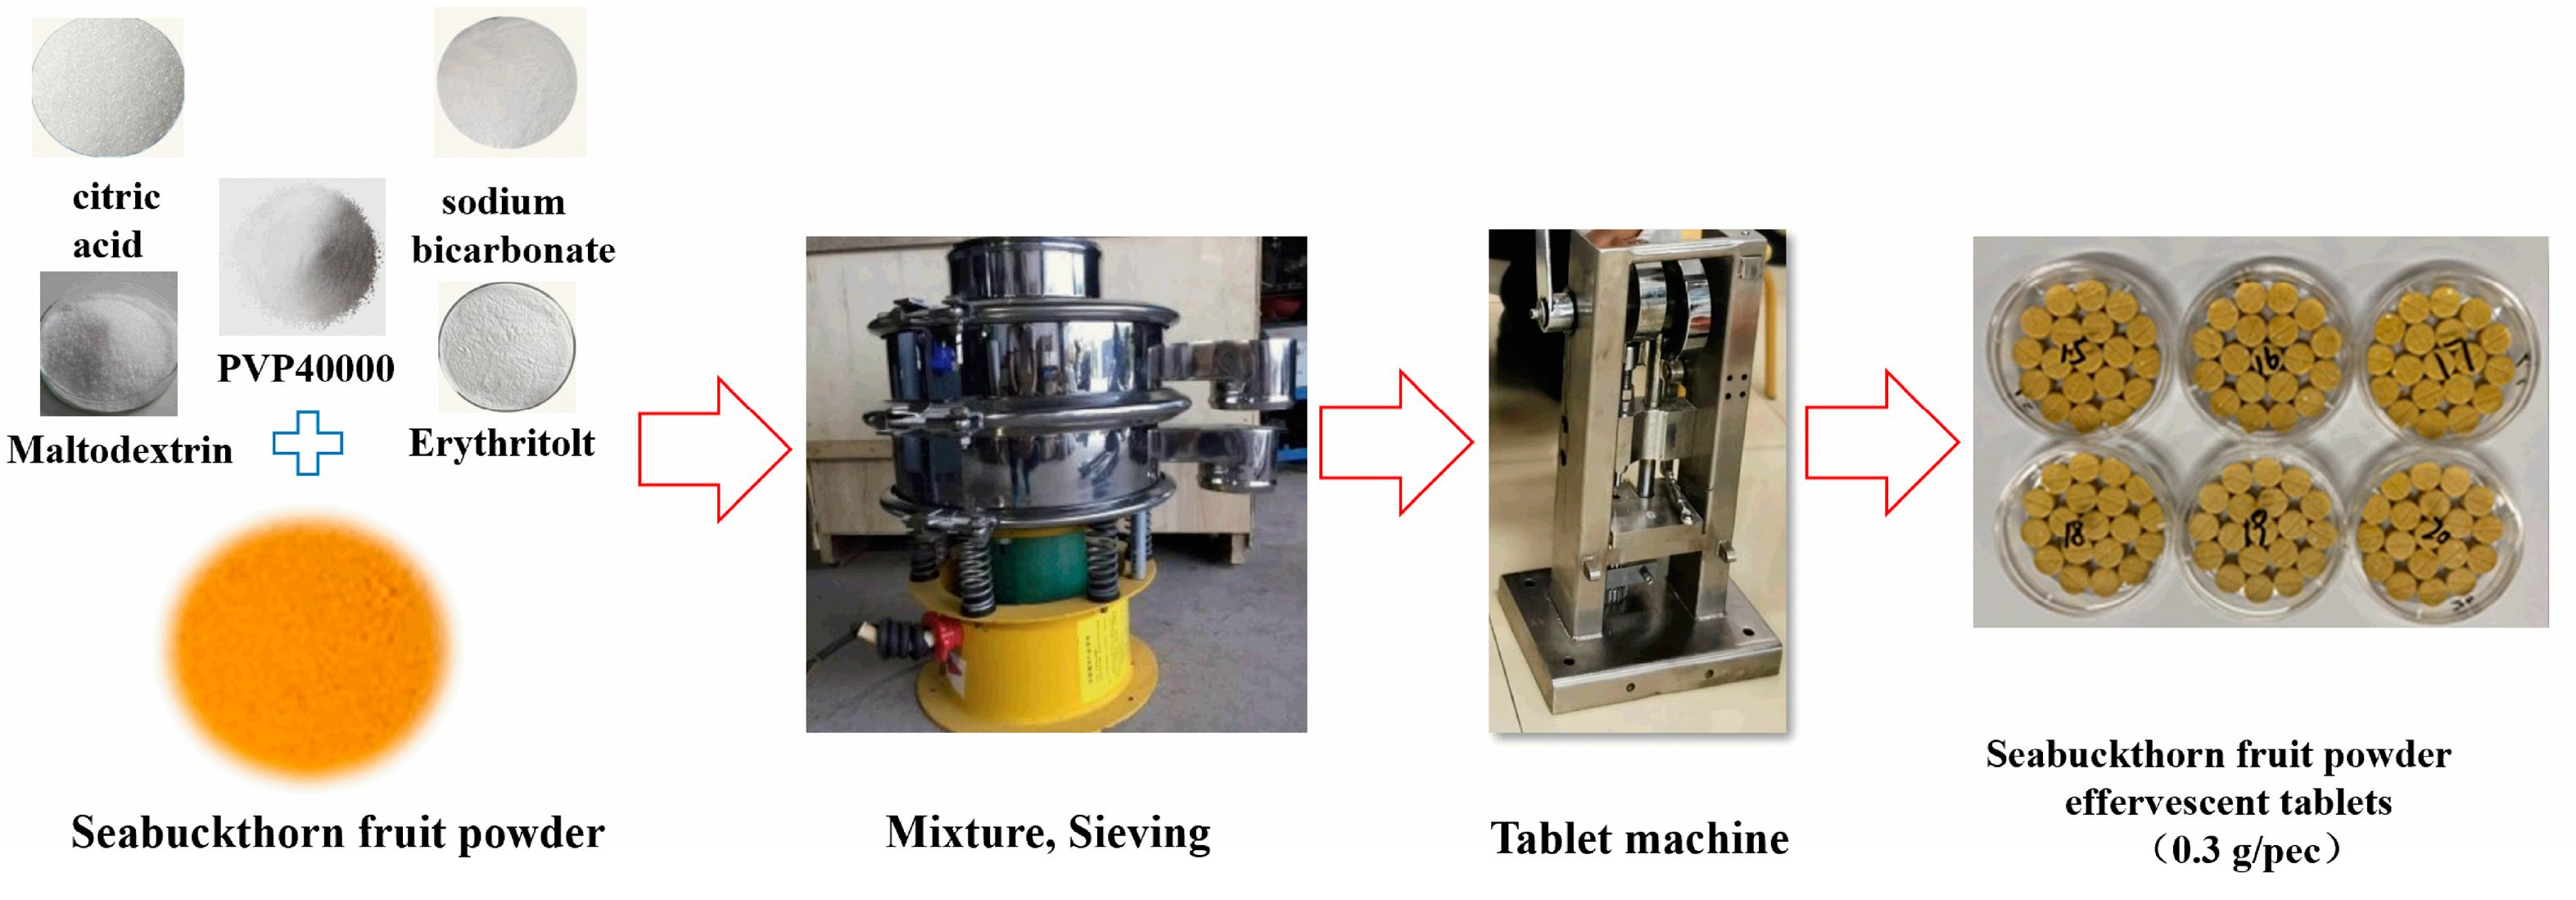
2.2. Sample Preparation

Sea buckthorn fruit powder and relevant auxiliary materials (erythritol, effervescent agents, maltodextrin, and polyvinylpyrrolidone) were mixed in different proportions and passed through a 60 sieve. Then, 0.30 g of mixed material was weighed for tablet pressing, and the DP-25 10-station single punch tableting machine with 8 mm flat die and punches was compressed into tablets (Shanghai Tianfan pharmaceutical machine manufacturing factory, Shanghai, China), and then the obtained tablets batches were cured at 75 °C in an oven for 30 min [22,23]. The preparation process flow of sea buckthorn effervescent tablets was followed as presented in Figure 1.

2.3. Random Centroid Optimization

Random centroid optimization is particularly useful for investigating multiple factors and targets, as well as widely in the process optimization of food products [24]. In this paper, the effects of different additive content on the sensory quality of sea buckthorn fruit powder effervescent tablets were evaluated by this RCO method. Content of sea buckthorn fruit powder (30–70%), erythritol (0.5–2.5%), maltodextrin (0.3–3%), polyvinylpyrrolidone (1–5%), and acid base ratio (0.6–1.4) were evaluated based on the sensory score. The variables and the corresponding ranges were inputted to the RCO program (RCOPTNS), and 14 sets of proposed parameter values were yielded from the random search and then used for effervescent tablet ingredient optimization. The above parameter values were inputted to the first round of random search program to obtain the random optimization formula, and then they were re-inputted to the program of centroid search for further optimization. The obtained results were compiled and mapped for the optimizing process and used to produce the effervescent tablet. Then, the sensory qualities were compared with the market product.

2.4. Sensory Quality Evaluation

The sensory qualities of effervescent and beverage appearance, taste, effervescent effect, and disintegration were evaluated by 20 trained panelists (age range of 20 to 30 years from graduate students). The numbered samples were randomly presented to the panelists in lidded containers at room temperature [25]. The evaluation personnel evaluated each sample according to the sensory evaluation specifications presented in Table 1, the scoring range was 0–20 points, and the total sensory score was 100. After each sample was evaluated, they were rinse with purified water, and the measurement interval was 3 min. The sensory evaluation method is based on a scale of 0 to 4 according to the importance of the sensory evaluation of the product, and the evaluation coefficient is obtained. The scoring criteria are 4 points for very important; 0 points for less important; 3 points for more important, 1 point for less important; and 2 points each for equally important.

2.5. Fuzzy Mathematical Sensory Comprehensive Evaluation Model Establishment

Evaluation object set (y) is composed of 24 kinds of products: y = (y1, y2, y3,…, y24), where y1, y2, y3,…, y24, representing the set of products prepared for sensory evaluation. The set of evaluation factors U make up the sensory quality of the product. The evaluated factors, effervescent appearance, beverage appearance, taste, and disintegration are U1–U5, respectively The evaluation standards for the product are the evaluation set V = {V1, V2, V3} = {good, medium, poor}. Factors of sensory quality were weighted and scored on a scale of 0 to 4, and the weight set was X = {0.123, 0.081, 0.310, 0.244, 0.242}, based on the scores. The result of the comprehensive evaluation of the fuzzy relationship is Ti = X·Ri, where X denotes the set of weights, Ri denotes the judgement matrix, and the overall assessment score Yi = Ti·V.

2.6. Ascorbic Acid Content

The content of ascorbic acid was determined using the HPLC system (Agilent 1260, Agilent Technologies Co. Ltd., Palo Alto, CA, USA). The HPLC system conditions were set as follows: diamonsil-C18 column (4.6 mm × 250 mm, 5 µm); UV wavelength of 245 nm; mobile phase constitutes 95% potassium dihydrogen phosphate (50 mmol/L, pH 3.0) and 5% acetonitrile in isocratic elution model; flow rate is 1 mL/min; and injection volume of 20 µL. The content was quantified by the obtained ascorbic acid standard curve (y = 6302.45x + 329.53, R2 = 0.9999) [26,27].
The effervescent tablet (2 g) was mechanically stirred in 60 mL metaphosphoric acid solution (4.5% (w/v)) for 15 min with a VORTEX-5 vortex mixer (Nanjing Baden Medical Co., Ltd., Nanjing, China), then the mixture was filtered through a 0.45 µm Millipore filter prior to injection into the chromatographic.

2.7. Carotenoids Content

The content of carotenoids was determined by the plant carotenoid content assay kit from Beijing Solarbio Technology Co., Ltd. (Beijing, China) with modifications [28]. The specific measurement steps are as follows: 0.1 g sea buckthorn powder effervescent tablets, 1 mL distilled water, and 10 mg reagent I were added to a 5 mL small beaker, stirred under dark, and transferred into a 10 mL centrifugal tube. The small beaker was rinsed with the extraction solution (80% acetone and distilled water are mixed in a ratio of 4:1) 2–3 times. The extraction solution was fixed to 10 mL, placed in dark conditions for 3 h, and then 1 mL supernatant was taken into a 1 mL cuvette. The absorbance value at 440 nm was measured using a UV-2000 spectrophotometer (Shimadzu Scientific Instruments, Tokyo, Japan), and it was recorded as A440. The carotenoid content was calculated according to the following equation.
carotenoid content (mg/g) = A440/(ε × d × V × 1000 ÷ W × F) = 0.04 × A440 × F/W
where A440 is the absorbance at 440 nm, 0.256 in this paper; ε is the empirical extinction coefficient of carotenoids, 250 L/g/cm; d is the optical path of cuvette; V is the total volume of extract; W is the sample quality; and F is the dilution factor.

2.8. Total Phenol Content

The total phenolic content of different samples was measured according to the method described by former research [29]. Briefly, 2.0 g of each extract was dissolved in 20 mL of methanol aqueous solution (80%, v/v), the mixture was then filtered using a Büchner funnel, and the supernatant was collected and transferred to a 50 mL calibration flask for constant volume. A total of 1.8 mL of saturated sodium carbonate solution (7.5%) was added after a 0.1 mL solution of the extract and 2 mL of Folin–Ciocalteu reagent, mixed, shaken for 3 min, and then stored in the dark for 1 h. The absorbance value at 760 nm was measured using a spectrophotometer. The calibration curve of gallic acid was obtained and established as y = 0.1189x − 0.0091 (R2 = 0.9996). The results are expressed as mg gallic acid equivalents/100 g (mg GAE/100 g).

2.9. Total Flavonoids Content

The determination of total flavonoid content was performed according to the following method [30]. The samples (2.0 g) were dissolved in 25 mL of 80% methanol aqueous solution. Then, they were filtered with 10 um filter paper, and the superannuate was collected and transferred to a 100 mL calibration flask for constant volume using an 80% methanol aqueous solution. A total of 30 mL of the extract was concentrated 10 times through Senco R-501 rotary evaporation (Shanghai Shenshun Biotechnology Co., Ltd., Shanghai, China), filtered through a 0.45 µm Millipore filter prior to determination. A 2 mL solution of the extract was transferred to a 10 mL centrifugal tube, 0.2 mL of 5% NaNO2 solution and 0.2 mL of 10% Al(NO3)3 solution were added in sequence, and they stood at room temperature for 6 min. Then, 2 mL of 4% NaOH solution was added and reacted at room temperature for 15 min. The obtained mixed solution was fixed to 5 mL with distilled water, and its absorbance at 510 nm was measured with methanol as the control. The calibration curve of the rutin equivalent was obtained and expressed as y = 0.1315x + 0.0143 (R2 = 0.9986). The results are expressed as mg rutin equivalents/100 g (mg RE/100 g).

2.10. Tablet Weight Difference

The intact sea buckthorn fruit powder effervescent tablets (20.00 g) were weighed accurately and the average value was calculated. Then, the mass of each effervescent tablet was weighed separately. Compared with the average mass, the quality difference limit was ±7.5% when the sample was less than 0.3 g, the quality difference limit was ±7.5% when the weight was less than 0.3 g, and the quality difference limit was ±5.0% when the weight was greater than or equal to 0.3 g.

2.11. Hardness

The hardness determination was performed according to the following method with a modification [31]. Hardness was measured by TAXT plus texture analyzer from British SMS company (London, UK) at room temperature, and the conditions were set as follows: compression mode; P/5test probe; 1 mm/s pretest speed; 0.5 mm/s test speed; 10 mm/s post-test speed; target mode force; 500 N force; 5 N trigger force; and 5 N break sensitivity and break mode rate. The average value was calculated after removing the highest value and the lowest value.

2.12. Disintegration Time Limit

The disintegration time limit was determined using the Zbs-6 g intelligent disintegration tester (Tianjin Tianda tianke Technology Co., Ltd., Tianjin, China) [22]. Seven samples were randomly selected and placed in the basket of the disintegration tester. And the complete disintegration time was recorded under the water temperature of 37 ± 1 °C. If one tablet failed to completely disintegrate within 5 min, another 7 tablets were taken for retest.

2.13. Statistical Analysis

All experiments were repeated three times and the experiment data were expressed as mean ± standard deviation. The data were processed and analyzed using the Origin 8.0 software, and statistical analyses were carried out using one-way analysis of variance (ANOVA). Differences among means were considered significant at p < 0.05 with Duncan’s multiple-range tests.

3. Results

3.1. Sensory Evaluation

The evaluation results were collected, summarized, and statistically analyzed to produce a statistical table of comprehensive tasting results (counting the number of sensory tasters) (Table 2 and Table 3). The calculation details were shown as follows: there were 3, 10, and 7 tasters who rated the samples as excellent, medium, and poor, respectively. Then, U1 = {0.15, 0.5, 0.35}, U2 = {0.3, 0.4, 0.3}, U3 = {0.25, 0.35, 0.40}, U4 = {0.2, 0.35, 0.45}, and U5 = {0.25, 0.35, 0.4}, and the membership rank matrices of the five single factors were obtained. The membership rank matrices of the twenty-four samples were obtained as follows:
R 1 = [ 0.15 0.50 0.35 0.30 0.40 0.30 0.25 0.35 0.40 0.20 0.35 0.45 0.25 0.35 0.40 ]       R 2 = [ 0.50 0.45 0.05 0.60 0.40 0 0.55 0.45 0 0.55 0.45 0 0.55 0.45 0 ]       R 3 = [ 0.30 0.60 0.10 0.30 0.70 0 0.30 0.50 0.20 0.25 0.45 0.30 0.30 0.40 0.30 ]
R 4 = [ 0.40 0.50 0.10 0.35 0.60 0.05 0.40 0.55 0.05 0.30 0.50 0.10 0.25 0.65 0.10 ]       R 23 = [ 0.60 0.35 0.05 0.65 0.35 0.05 0.65 0.35 0.05 0.75 0.25 0 0.70 0.30 0 ]       R 24 = [ 0.80 0.20 0 0.90 0.10 0 0.90 0.10 0 0.95 0.05 0 0.85 0.15 0 ]
T 1   =   X R 1   = { 0.123 ,   0.081 ,   0.310 ,   0.244 , 0.242 } × [ 0.15 0.50 0.35 0.30 0.40 0.30 0.25 0.35 0.40 0.20 0.35 0.45 0.25 0.35 0.40 ] = { 0.23     0.37     0.40 }
Similarly, T2 = {0.55 0.45 0.01}, T3 = {0.29 0.49 0.22}, T4 = {0.34 0.58 0.08},…, T23 = {0.68 0.31 0.01}, and T24 = {0.89 0.11 0}.
The total score of the fuzzy comprehensive evaluation is Y = T·V. Given a score of “good, medium, poor”, comment level was set as {90, 70, 50}, respectively, and the final comprehensive score for each sample was calculated.

3.2. Design of RCO Optimization Conditions

The contents of sea buckthorn fruit powder, aspartame, maltodextrin, polyvinylpyrrolidone, and acid base ratio were selected as the factors for RCO optimization; the comprehensive evaluation indexes were obtained after the data processing, preparation and evaluation. The experimental results of the random and centroid search in the first round of optimization are shown below.
The mapping optimization diagrams were drawn according to the first round of RCO experimental results, and the specific results are shown in Figure 2. The arrows in the figure corresponded to the optimization mapping condition of each factor, and the optimization results were calculated and shown as follows: sea buckthorn fruit powder content of 47.5%, erythritol content of 1.6%, acid base ratio of 1.1:1 (citric acid and sodium bicarbonate content of 45.4%), maltodextrin content of 2.1%, and polyvinylpyrrolidone content of 3.4%. But the results mapped in the figure are scattered, indicating that the optimization results could not be fully reflected; consequently, a second round of optimizing was required.
On the basis of the first round of optimization results, the upper and lower limits of each factor in the second round were reduced and inputted; the experimental scheme of the second round was obtained and the corresponding test results are shown in Table 3.
According to the experimental results, the mapping optimization diagrams from the second round were obtained and the specific results are shown in Figure 3.
Figure 3 shows that the obtained sensory evaluation was better than the results of the first round, and the optimization points, curves, and straight lines were also more concentrated. The curve and straight line in Figure 3 are trend lines, both pointing to the optimum region, while the arrow on the abscissa that indicates that the optimum values are reliable. The optimum parameters for the second round were optimized as follows: sea buckthorn fruit powder content, 47.7%; erythritol content, 1.3%; acid base ratio, 1:1 (citric acid and sodium bicarbonate content, 46.1%); maltodextrin content, 2%; and polyvinylpyrrolidone content, 2.9%. Moreover, this result was basically consistent with the optimal process conditions of the first round of the randomized experiment.

3.3. Correlation Analysis of Sensory Evaluation Additive Content

In order to further understand the correlation between sensory evaluation score and the content of sea buckthorn fruit powder, aspartame, maltodextrin, polyvinylpyrrolidone, and acid base ratio, Pearson correlation analysis was conducted. The results are shown in Table 4.
Data in Table 4 showed that a significant negative correlation between sensory score and sea buckthorn fruit powder content existed (p < 0.05), but the sensory score was not significantly correlated with the content of erythritol, maltodextrin, and polyvinylpyrrolidone or the acid base ratio. Furthermore, the negative correlation between sea buckthorn fruit powder content and maltodextrin content (p < 0.05), as well as the positive correlation between maltodextrin content and polyvinylpyrrolidone content (p < 0.05), indicate that the powder content is the main factor influencing the sensory evaluation, and high content reduces the sensory score.

3.4. Product Validation Test

After two rounds of optimization, the optimal sensory score of the optimal proportioning ratio was 87.76. The appearance of the obtained product is uniform, complete and round; its surface is smooth; and no obvious spot exists. After dipping in water, it disintegrates rapidly and violently, the solution has a strong aroma of sea buckthorn, clear without sediment and impurities, and tastes good. The sample weight is 0.3 g, and the tablet weight difference, disintegration time limit, hardness, and other characteristics meet the requirements of the Pharmacopoeia of the People’s Republic of China [31].

3.5. Comparison Characteristics of Powder Effervescent Tablet

The nutritional components and characteristics of powder effervescent tablets were affected by different ingredients contents, so ascorbic acid, carotenoids, total phenol, total flavonoids content, hardness, and disintegration time limit of the obtained and commercial effervescent tablets were determined and compared in Table 5.
The contents of ascorbic acid, carotenoids, total phenols, and total flavonoids of the obtained effervescent tablets in this study were 50.36 mg/100 g, 10.18 mg/100 g, 11.52 mg/100 g, and 28.46 mg/g, respectively, higher than the corresponding values of 10.71%, 76.74%, 36.98%, and 51.62%, respectively. In addition, The moisture content was 2.13%, which met the requirements, namely ≤ 5%. The hardness of the obtained effervescent tablets was significantly lower than the commercial ones, while the disintegration time limit between the two had no significant difference. This difference may be related to the different processing methods and ingredient proportions.

4. Discussion

Sensory evaluation is one of the important evaluation indicators of product quality and is generally carried out using the traditional sensory scoring method, which is generally affected by the region, ethnicity, tasting environment, habits, hobbies, and psychology of individuals [32,33]. As a comprehensive sensory evaluation method with qualitative and objective advantages, fuzzy mathematics and sensory evaluation have been utilized in studies of jams, agricultural products, and Luzhou-flavor liquor [34,35,36,37]. Compared to the commonly used orthogonal experimental design and response surface methodology, RCO could optimize the process conditions with a small number of experiments and avoid dozens of single-factor experiments, especially for the optimization of experimental schemes with multiple factors [20].
In this study, the freeze-dried sea buckthorn fruit powder is used as a base for the preparation of sea buckthorn powder effervescent tablets due to its rich nutritional components. The random centroid methodology combined with the fuzzy mathematical sensory evaluation method was adopted to optimize the process of sea buckthorn fruit powder effervescent tablets. The additive contents of sea buckthorn fruit powder, erythritol, disintegrating agent, maltodextrin, and PVP were optimized using 24 runs, the same as the randomized mass wheels and trials number for the optimization of the safflower seed oil process (two rounds) [21]. Both studies proved that the scientific and efficient process optimization methods could be used to obtain the optimal formulation, providing the theoretical basis for subsequent industrial production.
Among the formula components used in the preparation of sea buckthorn effervescent tablets, the disintegrating agent is the most effective component; it reacts rapidly in the presence of water and releases carbon dioxide. Meanwhile, the powder content was the main factor for influencing the sensory evaluation and a high content reduced the sensory score, which may be related to the composition and content of flavoring components. In addition, this formula had more comprehensive ingredients than others, especially the choice of erythritol, which is healthier and safer than aspartame [38].
The components of the obtained product met the product requirements. The moisture content was within the appropriate range, reducing oxidative decomposition and microbial activity [10]. Higher contents of ascorbic acid (50.36 mg/100 g), carotenoids (10.18 mg/100 g), total phenol (11.52 mg/100 g), and total flavonoids (28.46 mg/g) were found compared to the commercial product of sea buckthorn effervescent tablets. Total flavonoid content was significantly higher than that of aronia melanocarpa (4.52 mg/g), while total phenolic content was lower than that of aronia melanocarpa (5.83 mg/g) and barberry juice powder (70.66 mg/100 g) [10,37]. Moreover, this product was rich in VC and carotenoids nutrients, existing in sea buckthorn fruit powder, but this has not been determined in most studies.
The physical characteristics of sea buckthorn effervescent tablets cannot be neglected, and the tablet hardness, considered as a reflection of the tablet ingredients density, is one of the effective and important factors in the disintegration process [39]. Higher hardness will help to reduce breakage during transportation and storage, and the hardness of this product was significantly harder than the barberry effervescent in reported research (39–45 N). For solubility analysis, the requirement for the dissolving time is less than 5 min in the pharmacopoeia [31], and the dissolving time of sea buckthorn effervescent tablets was much shorter than corresponding products of pita, pineapple, guava, mango, and stevia, which was in the range of 2–10 min in water and 4–12 min in saliva [40].

5. Conclusions

In this study, the process optimization of sea buckthorn fruit powder effervescent tablets was applied via the RCO method combined with fuzzy mathematical sensory evaluation for the first time. The highest fuzzy comprehensive sensory score was achieved, and the high-nutritional sea buckthorn effervescent tablet was obtained under the optimized conditions. This aspect of the research suggested that the optimization method can not only effectively solve the shortcomings of the traditional sensory scoring in terms of subjectivity and unilateralism, but also improve optimization efficiency and the quality of sea buckthorn effervescent tablets. Therefore, it can be applied as a new scientific and efficient approach for product process optimization. More research related to functional product development and evaluation methods needs to be conducted.

Author Contributions

Conceptualization, Y.M. and H.Y.; methodology, Y.L. and X.M.; software, Y.L. and M.X.; validation, X.M.; formal analysis, Y.L. and X.M.; investigation, Y.L.; resources, Y.M. and T.Z.; data curation, Y.M. and H.Y.; writing—draft preparation, Y.M.; writing—review and editing, H.Z.; visualization, H.Z.; supervision, H.Y. All authors have read and agreed to the published version of the manuscript.

Funding

This research was funded by special project for basic scientific activities of non-profit institutes supported the government of Xinjiang Uyghur Autonomous Region of funder, grant number: KY2022015; Special plan project of key R & D tasks in Xinjiang Uygur Autonomous Region, grant number: 2022B02005-3.

Data Availability Statement

The research created experimental data that can be found in the tables and figures presented in this manuscript.

Acknowledgments

The authors thank the Science & Department of Xinjiang Uygur Autonomous Region for the financial support given through the Project KY2022015 and 2022B02005-3. Yan Ma wishes to thank Xinjiang Seabuckthorn Engineering Technology Research Center, Xinjiang Kangyuan Biotechnology Co., Ltd. and Xinjiang Huihua Seabuckthorn Biotechnology Co., Ltd. for providing experimental materials and platforms.

Conflicts of Interest

The authors declare no conflict of interest.

References

  1. Ficzek, G.; Mátravölgyi, G.; Furulyás, D.; Rentsendavaa, C.; Jócsák, I.; Papp, D.; Simon, G.; Végvári, G.Y.; Stéger-Máté, C.D. Analysis of bioactive compounds of three sea buckthorn cultivars (Hippophaë rhamnoides L.‘Askola’,‘Leikora’, and ‘Orangeveja’) with HPLC and spectrophotometric methods. Eur. J. Hortic. Sci. 2019, 84, 31–38. [Google Scholar] [CrossRef]
  2. Rousi, A. The genus Hippophae, L. A taxonomic study. Ann. Bot. Fenn. 1971, 8, 177–227. [Google Scholar]
  3. Sundaram, M.S.; Iarahath, K.; Bawa, A.S. Development of sea buckthorn mixed fruit jelly. Int. J. Food Sci. Technol. 2007, 42, 403–410. [Google Scholar] [CrossRef]
  4. Sayegh, M.; Miglio, C.; Ray, S. Potential cardiovascular implications of Sea Buckthorn berry consumption in humans. Int. J. Food Sci. Nutr. 2014, 65, 521–528. [Google Scholar] [CrossRef]
  5. Tiitinen, K.M.; Hakala, M.A.; Kallio, H.P. Quality components of sea buckthorn (Hippophae rhamnoides) varieties. J. Agric. Food Chem. 2005, 53, 1692–1699. [Google Scholar] [CrossRef]
  6. Kanayama, Y.; Kato, K.; Stobdan, T.; Galitsyn, G.G.; Kochetov, A.V.; Kanahama, K. Research progress on the medicinal and nutritional properties of sea buckthorn (Hippophae rhamnoides)—A review. J. Hortic Sci. Biotechnol. 2012, 87, 203–210. [Google Scholar] [CrossRef]
  7. Zielińska, A.; Nowak, I. Abundance of active ingredients in sea-buckthorn oil. Lipids Health Dis. 2017, 16, 95. [Google Scholar] [CrossRef]
  8. Socaci, S.A.; Socaciu, C.; Tofană, M.; Raţi, I.V.; Pintea, A. In-tube extraction and GC–MS analysis of volatile components from wild and cultivated sea buckthorn (Hippophae rhamnoides L. ssp. Carpatica) berry varieties and juice. Phytochem. Anal. 2013, 24, 319–328. [Google Scholar] [CrossRef]
  9. Ciesarová, Z.; Murkovic, M.; Cejpek, K.; Kreps, F.; Tobolková, B.; Koplík, R.; Belajová, E.; Kukurová, K.; Daško, Ľ.; Panovská, Z.; et al. Why is sea buckthorn (Hippophae rhamnoides L.) so exceptional? A review. Food Res. Int. 2020, 133, 109–170. [Google Scholar] [CrossRef]
  10. Naji-Tabasi, S.; Emadzadeh, B.; Shahidi-Noghabi, M.; Abbaspour, M.; Akbari, E. Physico-chemical and antioxidant properties of barberry juice powder and its effervescent tablets. Chem. Biol. Technol. Age 2021, 8, 1–11. [Google Scholar] [CrossRef]
  11. Saifullah, M.; Yusof, Y.A.; Chin, N.L.; Aziz, M.G.; Mohammed, M.A.P.; Aziz, N.A. Tableting and dissolution characteristics of mixed fruit powder. Agric. Agric. Sci. Procedia 2014, 2, 18–25. [Google Scholar] [CrossRef]
  12. Yousefi, S.; Emam-Djomeh, Z.; Mousavi, S.M. Effect of carrier type and spray drying on the physicochemical properties of powdered and reconstituted pomegranate juice (Punica granatum L.). J. Food Sci. Technol 2011, 48, 677–684. [Google Scholar] [CrossRef] [PubMed]
  13. Ong, M.Y.; Yusof, Y.A.; Aziz, M.G.; Chin, N.L.; Amin, N.A. Characterisation of fast dispersible fruit tablets made from green and ripe mango fruit powders. J. Food Eng. 2014, 125, 17–23. [Google Scholar] [CrossRef]
  14. Zea, L.P.; Yusof, Y.A.; Aziz, M.G.; Ling, C.N.; Amin, N.A.M. Compressibility and dissolution characteristics of mixed fruit tablets made from guava and pitaya fruit powders. Powder Technol. 2013, 247, 112–119. [Google Scholar] [CrossRef]
  15. Saifullah, M.; Yusof, Y.A.; Chin, N.L.; Aziz, M.G.; Mohammed, M.A.P.; Aziz, N.A. Dissolution profling and its comparison of natural fruit powder effervescent tablets. J. Food Eng. 2016, 178, 60–70. [Google Scholar] [CrossRef]
  16. Naji-Tabasi, S.; Emadzadeh, B.; Shahidi-Noghabi, M.; Abbaspour, M.; Akbari, E. Physico-chemical properties of powder and compressed tablets based on barberry fruit pulp. J. Food Meas. Charact. 2021, 15, 2469–2480. [Google Scholar] [CrossRef]
  17. Yusof, Y.A.; Mohd Salleh, F.S.; Chin, N.L.; Talib, R.A. The drying and tabletting of pitaya powder. J. Food Process Eng. 2012, 35, 763–771. [Google Scholar] [CrossRef]
  18. Pushkar, S.; Sachan, N.K.; Ghosh, S.K. Pharmacotechnical Assessment of Processed Watermelon Flesh as Novel Tablet Disintegrant. Chemistry of Phytopotentials: Health, Energy and Environmental Perspectives; Khemani, L.D., Srivastava, M.M., Srivastava, S., Eds.; Springer: Berlin/Heidelberg, Germany, 2012; pp. 159–163. [Google Scholar]
  19. Rahardjo, B.; Noor, Z. Optimization of processing technique of the fruit juice effervescent tablet with response surface method. J. Teknol. San. Industri. Pangan. 2009, 20, 25–31. [Google Scholar]
  20. Xin, L.; Guo, L.; Edirs, S.; Zhang, Z.; Cai, C.; Yang, Y.; Lian, Y.; Yang, H. An Efficient Deacidification Process for Safflower Seed Oil with High Nutritional Property through Optimized Ultrasonic-Assisted Technology. Molecules 2022, 27, 2305. [Google Scholar] [CrossRef]
  21. Bao, J.; Zhang, X. Mixed fermentation of Spirulina platensis with Lactobacillus plantarum and Bacillus subtilis by random-centroid optimization. Food Chem. 2018, 264, 64–72. [Google Scholar] [CrossRef]
  22. Rahman, Z.; Zidan, A.S.; Korang-Yeboah, M.; Yang, Y.; Siddiqui, A.; Shakleya, D.; Khan, M.A.; Cruz, C.; Ashraf, M. Effects of excipients and curing process on the abuse deterrent properties of directly compressed tablets. Int. J. Pharmaceut. 2017, 517, 303–311. [Google Scholar] [CrossRef]
  23. Rahman, Z.; Yang, Y.; Korang-Yeboah, M.; Siddiqui, A.; Xu, X.M.; Ashraf, M.; Khanet, M.A. Assessing impact of formulation and process variables on in-vitro performance of directly compressed abuse deterrent formulations. Int. J. Pharmaceut. 2016, 502, 138–150. [Google Scholar] [CrossRef]
  24. Dou, J.; Toma, S.; Nakai, S. Random-centroid optimization for food formulation. Food Res. Int. 1993, 26, 27–37. [Google Scholar] [CrossRef]
  25. Uscanga, M.A.; Salvador, A.; Camacho, M.D.M. Impact of freeze-drying shelf temperature on the bioactive compounds, physical properties and sensory evaluation of a product based on orange juice. Int. J. Food Sci. Technol. 2021, 56, 5409–5416. [Google Scholar] [CrossRef]
  26. Oruña-Concha, M.J.; Gonzalez-Castro, M.J.; Lopez-Hernandez, J.; Simal-Lozano, J. Monitoring of the vitamin C content of frozen green beans and Padrón peppers by HPLC. J. Sci. Food Agric. 1998, 76, 477–480. [Google Scholar] [CrossRef]
  27. Vazquez Oderiz, M.L.; Vazquez Blanco, M.E.; Lopez Hernandez, J.; Simal Lozano, J.; Romero Rodriguez, M.A. Simultaneous determination of organic acids and vitamin C in green beans by liquid chromatography. J. AOAC Int. 1994, 77, 1056–1059. [Google Scholar] [CrossRef] [PubMed]
  28. Korekar, G.; Dolkar, P.; Singh, H.; Srivastava, R.B.; Stobdan, T. Variability and the genotypic effect on antioxidant activity, total phenolics, carotenoids and ascorbic acid content in seventeen natural population of Seabuckthorn (Hippophae rhamnoides L.) from trans-Himalaya. LWT-Food Sci. Technol. 2014, 55, 157–162. [Google Scholar] [CrossRef]
  29. Cao, X.; Zhang, Y.; Zhang, F.; Wang, Y.; Yi, J.; Liao, X. Effects of high hydrostatic pressure on enzymes, phenolic compounds, anthocyanins, polymeric color and color of strawberry pulps. J. Sci. Food Agric. 2011, 91, 877–885. [Google Scholar] [CrossRef] [PubMed]
  30. Choi, S.H.; Ahn, J.B.; Kim, H.J.; Im, N.K.; Kozukue, N.; Levin, C.E.; Friedman, M. Changes in Free Amino Acid, Protein, and Flavonoid Content in Jujube (Ziziphus jujube) Fruit during Eight Stages of Growth and Antioxidative and Cancer Cell Inhibitory Effects by Extracts. J. Agric. Food Chem. 2012, 60, 10245–10255. [Google Scholar] [CrossRef]
  31. National Pharmacopoeia Committee. The Pharmacopoeia of the People’s Republic of China, 4th ed.; China Medical Science and Technology Press: Beijing, China, 2015; pp. 3–4. [Google Scholar]
  32. Cheng, P.; Fan, W.; Xu, Y. Quality grade discrimination of Chinese strong aroma type liquors using mass spectrometry and multivariate analysis. Food Res. Int. 2013, 542, 1753–1760. [Google Scholar] [CrossRef]
  33. Mukhopadhyay, S.; Majumdar, G.; Goswami, T.; Mishra, H. Fuzzy logic (similarity analysis) approach for sensory evaluation of chhana podo. LWT-Food Sci. Technol. 2013, 53, 204–210. [Google Scholar] [CrossRef]
  34. Xu, W.; Wang, B.; Zhang, H. Research on data fusion algorithm based on fuzzy mathematics and principal component analysis. Adv. Appl. Math. 2019, 8, 953–957. [Google Scholar] [CrossRef]
  35. Shinde, S.; Kulkarni, U. Extracting classification rules from modified fuzzy min–max neural network for data with mixed attributes. Appl. Soft Comput. 2016, 40, 364–378. [Google Scholar] [CrossRef]
  36. Cheng, H.; Xing, J.; Zheng, R. Comprehensive safety risk assessment of pesticide residues in agricultural products based on entropy-fuzzy analysis. J. Food Sci. Technol. 2021, 21, 331–339. [Google Scholar] [CrossRef]
  37. Liu, Y.; Qiao, Z.; Zhao, Z.; Wang, X.; Sun, X.; Han, S.; Pan, C. Comprehensive evaluation of Luzhou-flavor liquor quality based on fuzzy mathematics and principal component analysis. Food Sci. Nutr. 2022, 10, 1780–1788. [Google Scholar] [CrossRef] [PubMed]
  38. Wu, S.; Yuan, Y.; Yin, J.; Hu, H.; Pei, H.; Li, W.; Zhang, X. Characteristics of effervescent tablets of Aronia melanocarpa: Response surface design and antioxidant activity evaluation. J. Food Meas. Charact. 2022, 16, 2969–2977. [Google Scholar] [CrossRef]
  39. Patel, S.G.; Siddaiah, M. Formulation and evaluation of effervescent tablets: A review. J. Drug Deliv. Therapeutics. 2018, 8, 296–303. [Google Scholar] [CrossRef]
  40. Saifullah, M.; Yusof, Y.; Chin, N.; Aziz, M. Physicochemical and flow properties of fruit powder and their effect on the dissolution of fast dissolving fruit powder tablets. Powder Technol. 2016, 301, 396–404. [Google Scholar] [CrossRef]
Figure 1. Preparation process flow chart of sea buckthorn effervescent tablets.
Processes 11 02639 g001
Figure 2. Mapping results of drawn by RCO in the first round. (ae) mapping optimization of the effect of sea buckthorn fruit powder content, erythritol content, acid base ratio, maltodextrin content and polyvinylpyrrolidone content, respectively, based on sensory score.
Processes 11 02639 g002
Figure 3. Mapping results of drawn by RCO in the second round. (ae) mapping optimization of the effect of sea buckthorn fruit powder content, erythritol content, acid base ratio, maltodextrin content and polyvinylpyrrolidone content, respectively, based on sensory score.
Processes 11 02639 g003
Table 1. Sensory evaluation standard.
Evaluating IndicatorEvaluation StandardGradeScore
Effervescent tablet appearanceSmooth, uniform in color, and no abnormalityGood16–20
Relatively complete and smooth, with uniform color and a few spotsMedium10–15
Not smooth, with spots, loose or hardPoor~10
Beverage appearanceBright light yellow, uniform and clear, without precipitation and good dissolutionGood16–20
Light in color, slightly turbid, slightly precipitated, and has good solubilityMedium10–15
Dark in color, turbid, precipitated and poor in solubilityPoor~10
TasteSweet and sour, with strong aroma Good16–20
Sour or sweet, and the aroma is not strongMedium10–15
Slightly bitter and astringent, without flavorPoor~10
Effervescent effectViolent and rapid, and the foaming amount is largeGood16~20
Violent and slightly rapid, and the foaming amount is slightly largeMedium10–15
Not violent and the foaming amount is smallPoor~10
DisintegrationRapid disintegration and short timeGood16–20
Rapid disintegration and relatively short timeMedium10–15
Slow disintegration speed and long timePoor~10
Table 2. The first round of experiments of RCO.
Optimization CyclesExperiment
Number
Sea Buckthorn Fruit Powder Content
(%)
Erythritol
Content
(%)
Acid Base
Ratio
Maltodextrin Content
(%)
Polyvinylpyrrolidone Content
(%)
Sensory Evaluation
Score
The first round 166.21.11.2:11.93.266.63
257.01.90.8:12.84.977.45
355.00.61.1:12.02.880.84
450.31.40.9:12.32.275.10
564.41.20.7:10.91.967.12
662.10.81.2:12.32.871.55
739.721.3:12.84.172.67
856.52.30.8:12.51.268.61
935.42.31.2:10.82.973.30
1039.92.31.3:10.61.971.36
Centroid search1147.51.61.1:12.13.482.69
1252.01.41:12.03.169.43
1352.81.31.12.43.478.41
1449.81.51.12.13.579.64
Table 3. The second round of experiments of RCO.
Optimization CyclesExperiment
Number
Sea Buckthorn Fruit Powder Content
(%)
Erythritol
Content
(%)
Acid Base
Ratio
Maltodextrin Content
(%)
Polyvinylpyrrolidone Content
(%)
Sensory Evaluation
Score
The second round1559.70.70.9:11.72.463.51
1654.31.00.9:11.81.884.92
1755.91.30.8:11.83.674.30
1845.81.21.2:11.72.480.96
1941.31.10.8:12.23.586.31
2040.30.71.1:12.53.576.10
Centroid search2148.81.11:122.883.48
2247.71.31:122.987.76
2349.61.21:12376.84
2449.21.11:122.886.11
Table 4. Correlation analysis of sensory evaluation.
Sensory Evaluation Sensory ScoreSea Buckthorn Fruit Powder Content
(%)
Erythritol
Content
(%)
Acid Base
Ratio
Maltodextrin
Content
(%)
Polyvinylpyrrolidone Content
(%)
Sensory score1
Sea buckthorn fruit powder content−0.531 *1
Erythritol
content
0.540−0.0331
Acid base
ratio
0.100−0.417−0.0781
Maltodextrin
Content
0.250−0.778 **−0.2910.1121
Polyvinylpyrrolidone content−0.0380.4590.145−0.2310.627 *1
* indicates significant correlation (p < 0.05); ** indicates extremely significant correlation (p < 0.01).
Table 5. Comparison of nutritional components and characteristics.
Water Content
(%)
Ascorbic Acid
(mg/100 g)
Carotenoids
(mg/100 g)
Total Phenol
(mg/100 g)
Total Flavonoids
(mg/g)
Hardness
(N)
Disintegration Time Limit
(s)
Obtained effervescent tablets2.13 ± 0.15 a50.36 ± 0.04 a10.18 ± 0.14 a11.52 ± 0.13 a28.46 ± 0.11 a68.40 ± 0.73 b10.05 ± 0.15 a
Commercially available1.59 ± 0.37 b45.49 ± 0.55 b5.76 ± 0.18 b7.26 ± 0.05 b18.77 ± 0.36 b80.85 ± 0.93 a10 ± 0.13 a
Results obtained from the tests we carried out. Different superscript letters within columns are significantly different (p < 0.05).
Disclaimer/Publisher’s Note: The statements, opinions and data contained in all publications are solely those of the individual author(s) and contributor(s) and not of MDPI and/or the editor(s). MDPI and/or the editor(s) disclaim responsibility for any injury to people or property resulting from any ideas, methods, instructions or products referred to in the content.

