Abstract
There is a problem of a rapid decline in production caused by the repeated heating of the near-wellbore zone during steam stimulation. Finding a suitable foam system to expand the area of the steam chamber and slow down the rapid production of hot water during the recovery process can effectively improve the effect of steam stimulation. In this paper, CGS foam was prepared with high-temperature-resistant surfactant GD, graphite particles, and clay particles. Through the study of foam properties, it was found that with the addition of particles, the strength of the foam’s liquid film, half-life time, and temperature resistance was greatly improved. The appropriate permeability of the CGS foam and the movement characteristics of it in formations with different permeabilities were studied through a plugging experiment with a sand pack. The plugging performances of the GD foam, CGS foam, and pure particles in a simulated reservoir were compared. The development of the steam cavity during the steam stimulation process and the influence of injecting GD foam and CGS foam on the flow in the simulated reservoir were studied through a two-dimensional visualization model. The temperature resistance and stability of the CGS foam were better than those of GD foam in the simulated formation.
1. Introduction
At present, the oil demand in the international market is still growing steadily. The development prospects of heavy oil resources, which account for about 60–70% of the world’s total oil reserves, are promising [1]. Due to the high viscosity characteristics of heavy oil, its extraction process faces greater challenges. Heat injection is considered to be the most effective technical measure to recover heavy oil. Typical heat recovery technologies include steam-assisted gravity drainage (SAGD) [2,3], steam flooding [4,5], oil reservoir combustion technology [6], cyclic steam stimulation (CSS), etc. [7]. The cyclic steam injection method (CSS), also known as steam huff and puff, originated in the Maracaibo Lake Oilfield in Venezuela [8]. CSS has been widely used in oilfields in North America and the Liaohe Oilfield in China. About 80% of heavy oil in China is produced via CSS [9]. Thus far, various new technologies for heavy oil recovery have emerged one after another, but steam huff and puff is still the most effective and common method for heavy oil recovery [10,11,12,13].
CSS mainly includes three stages: steam injection, well soaking, and production. When the output rate of crude oil decreases to a certain limit, the production process of that cycle ends. Then, the steam injection process for the next cycle begins [11,14]. The heating radius is an important index for describing the effect of steam stimulation. The effective heating radius of steam stimulation is generally 20–30 m. The oil saturation of the reservoir outside the effective heating radius remains in its original state. The first few cycles of steam huff and puff are the main process of increasing the radius of the steam region. Excessive rounds of steam injection will only repeatedly heat the affected area [15,16].
After multiple rounds of steam huff and puff, a water flow channel with high permeability is formed near the bottom of the well. After the completion of soaking, more high-temperature water is quickly extracted, resulting in the rapid loss of heat and pressure [3,17,18,19]. After several cycles of steam stimulation, the reservoir pressure at the bottom of the well is reduced to 25–40% of the initial reservoir pressure [20,21].
Relevant studies have shown that, due to the existence of the Jamin effect, the foam injected into the reservoir can effectively seal the large pores in the reservoir and improve the oil–water mobility ratio in the reservoir [22,23,24]. At the same time, surfactants can reduce the interfacial tension of oil and water after the foam bursts and promote the emulsification of crude oil [25]. Even for high-temperature-resistant foam, the performance of the foam will inevitably decline with the increase in temperature under high-temperature conditions [26]. The addition of solid particles can improve the stability of the foam, and these particles can stay in the reservoir to improve the long-term plugging effect. SiO2 nanoparticles, fly ash, cement, and clay are commonly used solid particles for improving the stability of three-phase foam [23,24,27].
The research on the three-phase foam system has confirmed that this system can be used in a reservoir to plug the high-permeability area. Solid particles can stabilize the foam [28,29] and, on the other hand, the foam can also carry the particles into the deep reservoir. Heavy oil reservoirs developed via cyclic steam huff and puff have the characteristics of high temperatures above 200 °C and high reservoir permeability. Therefore, the selected plugging agent system is required to have good plugging ability and temperature resistance [30,31]. The solid particles in the three-phase foam system can effectively improve the stability of the foam and, after the foam collapses, the solid particles can be retained in the reservoir to continue plugging without being affected by high temperatures [32].
The three-phase foam system is an effective method for enhancing oil recovery in the CCS process. The selected three-phase foam should have sufficient stability and temperature resistance, and the most important thing is that the three-phase foam should be an excellent match for the permeability of the reservoir. The three-phase foam, which has been comprehensively tested and analyzed, can be successfully injected into the deep reservoir during the CSS process to effectively enhance oil recovery. In this paper, graphite particles and clay-stabilized foam were studied. Graphite particles can be separated into smaller layered structures through ultrasonic dispersion. This material has excellent dispersibility and high stability when mixed with clay particles. There is little research on the use of graphite particles in reservoir water plugging. Thus, a series of exploratory studies have been conducted in this paper. A suitable surfactant and three-phase foam made of clay and graphite particles were prepared, and the water plugging effect of the foam during the cyclic steam stimulation process was tested.
2. Experiments
2.1. Materials
The viscosity of the crude oil used in the experiment was 352 mPa.s (@ 50 °C), and the density was 0.92 g/cm3 (@ 25 °C). The main component of surfactants was sulfonates and was named GD. Crude oil and GD surfactant were provided by Shengli Oil Field Research Institute. The water was deionized water made by a UPT water purification system (Ulupure Inc., Chengdu, China). Nitrogen (purity > 99.9%, Tianyuan Gas Co., Ltd., Shanghai, China).
The size of graphite particles with 5000 mesh dose did not exceed 2.6 μm (Qingdao Tianshengda Co., Ltd., Qingdao, China). The particle size of clay particles did not exceed 2.6 μm. The dispersant of the particles was sulfonated lignins with a molecular weight of 3000–4000. These two drugs were from the Shengli Oilfield Research Institute.
2.2. Preparation of CGS Dispersion
To attain a homogeneous foam system, the following steps are imperative:
Commence by incorporating 6 wt% of 5000 mesh graphite particles into either pure water or brine. Employ an ultrasonic oscillation device to disperse these particles for a duration of two hours. Simultaneously, introduce a specific quantity of surfactant at multiple intervals. Next, prepare a 4 wt% clay dispersion without the inclusion of surfactants using the same dispersion methodology. Subsequently, combine the two solutions in a 1:1 ratio and introduce a specific quantity of lignosulfonates. Continue the process of ultrasonic dispersion for a period of 30 min. Throughout this entire process, maintain a cold water bath environment to ensure that the solution’s temperature remains below 40 °C. Within the scope of this study, the composite surfactant solution of clay and graphite was composed of 2 wt% clay and 3 wt% graphite. Moreover, it encompassed a specific concentration of GD surfactants and lignosulfonates, designated as CGS. Subsequently, CGS foam was harnessed as the medium for conducting a comprehensive array of experimental investigations.
2.3. Preparation and Characterization of Foams
2.3.1. Viscosity Testing of Dispersions
The dispersion of CGS was added to the sample cell of a rotary rheometer (MCR 302, Anton Paar, Graz, Austria), and a concentric cylinder module was employed to precisely assess the viscosity of the dispersion. The rotational speed of the rotor was maintained at 10 revolutions per minute (r/min), while the temperature was consistently controlled to reflect ambient conditions.
2.3.2. Optimizing the Foam System
The prepared GD surfactant solution or CGS solution was tested using the Waring Blender method [23]. A total of 100 mL of the dispersion was stirred at a rate of 8000 r/min for a duration of 180 s using a stirrer (GJ-3S, Qingdao Senxin Machinery Equipment Co., Ltd., Qingdao, China). The resulting foam was subsequently introduced into a sealed graduated cylinder, and the volume of the foam and the time required for 50 mL of liquid to separate from the bottom of the graduated cylinder were recorded.
2.3.3. Properties of Liquid Film
The surface dilational viscoelasticity (E) of the dispersion was evaluated utilizing a drop tensiometer (Tracker-H, TECLIS, Civrieux-d’Azergues, France). The interfacial tensiometer was predominantly composed of a high-temperature and high-pressure droplet system, an advanced image-acquisition system, and image analysis software. The CGS dispersion was introduced into the syringe. Conforming to pre-established parameters, a droplet with a volume of 3–6 μL was automatically formed at the terminal point of the syringe by the droplet system. The image acquisition system captured and documented the relevant volume and area parameters of the droplet. Subsequently, following a 30-minute period of stabilized droplet existence, the dedicated testing software undertook automatic computation and comprehensive analysis of the interfacial tension (F). In accordance with the predetermined parameters, the automated control system orchestrated the syringe to induce periodic oscillation of the droplet’s volume. The amplitude of this oscillation remained consistently set at 10% of the droplet’s volume, and the oscillation frequency was 0.1 Hz. Throughout this process, the image acquisition system recorded the dynamic correlation between the surface tension (F) of the liquid film and the corresponding area (A) of the oscillating droplet. By invoking Gibbs Formula (Equation (1)), the surface dilational viscoelasticity (E) of the interface can be calculated.
The surface dilational viscoelasticity served as a pivotal metric for assessing the resilience of the liquid film. Notably, a heightened value of this parameter corresponded to an elevated level of stability exhibited by the liquid film [24].
2.4. Sand Pack Experiments
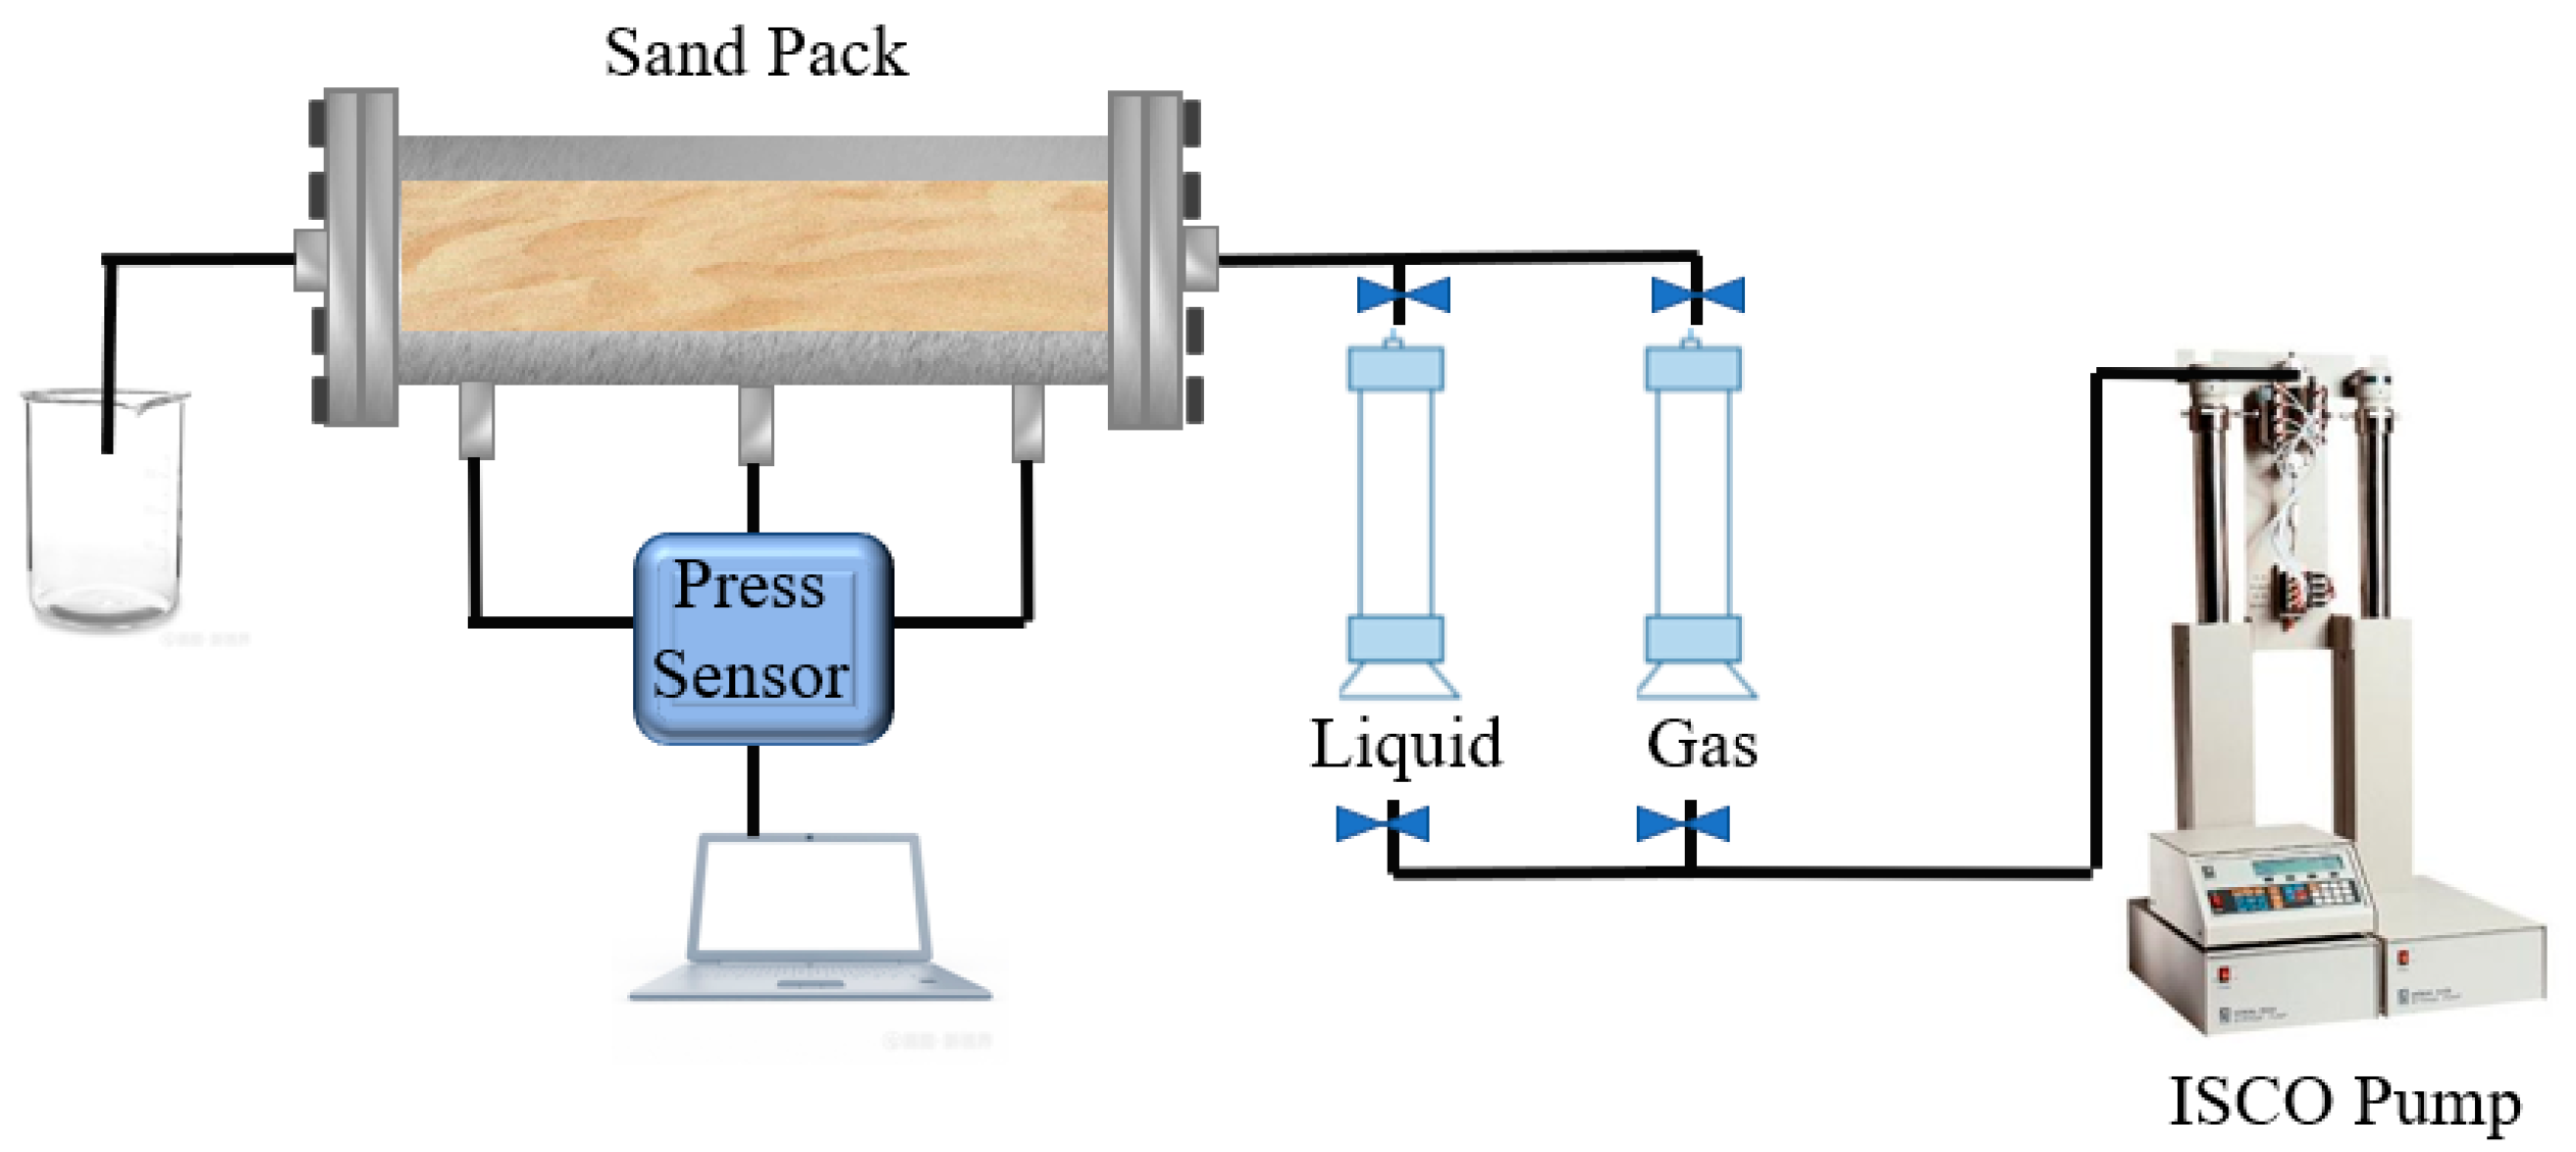
Sand pack experiments were conducted to assess the optimal range of formation permeability for CGS foam and to evaluate the plugging performance of both CGS foam and pure GD-1 foam under high-temperature conditions. The experimental setup is shown in Figure 1. Various grades of quartz sand were blended and introduced into a sand filling tube measuring 2.5 cm in diameter and 60 cm in length. Detailed parameters for each experimental set are provided in Table 1. Initially, the sand pack was saturated with brine, and, subsequently, the pore volume and permeability of the sand pack were determined. In the subsequent step, a back pressure of 1 MPa was applied. The sand-filled conduit was then heated to the designated temperature and maintained at that level for a duration of 3 h. In the third phase, adhering to the prescribed injection rate and gas–liquid ratio, the gas–liquid mixture was introduced simultaneously into the foam generator, subsequently flowing into the sand-filled conduit. Throughout this progression, pressure measurements were recorded at the leading, midpoint, and trailing sections of the sand-filled conduit.

Figure 1.
Schematic diagram of sand pack experiment.

Table 1.
The experimental conditions of foam flooding in sand packs.
2.5. Two-Dimensional Visualization Simulation Experiments
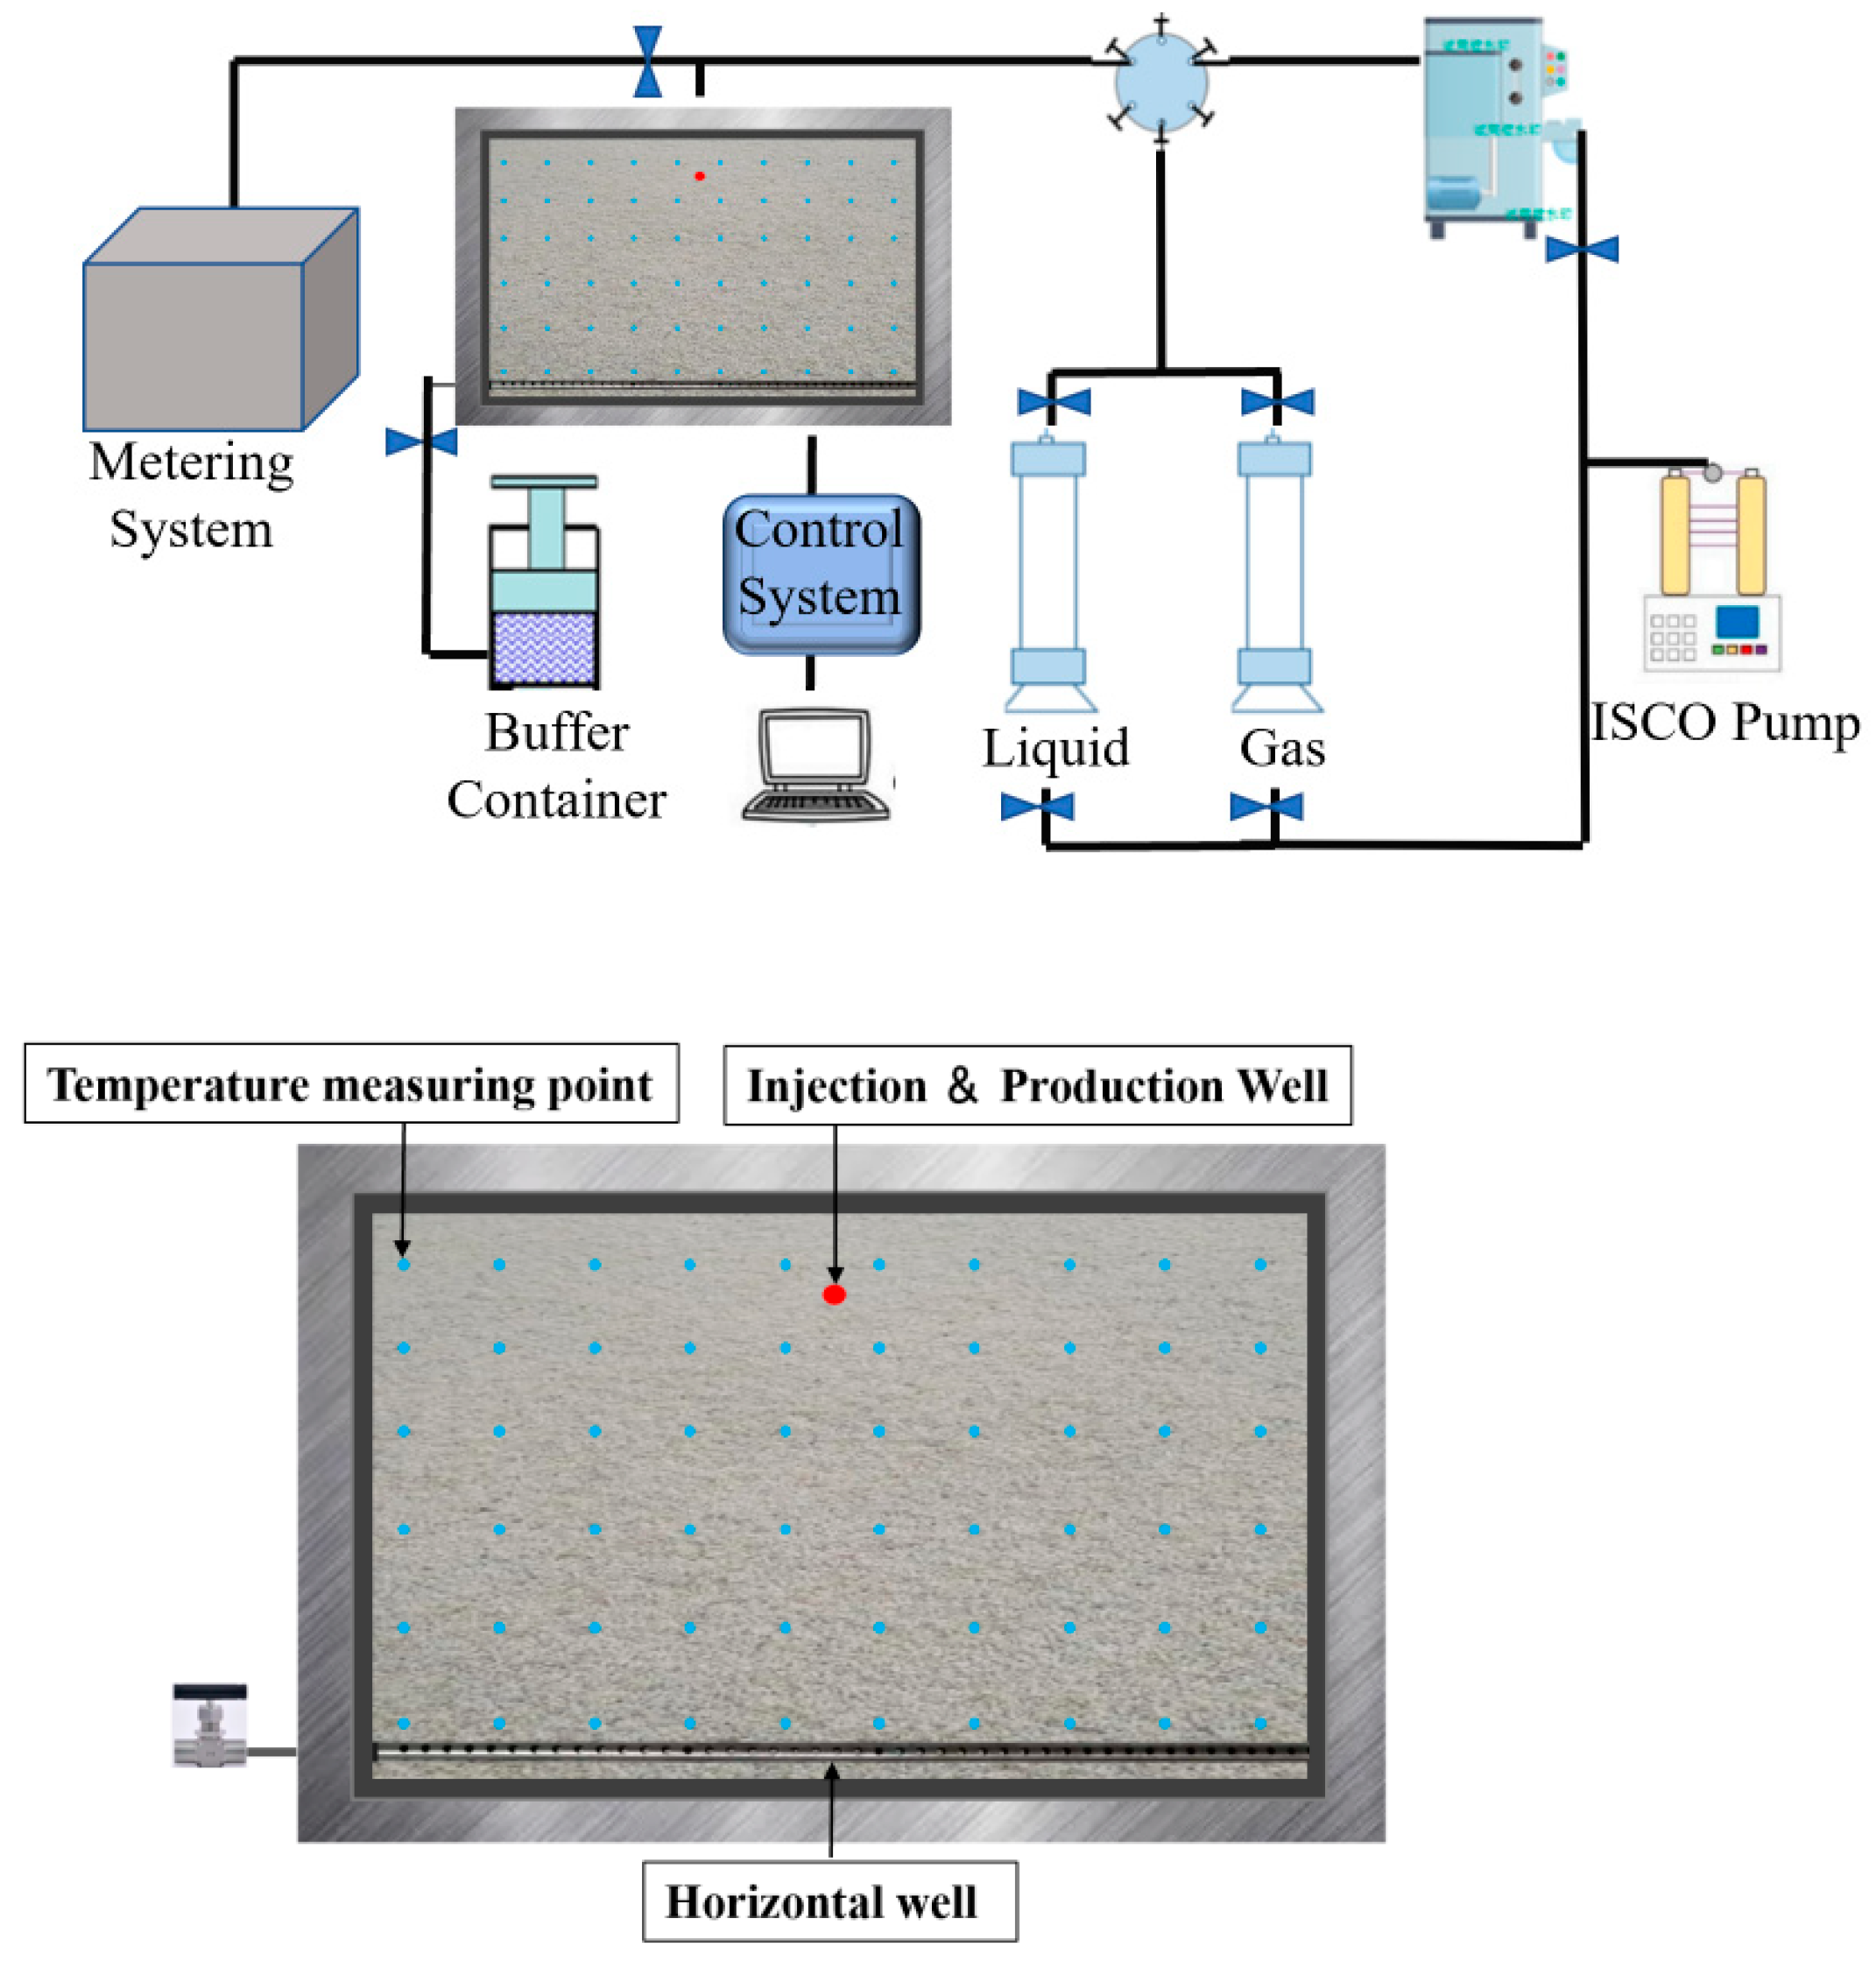
In the presented two-dimensional panel model, it becomes feasible to directly observe the oil recovery augmentation brought about by both GD foam and CGS foam within the simulated reservoir during the steam huff and puff procedure. Through the analysis of production data and fluctuations in the temperature field, the distinctions and underlying factors of these two foam types’ characteristics were examined. The configuration of the experimental apparatus is depicted in Figure 2.

Figure 2.
Schematic diagram of the 2D visualization experiment.
- (1)
- Fill the formulation of 4000 mD permeability quartz sand used in the sand filling tube experiment into the two-dimensional flat plate model. Verify the integrity of the unit, subsequently employing separate models for brine and crude oil saturation. The lower extremity of the flat plate features a horizontal well, establishing a linkage to an infinitely extensive reservoir maintained at a consistent pressure of 1 MPa. The production well connects to a back pressure valve, which is regulated to maintain a back pressure of 1.1 MPa. The apparatus temperature is stabilized at 80 °C.
- (2)
- Set up the experimental apparatus as illustrated in the diagram and execute a series of four steam-stimulation cycles. During each cycle, introduce 150 mL of steam through the production well at a rate of 10 mL/min, maintaining a steam temperature of 250 °C. The base water pressure is kept constant at 1 MPa. Allow for a 30-min soaking period. Following well opening, employ a steady-flow pump to administer 400 mL of liquid through the horizontal well at a rate of 10 mL/min, mimicking the recovery process. Repeat this procedure for a total of 4 cycles.
- (3)
- Implement two cycles of pure GD foam profile control. During each cycle, introduce 150 mL of steam followed by 150 mL of foam through the production well. Maintain a gas–liquid ratio of 2:1 and an injection rate of 10 mL/min to uphold a constant bottom water pressure of 1 MPa. Subsequently, cease the injection of bottom water at constant pressure, and introduce 550 mL of formation water through the horizontal well at a rate of 10 mL/min for displacement. Production takes place under a back pressure of 1 MPa at the wellhead of the production well. Proceed with two cycles of enhanced syntactic foam profile control. In each cycle, inject 150 mL of steam through the production well, followed by the injection of 150 mL of CGS foam at a gas–liquid ratio of 2:1, maintaining an injection rate of 10 mL/min and a constant bottom water pressure of 1 MPa to initiate well operations. Upon completion, discontinue the constant bottom water pressure, introduce 550 mL of simulated formation water through the horizontal well at a rate of 10 mL/min for displacement, and conduct production under a wellhead back pressure of 1 MPa.
3. Results and Discussion
3.1. Analysis of CGS Dispersion Properties
3.1.1. Dispersion Viscosity and Particle Size Distribution
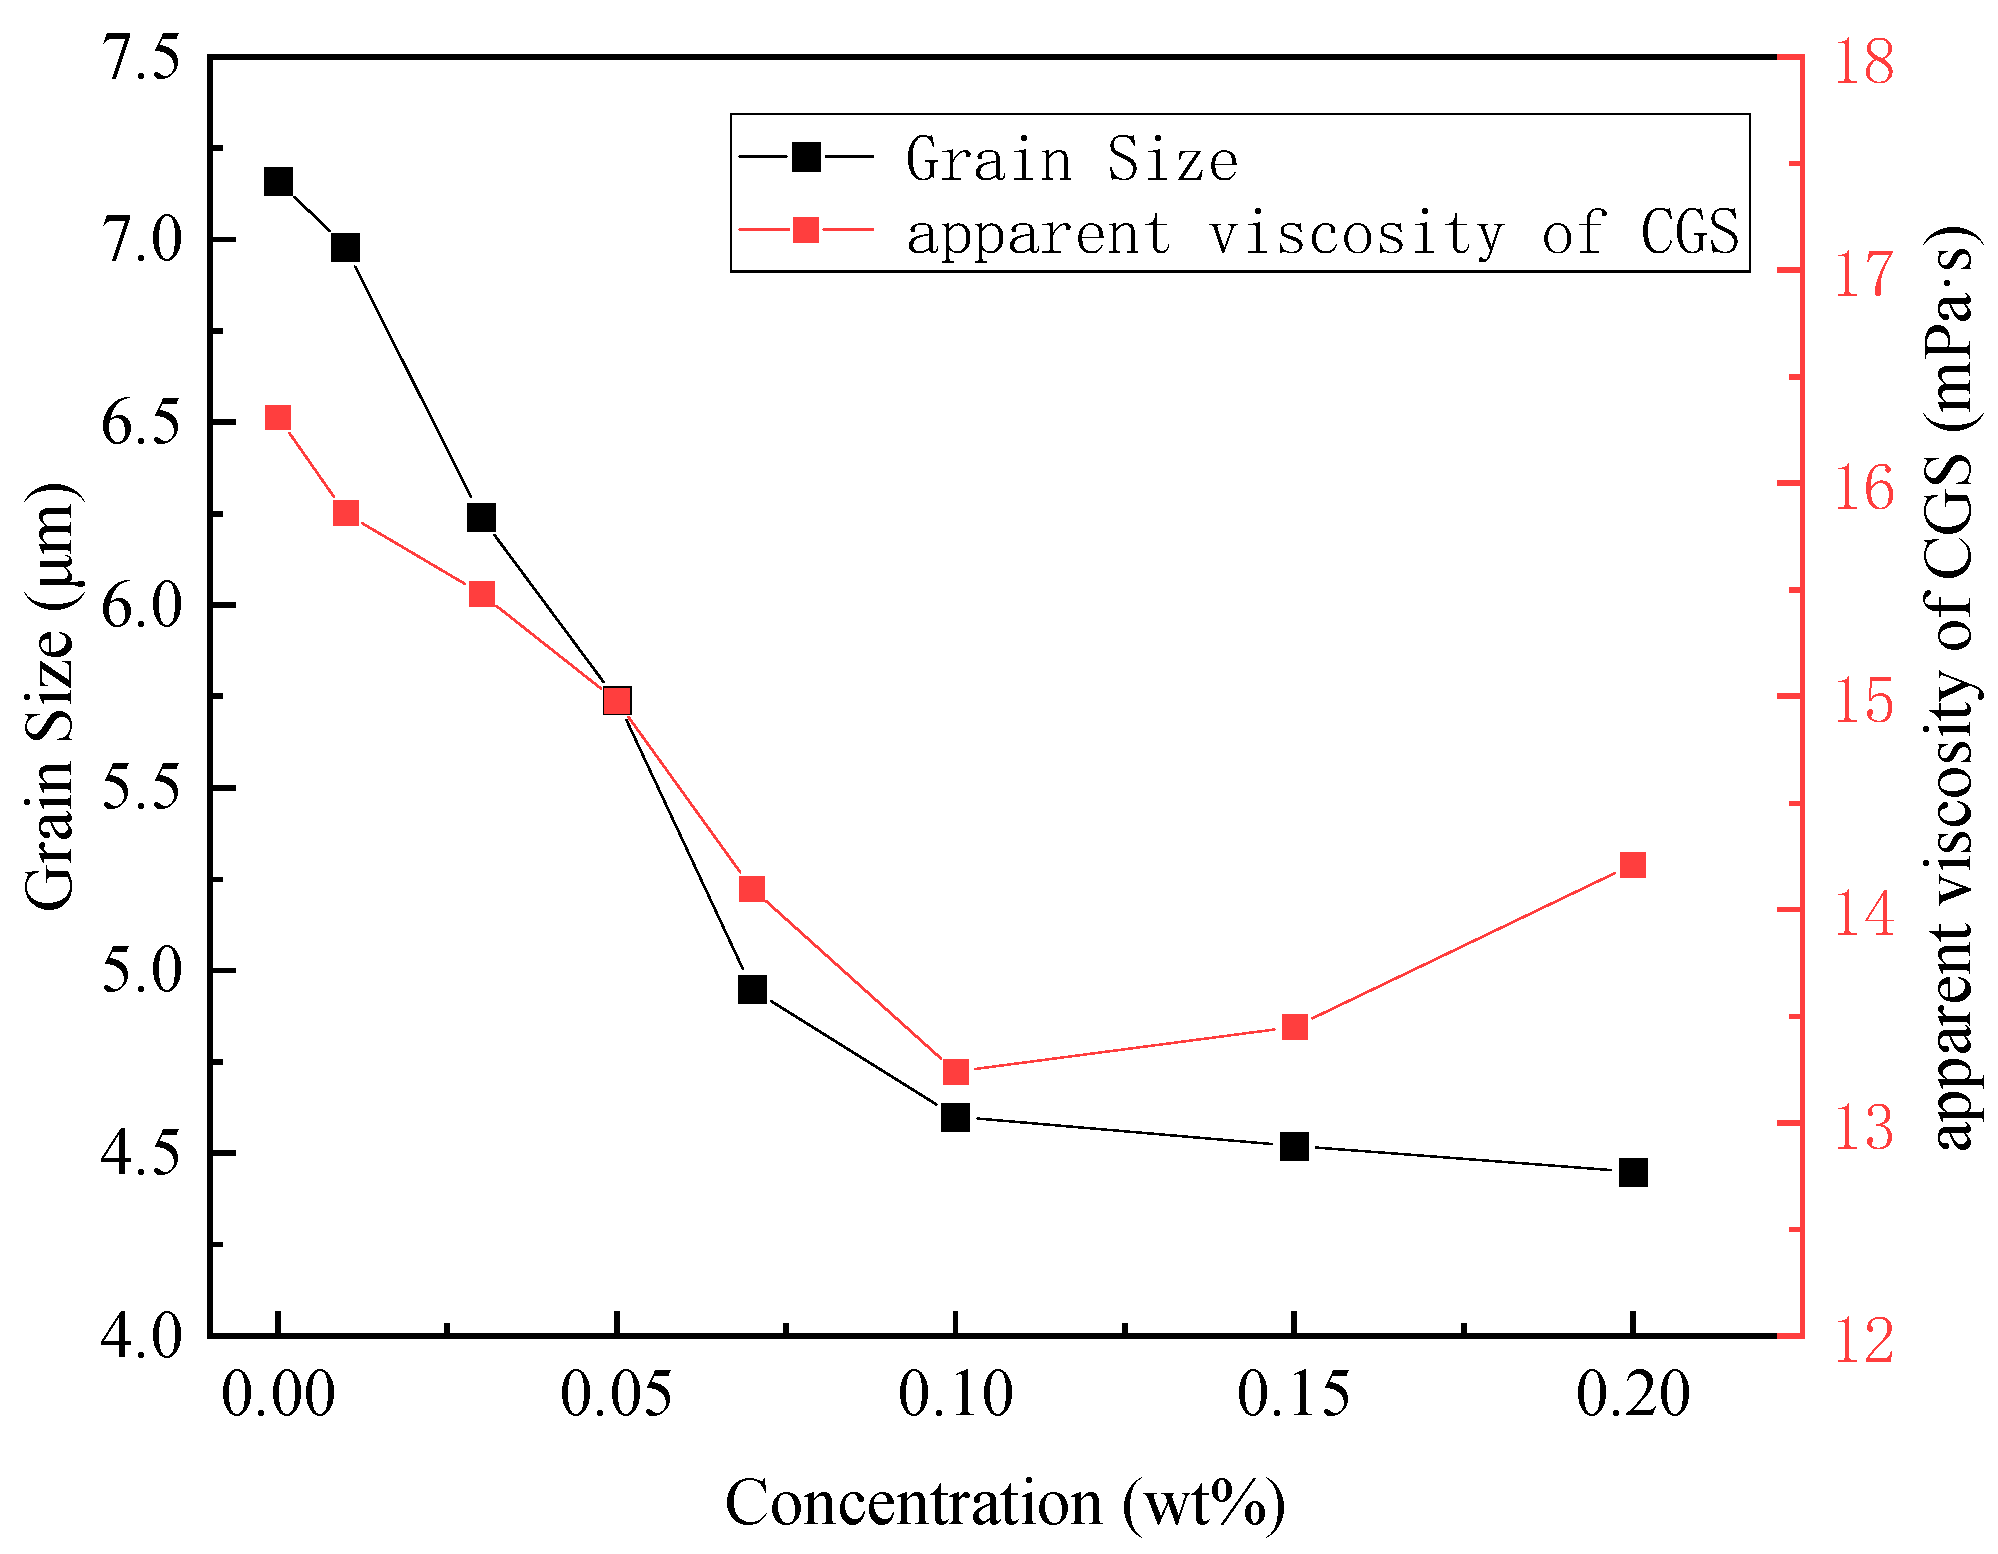
A dispersion containing 2 wt% clay, 3 wt% graphite, and 0.5 wt% GD formula was prepared with varying concentrations of lignosulfonate. The viscosity of the dispersion and the D90 value of the particles were tracked, as depicted in Figure 3. As the concentration of lignosulfonate increased, the D90 value of the particles decreased. The dispersion behavior of both the graphite and clay particles was influenced by surfactants and lignosulfonate. Initially, the surface of graphite particles is hydrophobic. Ultrasound treatment leads to the removal of thinner layers from these particles, exposing a fresh surface that readily absorbs surfactant molecules. This transition renders the graphite particles hydrophilic, yet not sufficiently stable for dispersion in water [33,34]. Additionally, the introduction of clay particles and lignosulfonate into the graphite dispersion alters the scenario. The mineral crystals on the surface of clay can interact with water through hydrogen bonding, a process referred to as hydration. This ensures the stability of clay particles in water after ultrasonic dispersion and hydration, ultimately enhancing the stability of the graphite dispersion [35]. The adsorption of lignosulfonate molecules on the particle surface is mainly due to London dispersion forces and hydrophobic forces, in addition to electrostatic forces. The addition of lignosulfonate changes the surface properties of graphite particles and clay particles. This results in an improvement in the dispersion of these solid particles [36]. Figure 3 illustrates the reduction in the D90 particle value from 7.16 µm to 4.45 µm. Enhanced dispersion of clay particles correlates with a decrease in the dispersion’s viscosity. However, the presence of lignosulfonate can elevate the liquid’s viscosity. Consequently, when the lignosulfonate concentration surpasses 0.1 wt%, the dispersion’s viscosity experiences an increase.

Figure 3.
Variation in Viscosity of CGS Dispersions and D90 Diameter of Particles with Lignosulfonate Concentration.
3.1.2. Interfacial Dilational Viscoelasticity
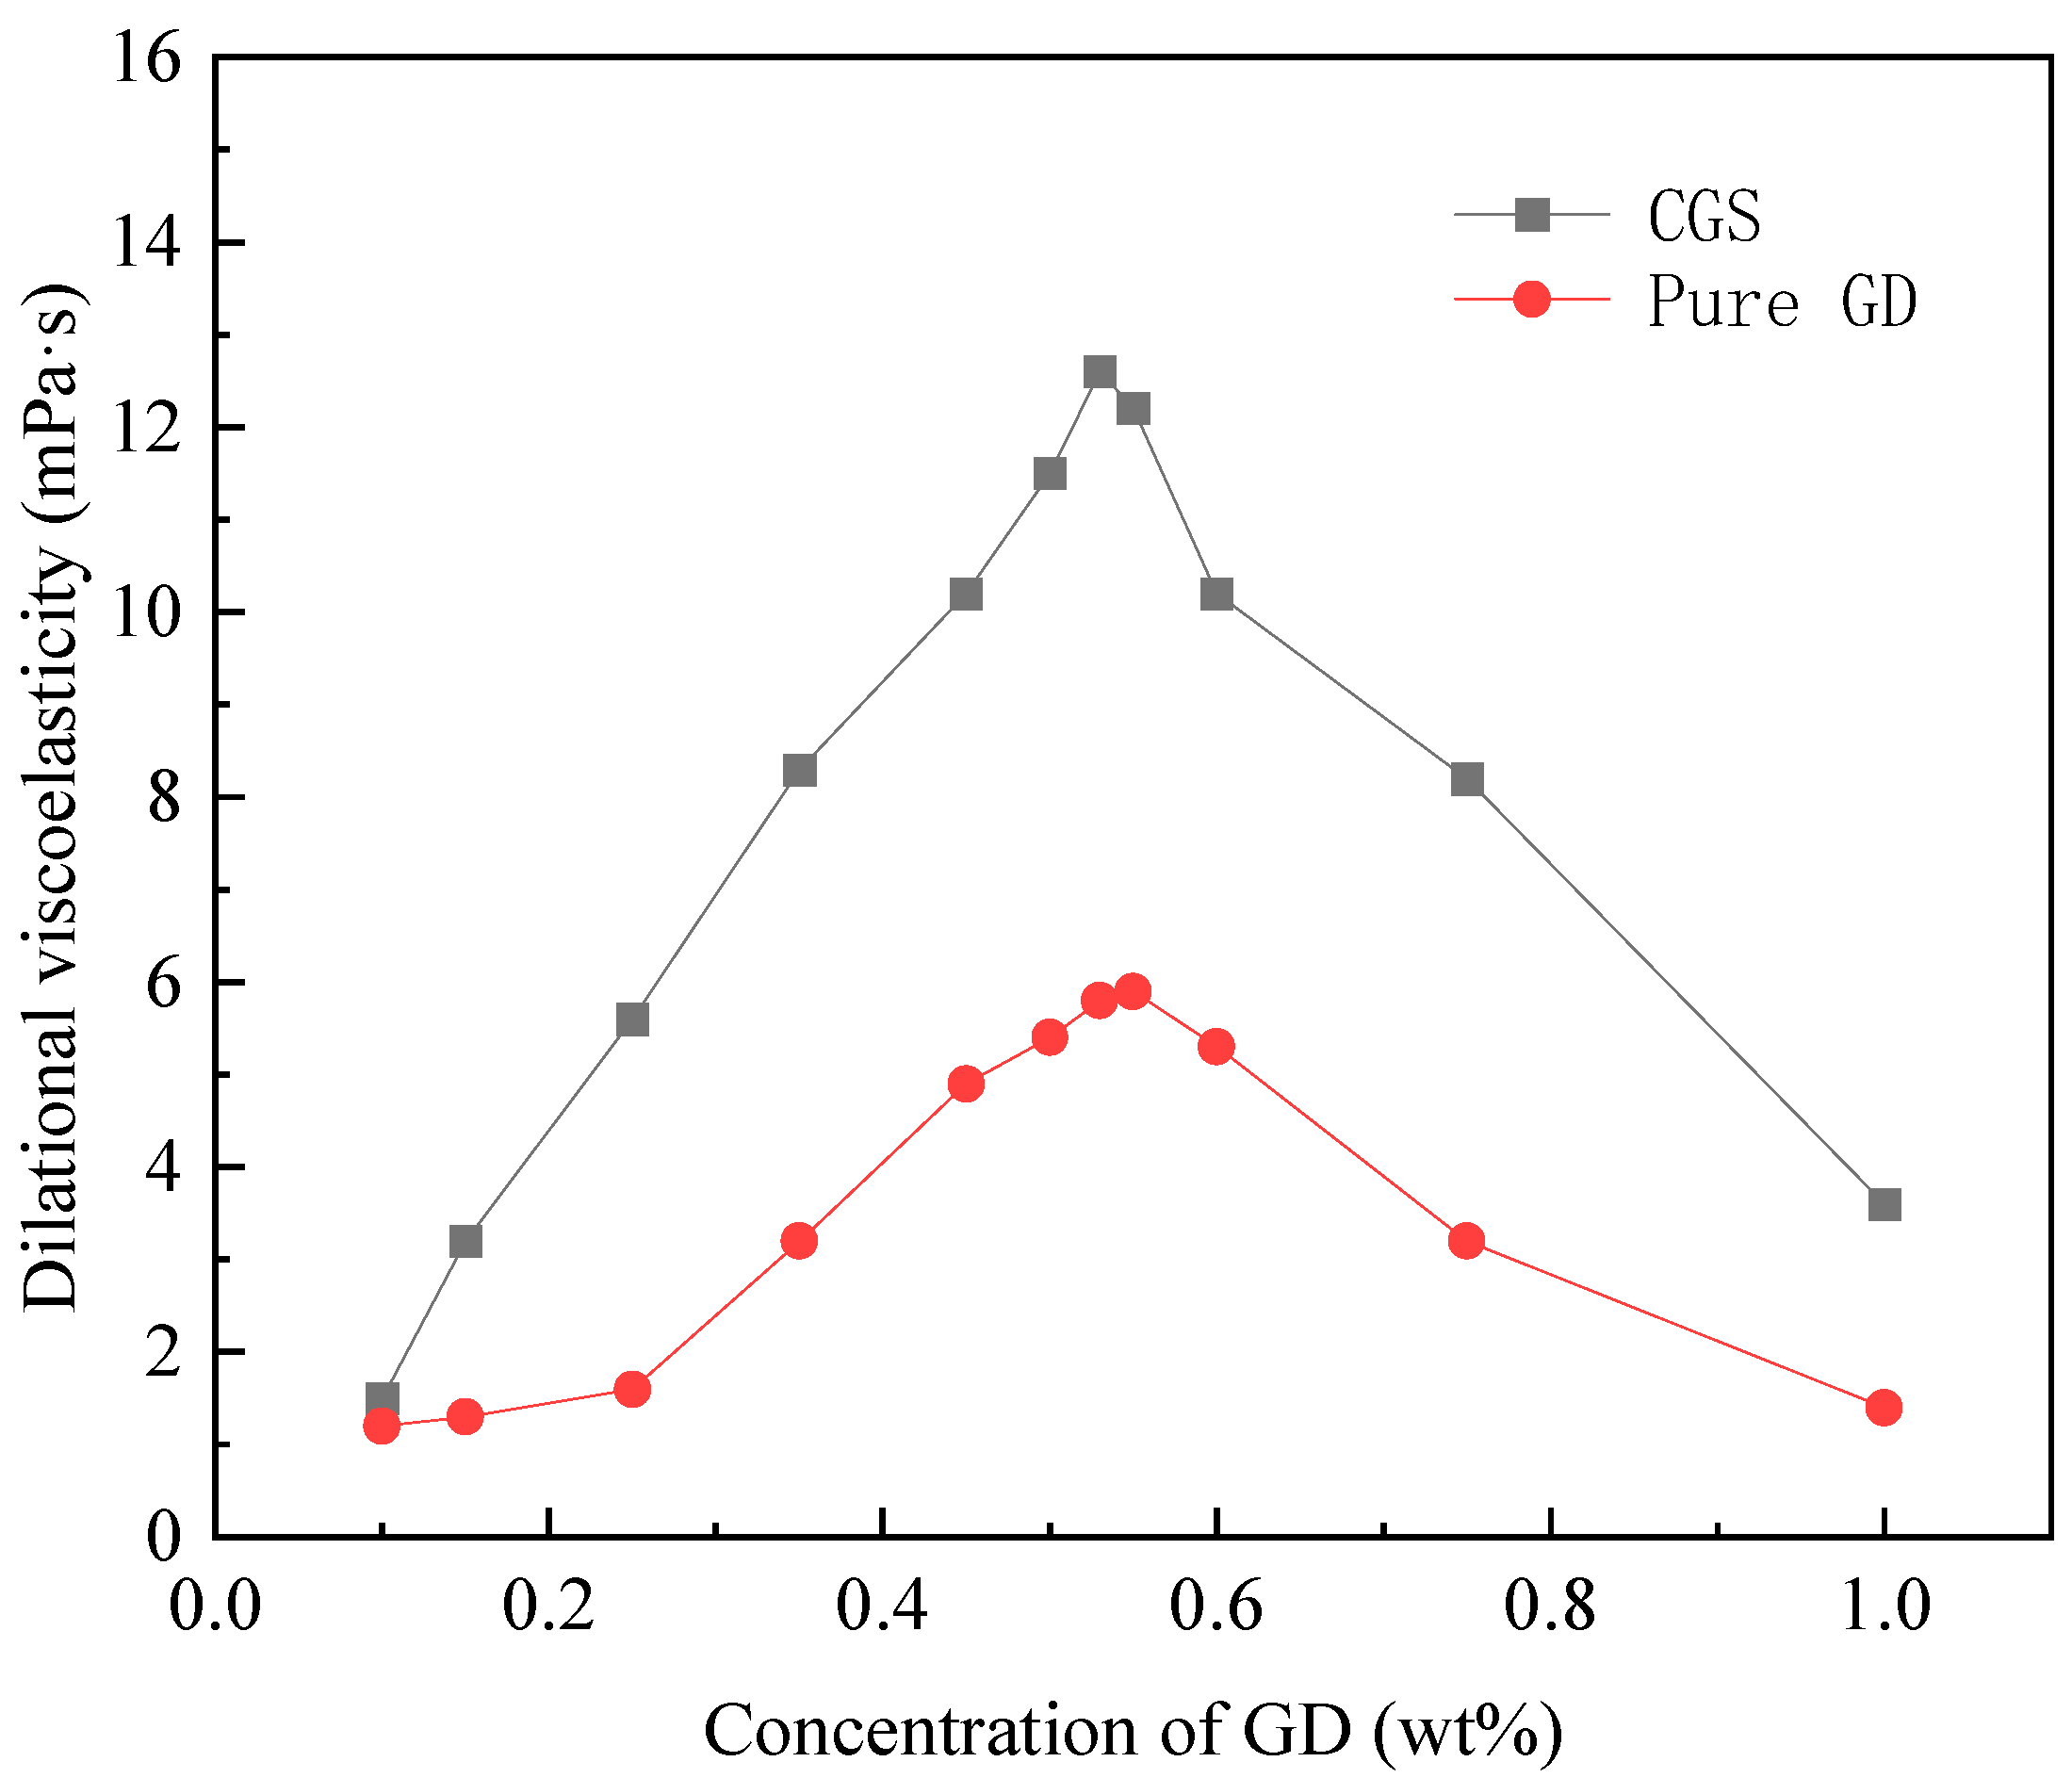
Figure 4 illustrates the interfacial dilational viscoelasticity of CGS (2 wt% clay + 3 wt% graphite + 0.1 wt% lignosulfonate + GD surfactant) dispersions alongside pure GD surfactant solutions. A higher value indicates a more resilient liquid film capable of withstanding external forces without rupture. Notably, when the surfactant concentration in the CGS dispersion reaches 0.3 wt%, the dilational viscoelasticity value approaches the peak exhibited by the GD solution. The liquid film strength of the CGS dispersion surpasses that of the GD solution. This observation can possibly be attributed to the formation of a certain skeletal structure by the particles within the liquid or due to adsorption phenomena occurring between the particles and the surfactant at the gas–liquid interface.

Figure 4.
Variation in Interfacial Dilational Viscoelasticity of GD Surfactant Solutions and CGS Dispersions with GD Surfactant Concentration.
As the concentration of the GD surfactant increases, alterations in the adsorption quantity of the surfactant onto particles and interfaces come into play. On the one hand, surfactant adsorption at the gas–liquid interface boosts the expansion viscoelastic modulus, a phenomenon corroborated by the curve exhibited by the pure GD surfactant. On the other hand, changes in adsorption levels influence the particles’ hydrophilicity and hydrophobicity, subsequently affecting their adsorption onto the gas–liquid interface [34]. The culmination of this effect was observed when the concentration of GD surfactant reached 0.53 wt%, leading to the maximal liquid film strength within the CGS dispersion. It is pertinent to note that the influence of surfactants on fortifying liquid film strength does not diminish over time.
3.2. Stability of Foam
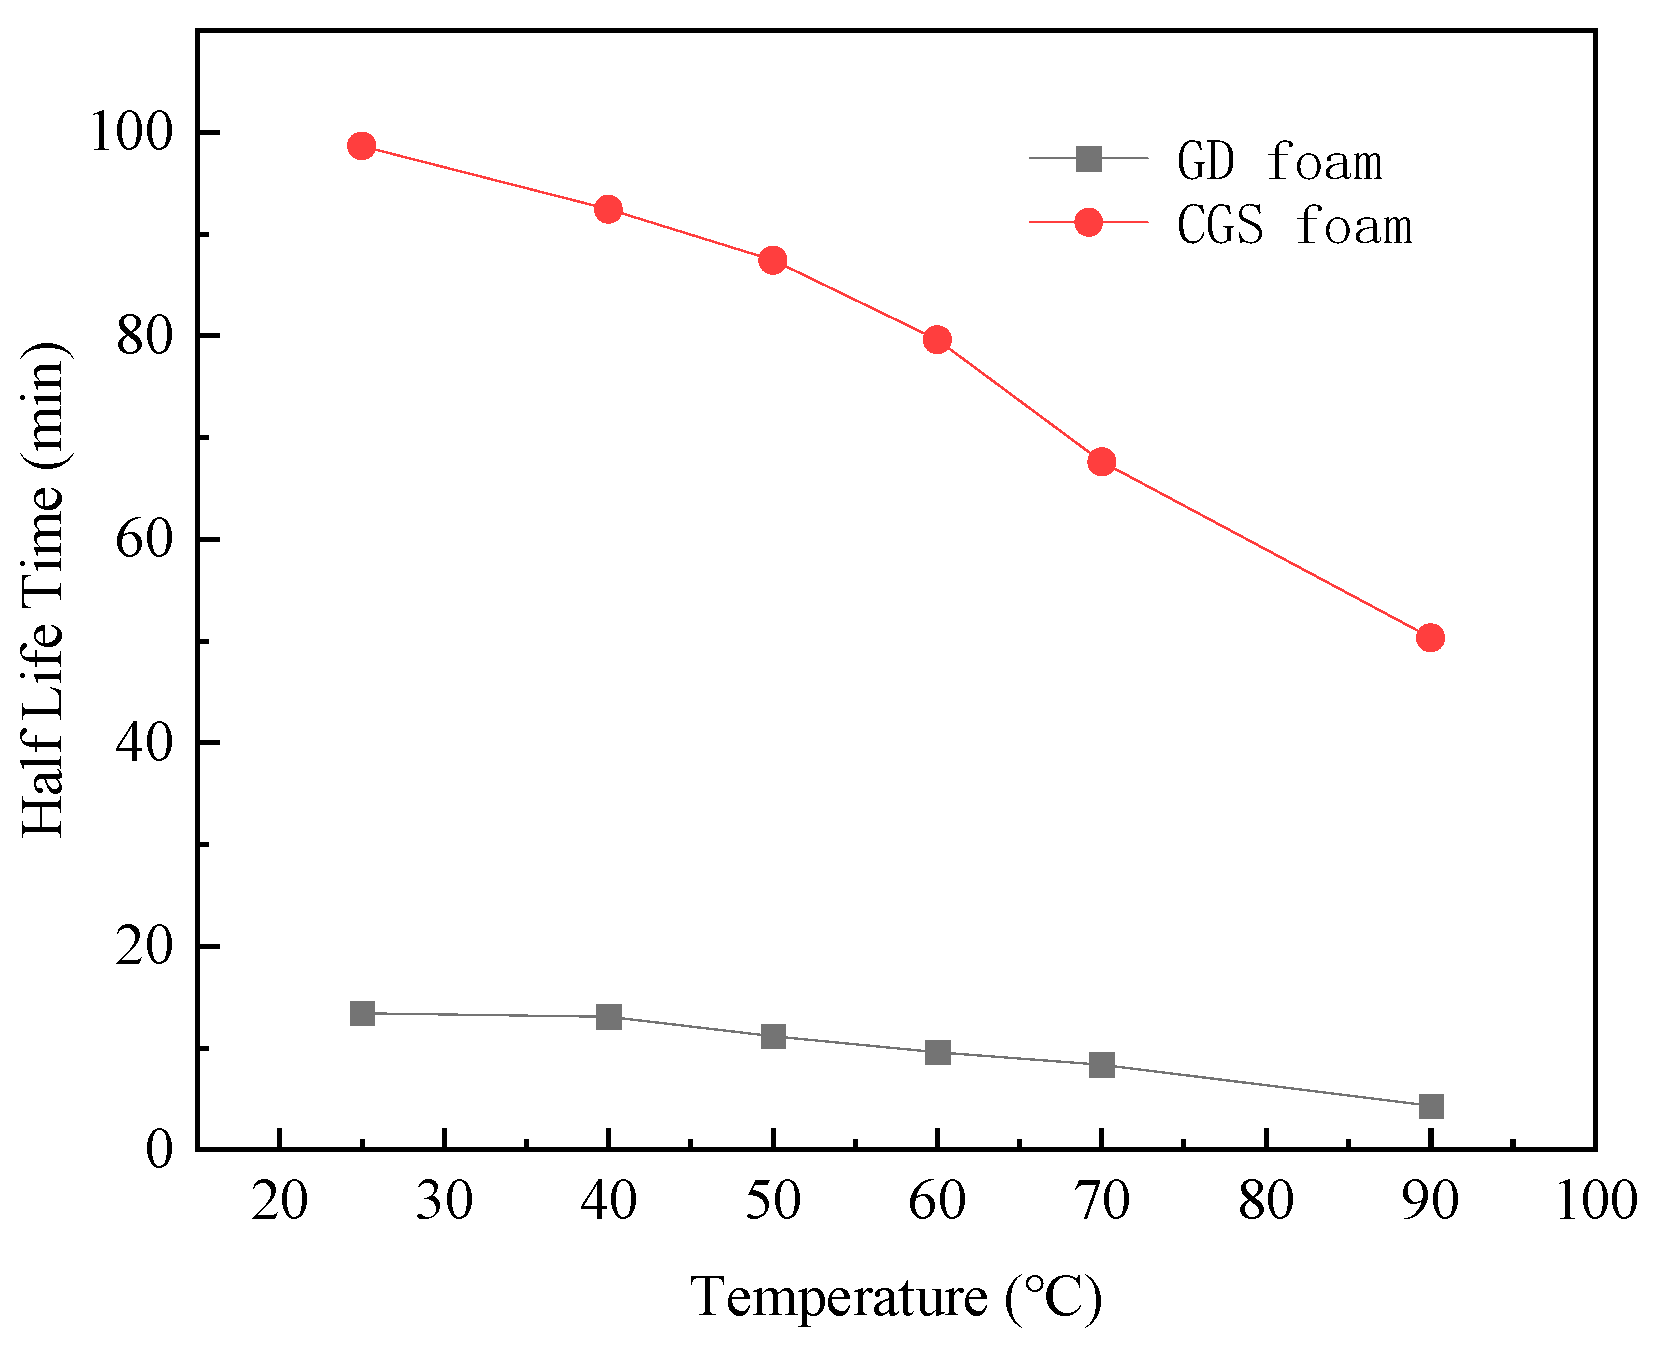
The CGS foam was formulated by combining 3 wt.% graphite, 2 wt.% clay, 0.53 wt% GD surfactant, and 0.1 wt% lignosulfonate. The GD foam, on the other hand, featured a surfactant concentration of 0.53%. Moving to Figure 5, it portrays the correlation between half-life and temperature for both the CGS foam and GD foam. At room temperature, the half-life of CGS three-phase foam extends to 98.63 min, an approximately sixfold increase compared with the half-life of pure surfactant foam. This enhancement can be attributed to the formation of a particle-based framework within the liquid film of CGS. The adsorption of particles onto the gas–liquid interface bolsters the strength of the liquid film. By introducing particles, the diffusion of gas from smaller to larger bubbles is hindered, largely due to the Prandtl boundary [27,36].

Figure 5.
Half-Life of CGS Foam and GD Foam at Different Temperatures.
Following an increase in temperature, the half-life of both foams exhibited a noticeable reduction. This phenomenon arose from two key factors. Firstly, elevated temperatures lead to heightened molecular thermal motion, thereby accelerating the coalescence of gas and thinning of the liquid film. Secondly, the quantity of surfactant adsorbed onto the gas–liquid interface decreases at higher temperatures, subsequently diminishing the stability of the liquid film [32]. However, despite this general trend, the half-life of CGS foam remains 11.6 times longer than that of pure surfactant foam. Remarkably, the influence of particle addition on foam stability becomes even more pronounced under high-temperature conditions.
3.3. Performance of Foam in Porous Media
3.3.1. Applicable Range of Permeability
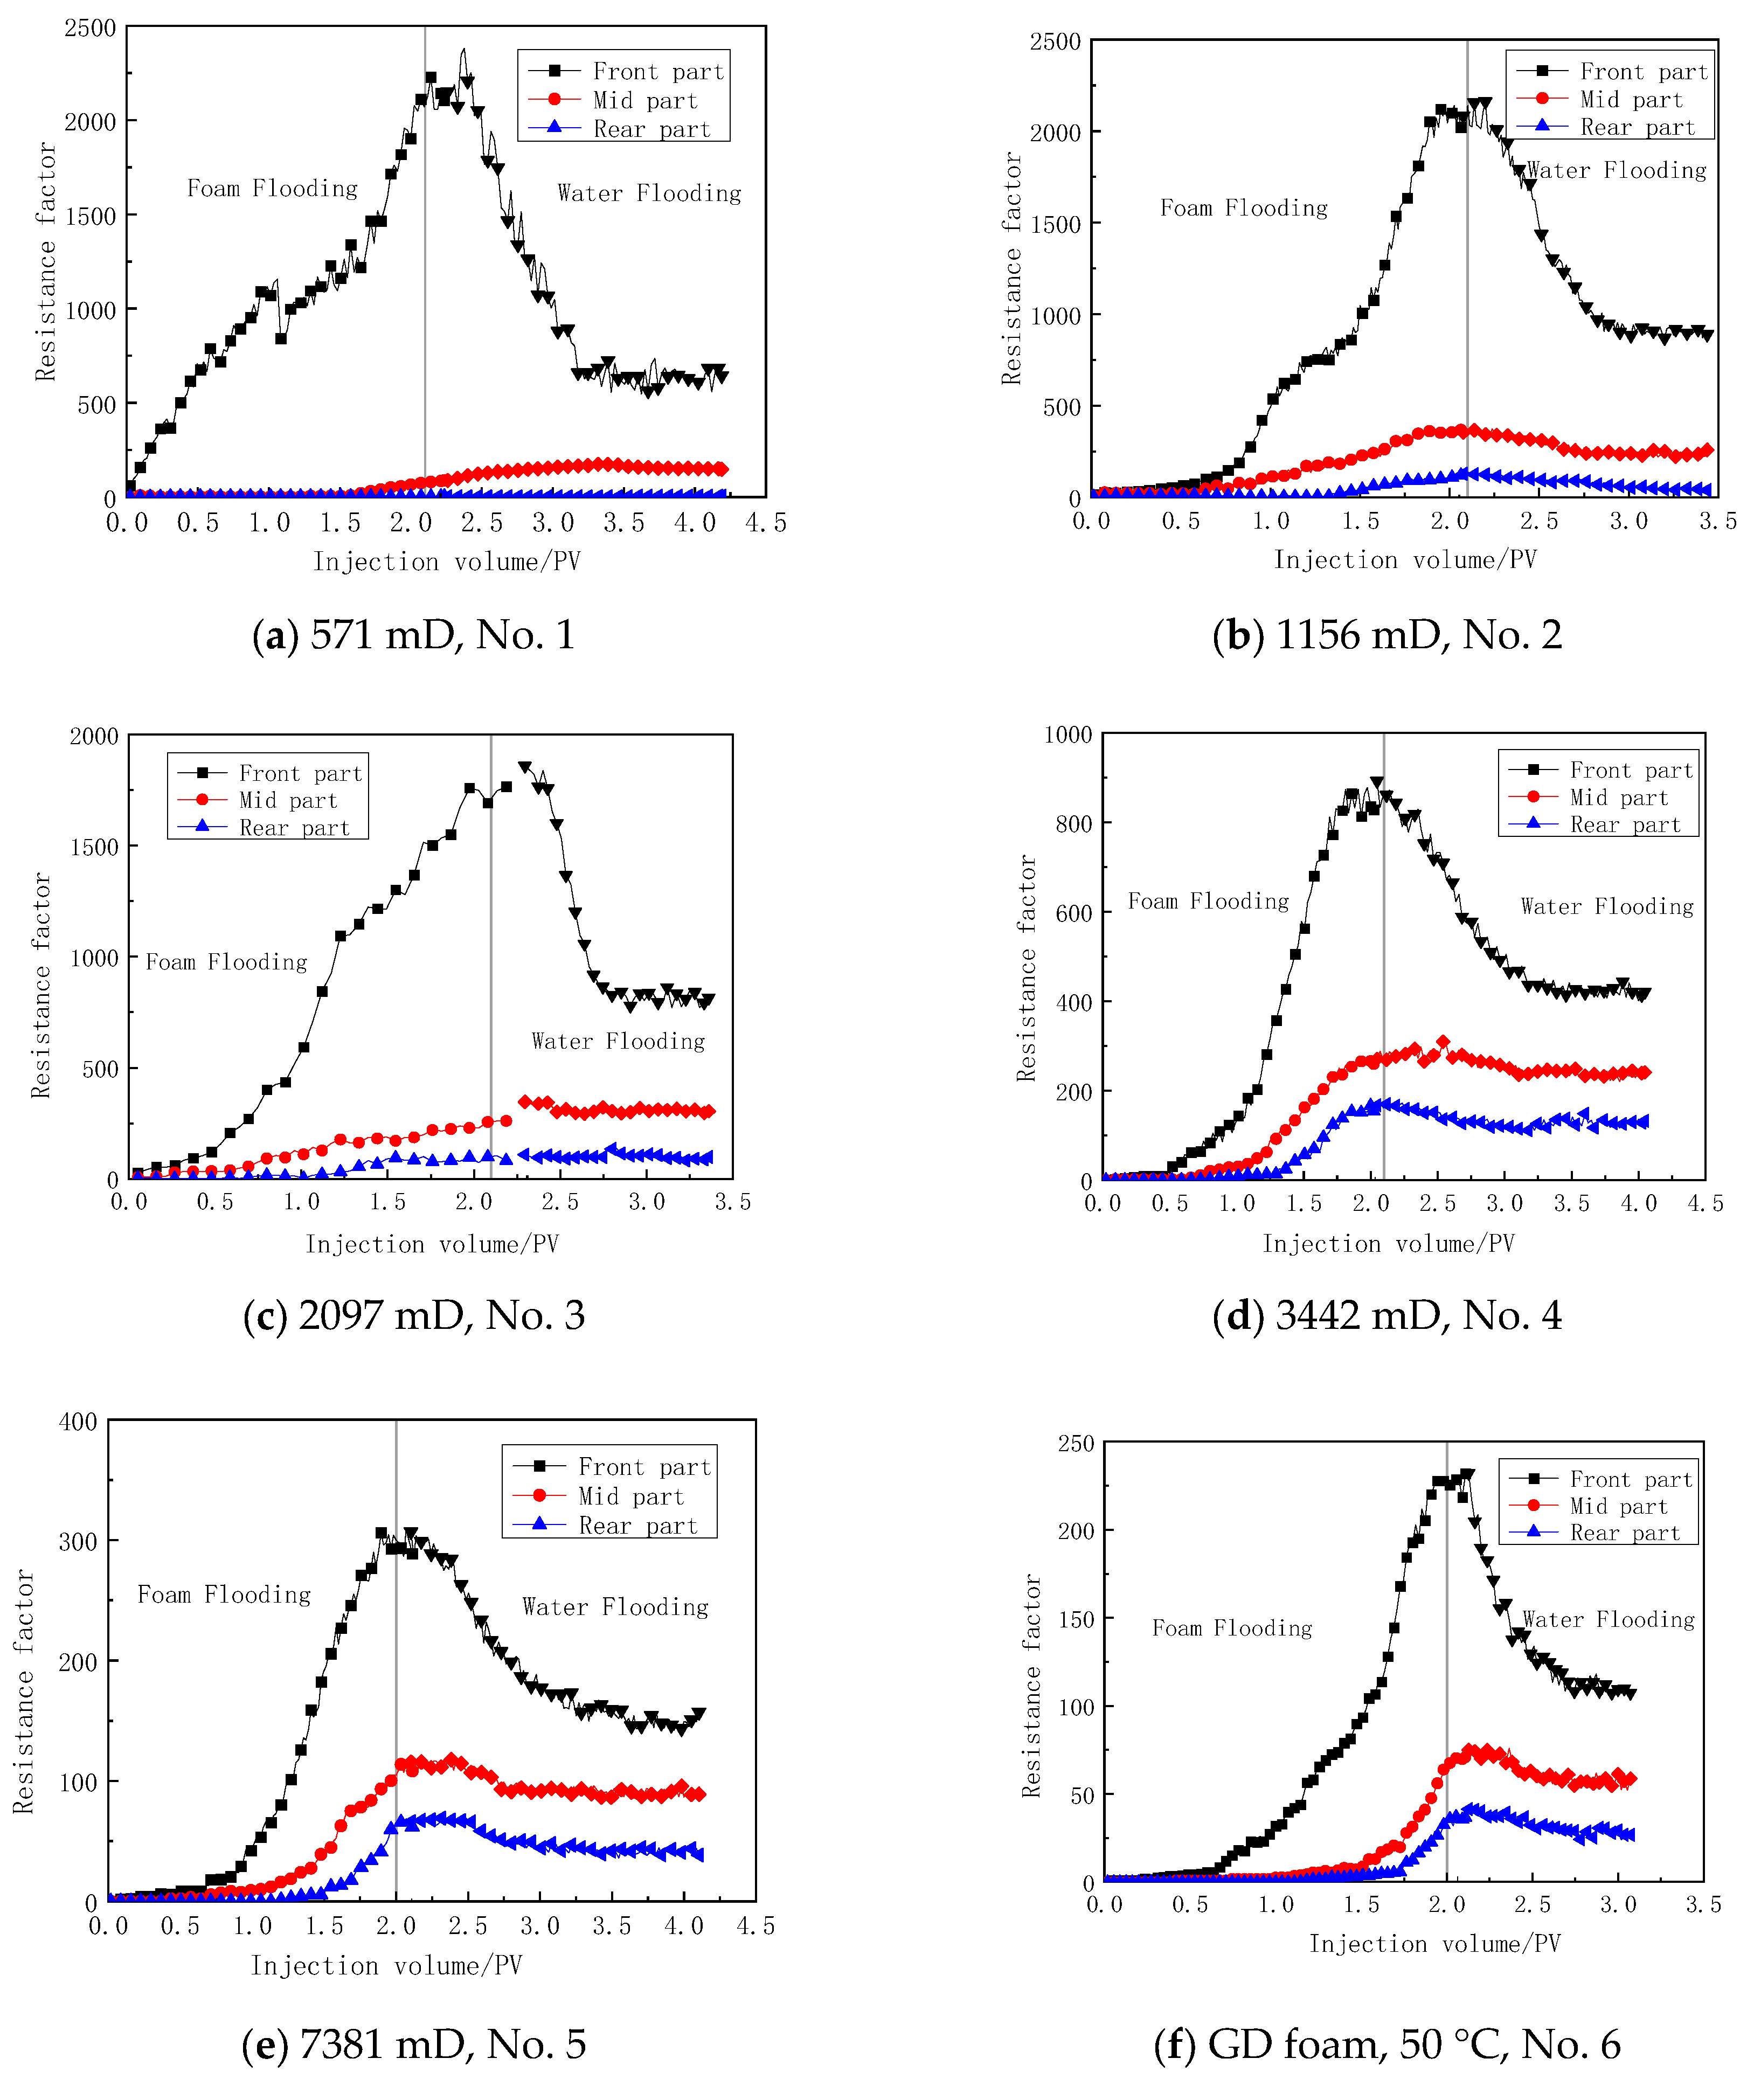
To assess the blocking performance of CGS foam in reservoirs with varying permeabilities and to understand the foam migration behavior within these reservoirs, a series of five sand-packing pipe experiments were conducted. The CGS foam composition consisted of 3 wt% graphite, 2 wt% clay, 0.53 wt% surfactant, and 0.1 wt% lignosulfonate. As depicted in Figure 6a,b, when the permeability remained under 1200 mD, there was a substantial injection pressure disparity within the sand-packing pipe, primarily concentrated towards the front. Injected particles tended to accumulate at the entrance of the sand-packing pipe, hindering deeper migration into the formation. Notably, in the fluid produced from these two experimental groups, particle concentration was merely 1.2% and 7.9% of the injected liquid concentration, with nearly all particles remaining within the initial sixth of the filling tube. As permeability increased to 2097 mD, particle aggregation improved, and the pressure difference between the middle, rear, and front sections decreased. During subsequent water flooding, the surfactant was gradually washed away. Nevertheless, the front particles exhibited gradual migration towards the deeper formation. Consequently, while the pressure disparity in the frontal segment declined rapidly, the middle and rear portions of the sand-packing pipe maintained an effective blocking effect. This suggests that the residual drag effect in the sand pack, with particles added, surpasses that of pure surfactant foam. The optimal formation permeability for CGS foam is approximately 3442 mD. The pressure data illustrated in Figure 6d demonstrate that CGS foam exhibits a relatively even distribution throughout the sand pack. When the injected fluid was switched to water, the weakening of the foam’s Jamin effect occurred due to surfactant washout. Nevertheless, the bridging effect of the particles remained largely intact. Each segment of the sand-filling pipe sustained a relatively high pressure level. In Figure 6f, it becomes evident that although CGS foam within high-permeability formations (7381 mD) can achieve effective plugging throughout the sand-packing pipe, the discontinuation of new CGS foam injection results in the continuous flushing of foaming fluid and particles by the fluid. Consequently, the particles fail to maintain a stable blocking effect within the formation. This observation underscores the need to consider a three-phase foam system with larger particle sizes for high-permeability formations.


Figure 6.
The resistance factors of foam injection in cores.
3.3.2. Comparison of Sealing Ability
Figure 6d,f,g elucidate the distinct formation plugging outcomes exhibited by different systems within a reservoir characterized by a permeability of (3400 ± 10%) mD. Notably, the plugging efficiency of CGS foam surpasses that of pure surfactant foam at equivalent concentrations. The plugging pressure associated with CGS foam demonstrates an impressive 3.2-fold increase compared with that of pure surfactant foam. Furthermore, a distinct absence of noticeable accumulation effects is observed in the frontal section of the sand-packing pipe. Comparing CGS foam with graphite clay particles, it is evident that graphite clay particles exhibit significant accumulation in the frontal section, leading to poor injectability. This issue primarily stems from the absence of surfactant and lignosulfonate, resulting in diminished particle dispersibility and an increased tendency for agglomeration. Consequently, the plugging material struggles to effectively penetrate into the core region.
3.3.3. Temperature Resistance
Figure 6d,f,h,i demonstrate the temperature-resistance characteristics of CGS foam and pure surfactant foam. Notably, the decrease in resistance factor for CGS foam at 120 °C is significantly less pronounced compared with that for GD foam. This indicates that the stability of CGS foam surpasses that of GD foam, and the plugging effect of particles within the foam on larger pores remains unaffected by temperature fluctuations.
3.4. Analysis of Production Parameters
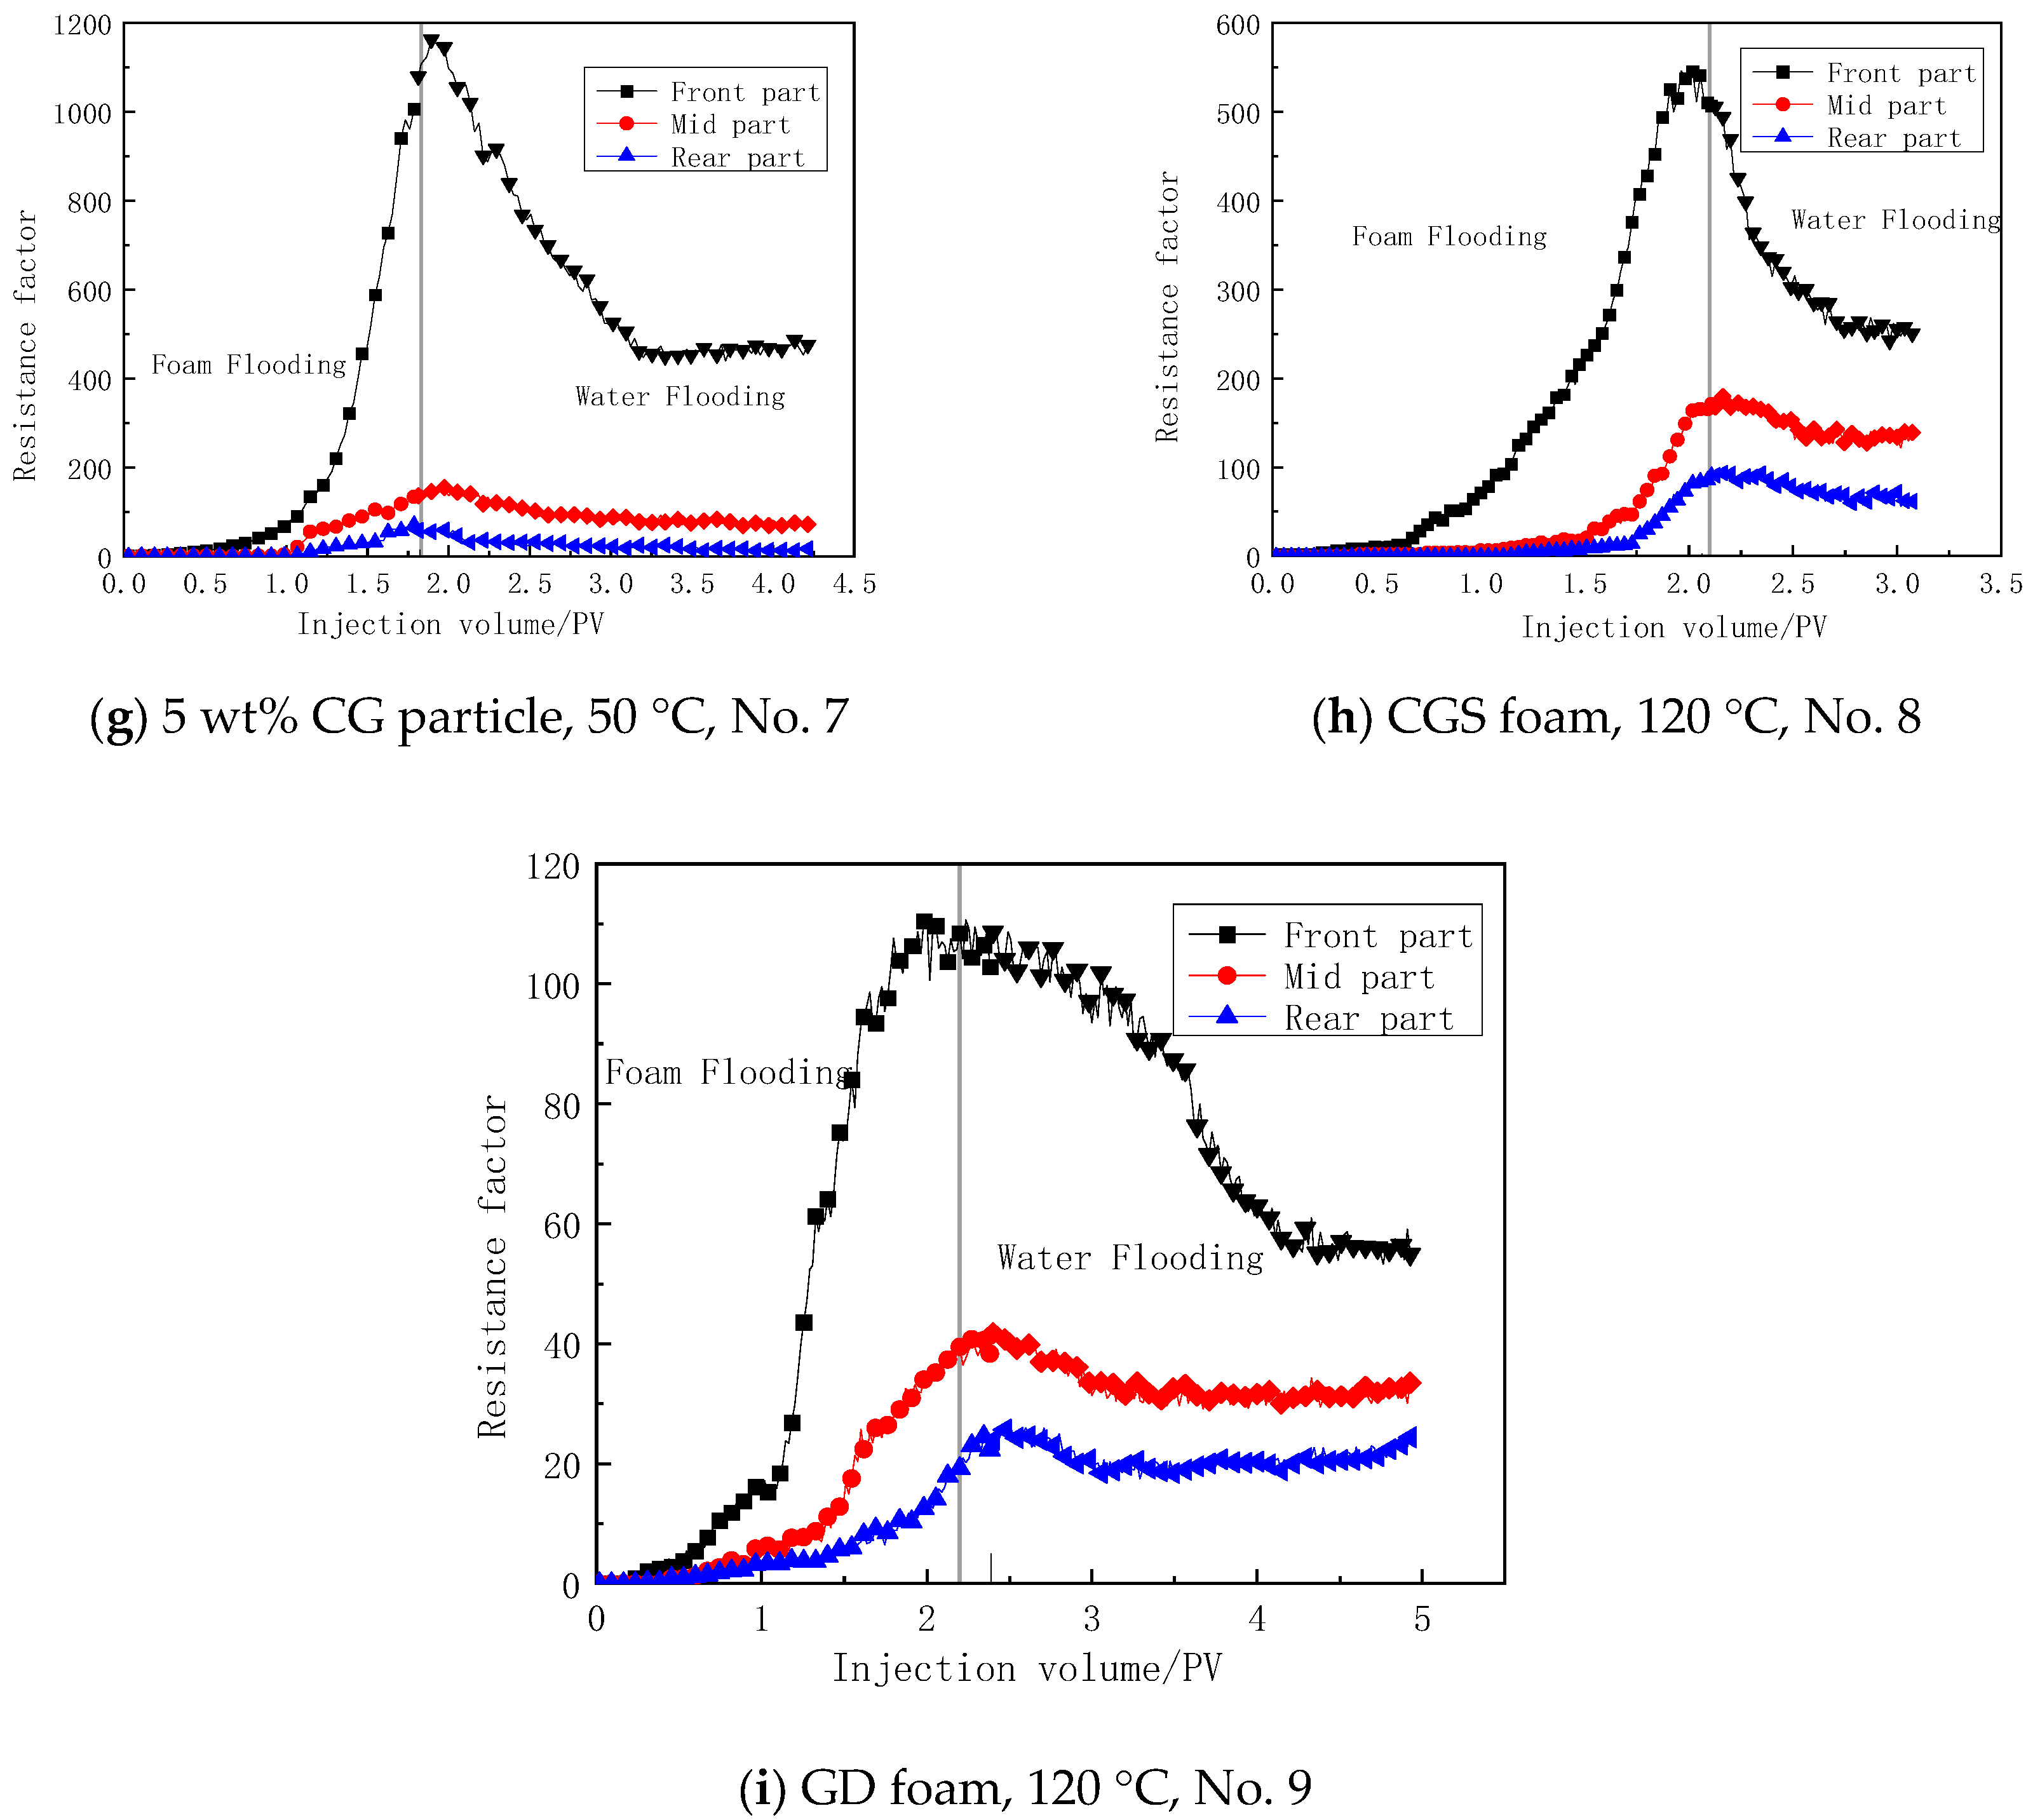
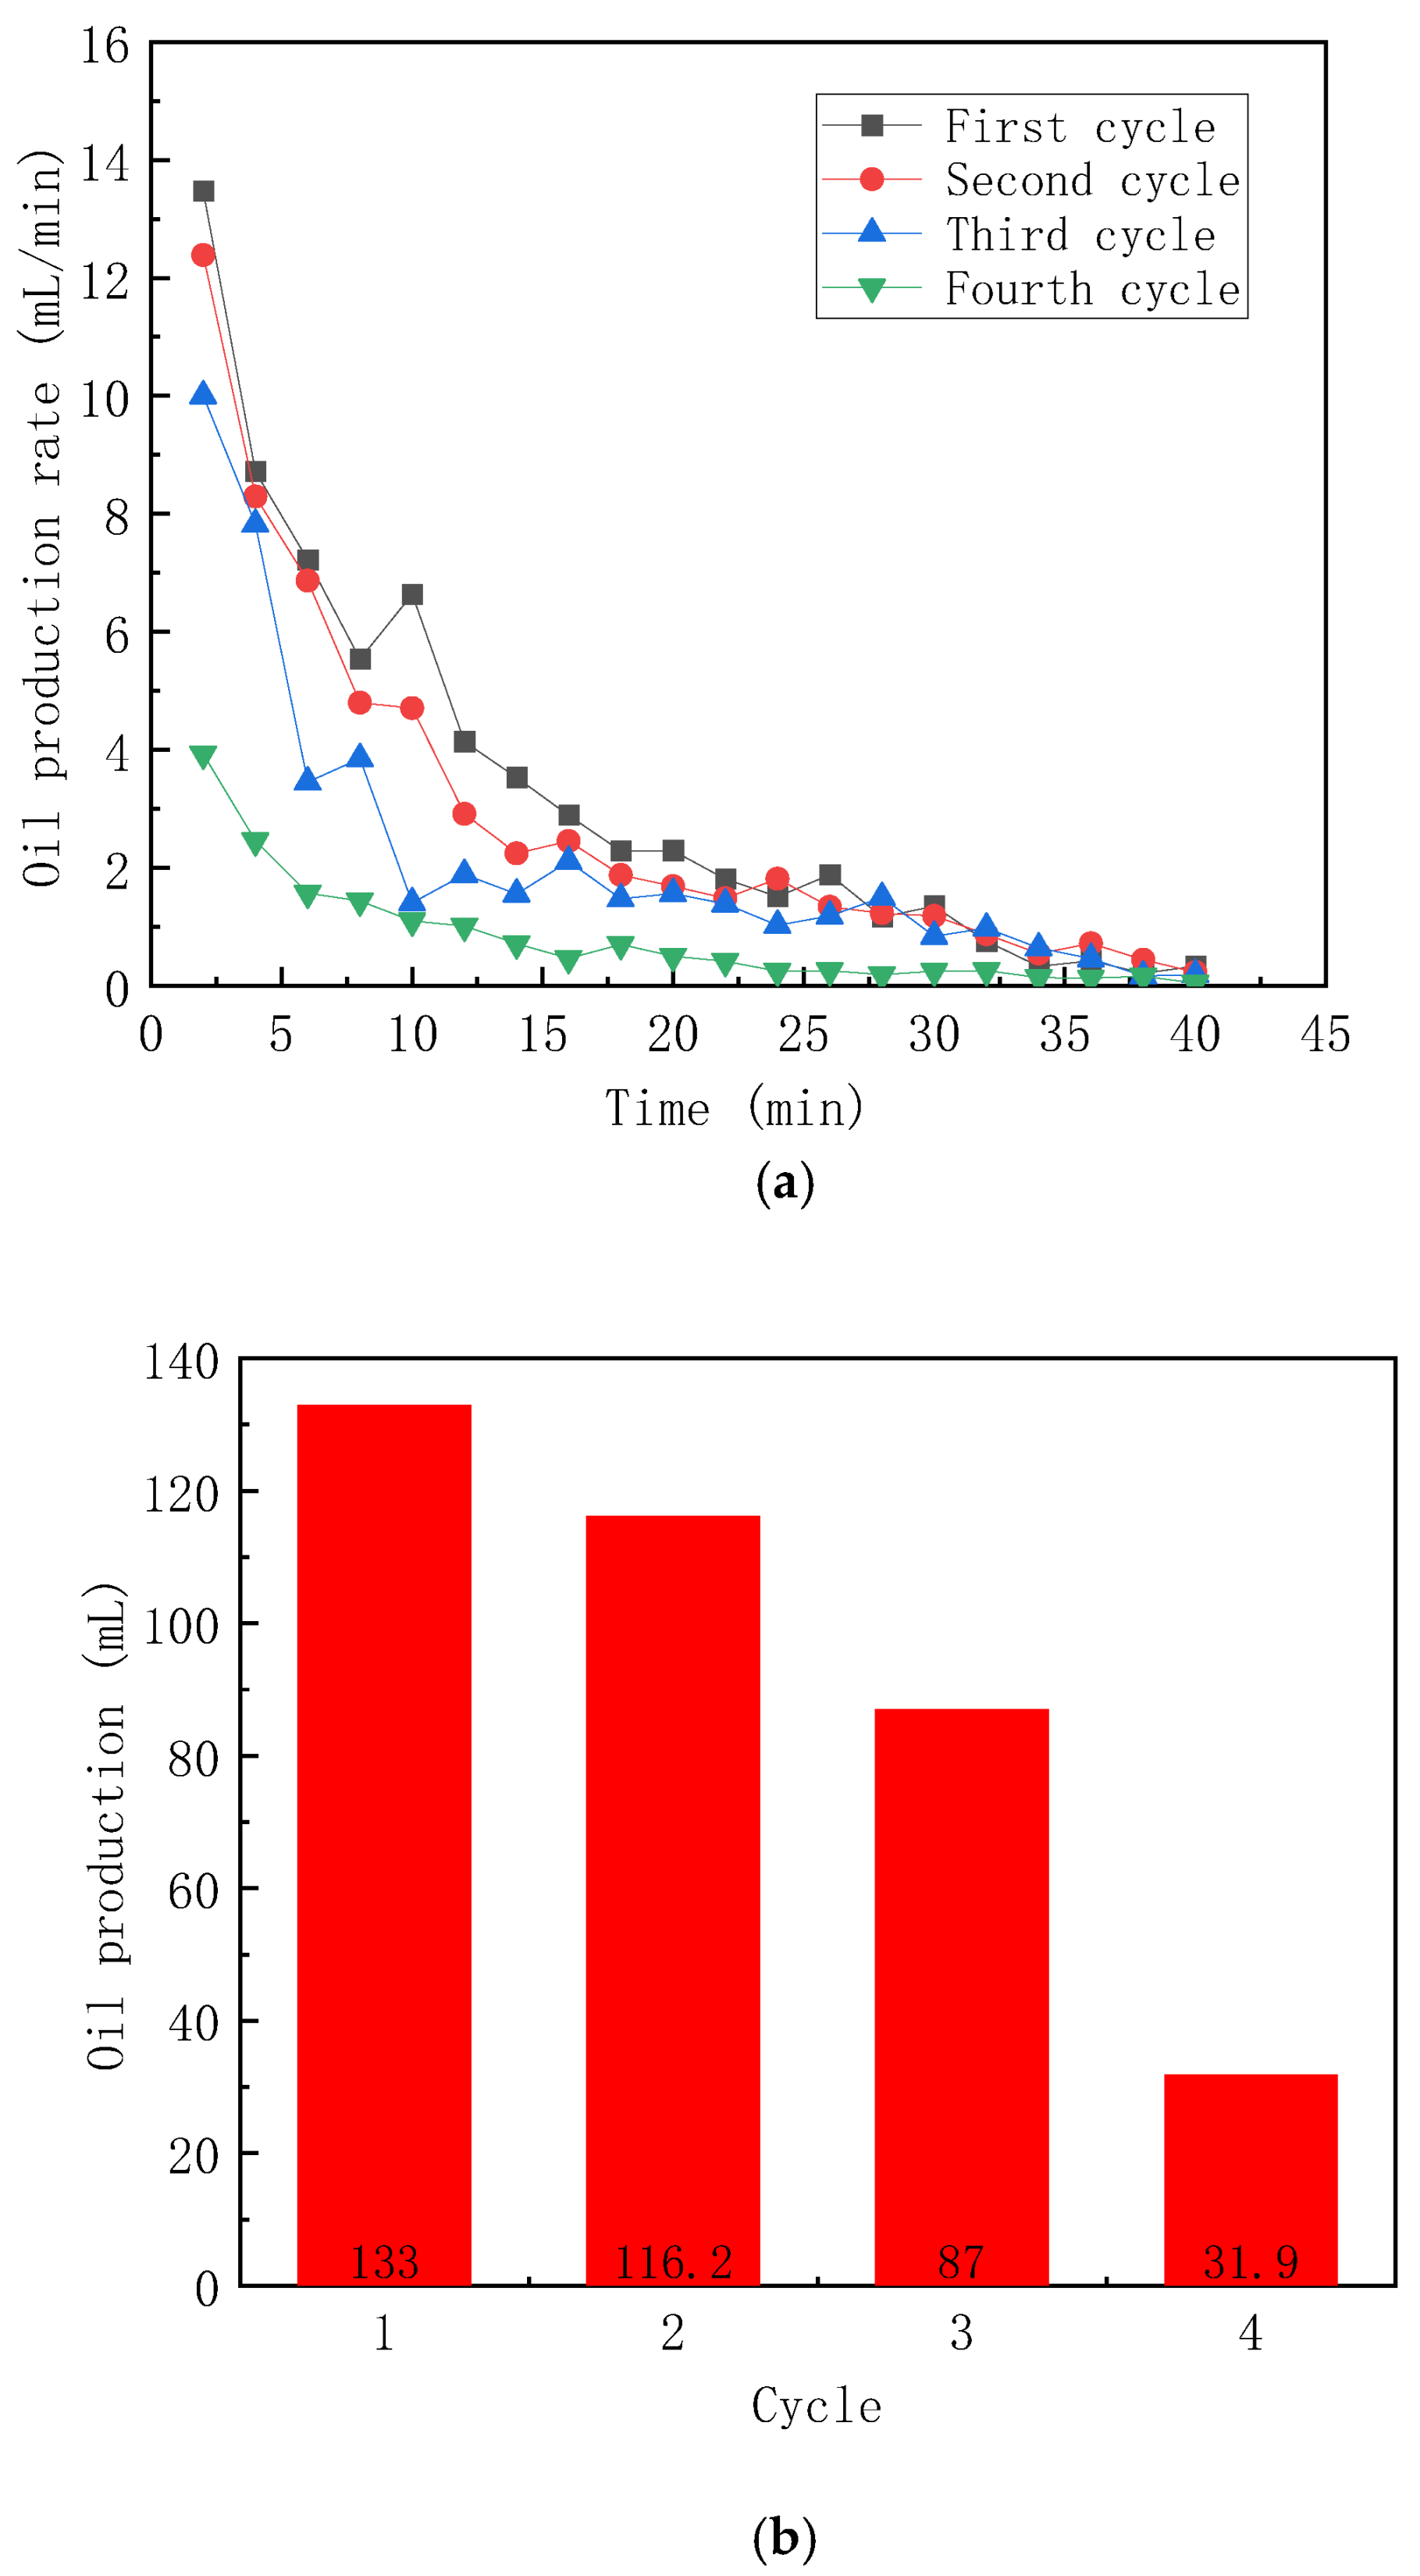
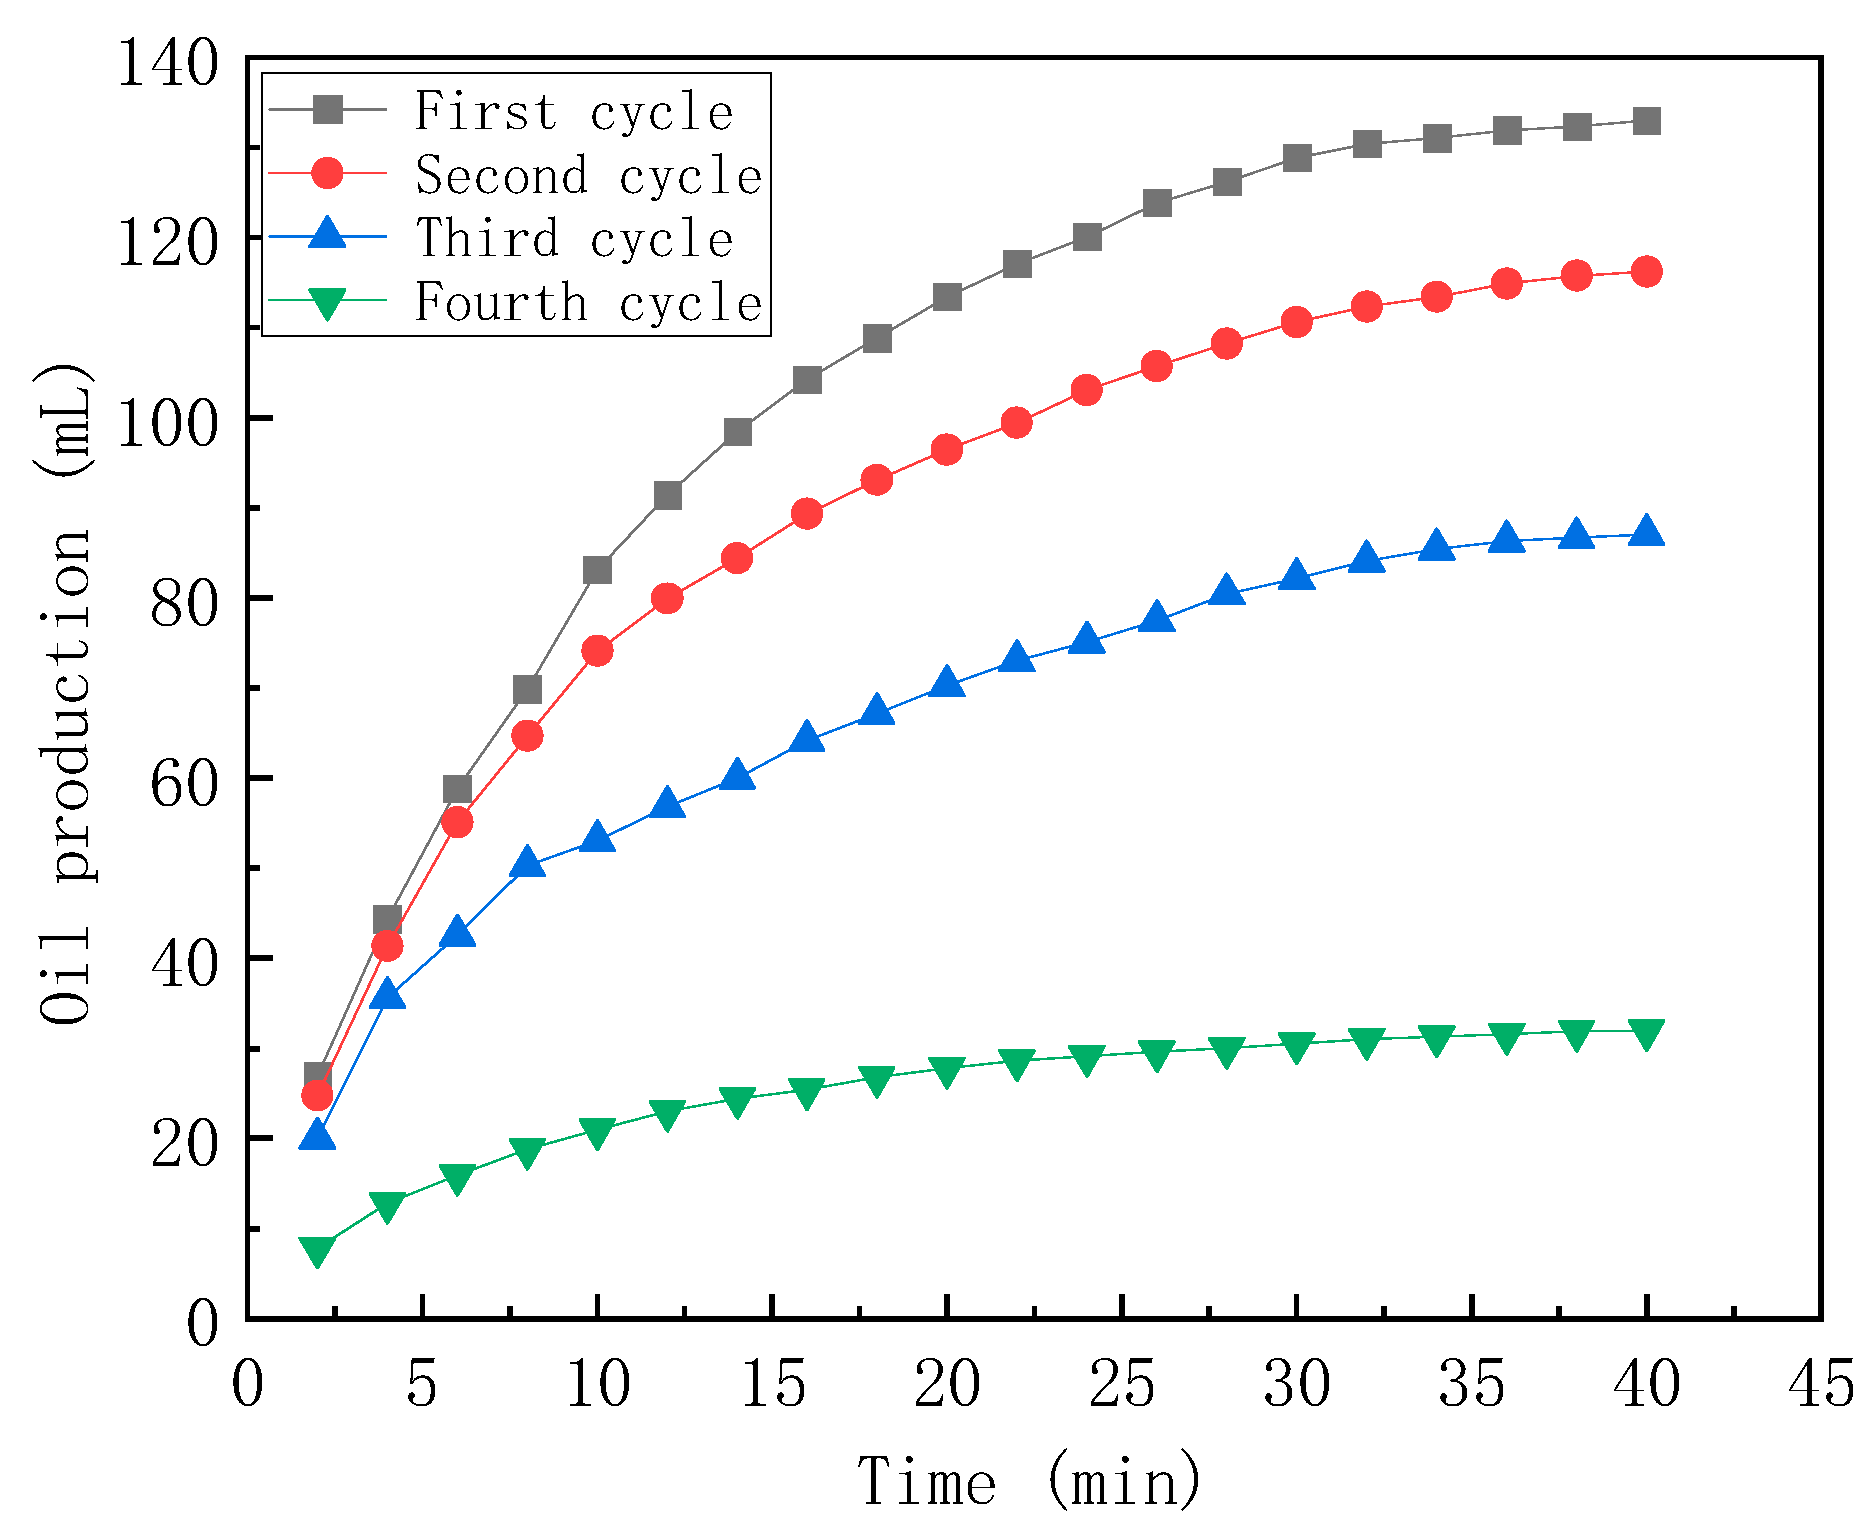
Figure 7 displays the oil production rate for the initial four cycles of pure steam huff and puff. In the context of conventional steam soaking, the oil production rate experiences a rapid decline as the steam soaking cycle extends, leading to a substantial reduction in total oil production per cycle. The maximum oil production rate for standard steam stimulation decreases by 71.2%. The oil production volumes for the first four cycles are as follows: 133 mL, 116.2 mL, 87 mL, and 31.9 mL, respectively. The gradual decrease in crude oil production over the first three cycles can be attributed to the continual reduction in the saturation of remaining crude oil near the wellbore. Moreover, the expansion of the steam heating radius plays a role. However, by the fourth cycle, the steam field’s heating radius approaches its limit, and the extractable crude oil within the affected area has already been recovered in the initial three cycles. Consequently, crude oil output in this cycle experiences a substantial decline. In fact, the crude oil recovery rate in the fourth cycle is a mere 23.9% of the first cycle’s output and only 36.7% of the output observed in the third cycle.

Figure 7.
The oil production rate (a) and oil production (b) in the four cycles of pure steam stimulation.
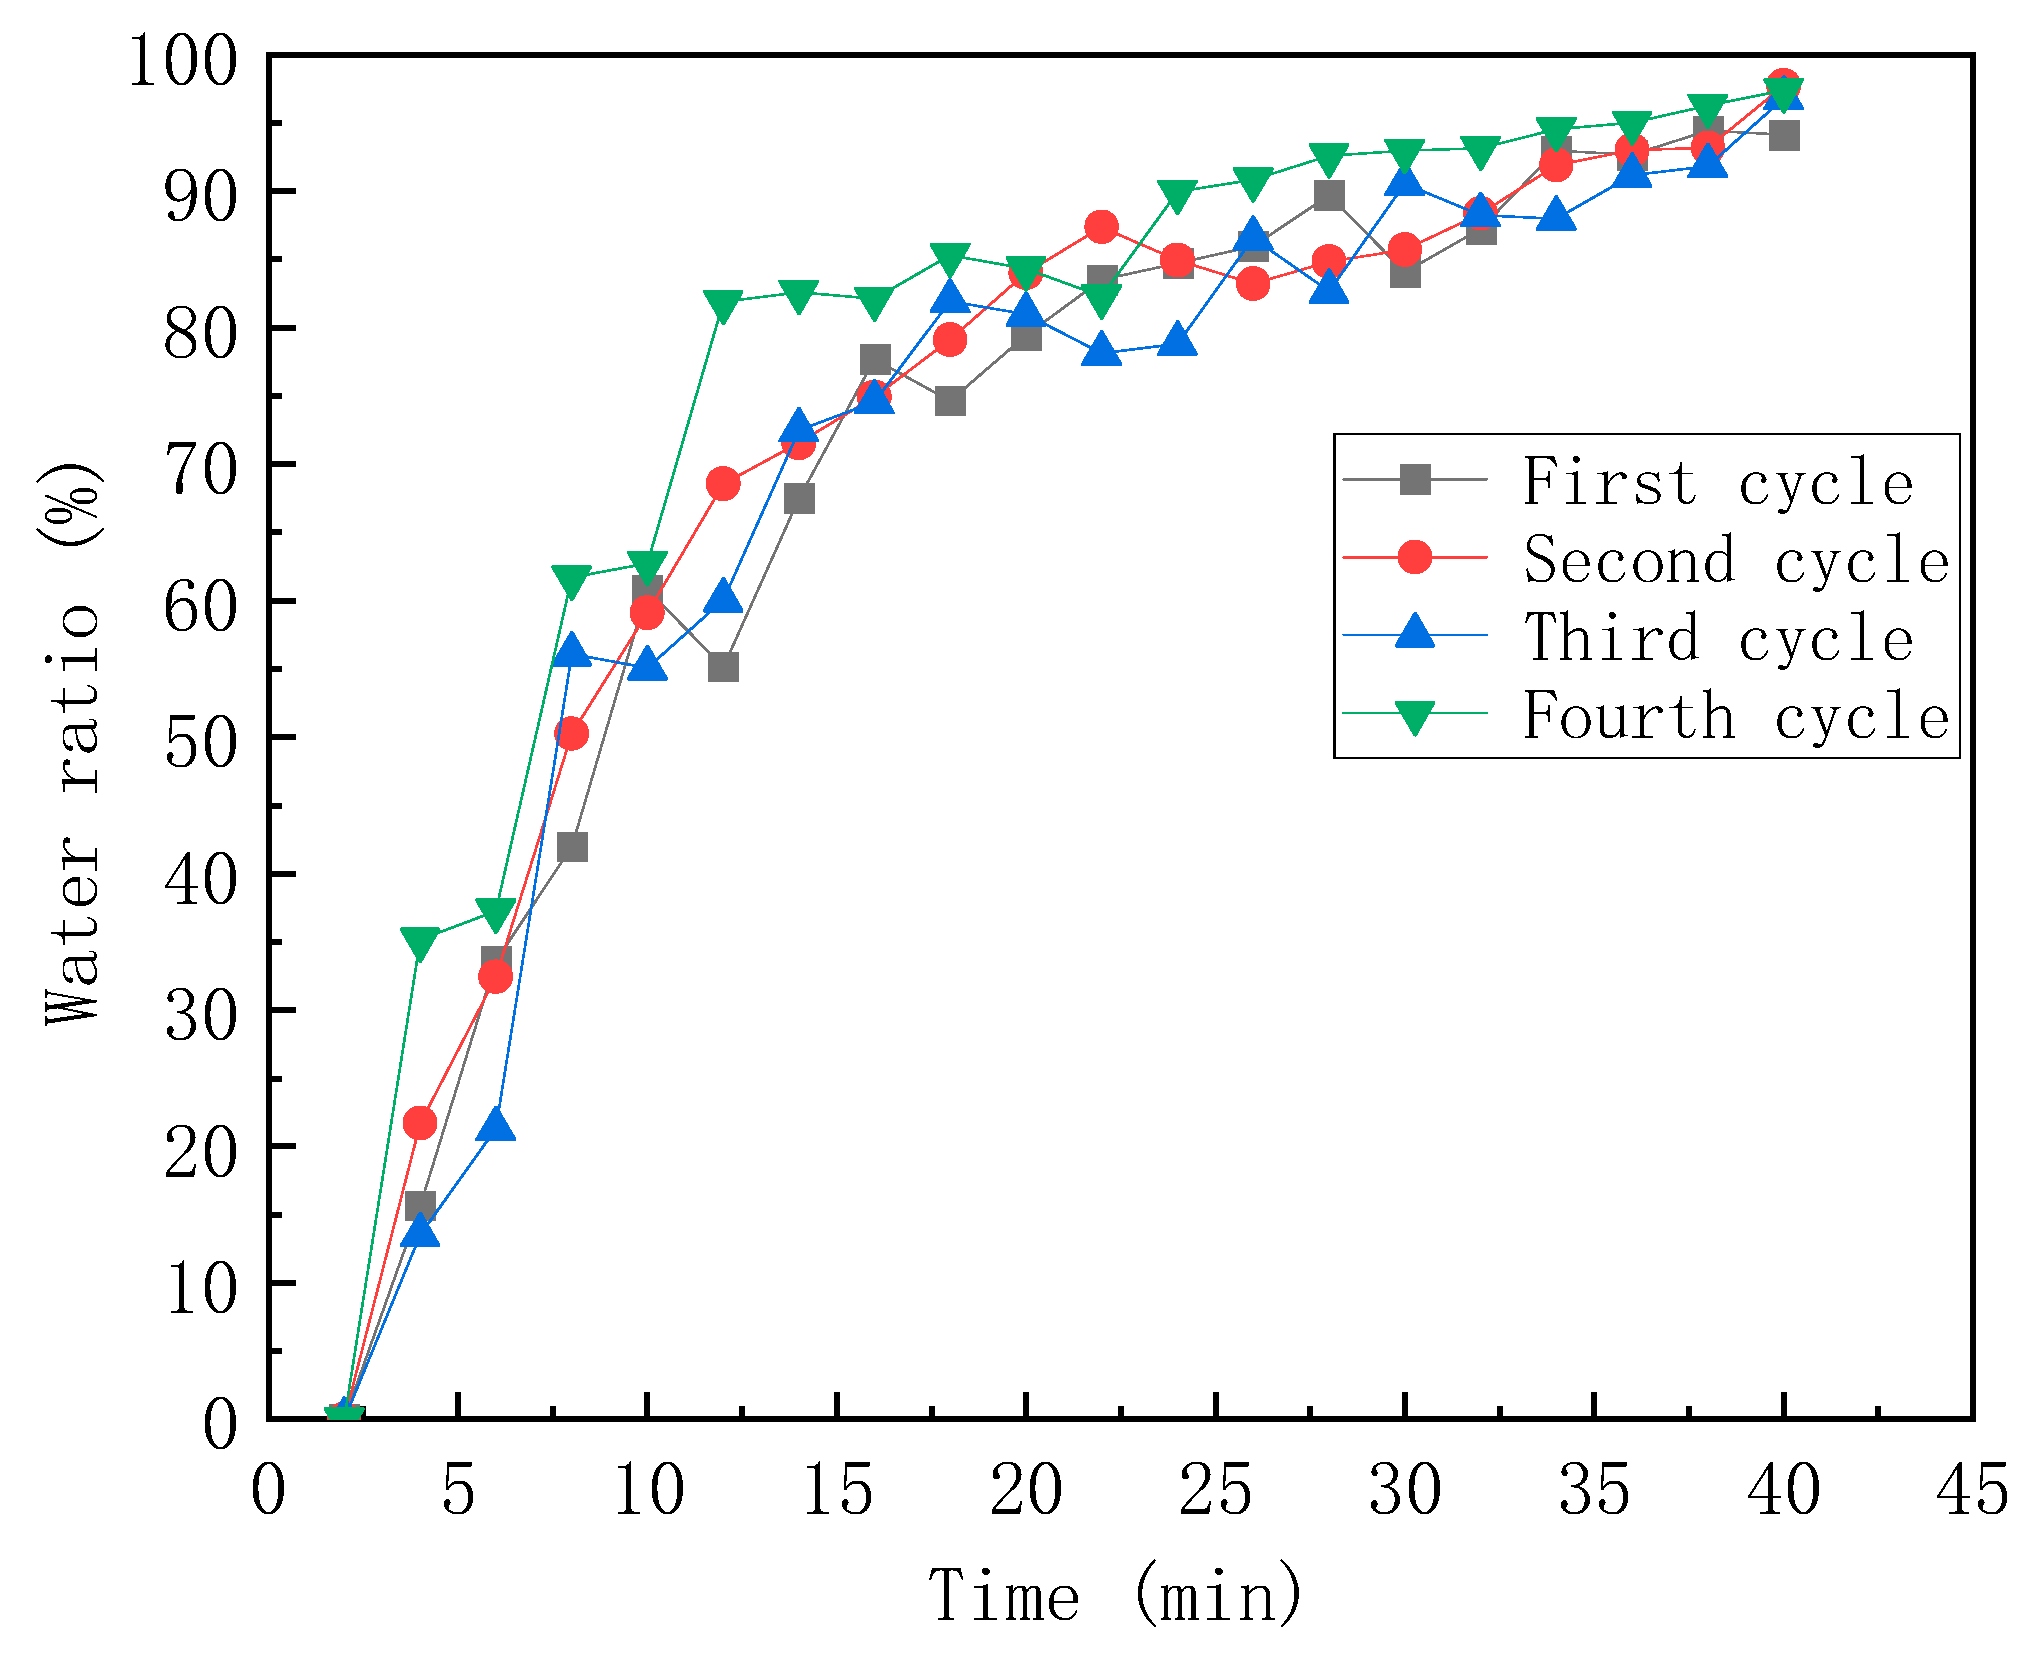
Figure 8 illustrates the water content of the produced liquid for each cycle. The increase in water content during the first three throughput cycles exhibits a comparable trend. However, in the fourth cycle, there is a notable deviation. The initial water content value for the fourth cycle reaches 36%, and by the 12th minute, the water content surpasses 80%, remaining consistently high thereafter. This observation can be attributed to the rapid production of steam injected during the fourth cycle. The steam preferentially follows high-permeability pathways during the extraction process, leading to an elevated water content in the produced liquid.

Figure 8.
Water content in the four cycles of pure steam stimulation.
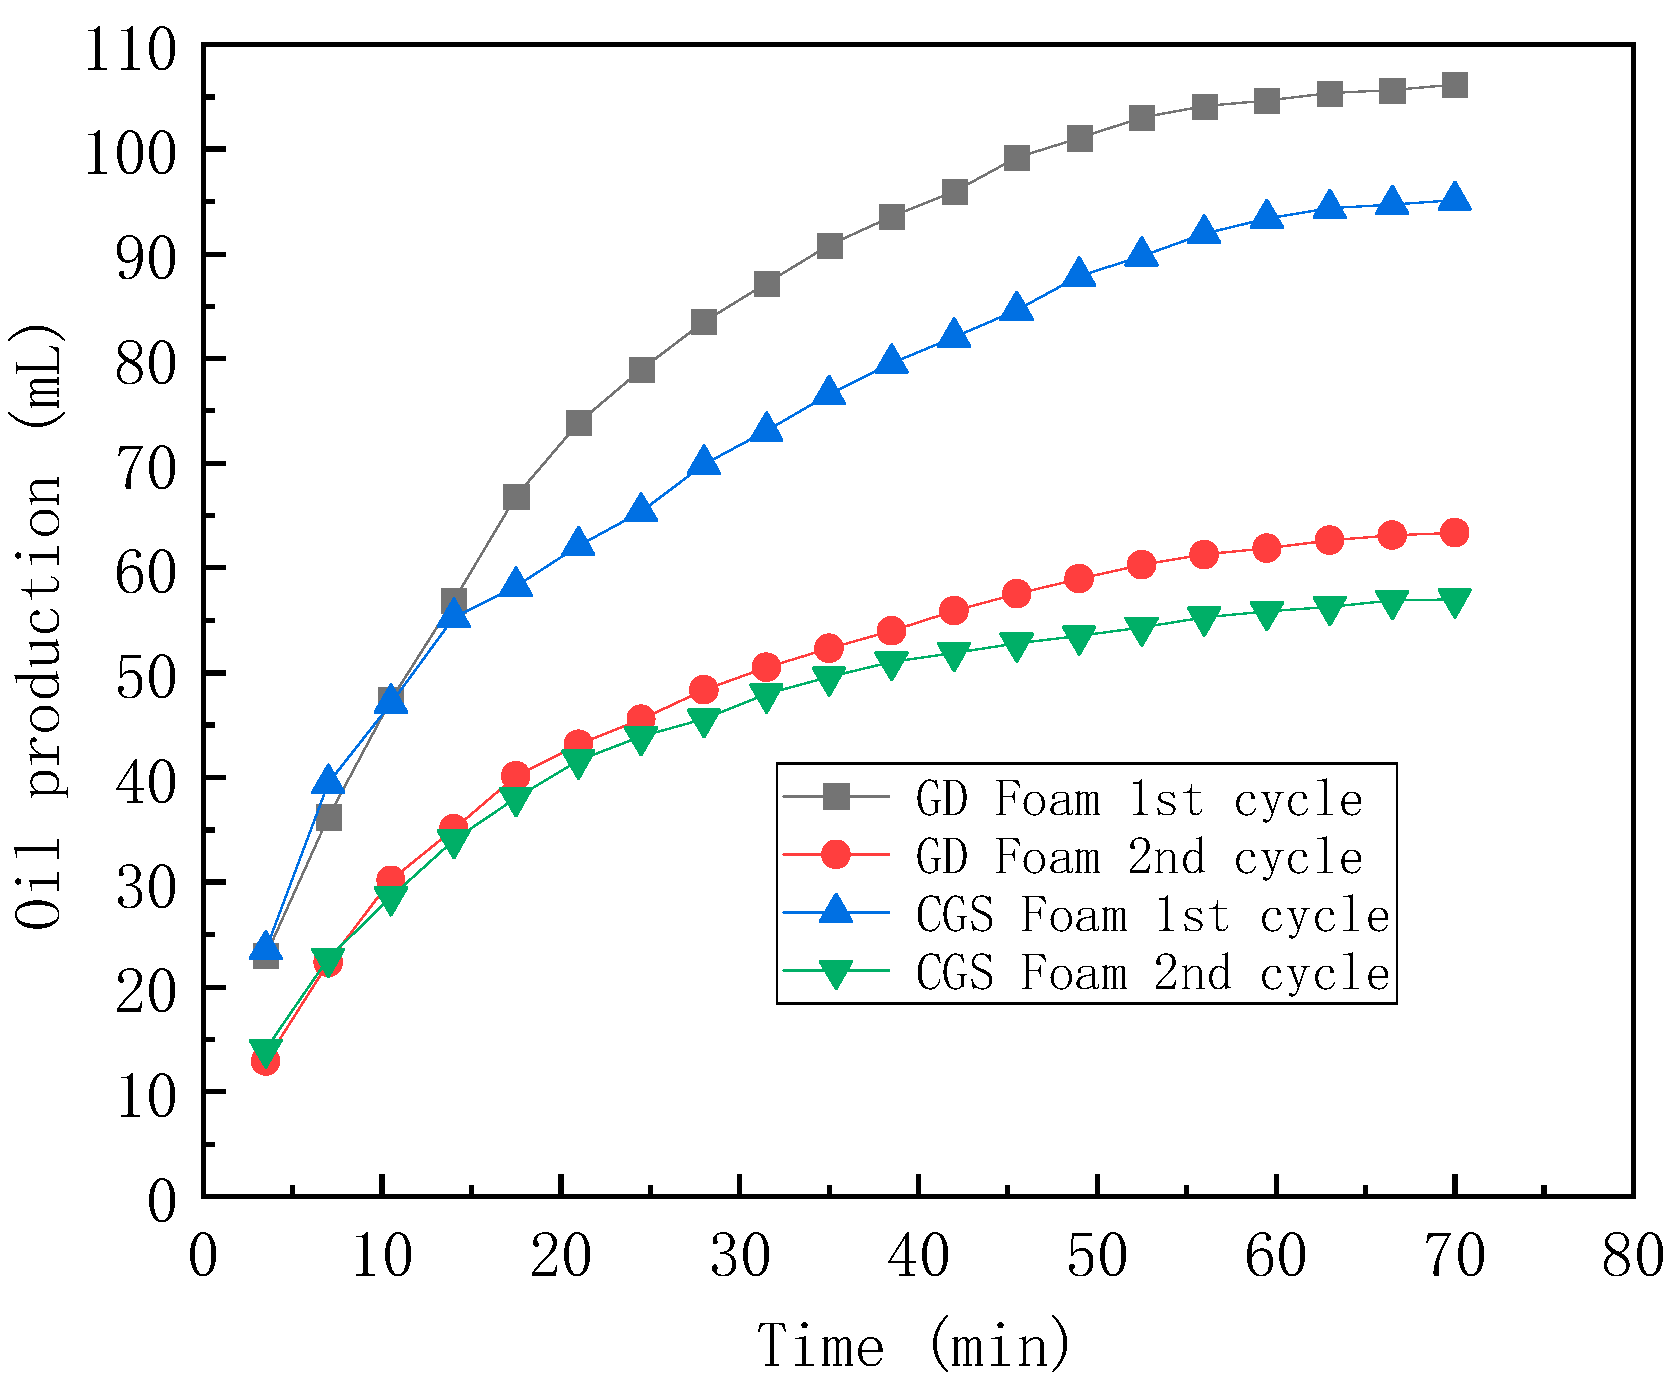
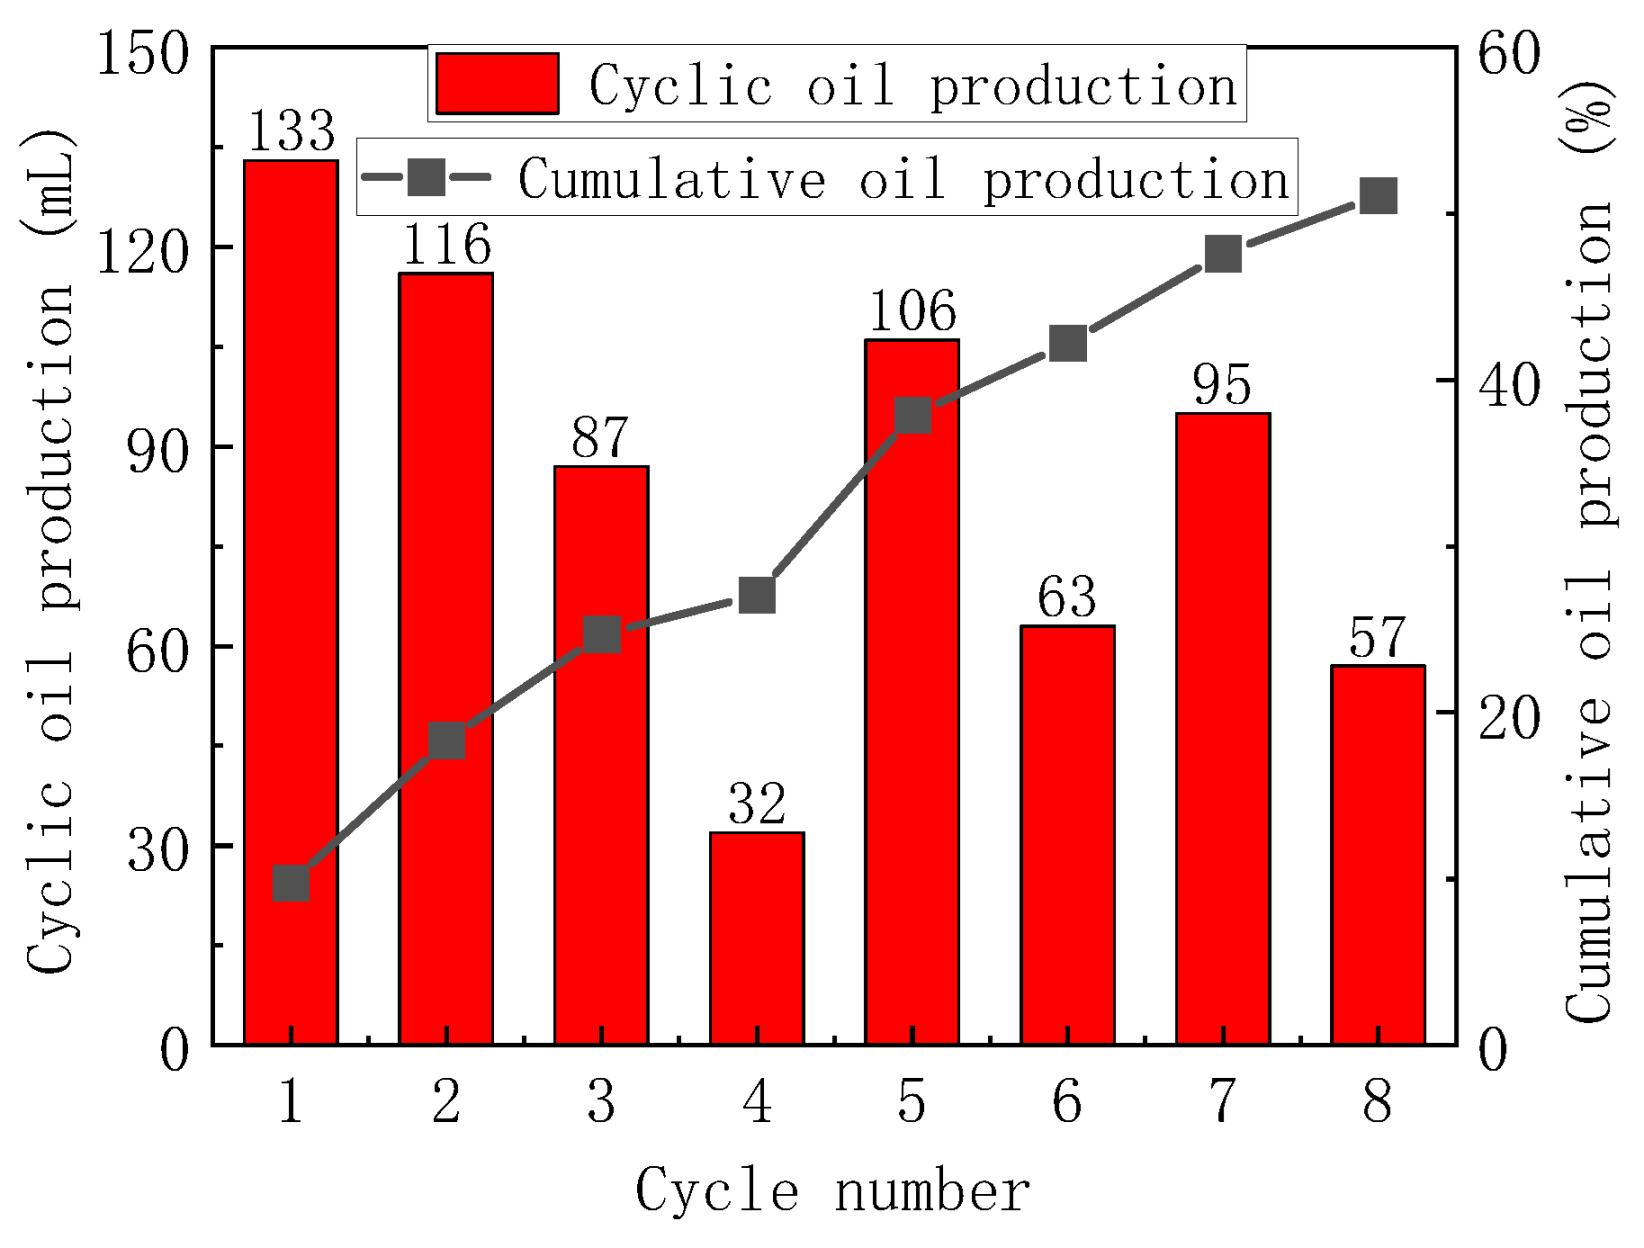
Figure 9 illustrates the oil recovery trend for pure steam stimulation, revealing a rapid decline in oil production during the third and fourth cycles. Turning to Figure 10, the oil production curve for steam huff and puff combined with foam is presented. Here, it is apparent that the performance of pure GD foam does not match up to that of CGS foam. Figure 11 provides a comparative overview of oil production across each cycle. The incorporation of foam notably enhances crude oil recovery within a single cycle. This enhancement is attributed to the expanded steam heating area, which curtails the rapid production of high-temperature water through high-permeability channels during the recovery process. Notably, the efficacy of pure GD foam diminishes with increasing puff cycles. Throughout the seventh and eighth steam stimulation cycles, the addition of CGS foam enhances the recovery factor during the recovery process. Despite a consistent volume of injected foam, the steam’s reach is not significantly expanded, but the oil recovery impact is greater. These observations underscore the considerably improved capacity of enhanced foam to obstruct high-permeability channels, a consequence of enhanced foam stability and its resistance to rupture. Furthermore, particle deposition within the porous medium contributes to a robust plugging effect.

Figure 9.
Oil production in pure steam huff and puff.

Figure 10.
Oil production in steam huff and puff with foam.

Figure 11.
Volume and cumulative recovery rate of oil recovery in each cycle.
3.5. Foam Enhances Formation Energy
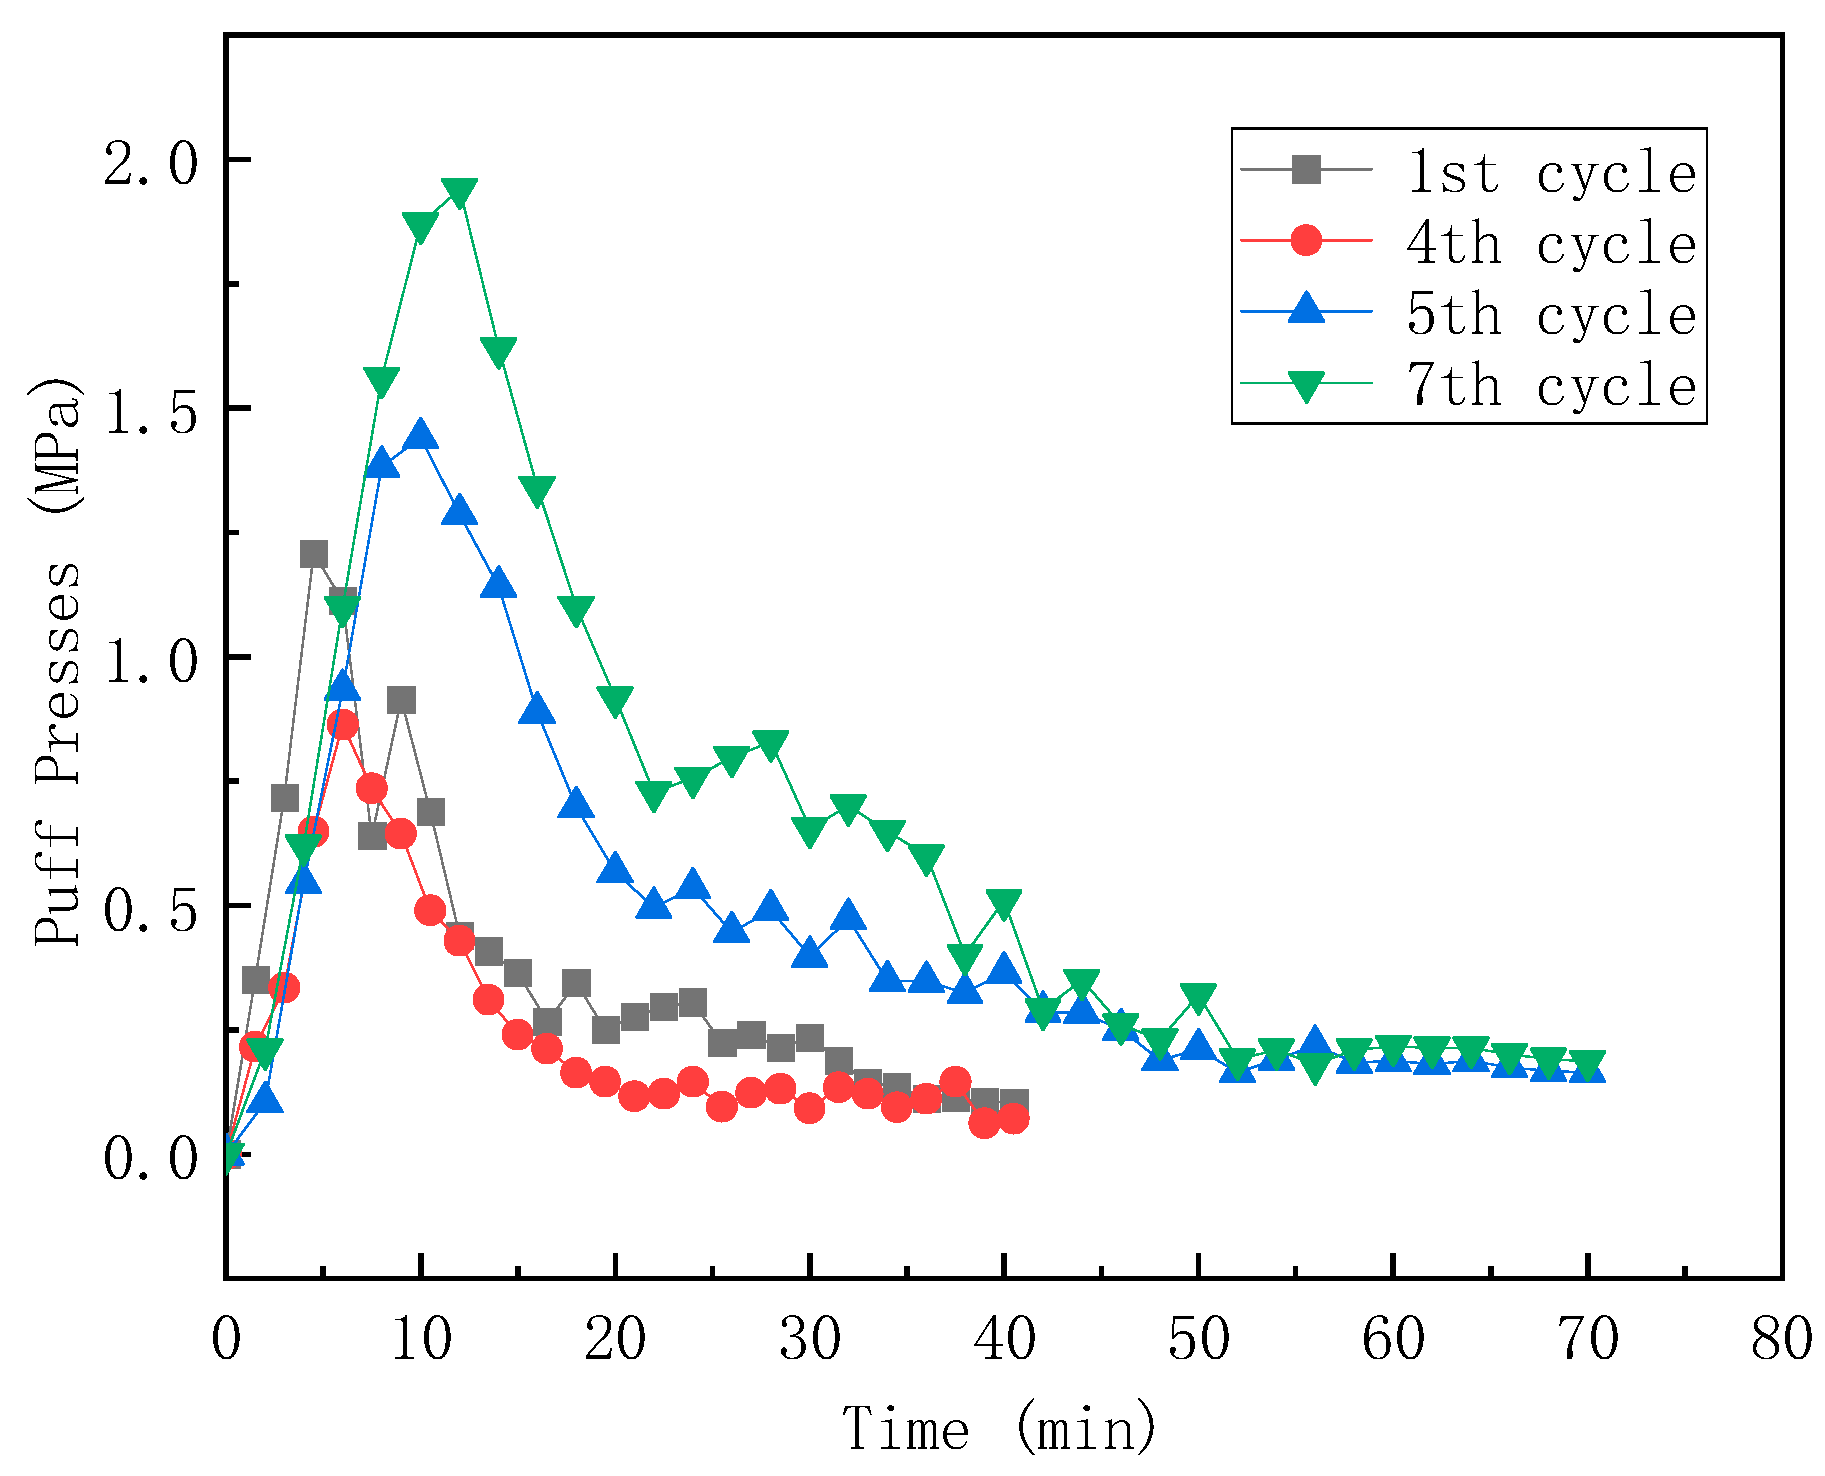
As the number of steam huff and puff cycles increases, a greater number of high-permeability channels emerge near the wellbore, resulting in a rapid decrease in flow resistance during the recovery process. This trend is depicted in Figure 12, where the maximum flow resistance decreases from 1.95 MPa to 0.82 MPa after the initial cycle. Following the fifth round of foam-assisted steam stimulation, the flow resistance increases once again, indicating the effective plugging of large pores within the simulated subsurface during recovery. In the seventh cycle, the injection of CGS foam reverses the declining trend in oil recovery observed during the sixth cycle, concurrently establishing a new level of flow resistance. Notably, the injection of foam induces the retrograde movement of maximum resistance. This reversal is more pronounced in the seventh cycle than in the fifth cycle. The formation thus accumulates more energy, gradually releasing it over time. This phenomenon is advantageous for extending the production duration.

Figure 12.
Pressure curve for each cycle.
3.6. Flow Characteristics
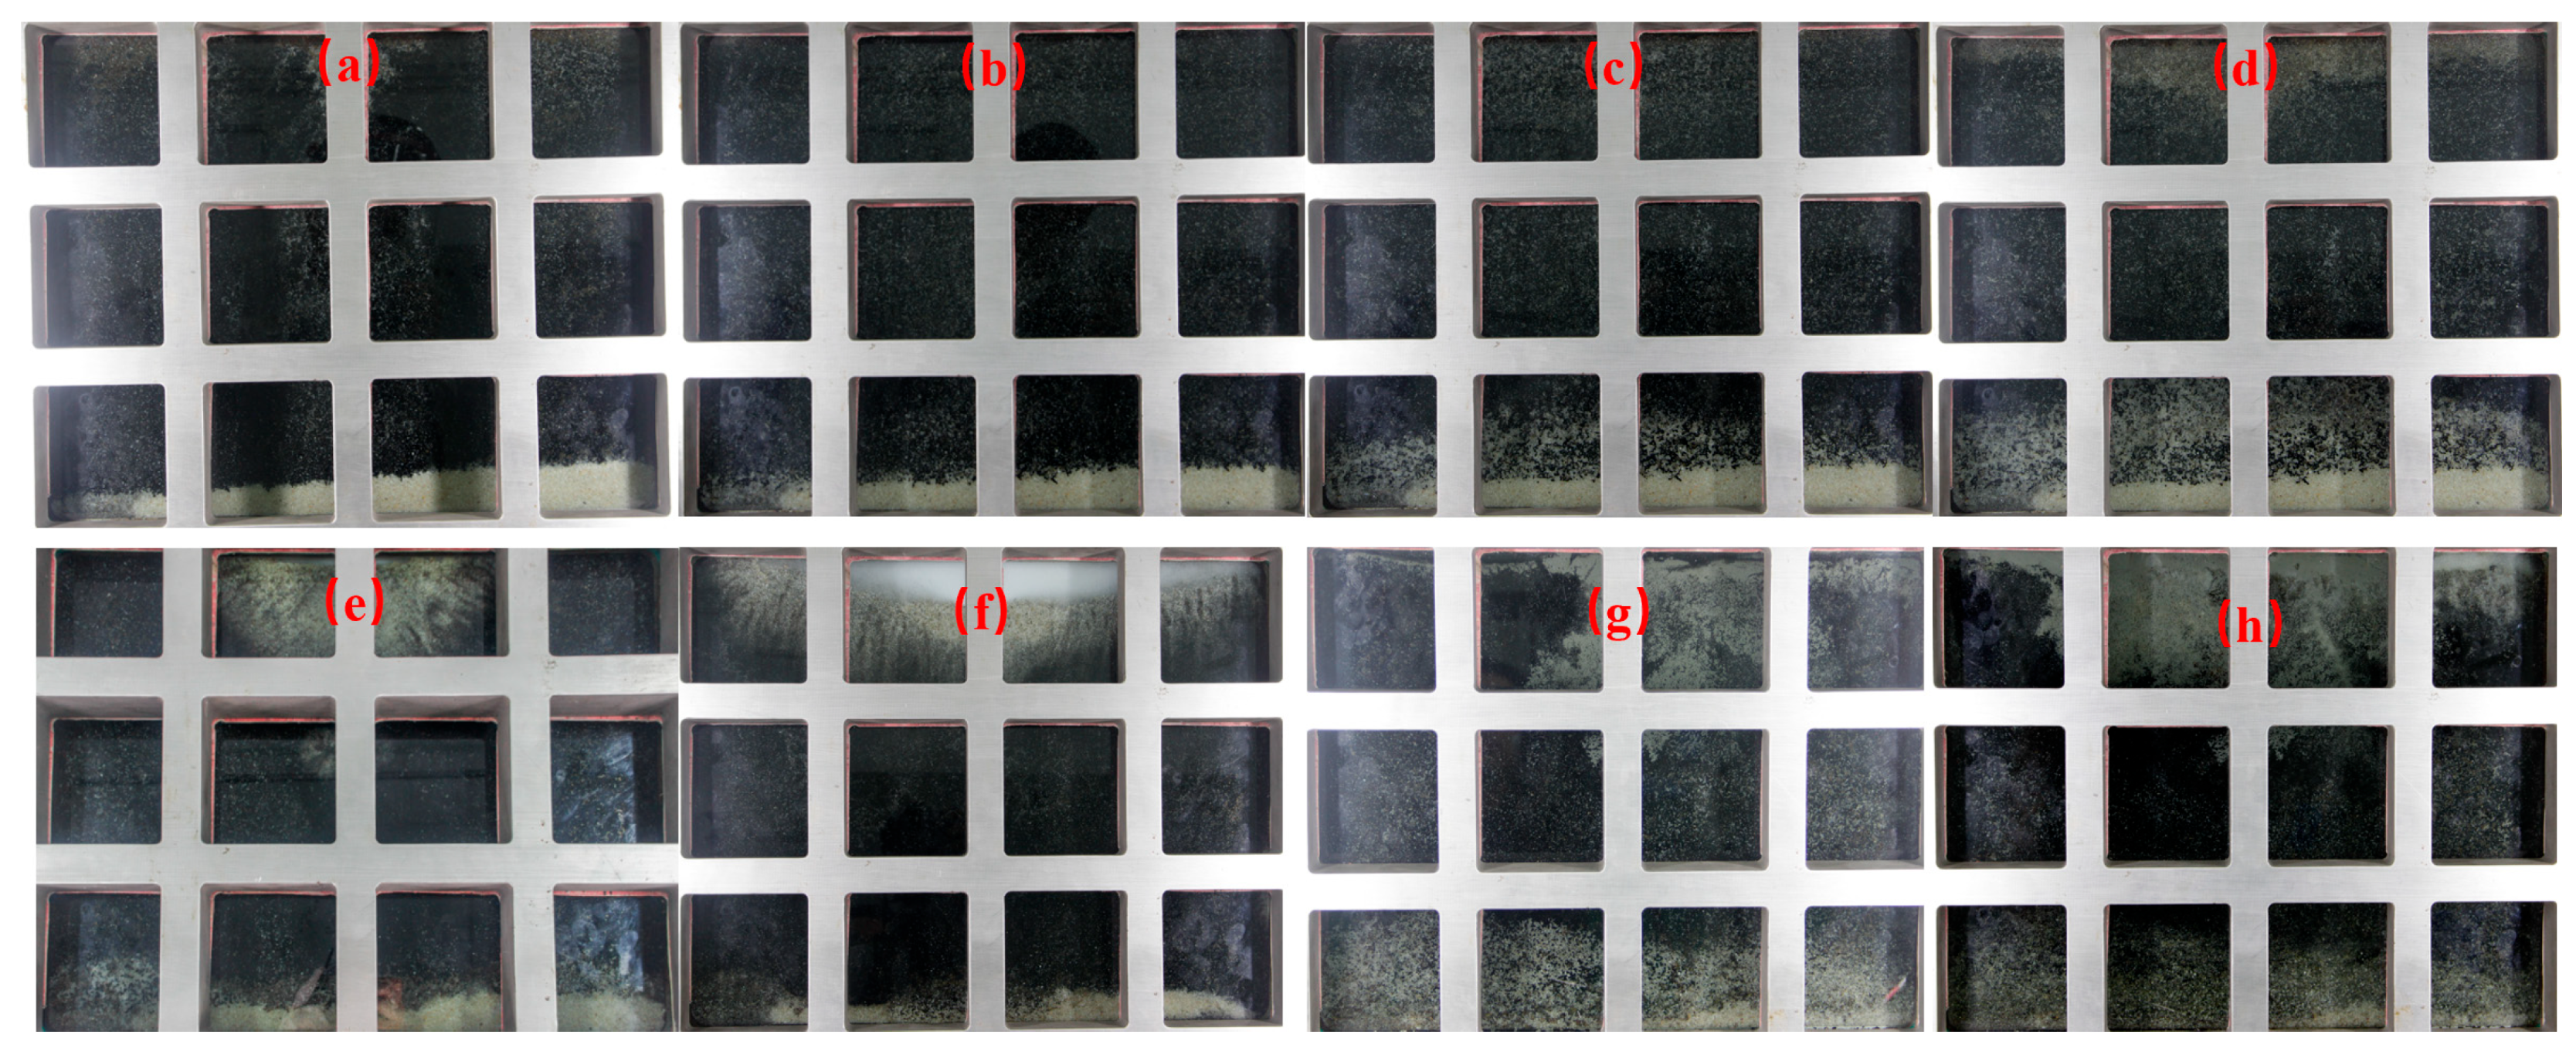
The images following each injection cycle are displayed in Figure 13. In the initial four cycles of pure steam stimulation (Figure 13a–d), the color in the vicinity of the well gradually lightened. Upon the introduction of foam during the fifth (Figure 13e) and sixth (Figure 13f) cycles, the efficiency of crude oil extraction from the core improved. However, it is worth noting that the permeability of the water phase near the well also increased rapidly during this phase. The stability duration of GD foam in the simulated reservoir was shorter compared with that of CGS foam. GD foam could not maintain a stable presence in the porous medium for an extended period. Subsequently, during the seventh (Figure 13g) and eighth (Figure 13h) cycles of cyclic steam stimulation, CGS foam was introduced into the simulated reservoir. In the seventh cycle, the CGS foam flowed along pre-existing high-permeability channels, while in the eighth cycle, it penetrated areas that had not been obstructed in the seventh cycle.

Figure 13.
Photos at the end of each injection stage in each cycle: (a) first cycle steam injection, (b) second cycle steam injection, (c) third cycle steam injection, (d) fourth cycle steam injection, (e) first cycle GD-foam-assisted steam injection, (f) second cycle GD-foam-assisted steam injection, (g) first cycle CGS-foam-assisted steam injection, (h) second cycle CGS-foam-assisted steam injection.
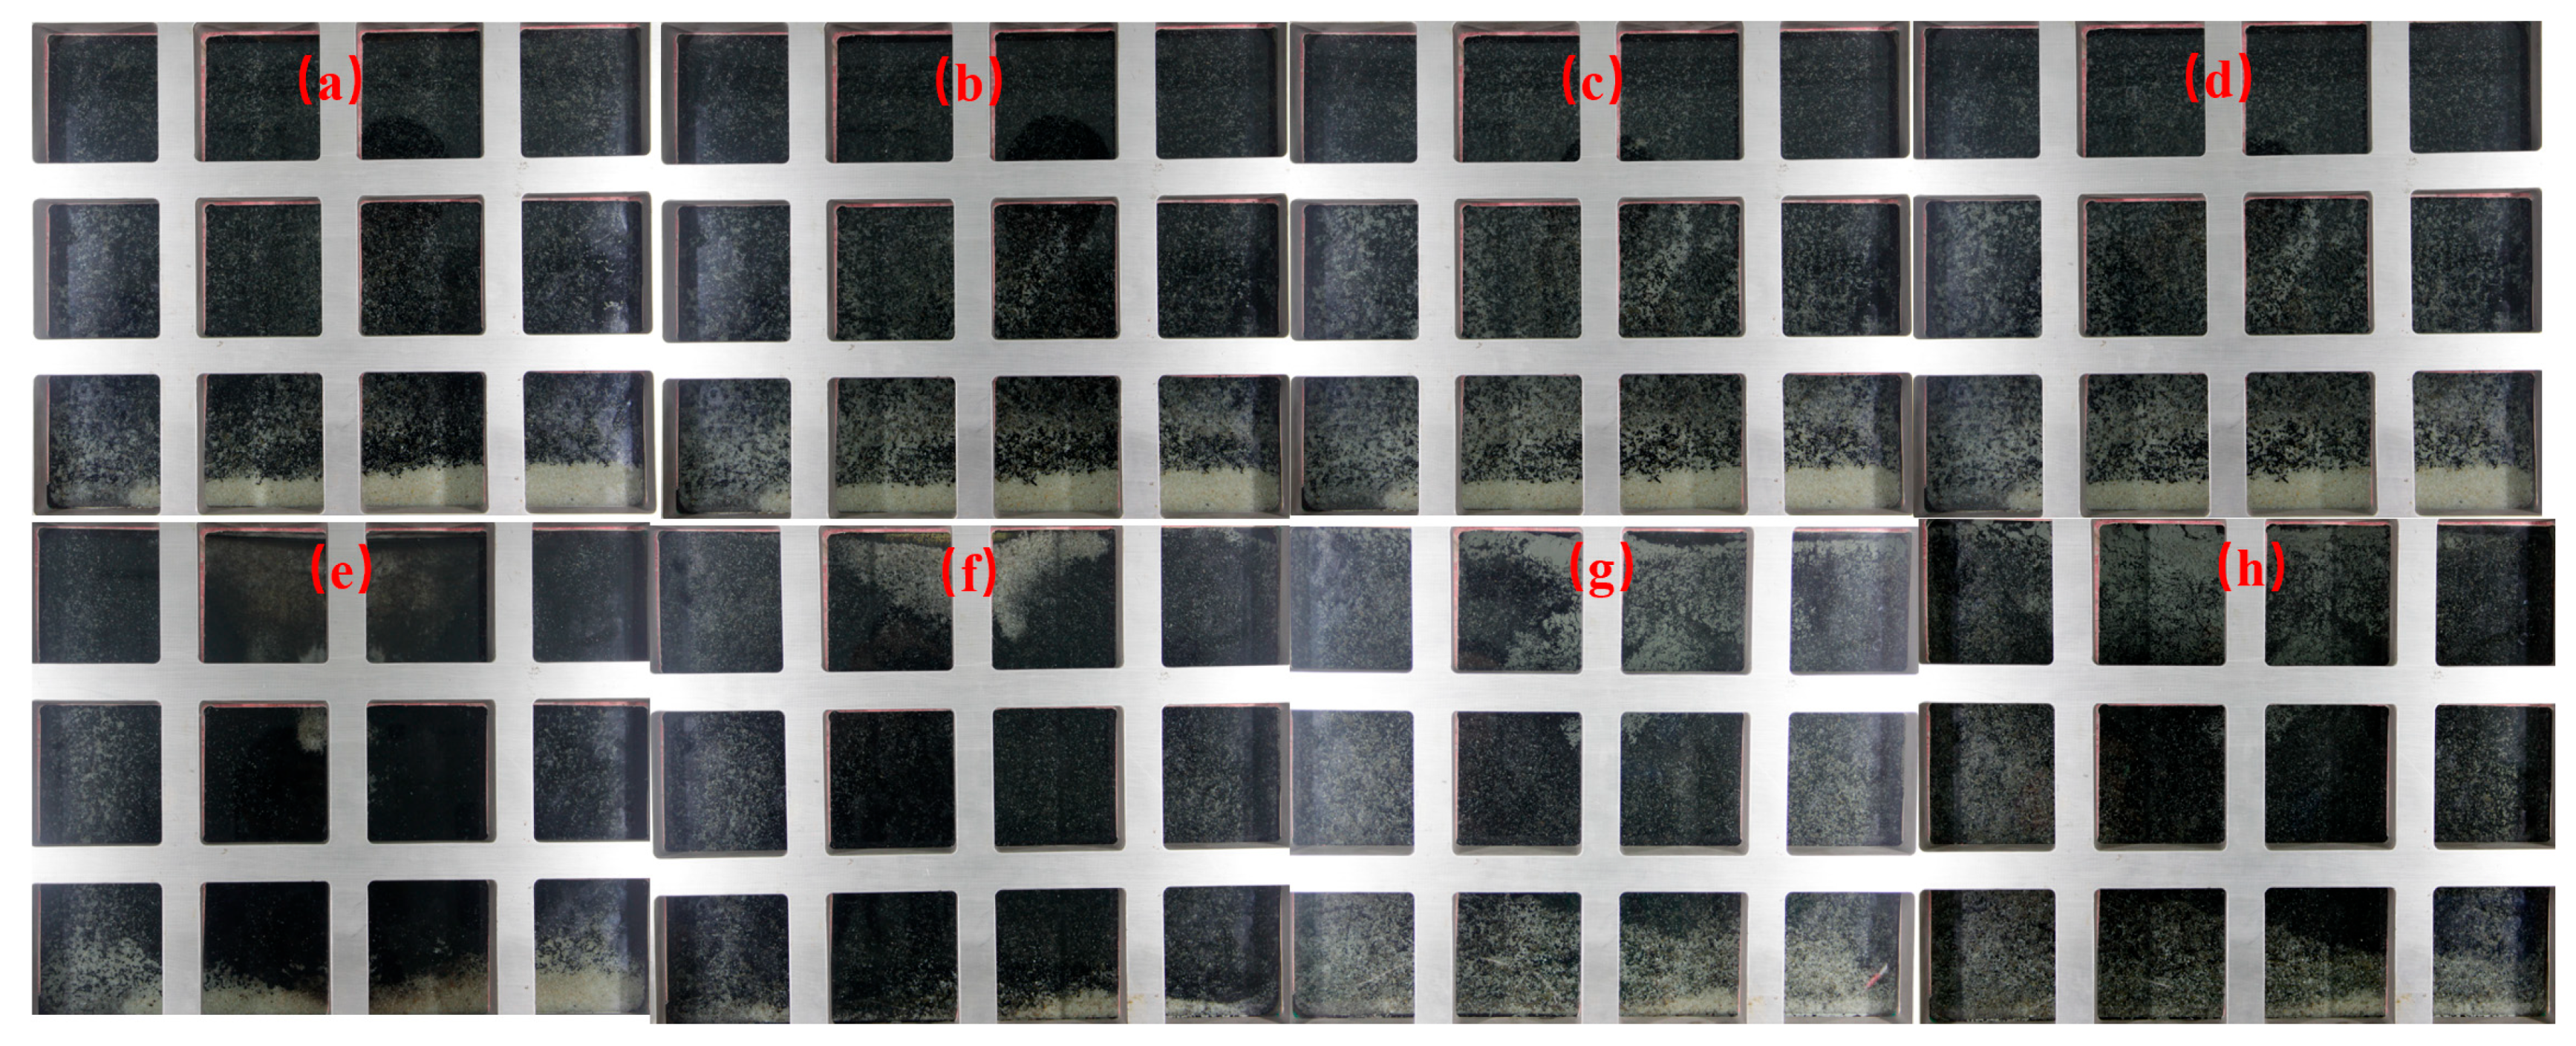
Figure 14 illustrates the state at the conclusion of each steam stimulation cycle. After the initial four cycles of pure steam stimulation (Figure 14a–d), the waterline at the model’s bottom gradually rose, and the central region became lighter in color. The presence of GD foam during the fifth (Figure 14e) and sixth (Figure 14f) cycles effectively prevented water from migrating along the central area towards the production well. As a result, both sides of the model became lighter in color. In the images, only a small amount of foam is visible in this area. This is because some of the foam was extracted during the production process, and the remaining foam within the formation dissipated. In the photos of the seventh and eighth cycles, a substantial number of particles and foam residue can be observed within the formation at the conclusion of the recovery process. This phenomenon occurred in areas where CGS foam had flowed during the injection process. This observation confirms that CGS foam is more stable and effective compared with GD foam. The images from the seventh (Figure 14g) cycle reveal a decrease in the crude oil content within the high-permeability channels on both sides of the model. The foam introduced during the eighth (Figure 14h) cycle infiltrated the high-permeability channel formed in the seventh cycle, and other areas with a high saturation of remaining oil in the model further developed. This demonstrates that CGS foam consistently and autonomously selects high-permeability channels, residing in these areas for extended plugging. Consequently, more water flows through regions with higher remaining oil contents, validating that foam plugging is a more intelligent method.

Figure 14.
Photos at the end of the extraction stage in each cycle: (a) first cycle steam injection, (b) second cycle steam injection, (c) third cycle steam injection, (d) fourth cycle steam injection, (e) first cycle GD-foam-assisted steam injection, (f) second cycle GD-foam-assisted steam injection, (g) first cycle CGS-foam-assisted steam injection, (h) second cycle CGS-foam-assisted steam injection.
3.7. Changes in Temperature Field
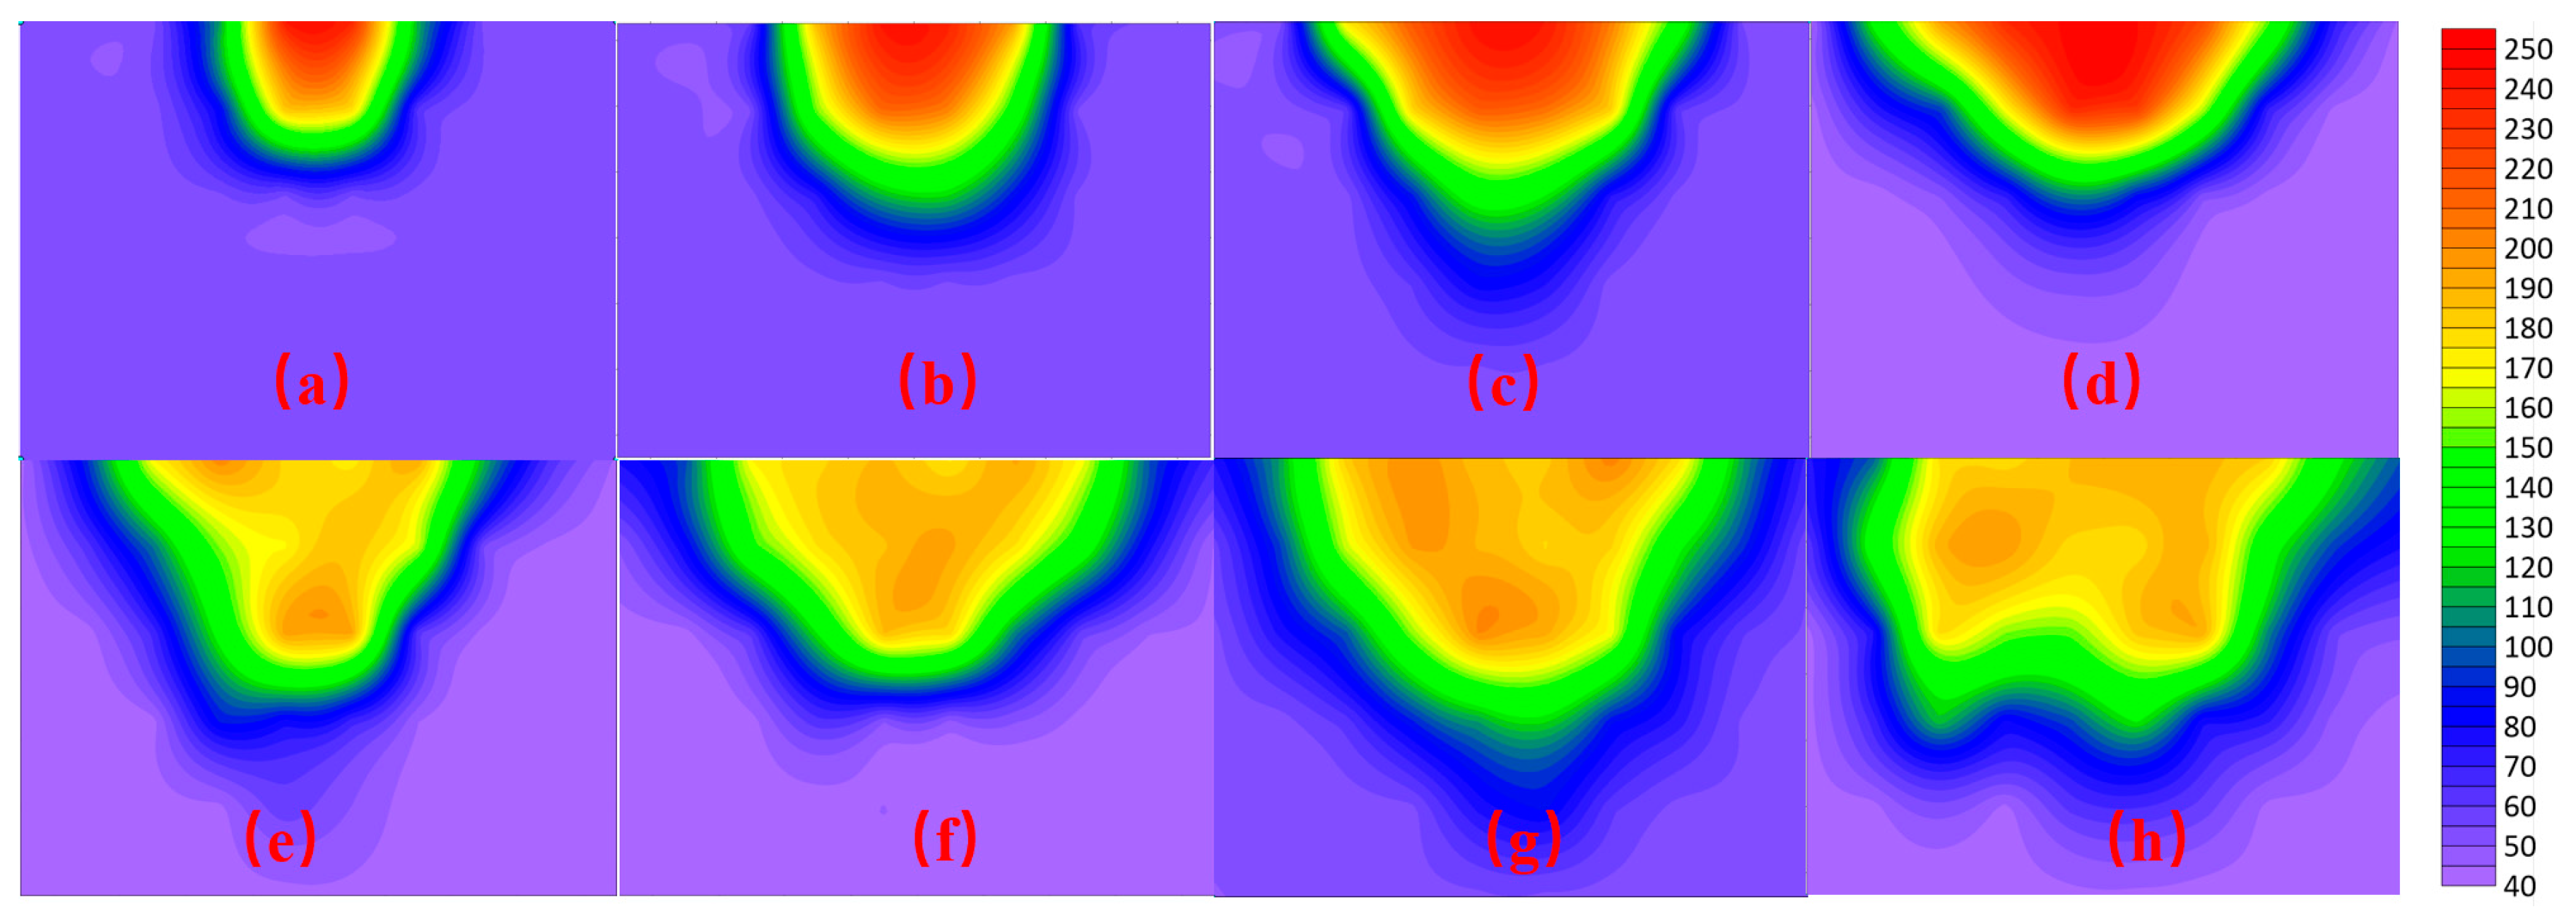
The radius of the area heated by steam is an important parameter to measure the effectiveness of steam stimulation and predicting crude oil production. The area of the steam chamber in the first to third cycles continued to increase with the number of cycles, and the scanning ratio increased from 13.4% to 24.6%, but the area in the fourth cycle was only 26.1%. The area of the steam chamber hardly continued to expand. The injection of foam reduced the core temperature of the steam chamber. The average temperature of the steam chamber in the fourth cycle was 241.2 °C, and the value in the fifth cycle decreased to 203.4 °C. But, the area affected by steam increased from 26.1% to 35.6%. It can be seen from Figure 15 that after four cycles of steam huff and puff, the saturation of the crude oil in the middle area of the steam chamber decreased significantly. The decrease in the core temperature of the steam chamber had little effect on the weakening of the oil displacement efficiency, but the expansion of the area of the steam chamber had a greater increase in oil recovery efficiency.

Figure 15.
Temperature field at the end of each injection cycle: (a) first cycle steam injection, (b) second cycle steam injection, (c) third cycle steam injection, (d) fourth cycle steam injection, (e) first cycle GD-foam-assisted steam injection, (f) second cycle GD-foam-assisted steam injection, (g) first cycle CGS-foam-assisted steam injection, (h) second cycle CGS-foam-assisted steam injection.
4. Conclusions
- (1)
- The comparison between CGS foam and GD foam shows that the stability of foam is increased by six times by particles and the temperature resistance of the foam is also improved.
- (2)
- CGS foam is suitable for formations with a permeability of 3000 mD, and the plugging performance of CGS foam in sand-packed pipes is stronger than that of pure GD foam. CGS foam is easier to be injected into formation than graphite clay particles.
- (3)
- The area swept by the injected steam mainly increased in the first four rounds during steam stimulation. After the injection of GD foam, the swept area of steam increased from 26.1% to 35.6%.
- (4)
- The particles in CGS foam can persist in the high-permeability channel in the formation. CGS foam is better than GD foam at changing the trend of crude oil production decline with the increase in huff and puff cycle.
Author Contributions
Conceptualization, Z.L. (Zengmin Lun) and Z.L. (Zhaomin Li); data curation, M.W., J.D., M.L. and D.W.; writing—original draft preparation, M.W.; writing—review and editing, Y.T.; project administration, Z.L. (Zengmin Lun) and Z.L. (Zhaomin Li). All authors have read and agreed to the published version of the manuscript.
Funding
This research was funded by the [National Natural Science Foundation of China] grant number [U20B6003] and the [Natural Science Foundation of Shandong Province, China] grant number [ZR2020QE106].
Data Availability Statement
The data presented in this study are available on request from the corresponding author. The data are not publicly available due to the large volume of data.
Acknowledgments
We are grateful to the Shandong Engineering Research Center for CO2 Utilization and Storage for their kind help in this study. The valuable comments made by the anonymous reviewers are also sincerely appreciated. Thanks to “Independent Prospective Basic Project of State Key Laboratory of Offshore Oil Exploitation in 2023”.
Conflicts of Interest
The authors declare no conflict of interest.
References
- Wang, Z.J.; Li, S.Y.; Jin, Z.J.; Li, Z.M.; Liu, Q.Y.; Zhang, K.Q. Oil and gas pathway to net-zero: Review and outlook. Energy Strategy Rev. 2023, 45, 101048. [Google Scholar] [CrossRef]
- Akbilgic, O.; Zhu, D.; Gates, I.D.; Bergerson, J.A. Prediction of steam-assisted gravity drainage steam to oil ratio from reservoir characteristics. Energy 2015, 93, 1663–1670. [Google Scholar] [CrossRef]
- Baghernezhad, D.; Siavashi, M.; Nakhaee, A. Optimal scenario design of steam-assisted gravity drainage to enhance oil recovery with temperature and rate control. Energy 2019, 166, 610–623. [Google Scholar] [CrossRef]
- Mozaffari, S.; Nikookar, M.; Ehsani, M.R.; Sahranavard, L.; Roayaie, E.; Mohammadi, A.H. Numerical modeling of steam injection in heavy oil reservoirs. Fuel 2013, 112, 185–192. [Google Scholar] [CrossRef]
- Shafiei, A.; Dusseault, M.B.; Zendehboudi, S.; Chatzis, I. A new screening tool for evaluation of steamflooding performance in Naturally Fractured Carbonate Reservoirs. Fuel 2013, 108, 502–514. [Google Scholar] [CrossRef]
- Lu, T.; Ban, X.; Guo, E.; Li, Q.; Gu, Z.; Peng, D. Cyclic In-Situ Combustion Process for Improved Heavy Oil Recovery after Cyclic Steam Stimulation. SPE J. 2022, 27, 1447–1461. [Google Scholar] [CrossRef]
- Zhao, D.W.; Wang, J.; Gates, I.D. Thermal recovery strategies for thin heavy oil reservoirs. Fuel 2014, 117, 431–441. [Google Scholar] [CrossRef]
- Fan, H.J.; Fan, T.E.; Deng, J.H.; Zhang, L.J.; Zheng, W.; Chen, L.F.; Ge, Z.Z.; Xie, H.J.; Liang, X. The Influence of Interlayer on the Development of Steam Chamber in Steam Stimulation during Heavy Oil Recovery. Processes 2023, 11, 1742. [Google Scholar] [CrossRef]
- Yang, M.; Chai, M.J.; Yu, X.R.; Wang, S.; Feng, Q.H.; Chen, Z.X. Insights into in-situ upgrading of bitumen in the hybrid of steam and combustion process: From experimental analysis aspects. J. Pet. Sci. Eng. 2022, 217, 110894. [Google Scholar] [CrossRef]
- Aounallah, K. Efficient Simulation and Analysis of the Effects of Permeability on the In-Situ Combustion of Heavy Oils. In Proceedings of the SPE Annual Technical Conference and Exhibition, Calgary, AB, Canada, 30 September–2 October 2019. [Google Scholar]
- Bao, Y.; Wang, J.; Gates, I.D. On the physics of cyclic steam stimulation. Energy 2016, 115, 969–985. [Google Scholar] [CrossRef]
- Chen, H.; Chen, Z.; Wei, B.; Jiang, Q. A novel approach for quantitative characterization of aqueous in-situ foam dynamic structure based on fractal theory. Fuel 2023, 352, 129149. [Google Scholar] [CrossRef]
- Songliang, P.; Aiwu, Y.; Hua, J.; Shoujun, Z. Cyclic Preheating Test in SAGD Horizontal Wells of Liaohe Oilfield. In Proceedings of the International Oil and Gas Conference and Exhibition in China, Beijing, China, 8–10 June 2010. [Google Scholar]
- Srinivasareddy, D.; Kumar, G.S. A Numerical Study on Phase Behavior Effects in Enhanced Oil Recovery by In Situ Combustion. Pet. Sci. Technol. 2015, 33, 353–362. [Google Scholar] [CrossRef]
- Xianghong, W.; Anzhu, X.; Hailiang, F. An integrated evaluation on factors affecting the performance of superheated steam huff and puff in heavy oil reservoirs. Pet. Explor. Dev. Online 2010, 37, 608–613. [Google Scholar] [CrossRef]
- Xu, A.; Mu, L.; Fan, Z.; Wu, X.; Zhao, L.; Bo, B.; Xu, T. Mechanism of heavy oil recovery by cyclic superheated steam stimulation. J. Pet. Sci. Eng. 2013, 111, 197–207. [Google Scholar] [CrossRef]
- Babadagli, T.; Al-Bemani, A. Investigations on matrix recovery during steam injection into heavy-oil containing carbonate rocks. J. Pet. Sci. Eng. 2007, 58, 259–274. [Google Scholar] [CrossRef]
- Wang, Z.J.; Li, S.Y.; Li, Z.M. A novel strategy to reduce carbon emissions of heavy oil thermal recovery: Condensation heat transfer performance of flue gas-assisted steam flooding. Appl. Therm. Eng. 2022, 205, 638–651. [Google Scholar] [CrossRef]
- Tang, G.-Q.; Lowry, D.; Lee, V. Recovery Mechanism of Steam Injection in Carbonate Reservoir. In Proceedings of the SPE Western North American Region Meeting, Anchorage, AL, USA, 7–11 May 2011. [Google Scholar]
- Luo, E.; Fan, Z.; Hu, Y.; Zhao, L.; Bo, B.; Yu, W.; Liang, H.; Liu, M.; Liu, Y.; He, C.; et al. An efficient optimization framework of cyclic steam stimulation with experimental design in extra heavy oil reservoirs. Energy 2020, 192, 116601. [Google Scholar] [CrossRef]
- Qu, T.; Li, S. Technique of enhancing recovery of remaining oil in heavy oil reservoirs by horizontal wells. Pet. Explor. Dev. 2009, 36, 743–748. [Google Scholar]
- Pang, Z.X.; Liu, H.Q.; Zhu, L. A laboratory study of enhancing heavy oil recovery with steam flooding by adding nitrogen foams. J. Pet. Sci. Eng. 2015, 128, 184–193. [Google Scholar] [CrossRef]
- Sun, Q.; Li, Z.; Li, S.; Jiang, L.; Wang, J.; Wang, P. Utilization of Surfactant-Stabilized Foam for Enhanced Oil Recovery by Adding Nanoparticles. Energy Fuels 2014, 28, 2384–2394. [Google Scholar] [CrossRef]
- Sun, Q.; Li, Z.; Wang, J.; Li, S.; Li, B.; Jiang, L.; Wang, H.; Lü, Q.; Zhang, C.; Liu, W. Aqueous foam stabilized by partially hydrophobic nanoparticles in the presence of surfactant. Colloids Surf. A Physicochem. Eng. Asp. 2015, 471, 54–64. [Google Scholar] [CrossRef]
- Telmadarreie, A.; Trivedi, J.J. New Insight on Carbonate-Heavy-Oil Recovery: Pore-Scale Mechanisms of Post-Solvent Carbon Dioxide Foam/Polymer-Enhanced-Foam Flooding. SPE J. 2016, 21, 1655–1668. [Google Scholar] [CrossRef]
- Li, S.; Li, Z.; Lin, R. Mathematical models for foam-diverted acidizing and their applications. Pet. Sci. 2008, 5, 145–152. [Google Scholar] [CrossRef]
- Espinosa, D.; Caldelas, F.; Johnston, K.; Bryant, S.L.; Huh, C. Nanoparticle-Stabilized Supercritical CO2 Foams for Potential Mobility Control Applications. In Proceedings of the SPE Improved Oil Recovery Symposium, Tulsa, OK, USA, 24–28 April 2010. SPE–129925-MS. [Google Scholar]
- Ernsting, M.J.; Murakami, M.; Roy, A.; Li, S.-D. Factors controlling the pharmacokinetics, biodistribution and intratumoral penetration of nanoparticles. J. Control. Release 2013, 172, 782–794. [Google Scholar] [CrossRef] [PubMed]
- Binks, B.P.; Kirkland, M.; Rodrigues, J.A. Origin of stabilisation of aqueous foams in nanoparticle–surfactant mixtures. Soft Matter 2008, 4, 2373–2382. [Google Scholar] [CrossRef]
- Geng, P.; Zore, A.; Van de Mark, M.R. Thermodynamic Characterization of Free and Surface Water of Colloidal Unimolecular Polymer (CUP) Particles Utilizing DSC. Polymers 2020, 12, 1417. [Google Scholar] [CrossRef]
- Wang, X.; Zhong, J.; Wang, Y.; Yu, M. A study of the properties of carbon foam reinforced by clay. Carbon 2006, 44, 1560–1564. [Google Scholar] [CrossRef]
- Sani, A.M.; Mohanty, K.K. Incorporation of clay nano-particles in aqueous foams. Colloids Surf. A Physicochem. Eng. Asp. 2009, 340, 174–181. [Google Scholar] [CrossRef]
- Kozbial, A.; Zhou, F.; Li, Z.; Liu, H.; Li, L. Are Graphitic Surfaces Hydrophobic? Acc. Chem. Res. 2016, 49, 2765–2773. [Google Scholar] [CrossRef]
- Cao, X.; Li, Y.; Jiang, S.; Sun, H.; Cagna, A.; Dou, L. A study of dilational rheological properties of polymers at interfaces. J. Colloid Interface Sci. 2004, 270, 295–298. [Google Scholar] [CrossRef]
- Li, S.; Qiao, C.; Ji, G.; Wang, Q.; Tao, L. Experimental Study of Profile Control with Foam Stabilized by Clay Particle and Surfactant. Energies 2019, 12, 781. [Google Scholar] [CrossRef]
- Qin, Y.; Yang, D.; Guo, W.; Qiu, X. Investigation of grafted sulfonated alkali lignin polymer as dispersant in coal-water slurry. J. Ind. Eng. Chem. 2015, 27, 192–200. [Google Scholar] [CrossRef]
Disclaimer/Publisher’s Note: The statements, opinions and data contained in all publications are solely those of the individual author(s) and contributor(s) and not of MDPI and/or the editor(s). MDPI and/or the editor(s) disclaim responsibility for any injury to people or property resulting from any ideas, methods, instructions or products referred to in the content. |
© 2023 by the authors. Licensee MDPI, Basel, Switzerland. This article is an open access article distributed under the terms and conditions of the Creative Commons Attribution (CC BY) license (https://creativecommons.org/licenses/by/4.0/).