Article

Multi-Scale Fractal Characteristics of the Pore System in Low-Permeability Conglomerates from the Junggar Basin

1
Hubei Key Laboratory of Petroleum Geochemistry and Environment, Yangtze University, Wuhan 430100, China
2
The Fourth Oil Production Plant, PetroChina Changqing Oilfield Company, Yulin 718500, China
3
Research Institute of Petroleum Exploration and Development, PetroChina Xinjiang Oilfield Company, Karamay 834000, China
4
Sanya Offshore Oil & Gas Research Institute, Northeast Petroleum University, Sanya 572025, China
5
Technology Development Department, XMotors.ai Inc., Santa Clara, CA 95054, USA
*
Authors to whom correspondence should be addressed.
Processes 2023, 11(9), 2667; https://doi.org/10.3390/pr11092667
Submission received: 15 August 2023 / Revised: 3 September 2023 / Accepted: 4 September 2023 / Published: 6 September 2023

Abstract

:
The pore structure and its complexity play a critical role in fluid migration and recovery efficiency. Multiple pore types, broad pore size distribution (PSD), and extremely irregular pore morphology hinder the comprehensive investigation of pore systems and their complexity in low-permeability conglomerates. In this study, the multi-scale pore system and fractal characteristics of the Permian Lower Wuerhe Formation and Triassic Baikouquan Formation conglomerates from the Junggar Basin were investigated, combining physical property analysis, casting thin sections, scanning electron microscopy, and Nuclear magnetic resonance (NMR). The results show that the pore system of conglomerates consists of residual intergranular pores (RIPs), dissolution pores (DPs), clay-related pores (CRPs), and microfractures. Three types of PSD were identified according to the shape of the T2 spectrum. Based on the fractal characteristics derived from NMR data, pore systems in conglomerates were divided into macropores (mainly RIPs and DPs), mesopores (mainly CRPs), and micropores (reflect adsorption spaces). The fractal dimension of macropores (D3) increases with the increase of clay mineral content and the decrease of contents of quartz and feldspar. Moreover, the volume of macropores decreases with the increase of clay mineral content and the decrease of contents of quartz and feldspar. In addition, the fractal dimensions and volumes of mesopores and micropores have no obvious relationship with mineral composition. D3 and macropore volume control the physical properties and fluid mobility of conglomerates. T2,gm shows a strong negative correlation with D3 and macropore volume. Meanwhile, the high value of D3 would reduce the volume of macropores. These results demonstrate that D3 is a good indicator to reveal the quality of pore structure in low-permeability conglomerates.

1. Introduction

With the discovery of a large number of conglomerate reservoirs, they have become extremely important unconventional resources [1,2,3,4,5]. The Junggar Basin is a large superimposed oil-bearing basin in western China, and the Mahu Sag is a lacustrine hydrocarbon-rich sag from the Junggar Basin (Figure 1). Major breakthroughs have been made in petroleum exploration of low-permeability conglomerates of the Permian Lower Wuerhe Formation (P2w) and Triassic Baikouquan Formation (T1b) in the Mahu Sag. In 2013, Well Mahu 1 achieved an unfractured daily output of 58 m3 in the T1b conglomerate reservoirs [6]. As of 2017, more than 12.4 million tons of petroleum reserves have been discovered in the T1b and P2w conglomerate reservoirs, of which the proven reserves are 5.2 million tons [5]. The T1b and P2w conglomerate oil fields in the Mahu Sag have become the largest conglomerate oil fields in the world. Affected by primary packing type, grain size, and pebble content, conglomerate reservoirs exhibit strong heterogeneity [7,8]. Compared with other clastic reservoirs, the pore system of conglomerate reservoirs is more complex [8,9,10,11,12]. Pore system parameters mainly include pore type, pore size and volume, pore shape, and topology [13]. An accurate investigation of pore structure is crucial to reveal the seepage characteristics and productivity of low-permeability conglomerates. However, the pore system of conglomerates have various pore sizes and strong heterogeneity, making them difficult to characterize.
In recent years, researchers have tried to adopt various advanced techniques to comprehensively investigate the pore system of tight reservoirs. However, these techniques have different advantages and disadvantages due to their working mechanisms. The image method (e.g., casting thin sections (CTS) and scanning electron microscopy (SEM)) can directly observe the pore types and pore shapes, and quantitatively count the size and distribution of pores and throats [13,14], but the representation is poor. N2 adsorption (NA) can only accurately measure fine pores of 1.5~200 nm [15]. Mercury injection porosimetry (MIP) can obtain throat and its controlling pore volume information, but cannot correctly display larger pores [16]. Nuclear magnetic resonance (NMR) is the most effective means of quantitatively characterizing full-scale pore systems but needs to be calibrated with other experimental data [10,17,18]. Therefore, multiple experimental approaches are required to comprehensively investigate the size and distribution of pores.
It is difficult to characterize the complexity of the pore system using Euclidean geometry and traditional techniques [19]. The fractal method provides an effective means to investigate the irregular and complex pore system of porous media [20]. Many researchers have confirmed that coal, shale, sandstone, and carbonate have fractal characteristics [20,21,22,23]. However, little research has been done on the fractal characteristics of conglomerates. The fractal dimension can be calculated from SEM, NA, MIP, or NMR data [19,20,21,24]. Conglomerate has a wide pore size distribution (PSD) from 0.001 to 200 μm [10]. Therefore, calculating the fractal dimension by using the NMR method can fully understand the fractal characteristics of the full-scale pore structure of conglomerates.
The purpose of this work is to elucidate the fractal characteristics of the full-scale pore system of conglomerates. In this paper, the T1b and P2w conglomerates were collected from the Mahu sag of the Junggar basin in NW China. The pore system of low-permeability conglomerates was investigated by CTS, SEM, and NMR experiments. Furthermore, the fractal characteristics of the pore system from the conglomerates were analyzed by NMR experiments. Finally, the correlations between the fractal dimension and the pore system of conglomerates are revealed.

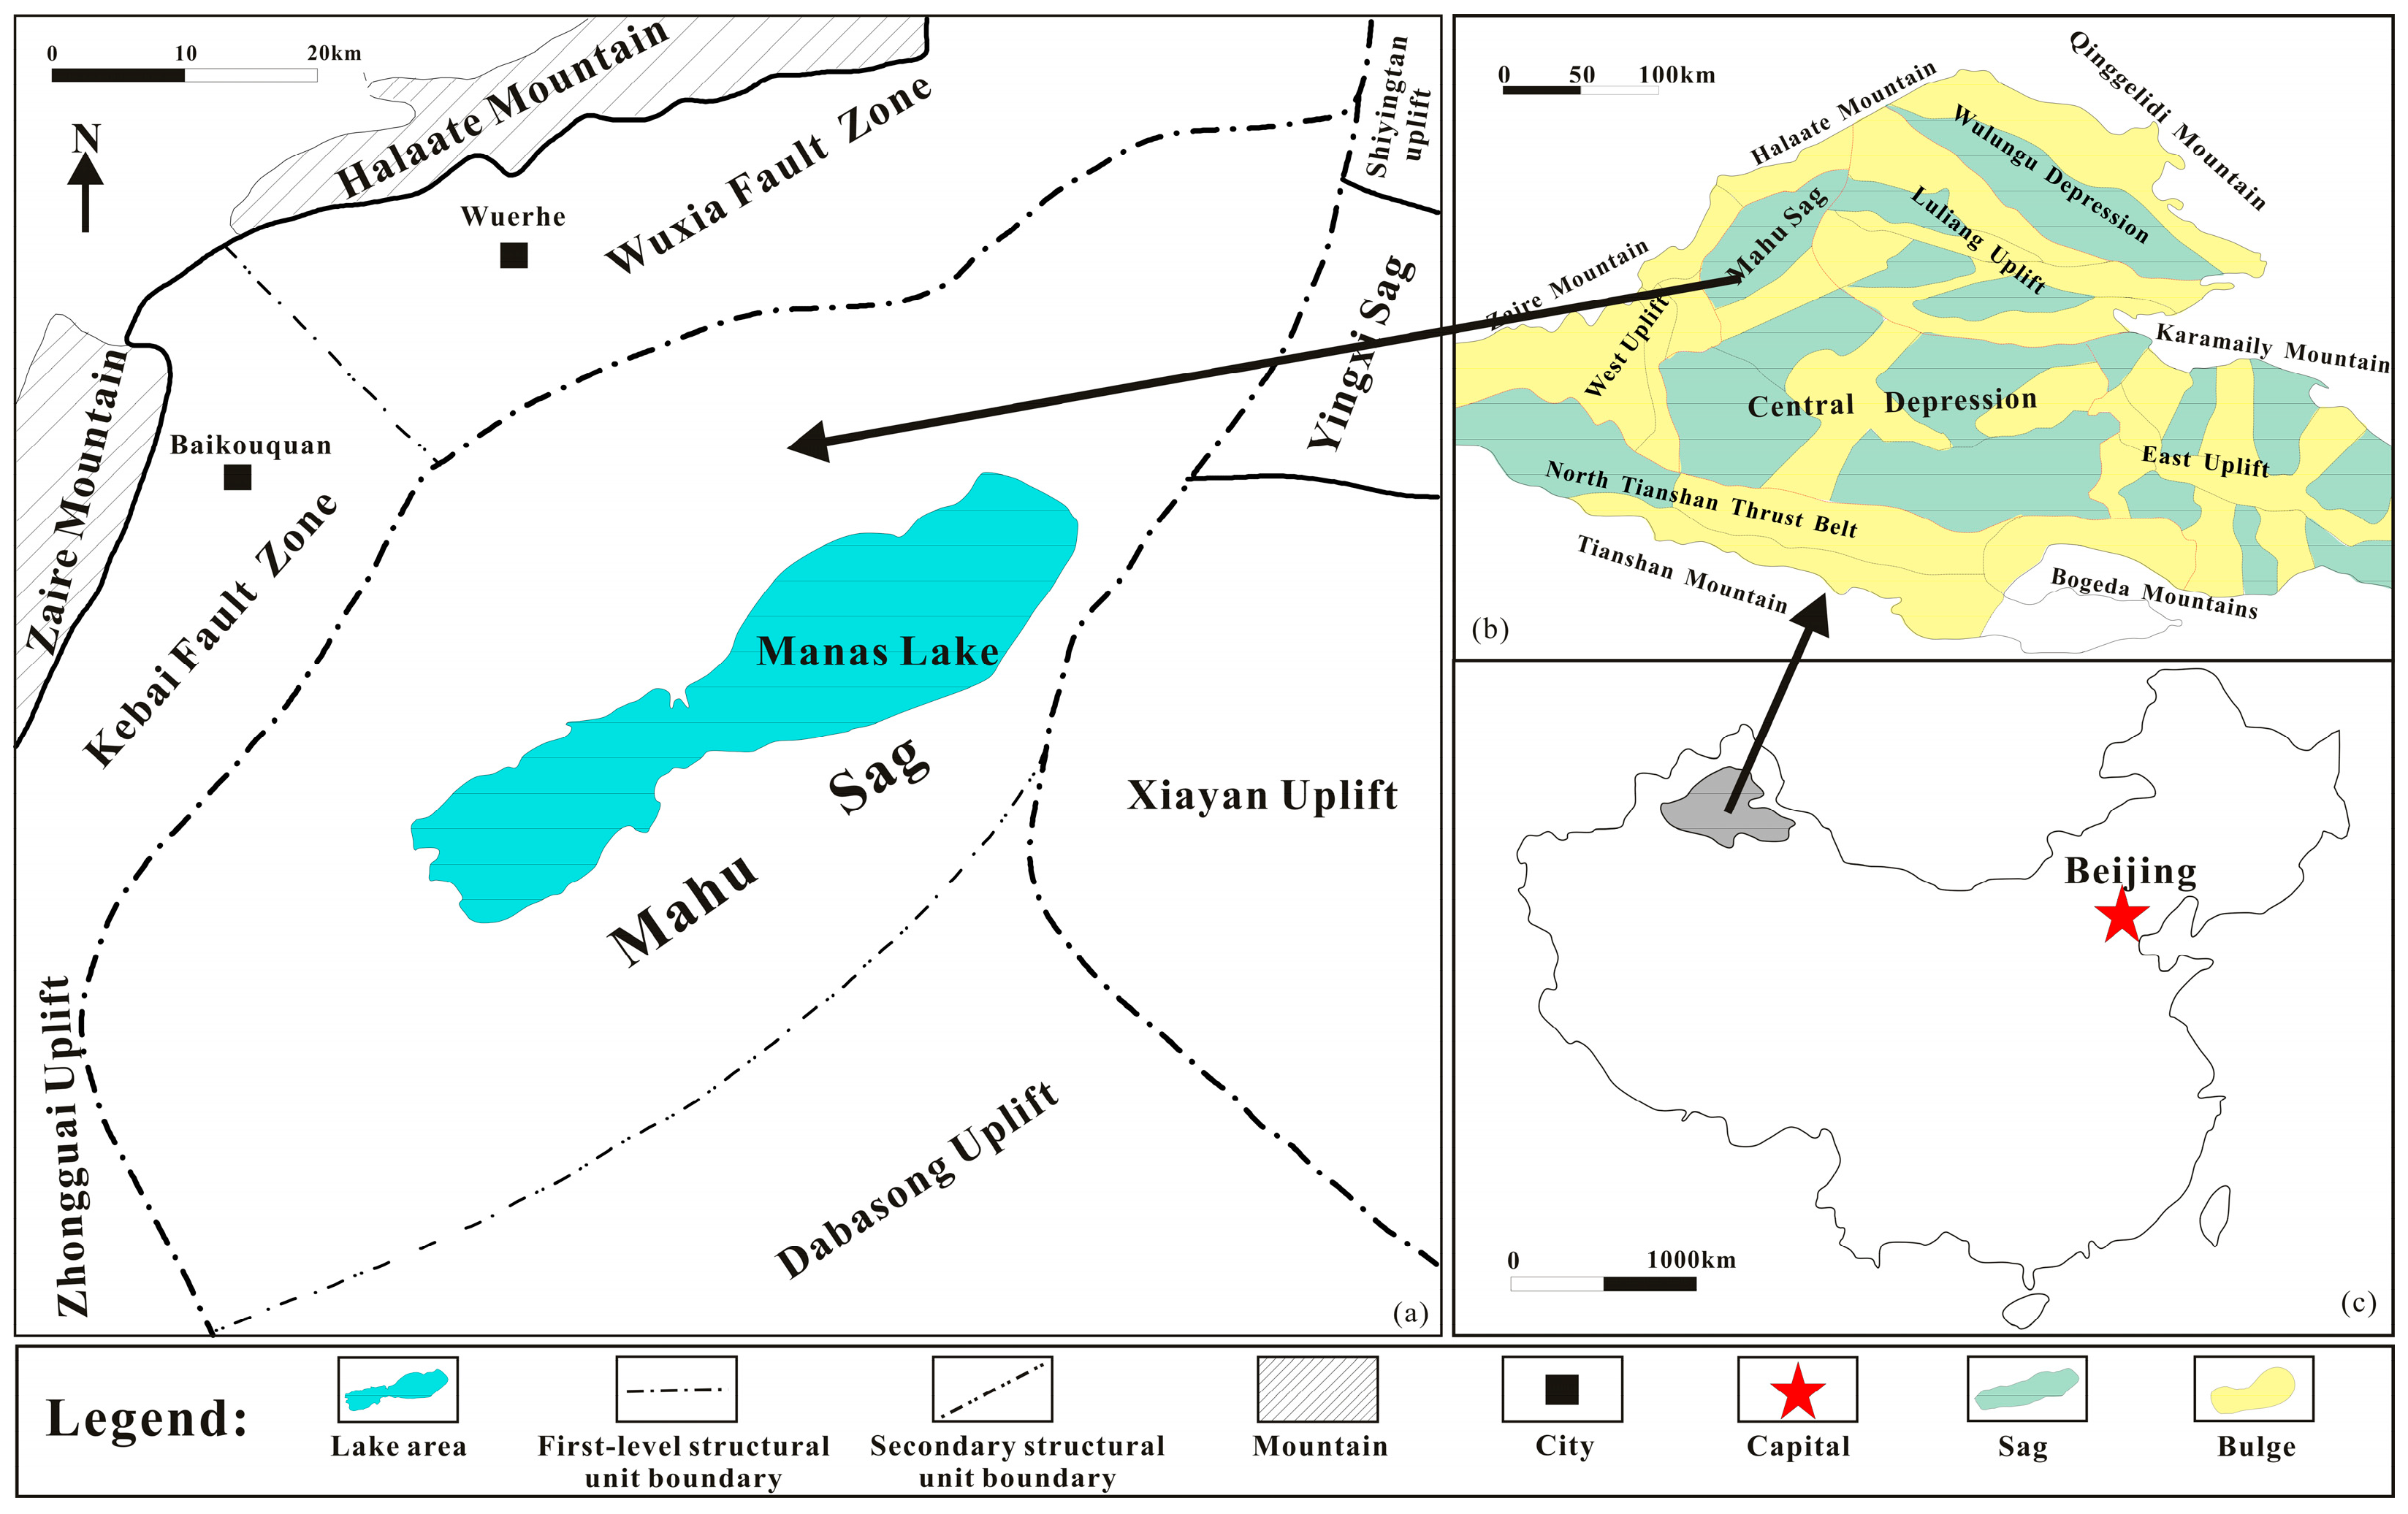
2. Geological Setting

The Junggar Basin is located in northwest China and is the second largest inland basin in China, which can be divided into the Central Depression, the East Uplift, the West Uplift, the Luliang Uplift, the Wulungu Depression, and the North Tianshan Thrust Belt. The Mahu sag is a secondary structural unit of the Central Depression (Figure 1), covering an area of about 5000 km2. The strata in the Mahu sag are relatively well developed. From bottom to top strata are: Carboniferous (C), Permian (Jiamuhe Formation (P1j), Fengcheng Formation (P1f), Xiazijie Formation (P2x), Lower Wuerhe Formation (P2w), and Upper Wuerhe Formation (P3w)), Triassic (Baikouquan Formation (T1b), Karamay Formation (T2k), Baijiantan Formation (T3b)), Jurassic (Badaowan Formation (J1b), Sangonghe Formation (J1s), Xishanyao Formation (J2x), Toutunhe Formation (J2t), Qigu Formation (J2q)), and Cretaceous Tugulu Group (K1tg). The target strata of this work are the P2w and T1b. The T1b displays an angular unconformity with the P2w in the Mahu Sag [25]. The P2w and the T1b conglomerate reservoirs are deposited in fan delta front subfacies [10]. Four sets of potential source rocks (i.e., C, P1j, P1f, and P2w) developed in the Mahu Sag. The P1f source rock (0.14% < TOC < 3.5%, Ro > 1%) is the main source rock, with a thickness of 50–400 m [26]. Based on Folk’s classification scheme, the P2w and T1b conglomerates are mainly feldspathic litharenites and litharenites. Rock fragments are in the range of 32–96%, with an average of 66.8%. Feldspar particles vary from trace to 44% (with a mean of 18.5%). Quartz particles range from 2% to 35%, with an average of 14.5%. The rock fragments are dominated by tuff, with subordinate amounts of mudstone and sandstone.

3. Samples and Experiments

3.1. Samples

We selected twenty-seven conglomerate samples for analysis. Conglomerate samples collected from the T1b and P2w are denoted as “Bxx” and “Wxx”, respectively. Prior to the experiments, all as-received conglomerate samples were extracted with a dichloromethane/acetone mixture (3:1 v/v) for one week to remove residual oil from the core. After solvent extraction, all conglomerates were dried at 110 °C for 6 h. Then, the conglomerates were subjected to porosity, permeability, CTS, SEM, and NMR techniques.

3.2. Experiments

The permeability was measured under a confining pressure of 10 MPa. Mineral composition analysis was carried out via a D8 DISCOVER X-ray diffractometer.
Casting thin sections was performed using a ZEISS Z1 polarizing microscope following the Chinese Oil and Gas Industry Standard SY T 5368-2000. Conglomerates were impregnated with blue epoxy to facilitate visualization of pores and throats.
Before SEM analysis, the samples were prepared to a size of 1 cm (length) × 1 cm (width) × 0.5 cm (height). The observation surface was milled by an argon ion beam on an Ilion+II 697C Argon Ion Polisher. Then, SEM tests were conducted on a Quanta 450 field emission SEM according to the GB/T 16594-2008. Two typical conglomerate samples (B14 and W4) were selected for QEMSCAN analyses using an AmicSCAN automatic mineralogy electron microscope.
NMR measurements were conducted on a MesoMR23-060H-1 instrument at the Key Laboratory of Deep Oil and Gas at the China University of Petroleum. Two sets of T2 spectra were measured on the conglomerate samples: a saturated sample and a centrifuged sample. The centrifuged samples were obtained at a centrifugation speed of 10,000 r/min. T2 spectra were measured by the CPMG sequence. The NMR parameters we use are as follows: TE, 0.1 ms; Tw, 9000 ms; NECH, 8000; NS, 16.

4. Results

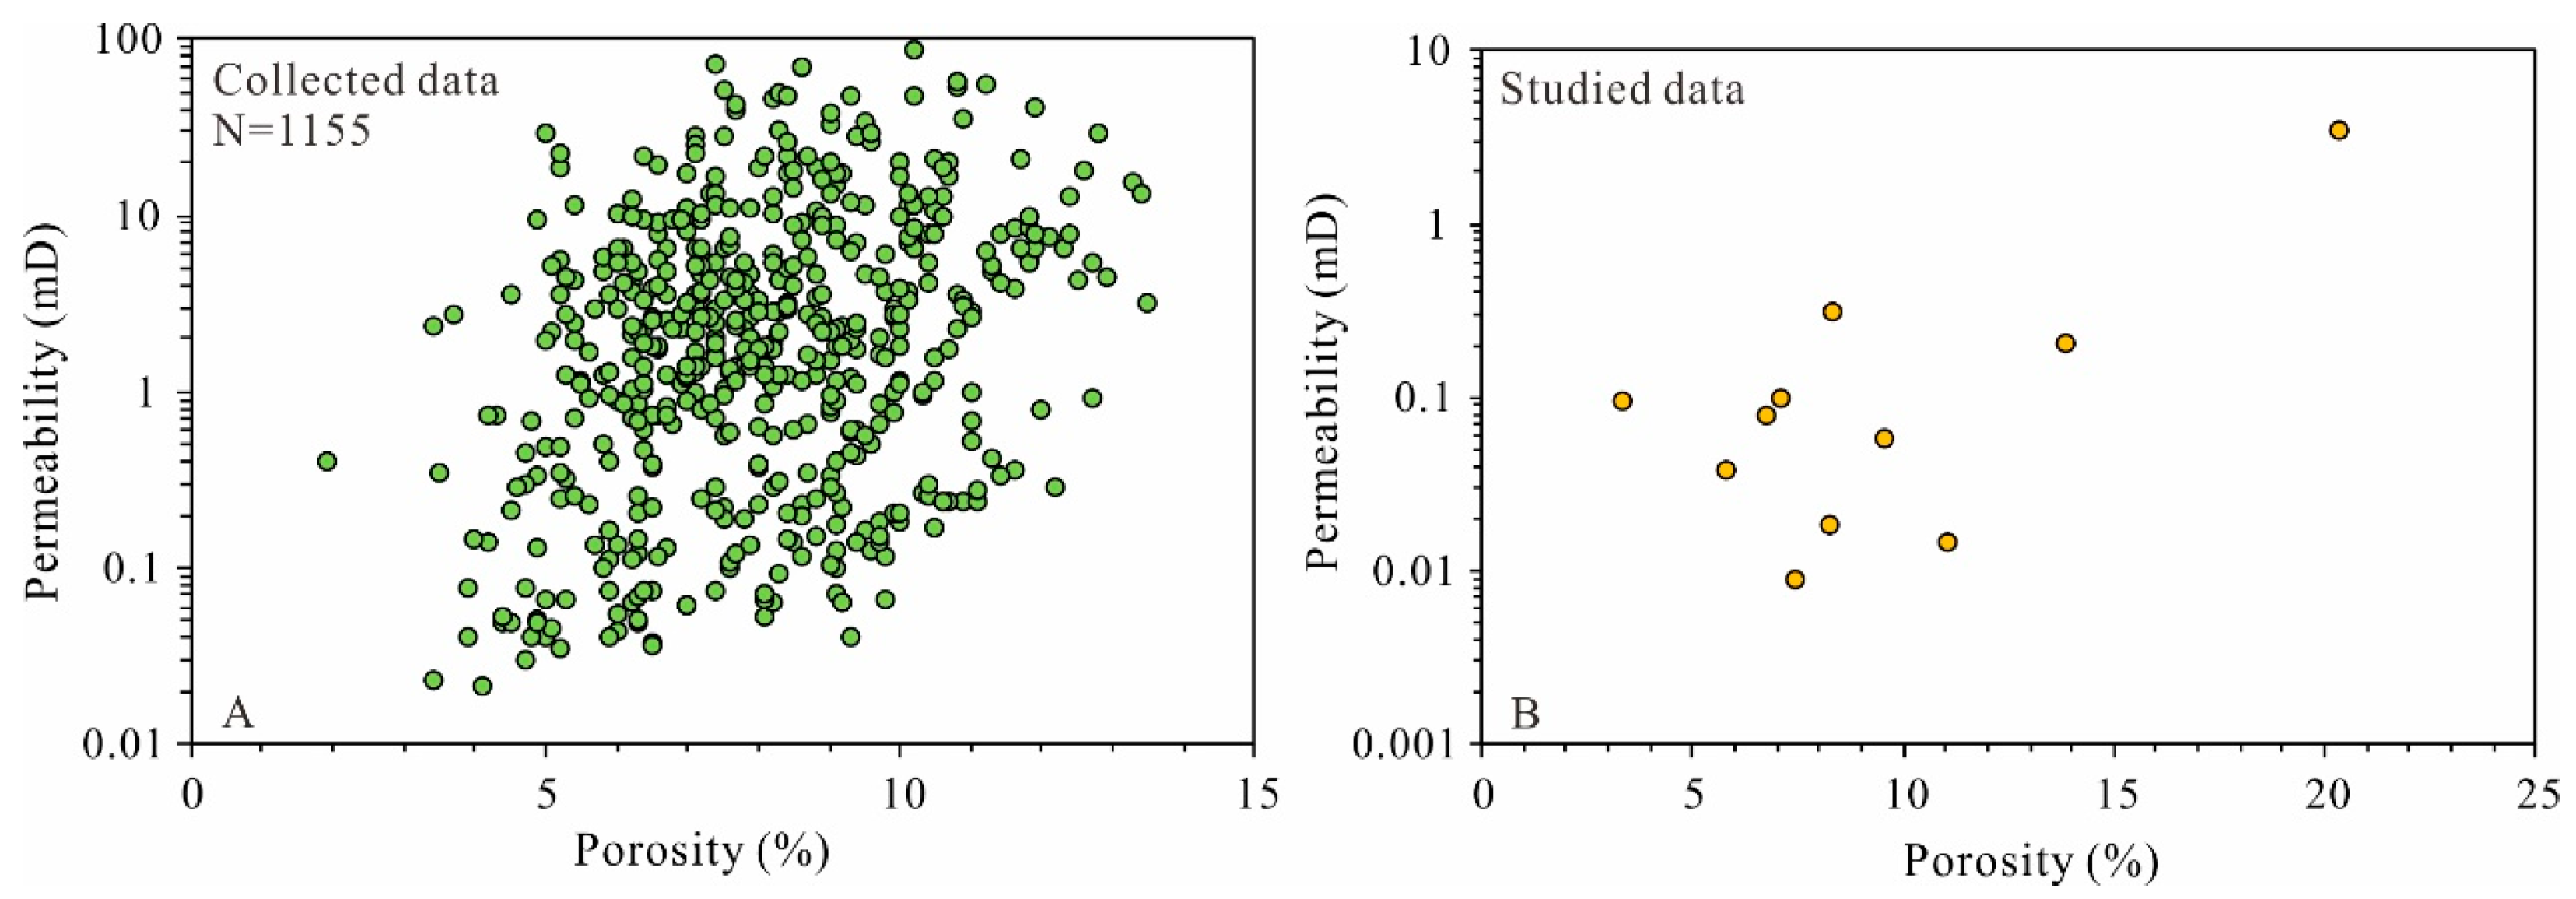
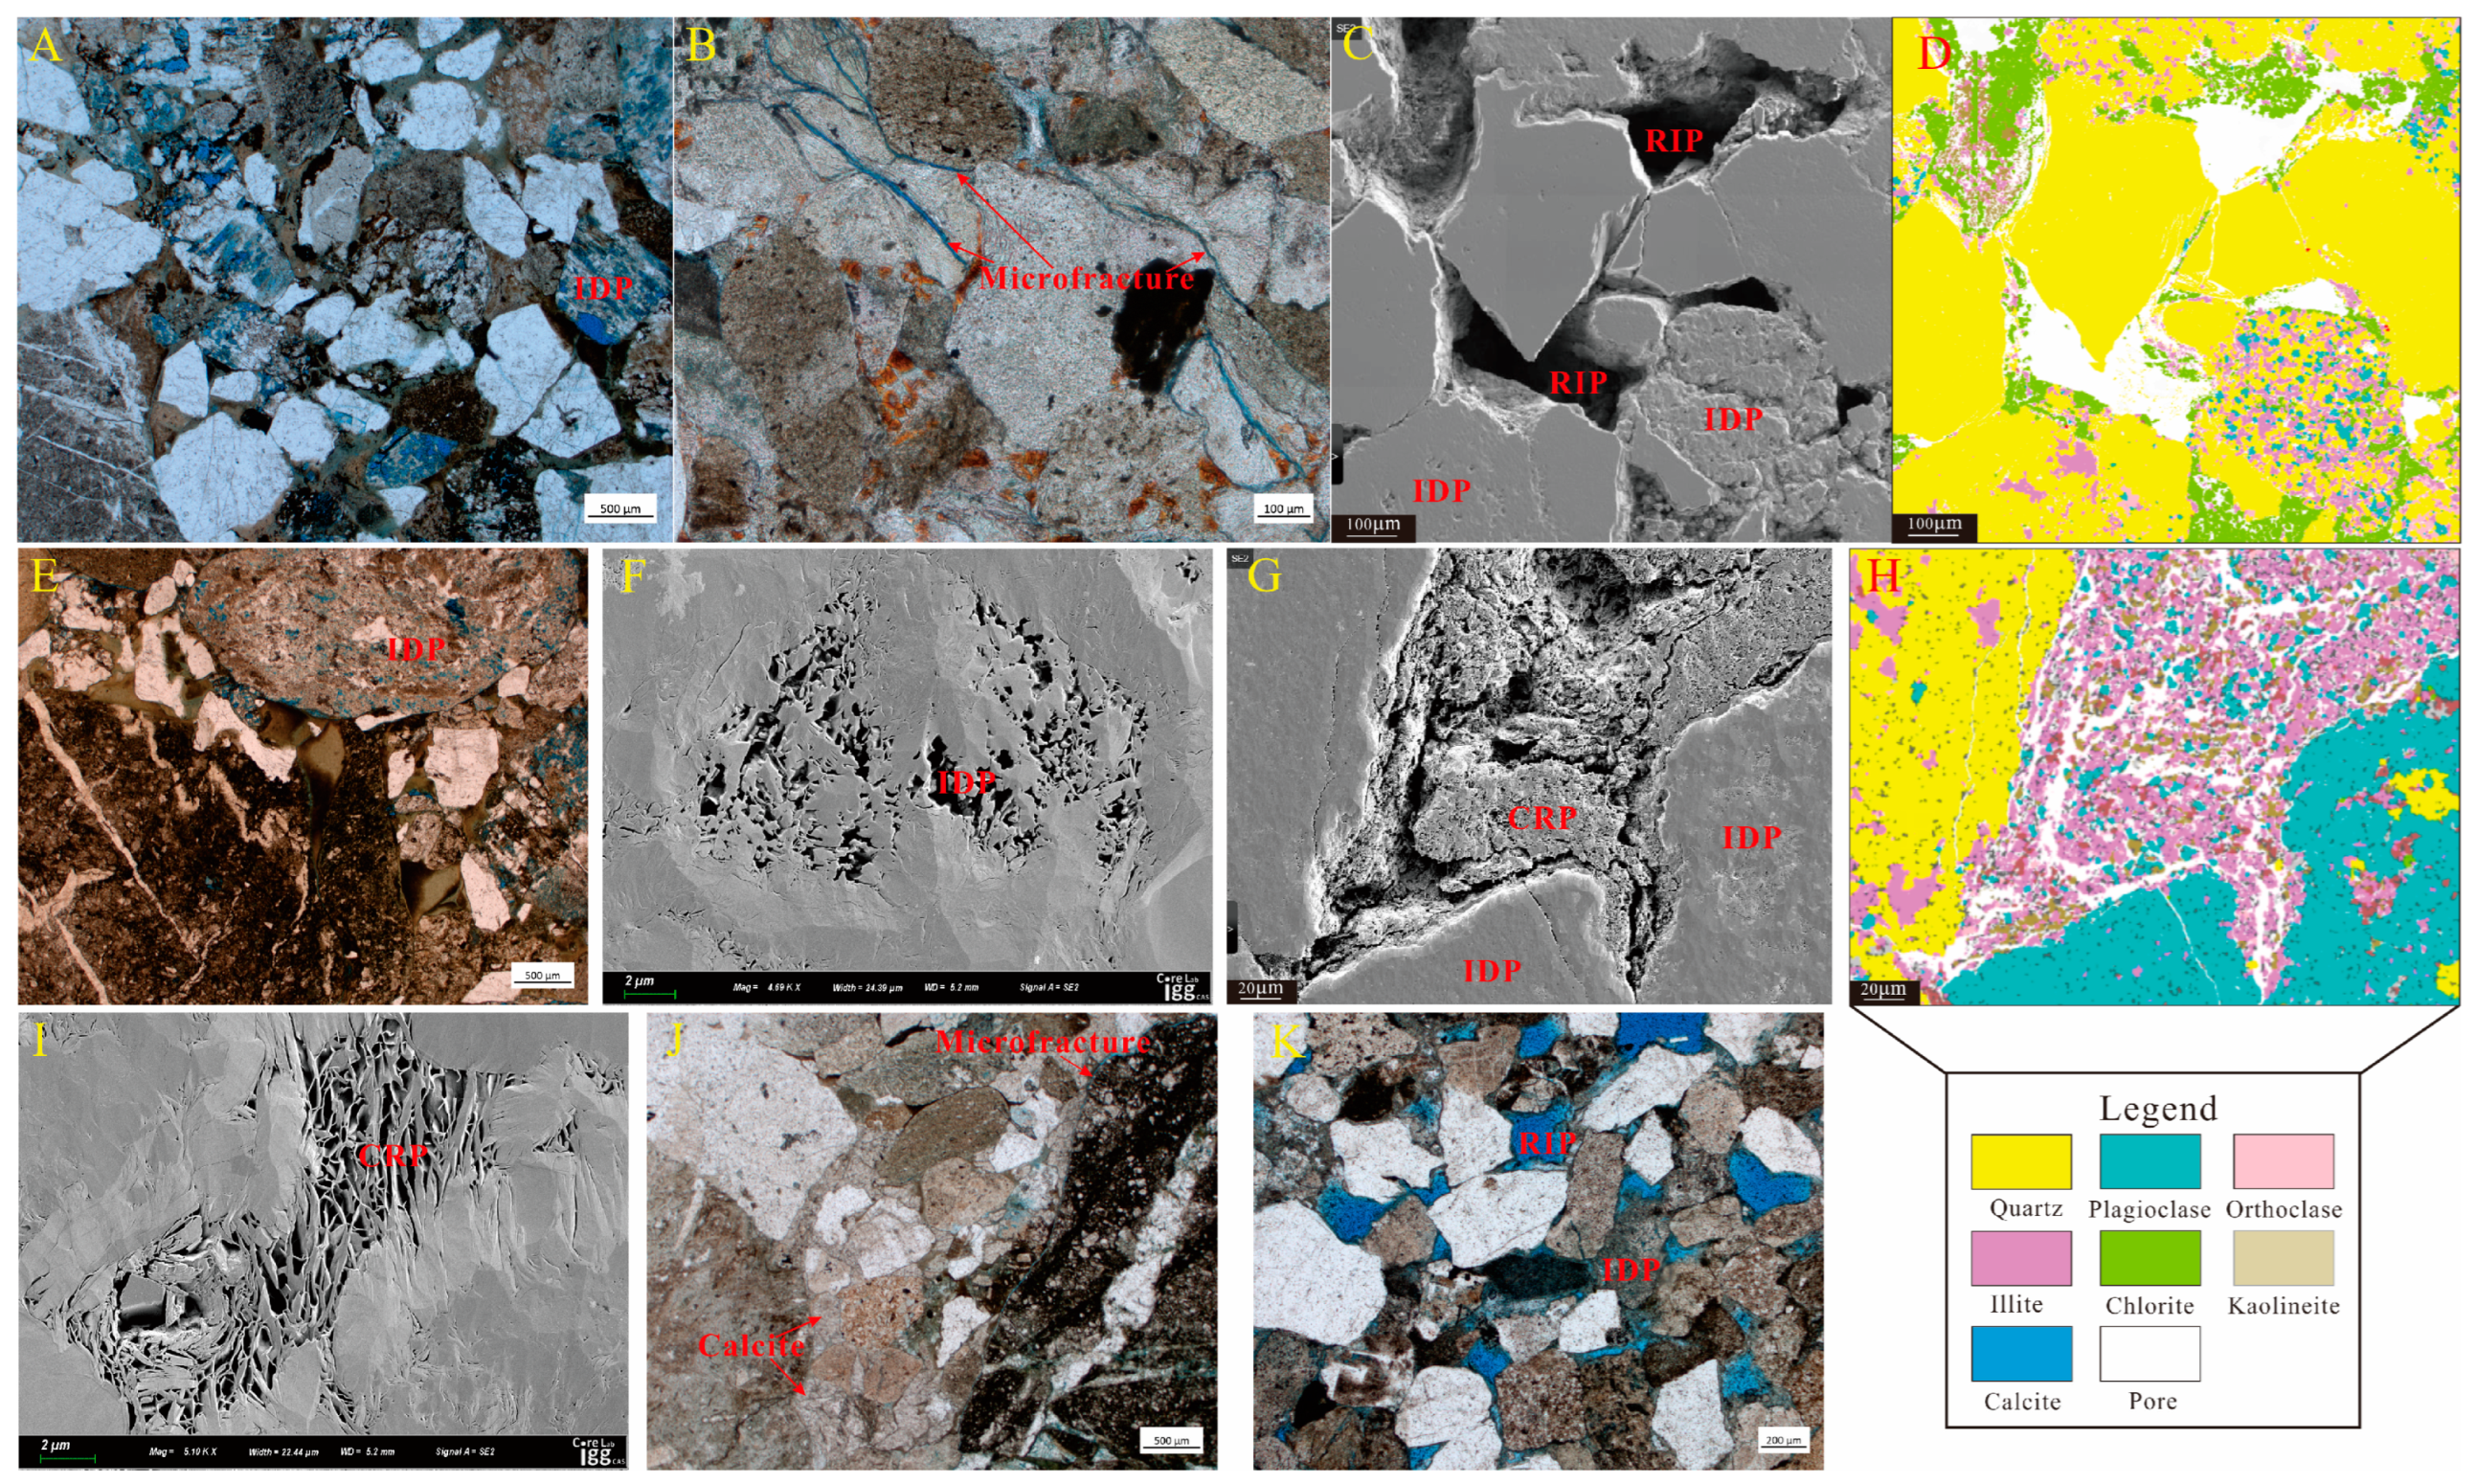
4.1. Porosity, Permeability, and Pore Types

The collected porosity was between 1.9% and 16.4%, with an average of 8.3%. The collected permeability under net confining stress of 1.4 MPa varied from 0.011 mD to 94.8 mD (Figure 2A). The studied porosity varied from 3.4% to 20.3%, with an average of 8.2%. The studied permeability ranged from 0.0088 mD to 3.5200 mD at 10 MPa (Table 1 and Figure 2B). There was a poor relationship between permeability and porosity due to the presence of micro-fracture and the influence of intense diagenesis (Figure 3).
The minerals were dominated by quartz (31.9–62.3%) and feldspar (18.7–52.8%), followed by clay minerals (3.1–25.6%) and calcite (0–30.1%). The P2w clay minerals were dominated by illite (0.84–9.13%) and chlorite (0.98–9.98%). The major components of T1b clay minerals were smectite (0.90–13.3%) and chlorite (1.10–10.58%) (Table 1).
The pore system controlled the petroleum storage and seepage capacity in the reservoir. Under the joint influence of sedimentation and diagenesis, the low-permeability conglomerate has a variety of pore types and a broad range of pore sizes (Figure 3). The geometry of residual intergranular pores (RIPs) is irregular, and the pore size is mainly > 10 μm. RIPs only develop in conglomerate samples with good particle sorting and rich rigid particles. RIPs are mostly formed between quartz particles with grain-coating chlorite (Figure 3C,D,K). The detrital particles such as feldspar, quartz, and rock fragments in the conglomerate in the study area were partially or completely dissolved to form dissolution pores. In the presence of alkaline fluid, quartz was susceptible to dissolution to form the intragranular dissolution pores (IDPs), and the pore size was mostly nano-scale (Figure 3C) [27]. However, feldspar and rock fragments are prone to dissolution in the existence of acidic fluids [28]. The DPs formed by dissolution of feldspar and rock fragments were mostly micron-scale pores (Figure 3A,C,E,F,K). A large amount of detrital clay was distributed among the conglomerate framework grains, which develop abundant nano-scale pores. Moreover, the DPs are usually filled with authigenic clay, forming intercrystalline pores. In this work, we refer to such pores as clay-related pores (CRPs). There are two main causes of microfractures in the study area: diagenetic fractures (mainly grain boundary fractures) and structural fractures. Microfractures play an excellent role in improving the seepage capacity of the reservoir. The width of the microfractures was mainly in the order of microns (Figure 3B,J).

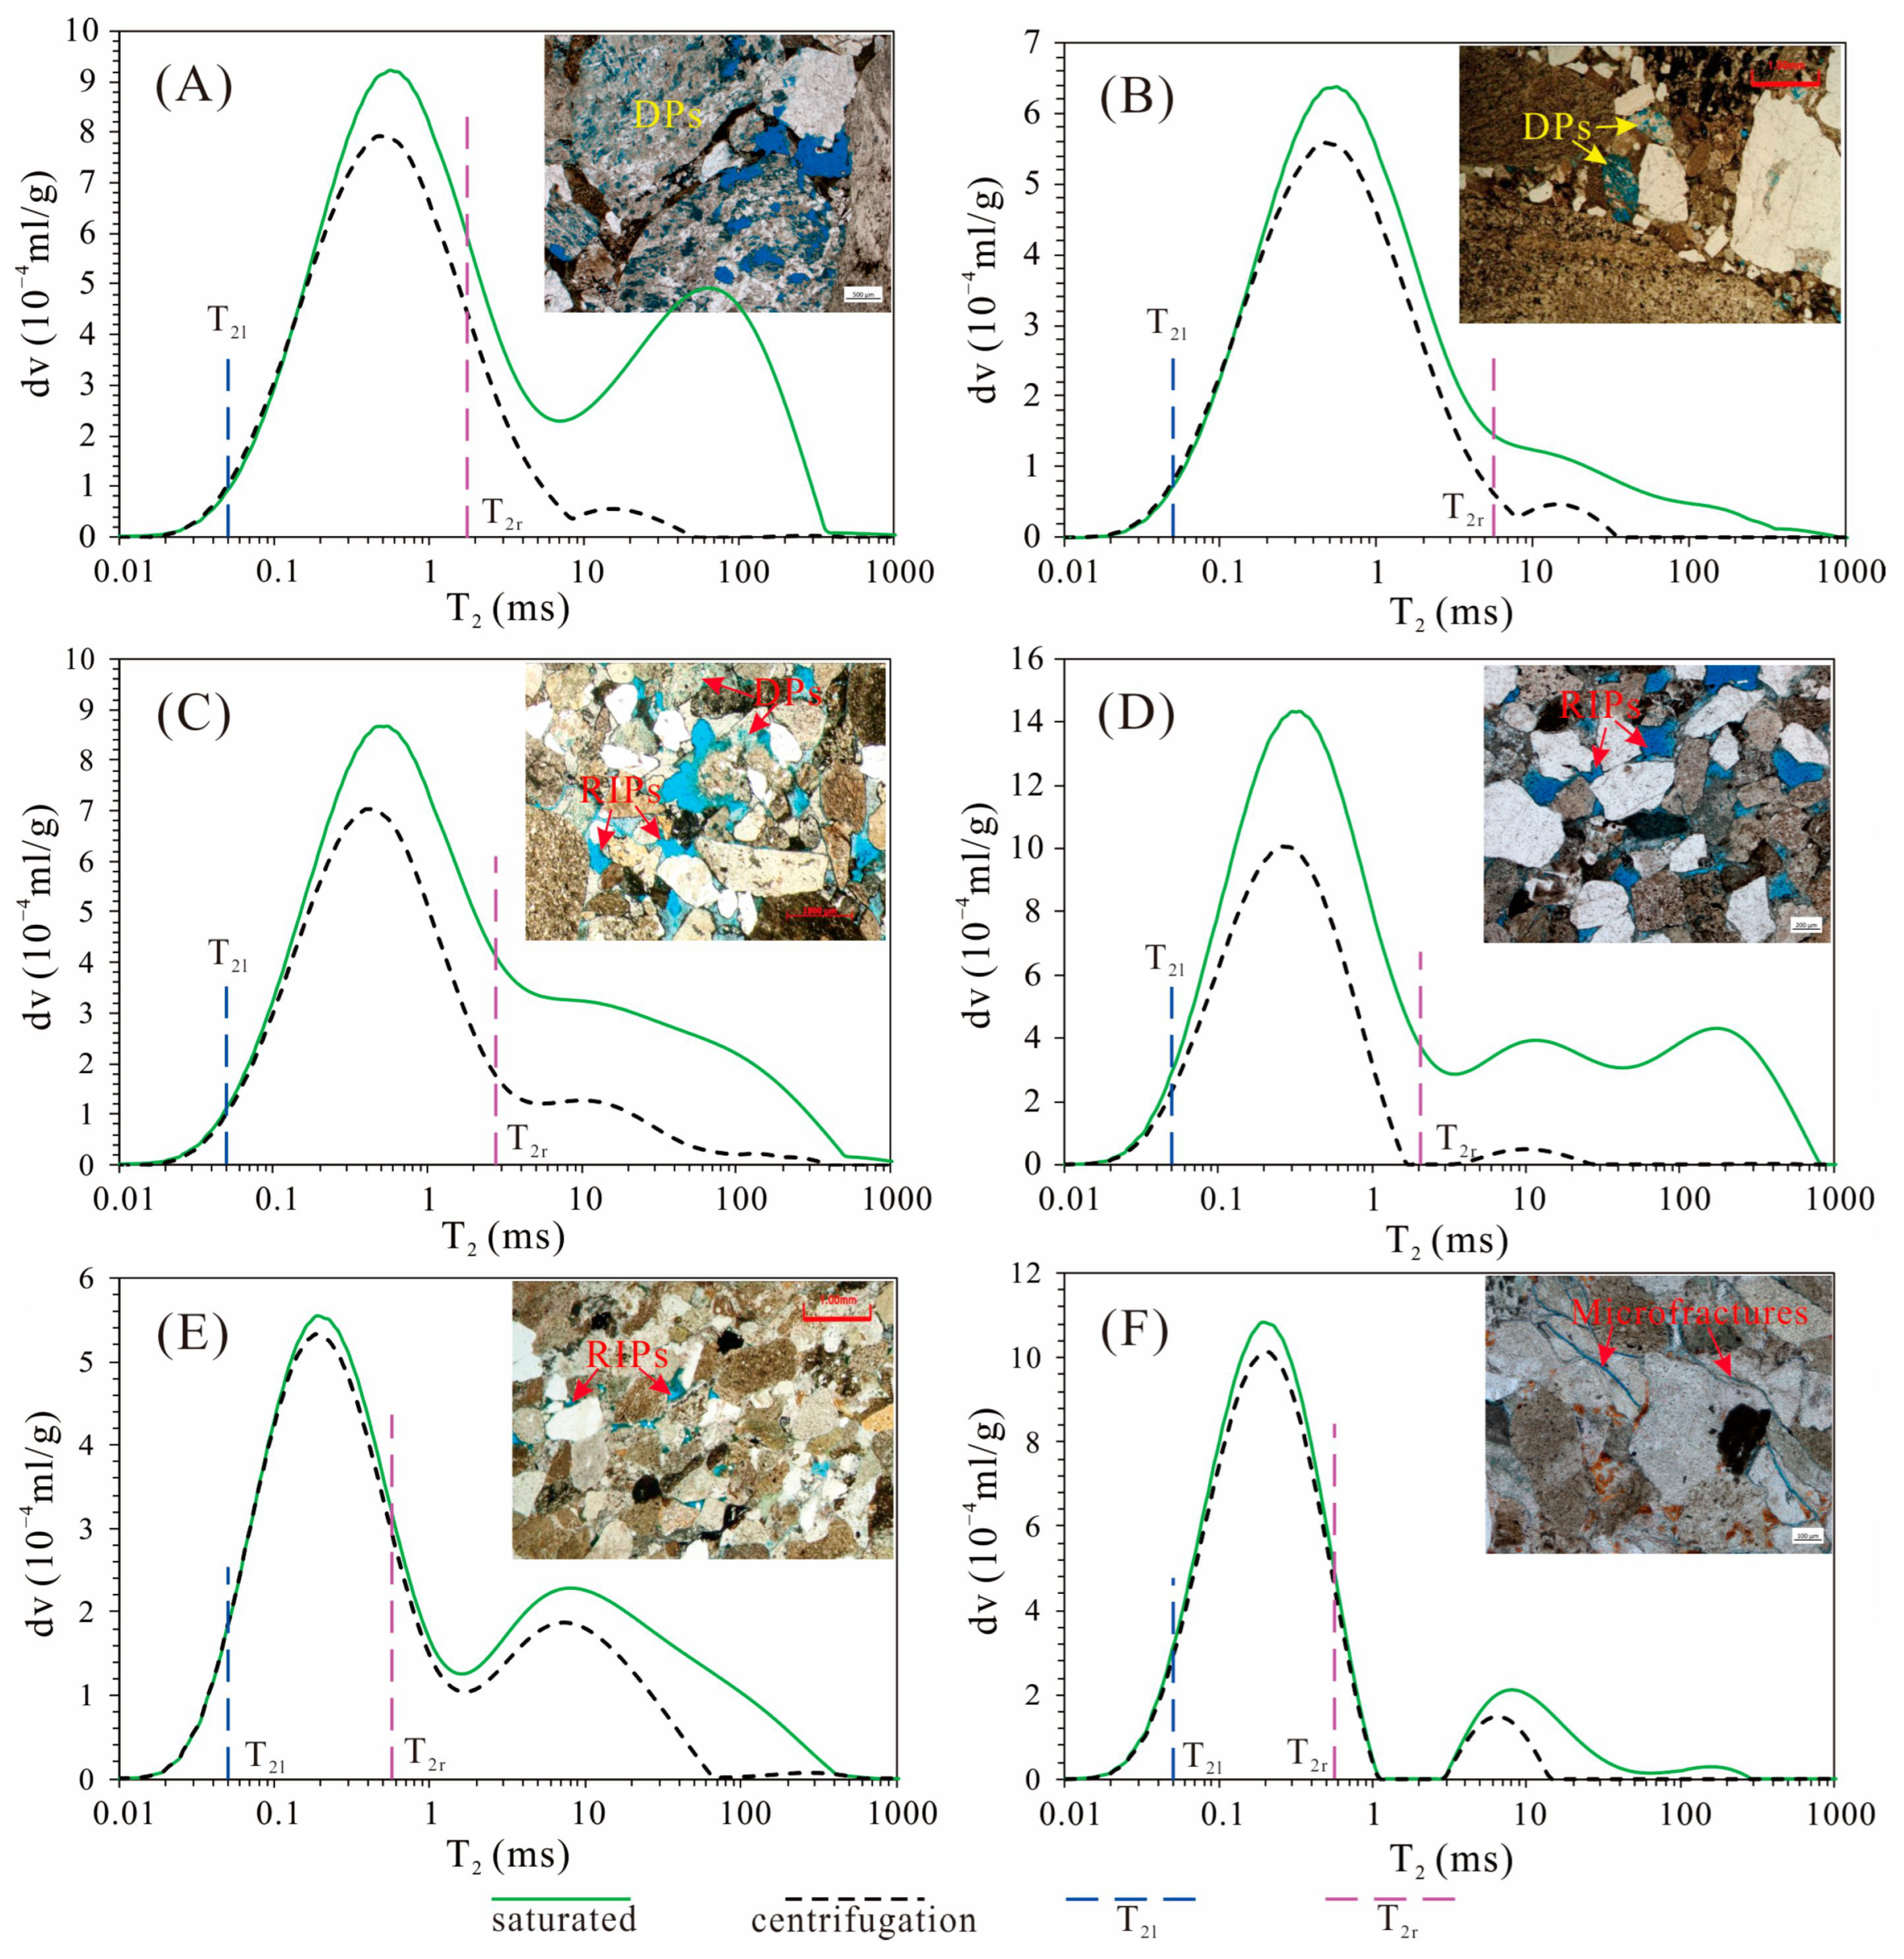
4.2. Pore Structure and Movable Fluid Saturation from NMR

The T2 spectra under saturated fluid conditions can reveal the full-scale PSD of conglomerates. The largest T2 value corresponds to the largest pore size, and the smallest T2 value corresponds to the smallest pore size. The T2 spectra of the typical conglomerates are displayed in Figure 4. Three types of PSD are observed according to the shapes of T2 spectra. Type I conglomerates had a broad T2 distribution, varying from 0.01 ms to 700 ms (Figure 4C,D), indicating that the large-scale RIPs, DPs, and CRPs were all developed in this type of conglomerate. Type II conglomerates had a relatively broad T2 distribution, in the range of 0.01–300 ms (Figure 4A,E), reflecting that this type of conglomerate was dominated by small-scale RIPs or DPs and CRPs. Type III conglomerates had a narrower T2 distribution, varying from 0.01 ms to 100 ms (Figure 4B,F), showing that this type of conglomerate mainly developed CRPs and a few small-scale IDPs or microfractures.
The movable fluid saturation (Sm) of the selected conglomerates was in the range of 12.62–51.25%, with an average of 27.53% (Table 2). Moreover, from type I conglomerate to type III conglomerate, the Sm decreased gradually. The fluid mobility in pores of different sizes also displayed large differences.

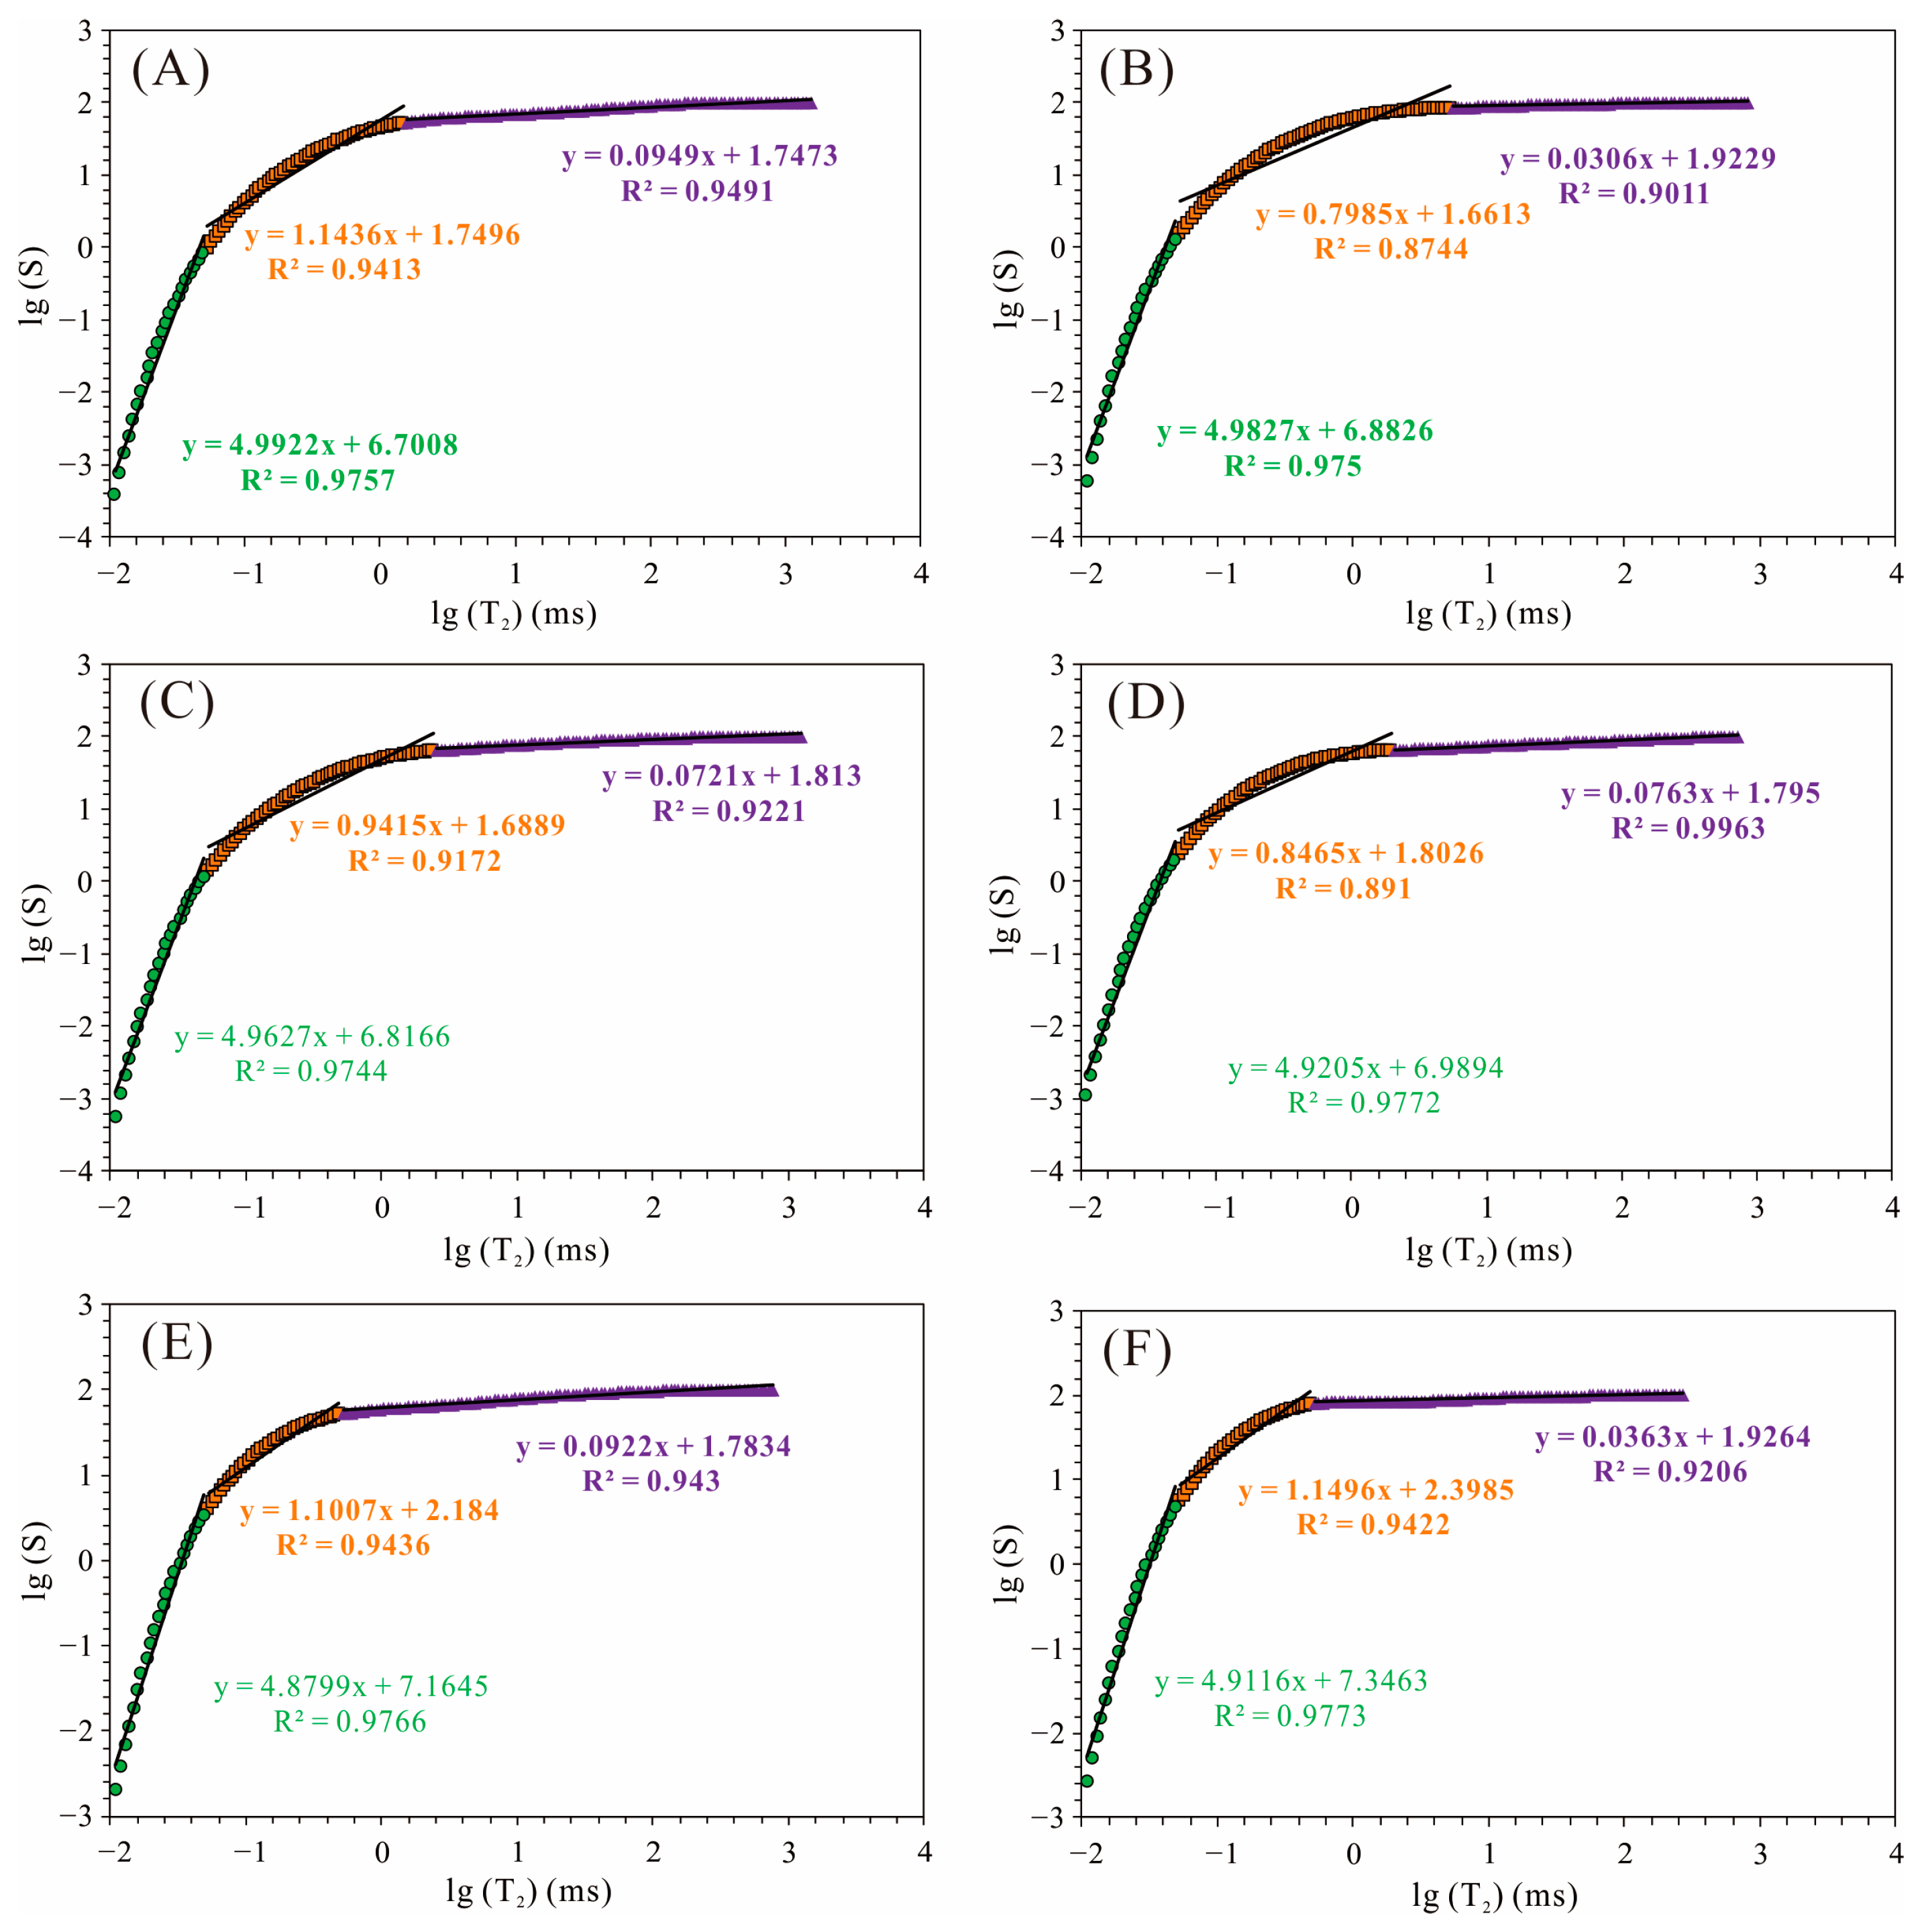
4.3. Fractal Characteristics Derived from NMR

Shao et al. (2017) proposed an effective method to calculate the fractal dimension (D) using NMR data [24]. The calculation equation of fractal dimension is:
lg(S) = (3 − D)lgT2 + (D − 3)lgT2max
where S denotes the cumulative pore volume percentage with a pore size smaller than T2, %; D is the fractal dimension; T2max denotes the maximum T2 value, ms.
A scatter plot of lg(S) and lg(T2) was drawn to reflect the fractal characteristics of conglomerates (Figure 5). Three distinct linear segments are displayed by two “turning points” (T2l and T2r). The T2l was stable for all conglomerate samples with values around 0.05 ms. However, the T2r of different conglomerate samples was quite different, ranging from 0.4 ms to 5.4 ms. These two “turning points” divided the pore system of the conglomerate into three parts: macropores (>T2r), mesopores (T2l < T2 < T2r), and micropores (<T2l). Moreover, the fluid in the pores with T2 < T2l was immobile. The fluid in the pores with T2 between T2l and T2r was dominated by irreducible fluid. The fluid in the pores with T2 > T2r was mainly movable fluid (Figure 4).
The fractal dimensions of macropores, mesopores, and micropores are expressed as D3, D2, and D1, respectively, as shown in Table 2. D3 was in the range of 2.842–2.982, with a mean of 2.936, indicating that macropores had extremely high pore structure complexity. In this work, macropores reflect RIPs and DPs. The extremely irregular shape and the large surface roughness of RIPs and DPs were observed from CTS and SEM images (Figure 3). D2 was in the range of 1.794–2.316, with a mean of 2.040, which was smaller than D3, implying that the complexity of mesopores (mainly CRPs) was weaker than that of macropores. D1 varied from −2.148 to −1.760, with a mean of −1.934, indicating that D1 was meaningless. In this work, the micropores reflect adsorption spaces. There was no apparent correlation between D2 and D3.

5. Discussion

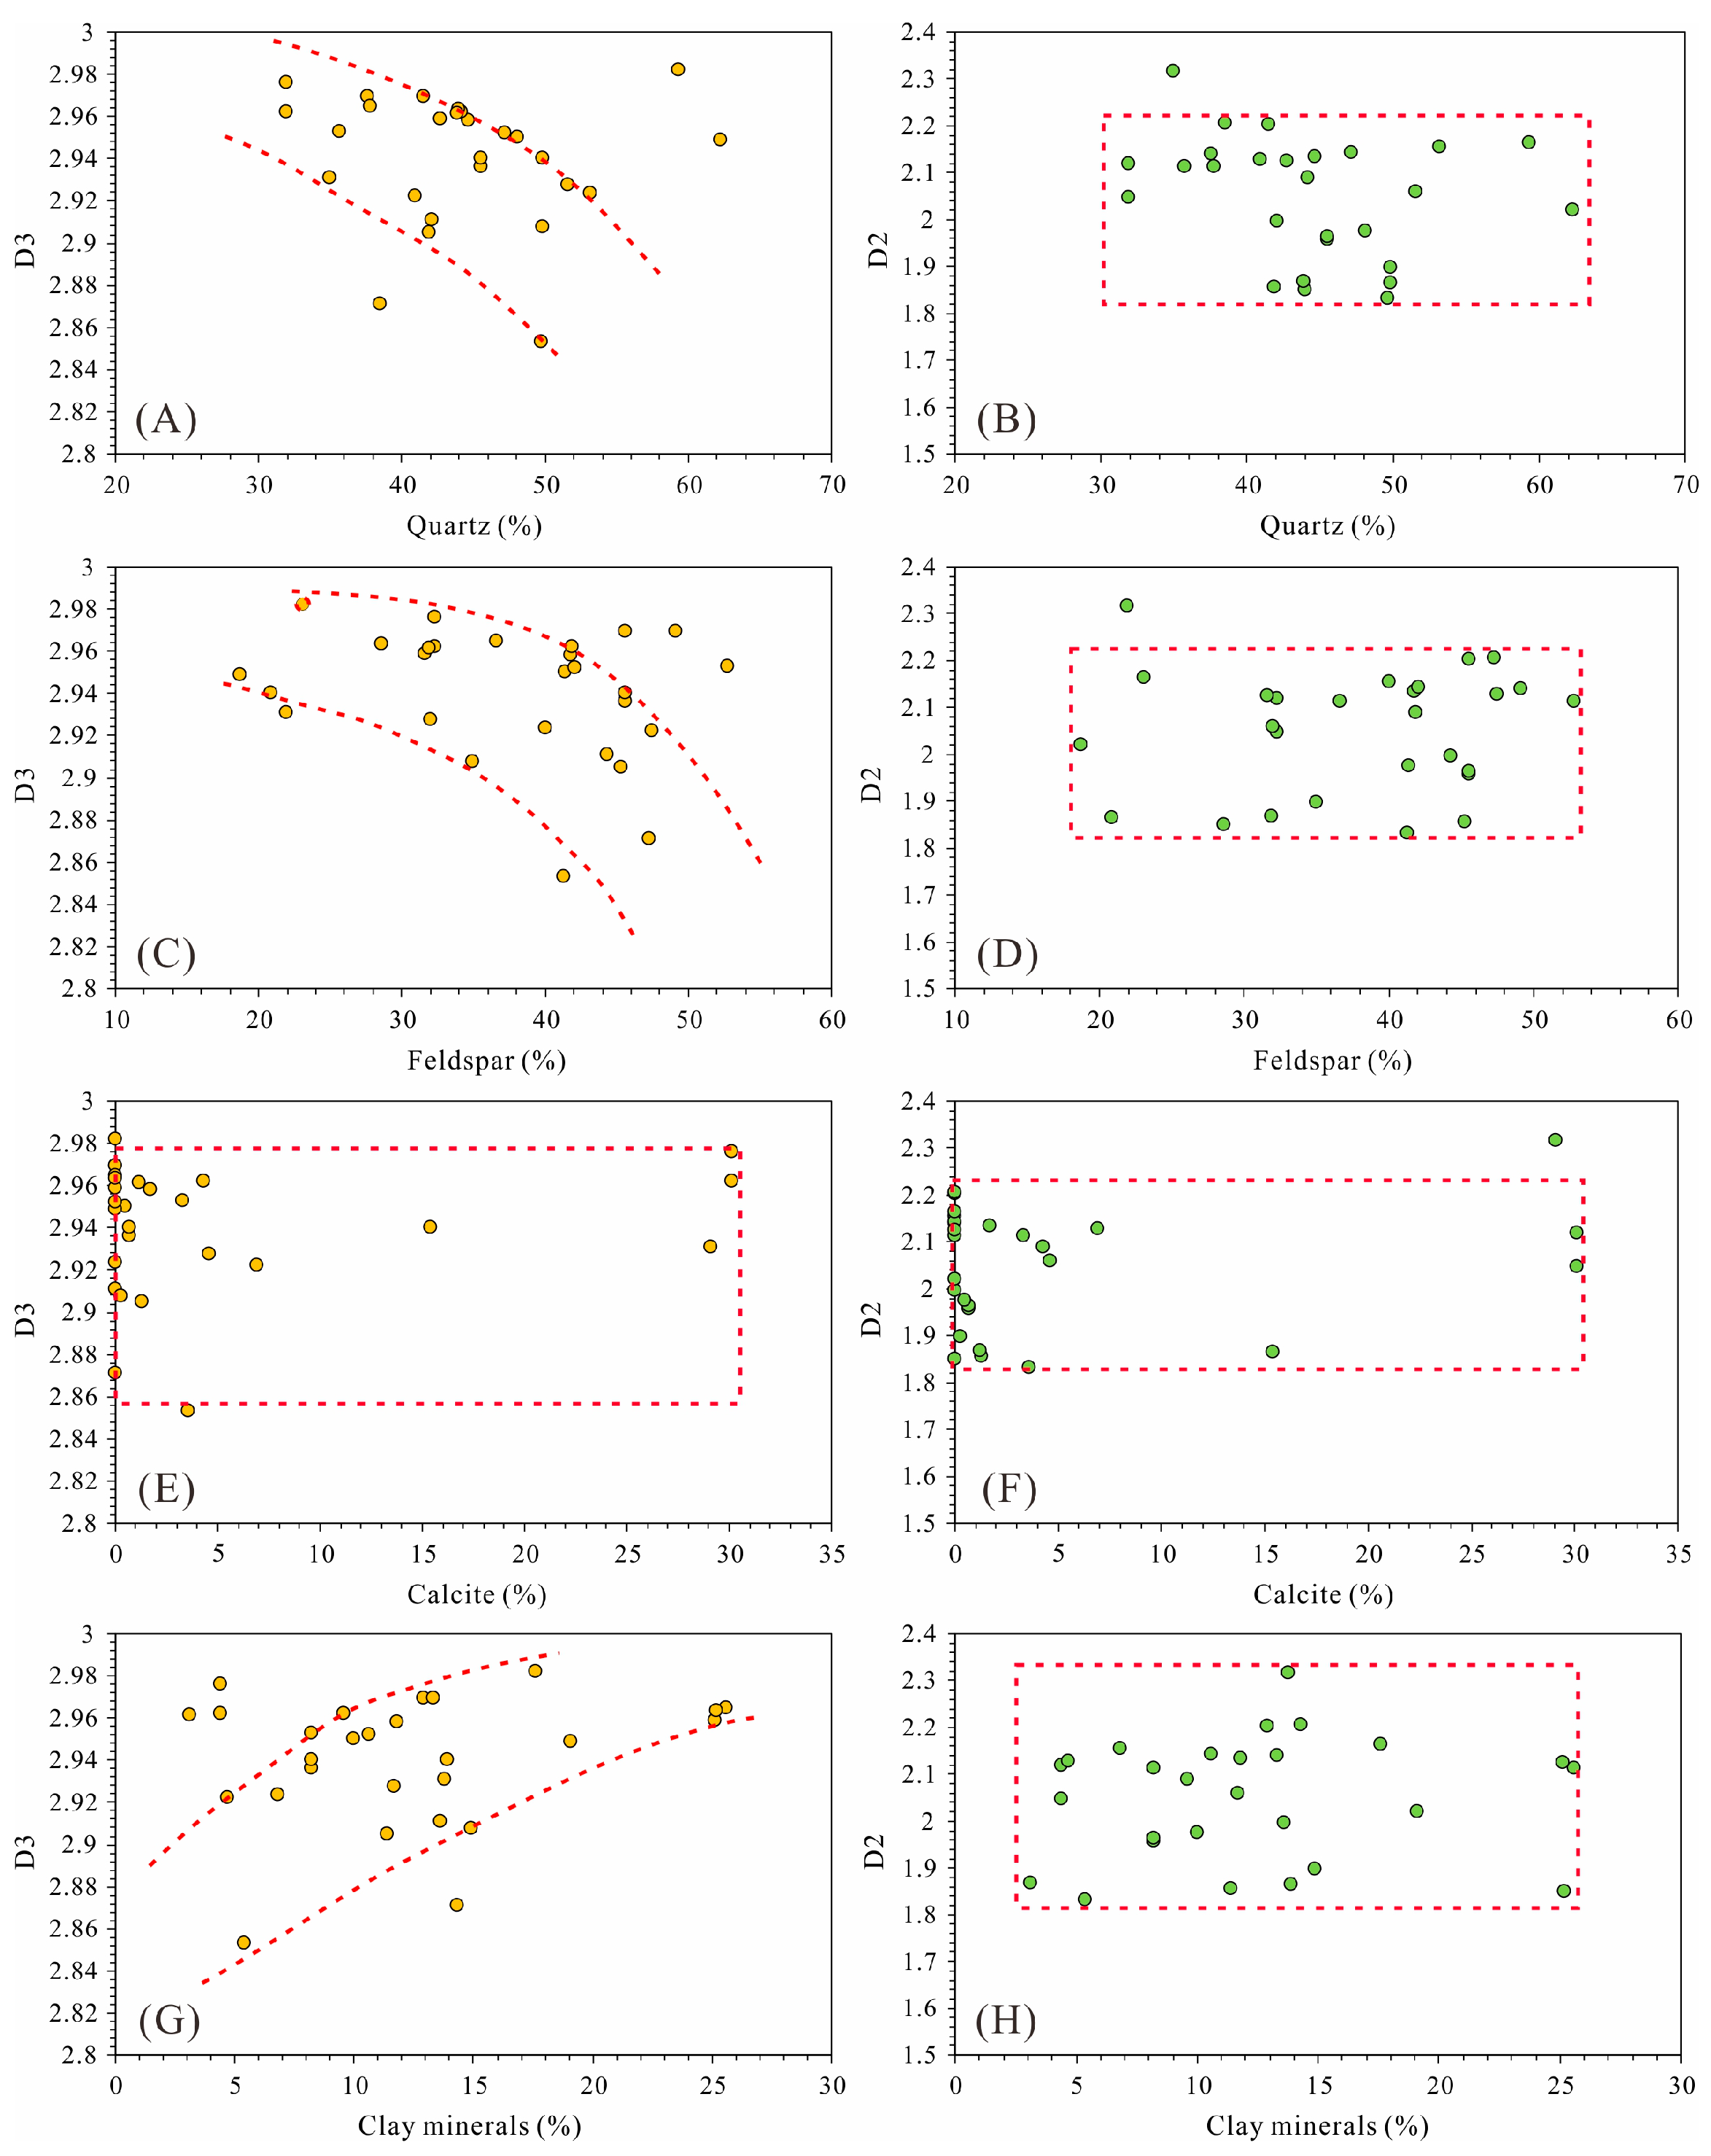
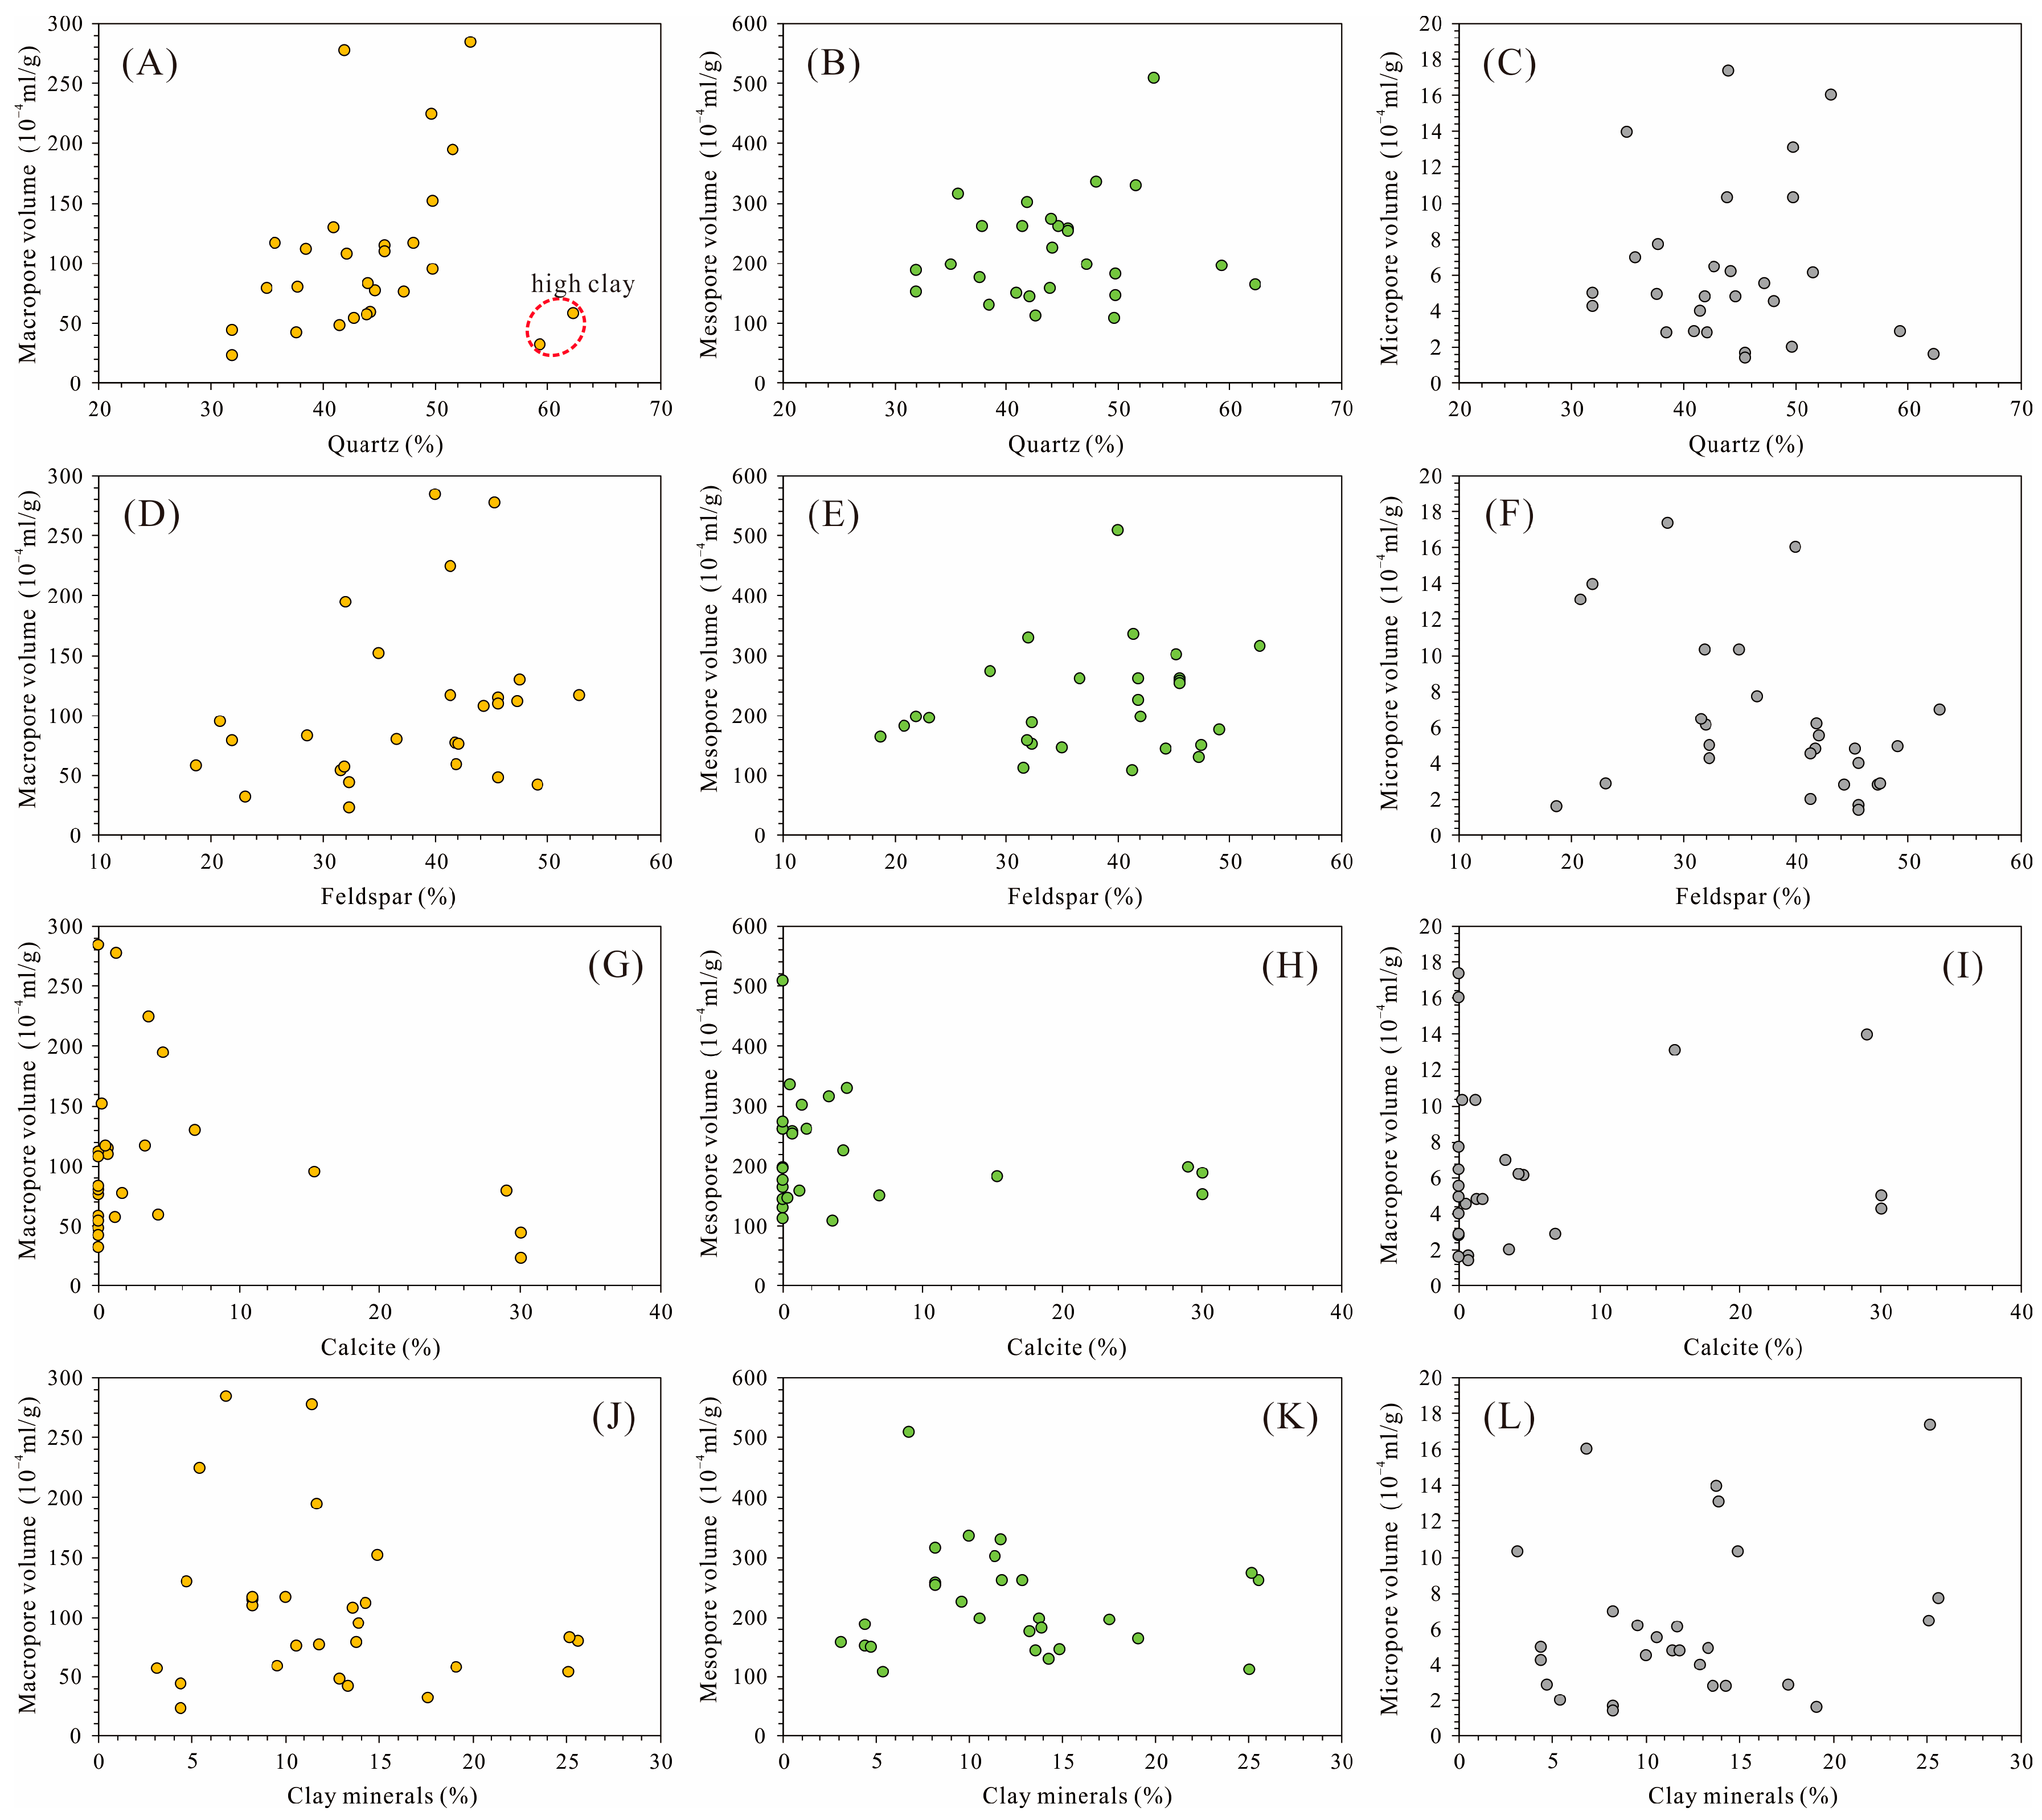
5.1. Correlations between Fractal Characteristics and Mineral Compositions

D3 was negatively correlated with the contents of quartz and feldspar (Figure 6A,C), indicating that high contents of quartz and feldspar can reduce the complexity of macropores. There was no distinct relationship between D3 and the calcite content (Figure 6E). Moreover, there was a positive relationship between D3 and the clay mineral content (Figure 6G), which was mainly due to the fact that pore-lining and pore-filling clays can increase the surface roughness and tortuosity of macropores [29]. However, D2 had no obvious correlation with the contents of whole rock minerals (Figure 6B,D,F,H), indicating that whole rock minerals had no effect on the complexity of mesopores. This phenomenon may be related to the fact that the mesopores were mainly CRPs, and their complexity may be attributed to the crystal structure of clay minerals [30,31].
In addition, we further analyzed the relationship between volumes of macropores, mesopores, and micropores and mineral compositions (Figure 7). A remarkable positive relationship existed between the volume of macropores and the contents of quartz and feldspar (Figure 7A,D). In addition, the volume of macropores showed a negative relationship with the contents of clay minerals and calcite (Figure 7G,J). The above findings demonstrate that high quartz and feldspar content increases macropore volume. However, there were no distinct relationships between mineral compositions and the volumes of mesopores and micropores (Figure 7B,C,E,F,H,I,K,L).

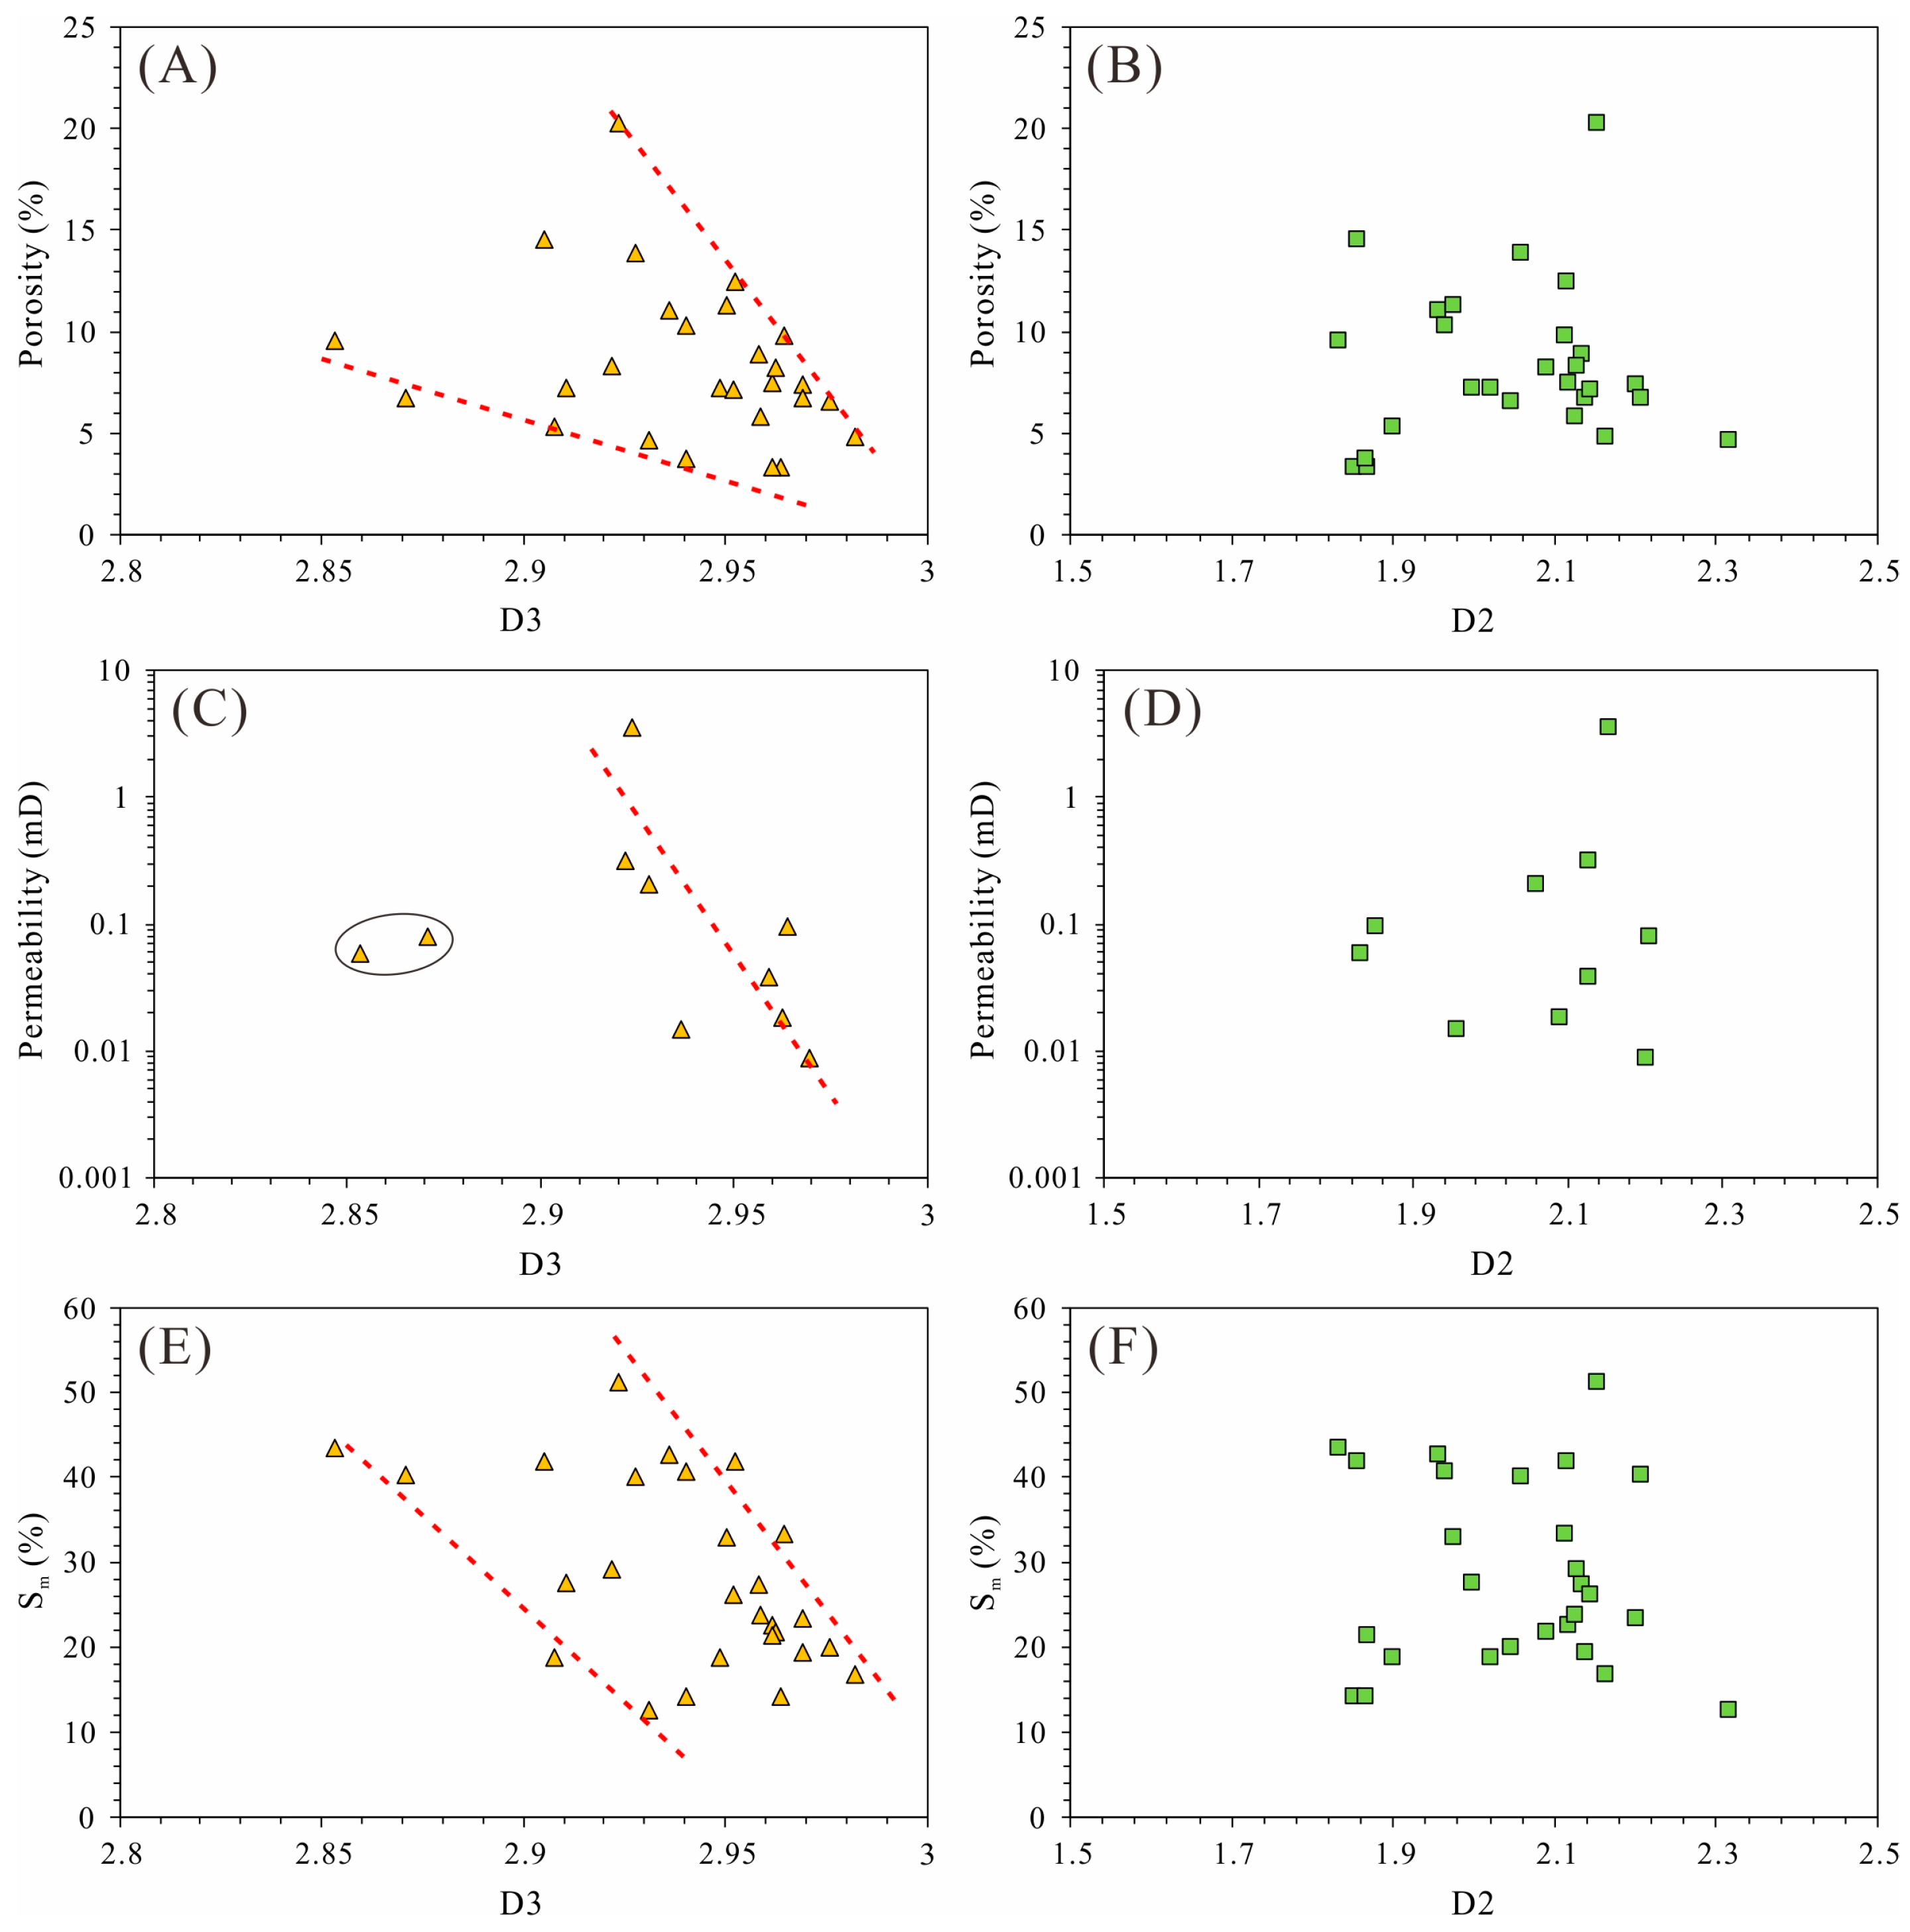
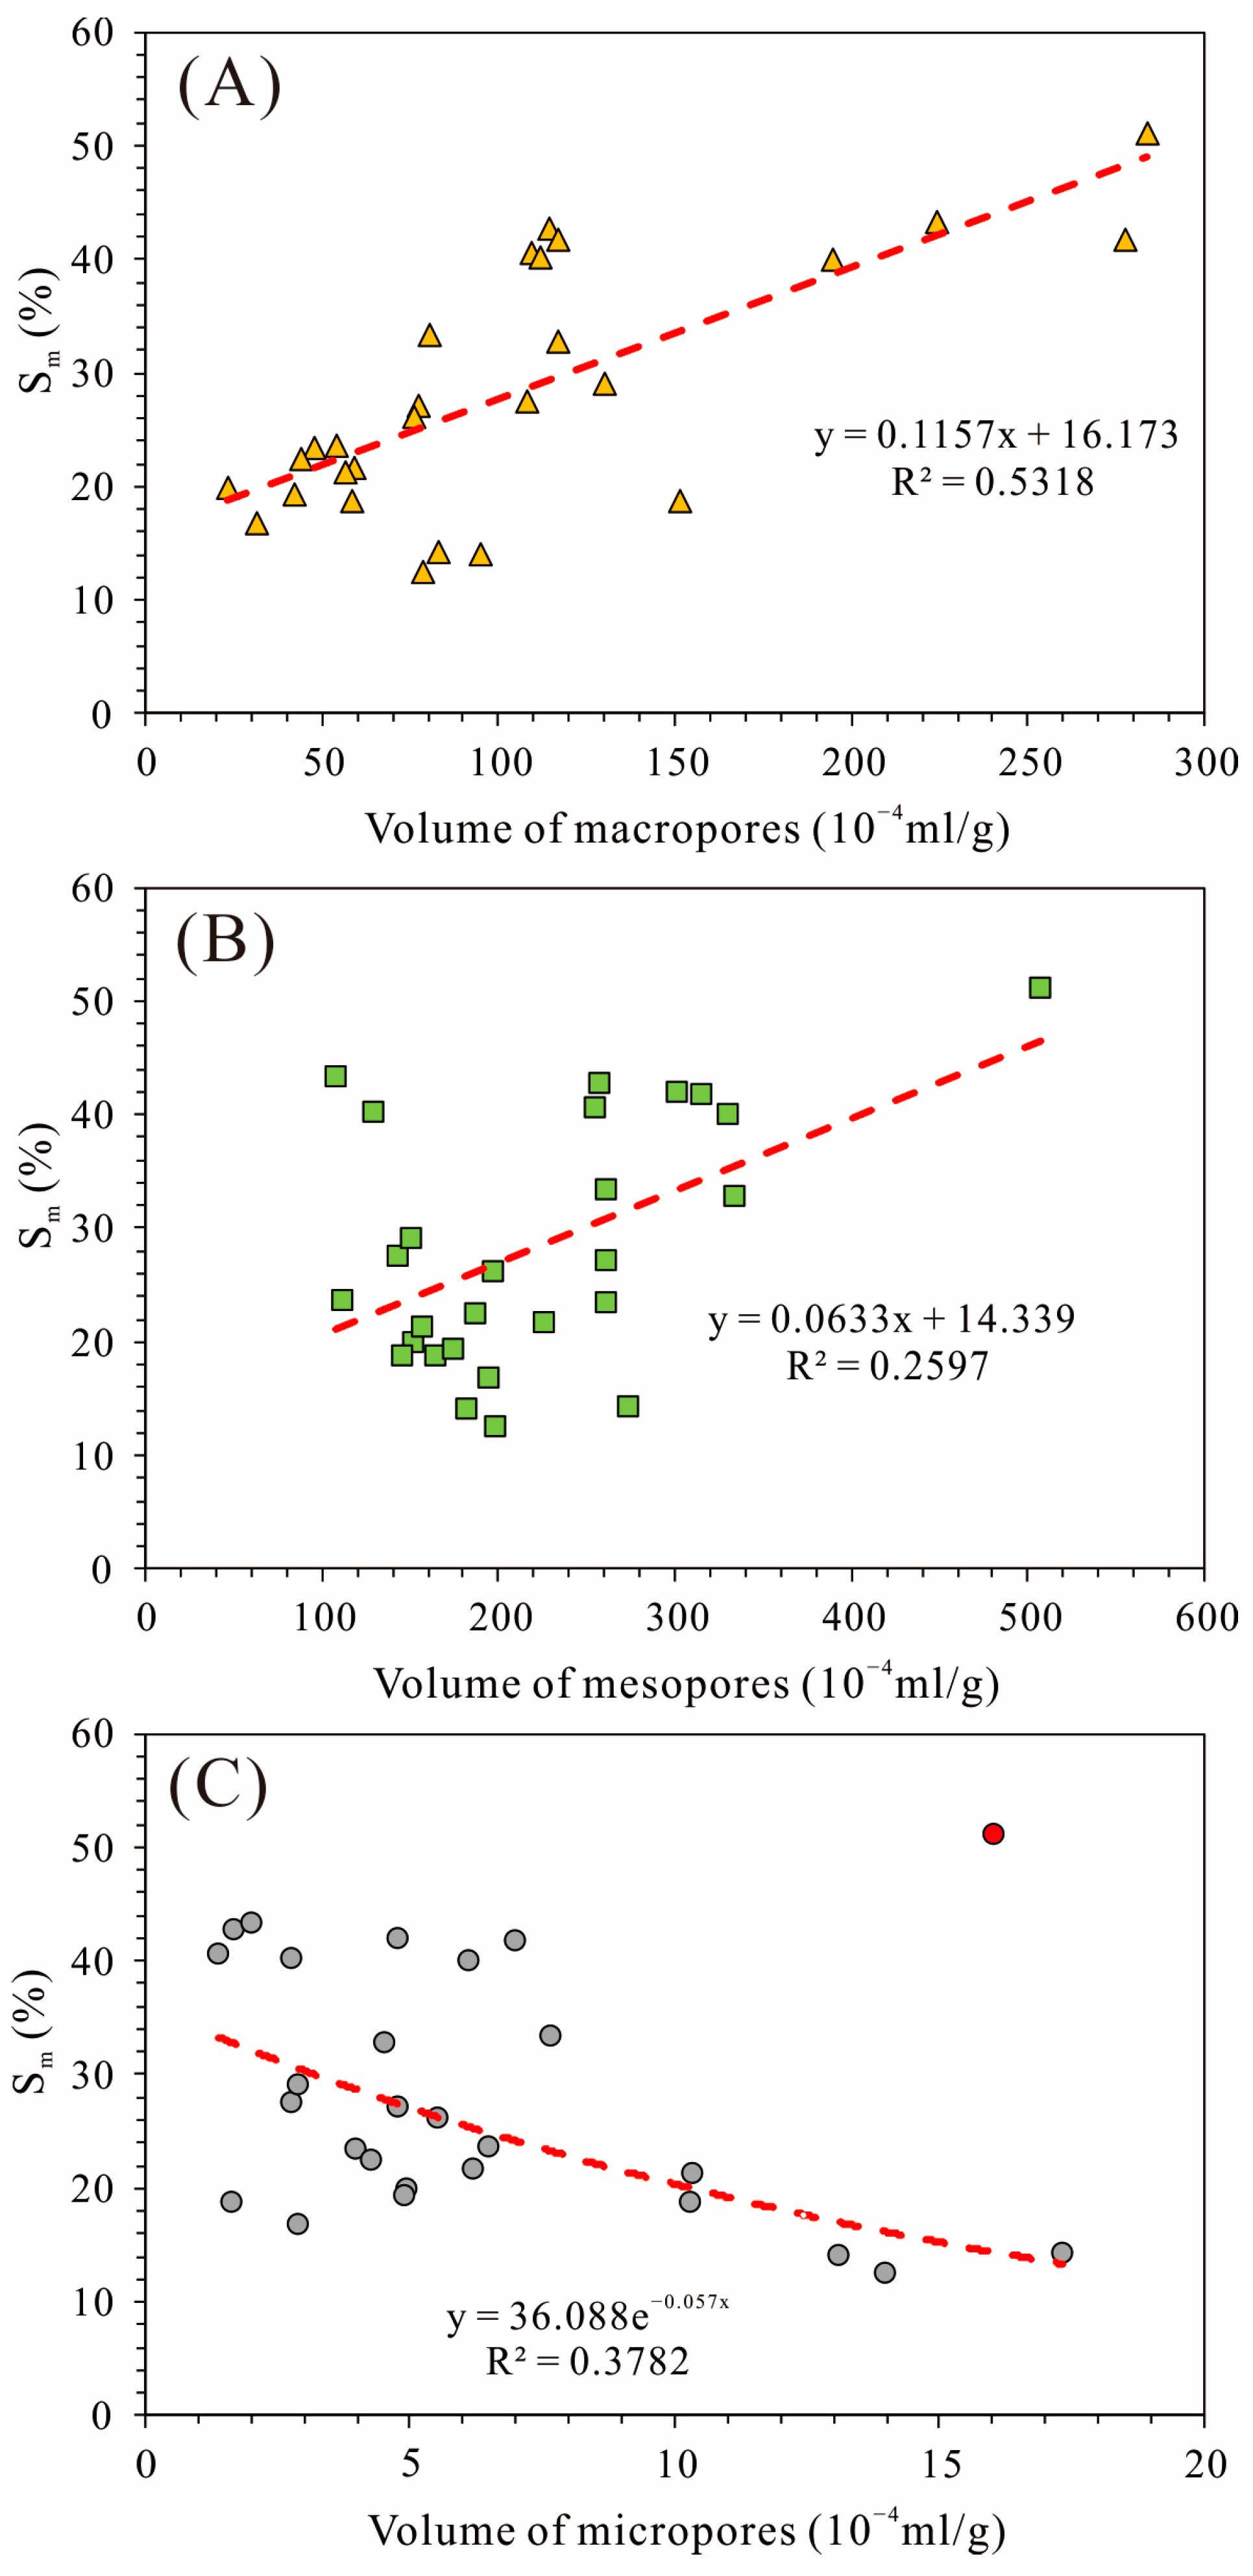
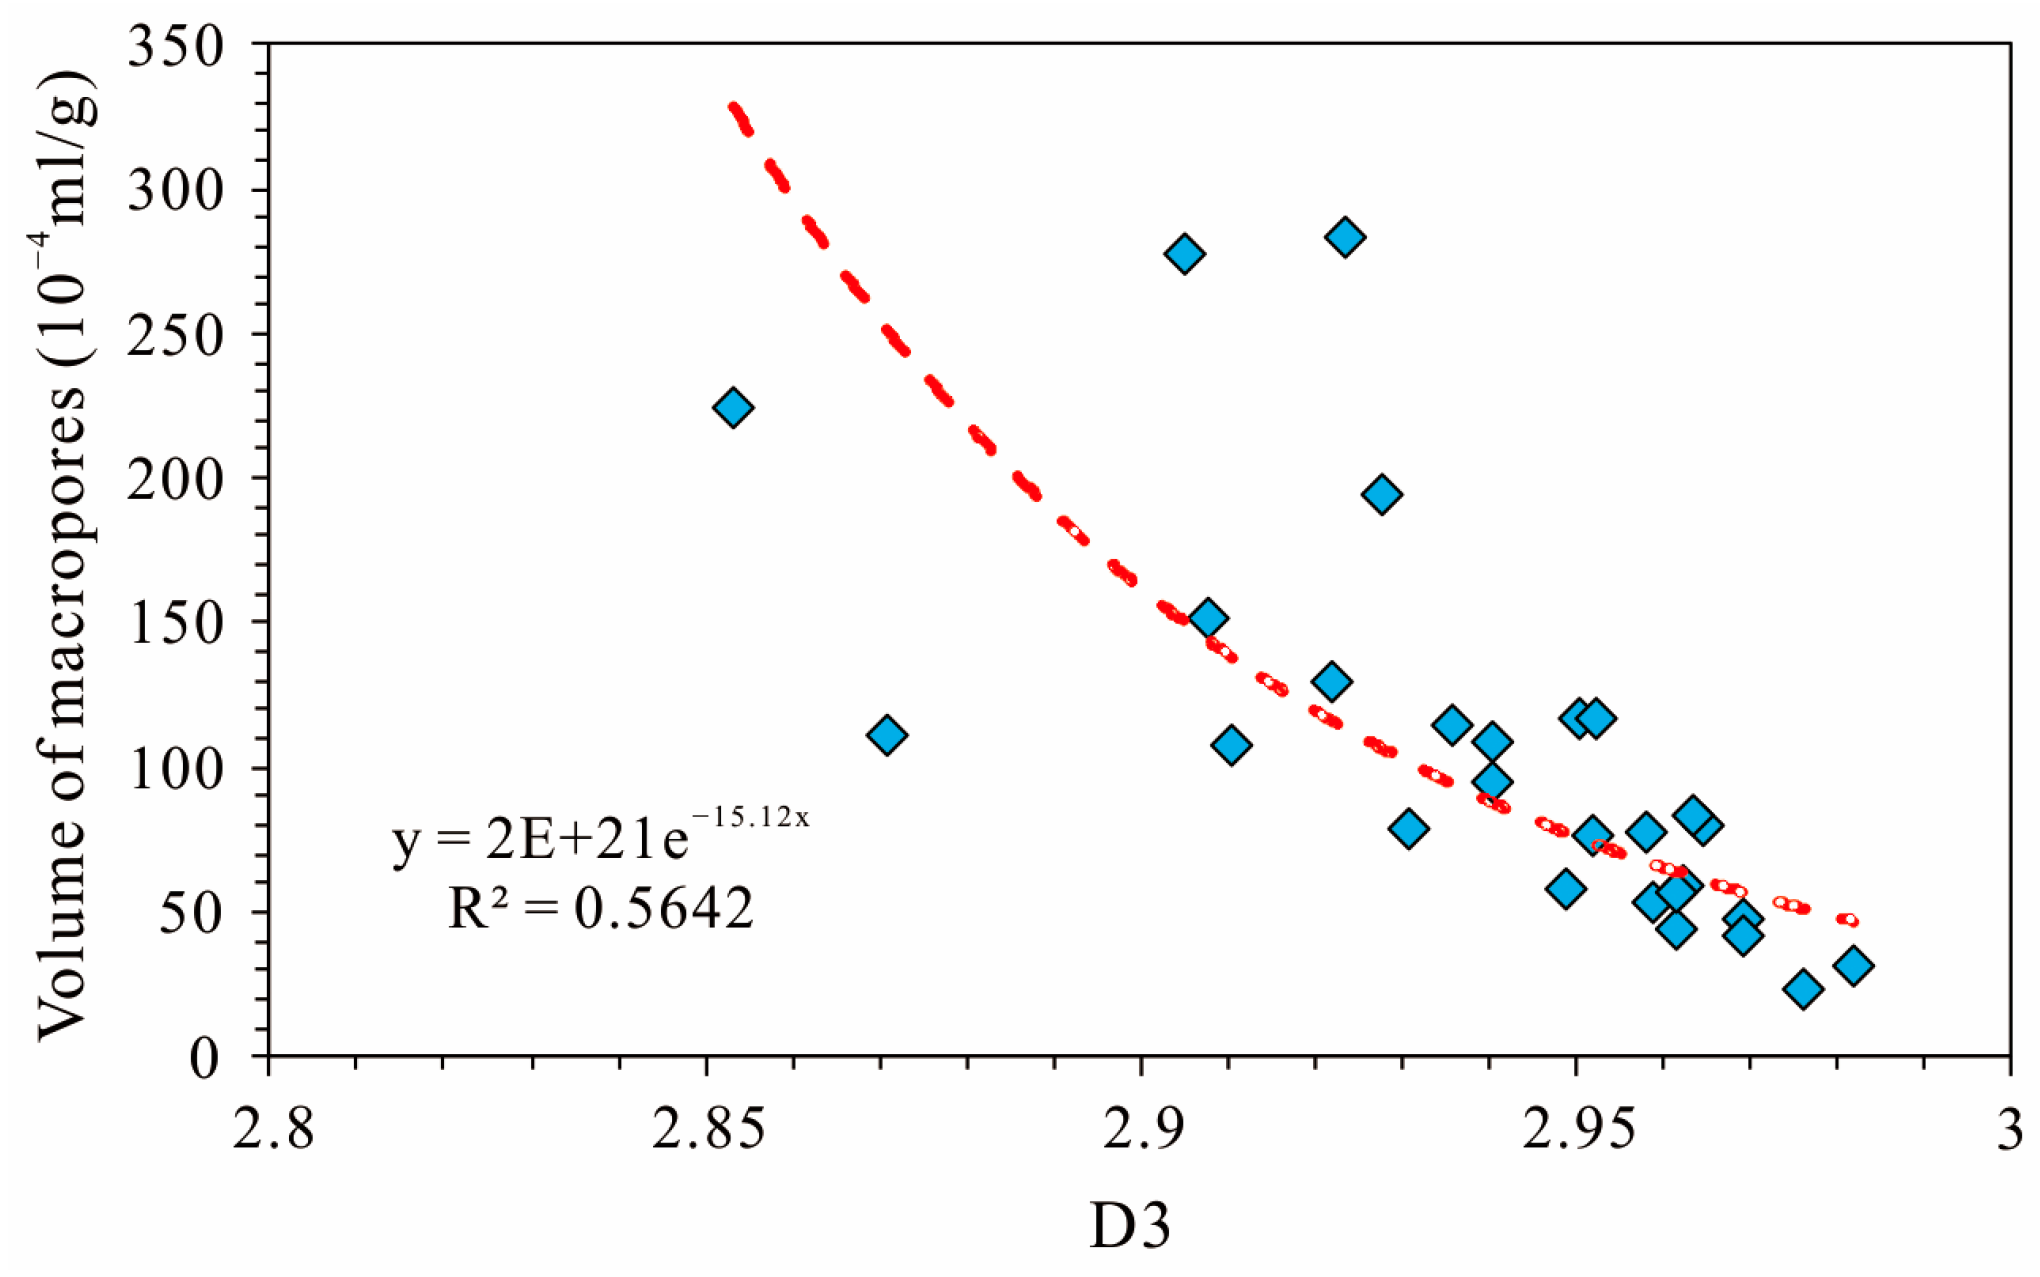
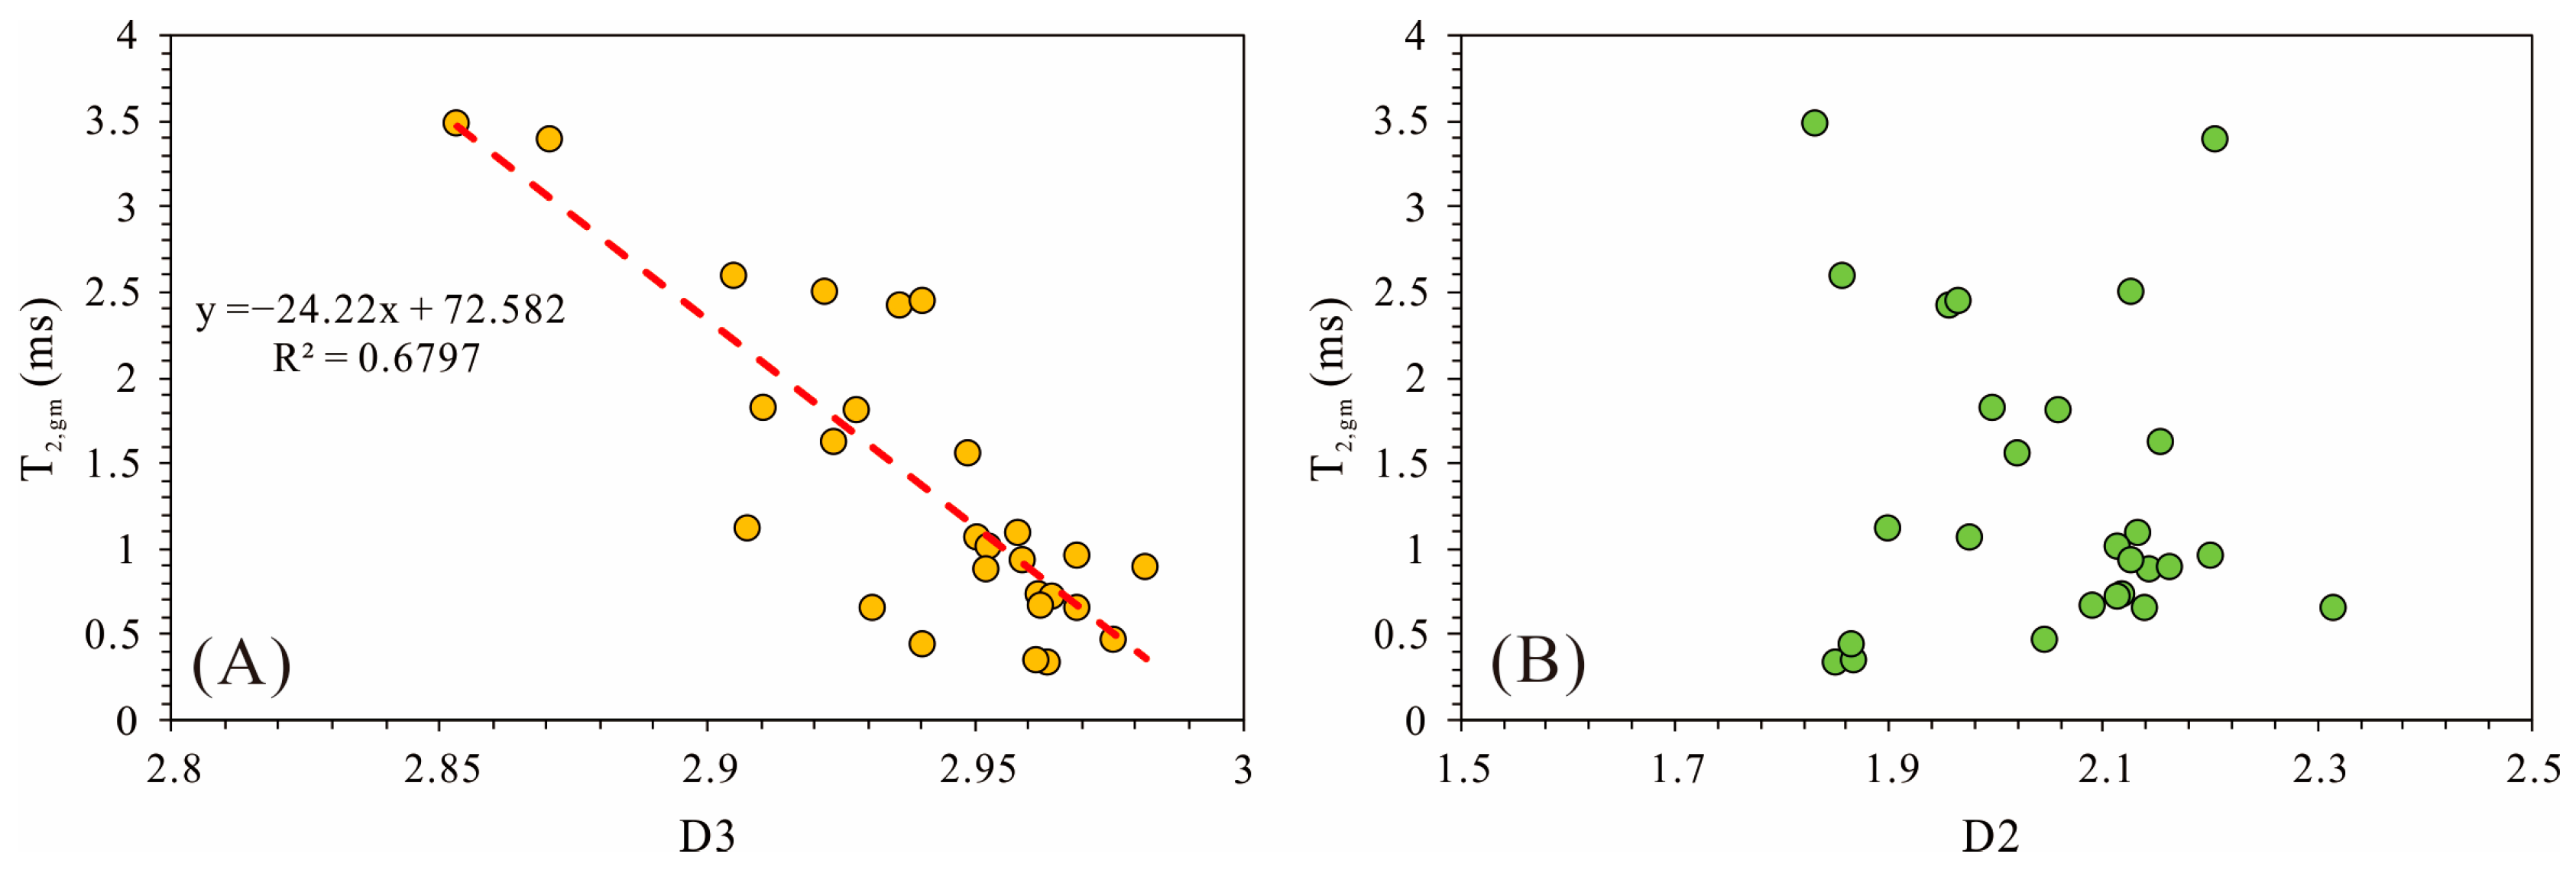
5.2. Correlations between Fractal Characteristics, Porosity, Permeability, and Movable Fluid Saturation

D3 waws negatively correlated with porosity, permeability, and Sm, while D2 showed no significant relationships with porosity, permeability, and Sm (Figure 8). These results suggest that the increase in D3 results in a complex pore structure, thereby reducing permeability and fluid mobility. There was an obvious positive relationship between Sm and the volume of macropores. Moreover, there was a weak positive relationship between Sm and the volume of mesopores. However, the Sm was negatively correlated with micropore volume (Figure 9B,C). In addition, the high value of D3 reduces the volume of macropores (Figure 10). Therefore, the reservoir quality and fluid mobility of conglomerates were dominated by the complexity of macropores.

5.3. Implications of Fractal Characteristics for Characterizing the Pore Structure of Conglomerates

The fractal characteristics derived from NMR data revealed that macropores, mesopores, and micropores constituted the pore system of low-permeability conglomerates. Macropores were dominated by DPs and RIPs, which are the major contributors to reservoir quality and fluid mobility. Mesopores were mainly composed of clay-related pores in which the fluid is mostly irreducible. Micropores mainly reflect the adsorption spaces. The geometric mean of the T2 spectra (T2,gm) under saturated conditions can be used to assess the quality of the reservoir pore structure. A high T2,gm reflects a good pore structure [28]. T2,gm displayed a distinct negative relationship with D3, with R2 of 0.6897, while the correlation between T2,gm and D2 was not obvious (Figure 11). Thus, D3 is a good indicator to reveal the quality of pore structure in the low-permeability conglomerates.

6. Conclusions

The P2w and T1b low-permeability conglomerate samples were measured by CTS, SEM, and NMR experiments to investigate the multi-scale pore system and fractal characteristics. The following conclusions can be drawn.
Four pore types are identified from CTS and SEM images: RIPs, DPs, CRPs, and microfractures. Based on the fractal characteristics of a multi-scale pore system, the pore system is divided into three parts: macropores, mesopores, and micropores. The physical properties and fluid mobility of conglomerates are mainly controlled by the fractal dimension and volume of macropores. The development of macropores is dominated by the contents of feldspar, quartz, and clay minerals. Pore-lining and pore-filling clays can increase the complexity of macropores. Only D3 can indicate the quality of the pore structure of conglomerates.

Author Contributions

Conceptualization, Z.W. and S.L.; methodology, W.T. and S.L.; investigation, W.T.; resources, Y.G.; data curation, J.Z., Y.F. and H.G.; writing—original draft preparation, J.Z.; writing—review and editing, W.T., S.L. and X.Z.; supervision, Z.W.; funding acquisition, W.T. and Z.W. All authors have read and agreed to the published version of the manuscript.

Funding

This research was funded by the National Natural Science Foundation of China (Grant No. 42202187 and 42272160).

Data Availability Statement

Not applicable.

Conflicts of Interest

The authors declare no conflict of interest.

References

  1. Blasko, D.P.; Wenger, W.J.; Morris, J.C. Oilfields and Crude Oil Characteristics: Cook Inlet Basin, Alaska; US Department of Interior, Bureau of Mines: Wanshington, DC, USA, 1972.
  2. Zonneveld, J.P.; Moslow, T.F. Exploration Potential of the Father G Shoreface Conglomerate Trend: Evidence from Outcrop. Bull. Can. Pet. Geol. 2004, 52, 23–38. [Google Scholar] [CrossRef]
  3. Zhang, L.; Lu, S.; Xiao, D.; Gu, M. Characterization of Full Pore Size Distribution and Its Significance to Macroscopic Physical Parameters in Tight Glutenites. J. Nat. Gas Sci. Eng. 2017, 38, 434–449. [Google Scholar] [CrossRef]
  4. Zhu, X.M.; Zhao, D.N.; Jiang, S.X.; Ge, J.W.; Zhang, S.P.; Han, X.F.; Liu, X. Digenetic Sequence of Low Porosity and Permeability Reservoirs from Nearshore Subaqeous Fan of Shahejie Formation in the Steep Slope Zone of Chezhen Depression, Bohai Bay Basin. J. Earth Sci. Environ. 2014, 36, 1–9. [Google Scholar] [CrossRef]
  5. He, C.; Zhang, C. The World ’s Largest Conglomerate Oil Field Discovered in Junggar Basin, Xinjiang. Geol. China 2017, 44, 1174. [Google Scholar]
  6. Zhi, D.; Tang, Y.; Zheng, M.; Guo, W.; Wu, T.; Zou, Z. Discovery, Distribution and Exploration Practice of Large Oil Provinces of Above? Source Conglomerate in Mahu Sag. Xinjiang Pet. Geol. 2018, 39, 1–8+22. [Google Scholar] [CrossRef]
  7. Blair, T.C.; McPherson, J.G. Grain-Size and Textural Classification of Coarse Sedimentary Particles. J. Sediment. Res. 1999, 69, 6–19. [Google Scholar] [CrossRef]
  8. Xiao, M.; Wu, S.; Yuan, X.; Cao, Z.; Xie, Z. Diagenesis Effects on the Conglomerate Reservoir Quality of the Baikouquan Formation, Junggar Basin, China. J. Pet. Sci. Eng. 2020, 195, 107599. [Google Scholar] [CrossRef]
  9. Xiao, M.; Wu, S.; Yuan, X.; Xie, Z. Conglomerate Reservoir Pore Evolution Characteristics and Favorable Area Prediction: A Case Study of the Lower Triassic Baikouquan Formation in the Northwest Margin of the Junggar Basin, China. J. Earth Sci. 2021, 32, 998–1010. [Google Scholar] [CrossRef]
  10. Tian, W.; Lu, S.; Huang, W.; Wang, S.; Gao, Y.; Wang, W.; Li, J.; Xu, J.; Zhan, Z. Study on the Full-Range Pore Size Distribution and the Movable Oil Distribution in Glutenite. Energy Fuels 2019, 33, 7028–7042. [Google Scholar] [CrossRef]
  11. Yu, Z.; Wang, Z.; Jiang, Q.; Wang, J.; Feng, Y.; Zheng, J.; Baffour, B.A. Evaluation of Low Permeability Conglomerate Reservoirs Based on Petrophysical Facies: A Case Study from the Triassic Baikouquan Formation, Northern Mahu Sag, Junggar Basin, China. J. Pet. Sci. Eng. 2022, 219, 111082. [Google Scholar] [CrossRef]
  12. Wang, Z.; Ge, H.; Zhou, W.; Wei, Y.; Wang, B.; Liu, S.; Zhou, H.; Du, S. Characterization of Pores and Microfractures in Tight Conglomerate Reservoirs. Int. J. Hydrogen Energy 2022, 47, 26901–26914. [Google Scholar] [CrossRef]
  13. Wu, Y.; Tahmasebi, P.; Lin, C.; Aleem, M.; Dong, C.; Golab, A.N.; Ren, L. A Comprehensive Study on Geometric, Topological and Fractal Characterizations of Pore Systems in Low-Permeability Reservoirs Based on SEM, MICP, NMR, and X-ray CT Experiments. Mar. Pet. Geol. 2019, 103, 12–28. [Google Scholar] [CrossRef]
  14. Loucks, R.G.; Reed, R.M.; Ruppel, S.C.; Hammes, U. Spectrum of Pore Types and Networks in Mudrocks and a Descriptive Classification for Matrix-Related Mudrock Pores. Am. Assoc. Pet. Geol. Bull. 2012, 96, 1071–1098. [Google Scholar] [CrossRef]
  15. Anovitz, L.M.; Cole, D.R. Characterization and Analysis of Porosity and Pore Structures. Rev. Mineral. Geochem. 2015, 80, 61–164. [Google Scholar] [CrossRef]
  16. Kaufmann, J.; Loser, R.; Leemann, A. Analysis of Cement-Bonded Materials by Multi-Cycle Mercury Intrusion and Nitrogen Sorption. J. Colloid Interface Sci. 2009, 336, 730–737. [Google Scholar] [CrossRef]
  17. Xiao, D.; Jiang, S.; Thul, D.; Huang, W.; Lu, Z.; Lu, S. Combining Rate-Controlled Porosimetry and NMR to Probe Full-Range Pore Throat Structures and Their Evolution Features in Tight Sands: A Case Study in the Songliao Basin, China. Mar. Pet. Geol. 2017, 83, 111–123. [Google Scholar] [CrossRef]
  18. Chen, J.; Huang, Z.; Yao, G.; Zhang, W.; Pan, Y.; Qu, T. Analysis Method of Full-Scale Pore Distribution Based on MICP, CT Scanning, NMR, and Cast Thin Section Imaging—A Case Study of Paleogene Sandstone in Xihu Sag, East China Sea Basin. Processes 2023, 11, 1869. [Google Scholar] [CrossRef]
  19. Liu, K.; Ostadhassan, M. Multi-Scale Fractal Analysis of Pores in Shale Rocks. J. Appl. Geophys. 2017, 140, 1–10. [Google Scholar] [CrossRef]
  20. Lai, J.; Wang, G. Fractal Analysis of Tight Gas Sandstones Using High-Pressure Mercury Intrusion Techniques. J. Nat. Gas Sci. Eng. 2015, 24, 185–196. [Google Scholar] [CrossRef]
  21. Yao, Y.; Liu, D.; Tang, D.; Tang, S.; Huang, W. Fractal Characterization of Adsorption-Pores of Coals from North China: An Investigation on CH4 Adsorption Capacity of Coals. Int. J. Coal Geol. 2008, 73, 27–42. [Google Scholar] [CrossRef]
  22. Xu, Q.; Ma, Y.; Liu, B.; Song, X.; Li, L.; Xu, J.; Su, J.; Wu, K.; Chen, Z. Fractal Characteristics of Lacustrine Tight Carbonate Nanoscale Reservoirs. Energy Fuels 2018, 32, 107–118. [Google Scholar] [CrossRef]
  23. Zhang, J.; Tang, Y.; He, D.; Sun, P.; Zou, X. Full-Scale Nanopore System and Fractal Characteristics of Clay-Rich Lacustrine Shale Combining FE-SEM, Nano-CT, Gas Adsorption and Mercury Intrusion Porosimetry. Appl. Clay Sci. 2020, 196, 105758. [Google Scholar] [CrossRef]
  24. Shao, X.; Pang, X.; Li, H.; Zhang, X. Fractal Analysis of Pore Network in Tight Gas Sandstones Using NMR Method: A Case Study from the Ordos Basin, China. Energy Fuels 2017, 31, 10358–10368. [Google Scholar] [CrossRef]
  25. Dang, W.; Fao, G.; You, X.; Wu, J.; Liu, S.; Yan, Q.; He, W.; Guo, L. Genesis and Distribution of Oils in Mahu Sag, Junggar Basin, NW China. Pet. Explor. Dev. 2023, 50, 840–850. [Google Scholar] [CrossRef]
  26. Qu, J.; Yang, R.; Tang, Y. Large Area Petroleum Accumulation Model of the Triassic Glutenite Reservoirs in the Mahu Sag, Junggar Basin: Triple Controls of Fan, Fault and Overpressure. Acta Geol. Sin. 2019, 93, 915–927. [Google Scholar] [CrossRef]
  27. Xu, T.; Liu, L.; Wang, Y.; Ji, H.; Song, G.; Wan, Q.; Luo, Z.; Li, X.; Li, L.; Li, J. Diagenesis and Porosity Evolution of Clastic Reservoir of Baikouquan Formation in Wuerhe-Fengnan Area. J. Northeast Pet. Univ. 2018, 42, 27–39. [Google Scholar] [CrossRef]
  28. Lai, J.; Wang, G.; Wang, Z.; Chen, J.; Pang, X.; Wang, S.; Zhou, Z.; He, Z.; Qin, Z.; Fan, X. A Review on Pore Structure Characterization in Tight Sandstones. Earth-Sci. Rev. 2018, 177, 436–457. [Google Scholar] [CrossRef]
  29. Xiao, D.; Jiang, S.; Thul, D.; Lu, S.; Zhang, L.; Li, B. Impacts of Clay on Pore Structure, Storage and Percolation of Tight Sandstones from the Songliao Basin, China: Implications for Genetic Classification of Tight Sandstone Reservoirs. Fuel 2018, 211, 390–404. [Google Scholar] [CrossRef]
  30. Neasham, J.W. The Morphology of Dispersed Clay in Sandstone Reservoirs and Its Effect on Sandstone Shaliness, Pore Space and Fluid Flow Properties. In Proceedings of the SPE Annual Fall Technical Conference and Exhibition, Denver, CO, USA, 9–12 October 1977; pp. 1–8. [Google Scholar]
  31. Wilson, M.D.; Pittman, E.D. Authigenic Clays in Sandstones; Recognition and Influence on Reservoir Properties and Paleoenvironmental Analysis. J. Sediment. Res. 1977, 47, 3–31. [Google Scholar] [CrossRef]
Figure 1. Location of the Junggar Basin and Mahu Sag (Revised from Tian et al., 2019) [10]. (a) Geological map of the Mahu Sag; (b) The Location of the Mahu Sag in the Junggar Basin; (c) The Location of the Junggar Basin in China.
Processes 11 02667 g001
Figure 2. The physical properties of the P2w and the T1b conglomerate reservoirs from the Mahu Sag. (A) Relationship between permeability and porosity from collected data; (B) Relationship between permeability and porosity from studied data.
Processes 11 02667 g002
Figure 3. Pore types identified by CTS and SEM images in the P2w and T1b conglomerates. (A) Intragranular dissolution pores (IDPs), B1, plane polarized light; (B) grain boundary fractures and structural fractures, W5, plane polarized light; (C) residual intergranular pores (RIPs) and intragranular dissolution pores (IDPs), B14, SEM; (D) QEMSCAN image in the same view field as photo C; (E) IDPs within rock fragments, B7, plane polarized light; (F) IDPs, W4, SEM; (G) clay-related pores (CRPs) associated with detrital clay and IDPs within feldspar, W4, SEM; (H) QEMSCAN image in the same view field as photo G; (I) CRPs associated with authigenic clay, W4, SEM; (J) grain boundary fractures and calcite cement, B21, plane polarized light; (K) RIPs and DPs, B14, plane polarized light.
Processes 11 02667 g003
Figure 4. NMR T2 spectrum of the typical conglomerate samples at the saturated and centrifuged conditions. (A) is from sample B1; (B) is from sample B2; (C) is from sample B13; (D) is from sample B14; (E) is from sample W4; (F) is from sample W5.
Processes 11 02667 g004
Figure 5. Fractal characteristics of the typical conglomerates. (A) is from sample B1; (B) is from sample B2; (C) is from sample B13; (D) is from sample B14; (E) is from sample W4; (F) is from sample W5.
Processes 11 02667 g005
Figure 6. Correlations between fractal dimensions (D3 and D2) and mineral compositions. (A) Correlation of D3 versus quartz; (B) Correlation of D2 versus quartz; (C) Correlation of D3 versus feldspar; (D) Correlation of D2 versus feldspar; (E) Correlation of D3 versus calcite; (F) Correlation of D2 versus calcite; (G) Correlation of D3 versus clay minerals; (H) Correlation of D2 versus clay minerals.
Processes 11 02667 g006
Figure 7. Relationships between mineral compositions and pore volumes. (A) Relationship of macropore volume versus quartz; (B) Relationship of mesopore volume versus quartz; (C) Relationship of micropore volume versus quartz; (D) Relationship of macropore volume versus feldspar; (E) Relationship of mesopore volume versus feldspar; (F) Relationship of micropore volume versus feldspar; (G) Relationship of macropore volume versus calcite; (H) Relationship of mesopore volume versus calcite; (I) Relationship of micropore volume versus calcite; (J) Relationship of macropore volume versus clay minerals; (K) Relationship of mesopore volume versus clay minerals; (L) Relationship of micropore volume versus clay minerals.
Processes 11 02667 g007
Figure 8. Relationships between fractal dimensions and porosity and permeability and movable fluid saturation. (A) Relationship of porosity versus D3; (B) Relationship of porosity versus D2; (C) Relationship of permeability versus D3; (D) Relationship of permeability versus D2; (E) Relationship of Sm versus D3; (F) Relationship of Sm versus D2.
Processes 11 02667 g008
Figure 9. Relationships between movable fluid saturation and pore volumes. (A) Relationship of Sm versus macropore volume; (B) Relationship of Sm versus mesopore volume; (C) Relationship of Sm versus micropore volume.
Processes 11 02667 g009
Figure 10. Relationships between D3 and the volume of macropores.
Processes 11 02667 g010
Figure 11. Relationships between T2,gm and fractal dimensions. (A) Relationship of T2,gm versus D3; (B) Relationship of T2,gm versus D2.
Processes 11 02667 g011
Table 1. Porosity, permeability, and mineral composition of the conglomerates. Φ—porosity, K—permeability, Q—quartz, F—feldspar, Ca—calcite, CM—clay mineral, S—smectite, Ka—kaolinite, I—illite, C—chlorite, I/S—mixed layer illite and smectite, C/S—mixed layer chlorite and smectite.
No.WellΦ (%)K (mD)Mineral Composition (wt.%)
QFCaCMSKaICI/SC/S
B1M60114.5/41.945.31.311.40.002.281.374.451.142.17
B2M6017.40.008841.545.60.012.90.002.322.454.771.032.32
B3M60311.10.014745.545.60.78.20.000.666.070.980.160.33
B4M60410.3/45.545.60.78.20.000.666.070.980.160.33
B5M6036.70.079538.547.30.014.30.003.153.435.151.431.14
B7M6048.9/44.741.81.711.80.002.121.534.841.302.01
B8M15411.3/48.141.40.510.00.001.302.904.100.301.40
B9M1546.6/31.932.330.14.40.000.750.841.980.220.62
B10M1547.5/31.932.330.14.40.000.750.841.980.220.62
B11M1547.2/42.144.30.013.60.001.366.663.260.541.77
B12M1547.2/62.318.70.019.12.101.724.786.690.003.82
B13M13613.90.207051.632.04.611.70.000.239.131.520.000.82
B14M13920.33.520053.240.00.06.80.001.092.242.450.480.54
B15M13912.5/35.752.83.38.20.080.334.352.710.160.57
B16M1396.8/37.649.10.013.31.060.405.594.920.001.33
B17M1397.2/47.242.10.010.6//////
B18X7239.50.057949.741.33.65.40.000.431.892.000.270.81
B19X7239.8/37.836.60.025.62.301.797.949.980.003.58
B20X7238.20.018544.241.94.39.60.001.152.983.650.481.34
B21X7238.30.316040.947.56.94.70.661.601.181.270.000.00
W1M0014.7/35.021.929.113.811.870.830.001.100.000.00
W2M0014.8/59.323.10.017.63.524.752.466.860.000.00
W3M2115.80.037842.731.60.025.113.302.511.517.780.000.00
W4M2115.3/49.835.00.314.99.241.940.003.730.000.00
W5M2183.40.095644.028.60.025.211.590.762.2710.580.000.00
W6M2183.4/43.931.91.23.10.900.060.002.140.000.00
W7M2183.8/49.820.915.413.97.920.280.005.700.000.00
Table 2. Parameters derived from NMR.
No.Depth
/m
T2l
/ms
T2r
/ms
T2,gm
/ms
Sm
/%
Fractal DimensionPore Volume/10−4 mL·g−1
D1D2D3Macro-Meso-Micro-
B13861.50.051.542.6041.89−1.9921.8562.9054.77301.15277.18
B23892.00.055.360.9623.39−1.9832.2022.9693.97261.2047.80
B33806.30.054.662.4242.69−2.0741.9572.9361.66257.27114.26
B43806.30.055002.4440.65−2.1481.9652.9401.40254.20109.34
B53837.90.053.533.3940.30−1.8672.2062.8712.78129.78111.72
B73881.00.053.301.1027.23−1.9692.1332.9584.78260.4877.27
B83007.60.052.501.0732.80−1.9931.9752.9514.52334.30116.46
B93027.10.051.890.4720.03−1.9672.0462.9764.96152.2423.41
B103027.10.052.500.7322.49−1.9802.1182.9624.26187.2944.03
B113034.10.051.891.8227.49−1.8961.9972.9112.77143.06108.14
B123069.80.054.061.5618.81−1.7602.0212.9491.63163.7158.16
B133270.70.052.501.8140.06−1.9632.0592.9286.10329.54194.77
B143260.10.052.031.6251.25−1.9212.1542.92416.02507.52283.72
B153273.30.052.501.0141.78−1.9232.1152.9536.97315.34116.48
B163280.30.052.170.6519.43−1.9672.1392.9694.89174.6941.94
B173309.90.052.170.8826.19−1.9692.1442.9525.54197.4775.90
B182676.50.051.253.4843.36−2.0031.8322.8532.03107.62223.89
B192686.70.051.890.7233.33−1.9112.1142.9657.68260.9380.12
B202691.90.051.890.6621.66−1.7672.0902.9626.19226.0958.74
B212734.00.052.872.5029.20−1.8742.1272.9222.88150.57129.98
W13567.30.051.540.6512.62−1.8892.3162.93113.98198.4478.45
W23572.80.054.660.8916.81−2.1122.1632.9822.87194.9731.59
W33772.30.051.010.9323.66−1.8952.1262.9596.48112.0853.80
W43768.40.050.511.1218.73−1.8801.8992.90810.30145.71151.50
W53854.30.050.510.3314.23−1.9121.8502.96417.33273.2282.92
W63915.30.050.510.3521.39−1.9111.8682.96210.32156.9356.67
W73932.20.050.4720.4414.10−1.9001.8662.94113.10182.3694.74
Disclaimer/Publisher’s Note: The statements, opinions and data contained in all publications are solely those of the individual author(s) and contributor(s) and not of MDPI and/or the editor(s). MDPI and/or the editor(s) disclaim responsibility for any injury to people or property resulting from any ideas, methods, instructions or products referred to in the content.

