Abstract
To investigate the effect of microwave irradiation on the rate of magnetite reduction while increasing the gas phase diffusion rate limit, the microstructure and kinetics of CO reduction of magnetite powder were studied. The investigation was conducted through microwave irradiation and conventional heating at 900~1100 °C. Under the two heating methods, the iron crystal is selectively reduced and gradually expanded along the direction normal to the length of the ore powder, forming a strip of iron crystal that penetrates the powder and expands outward across the width. The microwave field can effectively improve the sintering of minerals. The changes in Avrami exponents m and k in the reduction process were determined by combining the Johnson–Mehl–Avrami (JMA) model with the lnln method. The microwave field did not change the limiting step. Microwave irradiation proves to be the most effective means to enhance both the initial reduction rate and the rate during the primary iron crystal precipitation phase. The morphology of the iron crystal takes on a dense punctate shape, influenced by the rate of diffusion control.
1. Introduction
The blast-furnace converter process is the prevailing method in steelmaking. This is a relatively mature technology that achieves high production efficiency. The main characteristics of the process are the excessive reduction of silicon, phosphorus, and sulfur in molten iron, and the carbon metallurgy process of carbon saturation. Blast-furnace ironmaking depends on the coke’s structure and its function as a reducing agent. Amidst the trend of low-carbon metallurgy and enhancements in electric furnace capacity, gas-based reduction ironmaking offers the potential to eliminate dependence on coke resources and mitigate impurity elements in electric furnace steelmaking. This more environmentally friendly approach reduces carbon emissions, making it the most popular choice for a low-carbon process.
The most representative processes for large-scale industrial production of gas-based solid-state reduction are the MIDREX and ENERGIRON processes. The future advancement of gas-based solid-state reduction faces two primary challenges: non-carbon heat source protection, and production efficiency improvement. The former can be solved by replacing carbon heat with electric energy, while hydrogen-rich reducing gas (H2-CO instead of CO) and a higher reduction temperature help to further improve production efficiency. However, addressing the challenge of mineral phase sintering and iron phase bonding at high temperatures (above 900 °C) remains imperative [1].
Microwave irradiation, an electromagnetic heating method, is characterized by volume and selective heating [2,3,4,5]. Microwave irradiation significantly promotes chemical reactions [6]. Iron ore (powder or pellet) exhibits strong absorption characteristics [7]. The research on microwave reduction of iron-ore pellets and powder primarily utilizes the carbothermal reduction method [8,9,10]. Nonetheless, the literature reflects a few studies on microwave gas-based reduction. Applying the microwave field to the gas-based solid-state reduction process is expected to achieve the dual goals of heat source protection and reduction-rate improvement. It is of great importance to carry out fundamental and prospective studies on the metallurgical effect and mechanism of action of microwave irradiation, while exploring and studying various potential applications of microwave treatment in metallurgical processes.
The common properties of gas-based solid-state reduction of iron-ore powder or pellets are refined from basic metallurgical mechanics. The reduction process can be divided into the following component steps:
- Gas phase diffusion. This includes gas phase volume diffusion, pore diffusion, and gas-film diffusion of reducing and product gas.
- Solid phase diffusion. This includes the diffusion of the reduction process through the product layer and the internal diffusion of unreduced minerals.
- Interface reaction. This includes interface physics, chemical adsorption, and chemical reaction.
- Nucleation and growth. This includes the precipitation nucleation and growth of the new product phase.
Based on the relative resistance of the above steps in the reduction process, it becomes feasible to identify the primary limiting factors within the kinetics of the reduction process. The key to improving the metallurgical effect is mitigating the impedance caused by the constraining steps. In general, due to the high relative rate of the interfacial reaction in the reduction process, diffusion (gas or solid phase) can easily become a limiting factor in gas-based reduction. According to previous research, microwave irradiation can increase the solid phase diffusion rate [11]. However, whether microwave irradiation can improve the reduction rate when there is a gas phase diffusion rate limit has not been reported. In this study, a comparative analysis between microwave and conventional heating conditions was conducted, focusing on the microstructure and product morphology of the reduction process. CO has a lower diffusion capacity than H2, and the diffusion resistance of the ore-powder layer is higher than that of the ore-pellet bed. Therefore, this study designed a material bed using magnetite concentrate powder as the raw material and CO gas as the reducing gas. Experimental research was carried out to verify that the reduction process occurred within the constraints of the gas phase diffusion limitation mechanism.
2. Experiment
Magnetite concentrate powder obtained from a steel plant production unit was heated and dehydrated at 180 °C for 4 h in a drying oven. The X-ray diffraction pattern (XRD) of the magnetite powder indicated its composition to be 95.7% magnetite with small amounts of hornblende and mica [12]. The particle size distribution of the magnetite concentrate powder was measured using a Mastersizer 2000 laser particle size analyzer, presenting values ranging from 10 to 200 μm; the median particle size (D50) was 60.26 μm [12].
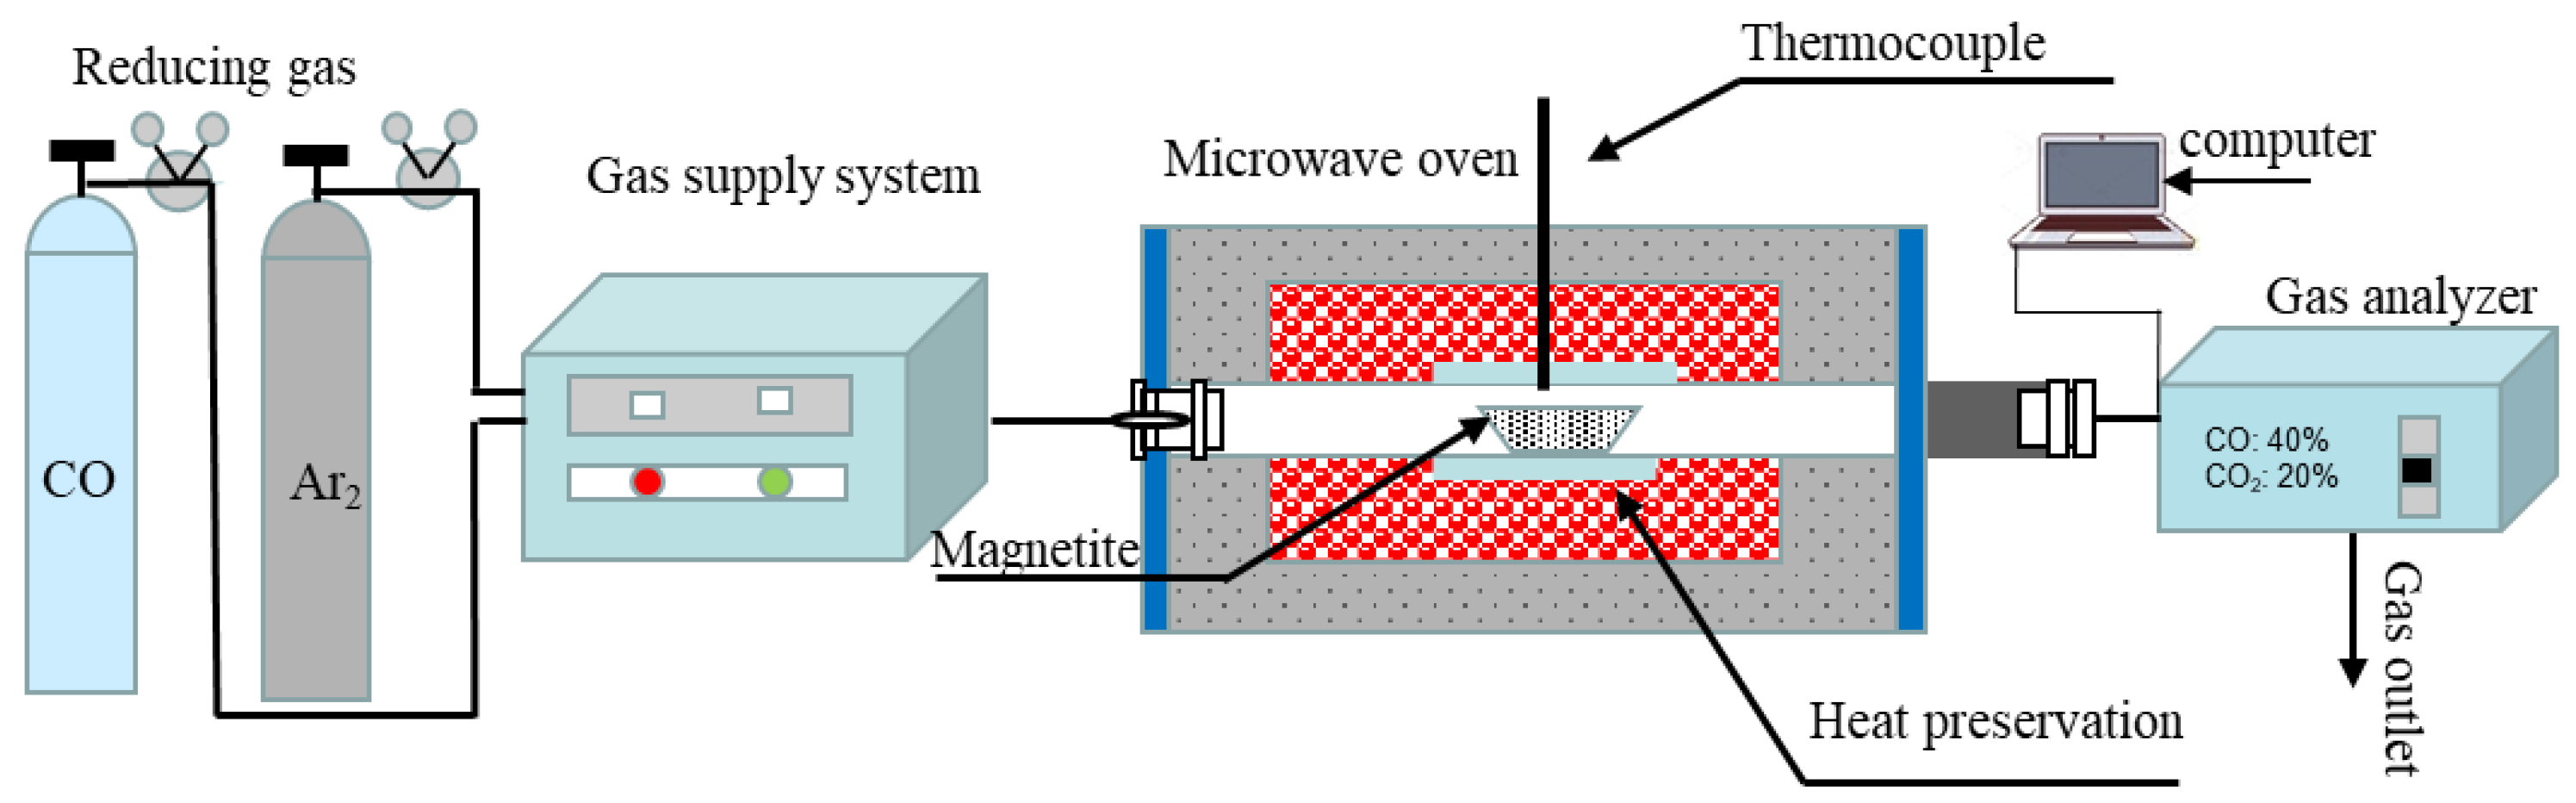
The magnetite powder (15 g) was placed in a corundum crucible (60 mm × 30 mm × 15 mm) without compaction. A tube furnace with conventional heating and microwave irradiation (1–4 kW, 2.45 GHz) was used in the experiment. The inner diameter (40 mm) and the length (100 mm) of the quartz tube. The heating rate was controlled at 20 °C/min. Once the reduction temperature was reached, it was maintained for a holding time of 40 min. High temperature and prolonged heating ensured that the temperature inside and outside the furnace tube remained consistent and uniform. A schematic diagram of the experimental device is shown in Figure 1.
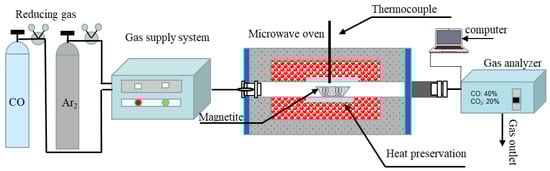
Figure 1.
Microwave experiment system.
Argon gas (purity 99.99% Ar) was used to protect the heating and cooling process. Different volumetric proportions of Ar-CO were introduced into the reduction process, and the total Ar-CO gas flow rate was 1.66 L/min. The gas flow was separately controlled by the mass flowmeter. A higher flow rate was used to avoid the experimental interference that can be caused by an inadequate CO flow rate. An online gas analyzer (Gasboard-3100), which was connected to the gas outlet of the tube-furnace reactor, was used to detect and record the real-time gas compositions. To facilitate prompt gas phase analysis, the quartz furnace tube was filled with a sealed quartz tube to shorten the residence time of the gas in the tube. After cooling, the magnetite was weighed to calculate the weight loss. The reduced products were subjected to chemical analysis, mineral phase composition analysis via XRD, and electron microscope morphology analysis via scanning electron microscopy (SEM). Details on the conventional tubular electric-heating furnace can be found in a previous study [13].
3. Results and Discussion
3.1. Reduction Indexes
Notably, the degree of metallization denotes the degree of conversion of iron oxide into metallic iron during reduction. It is defined as the percentage of the mass of metallic iron (MFe) divided by the total iron mass (TFe) in the reduced product ore powder, as shown in Equation (1).
During CO reduction of the iron-ore powder, oxygen in the iron oxide reactant is combined with the CO reducing gas to form CO2, which decreases the reactant mass. Therefore, the reaction process can be analyzed by the changes of quality or by the amount of CO2 released. The reduction ratio (x) is a key parameter adopted to characterize the reduction difficulty of reactants, that is, the difficulty of removing oxygen from reactants during the reaction process; moreover, it is an important fundamental parameter for assessing the rate-determining step. The calculation formula is as follows (Equation (2)):
Here, is the mass of accumulated oxygen loss at time t, and is the initial mass of oxygen contained in the solid iron oxide.
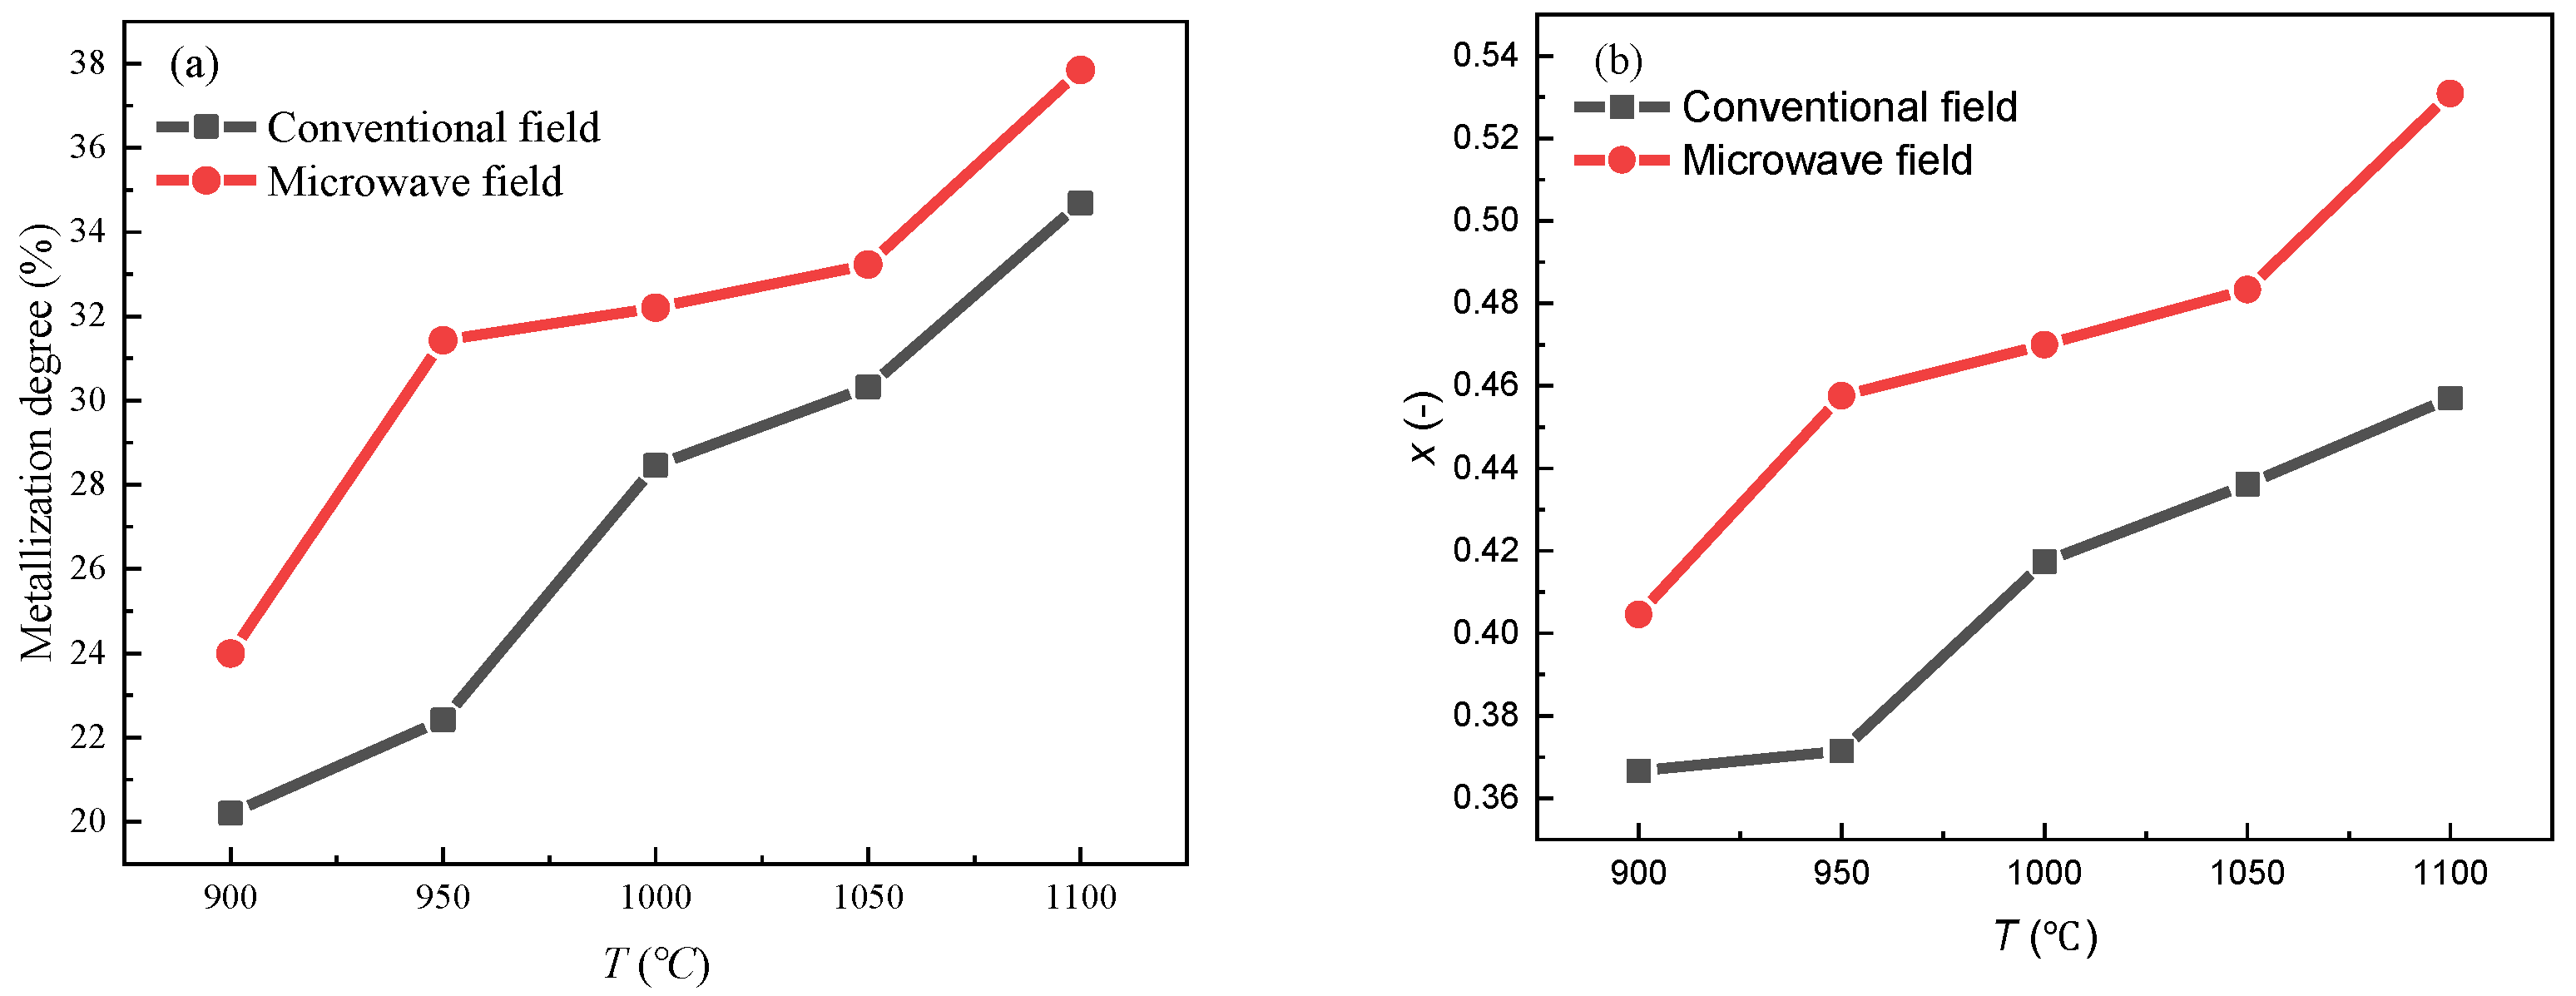
Figure 2a,b illustrate the effects of temperature on metallization degree and reduction ratio, respectively. The experiment was conducted for 40 min under 60 vol.% CO-Ar reduction gas via microwave and conventional heating.

Figure 2.
Variation in the metallization degree of magnetite under microwave or conventional heating at different temperatures: (a) metallization degree (b) reduction ratio.
Under the 60% CO-Ar atmosphere, both heating processes exhibited an increase in metallization degree and reduction ratio with increasing temperature, and the reduction processes were enhanced by microwave irradiation. The metallization degree and reduction ratio under microwave irradiation were higher than those under conventional heating. At 950 °C, the Md and x under the microwave field were 1.45 and 1.23 times higher, respectively, than those under the conventional field. As the temperature rose, the effect of microwave irradiation on enhancing reduction decreased. At 1100 °C, the metallization degree and reduction rate under the microwave field were 1.16 and 1.09 times those under the conventional field, respectively. However, under certain conditions, the reduction rate and metallization rate remained low, in accordance with the basic characteristics of diffusion limitation.
When the iron oxide is completely reduced, x = Md/100. As shown in Figure 2, there is a large differential value between Md/100 and x. This indicates that the reduction process has an intermediate (FeO) phase. This is due to the following two reactions:
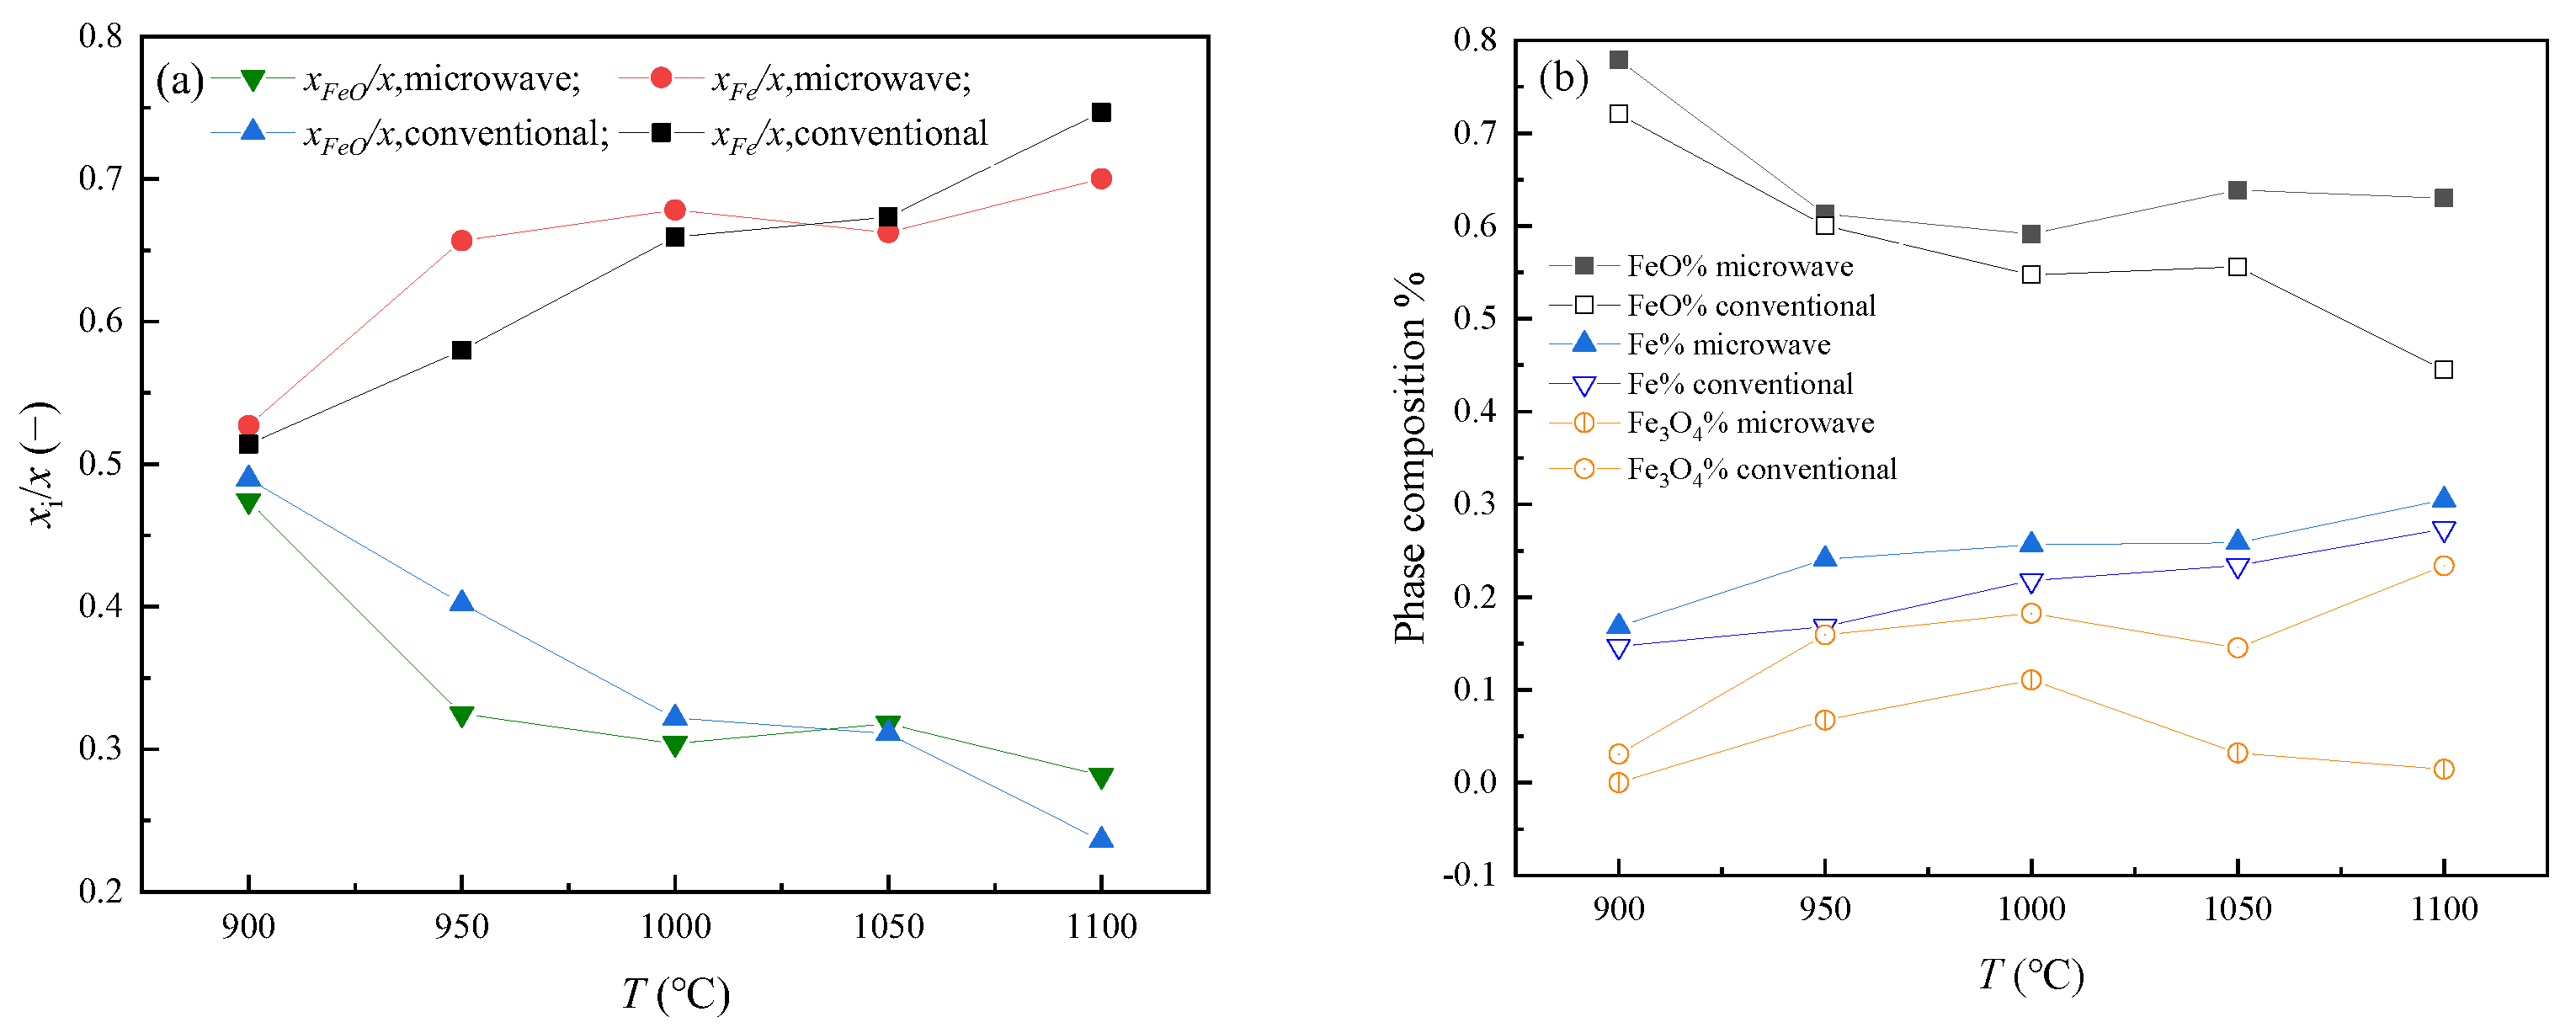
According to %TFe, %MFe, x, etc., the oxygen loss rate corresponding to Fe and intermediate FeO in the reduced product can be calculated. The mass loss caused by the reduction process due to the removal of S and P can be disregarded, as it accounts for a negligible proportion of the total mass. The above difference represents the oxygen-loss rate of the intermediate phase FeO generated by the reduction of Fe3O4:
Based on this, the ratio of oxygen lost in the Fe and FeO phases to the total oxygen loss can be obtained , as shown in Figure 3a. Further, the contents of Fe and FeO in the products were obtained (Figure 3b). Microwave irradiation can promote the conversion of Fe3O4 to FeO and the conversion of FeO to Fe. With the increase in temperature, the effect of the microwave field on the conversion of Fe3O4 to FeO becomes more apparent.
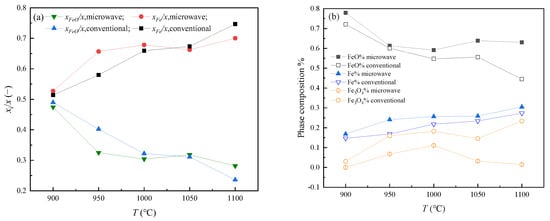
Figure 3.
(a) The oxygen loss rate of each step. (b) Phase composition after reduction.
3.2. Phases and Microscopic Morphology
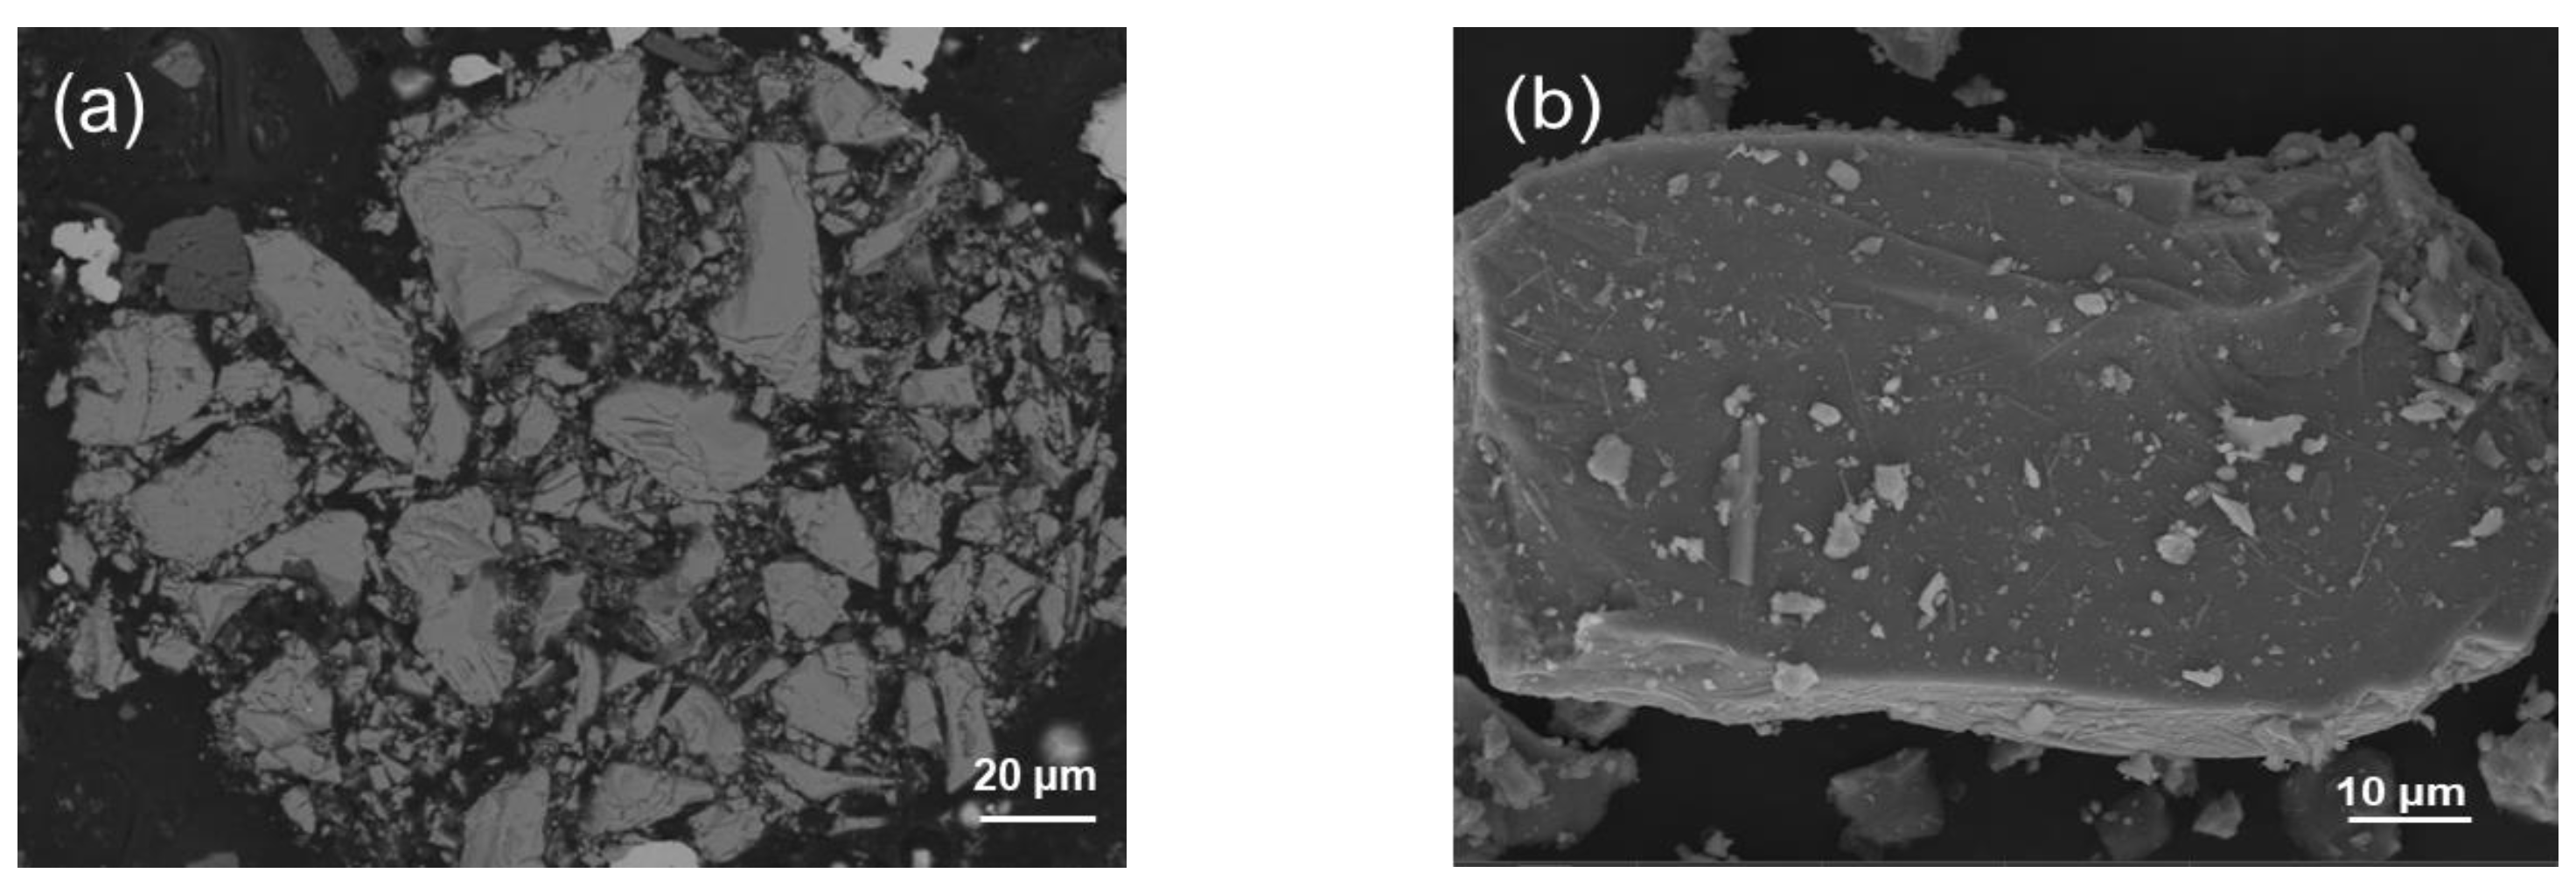
The backscattered electron image obtained via SEM analysis of a magnetite particle is shown in Figure 4. A conductive mounting material was selected. The bright white in the figure is copper in the mounting material. Figure 4a shows the backscattered electron pattern of the cross section of the original particle, Fe3O4 in dark gray. Figure 4b shows the surface of the original fine ore particles, which is relatively smooth and dense, with hardly any pores observed.

Figure 4.
SEM images of an original magnetite particle: (a) cross section and (b) surface.
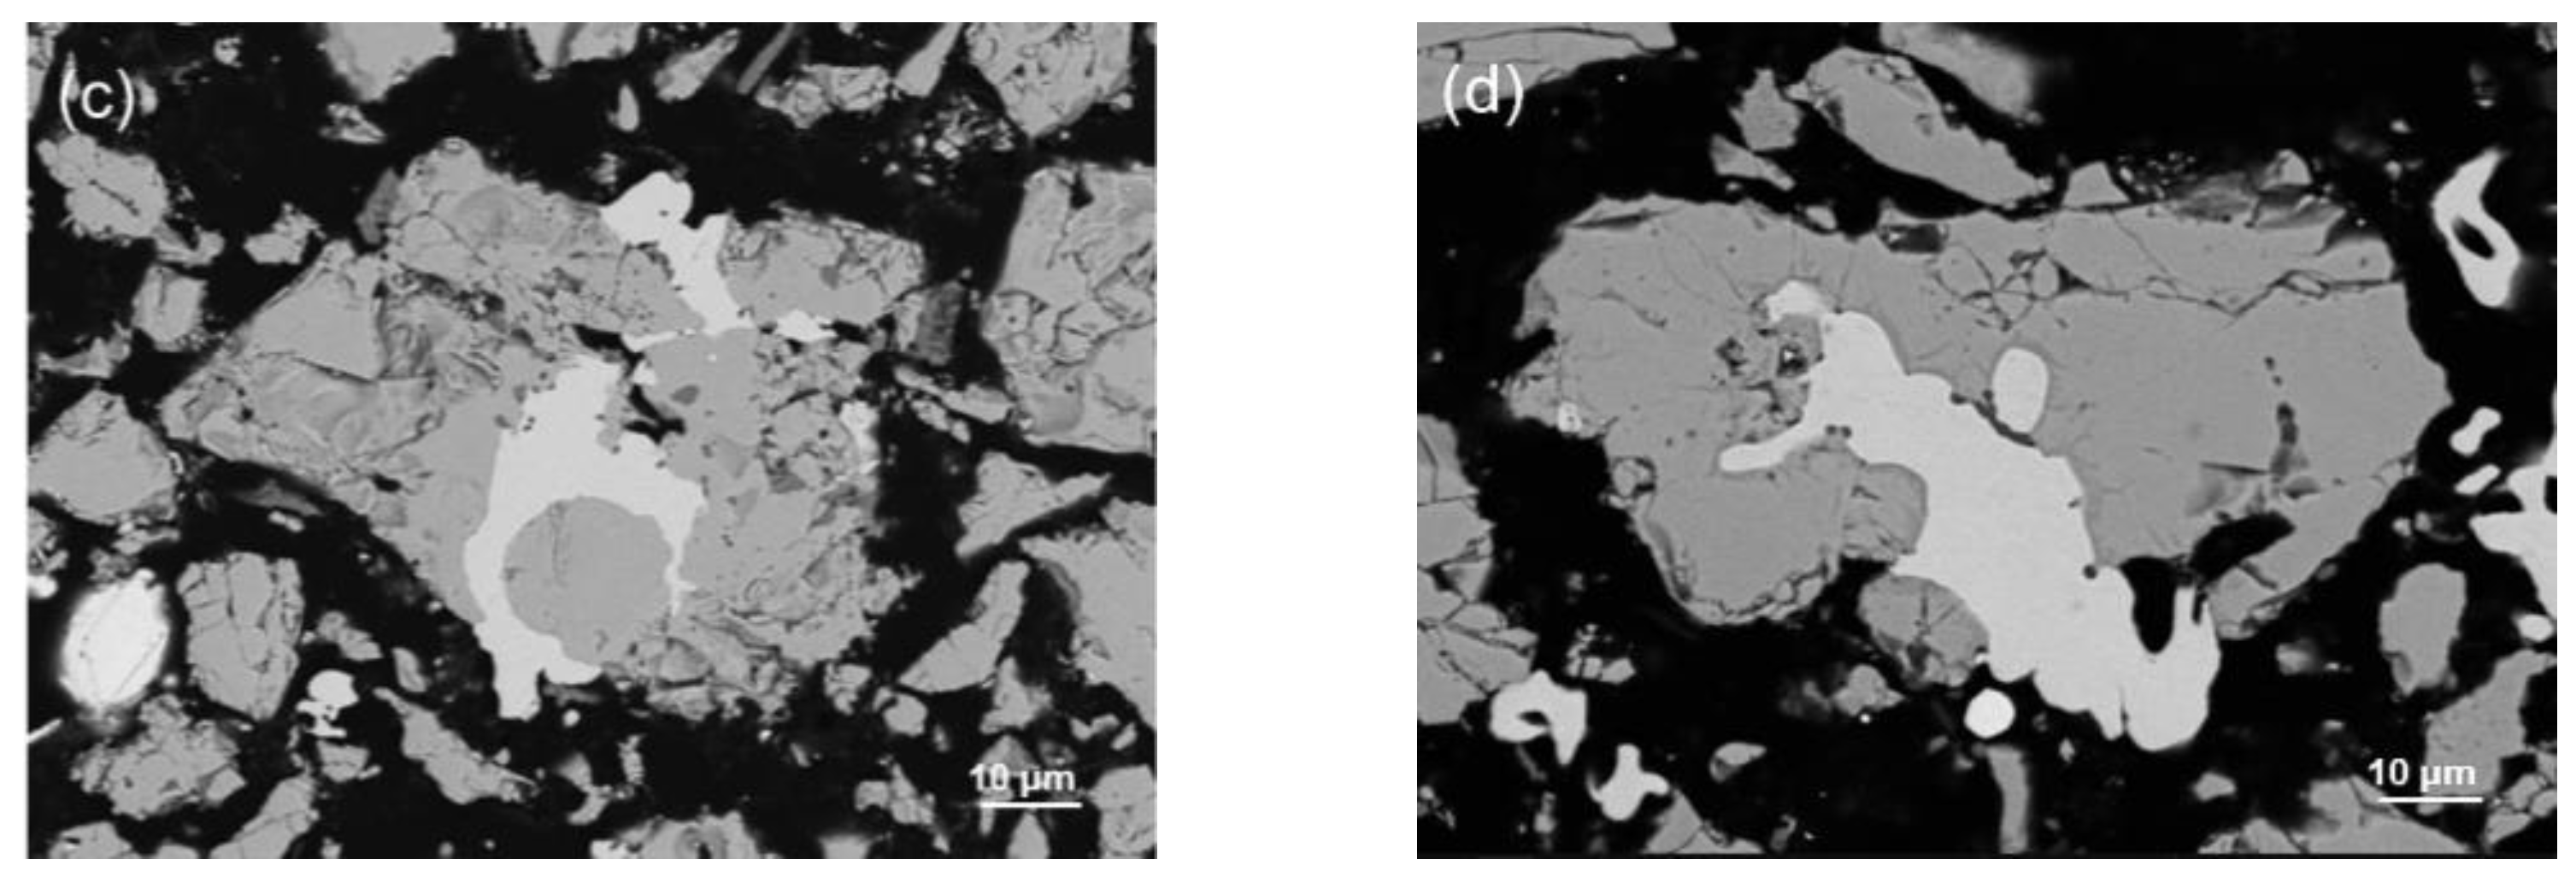
The micromorphology and structure after reduction under microwave irradiation are shown in Figure 5, Figure 6 and Figure 7. Figure 5 presents the SEM-energy-dispersive X-ray spectroscopy (EDS) images and compositional data of key points of magnetite reduced at 1000 °C in 60% CO-Ar at different times by microwave irradiation. The atomic ratio O/Fe at Points 1 and 4 is 1:1; hence, the region corresponding to these points can be considered as FeO. The region corresponding to Point 2 exhibits an O/Fe atomic ratio of 4:3, which is attributed to Fe3O4. Finally, Point 3 indicates the presence of Fe (99.01 at. %).
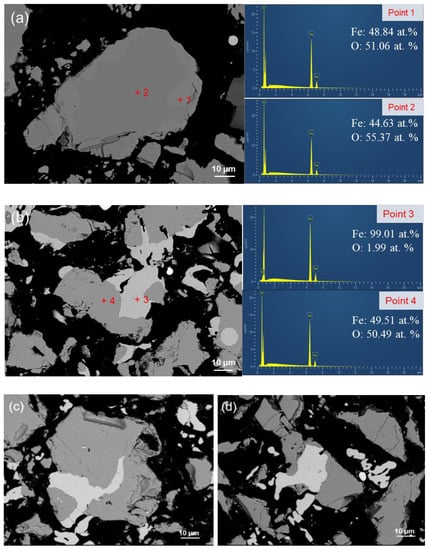
Figure 5.
Cross-sectional SEM-EDS images of reduced magnetite particles obtained via microwave irradiation at various time intervals: (a) 10, (b) 20, (c) 30, and (d) 40 min.
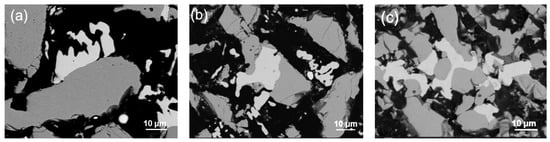
Figure 6.
SEM images of the reduction at 40 min in a 60% CO-Ar atmosphere, at temperatures of (a) 900 °C; (b) 1000 °C; (c) 1100 °C.
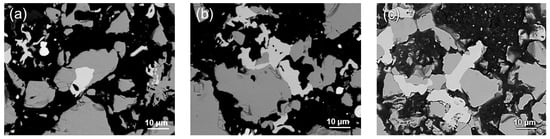
Figure 7.
SEM images of the reduction at 40 min and 1000 °C, under reduction atmospheres of (a) 30%; (b) 40%; (c) 60% CO-Ar.
Figure 5a,b present the results of magnetite reduction via microwave irradiation at 10 min; here, the sample is taken from the top 1/3 of the material layer. The interior of the particles is composed of unreacted dense Fe3O4 (Point 2), and the exterior is composed of FeO (Point 1). The thickness of the FeO layer varies greatly at different particle positions, indicating that the reduction process of Fe3O4 → FeO is not a uniform process to the center of the particles. Figure 4a shows that the Fe3O4 phase is more compact, but some microcracks are generated at the edge position (Point α in Figure 5a). Some of the crack positions are restored (Point β in Figure 5a). Some microcracks develop into large cracks (Point γ in Figure 5a), and particle disintegration even occurs (Point δ in Figure 5a). This phenomenon shows that some cracks are produced before the iron phase. This may be related to the reverse temperature distribution during microwave irradiation (the relative high temperature inside the particles and the relative low temperature outside the particles). After 20 min progression of the reaction, the formation and aggregation of the dense metal iron phase was primarily concentrated within the particle cracks and certain segments of the outer surface. Crystallization occurring within a crack extends the crack into a fissure, leading the iron crystals to develop into strips as they traverse the gap between particles. This transformation ultimately results in the fragmentation of the particles into two distinct parts. However, these two parts isolated by the iron phase will not be further fragmented due to the bonding of the intermediate iron phase. By contrast, the selective reduction and crystallization of some areas on the outer surface should be affected by local CO partial pressure conditions and CO selective adsorption. Figure 5c,d shows the microstructure at 30 and 40 min of reduction, respectively, with the samples taken from the middle 1/3 and lower 1/3 of the material layer in the crucible, respectively. The figure shows that the iron phase produced by reduction mainly exists at the crack, and the reduction crystallization on the surface of the particles decreases. Compared with Figure 5b, the reduction process differs from the surface layer to the bottom layer inside the crucible, due to the deterioration of CO diffusion conditions. The upper region experiences a higher degree of reduction.
Figure 6 shows the cross-sectional morphology of magnetite particles reduced by 60% CO-Ar under a microwave field at different temperatures. Figure 7 shows the morphology of magnetite reduced by a microwave field at 1000 °C under different CO partial pressures. It can be seen that even under different conditions, the metal iron phase produced by reduction is dense and has no obvious porous structure. Higher temperature and higher CO partial pressure can obtain a higher metallization degree.
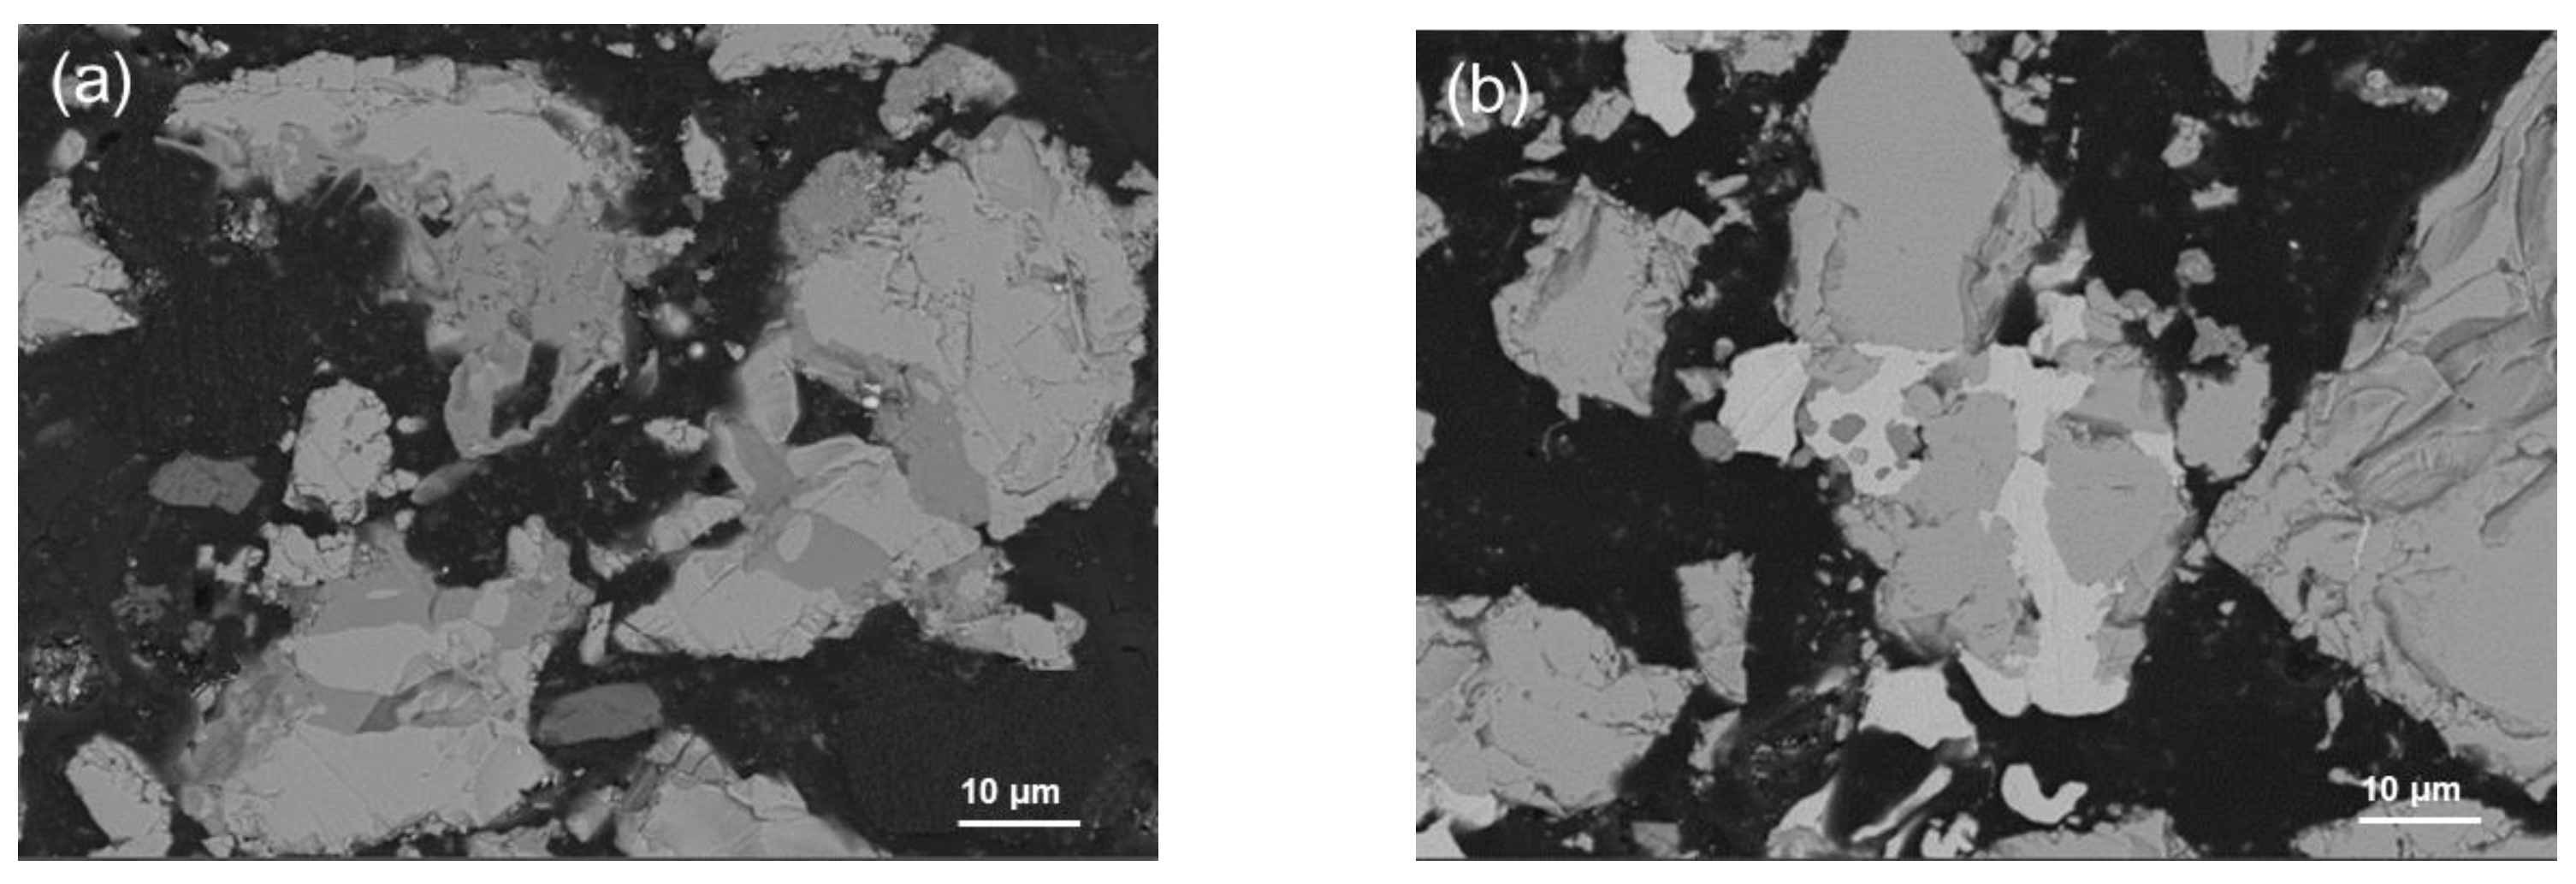
SEM images of the reduced samples at different time intervals, under conventional heating at 1000 °C and a reduction atmosphere of 60% CO-Ar, are shown in Figure 8. Metal iron forms under the conventional field at a significantly later stage than under the microwave field. The reduction process produces a large number of microcracks inside the unreduced matrix, resulting in the destruction of the original dense continuous structure. The iron phase is primarily formed at and infiltrated into the internal cracks in the particles, and there is no obvious iron phase on the outer surface of the particles. Therefore, under conventional heating at a higher reduction temperature, the unreduced phase undergoes sintering. By contrast, when under microwave irradiation, the sintering of the unreduced phase manifests as bridging and adhesion between iron phases. Microwave irradiation can effectively improve the phenomenon of mineral sintering. The expansion of the material bed is obvious in the reduction process under the microwave field, whereas its expansion is relatively small after conventional field reduction. The expansion phenomenon diminishes with the increase in temperature. Material-bed expansion provides a channel for gas diffusion and accelerates the reduction reaction.


Figure 8.
Cross-sectional SEM images of reduced magnetite particles obtained via conventional heating at various time intervals: (a) 10, (b) 20, (c) 30, and (d) 40 min.
There are generally three types of iron crystals produced by reduction [14,15]: dense punctate or layered, porous, and whisker fibrous. When the reduction potential of the reducing atmosphere is high, iron crystals are primarily precipitated in the first form. Therefore, the hydrogen-reduction iron-ore powder is generally porous [16]. In the process of CO fluidization reduction, iron whiskers are easily produced. Investigations [17] indicated that three distinct final product morphologies can be obtained on the reduction of wustite in CO/CO2 or H2/H2O gas mixtures: porous iron, porous wustite covered with dense iron, and dense wustite covered with dense iron. Matthew [18] reports that the porous structure is mainly controlled by atmospheric conditions and temperature. With the increase of the CO/CO2 or H2/CO partial-pressure ratio, the iron phase morphology of the product develops from dense to bursting and then to honeycomb porous. Heating is beneficial for the formation of porous structures. At lower proportions of CO2 or H2O, however, despite the initial formation of a dense iron layer, the final structure comprises a porous iron morphology.
Under the conditions of this experiment, the iron crystals form dense bands across various time intervals, temperature levels, and CO partial pressures. The initial particles do not coat the outer surface, and there is no obvious porous structure under high CO partial pressure. Instead, they are selectively reduced and crystallized from the newly formed microcracks and gradually expanded along the normal direction of the ore powder length. Their in-depth growth forms a strip of iron crystal that penetrates the ore powder and expands outward width-ways as a result of the combined action of CO adsorption orientation [19] and mineral microdefects. This study shows that the prerequisite for the generation of porous structures is that the reduction takes places under a non-diffusion-limiting mechanism.
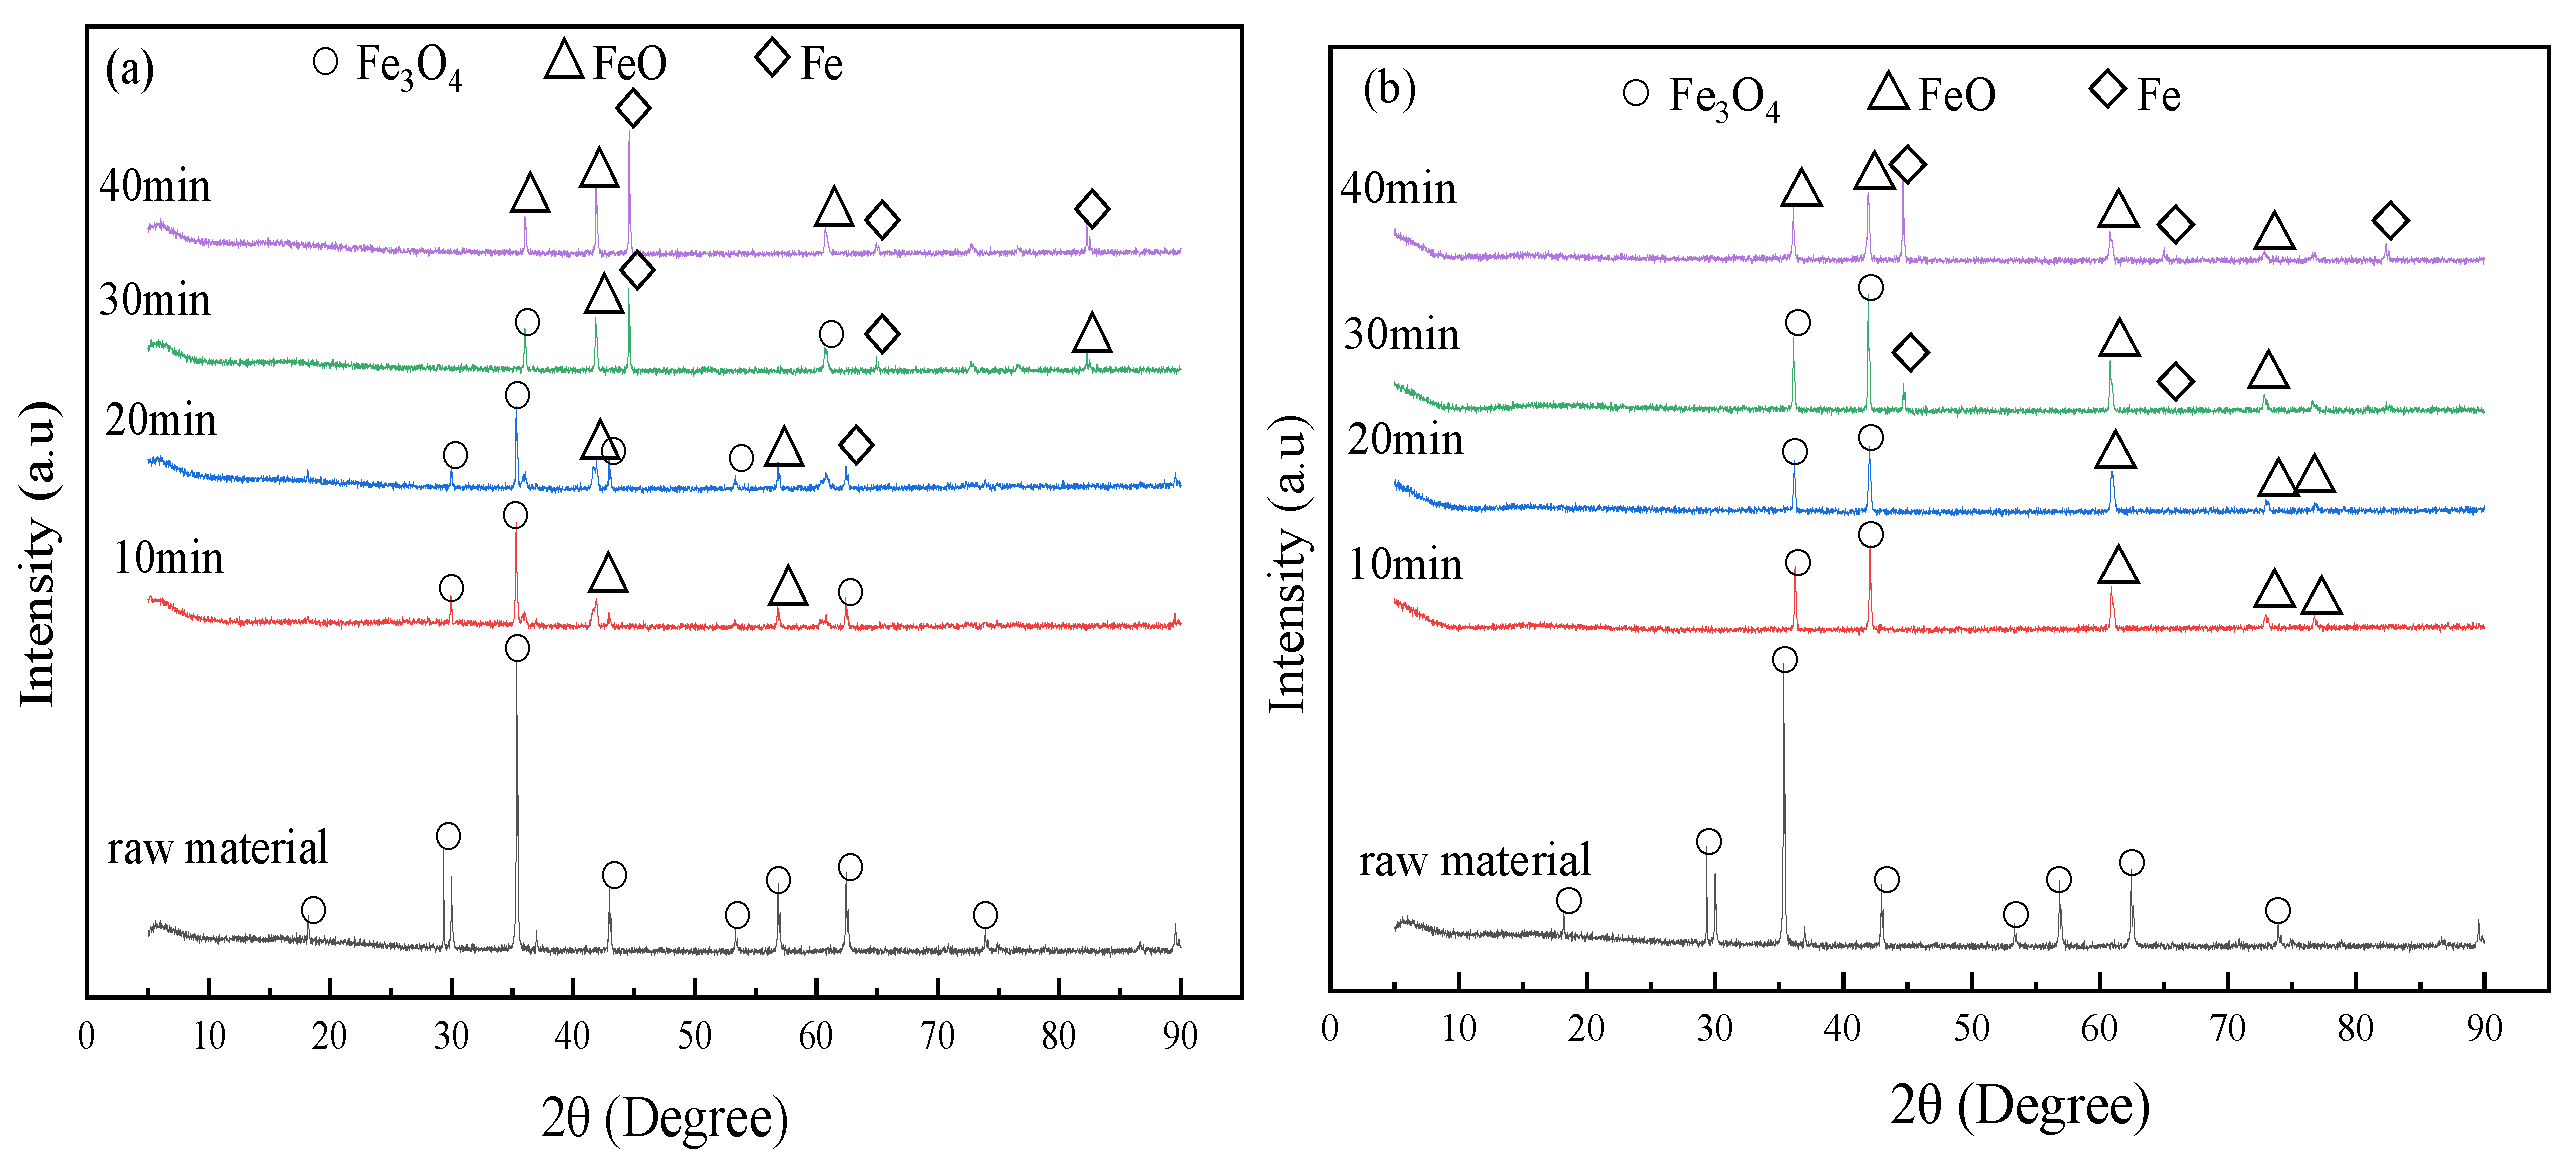
Figure 9 depicts the XRD patterns of reduced magnetite obtained using the microwave and conventional heating methods under a 60% CO-Ar atmosphere at 1000 °C. From the XRD analysis, the phase transition of magnetite during the reduction process was determined. Overall, in both heating methods, the diffraction peak of Fe3O4 steadily diminished, whereas the diffraction peak of Fe gradually increased. Under microwave irradiation, the FeO diffraction peak appeared after 10 min, the Fe peak appeared after 20 min, and the Fe3O4 diffraction peak completely disappeared after 40 min. Under conventional heating, the FeO diffraction peak appeared after 10 min, the Fe peak appeared after 30 min, and the Fe3O4 peak was still present after 40 min. The two reduction processes (CO reduction of Fe3O4 to FexO, and FexO reduction to Fe) intersect. Owing to the high potential for CO reduction in the near-surface region of the ore powder, iron is produced before reduction completely eliminates the Fe3O4. The reduction of Fe3O4 by H2 is divided into two independent processes: Fe3O4→FexO, and FexO→Fe [20].
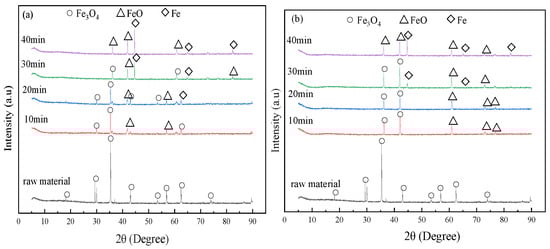
Figure 9.
XRD diffraction patterns of reduced magnetite after (a) microwave and (b) conventional heating recorded at various time intervals (10, 20, 30, and 40 min).
3.3. Micro Kinetics
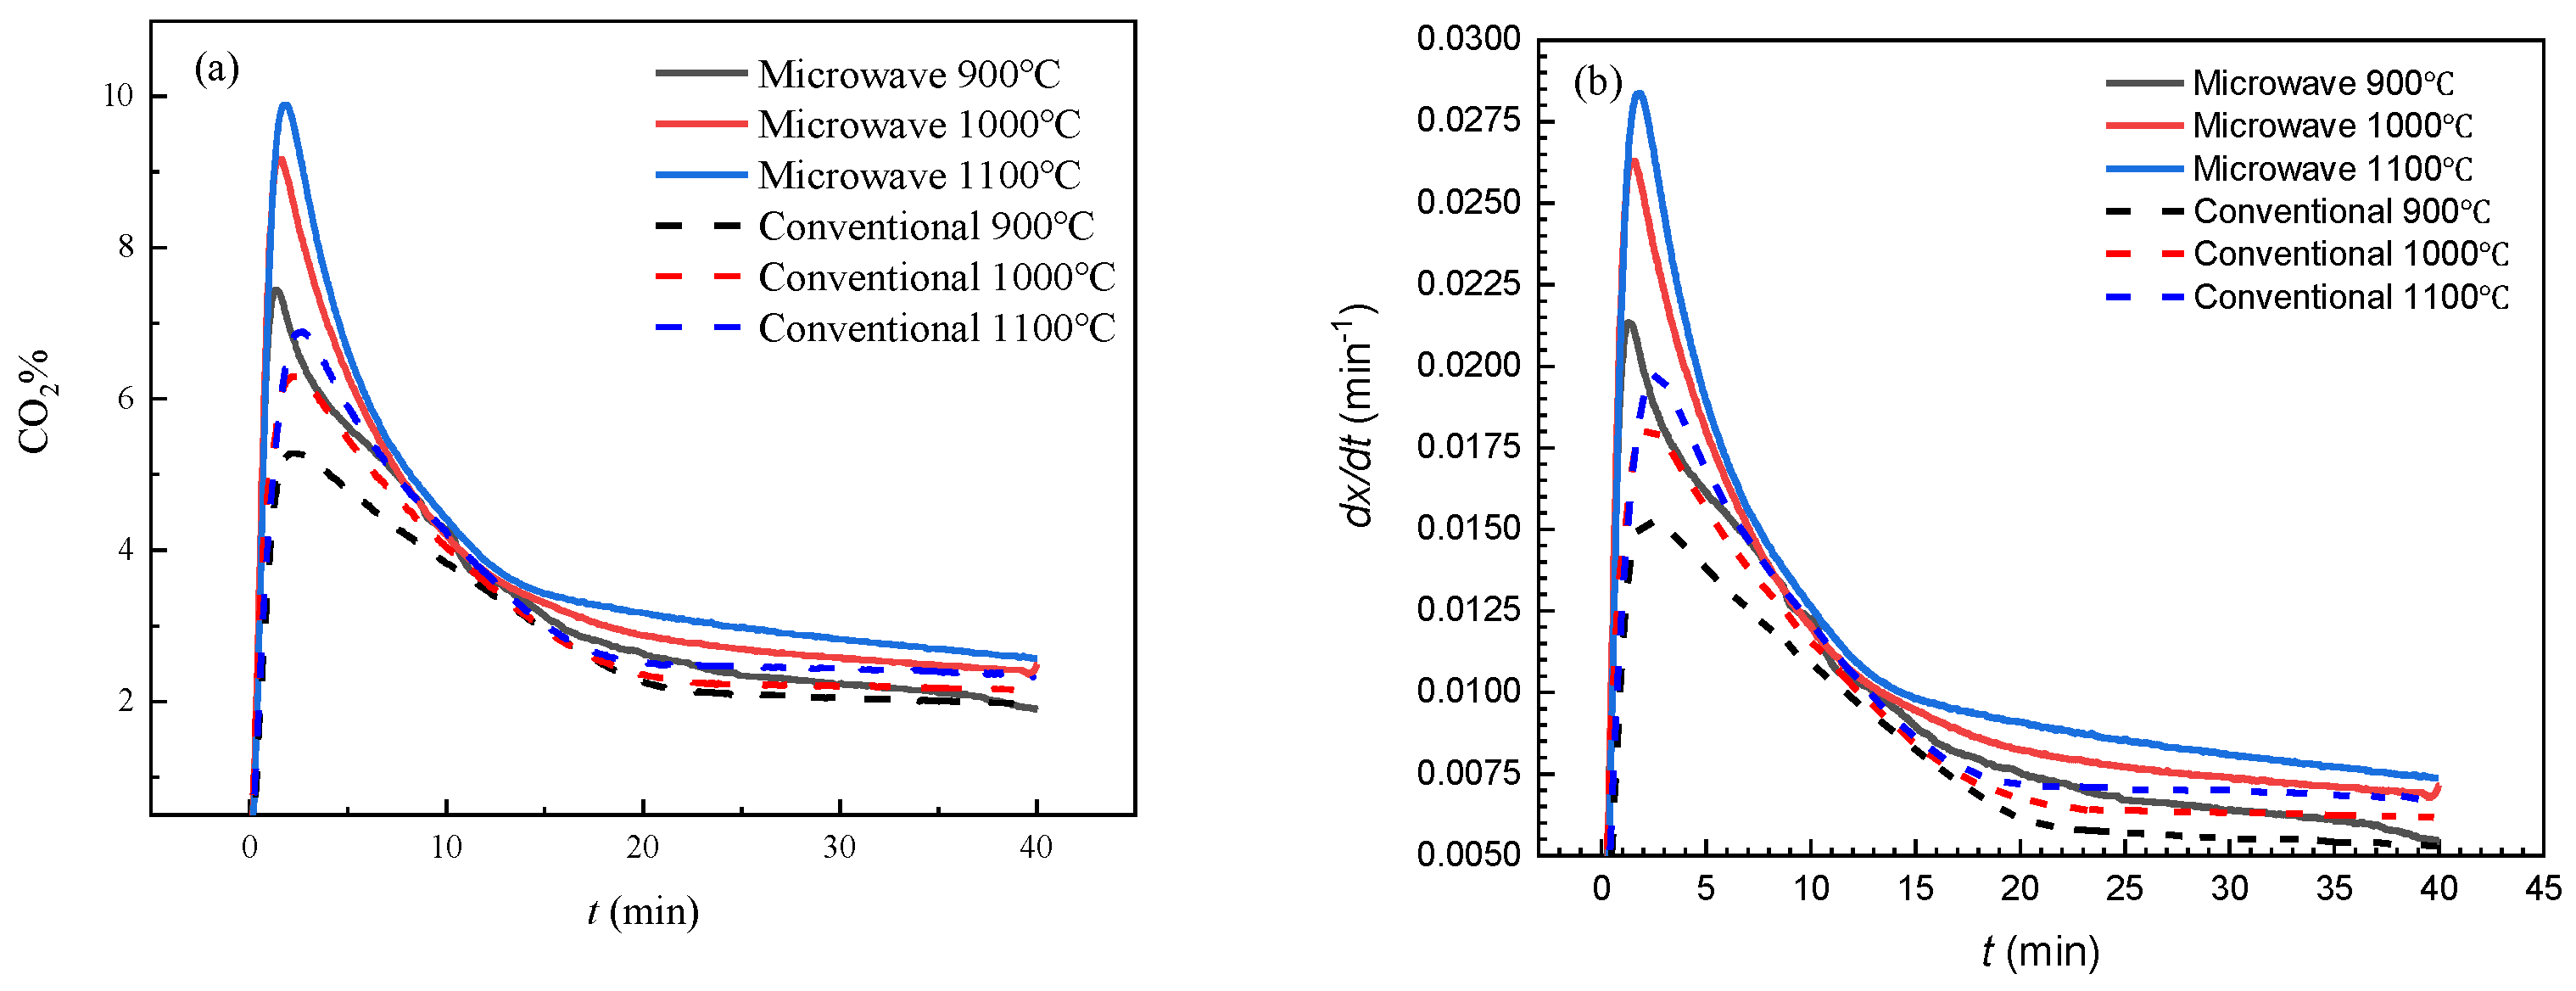
Detailed analysis of the microstructure of the reaction products shows that the iron crystals formed under the experimental conditions are dense punctate. However, porous iron crystals are formed during reduction under many other process conditions. Due to the change in material structure and mass transfer conditions in the reduction process, the rate-limiting steps will vary across different stages, thus undergoing different mechanisms of reduction. Therefore, it is necessary to conduct a kinetic analysis of the magnetite reduction process. Notably, understanding the rate-determining steps in complex metallurgical reactions is highly significant in the field of metallurgical dynamics theory, as well as in reactor design for practical industrial applications. For reactors in actual production, complex metallurgical reactions are involved. Figure 10a presents variation curves of CO2 formation with time when magnetite is reduced under a 60% CO-Ar environment at 900–1100 °C. The experimental data were obtained using an online infrared gas analyzer, as previously described. The change in reaction rate with time was calculated in accordance with the change in CO2 % generated by the reduction reaction (Figure 10b).
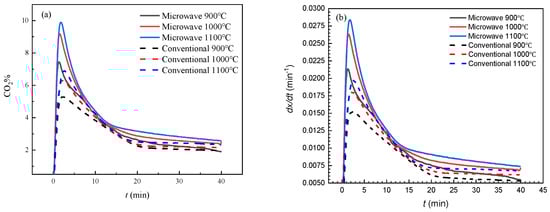
Figure 10.
(a) Variation in the percentage of CO2 generation from magnetite reduction via microwave and conventional heating. (b) The reduction ratio of microwave irradiation and conventional heating changes with time.
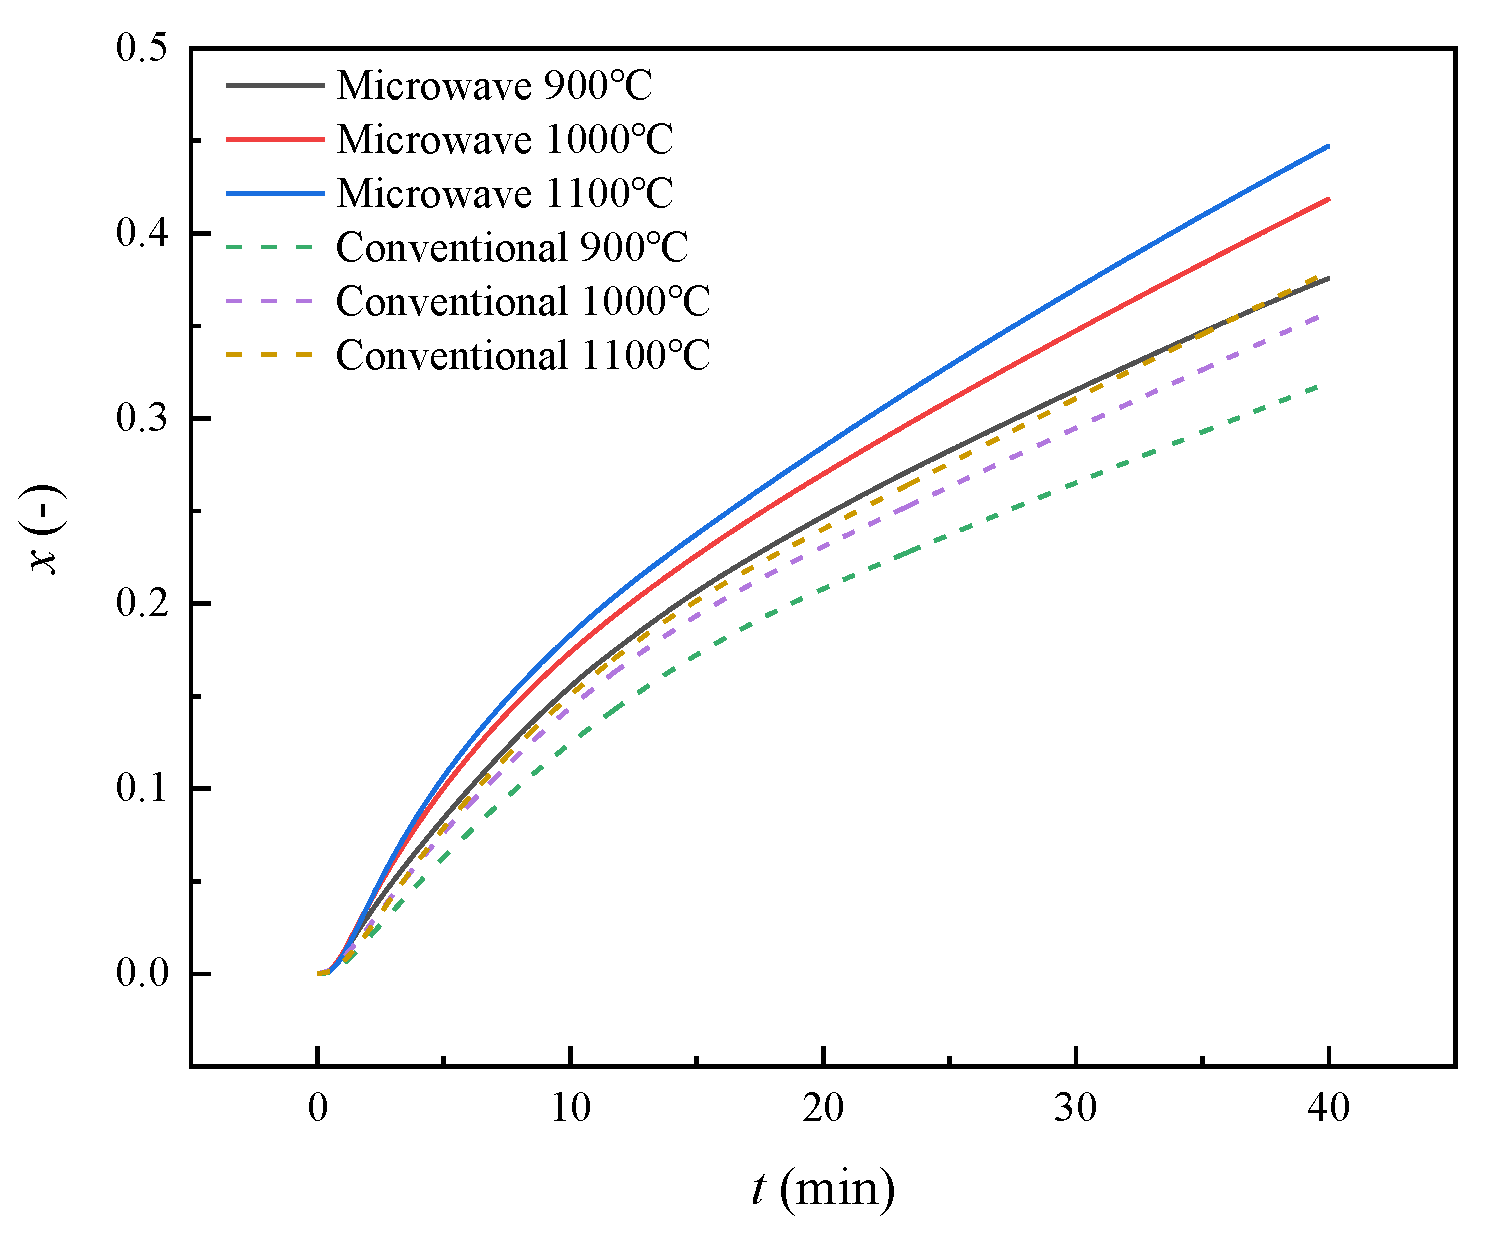
Figure 11 presents the reduction degree of the magnetite sample reduced at various temperatures (900, 1000, and 1100 °C) for 40 min using microwave and conventional heating. The slope of the curve represents the reduction reaction ratio, which increases with increasing reduction time.
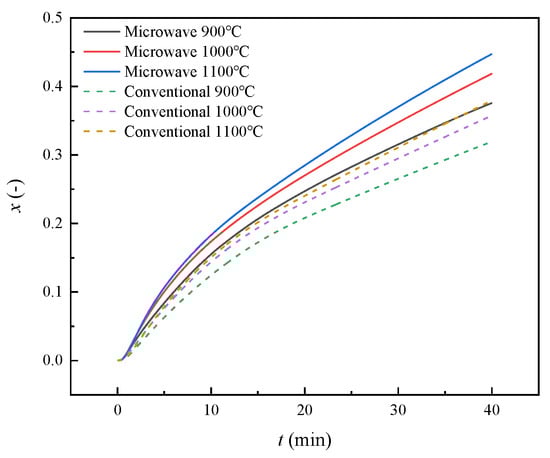
Figure 11.
Variation in reduction ratio with time for microwave and conventional heating.
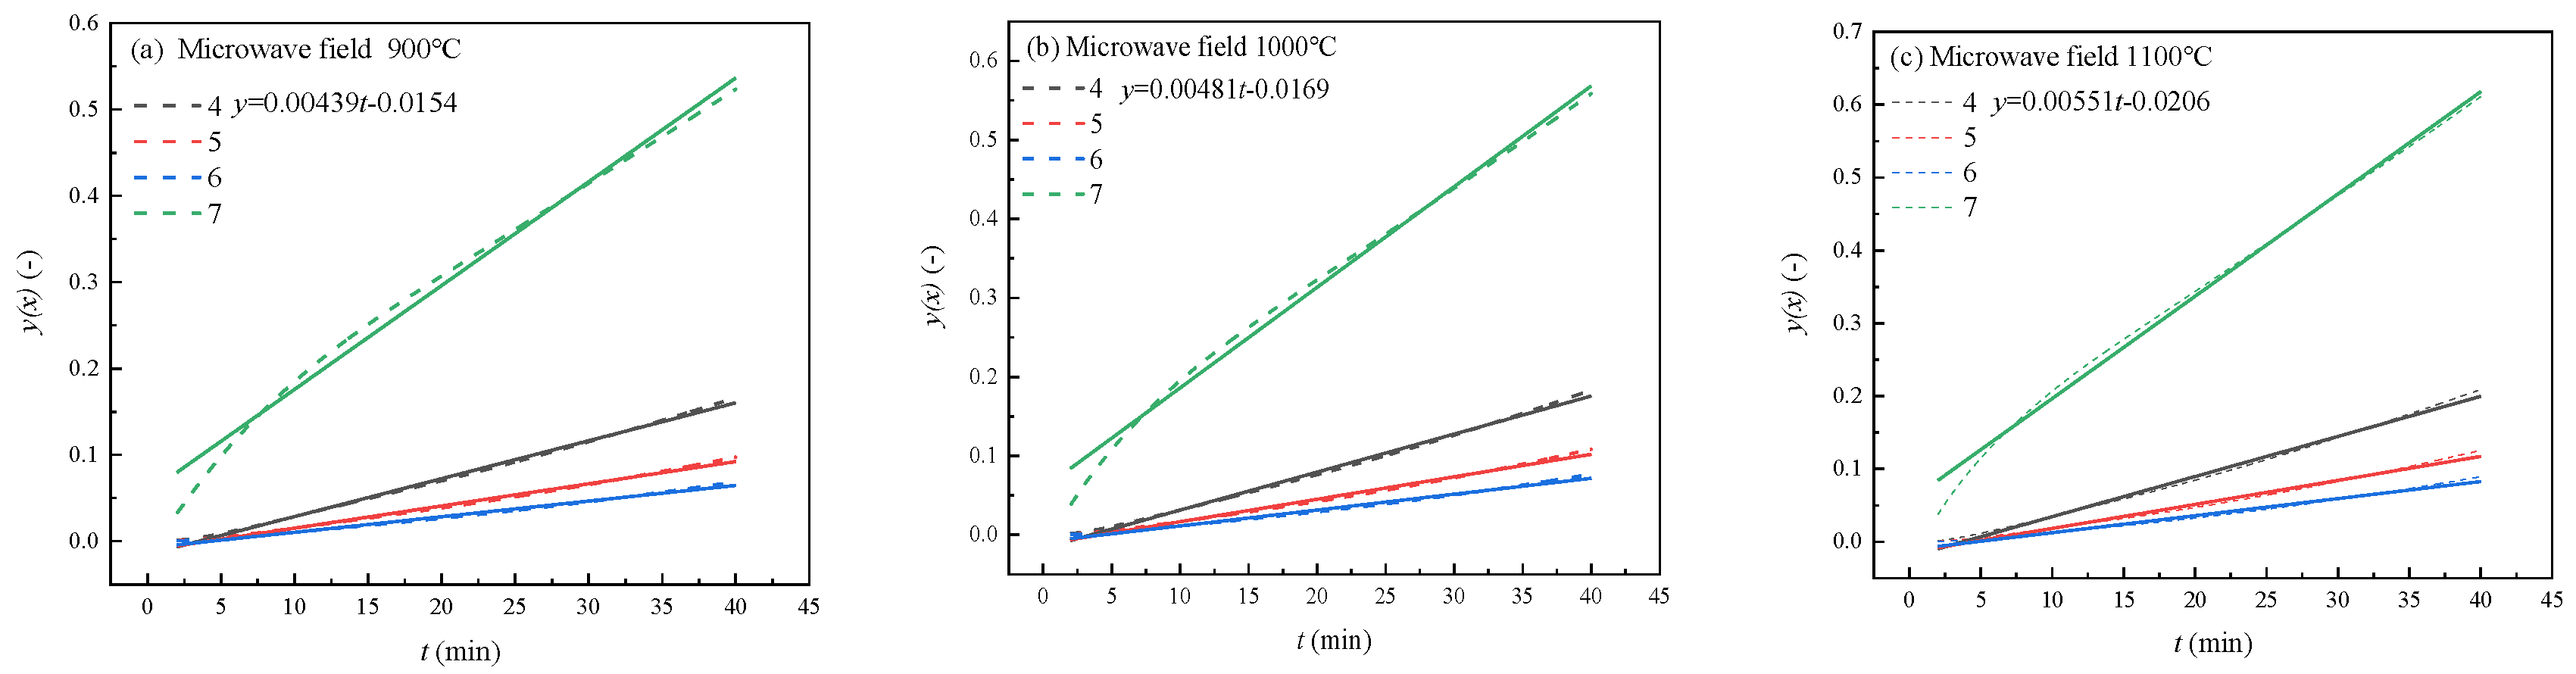
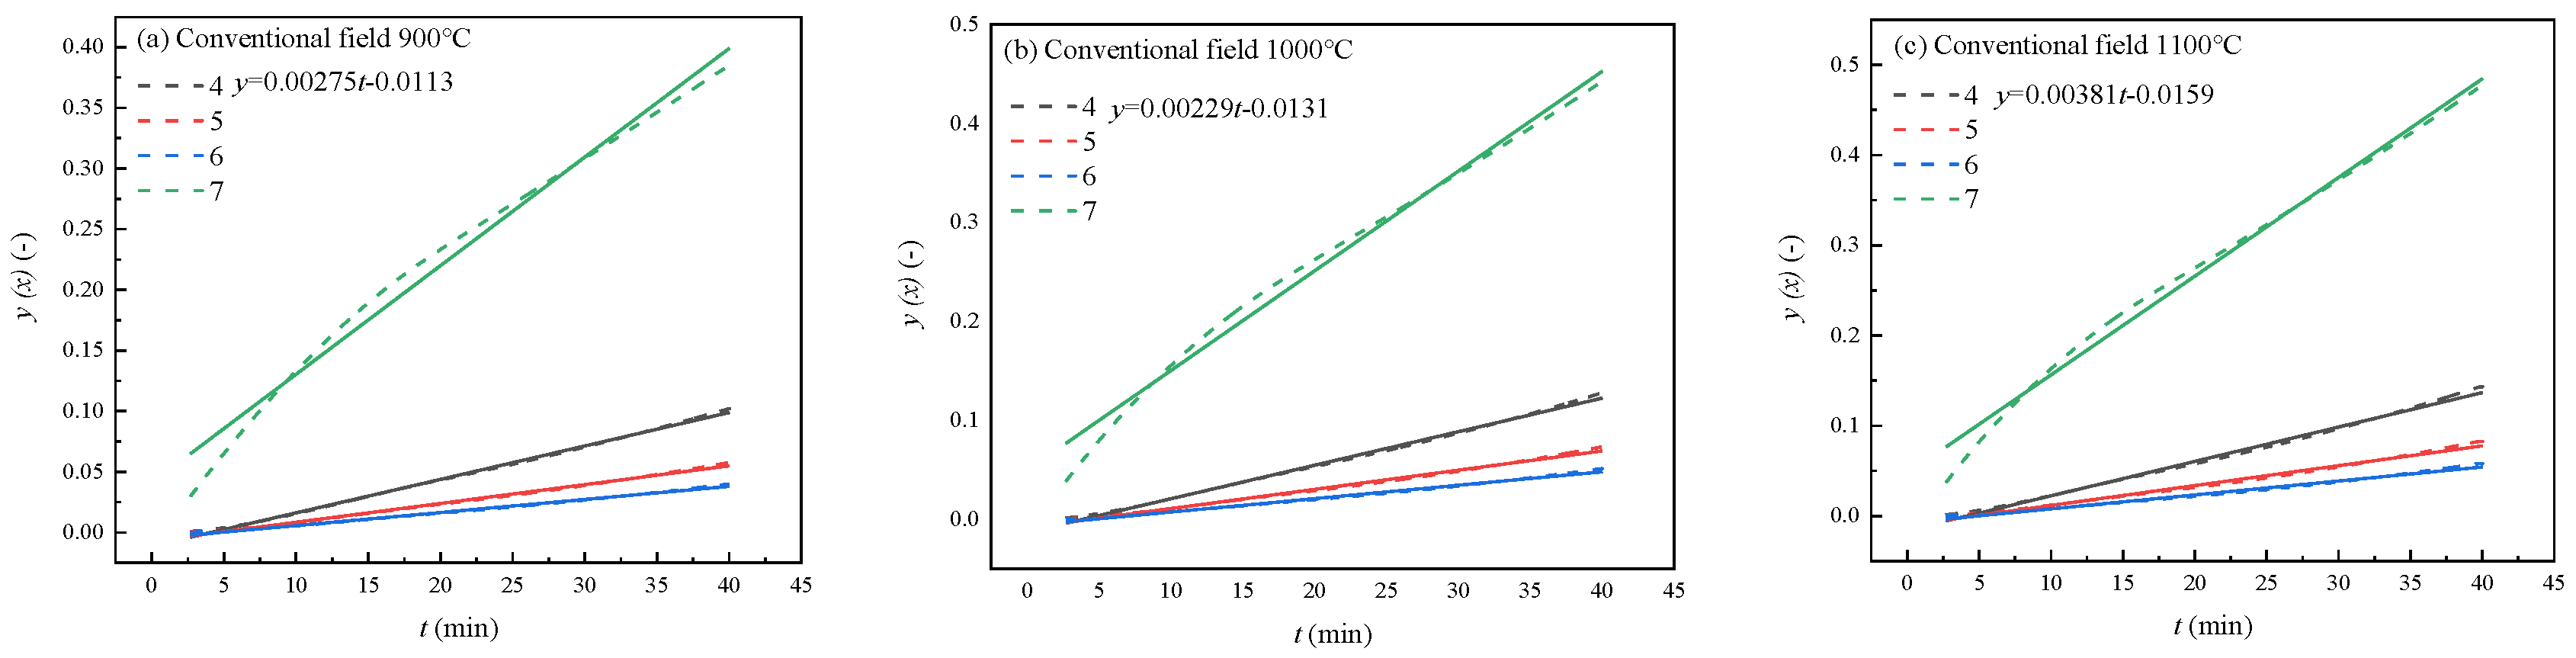
A model-fitting method can be used to determine the rate control step of the reduction process [21,22,23]. The obtained reaction kinetics can be fitted with the gas–solid reaction models in Table 1. The corresponding expressions y(x) are given on the left-hand sides of the equations in Table 1. If the expression y(x) fits the experimental data well throughout the reaction process, plotting it under constant temperature conditions yields a straight line with a slope k (rate constant). Therefore, fitting the data at different temperatures by analyzing y(x) against time (t) produces a series of rate constant values. Table 2 and Table 3 display the average values of the coefficient of determination (R2) corresponding to different y(x) function lines for the microwave and conventional heating processes, respectively. Figure 12 and Figure 13 present the fitted curves of CO-reduced magnetite under microwave and conventional heating, respectively. When the reduction reaction gas flow begins, the CO concentration in the reaction gas rapidly increases from zero to the target concentration in the gas flow. Therefore, this time period is excluded from the study, and the kinetic analysis of microwave and conventional heating begins at 2 min and 2.7 min, respectively.

Table 1.
Gas–solid reaction models.
Table 2.
Correlation coefficients of y(x) at different temperatures under microwave irradiation.
Table 3.
Correlation coefficients of y(x) at different temperatures under conventional heating.
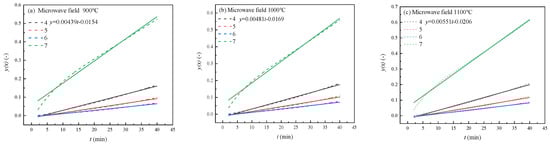
Figure 12.
Fitted lines of the relationship between y(x) and t for CO reduction under microwave irradiation.
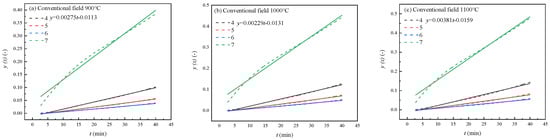
Figure 13.
Fitted lines of the relationship between y(x) and t for CO reduction under conventional heating.
From Table 2 and Table 3, under the microwave field, model 4 (diffusion control) has a higher fitting degree at 900 °C and 1000 °C. Models 7 and 4 (apparent first-order reaction and diffusion control, respectively) have a higher fitting degree at 1100 °C. Under the conventional field, model 4 (diffusion control) has a higher fitting degree at 900–1100 °C, and displays obvious one-dimensional characteristics. This shows that microwave irradiation does not significantly change the macroscopic restrictive step of magnetite powder reduction, but at a high temperature (1100 °C), a microwave field has a tendency to cause the apparent first-order reaction.
3.4. Microkinetics
The macroscopic kinetic analysis mentioned above, relying on the linear model, assumes that the restrictive steps of the reduction process remain constant. However, changes may occur to the restrictive steps of the reduction process due to changes in gas phase composition, mineral phase, and product structure. Therefore, it is necessary to study the microkinetic mechanism in the reduction process. In order to analyze the microscopic process kinetics of magnetite concentrate powder reduction, an approach combining the lnln method with the JMA (Johnson–Mehl–Avrami) model was used.
Based on the lnln method [21], the possible intervals of each limiting step are estimated, providing a reference for the fitting of segmentation and hybrid control.
According to the lnln method, the reduction mechanism model can be uniformly expressed as:
where x is the degree of reduction at time t (%), t is reaction time (s), k is the reduction rate, and m is the Avrami exponent.
Therefore:
Therefore:
The first term on the right of the above formula is the relative specific rate (the specific rate per unit mass of the remaining unreacted phase). The second term is reduced by the apparent first-order reaction.
Therefore:
where represent the converted rate constant and rate of the corresponding t and x, respectively, converted according to the apparent first-order reaction (random nucleation) model. The above formula shows that the actual reduction transient rate is m times the fitting rate of the first-order reaction (which can be physically understood as a multidimensional extension of the one-dimensional reaction).
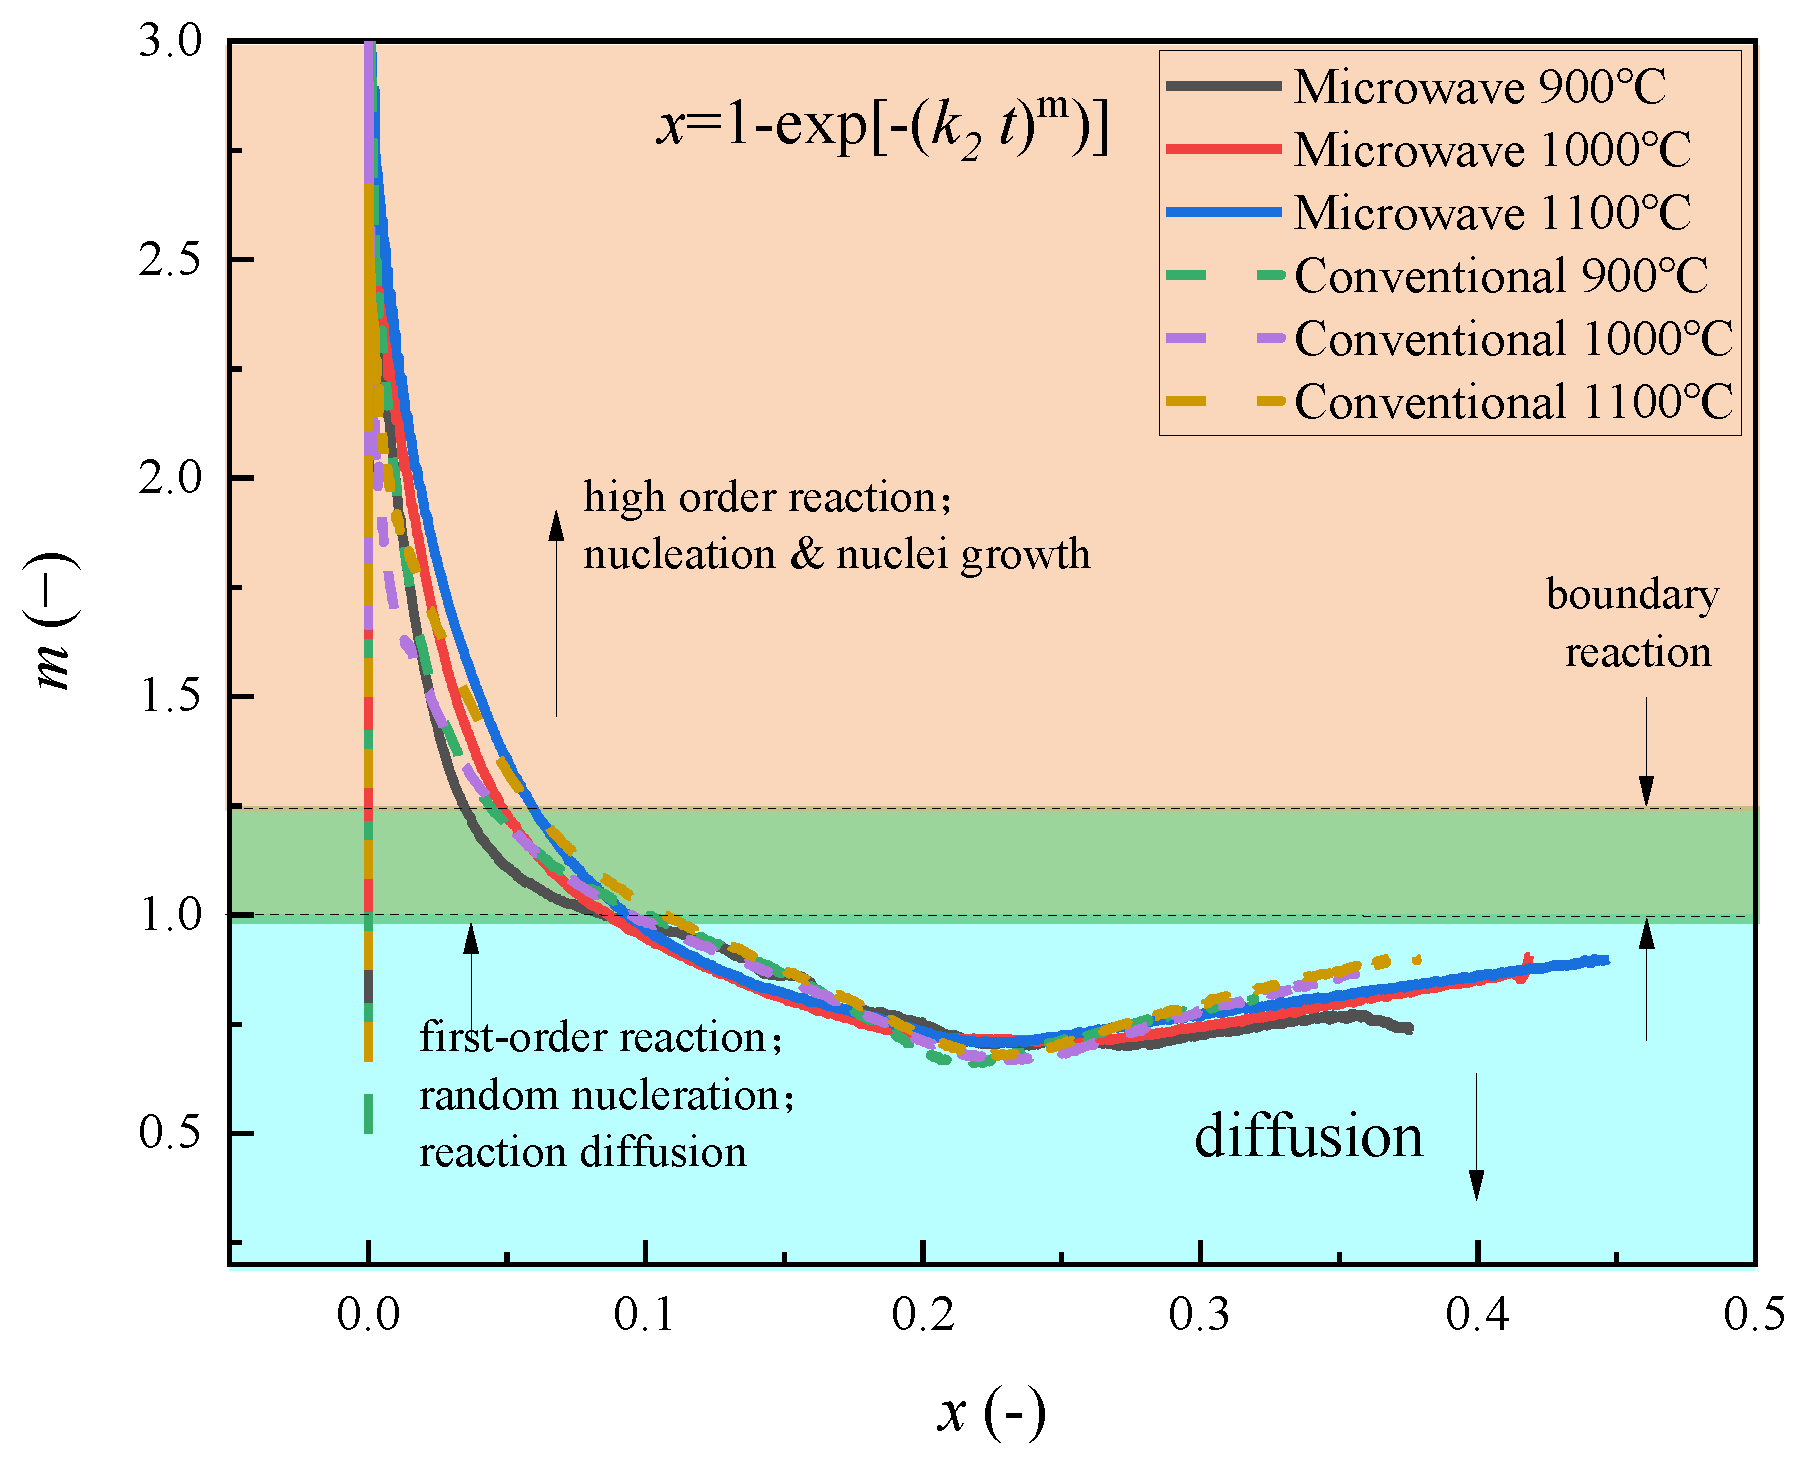
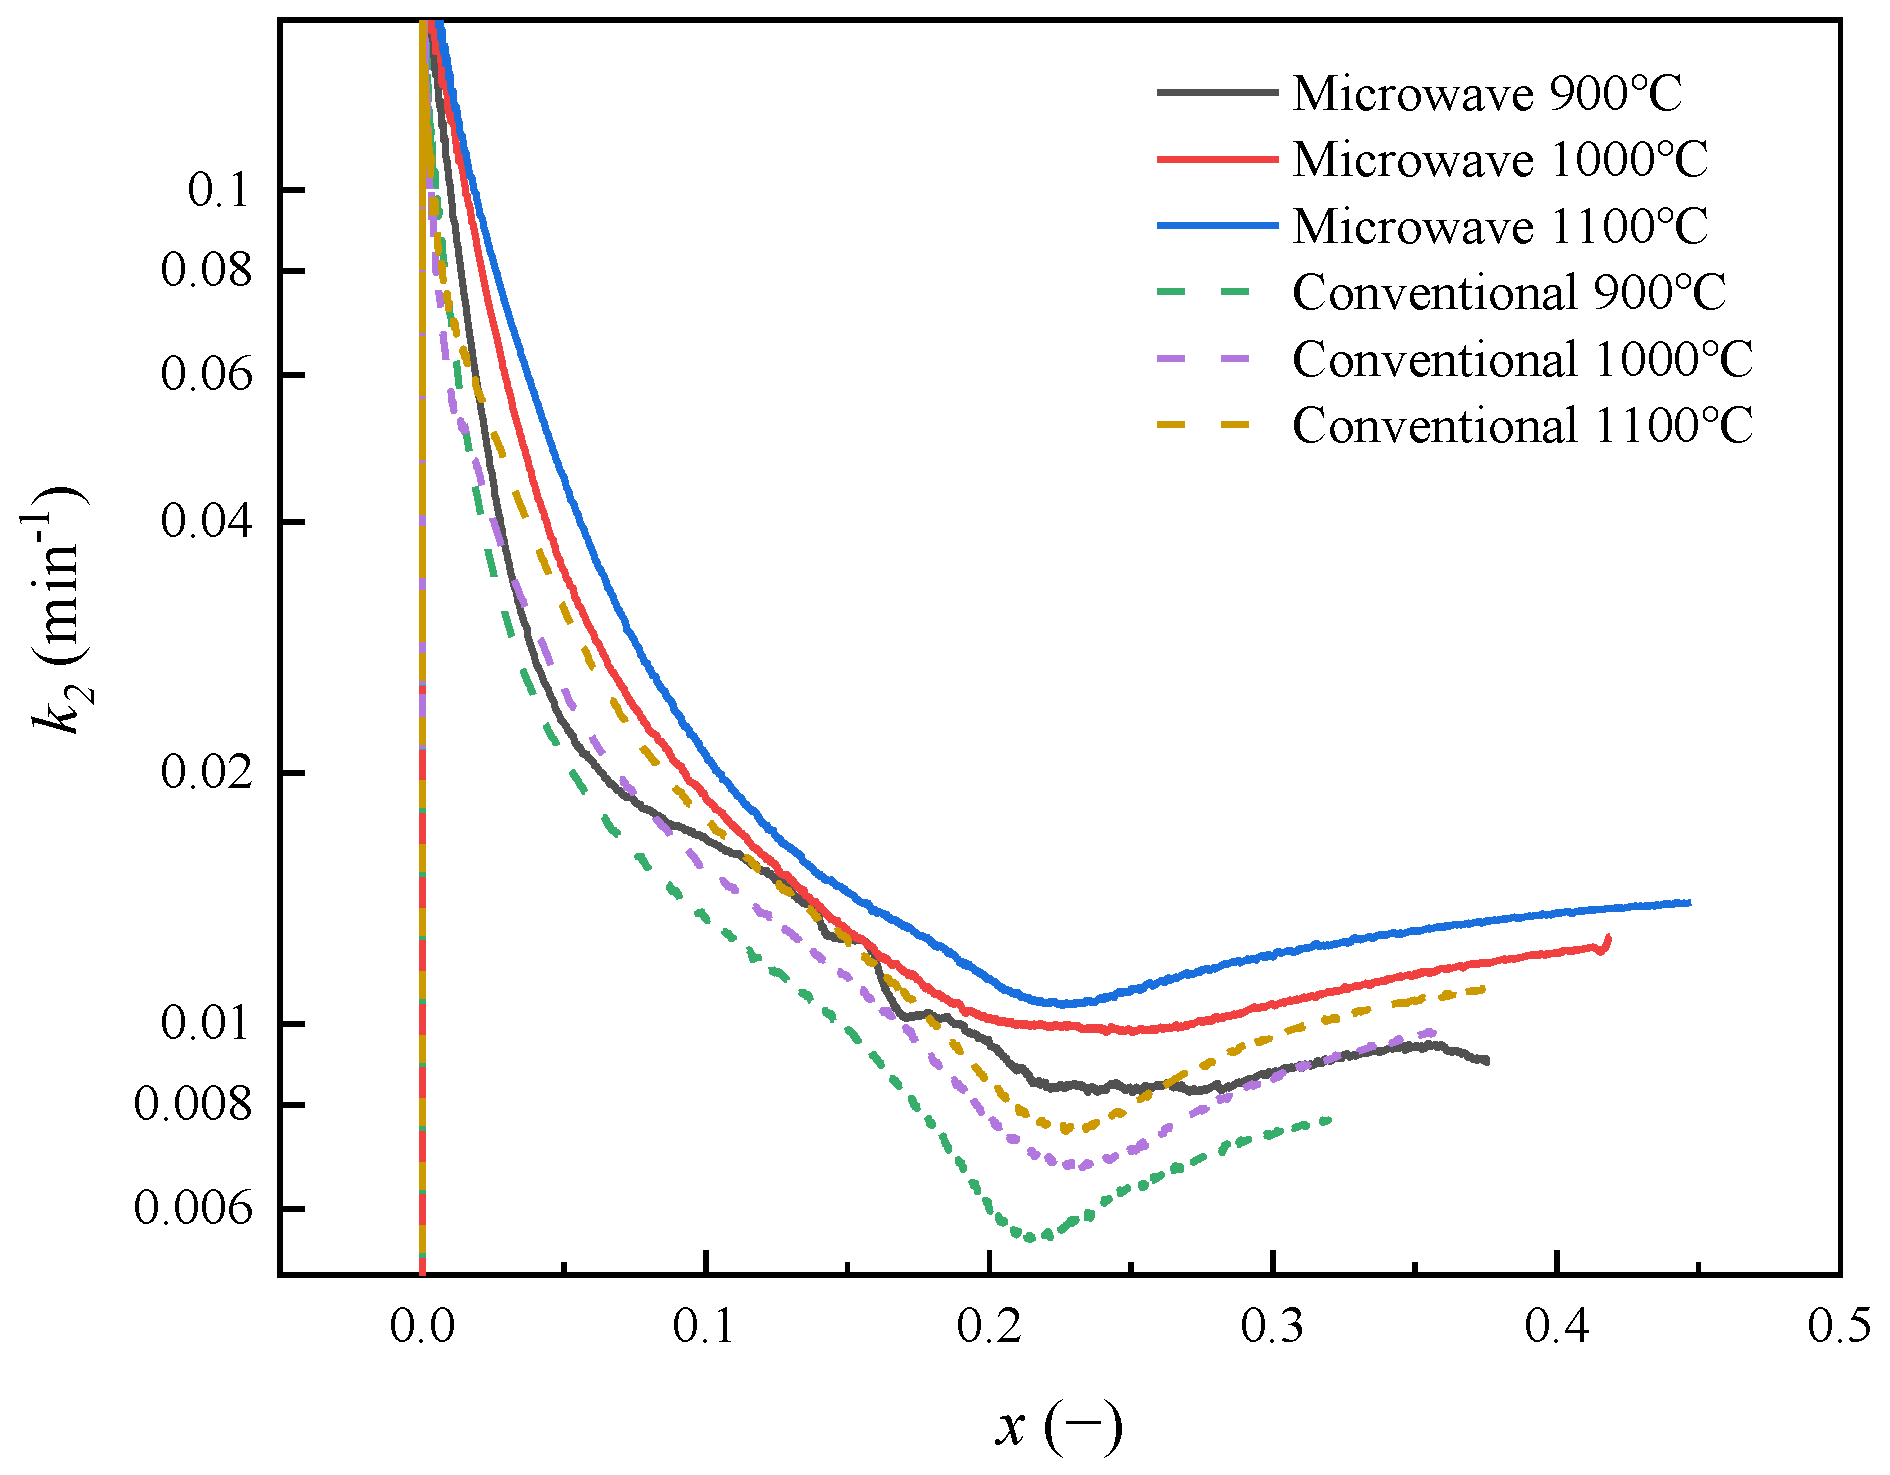
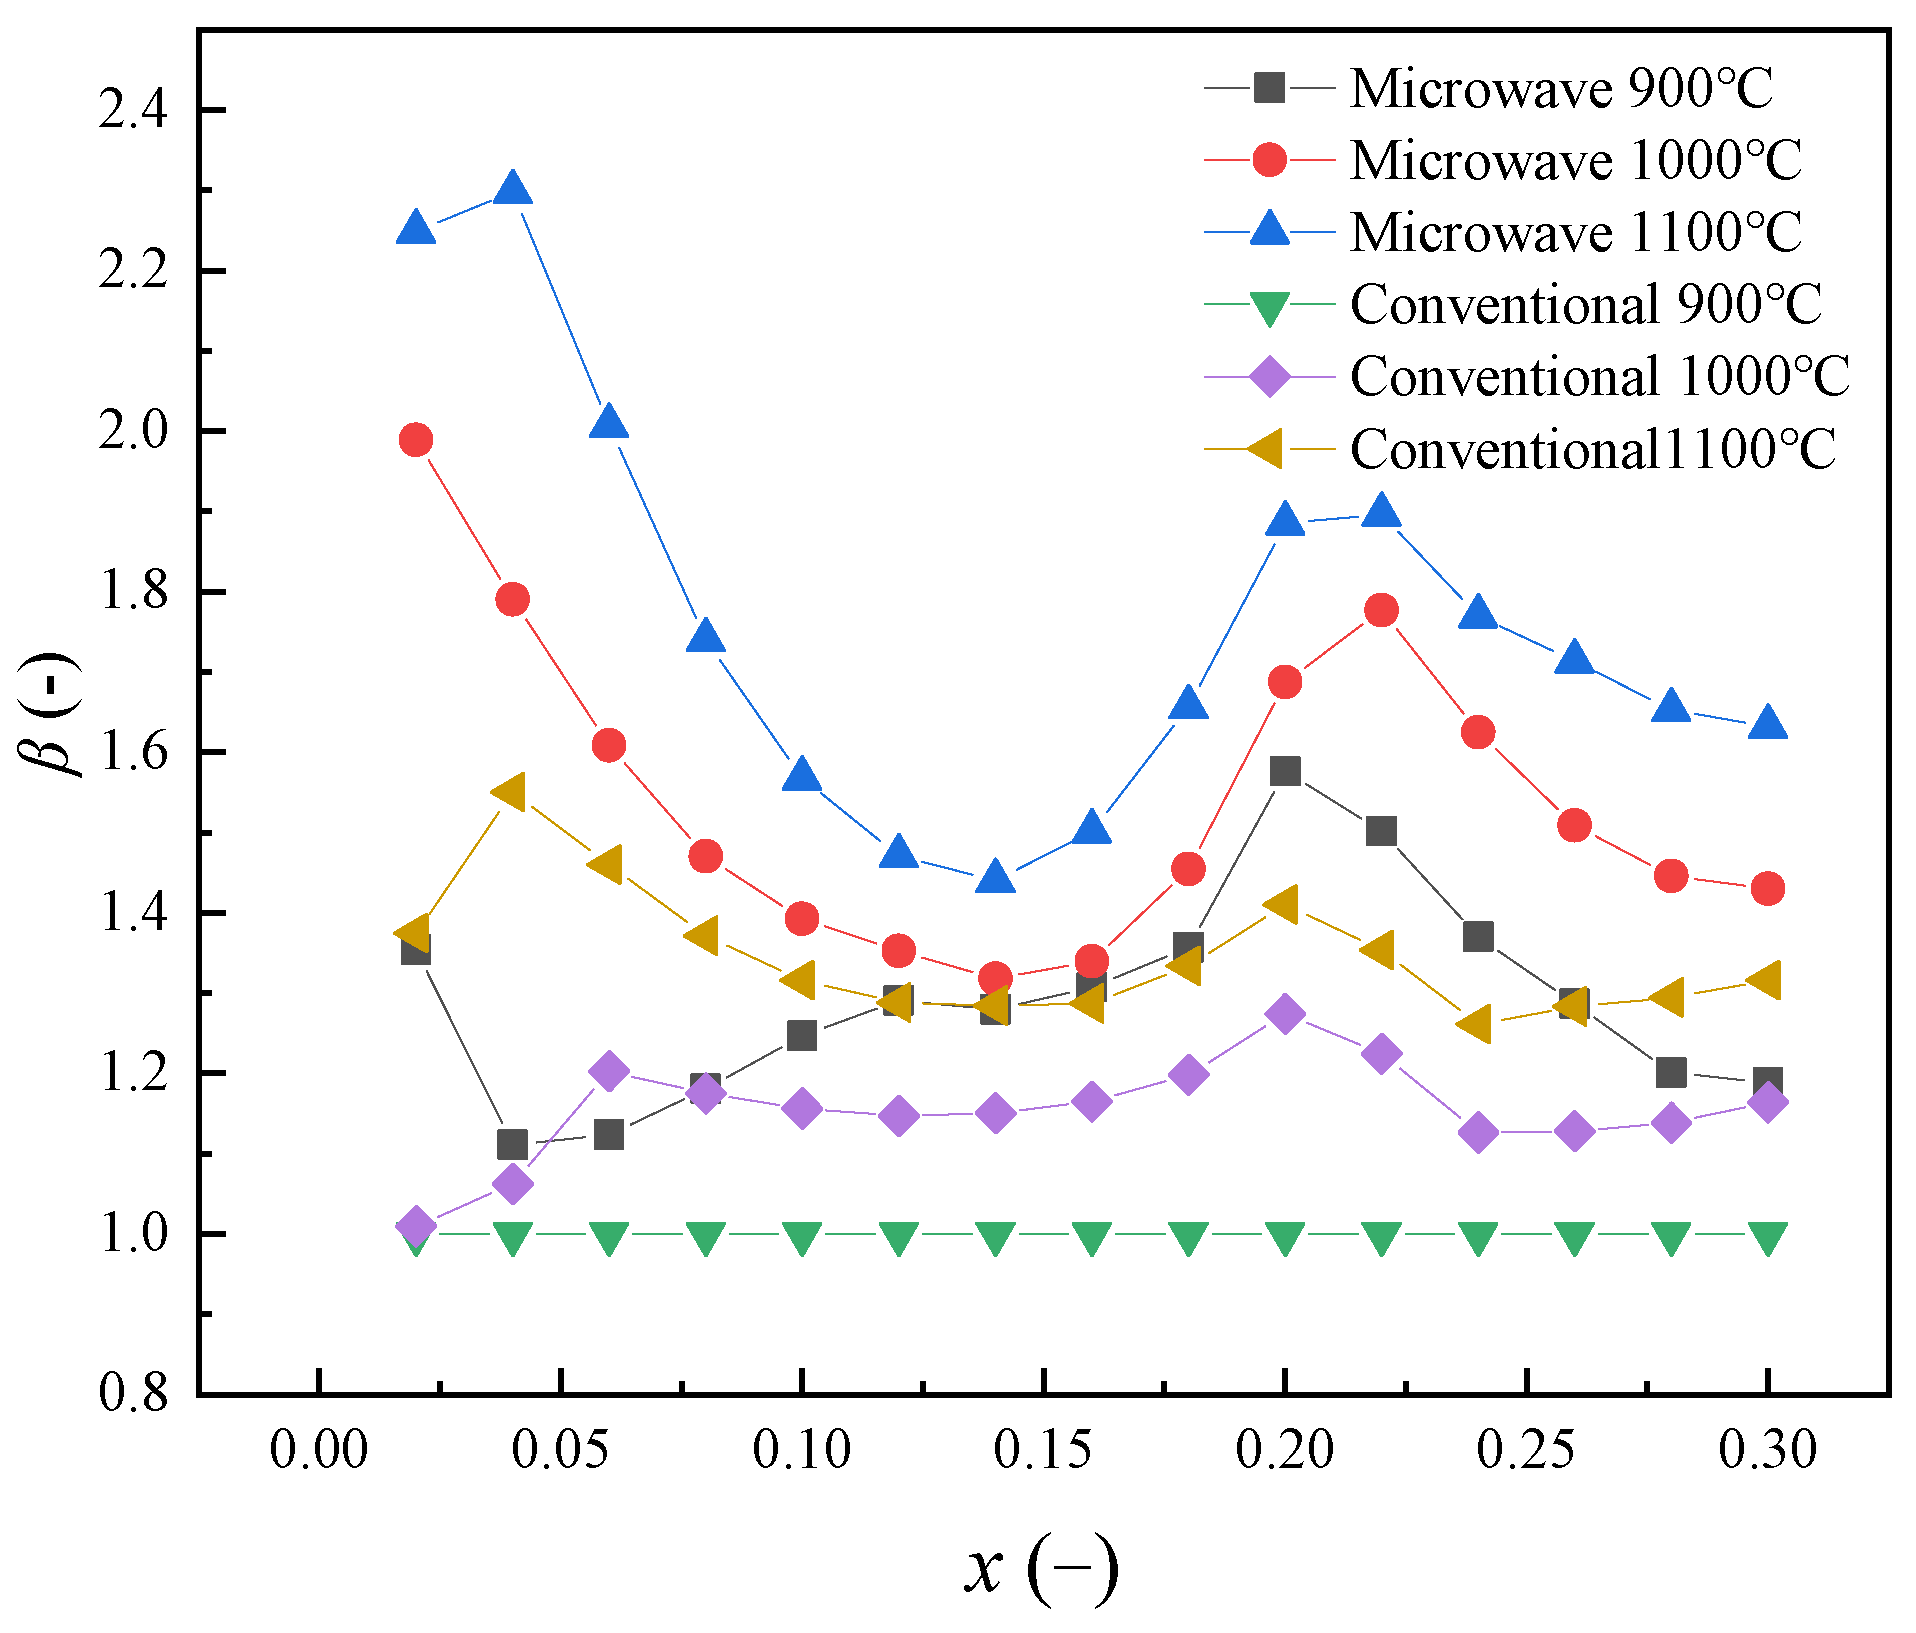
In Figure 14, the control mechanism range corresponding to the m value [24] is marked. The microwave field does not change the limiting step. The restrictive steps under the two heating methods are primarily characterized by diffusion. By using the calculation results of the m-t relationship and the experimental results of the x-t relationship, the change in k with the reduction ratio x can be calculated. The results are shown in Figure 15. In the first stage of reduction, the k value decreases sharply, and in the second stage, it is almost flat. The k value increases with the increase in temperature. Based on a k value of 900 °C under the conventional field, the ratio β of each temperature to 900 °C under the conventional field is calculated (Figure 16). The reduction rate constant at 900 °C under the microwave field is 1.11–1.57 times that under the conventional field. The reduction rate constant at 1100 °C under the microwave field is 1.47–2.29 times that at 900 °C under the conventional field. Microwave irradiation proves to be the most effective way to improve both the initial reduction rate and that exhibited during the primary iron crystal precipitation phase.
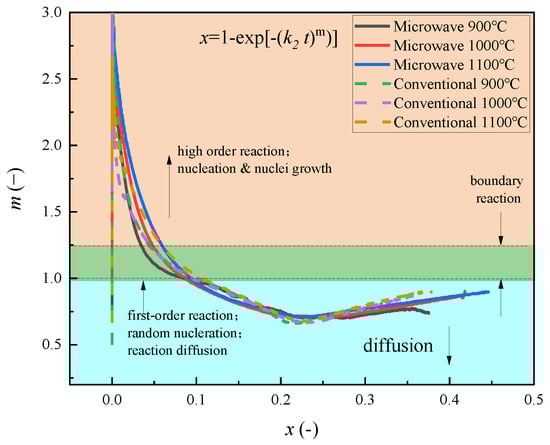
Figure 14.
The range of control mechanism corresponding to m-value.
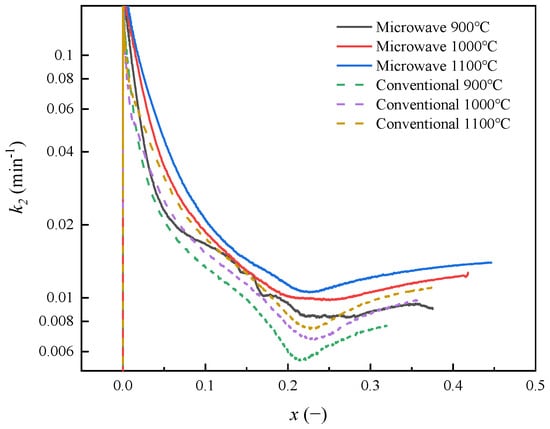
Figure 15.
The rate constants under different conditions.
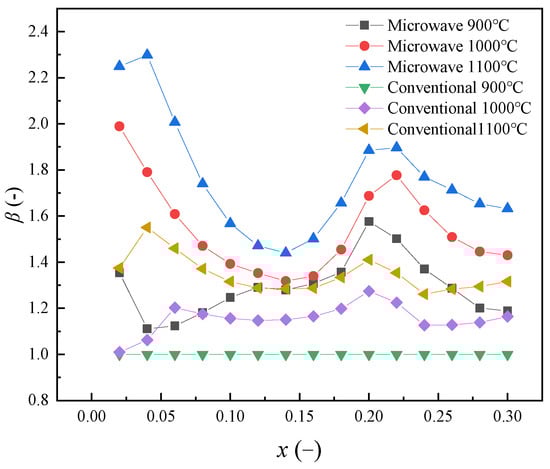
Figure 16.
The ratio at each temperature based on the conventional 900 °C.
Jiang Chen [25] found that the formation of porous iron by CO reduction is related to CO partial pressure and reduction temperature. However, under the experimental conditions of the present study, the reduced iron is a dense punctate. The morphology of iron crystals may be essentially controlled by the ratio of diffusion rate to reaction rate [19]. It is also related to the adsorption force of CO and H2 on precipitated iron, which is the root cause of the difference in the driving force of precipitated iron growth. Therefore, under the experimental conditions, when the diffusion rate is relatively low, it tends to produce a dense structure.
The avrami indexes m and k obtained from the above calculation are substituted into Equation (6). The obtained x-t relationship completely coincides with the experimental results, indicating that the obtained m and k are correct. The JMA model can describe the reduction process under diffusion constraints.
3.5. Activation Energy
According to the reduction ratio displayed in Figure 12 and Figure 13, the apparent activation energy of magnetite reduction to metallic iron can be calculated using the Arrhenius equation (Equation (11)):
Here, k is the reaction rate constant, A is a pre-exponential factor, R is the gas constant, T is temperature, and Ea is the apparent activation energy. Furthermore, taking the logarithm of both sides of Equation (11), a linearized Arrhenius equation can be obtained (Equation (12)).
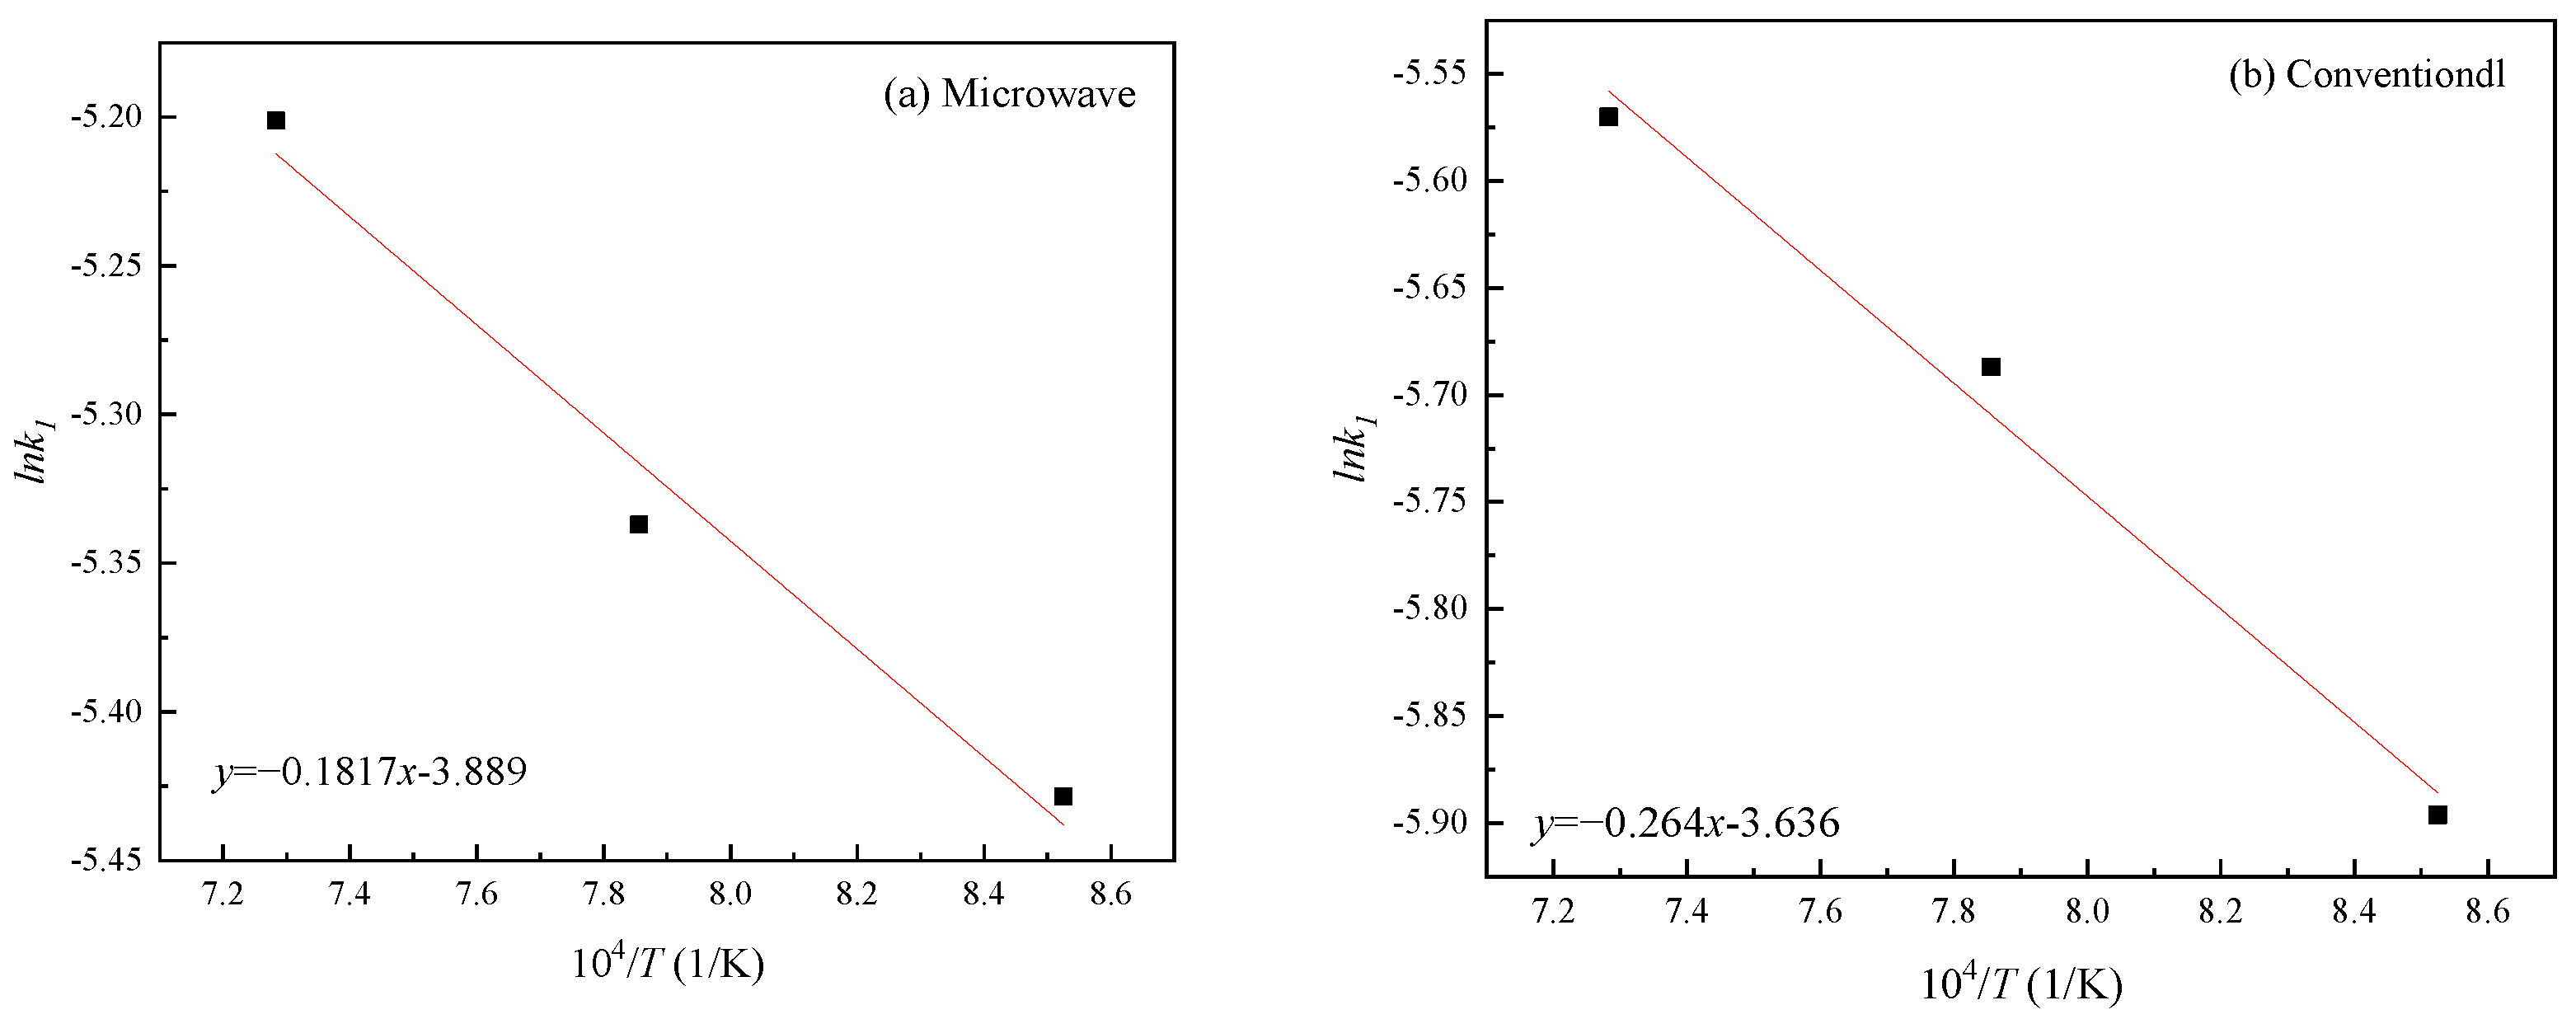
The activation energy under each experimental condition is obtained from the fitted linear equations displayed. The microkinetic activation energy was calculated (Figure 17). The activation energy under the microwave field was 15.106 kJ·mol−1, and the activation energy under the conventional field was 21.949 kJ·mol−1.
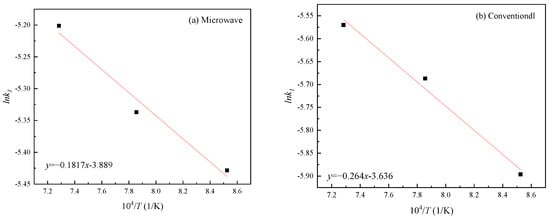
Figure 17.
Microkinetic activation energy; (a) microwave field, (b) conventional field.
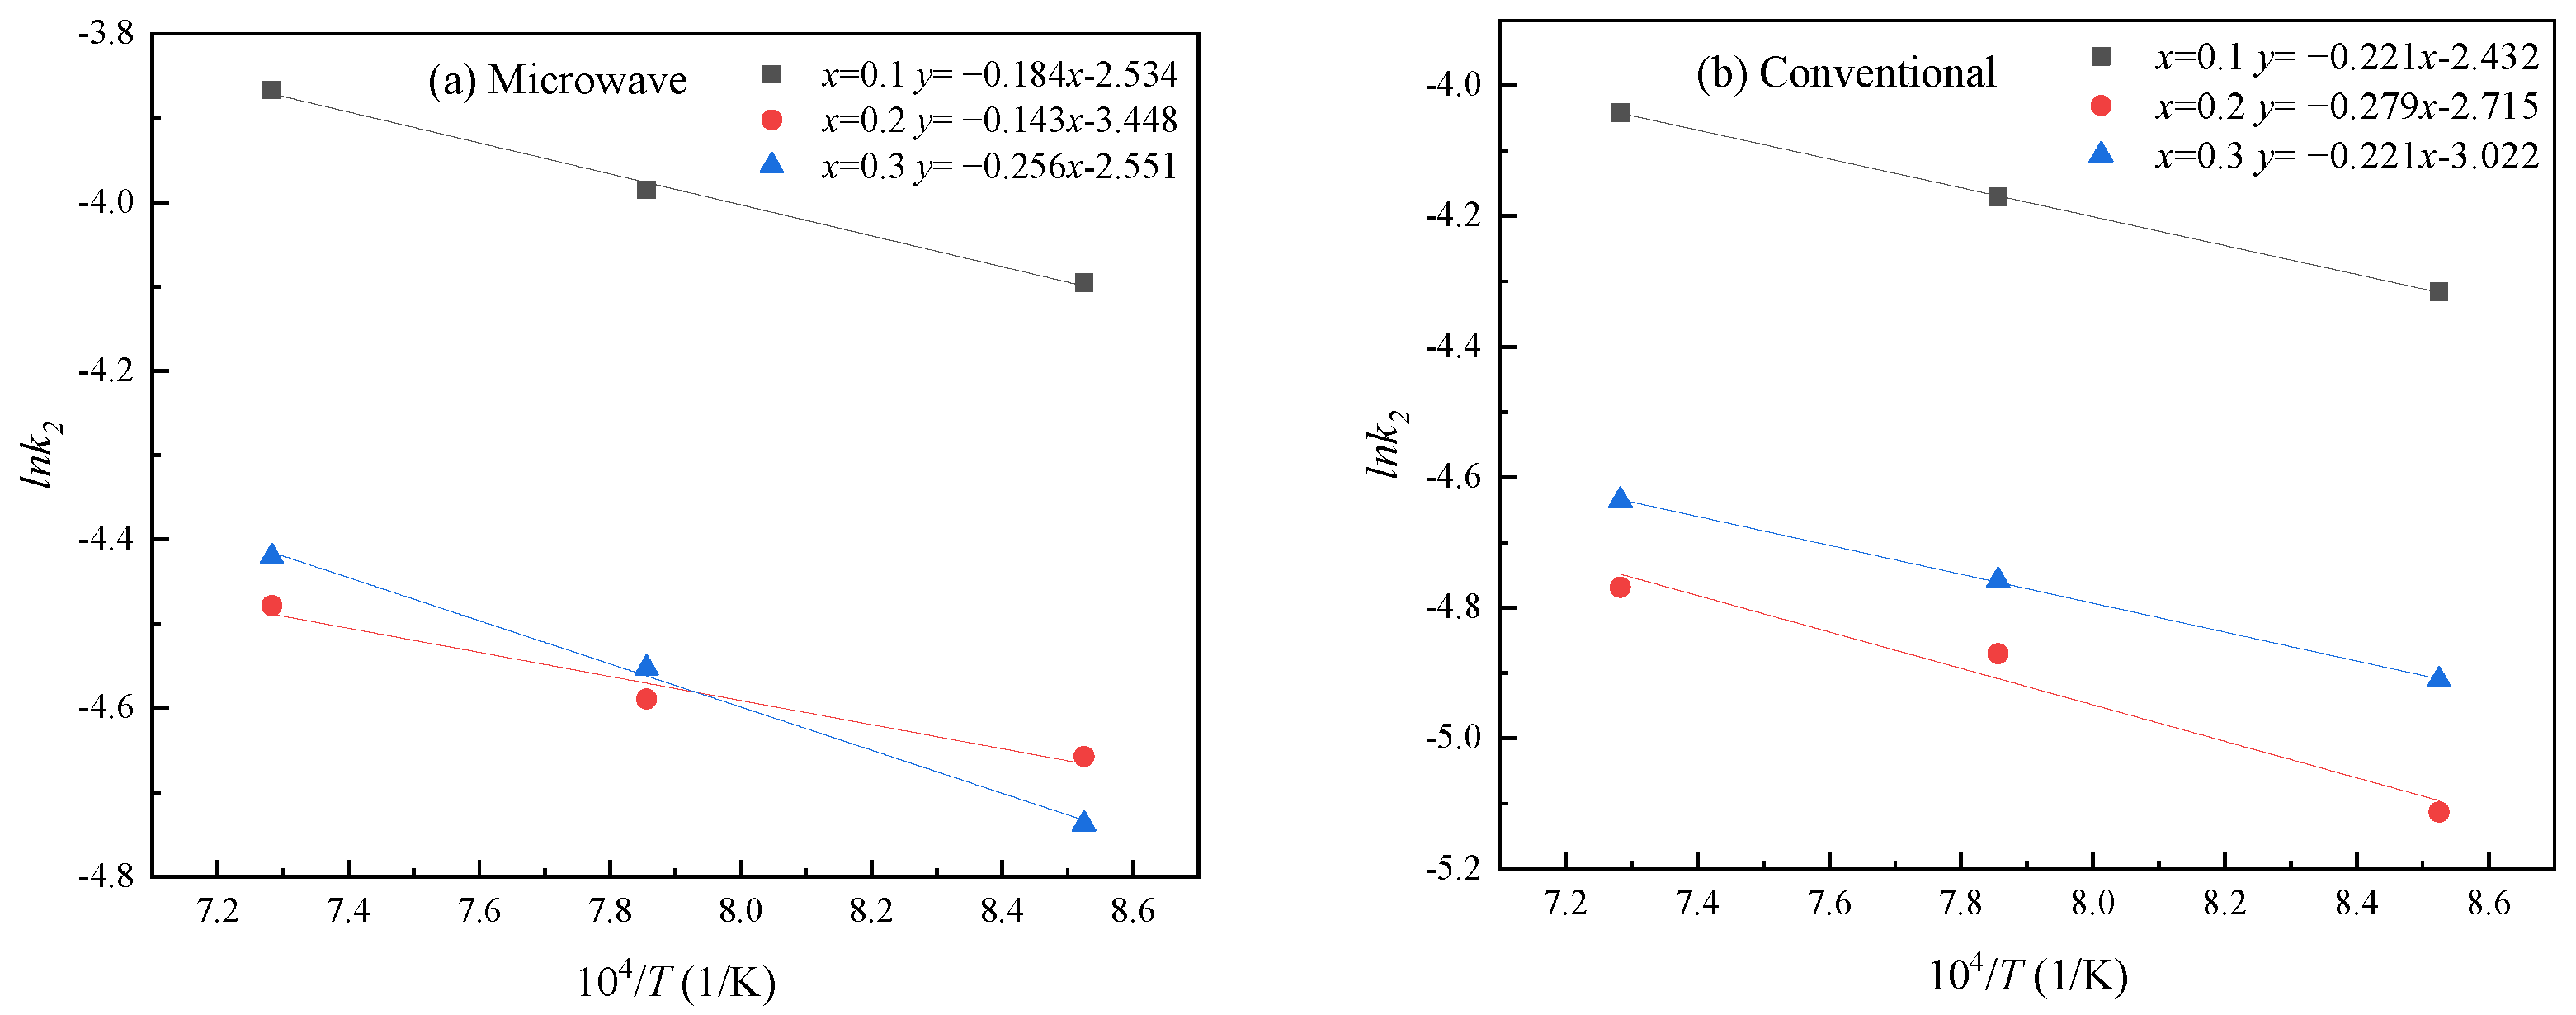
The apparent activation energy at different stages can be calculated according to the k2 obtained from microscopic kinetic analysis (Figure 18). The activation energy under the microwave field is 11.889–21.283 kJ·mol−1, and the activation energy under the conventional field is 18.374–23.196 kJ·mol−1. The activation energy under the microwave field is lower than that under the conventional field because microwave irradiation intensifies the oscillation of molecules at a low temperature, thereby achieving the effect of high temperature. Microwave irradiation also accelerates the oscillation of CO, thereby accelerating the adsorption of CO on the lattice surface. Due to the oscillation, the lattice gap increases and the diffusion becomes easier, thereby accelerating the internal diffusion.
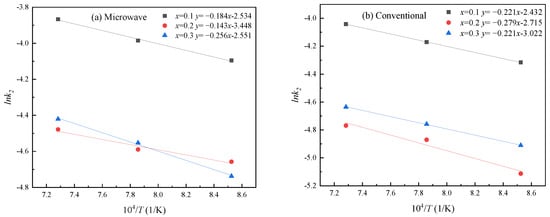
Figure 18.
Microscopic kinetic activation energy; (a) microwave field, (b) conventional field.
4. Conclusions
The kinetics of CO reduction of magnetite under microwave irradiation and conventional heating conditions were studied. The impact of the microwave field on the reduction effect and process under the condition of gas phase diffusion as a restrictive step was clarified, and the morphology characteristics of the product layer were analyzed. The results lay a foundation for the kinetic study of CO + H2 reduction. The primary conclusions are summarized as follows:
- Under the 60% CO-Ar atmosphere at 900–1100 °C, the metallization rate of the microwave field is 1.4 times that of the conventional field. The reduction degree of the microwave field is 1.2 times that of the conventional field. This shows that the microwave field can promote gas phase diffusion, but microwave irradiation does not significantly change the restrictive step. The promoting effect of the microwave field diminishes at higher temperature.
- Cross sections of magnetite particles were observed via SEM analysis. The morphologies of the reduced particles were similar for both microwave irradiation and conventional heating, with metallic iron forming a pointed-inward morphology causing the rupture of the particles. Under the condition of CO-limited reduction, the iron crystals produced by the reduction process under the microwave field and the conventional field are dense structures; porous components cannot be detected. The microwave field does not significantly change the morphology of the iron crystal. In addition to the influence of a reduction temperature and gas phase composition, the morphology of iron crystal can also be controlled by the reduction limiting step. This is a useful supplement to the conditions for the formation of iron crystal morphology. The morphology of iron crystals may be essentially controlled by the ratio of diffusion rate to reaction rate. When the diffusion rate is relatively low, it tends to produce dense structures.
- The microstructures of the reduction process under the microwave and conventional fields show that the reduction and crystallization of iron under the condition of CO reduction rate limiting is not like that of the H2 reduction, which will first produce a structure-coating layer around the exterior of the mineral. Instead, it is selectively crystallized from the microcracks generated by the stress in the early stage of the unreduced phase, and gradually expanded along the normal direction of the length of the ore powder. The in-depth growth results in the formation of strips of iron crystals that penetrate the ore powder and then expand outward width-ways, which is the result of CO adsorption orientation and mineral microdefects.
- Microwave irradiation can effectively improve the phenomenon of mineral sintering. The expansion of the material bed is obvious in the reduction process under the microwave field, whereas it is relatively small under the conventional field. The expansion phenomenon diminishes with the increase in temperature. The bed expansion provides a channel for gas diffusion and accelerates the reduction reaction.
- By contrast with the H2 reduction, the two reduction processes of CO reduction of Fe3O4 to FexO, and FexO to Fe, overlap. Due to the high potential for CO reduction in the near-surface region of the ore powder, iron is produced before reduction eliminates the Fe3O4. The reduction of Fe3O4 by H2 is divided into two independent cascade processes: Fe3O4 to FexO, and FexO to Fe.
- The JMA model was combined with the lnln method to determine the changes in the Avrami indexes m and k in the reduction process. It shows that the Avrami index m can be used to analyze the restrictive steps of the reduction process and its transformation. Under the condition of CO gas diffusion rate limiting, the reaction rate constant at 900 °C under the microwave field is 1.11–1.57 times higher than that under the conventional field at 900 °C. Microwave irradiation proves the most effective way to improve both the initial reduction rate and the reduction rate when the iron phase precipitates.
- Under the adopted experimental conditions, microwave irradiation reduced the activation energy of the reduction reaction. Microwave irradiation promoted the layer reduction phenomenon and directional reduction (the directional growth of the reduced iron phase) of the magnetite powder. Kinetic analysis of both the macroscopic linear model and the microscopic process shows that under the condition of gas diffusion as the limiting step, the activation energy of microwave irradiation reduction of magnetite concentrate powder is lower than that of conventional heating.
Author Contributions
Methodology, L.A.; Validation, L.H., C.S. and S.T.; Formal analysis, S.T.; Data curation, M.Z.; Writing—original draft, M.Z.; Writing—review & editing, L.A.; Visualization, L.H. All authors have read and agreed to the published version of the manuscript.
Funding
This study was supported by the Natural Science Foundation of Hebei Province (E2021209101; E2022209112); Science and Technology Research Projects of Higher Education Institutions in Hebei Province (ZD2022125); Tangshan Talent Funding Project (A20220212).
Conflicts of Interest
On behalf of all authors, the corresponding author states that there are no conflict of interest.
References
- Raymond, L.; Leiv, K. Iron Ore Reduction with CO and H2 Gas Mixtures–Thermodynamic and Kinetic Modelling. In Proceedings of the 4th Ulcos Seminar, University of Wollongong. Available online: https://ro.uow.edu.au/engpapers/1260 (accessed on 1 October 2008).
- Hunt, J.; Ferrari, A.; Lita, A.; Crosswhite, M.; Ashley, B.; Stiegman, A.E. Microwave-specific Enhancement of the Carbon-carbon Dioxide (Boudouard) Reaction. J. Phys. Chem. C 2013, 117, 26871–26880. [Google Scholar] [CrossRef]
- Zhou, J.; Xu, W.; You, Z.; Wang, Z.; Luo, Y.; Gao, L.; Yin, C.; Peng, R.; Lan, L. A New Type of Power energy for Accelerating Chemical Reactions: The Nature of a Microwave-driving Force for Accelerating Chemical Reactions. Sci. Rep. 2016, 6, 25149. [Google Scholar] [CrossRef]
- Ayvaz, S.I.; Aydin, I. Effect of the Microwave Heating on Diffusion Kinetics and Mechanical Properties of Borides in AISI 316L. Indian Inst. Met. 2020, 73, 2635–2644. [Google Scholar] [CrossRef]
- Amini, A.; Ohno, K.; Maeda, T.; Kunitomo, K. Comparison between Microwave Heating and Conventional Heating of FeS-CaO Mixture during Hydrogen-Reduction. Chem. Eng. J. 2019, 374, 648–657. [Google Scholar] [CrossRef]
- Binner, J.G.P.; Al-Dawery, I.A.H. Microwave Melt Texturing of Bulk YBCO Superconductors. Supercond. Sci. Technol. 1998, 11, 1230–1236. [Google Scholar] [CrossRef]
- Chen, J.; Liu, L.; Zeng, J.Q. Experimental study on reduction of carbonaceous iron ore powder by microwave heating. Steel 2004, 39, 1–5. [Google Scholar] [CrossRef]
- Hayashi, M.; Takeda, K.; Kashimura, K.; Watanabe, T.; Nagata, K. Carbothermic Reduction of Hematite Powders by Microwave Heating. ISIJ Int. 2013, 53, 1125–1130. [Google Scholar] [CrossRef]
- Ishizaki, K.; Nagata, K.; Hayashi, T. Localized Heating and Reduction of Magnetite Ore with Coal in Composite Pellets Using Microwave Irradiation. ISIJ Int. 2007, 47, 817–822. [Google Scholar] [CrossRef]
- Hara, K.; Hayashi, M.; Sato, M.; Nagata, K. Pig Iron Making by Focused Microwave Beams with 20 kW at 2.45 GHz. Iron Steel Inst. Jpn. 2012, 52, 2149–2157. [Google Scholar] [CrossRef]
- Kashimura, K.; Sato, M.; Hotta, M.; Agrawal, D.K.; Nagata, K.; Hayashi, M.; Mitani, T.; Shinohara, N. Iron production from Fe3O4 and graphite by applying 915 MHz microwaves. Mater. Sci. Eng. A 2012, 556, 977–979. [Google Scholar] [CrossRef]
- Zhou, M.; Ai, L.; Hong, L.; Sun, C.; Yuan, Y.; Tong, S. Comparison of Microstructures of Magnetite Reduced by H2 and CO under Microwave Field. Metals 2023, 13, 1367. [Google Scholar] [CrossRef]
- Sun, C.; Ai, L.; Hong, L.; Li, Y. Study on solid state steelmaking from thin cast iron sheets through decarburization in H2O–H2. Ironmak. Steelmak. 2019, 47, 1015–1021. [Google Scholar] [CrossRef]
- Moujahid, S.E.; Rist, A. The Nucleation of Iron on Dense Wustite: A Morphological Study. Metall. Mater. Trans. B 1988, 19, 787–802. [Google Scholar] [CrossRef]
- Amini, A.; Ohno, K.I.; Maeda, T.; Kunitomo, K. Effect of the Ratio of Magnetite Particle Size to Microwave Penetration Depth on Reduction Reaction Behaviour by H2. Sci. Rep. UK 2018, 8, 15023. [Google Scholar] [CrossRef]
- Kim, S.H.; Zhang, X.; Ma, Y.; Filho, I.R.S.; Schweinar, K.; Angenendt, K.; Vogel, D.; Stephenson, L.T.; El-Zoka, A.A.; Mianroodi, J.R.; et al. Influence of microstructure and atomic-scale chemistry on the direct reduction of iron ore with hydrogen at 700 °C. Acta Mater. 2021, 212, 116933. [Google Scholar] [CrossRef]
- John, D.H.S.; Matthew, S.P.; Hayes, P.C. The breakdown of dense iron layers on wustite in CO/CO2 and H2/H2O systems. Metall. Mater. Trans. B 1984, 15, 701–708. [Google Scholar] [CrossRef]
- Matthew, S.P.; Cho, T.R.; Hayes, P.C. Mechanisms of porous iron growth on wustite and magnetite during gaseous reduction. Metall. Mater. Trans. B 1990, 21, 733–741. [Google Scholar] [CrossRef]
- Wei, J. Study on the Mechanism of the Difference in the Morphology of Iron Precipitated during the Reduction of FeO by CO and H2. Ph.D. Thesis, Chongqing University, Chongqing, China, 2018. [Google Scholar]
- Kuila, S.K.; Chatterjee, R.; Ghosh, D. Kinetics of Hydrogen Reduction of Magnetite Ore Fines. Int. J. Hydrogen Energy 2016, 41, 9256–9266. [Google Scholar] [CrossRef]
- Abolpoura, B.; Afsahia, M.; Azizkarimi, M. Reduction kinetics of magnetite concentrate particles by carbon monoxide. Miner. Process Extr. Metall. 2018, 127, 29–39. [Google Scholar] [CrossRef]
- Stir, M.; Ishizaki, K.; Vaucher, S.; Nicula, R. Mechanism and kinetics of the reduction of magnetite to iron during heating in a microwave E-field maximum. J. Appl. Phys. 2009, 105, 124901. [Google Scholar] [CrossRef]
- Janković, B. Kinetic analysis of the no isothermal decomposition of potassium metabisulfite using the model-fitting and is conversional (model-free) methods. Chem. Eng. J. 2008, 139, 128–135. [Google Scholar] [CrossRef]
- Hancock, J.D.; Sharp, J.H. Method of Comparing Solid-State Kinetic Data and Its Application to the Decomposition of Kaolinite, Brucite, and BaCO3. J. Am. Ceram. Soc. 2010, 55, 74–77. [Google Scholar] [CrossRef]
- Chen, J.; Zhang, R.; Simmonds, T.; Hayes, P.C. Microstructural Changes and Kinetics of Reduction of Hematite to Magnetite in CO/CO2 Gas Atmospheres. Metall. Trans. B 2019, 50, 2612–2622. [Google Scholar] [CrossRef]


Disclaimer/Publisher’s Note: The statements, opinions and data contained in all publications are solely those of the individual author(s) and contributor(s) and not of MDPI and/or the editor(s). MDPI and/or the editor(s) disclaim responsibility for any injury to people or property resulting from any ideas, methods, instructions or products referred to in the content. |
© 2023 by the authors. Licensee MDPI, Basel, Switzerland. This article is an open access article distributed under the terms and conditions of the Creative Commons Attribution (CC BY) license (https://creativecommons.org/licenses/by/4.0/).