1. Introduction
Due to the tremendous increase in global population over the past 40 years, access to freshwater resources has become disproportionate (1). Due to the rising demand for pure water, there are not enough people, infrastructure, or businesses to supply it. Water quality may also be impacted in some places. In order to meet the growing and ongoing need for potable water, this has prompted countries to accelerate the water desalination process. Several nations have increased their efforts to establish, enhance services, and conduct research as a result of increased awareness of the need to monitor the cleanliness of drinking water in their nations [
1,
2,
3,
4].
Desalination techniques are mainly derived from thermal and membrane processes. Reverse osmosis (RO) membrane processes have become dominant due to their low operational cost, lower space requirements, and ease of operation [
3]. However, they require high pressure for operation. One of the desalination processes that combines heat and membrane processes is membrane distillation, and due to the low-grade heat requirement, the MD process takes the lead as an economical and efficient desalination process in terms of product purity compared to RO and traditional thermal desalination [
5]. Its benefits stem from the fact that it may be used with low-grade energy, that the feed water does not have to reach boiling point, that it is unaffected by the salinity of the water, and that it operates at ambient pressure. Due to these benefits, numerous studies have attempted to enhance this method [
5,
6,
7,
8].
Similar to scaling and fouling in pressure-driven membranes, fouling is a problem with membrane distillation when dealing with brine solutions and has recently been studied [
6,
9]. In the case of concentrated salt water, technically speaking, fouling results in membrane pores clogging during MD operations, which lowers the flow of latent heat of water vaporization and shortens the life of the membranes [
10,
11,
12]. Additionally, due to fouling and scaling on the membrane’s surface and a reduction in the feed water’s channel area, the feed water’s flow rate and pressure may be impacted. Additionally, fouling may cause the membranes to become wet or compromised [
11,
12]. DCMD can be a flat sheet or hollow fibers. Hollow fiber membranes are perhaps more appropriate for industrial applications due to their higher surface area and lower packing density [
13,
14]. However, compared to flat sheets, they have a high potential for fouling [
14] due to a deficit of turbulence flow phenomena either in to out or out to in feed flow. Last but not least, studies on fouling mitigation in membrane distillation have discovered that hollow membranes have a very high propensity to foul and do so in circumstances where other membrane types are not generally known to do so [
15]. For pressure-driven membranes in particular, hydrophilic hollow fiber architectures are less prone to clogging than other types of membrane structures. However, because it consists of a shell and tubes, the hollow fiber membrane configuration is considerably superior for the MD application [
13]. However, it has been discovered that even in the concentrated salt feed of 55,000 ppm salt solution, the fouling mitigation rate of hollow fiber membranes in the hydrophobic form is substantially lower [
16,
17,
18]. At the same time, this fouling was found more frequently in experiments containing the feed and the membranes in capillary tubes; in other studies where the feed and membranes were inside the capillary tubes, the fouling phenomenon was considered unlikely [
19].
The deposition of solid particles on the membrane surface is brought on by particulate fouling. The type and pace of deposition have been impacted by the size of the suspended particles. The fouling brought on by particles may be reduced by filtration techniques like cartridge filtration or sand filtration. To combat the problems of fouling and scaling encountered during MD application, several studies present a variety of techniques, including creating turbulence during the feed flow rate, increasing the feed flow rate during the MD process, routinely cleaning the process physically or chemically, reducing membrane surface roughness, and preventing the membrane surface from being charged [
20]. In addition to fouling and scaling, temperature polarization, or the persistent difference between hot feed and cool permeate temperatures, is a crucial concern in all classifications of MD processes [
2,
21,
22,
23,
24,
25,
26]. As a result, numerous studies have identified certain strategies to address the problems of temperature polarization during the MD process, such as generating turbulence in the feed flow and shortening the length of the hollow fiber membrane in the membrane module [
20,
21,
22,
23].
Membrane fouling and temperature polarization [
27,
28,
29,
30] are the key barriers to competitively scaling up membrane distillation (MD). The turbulence phenomenon in the feed channels has been proven to reduce scaling and even temperature distribution in the tube and shell heat exchangers. Therefore, in this study, the pulsation feed flow phenomenon was used to overcome the issues of DCMD polarization. In DCMD, multiple water sources, such as distilled water, seawater, and wastewater, were used with two different hertz and amplitudes of pulsation feed flow patterns, and a comprehensive comparison was made with conventional feed flow patterns.
2. Methodology
The aim of the work untaken in this experimental method is to overcome the issues of fouling on hollow fiber membranes using a pulsation feed technique during the DCMD operation. Various experimental setups and protocols have been made for the investigation, particularly the frequency of pulsation on feed flow rate, temperature difference between the feed and permeate, and the fouling and scaling rate of feed solutes onto the membrane surface, and the membrane properties have also been investigated. Results of different pulse frequencies on fouling, scaling, and temperature polarization were obtained, and a comparison was made without the pulse feed flow.
3. Brine Water and Distilled Water with or without Foulant Materials
Three types of water have been used in the experiments: distilled water, brine water (35,039.980 ppm and 51,058.2574 ppm), and wastewater. A pretreated seawater intake of 35,039.980 ppm was collected from the Al-Khaldyah desalination plant in Jeddah, Saudi Arabia. The pretreated seawater intake (35 g/L) was concentrated up to 51 g/L using the conventional thermal distillation process. The wastewater was taken from the Jeddah Sewage Treatment Plant. On the other hand, the distilled water was collected from the desalination plant (the specifications of the desalination plant) in the center of excellence in desalination technologies, and foulant materials were added to make synthetic feed.
4. Experimental Procedure
A commercial-grade hydrophobic PVDF hollow fiber membrane was provided by Econity Company, Limited, South Korea [
31], to be used in this study. Six identical modules were prepared with moderate heat- and chemical-resistance transparent acrylic pipes as housing and chlorinated polyvinyl chloride (CPVC) as fitting. Twelve equivalent hollow fibers were selected with a packed density of 99 ± 1% were crammed into a 30 cm long module. The company provides the fibers in a row in a long tube. A proper hollow fiber membrane formed six bundles. The hollow fiber membrane bundles were first washed with distilled water to ensure that they were dust- or smear-free. Then, the selected hollow fibers bundles were immersed in a bleach solution bath, and the temperature of the water bath was kept at 80 ± 5 °C and annealed for 60 min. After annealing, the hollow fibers were immersed in distilled water at 25 °C for 24 h.
Before assembling the hollow fiber module, the annealing process was carried out, as described elsewhere [
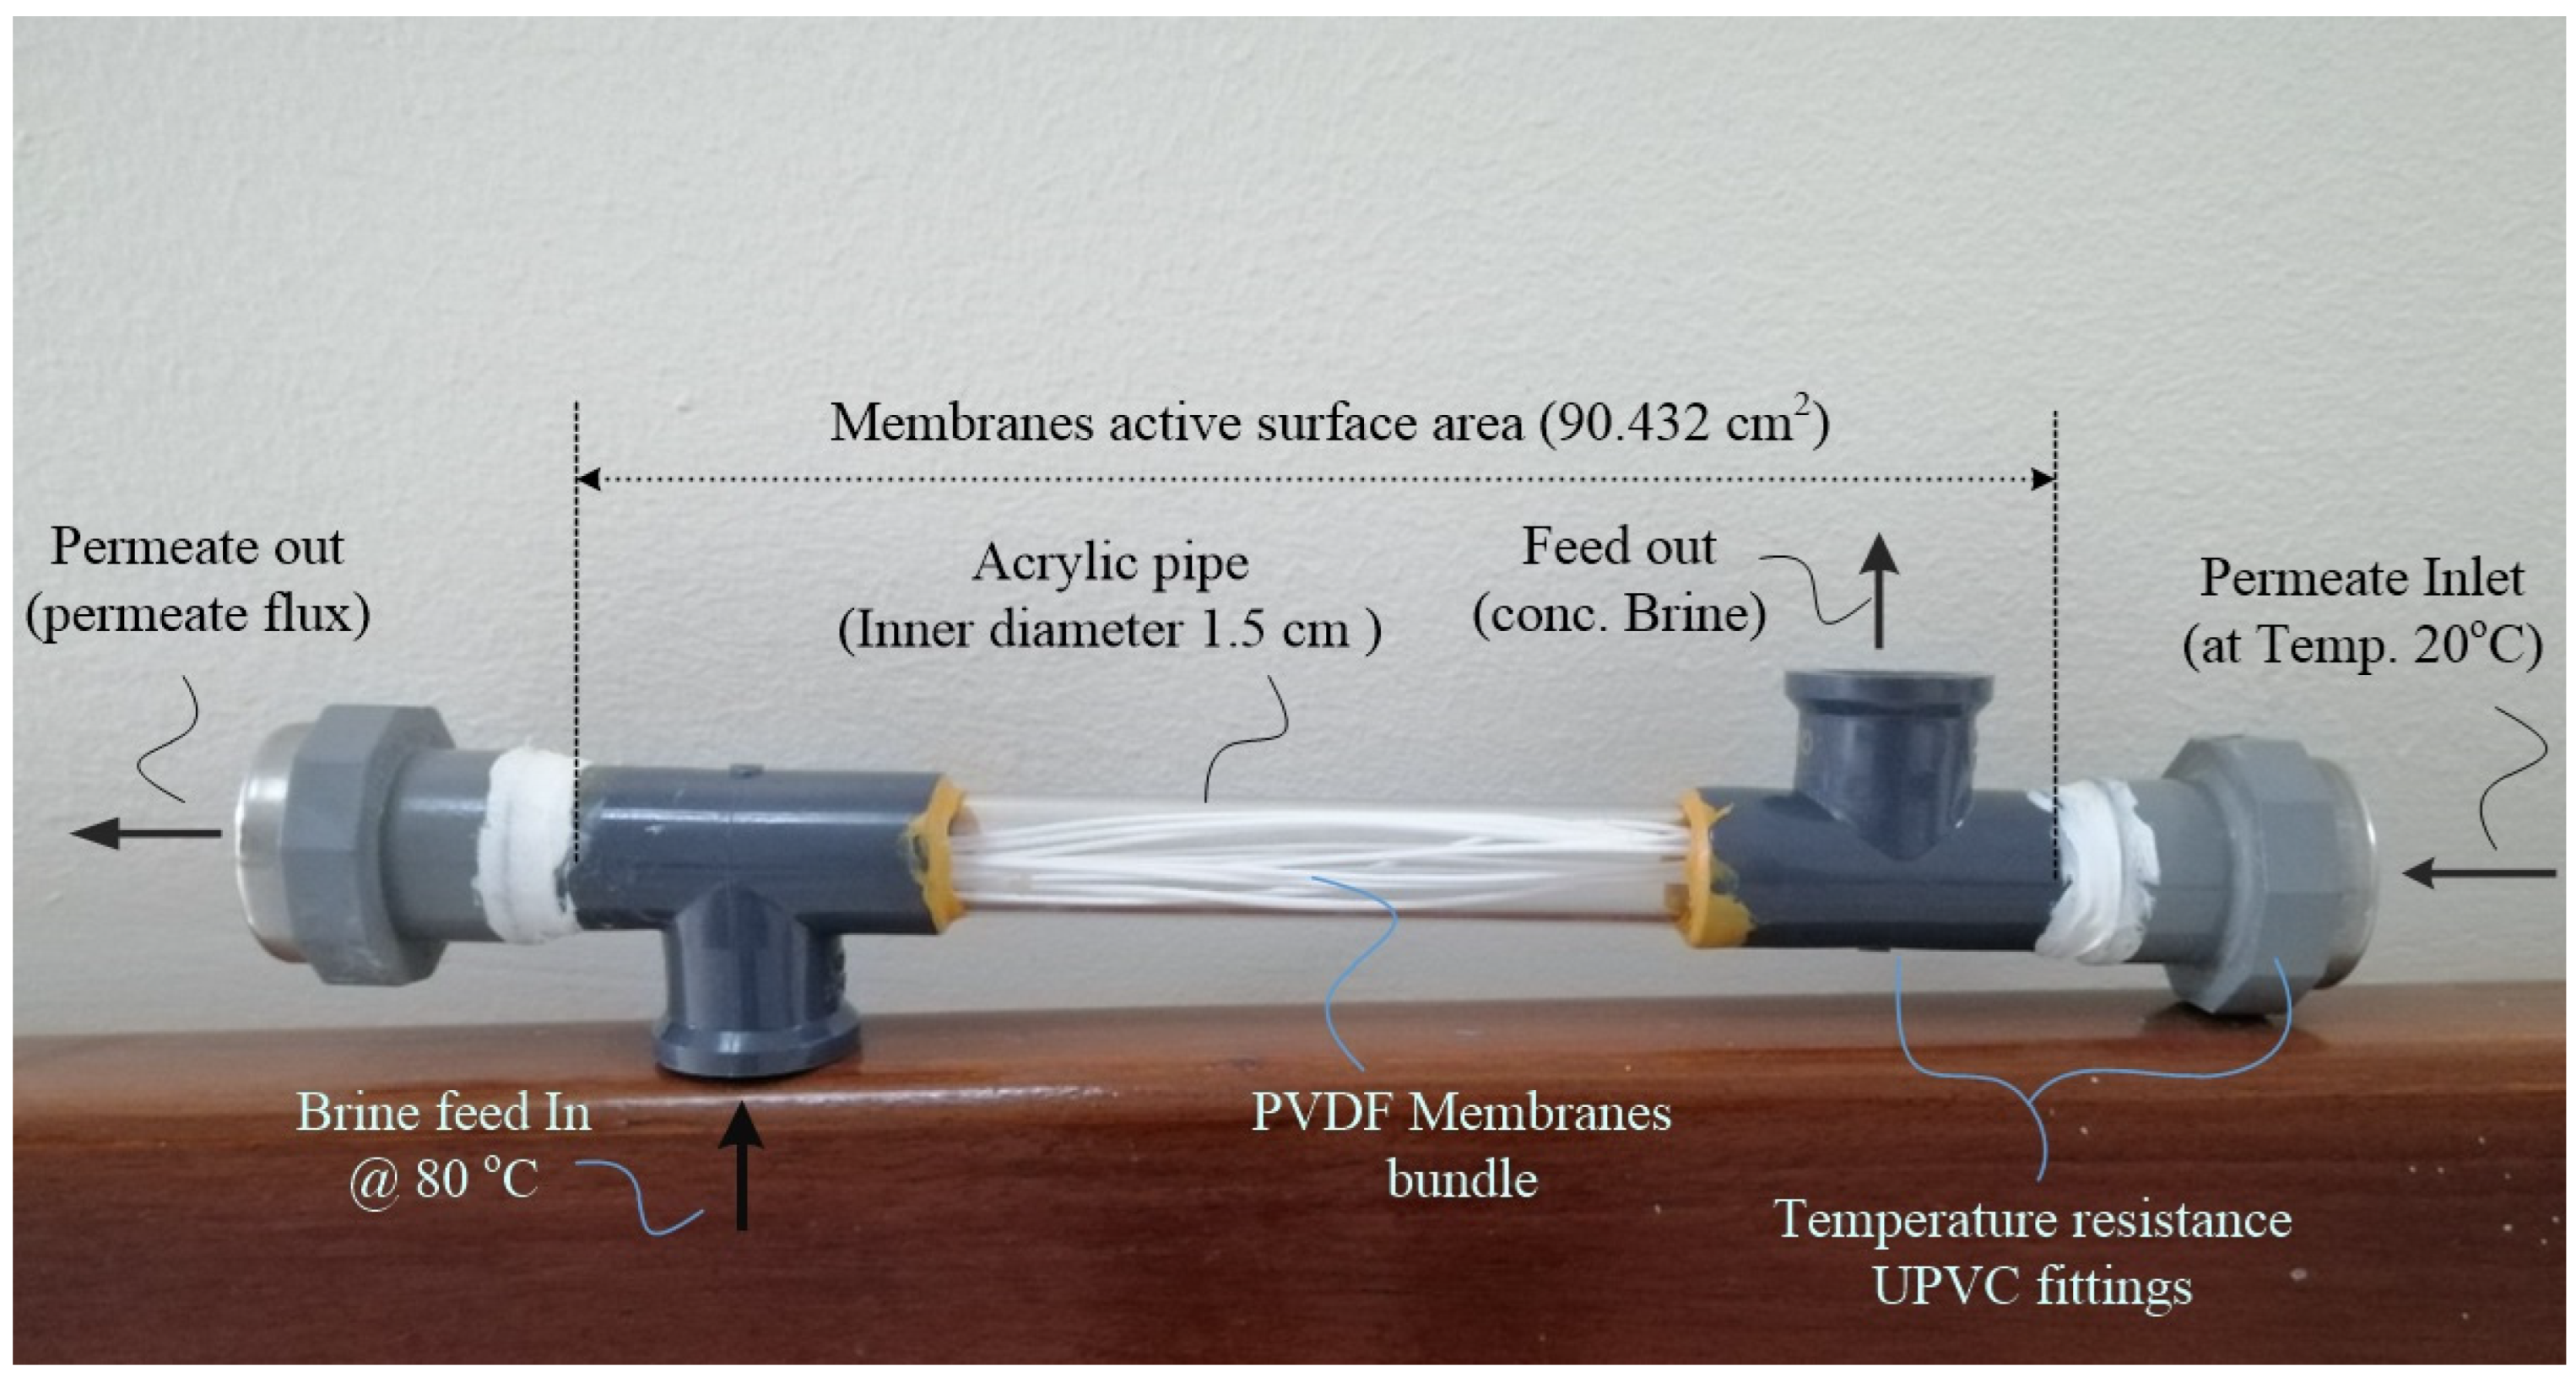
32]. After annealing, the hollow fiber membrane bundles were dried for 48 h at room temperature. The hollow fiber membranes were then potted in bundles of about 12 fibers each with a 30 cm length. A high fiber packing density is needed in PVDF hollow fiber membranes to minimize any axial diffusional effects and channeling. A constricted bundle of 12 PVDF hollow fibers was therefore housed in a 40 cm long acrylic pip or UPVC fitting with a hollow 2.5 cm diameter, and the concentric annular space between the acrylic pip or UPVC housing or casing and fiber bundle was filled using high-temperature, water-resistant wooden PVA white glue. The geometrical characteristics of the permeator are described in
Table 1, and
Figure 1 summarizes a full photo image of the PVDF hollow fiber membrane configuration for DCMM application.
5. DCMD Experimental Setup
A bench-scale unit was fabricated by an Italian company called DeltaE Srl which was used in this experiment to make sure that the tests were in direct contact for the membrane distillation process. A snapshot of a bench-scale unit is shown in
Figure 2.
Figure 3 shows a comprehensive schematic layout of the DCMD experimental setup used in this study [
33]. There are two cycles in the experiment set, the first one is for the feed water (hot stream), and the other is for the permeating water (cold stream). The hot side was fed with the prepared solution, and the cold side was fed with distilled water. The fed solutions were heated or cooled in a separate heater or cooler filled with water and submerged coils to exchange the heat; these were made in the United States of America by Polyscience—Model Number PP15R-30. The water moved to the module after being heated or cooled in the heating or cooling baths. The discharged water from the module came back to the feed bath for hot water or the permeate bath for the cold water. The output of the distillation process was collected and measured using an electronic balance device. Total dissolved solids were measured in the feed and permeate sides using conductivity meters in each bath, manufactured in the USA by Orion 3-star. The flowrate in both sides was monitored during the process using magnetic-inductive flow meters SM 6004 in each cycle of the bench-scale loops. All data were recorded during the experimentation.
The feed was kept in a closed loop and was heated at a constant temperature (80 °C). The difference between the closed-loop feed tank temperature and insulated feed channel temperature was taken into account, which was about ±1.5 °C. Simultaneously, the temperature differences between the chiller and draw solution channels, about ±1.5 °C, were also kept in the data logger. The feed solution circulated to the shell side of a vertical up-flow module through a pulsation centrifugal pump. Instantaneously, the permeate temperature, 20 °C, was pushed into the condenser pipe via a cooling liquid circulating pump. Then, the permeate flux collector (conical flask) was measured by balance.
6. Membrane Permeability Test
Typically, the permeability test is the competence of specific materials to pass all the way through a porous membrane [
34]. Moreover, the membrane barrier plays numerous distinct roles when it goes to seep into some components, whereas it is otherwise maintained. The distilled water permeability test of one membrane module was taken out using a cross flow ultrafiltration membrane. Before the test, the membranes were soaked in distilled water for 12 h. Membranes were primarily pressurized at a 2 bar transmembrane pressure (TMP) for at least an hour. Permeability tests were performed at room temperature, which is about 28 ± 1 °C. The experimental setup of membrane permeability is also shown in
Figure 2. Pure water permeation (PWP) and the solute permeation rate (PR) of the membranes were obtained using the following equation:
where
Q is the volume flow rate of permeate (L m
−2 h
−1),
A is the effective membrane area (m
2), Δ
P is the transmembrane pressure (bar),
N is the number of fibers,
do is the outer diameter of fiber (m), and
is the effective length of fiber (m).
7. Pulsation Instruments Setup and Pulsatile Flow Setup
Within the above experimental setup, the feed pump was replaced with a 4-chamber diaphragm pump and connected to a modulated power supply instrument (TS200-0) to amplify the desired signal generated by LabVeiw; the signal tested was a simple sine wave with frequency and amplitude variation. The operating limits of the device and the pump range between one and two hertz.
The permeate water
Flux was calculated throughout the experiments by using the following equations:
where
is the weight difference, and
is the time of the experiment.
8. Results and Discussions
To evaluate the capabilities of pulsation on enhancing the flow rate and reducing the fouling effects, several experiments were conducted for this purpose. This information includes testing distilled water, followed by seawater and wastewater [
34].
9. Effect of Distilled Water Flow Rate Variation as Feed on Permeates
Pure water was used for the pre-test investigations, which were conducted under various constant and pulsating flow conditions. These preliminary tests are designed to examine the straightforward impact of increasing feed velocity on flow. Four of the six tests started on a steady flow and increased progressively. The other two tests used a pulsatile flow and ran at a frequency and amplitude of 1 Hz and 1 amplitude, while the other test used a frequency and amplitude of 2 Hz and 2 amplitudes.
Figure 4 illustrates the impact of changing the feed flow velocity from constant to pulsatile on the pulsation, as well as the effect of increasing the feed flow velocity. Compared to the steady state feed flow rate, the higher hertz and amplitudes show a higher permeation rate, even though the steady state feed flow rate is higher, which revealed that the higher hertz and amplitudes of feed flow were probably due to the turbulence phenomenon within the hollow fiber housing.
Figure 4 shows an unusual trend when the findings of the permeate flux flow efficiency analysis for intermittent and pulsed flow are compared with those obtained using constant flow. Despite having lower flow rates than 2 hertz, the low frequency of 1 hertz and 1 amplitude is nevertheless helpful in promoting the mixing of fluid at the membrane surface with the bulk. Even at off-pulse, the flux recorded for higher intermittent flow (2 Hz) is nearly twice as high as that observed for steady flow in both pulsations. The amplitude and pattern of the flow, which change when the hertz frequency is changed, were clearly seen to increase with the pulsatile approach, increasing the flow caused by shear force on the membrane surface.
10. Effect of the Velocity of the Feed on the Flux and the Fouling for Pre-Treated Intake Seawater
Table 2 summarizes all experiments and their operating modes, where the temperature is constant for the feed at 70 °C and for the permeate at 20 °C, and the area of the hollow fibers is constant. Experiments 1, 2, and 3 were carried out in pre-treated intake seawater with a TDS of 35 g/L. Three modes of steady flow were applied to that module as per the following operating conditions (the summary for all experiments is shown in
Table 2):
Operating mode 1—Exp. 1: Feed velocity 1.5 L/m and permeate velocity 0.3 L/m.
Operating mode 2—Exp. 2: Feed velocity 2.0 L/m and permeate velocity 0.8 L/m.
Operating mode 3— Exp. 3: Feed velocity 3.0 L/m and permeate velocity 0.5 L/m.
The operational parameters for the feed are shown in ascending order of feed velocity in
Figure 5. All feed velocities, distilled water for the seawater, and the overall penetrated amount show that the flux becomes stronger over time. Technically speaking, porous membranes perform better over the course of operation in terms of the rate of evaporation than hydrophobic membranes do in terms of pore volume [
34,
35,
36]. In Experiments 1 and 2, both feed flow velocities (1.5 and 2.0 L/m) may exhibit nonlinear behaviors. In the experimental setup utilized in this investigation, permeate flux did not grow linearly; instead, it approached an equilibrium rate, as seen in
Figure 5. The authors in [
4] also reported similar results, showing that lower feed flow velocities show the nonlinear behavior of permeate flux.
However, compared to Exp. 1 and Exp. 2, Exp. 3 shows more consistency and linear permeate flux velocity. It is suggested that the higher feed flow velocity somehow creates a disturbance around the boundary layers of membranes and module shells, thus resulting in higher shear stress, which decreases the effect of temperature and concentration polarizations [
37]. This might have been caused by the higher feed velocity, where the permeating flux is more sensitive to feed velocity increases, and the heat transfer among the feed and permeate (draw solution) might be a significant factor. As suggested by prior membrane research, a larger applied feed pressure may also contribute to a higher membrane resistance. The previous results in
Figure 5 comply with various other research results, such as those obtained in [
38,
39], who found that in a lower flow rate, the size of salt crystals is larger than at higher flow rates. Furthermore, after operating the module for over seven hours at various feed flow velocities, there was no visible fouling either on the membrane surface or on the capillary tube itself, as shown in
Figure 6. These results revealed that the significance of the membrane hydrophobicity phenomenon and the higher feed flow velocities in the DCMD process could be one of the reasons for the lower fouling rate, which shows the long-term stability of the MD membrane in saline solution. However, in steady-state mode using an optimal range of feed flow velocities could perhaps be beneficial for the permeate flux recovery, but for long-term operations, pumping energy and membrane lifespan or membrane stability could be deficient factors in the DCMD process.
11. Effect of Pulsating the Flow of the Feed on the Flux and the Fouling for Brine Seawater
Experiments 4, 5, and 6 were carried out in the pulsation mode, where a pulsating pump with a modulator created the pulse effect in the feed stream; three operating modes were experienced on this module as per the following aspects. Operating Mode 1 (Exp. 4): the velocity of the feed stream ranges between 1.45 and 1.94 L/min in a sinusoidal wave form, where the frequency is one hertz, and the amplitude is two.
Operating Mode 2 (Exp. 5): the velocity of the feed stream ranges between 1.71 and 1.91 L/min in a sinusoidal wave form, where the frequency is two hertz, and the amplitude is two;
Operating Mode 3 (Exp. 6): the velocity of the feed stream ranges between 1.49 and 2.08 L/min in a sinusoidal wave form, where the frequency is one hertz, and the amplitude is two.
In Exp. 4 and Exp. 5, there was more consistency and linear permeate flux velocity, which highly refers to the reduction in concentration polarization and heat transfer equilibrium among the feed and draw solutions (permeate). The rapid pulsation modes (per second) also show a linear stability of permeate flux, which can be clearly observed in
Figure 7. These results also attributed a higher and more stable Reynolds number to the feed flow stream. However, compared to Exp. 4 and Exp. 5, Exp. 6 showed not only a higher permeating flux but also higher shear stress (
Figure 7), although at a lower pulsation frequency (1 Hz), which is probably due to a higher feed. As per
Figure 8, the total permeate amount or distilled water was enhanced as well, proportionally, with the increasing turbulence in the feed stream side.
The increased pulsation frequency, amplitude, and feed flow velocity, respectively, are also credited with identifying higher vapor pressure as a result of the shear stress within the membrane boundary layer. Additionally, greater vapor pressure successfully resolves the temperature polarization problem during DCMD operation and demonstrates good agreement with better flux recovery. However, the permeate flux and heat transfer between the feed and permeate can be initiated by either a low or high pulse frequency at a larger amplitude. Additionally,
Figure 8 demonstrates that the flux is improved at higher frequencies and amplitudes [Exp. 6], coinciding with the overall feed velocity.
After more than forty hours of operating in the module used in Experiments 4, 5, and 6, the pulsating effect worked on decreasing the visible precipitations on the membrane surface and keeping the flux levels closer to the initial flux, as shown in the photos of the module in
Figure 9. Compared to
Figure 6,
Figure 9 shows much lower fouling visibility even though the seawater concentration is 1.36 times higher and 5.7 times higher in the operating conditions. The pulsation phenomenon in DCM applications signifies an improvement in the feed flow vapor pressure, which could be attributed to flux enhancement and reducing the fouling rate. By comparing the optimum operating conditions in steady-state and pulsating modes, throughout the velocity and temperature, it has been noted that pulsating reduces the temperature polarization.
12. Effect of Pulsating on the Temperature Polarization of Bulk Permeate
Temperature polarization is one of the key problems with the MD membrane, and when it comes to the bundle of hollow fibers on the MD membrane, it is quite challenging to calculate precise temperature polarization. Many scientists have predicted temperature polarization, maybe in light of the experimental study in [
40] where a series of electrical sensors were used to predict the experimental and theoretical temperature polarization of DCMD. Besides that, the majority of them demonstrated that the bulk feed and permeate solutions’ temperatures (
Tf and
Tp) varied from one another [
24,
41]. The driving force, or the vapor pressure difference (
Pf −
Pp), as well as the permeate flux through MD membranes, are both decreased as a result of the permeate side’s increased partial pressure [
24,
41]. Because it is in equilibrium with the liquid phase, a lower temperature on the feed side causes the partial vapor pressure to decrease, while a higher temperature on the permeate side causes the partial pressure to increase. The authors in [
40] reported that the effect of initial saline temperature on the hot feed stream regarding pure water productivity is more significant than that of the hot and cold feed stream velocity variations.
In this study, we have predicted the temperature polarization on the bulk permeate side, as shown in
Figure 10,
Figure 11 and
Figure 12, for the temperatures of the permeate flux in optimum steady mode and the optimum pulsating mode, respectively. The comparative results show that the temperature is more consistent in the pulsating mode, since the fluctuating temperatures range between 23.14 °C and 23.18 °C, which is only 0.04 degrees. However, the steady-state temperature, which ranges in between 24 °C and 24.5 °C, which is 0.5 degrees, is 12 times higher than the difference in the pulsating mode, which suggests nonequilibrium behavior amongst the hot stream and cold stream, resulting in a lower permeate flux rate.
The highest temperature polarization rate appears for the steady-state case, which can be observed in
Figure 10, whereas low temperature polarization is shown at the feed flow in the form of pulsation flow (
Figure 11 and
Figure 12). It can also be seen that a higher frequency leads to a significant temperature difference between the feed and permeate. Nevertheless, both observations are related to the increase in wall shear stress caused by the settlement of temperature polarizations in DCMD, as can be clearly observed in
Figure 12,
Figure 13 and
Figure 14.
The velocity pattern of the feed stream varies as well in between the steady flow and the pulsating flow, as per
Figure 12, where the velocity pattern is almost stable and steady at 2.5 L/min; on the other hand, in
Figure 13, the velocity pattern fluctuates in between 1.73 L/min and 1.9 L/min, causing a turbulent effect in the capillary tube. With the assistance of membranes loss or allowance to make a reciprocating movement of the membranes inside the capillary tube once the feed flows in a turbulent pattern, the precipitation ratio is anticipated to be reduced.
As per the sinusoidal wave graph in
Figure 14 from LabView application controlling the modulator and the pulsating pump, it is observed how the actual flow is reflected on the feed solution velocity compared with two other operating patterns in
Figure 15. The graph displays the different frequencies (Hz). It can be seen that feed flow significantly fluctuated at every pulsation flow. The change in pressure differences inside the test cell that comes along with lower temperatures and fouling polarization is probably also to blame. The maximum and minimum values are important parameters to consider as they give an indication of the transient velocity inside the test cell. Negative values for the minimum mean that there is a shear stress flow direction within one pulsation period.
Figure 16 shows the actual pulsatile flow, where the frequency is two hertz and the amplitude is two hertz. At higher hertz and amplitude,
Figure 16 revealed a significant shear stress, which is in good agreement with the reduction of fouling in the membrane.
13. Effect of Steady Flow and Pulsating Flow on the Flux and Fouling or Wastewater
Experiments 7, 8, and 9 were carried out in DCMD using hollow fiber membranes, while the feed was wastewater with contaminants; three modes of pulsation were used as per the following aspects (Summary of all experiment is shown in
Table 2):
Operating Mode 1 (Exp. 7): the velocity of the feed stream ranges between 1.84 L/min and 1.96 L/min in a sinusoidal wave form, where the frequency is two hertz, and the amplitude is two also.
Operating Mode 2 (Exp. 8): the velocity of the feed stream ranges between 1.86 L/min and 1.96 L/min in a sinusoidal wave form, where the frequency is one hertz, and the amplitude is one also.
Operating Mode 3 (Exp. 9): feed velocity 1.8 L/min and permeate velocity 0.5 L/min.
As seen in
Figure 17, for operating mode 3, the normalized flux started to decline at 400 min in the steady flow mode in Exp. 12; furthermore, in operating mode 2—Exp. 11, where the flow is pulsatile at one hertz and one amplitude, the flux started to decline after about 400 min of continuous operation. Moreover, in operating mode 3, where the flux is pulsatile at two Hertz and two amplitudes, the flux decline was mitigated even after 600 min of operating.
The total permeate product was extracted in the previously mentioned experiments, shown in
Figure 18, the optimum amount was obtained in Exp. 7, where the flux stream was turbulence, then the second largest amount was obtained in Exp. 8, where the flux was more turbulence than in Exp. 12, but there was less turbulence than in Exp. 7. Eventually, a smaller permeate amount was found in the steady flow state in Exp. 9, where the contaminants more commonly precipitate on the membrane surface and inside the capillary tube itself, as per the photo of the models in
Figure 19 at the end of Exp. 9.
The effective result, once the pulsation was used in wastewater, is compatible with previous research detailed in review articles for fouling in membrane distillation [
42,
43], and this positive effect refers to the shearing action associated with high flow rates, consequently leading to a better removal of overall scale deposits. Despite having a high percentage of pollutants and scaling materials, wastewater was also evaluated. Three operational modes were used for the experiments. A slight effect on preventing the precipitation of collected materials on the membrane surface was provided by a space or clearance between the hollow fibers of the membrane. The primary important measure in this study—the pulsatile flow—was felt. Once the feed’s velocity started to become more turbulent at two hertz and two amplitudes, the fouling was reduced, and the time to begin the flux decline was extended. Contrarily, and for a continuous flow, the buildup of substances that result in scale and fouling was more rapid and physically evident on the membranes’ surface and the module’s capillary tube.
14. Conclusions
All the trials had successful outcomes in reducing fouling and the obvious accumulations on the membrane’s surface. The experiment was run in three different flow modes in seawater, and the most efficient flux was found at a frequency and amplitude of two hertz. The pulsatile flow reduces the temperature and concentration polarization in the region where the feed and membrane interfaces reside. It turns out to improve the way that water vapor moves through the membranes’ pores. Moreover, the numerous hollow fiber membranes inside the module are not blocked by debris or slats.
Additionally, investigations were conducted using wastewater as a fouling substance in the feed. Despite the fact that the foulant is dissolved in the solution, the increased pulsatile flow resulted in a better normalized flux. It could also be referred to as the membrane surface shear force. Perhaps this force is exposed in order to remove the buildup of contaminants that would otherwise obstruct the membrane pores and the effect that pulsation has on descaling temperature polarization, which causes pollutants to become either adhered to the membrane surface or clog the membrane holes.
Future research will be absolutely necessary to examine a wider variety of feed velocity patterns, more modules, and more feed sources. Fouling reduction will benefit from optimizing the shape of the DCMD modules with regard to the feed velocity, patterns, and inlet. The onset of the flux drop may be delayed for various feed types.
Author Contributions
Methodology, H.A.; Resources, H.A.; Data curation, B.K.; Writing—original draft, H.A. and I.A.M.; Writing—review & editing, M.S.K. All authors have read and agreed to the published version of the manuscript.
Funding
The authors would like to extend their gratitude and thankfulness to the Deputyship for Research & Innovation, Ministry of Education in Saudi Arabia along with King Abdulaziz University, DSR, Jeddah, Saudi Arabia for providing funding to this research under project number IFPNC–002-135-2020.
Data Availability Statement
Not applicable.
Acknowledgments
The authors would like to extend their gratitude and thankfulness to the Deputyship for Research & Innovation, Ministry of Education in Saudi Arabia along with King Abdulaziz University, DSR, Jeddah, Saudi Arabia for providing funding to this research under project number IFPNC–002-135-2020.
Conflicts of Interest
The authors declare no conflict of interest.
References
- World Health Organization. Progress on Household Drinking Water, Sanitation and Hygiene 2000–2017; WHO/UNICEF Joint Monitoring Programme for Water Supply, Sanitation and Hygiene (JMP). 2021. Available online: https://www.who.int/publications/i/item/9789240030848 (accessed on 18 July 2023).
- Alkhudhiri, A.; Darwish, N.; Hilal, N. Membrane distillation: A comprehensive review. Desalination 2012, 287, 2–18. [Google Scholar] [CrossRef]
- Khayet, M. Membranes and theoretical modeling of membrane distillation: A review. Adv. Colloid Interface Sci. 2011, 164, 56–88. [Google Scholar] [CrossRef] [PubMed]
- Naidu, G.; Jeong, S.; Vigneswaran, S. Influence of feed/permeate velocity on scaling development in a direct contact membrane distillation. Sep. Purif. Technol. 2014, 125, 291–300. [Google Scholar] [CrossRef]
- Chen, L.; Xu, P.; Wang, H. Interplay of the factors affecting water flux and salt rejection in membrane distillation: A state-of-the-art critical review. Water 2020, 12, 2841. [Google Scholar] [CrossRef]
- Gryta, M. The potential of membrane distillation as a stand-alone desalination process. Desalination. 2008, 223, 375–385. [Google Scholar]
- Cerneaux, S.; Strużyńska, I.; Kujawski, W.M.; Persin, M.; Larbot, A. Comparison of various membrane distillation methods for desalination using hydrophobic ceramic membranes. J. Membr. Sci. 2009, 337, 55–60. [Google Scholar] [CrossRef]
- Cipollina, A.; Di Sparti, M.G.; Tamburini, A.; Micale, G. Development of a Membrane Distillation module for solar energy seawater desalination. Chem. Eng. Res. Des. 2012, 90, 2101–2121. [Google Scholar] [CrossRef]
- Abulkhair, H.A. Swirling Flow Generator for Membrane Distillation. U.S. Patent 11,247,177, 15 February 2022. [Google Scholar]
- Alklaibi, A.M. Effectiveness of Water Desalination by Membrane Distillation Process. Membranes 2012, 2, 415–429. [Google Scholar] [CrossRef]
- Kullab, A. Desalination Using Membrane Distillation: Experimental and Numerical Study. Ph.D. Thesis, KTH Royal Institute of Technology, Stockholm, Sweden, 2011. [Google Scholar]
- Zhu, H.; Wang, H.; Wang, F.; Guo, Y.; Zhang, H.; Chen, J. Preparation and properties of PTFE hollow fiber membranes for desalination through vacuum membrane distillation. J. Membr. Sci. 2013, 446, 145–153. [Google Scholar] [CrossRef]
- Moujdin, I.A. Supercoil Filtration Unit. U.S. Patent 11,305,234, 19 April 2022. [Google Scholar]
- He, F.; Sirkar, K.K.; Gilron, J. Studies on scaling of membranes in desalination by direct contact membrane distillation: CaCO3 and mixed CaCO3/CaSO4 systems. Chem. Eng. Sci. 2009, 64, 1844–1859. [Google Scholar] [CrossRef]
- Bert, R.; Manes, C.; Tiraferri, A. New Facility for Membrane Fouling Investigations under Customizable Hydrodynamics: Validation and Preliminary Experiments with Pulsating Cross-Flow. Membranes 2022, 12, 334. [Google Scholar] [CrossRef] [PubMed]
- Lawson, K.W.; Lloyd, D.R. Membrane distillation. II. Direct contact MD. J. Membr. Sci. 1996, 120, 123–133. [Google Scholar] [CrossRef]
- Hassan, A.S.; Fath, H.E.S. Review and assessment of the newly developed MD for desalination processes. Desalin. Water Treat. 2013, 51, 574–585. [Google Scholar] [CrossRef]
- Sakai, K.; Koyano, T.; Muroi, T.; Tamura, M. Effects of temperature and concentration polarization on water vapour permeability for blood in membrane distillation. Chem. Eng. J. 1988, 38, B33–B39. [Google Scholar] [CrossRef]
- He, F.; Gilron, J.; Lee, H.; Song, L.; Sirkar, K.K. Potential for scaling by sparingly soluble salts in crossflow DCMD. J. Membr. Sci. 2008, 311, 68–80. [Google Scholar] [CrossRef]
- Laqbaqbi, M.; Sanmartino, J.A.; Khayet, M.; García-Payo, C.; Chaouch, M. Fouling in Membrane Distillation, Osmotic Distillation and Osmotic Membrane Distillation. Appl. Sci. 2017, 7, 334. [Google Scholar] [CrossRef]
- Gostoli, C.; Sarti, G.; Matulli, S. Low temperature distillation through hydrophobic membranes. Sep. Sci. Technol. 1987, 22, 855–872. [Google Scholar] [CrossRef]
- Sarti, G.; Gostoli, C.; Matulli, S. Low energy cost desalination processes using hydrophobic membranes. Desalination 1985, 56, 277–286. [Google Scholar] [CrossRef]
- Drioli, E.; Calabro, V.; Wu, Y. Microporous membranes in membrane distillation. Pure Appl. Chem. 1986, 58, 1657–1662. [Google Scholar] [CrossRef]
- Suleman, M.; Asif, M.; Jamal, S.A. Temperature and concentration polarization in membrane distillation: A technical review. Desalin Water Treat 2021, 229, 52–68. [Google Scholar] [CrossRef]
- Yang, X.; Wang, R.; Shi, L.; Fane, A.G.; Debowski, M. Performance improvement of PVDF hollow fiber-based membrane distillation process. J. Membr. Sci. 2011, 369, 437–447. [Google Scholar] [CrossRef]
- Maab, H.; Francis, L.; Al-Saadi, A.; Aubry, C.; Ghaffour, N.; Amy, G.; Nunes, S.P. Synthesis and fabrication of nanostructured hydrophobic polyazole membranes for low-energy water recovery. J. Membr. Sci. 2012, 423, 11–19. [Google Scholar] [CrossRef]
- Rezaei, M.; Alsaati, A.; Warsinger, D.M.; Hell, F.; Samhaber, W.M. Long-Running Comparison of Feed-Water Scaling in Membrane Distillation. Membranes 2020, 10, 173. [Google Scholar] [CrossRef] [PubMed]
- Curcio, E.; Ji, X.; Di Profio, G.; Sulaiman, A.O.; Fontananova, E.; Drioli, E. Membrane distillation operated at high seawater concentration factors: Role of the membrane on CaCO3 scaling in presence of humic acid. J. Membr. Sci. 2010, 346, 263–269. [Google Scholar] [CrossRef]
- Krivorot, M. Factors affecting biofilm formation and biofouling in membrane distillation of seawater. J. Membr. Sci. 2011, 376, 15–24. [Google Scholar] [CrossRef]
- Zhang, F.; Hou, W.; Yang, Z.; Wang, Z.; Chen, R.; Drioli, E.; Wang, X.; Cui, Z. Treatment of Aniline Wastewater by Membrane Distillation and Crystallization. Membranes 2023, 13, 561. [Google Scholar] [CrossRef]
- COMPANY CHRONOLOGY (HOME|ECONITY|COMPANY CHRONOLOGY): ECONITY. Available online: http://econity.com/en/econity/history.html (accessed on 11 April 2023).
- Ahmed, I.; Idris, A.; Noordin, M.Y.; Rajput, R. High performance ultrafiltration membranes prepared by the application of modified microwave irradiation technique. Ind. Eng. Chem. Res. 2011, 50, 2272–2283. [Google Scholar] [CrossRef]
- Hejazi, M.-A.A.; Bamaga, O.A.; Al-Beirutty, M.H.; Gzara, L.; Abulkhair, H. Effect of intermittent operation on performance of a solar-powered membrane distillation system. Sep. Purif. Technol. 2019, 220, 300–308. [Google Scholar] [CrossRef]
- Ali, I.; Bamaga, O.A.; Gzara, L.; Bassyouni, M.; Abdel-Aziz, M.; Soliman, M.; Drioli, E.; Albeirutty, M. Assessment of blend PVDF membranes, and the effect of polymer concentration and blend composition. Membranes 2018, 8, 13. [Google Scholar] [CrossRef]
- Ji, G.-L.; Zhu, L.-P.; Zhu, B.-K.; Zhang, C.-F.; Xu, Y.-Y. Structure formation and characterization of PVDF hollow fiber membrane prepared via TIPS with diluent mixture. J. Membr. Sci. 2008, 319, 264–270. [Google Scholar] [CrossRef]
- Yun, Y.; Ma, R.; Zhang, W.; Fane, A.; Li, J. Direct contact membrane distillation mechanism for high concentration NaCl solutions. Desalination 2006, 188, 251–262. [Google Scholar] [CrossRef]
- Mubashir, M.; Yeong, Y.F.; Lau, K.K. Ultrasonic-assisted secondary growth of deca-dodecasil 3 rhombohedral (DD3R) membrane and its process optimization studies in CO2/CH4 separation using response surface methodology. J. Nat. Gas Sci. Eng. 2016, 30, 50–63. [Google Scholar] [CrossRef]
- Gryta, M. Alkaline scaling in the membrane distillation process. Desalination 2008, 228, 128–134. [Google Scholar] [CrossRef]
- Hoek, E.M.; Elimelech, M. Cake-enhanced concentration polarization: A new fouling mechanism for salt-rejecting membranes. Environ. Sci. Technol. 2003, 37, 5581–5588. [Google Scholar] [CrossRef] [PubMed]
- Ho, C.; Yang, T.; Wang, B. Modeling of Conjugated Heat Transfer in Direct-Contact Membrane Distillation of Seawater Desalination Systems. Chem. Eng. Technol. 2012, 35, 1765–1776. [Google Scholar] [CrossRef]
- Dittscher, U.; Woermann, D.; Wiedner, G. Temperature polarization in membrane distillation of water using a porous hydrophobic membrane. Berichte der Bunsengesellschaft für physikalische Chemie 1994, 98, 1056–1061. [Google Scholar] [CrossRef]
- Warsinger, D.M.; Swaminathan, J.; Guillen-Burrieza, E.; Arafat, H.A. Scaling and fouling in membrane distillation for desalination applications: A review. Desalination 2015, 356, 294–313. [Google Scholar] [CrossRef]
- Rajwade, K.; Barrios, A.C.; Garcia-Segura, S.; Perreault, F. Pore wetting in membrane distillation treatment of municipal wastewater desalination brine and its mitigation by foam fractionation. Chemosphere 2020, 257, 127214. [Google Scholar] [CrossRef]
Figure 1.
Photo image of PVDF membranes module for DCMD.
Figure 1.
Photo image of PVDF membranes module for DCMD.
Figure 2.
Experimental setup of bench scale DCMD unit.
Figure 2.
Experimental setup of bench scale DCMD unit.
Figure 3.
A comprehensive schematic layout of DCMD experimental setup used in this study. The red color line shows the hot feed in and feed out (conc. feed); the green shows the permeate in (draw solution), and permeate out (permeate flux)
Figure 3.
A comprehensive schematic layout of DCMD experimental setup used in this study. The red color line shows the hot feed in and feed out (conc. feed); the green shows the permeate in (draw solution), and permeate out (permeate flux)
Figure 4.
Variation in the permeating flux at different feed flow rates and a constant permeate flow rate of 0.5 L/min for distilled water.
Figure 4.
Variation in the permeating flux at different feed flow rates and a constant permeate flow rate of 0.5 L/min for distilled water.
Figure 5.
Variation in flux at different velocities for the feed and permeate for the feed of seawater 35 g/L.
Figure 5.
Variation in flux at different velocities for the feed and permeate for the feed of seawater 35 g/L.
Figure 6.
Module number 1 after seven hours of operating in seawater; no fouling was observed on the module or the membranes where the flux did not decline.
Figure 6.
Module number 1 after seven hours of operating in seawater; no fouling was observed on the module or the membranes where the flux did not decline.
Figure 7.
Variation in flux at different pulsatile flow patterns for the feed and constant permeate velocity for the feed of seawater 51 g/L.
Figure 7.
Variation in flux at different pulsatile flow patterns for the feed and constant permeate velocity for the feed of seawater 51 g/L.
Figure 8.
The amount of produced water for Exp. 4, Exp. 5, and Exp. 6 in one hour for seawater with a concentration of 51 g/L.
Figure 8.
The amount of produced water for Exp. 4, Exp. 5, and Exp. 6 in one hour for seawater with a concentration of 51 g/L.
Figure 9.
The photo shows module 2 which was used in Experiments 4, 5, and 6, and after over 40 h of operating, no visible precipitations were stuck either on the membrane surface or on the transparent capillary tube containing the membranes.
Figure 9.
The photo shows module 2 which was used in Experiments 4, 5, and 6, and after over 40 h of operating, no visible precipitations were stuck either on the membrane surface or on the transparent capillary tube containing the membranes.
Figure 10.
Temperature of the outlet permeates distilled water for thirty minutes in the optimum steady flow mode in Experiment 3.
Figure 10.
Temperature of the outlet permeates distilled water for thirty minutes in the optimum steady flow mode in Experiment 3.
Figure 11.
Temperature of the outlet permeate distilled water for thirty minutes in the optimum pulsating mode in Experiment 6.
Figure 11.
Temperature of the outlet permeate distilled water for thirty minutes in the optimum pulsating mode in Experiment 6.
Figure 12.
Temperature of the outlet permeate distilled water for twenty minutes in the optimum pulsating mode in Experiment 6.
Figure 12.
Temperature of the outlet permeate distilled water for twenty minutes in the optimum pulsating mode in Experiment 6.
Figure 13.
The velocity pattern in steady flow operating condition for Exp. 3.
Figure 13.
The velocity pattern in steady flow operating condition for Exp. 3.
Figure 14.
The velocity pattern for pulsating flow operating condition in Exp. 6.
Figure 14.
The velocity pattern for pulsating flow operating condition in Exp. 6.
Figure 15.
A graph was extruded from the LabView program controlling the pulsation pump and modulator; the setting was setup on the sine wave and frequency of one hertz and two amplitude.
Figure 15.
A graph was extruded from the LabView program controlling the pulsation pump and modulator; the setting was setup on the sine wave and frequency of one hertz and two amplitude.
Figure 16.
Actual pulsatile flow, where the frequency is two hertz, and the amplitude is two hertz.
Figure 16.
Actual pulsatile flow, where the frequency is two hertz, and the amplitude is two hertz.
Figure 17.
Variation in normalized flux at different velocities for the feed and permeate for the feed of wastewater.
Figure 17.
Variation in normalized flux at different velocities for the feed and permeate for the feed of wastewater.
Figure 18.
The amount of water produced in Exp. 10, Exp. 11, and Exp. 12 in one hour for the feed of wastewater.
Figure 18.
The amount of water produced in Exp. 10, Exp. 11, and Exp. 12 in one hour for the feed of wastewater.
Figure 19.
A photo of the capillary tube and the membrane itself inside the capillary tube. The contaminants precipitate on both the transparent module and on the hollow fiber membranes.
Figure 19.
A photo of the capillary tube and the membrane itself inside the capillary tube. The contaminants precipitate on both the transparent module and on the hollow fiber membranes.
Table 1.
Details characterization of the hollow fiber membranes and housing.
Table 1.
Details characterization of the hollow fiber membranes and housing.
| Membrane Characteristics | Descriptions |
|---|
| Mean pore size (µm) | 0.1 |
| The material of membrane | PVDF membranes |
| Tensile strength of the membrane (Mega Pascal) | 14.2 |
| Porosity of the membrane | 80% |
| of hollow fibers (number) | 12 pieces |
| Elongation ratio% | 70% |
| Nominal outer diameter of the fiber (cm) | 0.12 |
| Nominal inner diameter of the fiber (cm) | 0.075 |
| Effective module length (cm) | 20 |
| Module diameter (cm) | 1.2 |
| Membrane area (m²) | 0.0090432 |
| Hollow fiber Housing Characterization |
| Transparent housing material | Acrylic |
| Acrylic pipe external diameter (cm) | 2 |
| Acrylic pipe internal diameter (cm) | 1.5 |
| Fitting materials | UPVC |
| Potting material | PVA |
Table 2.
Summary for all experiments and their operating mode, where the temperature is constant for the feed at 70 °C and for the permeate at 20 °C, and the area of the hollow fibers is constant.
Table 2.
Summary for all experiments and their operating mode, where the temperature is constant for the feed at 70 °C and for the permeate at 20 °C, and the area of the hollow fibers is constant.
| Exp. No. | Feed Type | Feed Velocity Pattern |
|---|
| Exp. 1 | Seawater | Steady (L/min): feed: 1.5, permeate: 0.3 |
| Exp. 2 | Seawater | Steady (L/min): feed: 2.0, permeate: 0.8 |
| Exp. 3 | Seawater | Steady (L/min): feed: 3.0, permeate: 0.5 |
| Exp. 4 | Seawater | Pulsatile: 1 hertz and 2 amplitude |
| Exp. 5 | Seawater | Pulsatile: 2 hertz and 2 amplitude |
| Exp. 6 | Seawater | Pulsatile: 1 hertz and 2 amplitude |
| Exp. 7 | Wastewater | Pulsatile: 2 hertz and 2 amplitude |
| Exp. 8 | Wastewater | Pulsatile: 1 hertz and 1 amplitude |
| Exp. 9 | Wastewater | Steady (L/min): feed: 1.8, permeate: 0.5 |
| Disclaimer/Publisher’s Note: The statements, opinions and data contained in all publications are solely those of the individual author(s) and contributor(s) and not of MDPI and/or the editor(s). MDPI and/or the editor(s) disclaim responsibility for any injury to people or property resulting from any ideas, methods, instructions or products referred to in the content. |
© 2023 by the authors. Licensee MDPI, Basel, Switzerland. This article is an open access article distributed under the terms and conditions of the Creative Commons Attribution (CC BY) license (https://creativecommons.org/licenses/by/4.0/).


