Article

Generation of Hydrogen Peroxide and Phenolic Content in Plant-Material-Based Beverages and Spices

1
Laboratory of Analytical Biochemistry, Institute of Food Technology and Nutrition, College of Natural Sciences, University of Rzeszow, 35-601 Rzeszow, Poland
2
Department of Bioenergetics, Food Analysis and Microbiology, Institute of Food Technology and Nutrition, College of Natural Sciences, University of Rzeszow, 35-601 Rzeszow, Poland
*
Author to whom correspondence should be addressed.
Processes 2024, 12(1), 166; https://doi.org/10.3390/pr12010166
Submission received: 10 November 2023 / Revised: 4 January 2024 / Accepted: 8 January 2024 / Published: 10 January 2024

Abstract

:
Phenolics are the main components of plant extracts contributing to their antioxidant activity. However, they autoxidize, generating hydrogen peroxide. This study aimed to examine the correlation between the phenolic content, total antioxidant capacity (TAC), and the amount of H2O2 generated in extracts of 18 various plant materials. A significant correlation was found between the phenolic content and TAC measured by ABTS decolorization, CUPRAC, FRAP, and DPPH decolorization methods (correlation coefficients r of 0.94, 0.93, 0.90, and 0.78, respectively). However, the correlation between the phenolic content and H2O2 amount generated upon brewing (r = 0.25) and after 1 h incubation (r = −0.37) was low or negative. The correlation between the phenolic content and the change of H2O2 concentration during 1 h incubation of the extracts was negative (r = −0.61). Examination of three phenolics (pyrogallol, gallic acid, and quercetin) showed that all compounds generate but also scavenge H2O2. Therefore, the H2O2 concentrations in phenolic-containing extracts represent net results of the rates of generation and scavenging of H2O2, which may differ depending on the composition of phenolics in the extracts, do not always increase with the increase in time and concentration of phenolics, and cannot serve as an index of the phenolic content.

1. Introduction

It has been demonstrated that beverages based on plant-derived material which are rich in polyphenols, such as tea and coffee, generate hydrogen peroxide, especially during long standing [1,2,3,4,5,6,7]. Hydrogen peroxide concentrations reaching 700 μM were reported in black tea 12 h after brewing [2]. We have reported the generation of hydrogen peroxide in such polyphenol-containing products as wine [8], cooked vegetables [9,10], as well as infusions of medicinal herbs [11]. Non-enzymatic autoxidation of polyphenols contributes to the generation of hydrogen peroxide in honey and thus to the antibacterial activity of honey [12].
Phenolic compounds are excellent antioxidants, scavenging reactive oxygen and nitrogen species [13,14,15], being the main contributors to the antioxidant capacity of plant-based food and beverages [16,17,18]. However, their reactivity with oxidants makes them susceptible to oxidation, including “autoxidation”, i.e., oxidation in contact with oxygen, especially in the presence of trace amounts of transition metal ions such as Fe(II) or Cu(I) acting as catalysts [12]. This property of phenolic compounds is not too important inside the cells, where oxygen concentration is lower than in the atmosphere, the environment is reducing, and primary products of oxidation can be reduced by other intracellular antioxidants [19,20]; nevertheless, this protection is lost and autoxidation commences when phenolic compounds in plant extracts or lifeless plant material contact atmospheric oxygen. The proposed mechanism of autoxidation of polyphenolic compounds QH2 assumes the occurrence of a two-step reaction. The first step consists in the formation of a semiquinone radical HQ, while the second results in the formation of a quinone Q. Superoxide radical anions formed in these reactions either dismutate to form oxygen and hydrogen peroxide or oxidize available substrates, being themselves reduced to H2O2. Thus, the main reason for the generation of hydrogen peroxide in plant-based beverages is the autoxidation of phenolics present in these beverages [21,22,23].
The occurrence of phenol autoxidation, accelerated at high temperatures during brewing tea, coffee, or herbal infusions, provokes a question of whether the generation of hydrogen peroxide may be an index of the content of phenolic compound and the anti-oxidant capacity of phenolic-rich materials. However, the situation may be not so simple, since polyphenols are also known to react with hydrogen peroxide. Treatment with hydrogen peroxide and peroxidase was proposed to detoxify phenol, 2-methylphenol, and chlorinated phenol derivatives [24]. Hydrotyrosol, a polyphenol from olive oil, was found to react with hydrogen peroxide but not superoxide [25]. It was demonstrated that polyphenols such as hydroquinone, quercetin, piceatannol, and resveratrol can exert an antioxidant effect in the skin by reacting with hydrogen peroxide [26]. In an aqueous peppermint extract, eriocitrin showed the highest H2O2-scavenging activity followed by rosmarinic acid, while hesperidin showed a low scavenging activity, and diosmin, narirutin, and isorhoifolin exhibited almost no H2O2-scavenging activity [27]. Phenolic acids, especially gallic acid and pyrogallol, were also found to react with hydrogen peroxide [28]. Benzoate derivatives were much stronger H2O2 scavengers than cinnamic acids [29]. Among benzoic acid derivatives, vanillic acid (3-hydroxy-4-methoxybenzoic acid) was found to be the most efficient H2O2 scavenger with its hydrogen peroxide scavenging activity of 170.2 μM−1, whereas protocatechuic acid (3,4-dihydroxybenzoic acid) exhibited the weakest activity (5.90 μM−1) [30]. In another study, from among six phenolic acids, caffeic acid was found to be the most efficient H2O2 scavenger with its H2O2-scavenging activity of 125 × 10−3 μM−1, while trans-cinnamic acid exhibited the weakest activity (0.73 × 10⁻³ μM−1). In that study, the H2O2-scavenging activity of various herbal extracts was estimated, with black and green tea showing activities of about 1.1 × 10⁵ mL/g and 1.3 × 10⁵ mL/g, respectively [31]. The hydrogen peroxide-scavenging activity of infusions of Rosa canina L. was also reported [32]. Thus, the behavior of various phenolics is different both concerning the rate of generation and the rate of scavenging of hydrogen peroxide, and it was concluded in earlier studies that several of the beverages commonly drunk by humans show a complex mixture of anti- and pro-oxidant abilities [4].
This study was thus aimed at answering the question whether or not the generation of hydrogen peroxide in extracts of diverse plant materials may be an index of their content of phenolics on the basis of analysis of 18 extracts of various nature (coffee, tea, cocoa, extracts of medicinal plants and spices).

2. Materials and Methods

2.1. Reagents, Materials and Equipment

Acetic acid (CAS no. 64-19-7, catalog no. 425687339, 80%), hydrochloric acid (CAS no. 7647-01-0, cat. no. 115752837, 35–38%), hydrogen peroxide (CAS no 7722-84-1, cat. no. 118851934, 30%), perchloric acid (CAS no. 7601-90-3, cat. no. 115649402, 60%), and Tris base (CAS no. 77-86-1, cat. no. 118534707, purity ≥ 99%) were purchased from Chempur (Piekary Śląskie, Poland). 2,4,6-Tri-(2-pyridyl)-s-triazine (TPTZ) (CAS no. 3682-35-7, cat. no. 93285, purity ≥ 99%) was supplied by FLUKA—Merck (Poznań, Poland). Copper (II) sulfate pentahydrate (CAS no 7758-99-8, cat. no. 658310422, purity ≥ 98%), ethanol (CAS no. 64-17-5, cat. no. 396480111, purity ≥ 99%), sodium acetate anhydrous (CAS no. 127-09-3, cat. no. BN60/6191, purity ≥ 99%), and Xylenol Orange (CAS no 3618-43-7, cat. no. 704590231, purity ≤ 100%) were obtained from Avantor Performance Materials (Gliwice, Poland). Catalase (CAS no. 9001-05-2, cat. no. C40, ≥ 10,000 units/mg protein), dimethyl sulfoxide (DMSO) (CAS no. 67-68-5, cat. no. D2438, anhydrous, ≥99.9%), 2,2-diphenyl-1-picrylhydrazyl (DPPH) (CAS no. 1898-66-4, cat. no. D9132, purity ≤ 100%), ferric chloride hexahydrate (CAS no. 10025-77-1, cat. no. 236489, purity ≥ 97%), (±)-6-hydroxy-2,5,7,8-tetramethylchromane-2-carboxylic acid (Trolox; CAS no. 53188-07-1, cat. no. 238813, purity ≥ 97%), gallic acid (CAS no. 149-91-7; cat. no. G7384; purity 97.5-102.5% (titration), Mohr’s salt (CAS no. 7783-85-9, cat. no. 203505, purity ≥ 99,997%), neocuproine (CAS no. 484-11-7, cat. no. N1501, purity ≥ 98%), phosphate-buffered saline (PBS) (cat. no. PBS404.200), potassium persulfate (CAS no. 7727-21-1, cat. no. 379824, purity 99.99%), pyrogallol (CAS no. 87-66-1, cat. no. P0381, purity ≥ 98%), and quercetin (CAS no. 117-39-5, cat. no. Q4951, purity ≥ 95%) were provided by Merck (Poznań, Poland). 2,2′-Azino-bis-(3-ethylobenzthiazoline-6-sulfonic acid) (ABTS; CAS no. 504-14-6, cat. no. 10102946001, purity ≥ 99%) was purchased from Roche (Warsaw, Poland).
The products analyzed (white, green, black, and red tea, rooibos, yerba mate, Tchibo and Brazil coffee, cocoa, herbs of rosemary and thyme, and spices (allspice, chili, green and black pepper, caraway seeds, and coriander) were purchased in local stores in Rzeszów as commercially available products.
Distilled water was purified using a Milli-Q system (Millipore, Bedford, MA, USA). Transparent flat-bottom 96-well plates used for the assays were obtained from (Greiner, Kremsmünster, Austria; cat. no. 655101). Absorbance was measured in a Spark multimode plate reader (Tecan Group Ltd., Männedorf, Switzerland).

2.2. Extracts and Solutions

The material was crushed in a mortar and 250 mg of the dry powdered material was treated with 25 mL of hot tap water, to mimic the conditions commonly used for the preparation of infusions. After 10 min, the infusions were centrifuged (3000× g, 10 min) and aliquots of the supernatants were withdrawn for the assay of the concentration of hydrogen peroxide, the concentration of phenolics, and antioxidant capacity.

2.3. Estimation of the Phenolic Content

The content of phenolic compounds was estimated using the Folin–Ciocalteu reagent [33]. Gallic acid was used as a standard and the results were expressed in gallic acid equivalents (GAE).

2.4. Estimation of Antioxidant Capacity

The antioxidant capacity of infusions was estimated by the ABTS decolorization, DPPH decolorization, FRAP, and CUPRAC methods.
The ABTS decolorization assay developed by Re et al. [34] in a slight modification [35] was used. Briefly, the stock ABTS solution was prepared by overnight oxidation of ABTS with potassium persulfate. Aliquots of the infusions or a Trolox solution were added to wells of a 96-well plate containing 200 μL of ABTS solution diluted with PBS to provide absorbance of 1.0 at 734 nm in a plate reader. The decrease in absorbance was read after 30-min incubation at ambient temperature.
The DPPH decolorization assay was performed by adding various amounts of the infusions or a Trolox solution to 200 µL of 0.3 mM 2,2-diphenyl-1-picrylhydrazyl (DPPH) solution in methanol, incubating in the dark at ambient temperature for 30 min, and measuring the decrease in absorbance at 517 nm.
For the FRAP assay, a slightly modified procedure of Benzie and Strain [36] was used. In brief, increasing volumes of the infusions or a Trolox solution were pipetted to wells of a 96-well plate containing 200 μL of the working solution. The working solution was freshly prepared by mixing one volume of 20 mM FeCl3, one volume of 10 mM TPTZ in 40 mM HCl, and ten volumes of 0.3 M acetate buffer, pH 3.6. After 30-min incubation at ambient temperature, absorbance was measured at 593 nm against a reagent blank.
For the CUPRAC assay, the procedure of Özyürek et al. [37] was used in a small modification. Briefly, 50 μL of 50 mM Tris-HCl buffer, pH 7.0, were mixed with 50 μL of 10 mM CuSO4, 50 μL of 7.5 mM neocuproine solution in ethanol, and various amounts of a sample or a Trolox solution, plus PBS to complete the sample volume to 50 μL in wells of a 96-well plate. After thorough mixing, the plate was incubated at room temperature for 60 min, and the absorbance of the samples was measured at 450 nm against a reagent blank.
Antioxidant activity was related to Trolox and expressed in Trolox equivalents (TE).

2.5. Generation and Scavenging of Hydrogen Peroxide

Generation of hydrogen peroxide by extract of plant materials compounds was studied at “zero time” (i.e., about 15 min after the contact of the material with boiling water) and after subsequent incubation for 1 h. Gallic acid and pyrogallol were dissolved in phosphate-buffered saline (PBS) to stabilize the pH. The stock solution of quercetin (100 mM) was made in DMSO and diluted in PBS. Generation of H2O2 by individual polyphenols (gallic acid, pyrogallol, and quercetin, 0.5, 1, 2, and 5 mM) was studied at “zero time” (i.e., about 5–7 min after pouring the substances with water) and after incubations of their solutions for 1, 2, and 3 h at room temperature. The scavenging of hydrogen peroxide by phenolics was studied by incubating 5–50 μM hydrogen peroxide with these polyphenols at various concentrations and assaying the concentration of H2O2 in the samples.
Hydrogen peroxide concentration was determined by the Xylenol Orange peroxide assay [38] using catalase to provide specificity for hydrogen peroxide [11]. Briefly, the infusion (180 µL) was added to two wells of a 96-well plate. One well was added with 2 µL of water and another with 2 µL of a 1 mg/mL catalase solution. After 15 min incubation, 20.2 µL of the Xylenol Orange Reagent (2.5 mM Xylenol Orange and 2.5 mM Mohr salt in 1.1 M perchloric acid) was added to both wells, and after 30 min incubation, absorbance was read at 560 nm. The difference in absorbance between the sample not treated with catalase and the catalase-treated sample was used as a measure of the concentration of hydrogen peroxide. The amount of catalase used was found to be sufficient for the full decomposition of 1 mM hydrogen peroxide present in a 200-µL sample during 15 min. The concentration of hydrogen peroxide was calculated using a calibration curve.
Alternatively, when studying solutions of individual polyphenols, in which the initial absorbance of the solutions was not so variable, hydrogen peroxide was assayed using the reagent blank procedure. In this procedure, absorbance produced by a sample reacted with a blank reagent containing the Mohr salt and perchloric acid, but no Xylenol Orange, was subtracted from the value obtained for a sample studied to correct for the own absorbance of the examined material [11].

2.6. Statistical Analysis

The results are shown as mean values ± standard deviation from at least three independent experiments. The statistical significance of differences was evaluated using ANOVA with the post-hoc Fisher LSD test, assuming the borderline of statistical significance of 0.05. The statistical significance of correlation coefficients was estimated with the Student’s “t” test. Statistical analysis of the data was performed using the STATISTICA software package (version 13.1, StatSoft Inc., 2016, Tulsa, OK, USA).

3. Results

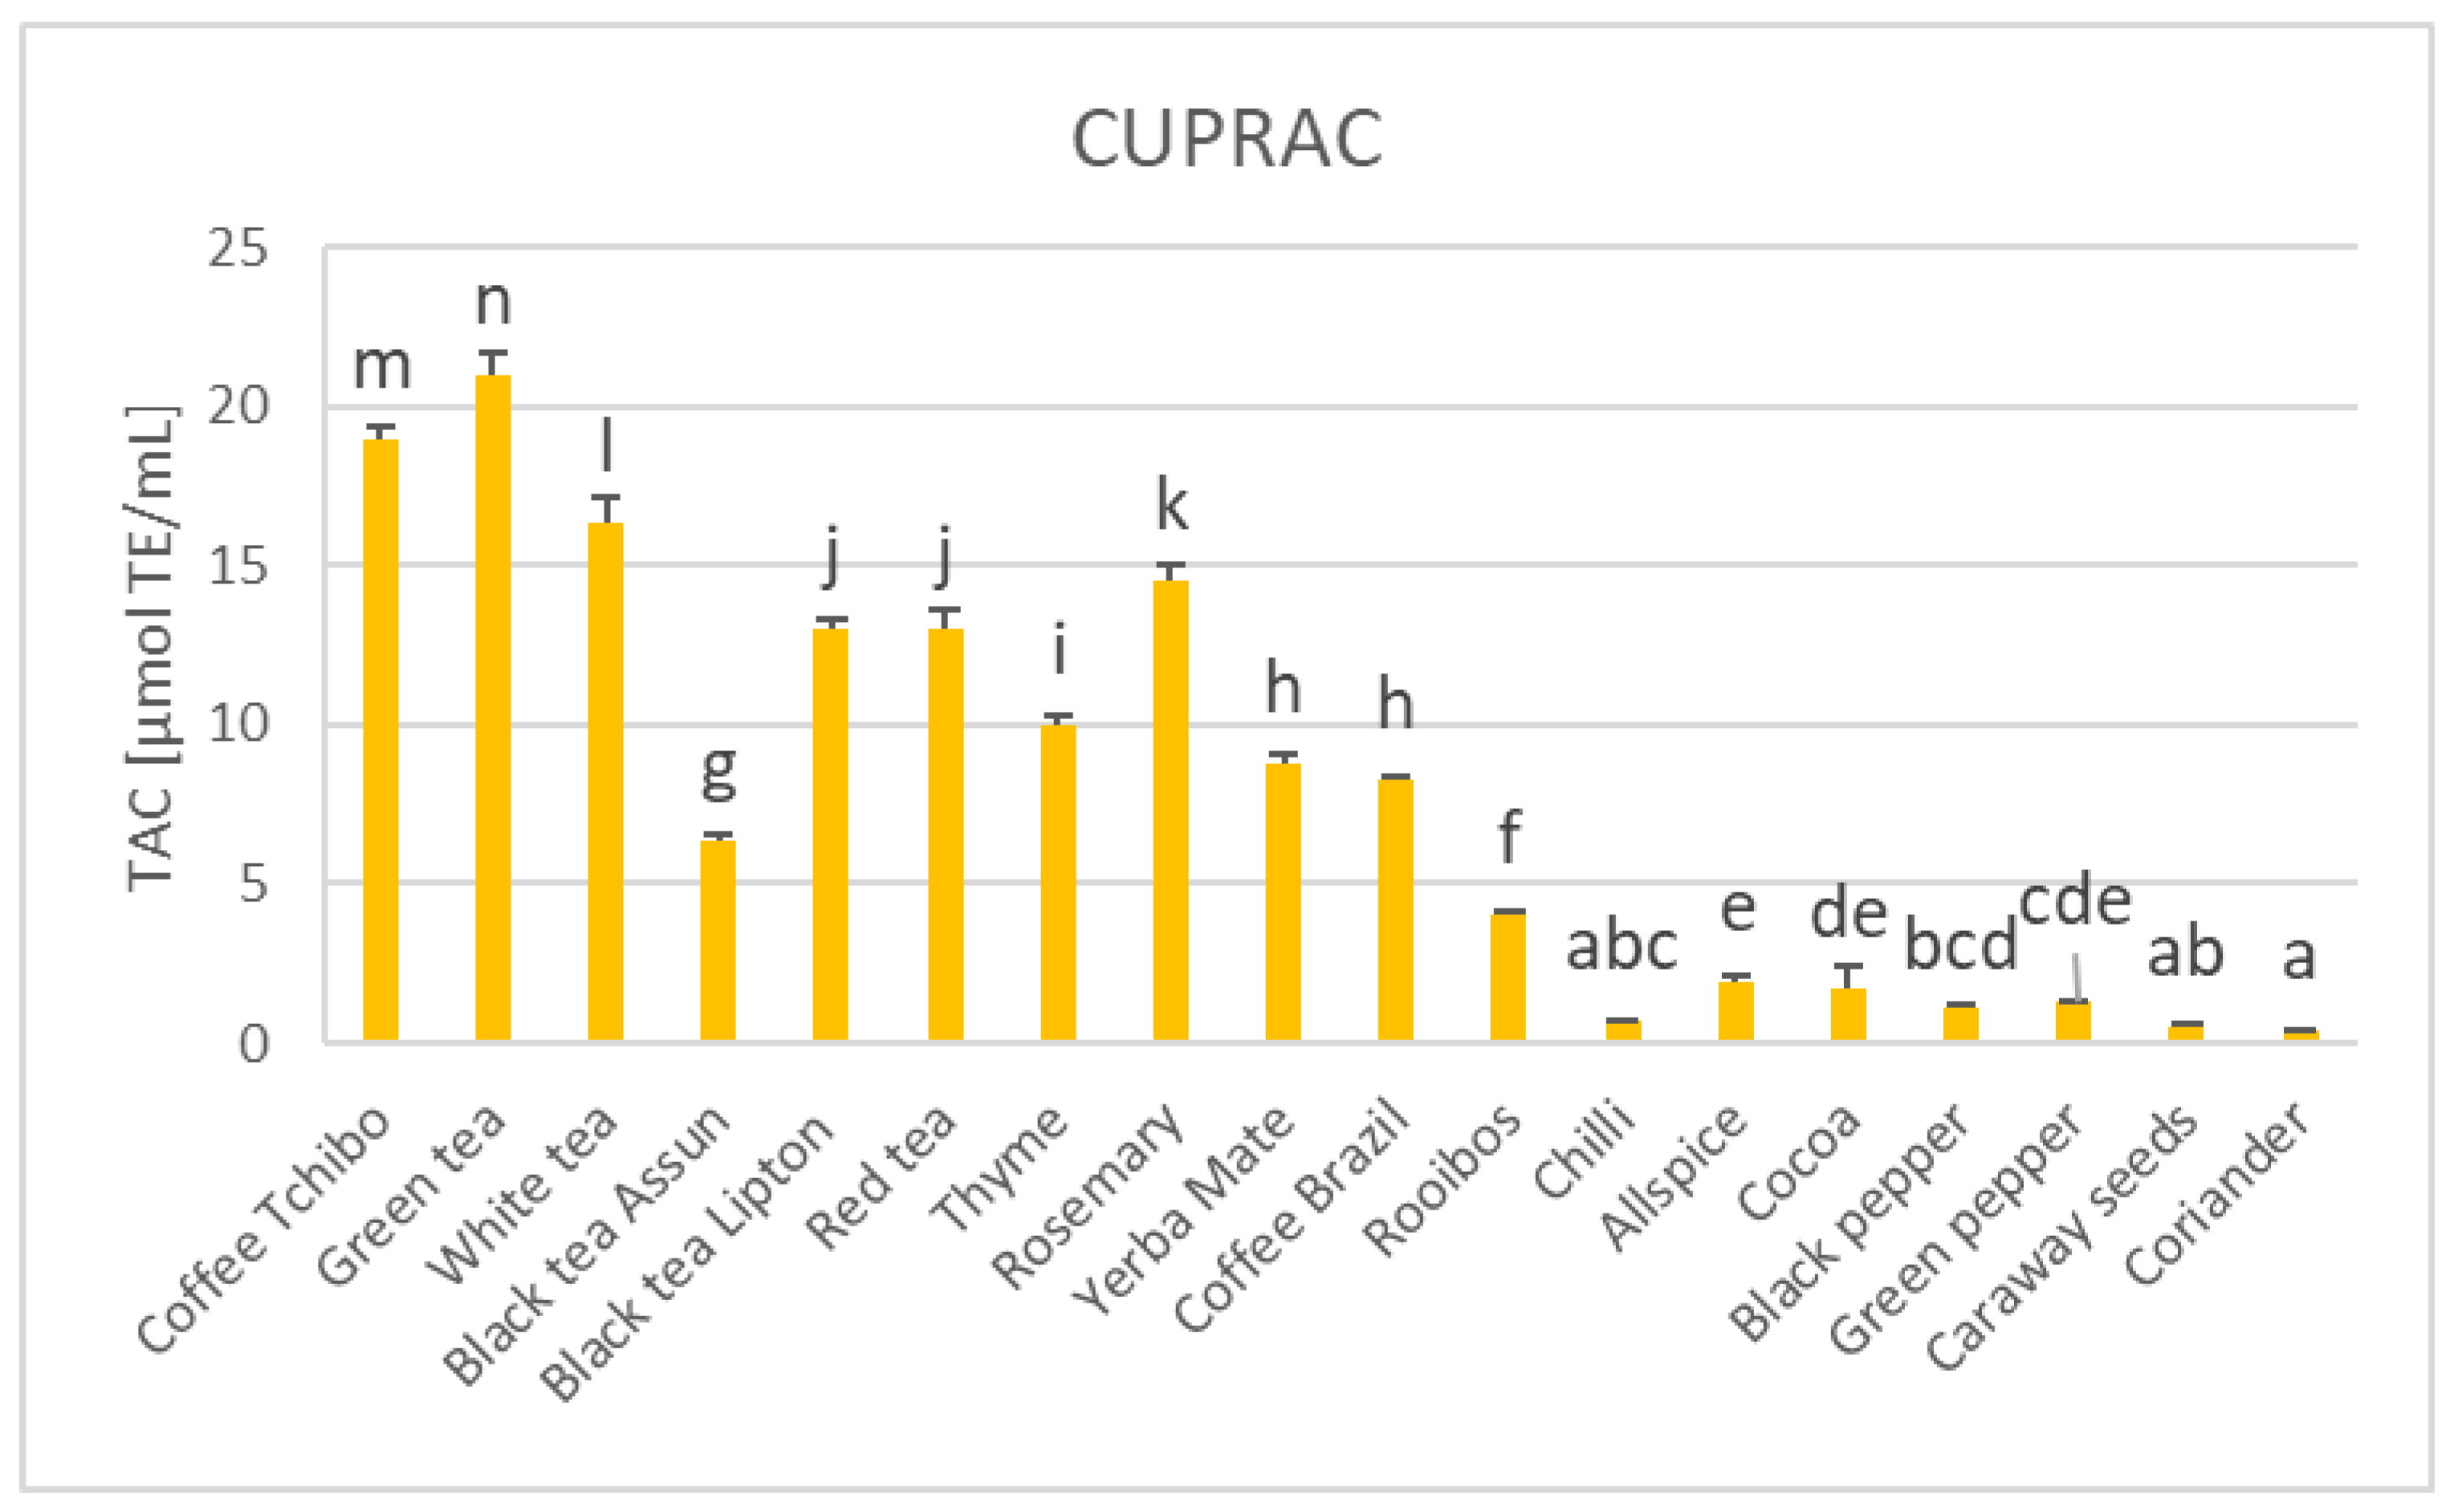
Teas, rooibos, yerba mate, coffees, cocoa, infusions of rosemary and thyme, and extracts of spices (allspice, chili, green and black pepper, caraway seeds, and coriander) were studied. The concentration of phenolics in the infusions showed a considerable variation, from 17.8 ± 1.3 μg GAE/mL (yerba mate) to 1019.3 ± 4.0 μg GAE/mL (Tchibo coffee). Similar variation was found for values of total antioxidant capacity (TAC) estimated by various methods. TAC estimated by ABTS decolorization ranged from 0.3 (coriander) to 23.1 (white tea) μmol TE/mL. TAC assayed by DPPH decolorization varied from 0.06 μmol TE/mL (coriander) to 3.6 μmol TE/mL (black tea), TAC assayed by FRAP from 0.1 μmol TE/mL (coriander) to 7.1 μmol TE/mL (Brazil coffee), and TAC estimated by the CUPRAC method from 0.4 μmol TE/mL (coriander) to 21.0 μmol TE/mL (green tea) (Figure 1).
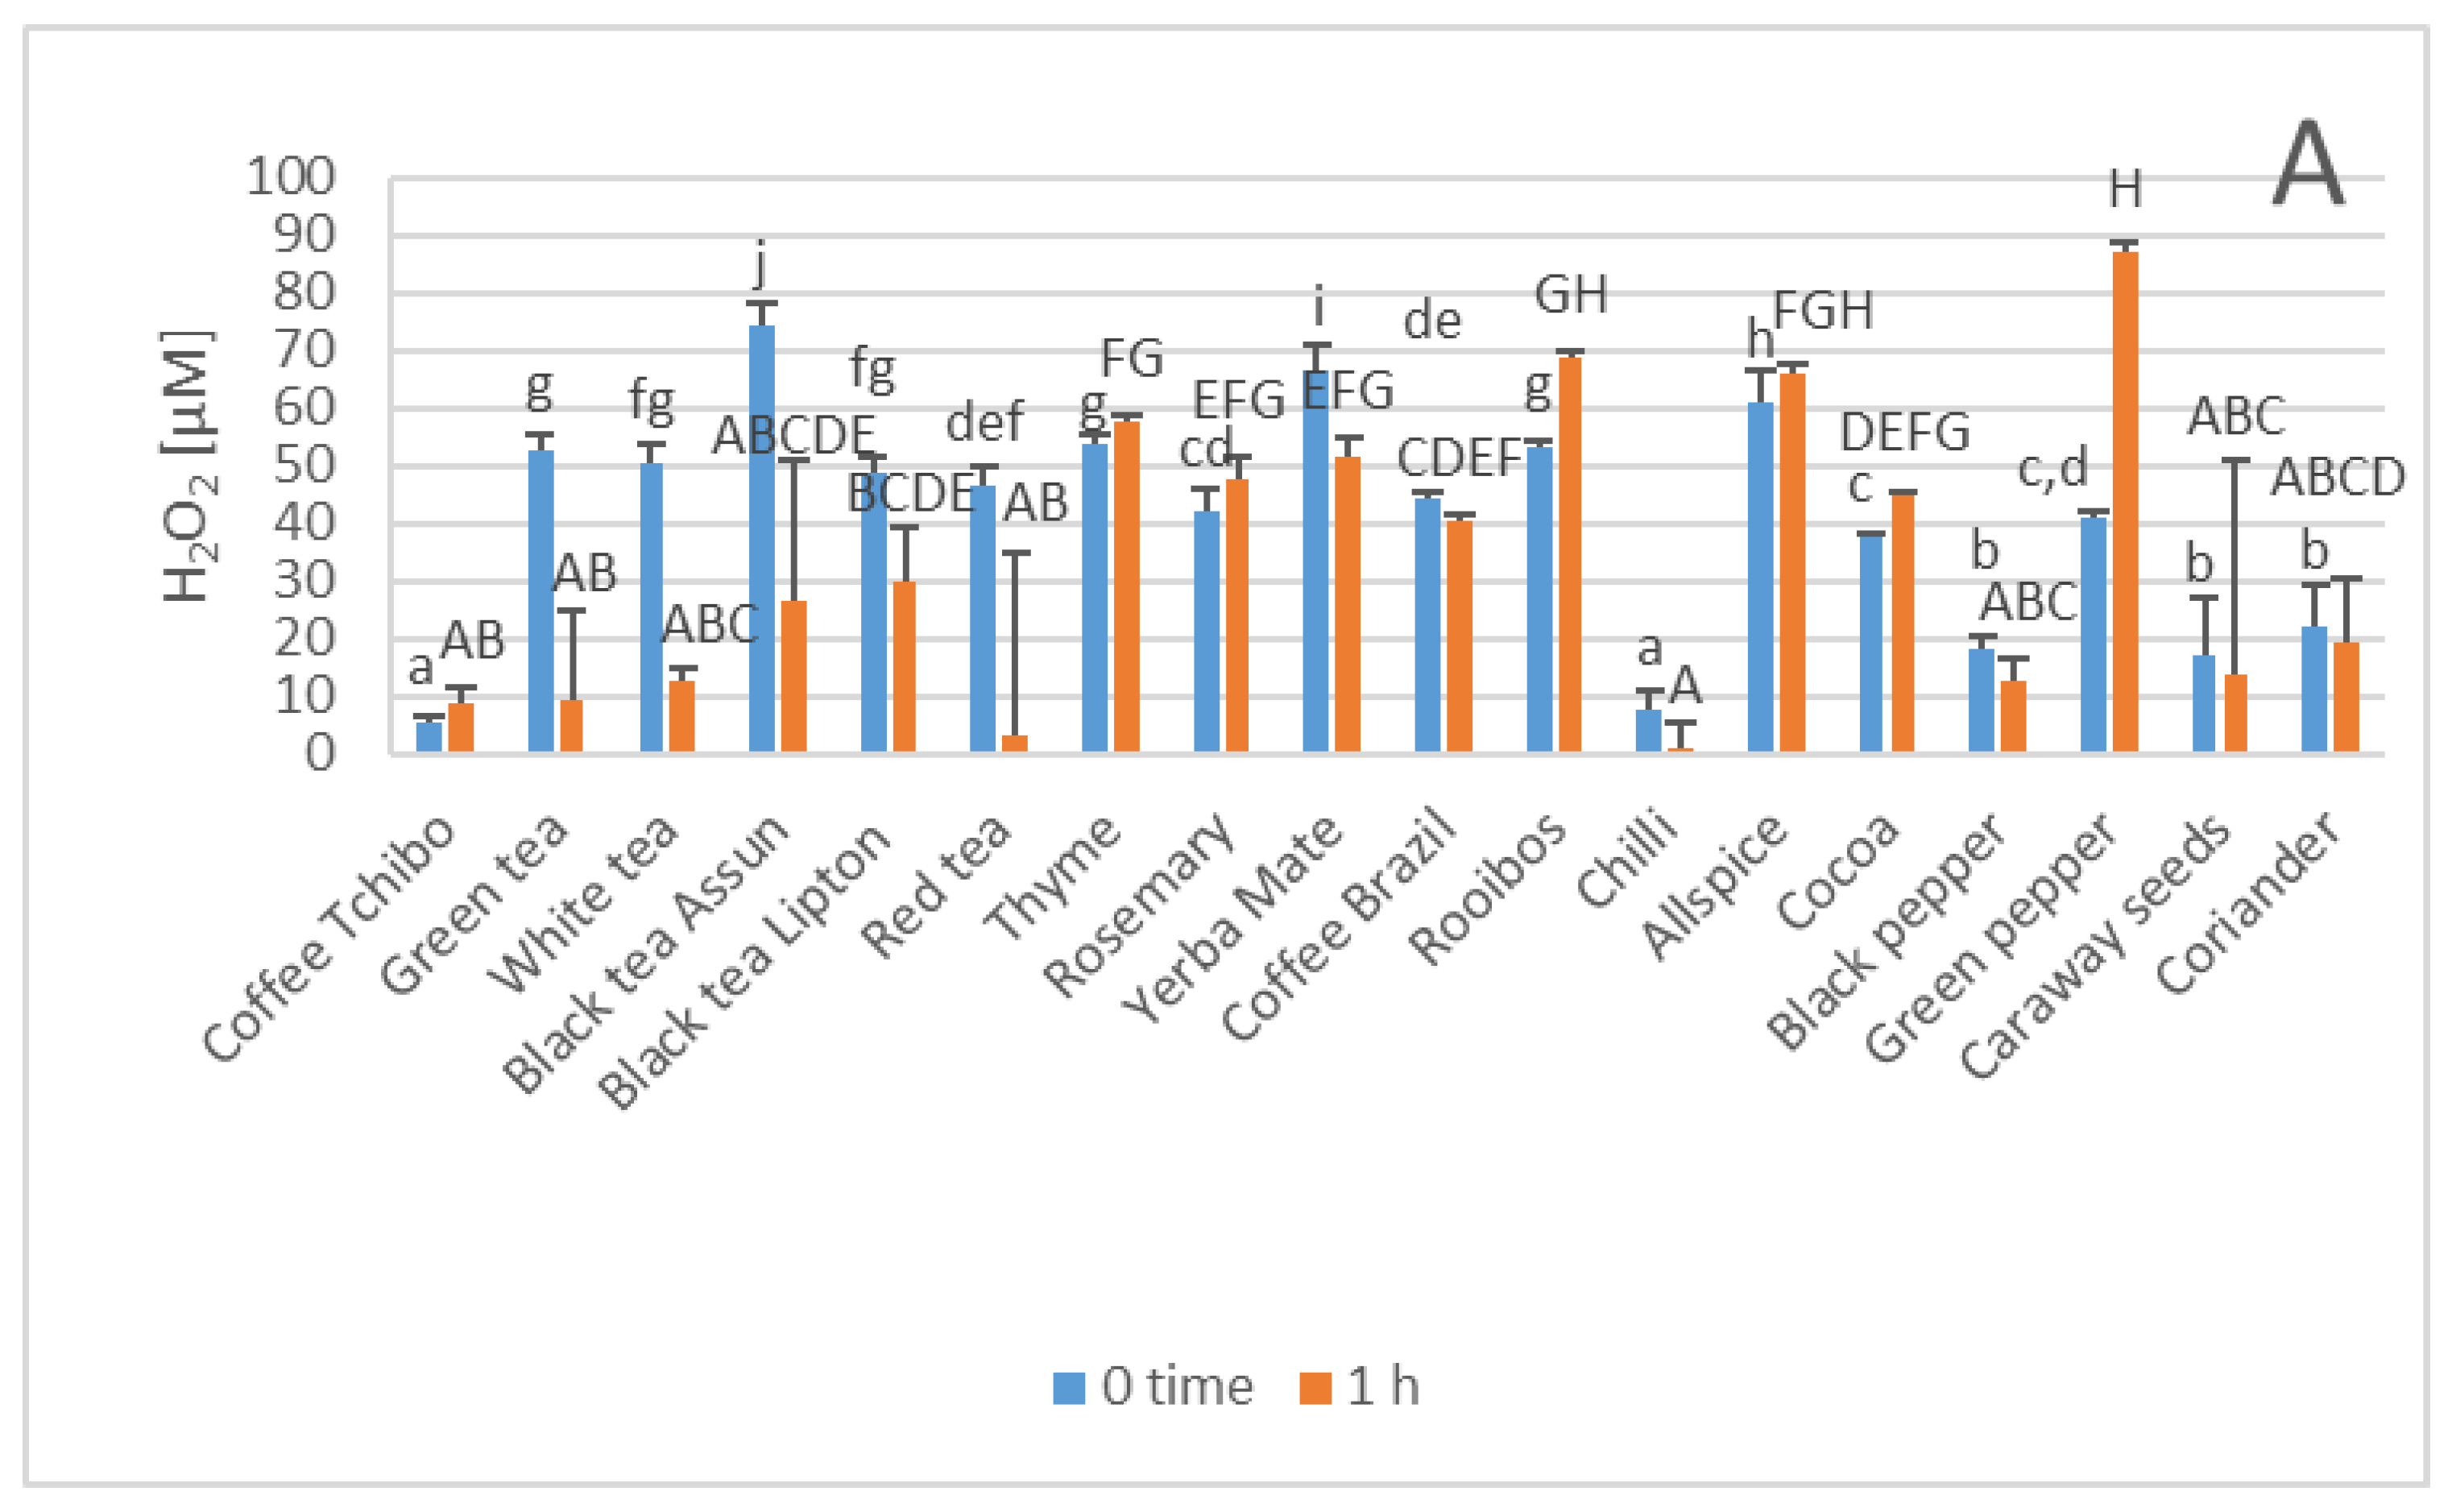
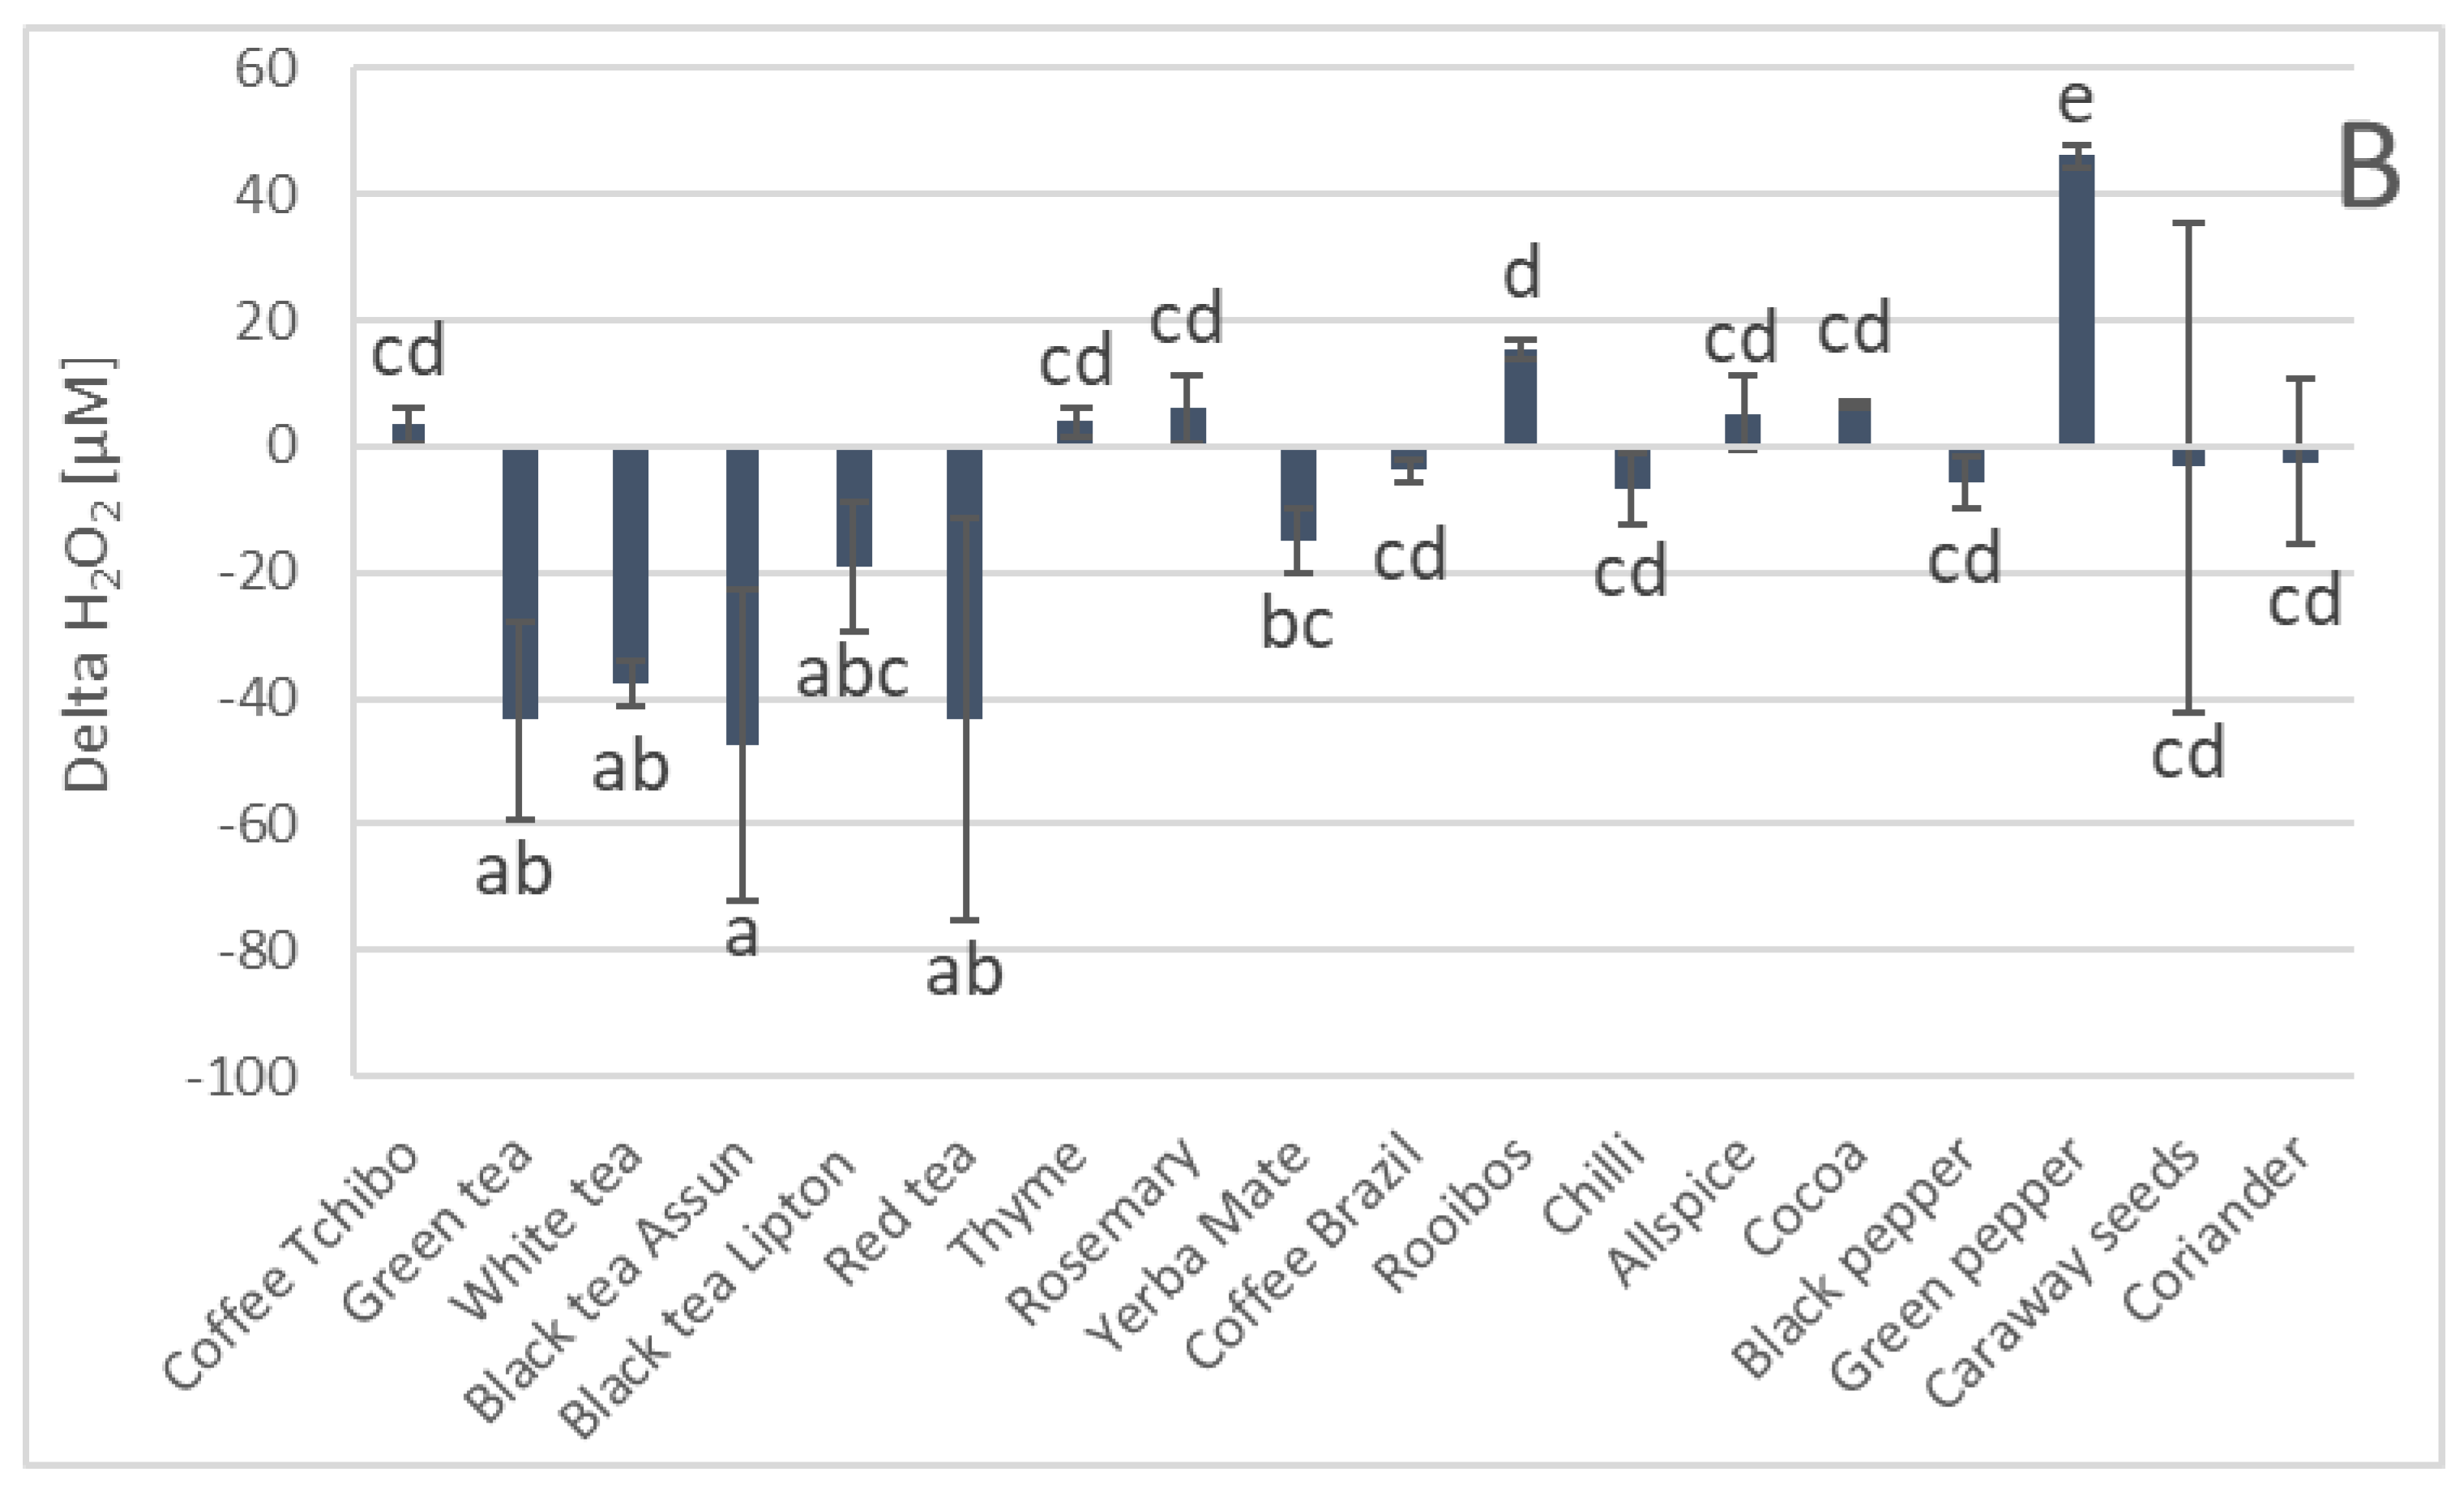
The concentration of hydrogen peroxide in freshly prepared extracts (“zero time”) and after 1 h incubation at ambient temperature, as well as the difference between the H2O2 concentrations after 1 h incubation and at “zero time” are presented in Figure 2. Again, considerable differences were seen in the amount of hydrogen peroxide generated at “zero time”. The highest H2O2 concentrations (74.3 ± 2.7 μM and 66.7 ± 4.4 μM) were noted for black tea and yerba mate, respectively, and the lowest (5.4 ± 1.2 μM and 7.7 ± 0.2 μM) for the Tchibo coffee and the chili extract, respectively. After 1 h incubation, the increase in the concentration of hydrogen peroxide was the most prominent in the extract of green pepper but, surprisingly, in some extracts, especially in green tea, black tea, and red tea, the concentration of H2O2 decreased.
There were significant correlations between the content of phenolics in the extracts and TAC estimated by various assays, as well as between the results of various TAC assays. The highest values of correlation coefficients were found for the total phenolic content vs. TAC assayed by ABTS decolorization (r = 0.94) and TAC assayed by the CUPRAC method (r = 0.93). The highest correlation between the results of various TAC assays was obtained for the FRAP and CUPRAC methods (r = 0.95), which is understandable as both assays are based on the same principle, i.e., reduction of metal ions (Fe3+ and Cu2+, respectively).
However, the correlation between the polyphenol content and H2O2 concentration at “zero time” was not significant statistically, and the correlation between the polyphenol content and H2O2 concentration after 1 h incubation was even negative. The correlation between the polyphenol content of the extracts and the change in H2O2 concentration during 1 h incubation was significant but, surprisingly, also negative (Table 1).
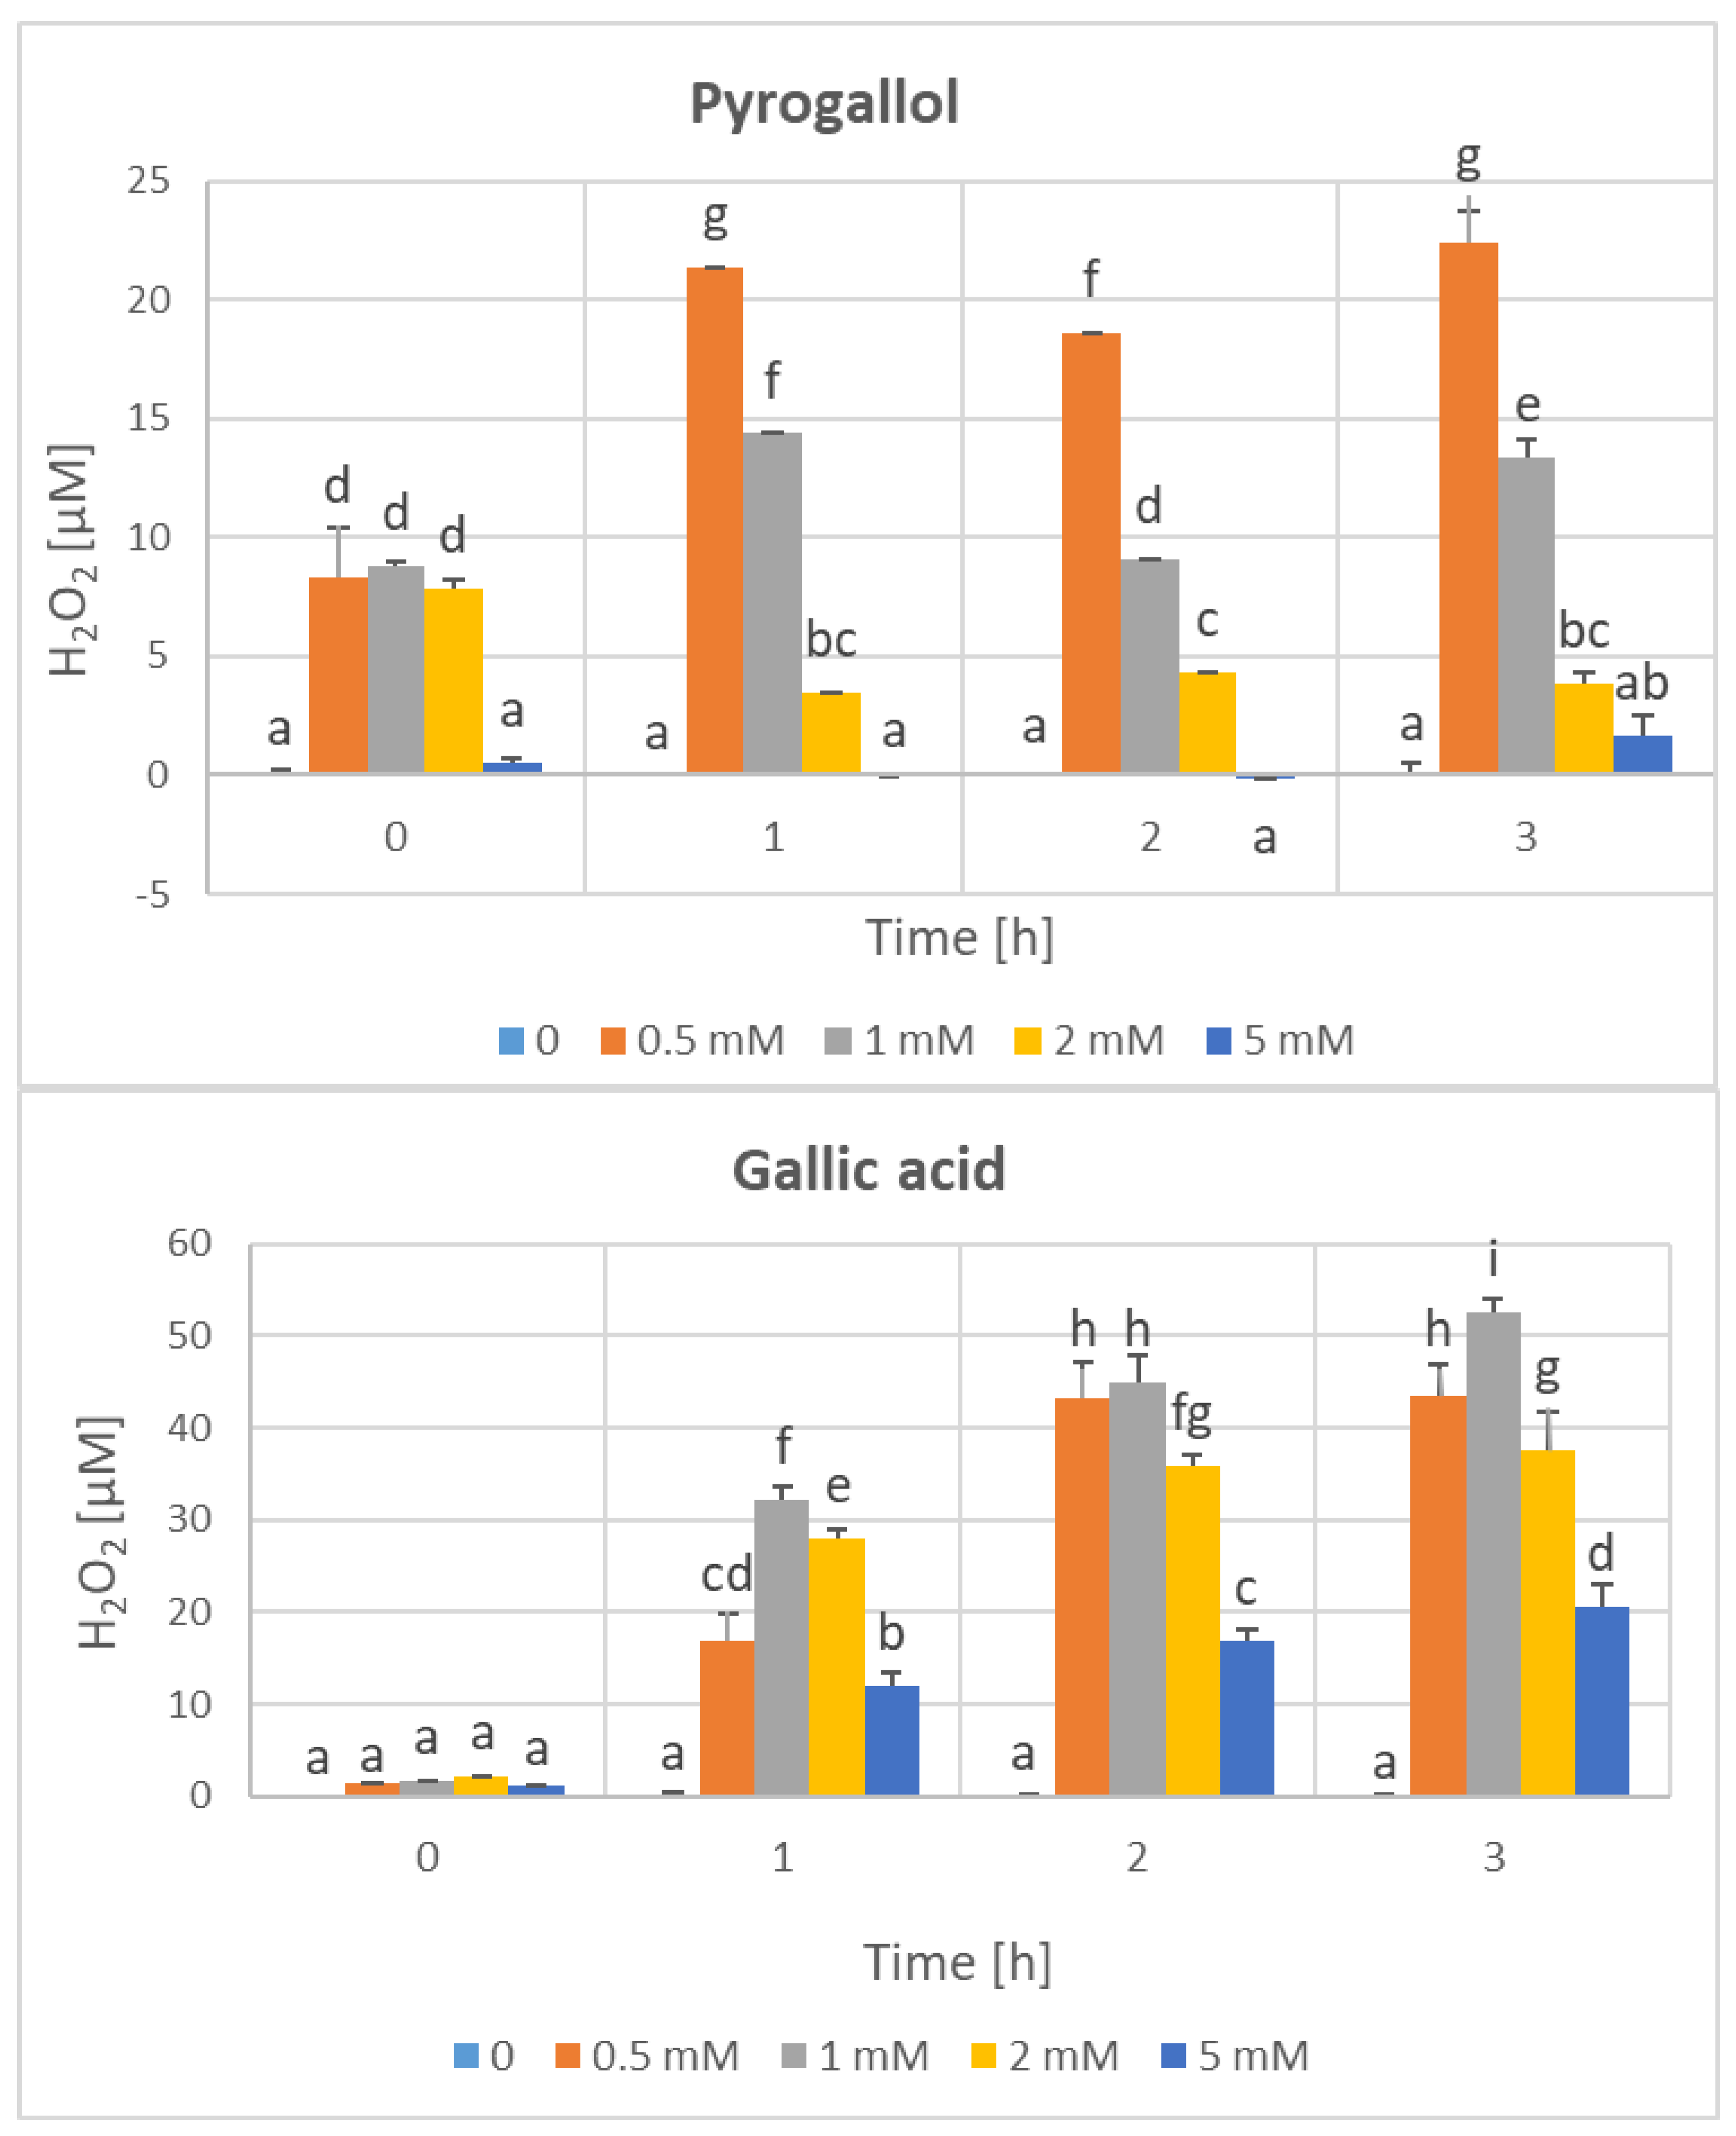
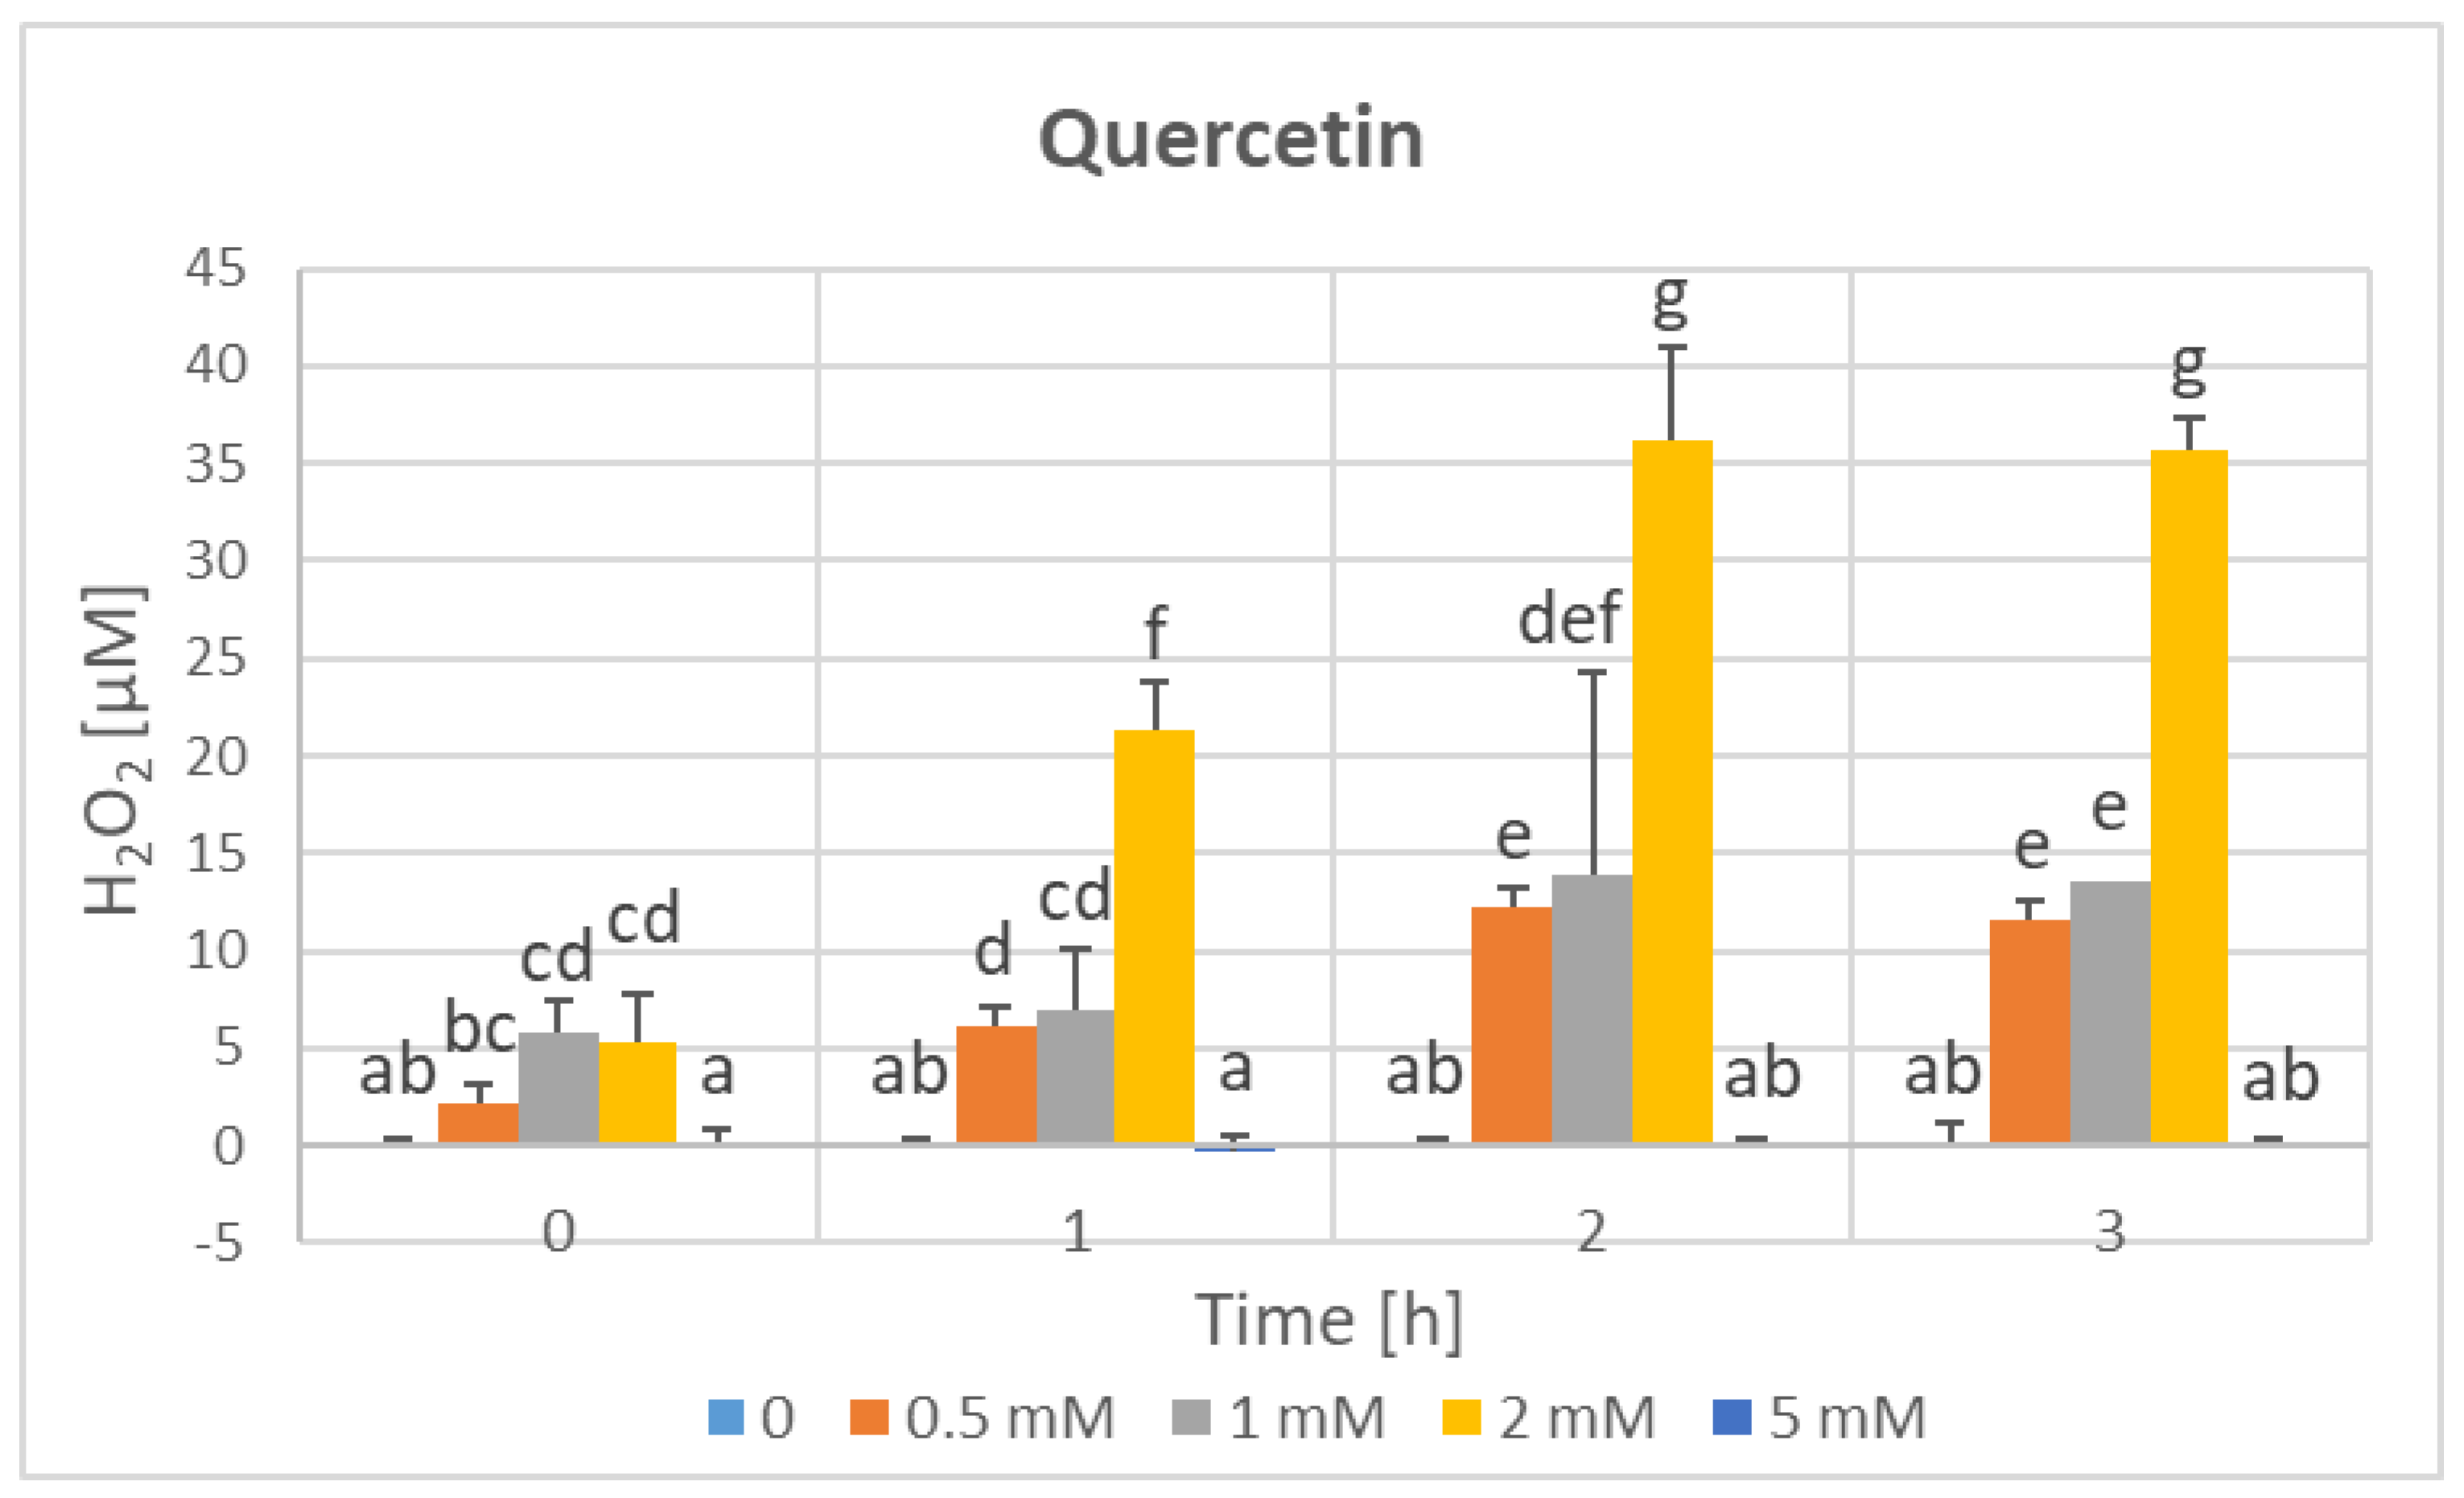
This weak correlation between the content of phenolics and the production of hydrogen peroxide in various plant extracts and the lack of a consistent pattern of changes in the hydrogen peroxide concentrations in various extracts during 1 h incubation prompted us to examine the generation of hydrogen peroxide by exemplary individual polyphenols (pyrogallol, gallic acid, and quercetin) and the reactions of these polyphenols with hydrogen peroxide. The results shown in Figure 3 evidence that (i) all the polyphenols studied generated micromolar concentrations of hydrogen peroxide, (ii) the amount of hydrogen peroxide generated was not proportional to the incubation time, and (iii) the amount of generated hydrogen peroxide was not proportional to the phenolic concentration.
The significant generation of hydrogen peroxide at “zero time”, especially for pyrogallol, may be surprising; however, there was a technical several-minute delay between the initial contact of dry solid polyphenol with water and the addition of the FOX reagent to the solution, so the “zero time” denotes, in fact, about 5–7 min. For pyrogallol solutions, the hydrogen peroxide concentration increased during 1 h incubation but then remained fairly stable. For gallic aid, the generation of hydrogen peroxide at “zero time” was negligible, was maximal during the first hour of incubation, and then continued to increase though the magnitude of the increase diminished with time. A similar picture was obtained for quercetin, but the generation of hydrogen peroxide by intermediate quercetin concentrations at the “zero time” was higher than in the case of gallic acid.
The dependence of the concentration of hydrogen peroxide generated on the polyphenol concentration did not follow a uniform pattern as well. For pyrogallol, the highest hydrogen peroxide generation was found for the lowest polyphenol concentration applied (0.5 mM, except for the “zero time”). For gallic acid, the highest generation was revealed for intermediate concentrations, peaking at 1 mM. For quercetin, the highest generation of H2O2 was generated for 2 mM polyphenol, and almost no generation was detected for 5 mM quercetin. Such complex relationships may be explained by the assumption that phenolics not only generate H2O2 but they (or products of their oxidation/degradation) also react with the generated hydrogen peroxide.
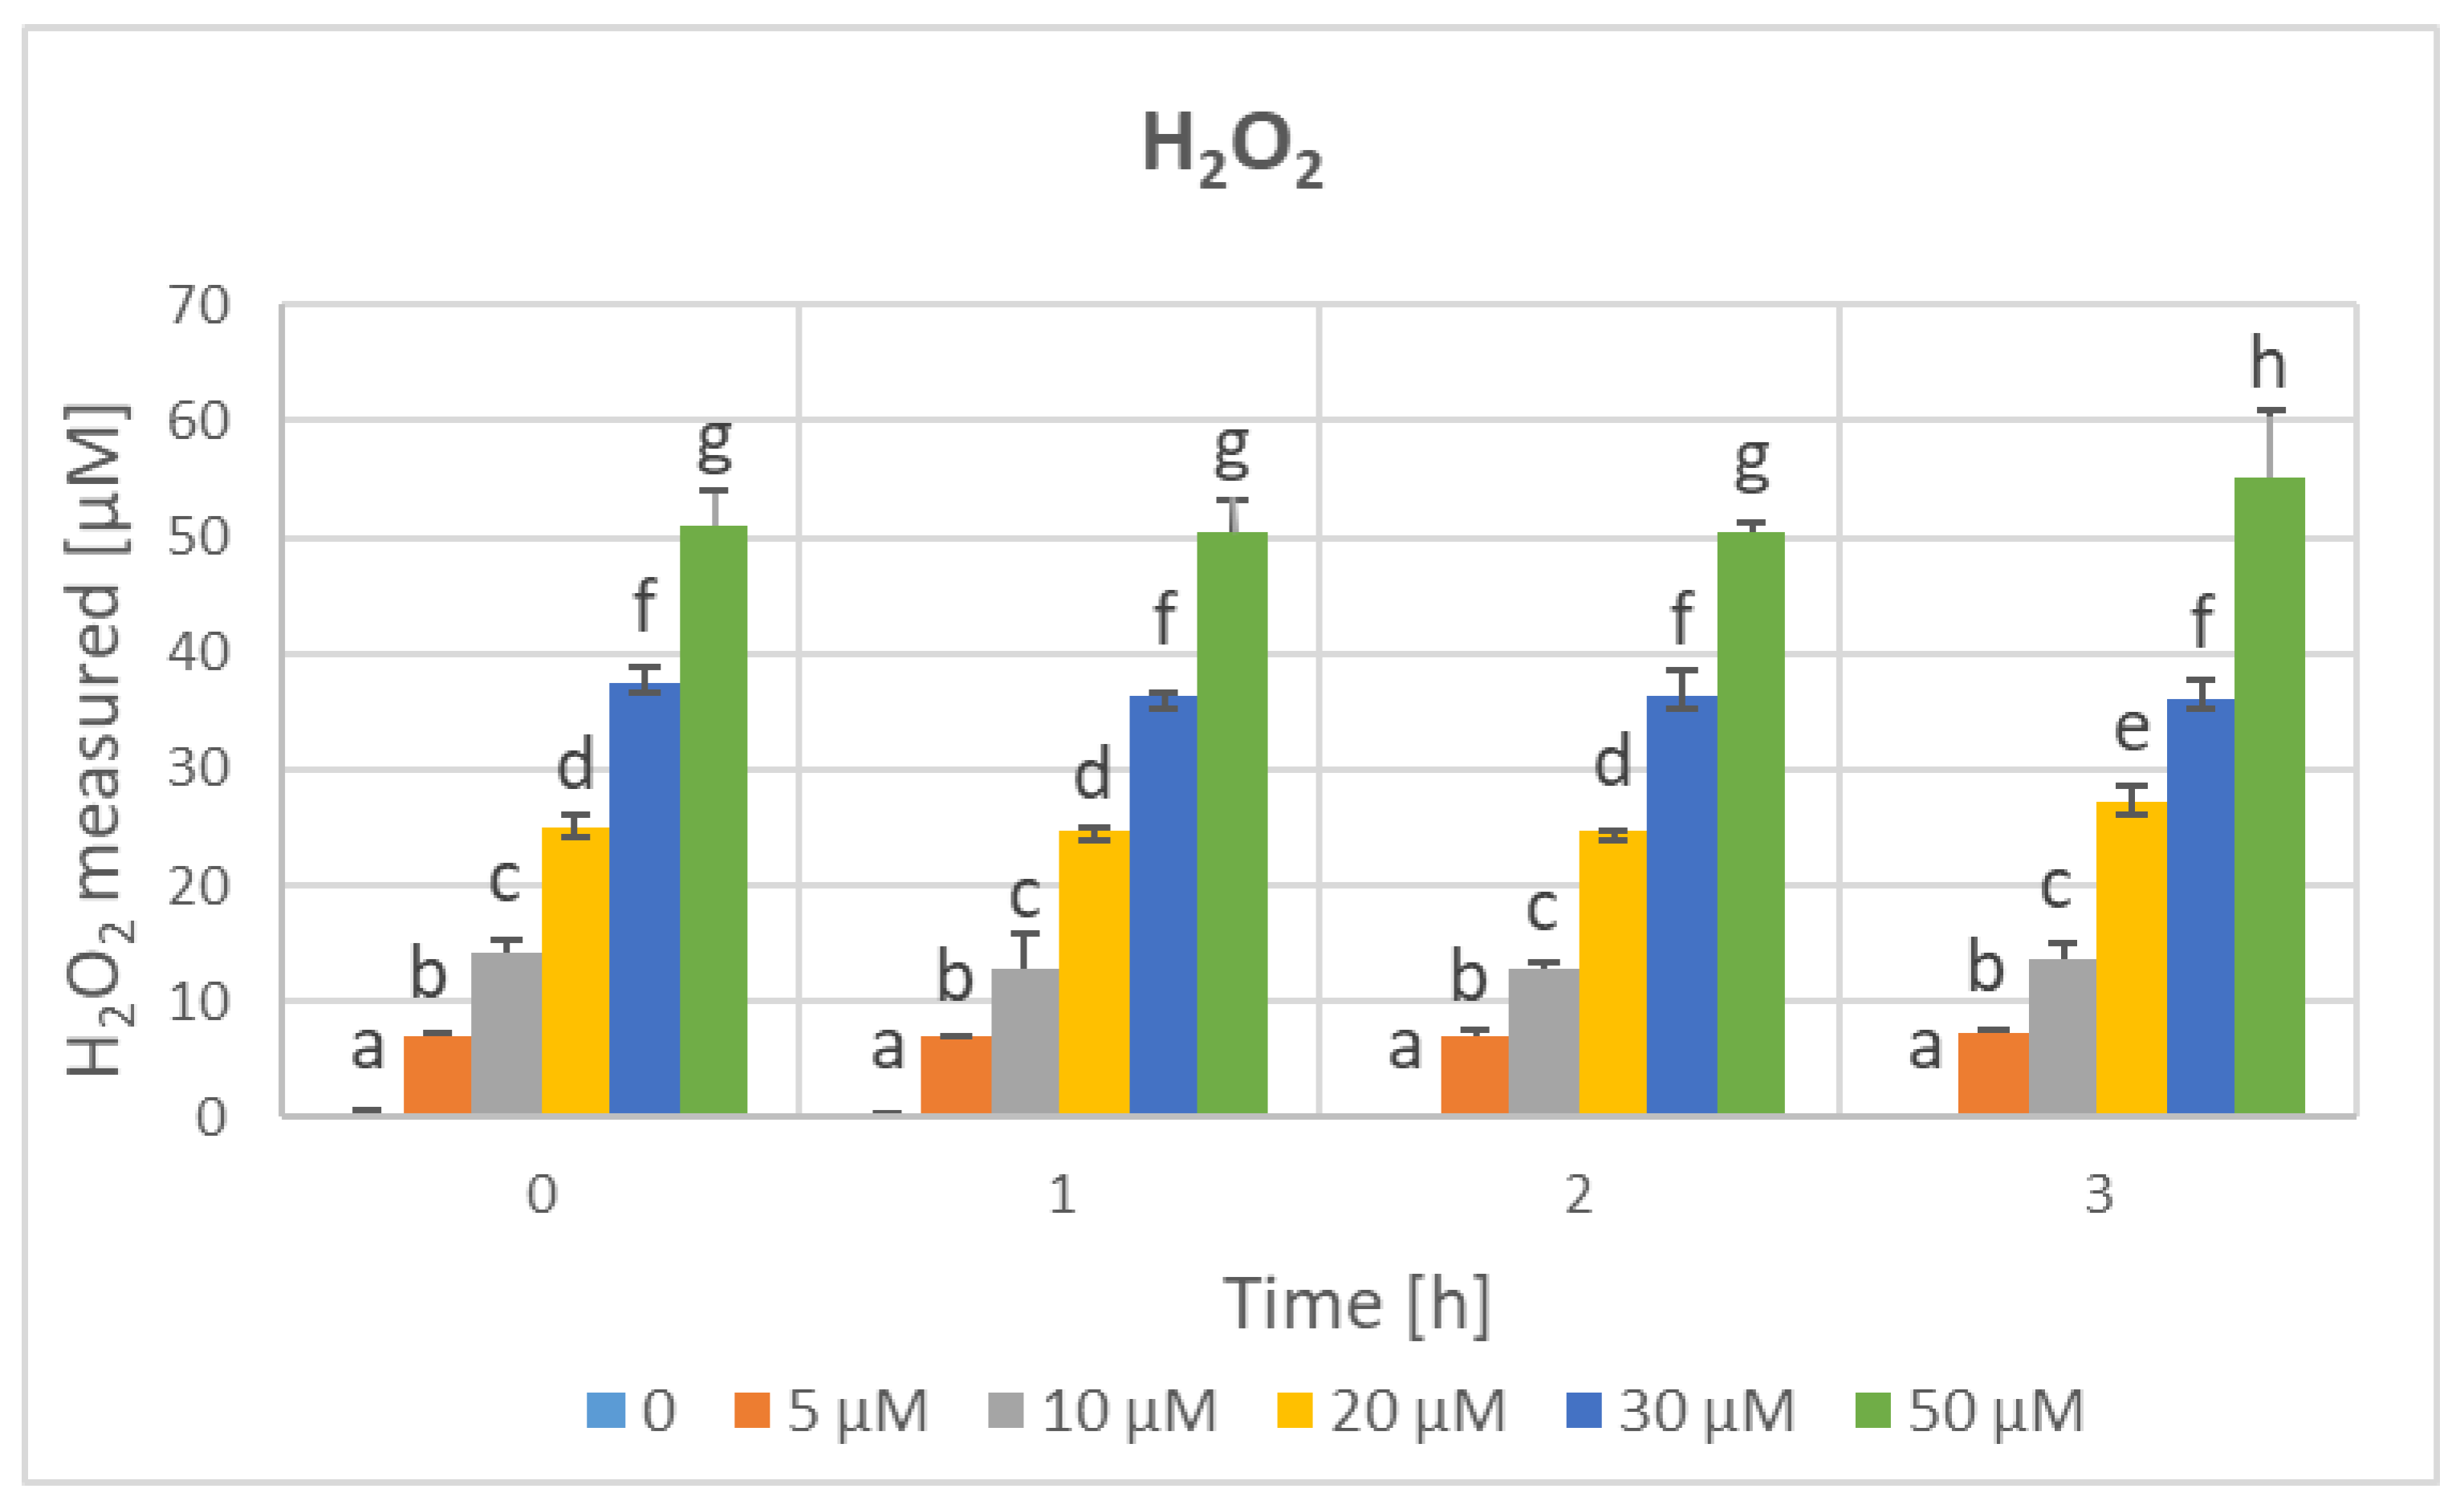
To check the validity of this assumption, the reactions of polyphenols with exogenously added hydrogen peroxide were studied. As shown in Figure 4, exogenous hydrogen peroxide was partly consumed by polyphenols although hydrogen peroxide solutions were fairly stable in the absence of polyphenols; no spontaneous decomposition but even an apparent increase in H2O2 concentration in two cases was noted during incubation. The concentration of hydrogen peroxide measured was almost always lower than the sum of concentrations of hydrogen peroxide generated in the absence of exogenous hydrogen peroxide and that of hydrogen peroxide added.
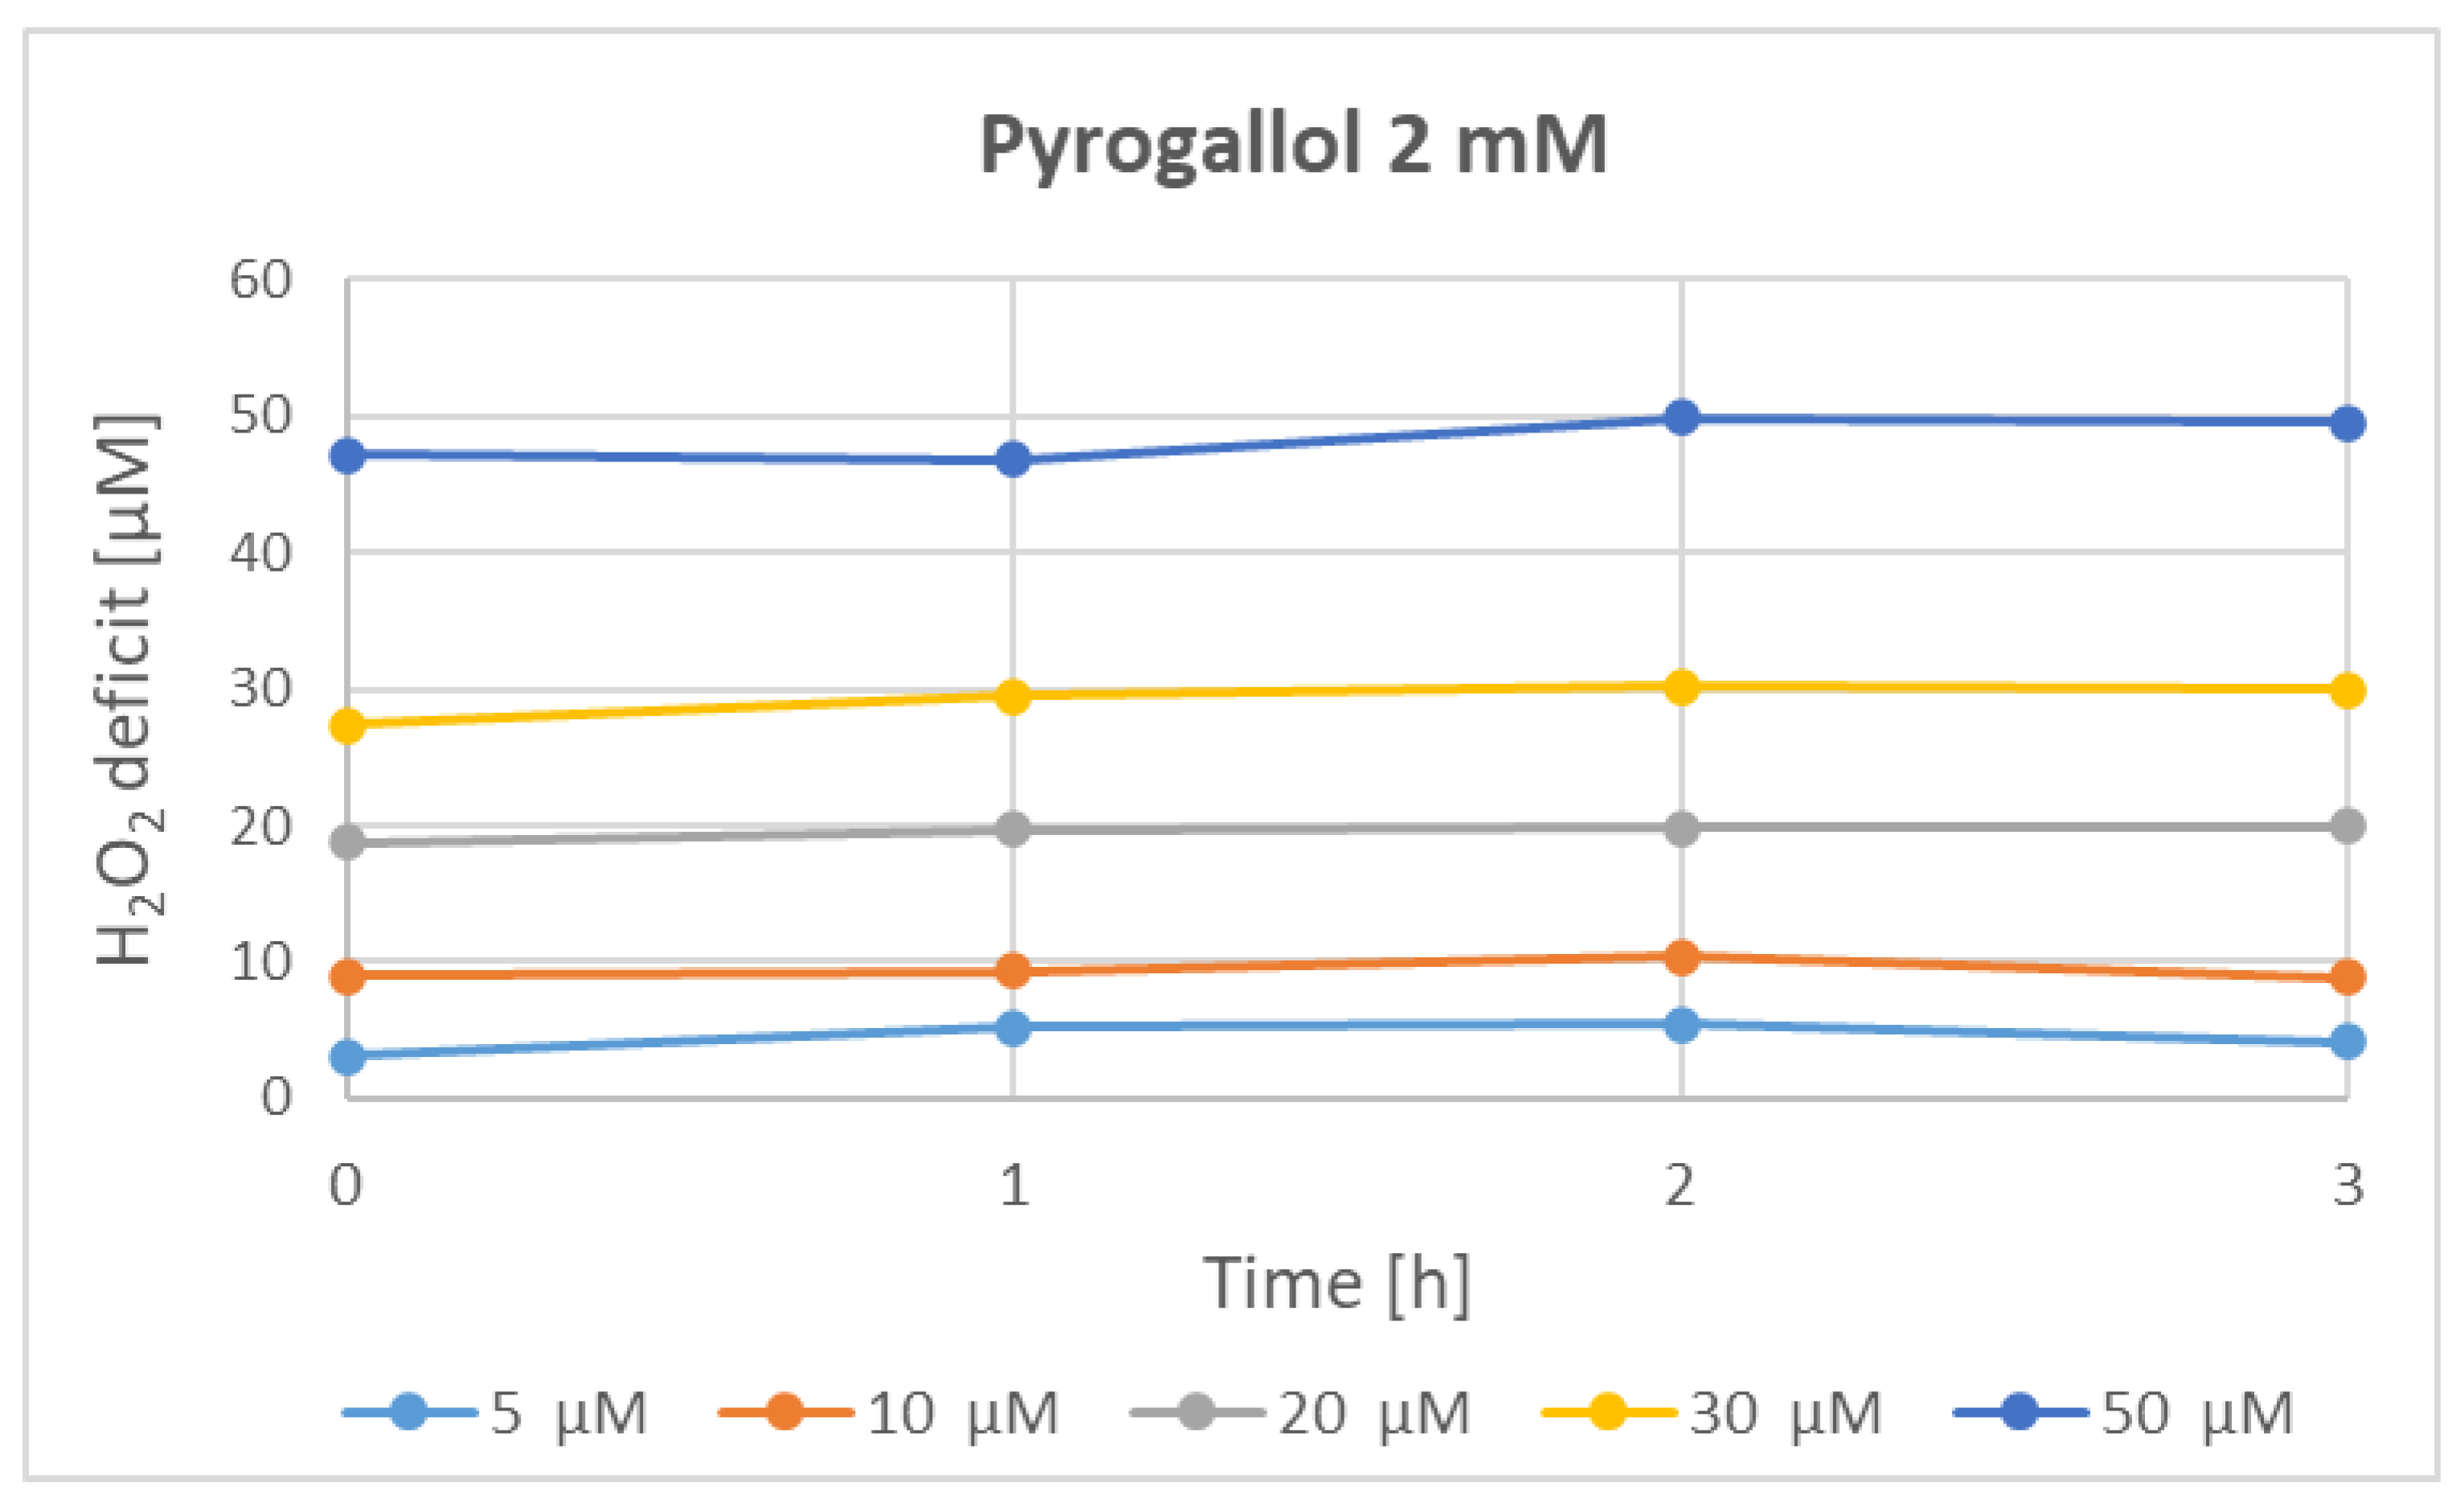
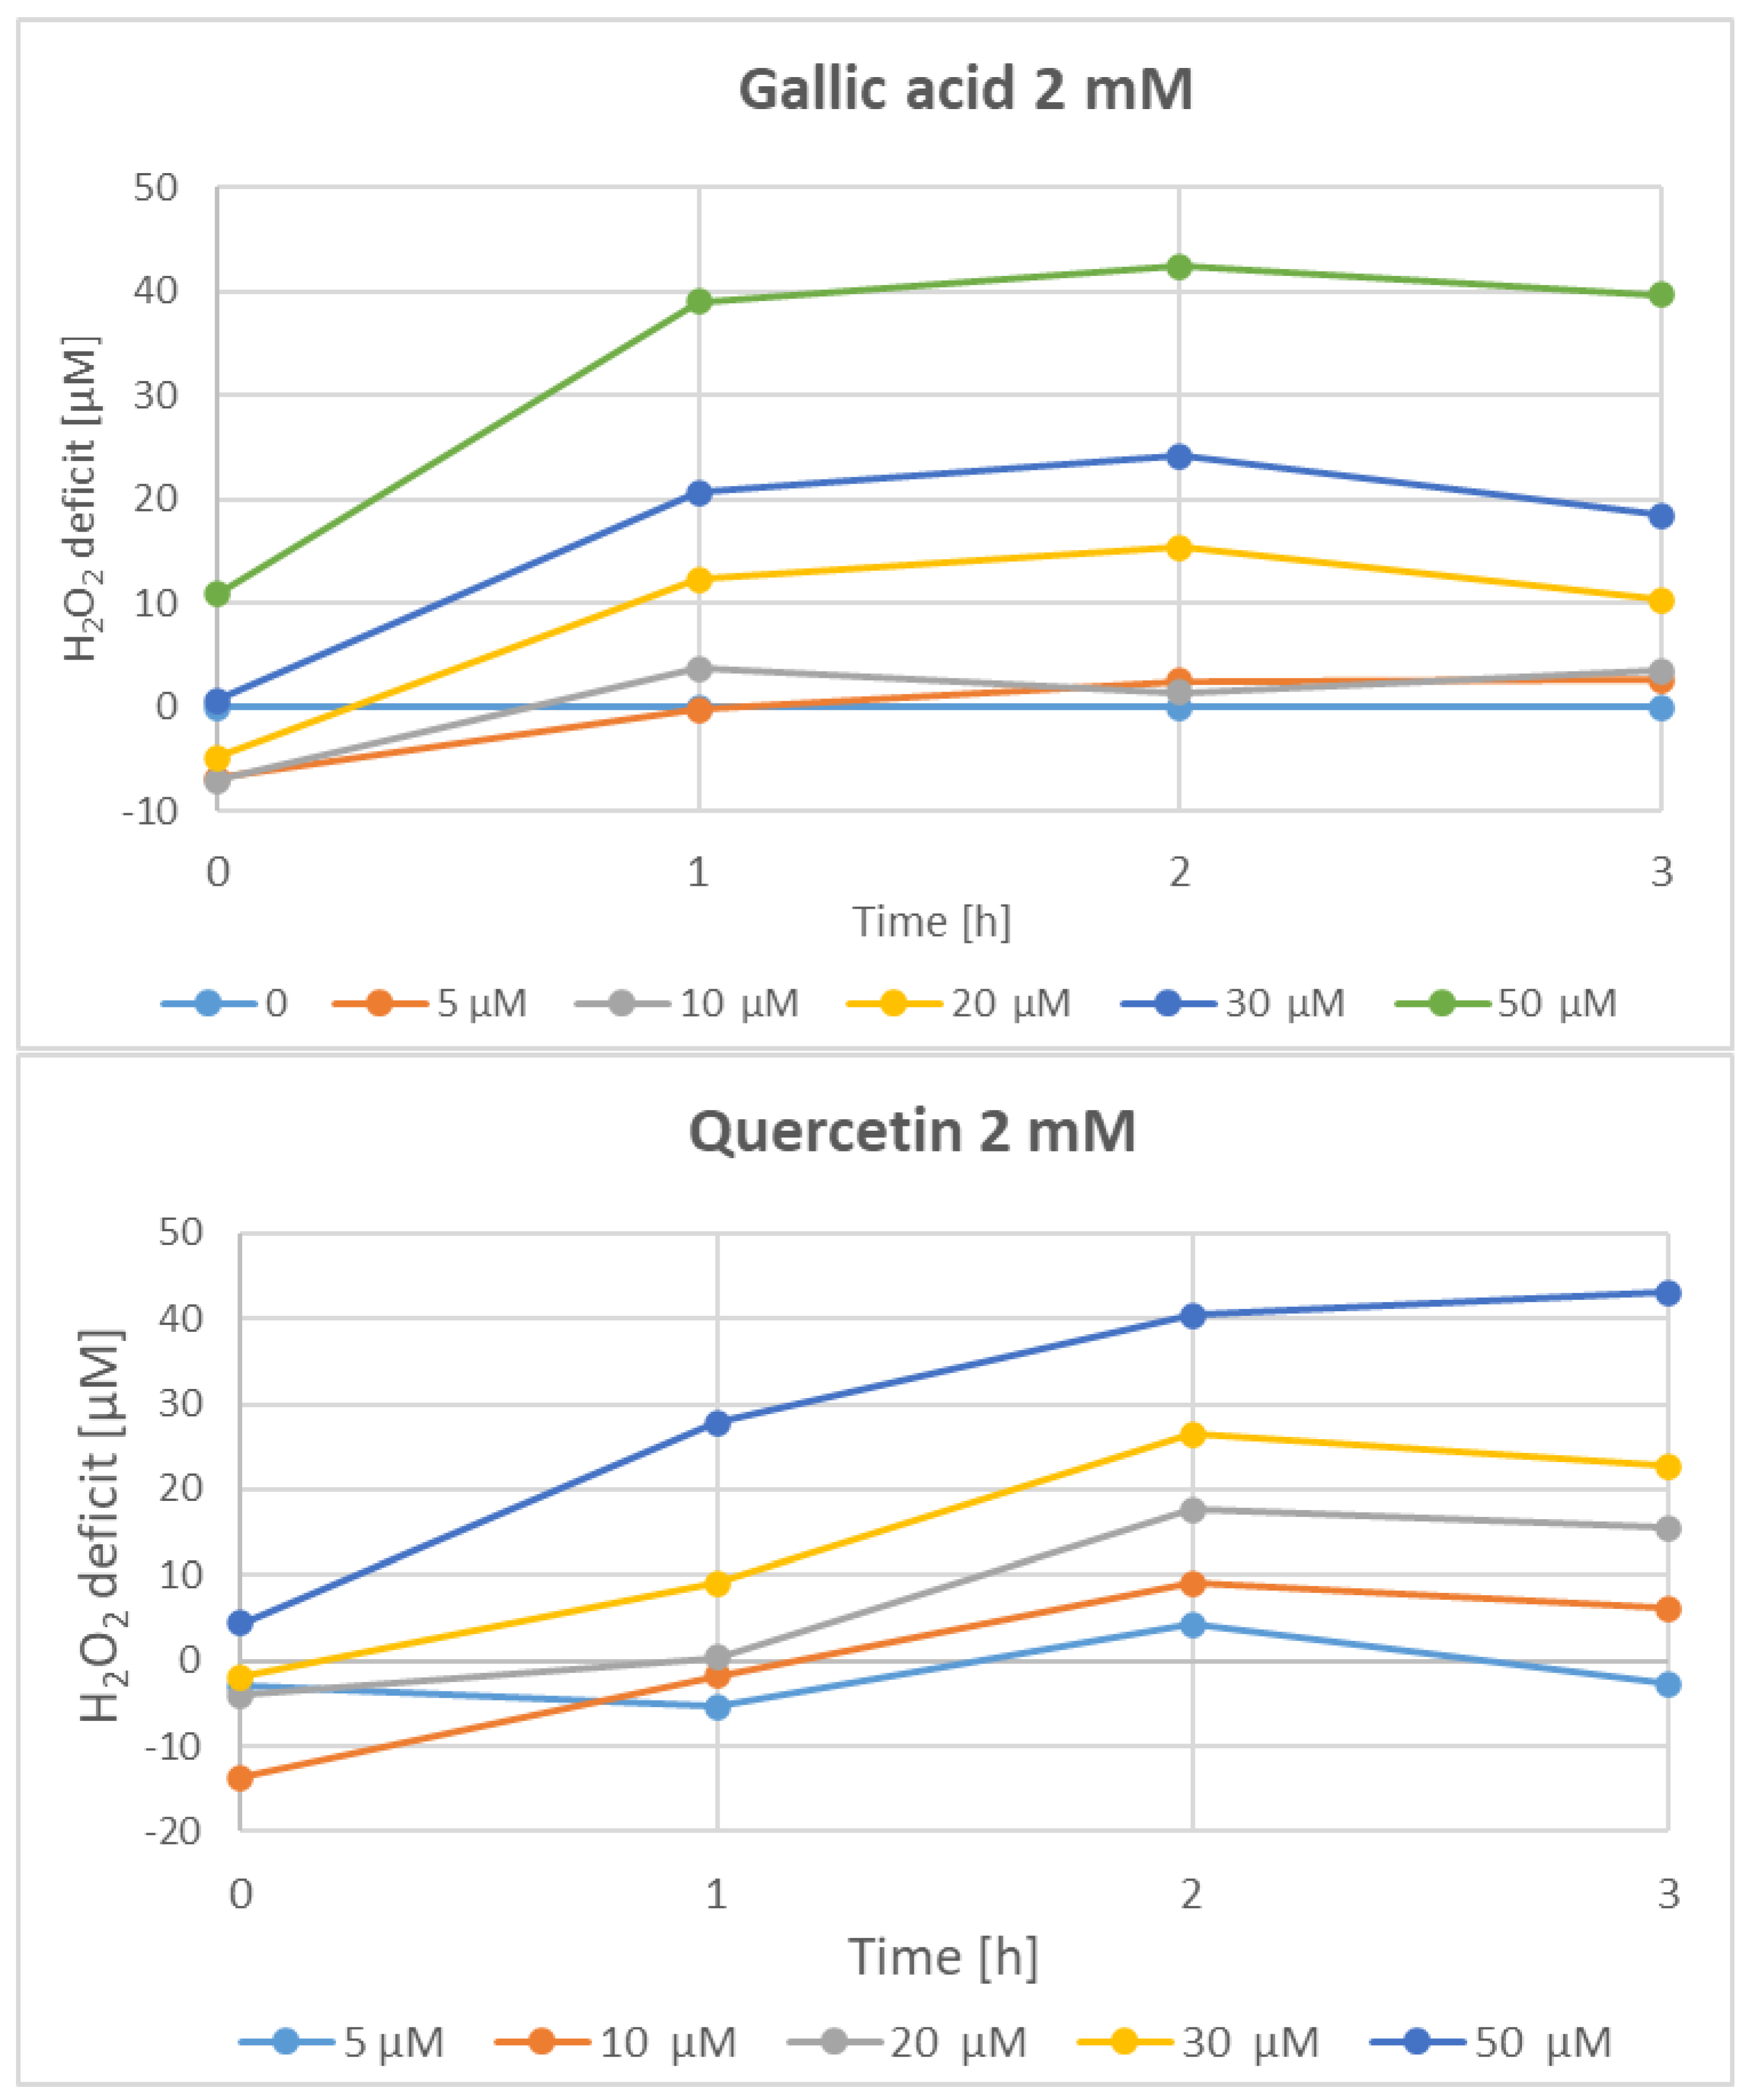
The deficit of hydrogen peroxide, defined as the concentration of hydrogen peroxide generated by 2 mM polyphenols plus the concentration of hydrogen peroxide added minus the concentration of hydrogen peroxide measured, is shown in Figure 5. For pyrogallol, the H2O2 deficit was practically constant in time, indicating that consumption of hydrogen peroxide took place during the initial minutes of incubation. For gallic acid and quercetin, the deficit initially increased in time (in some cases, indicating the highest rate of hydrogen peroxide consumption during the first hour of incubation (the period during which the rate of endogenous H2O2 generation was also the highest)).

4. Discussion

Significant correlations between the total content of phenolics and TAC assayed by various methods have been reported by many authors (Table 2). In some cases, the correlation coefficients were lower than 0.8–0.99, indicating a greater contribution of other classes of compounds to the antioxidant capacity.
In this study of 18 diverse plant material extracts, the correlation coefficients between total phenolic content and TAC estimated by ABTS reduction, DPPH reduction, FRAP, and CUPRAC were 0.94, 0.78, 0.90, and 0.93, respectively (Table 1). These data confirm that phenolics are the main antioxidants in plant extracts; higher correlations are difficult to expect since plants contain also other antioxidant compounds.
Oxidation of phenolics in plant extracts, not counteracted by antioxidant enzymes, generates eventually hydrogen peroxide as a product of oxygen reduction. It could be expected that the production of hydrogen peroxide would reflect the phenolic content of the extracts and negatively mirror their antioxidant activity. This was not the case; the correlation between the phenolic content and H2O2 concentration estimated after 1 h incubation was even negative. A statistically significant but negative correlation existed between the content of phenolics and the difference between H2O2 concentration at 1 h and at “zero time” (r = −0.61). Not only phenolics, but also e.g., ascorbate, generate hydrogen peroxide upon autoxidation [3]; nevertheless, they also contribute to the antioxidant activity, which, despite it, well correlated with the phenolic content. Interestingly, for many extracts, a decrease in the hydrogen peroxide concentration during 1 h incubation was found (Figure 2).
These data, especially the decrease in H2O2 concentration during incubation of extracts of plant materials, can be explained by assuming that phenolics not only generate but also consume hydrogen peroxide. To shed light on this question, we studied hydrogen peroxide generation and scavenging by three chosen polyphenols. The polyphenols are present in at least some of the extracts studied. Gallic acid is present in coffee in amounts of 2.5 mg–80 mg/100 g [53] or even 306–360 mg/100 g [54]. Coffee beans also contain quercetin (0.6–0.7 mg/100 g) [45]. Pyrogallol is also present in coffee and is the main contributor to the xanthine-oxidase-inhibiting activity of coffee extracts [55]. It is also present in tea and various plant extracts [56]. Quercetin is present in tea, coffee, and various other plant extracts [57]. Plant extracts contain also other components apart from phenolics, but the latter seem to be the main compounds reacting with hydrogen peroxide. It can be concluded on the basis of the presented data that the increase in the concentration of phenolics does not always lead to increased generation of hydrogen peroxide and the concentration of hydrogen peroxide does not always increase with time.
Although the generation of hydrogen peroxide in extracts of plant material, especially tea and coffee, has been convincingly demonstrated [1,2,3,4,5,6,7], it should be concluded that the concentrations of hydrogen peroxide measured in these extracts is a net result of the rate of its production and consumption, mainly by phenolic compounds. It has been shown that phenolics [58,59,60,61,62] and phenolic-rich materials such as rosemary extract [63], tea, and wine [64] generate hydrogen peroxide in cell culture media, which contributes to the cytotoxicity of these compounds/fluids under standard cell culture conditions. Under in vivo conditions, the oxygen concentration in most tissues is much lower, so phenolics oxidize at a slower rate or not at all, and the generated hydrogen peroxide is disposed of mainly by catalases, peroxidases, peroxiredoxins, and small-molecular-weight antioxidants. Therefore, their hydrogen-scavenging activity may predominate, and the production of hydrogen peroxide by these compounds should be treated mainly as an artifact of in vitro conditions.

Author Contributions

Conceptualization, K.K., G.B. and I.S.-B.; methodology, K.K., G.B. and I.S.-B.; software, K.K., P.F. and I.S.-B.; validation, P.F. and I.S.-B.; investigation, K.K., A.T. and I.S.-B.; writing—original draft preparation, K.K., G.B. and I.S.-B.; writing—review and editing, I.S.-B. and G.B.; supervision, I.S.-B.; project administration, I.S.-B. All authors have read and agreed to the published version of the manuscript.

Funding

This research received no external funding.

Data Availability Statement

Data are available from the corresponding author upon reasonable request.

Acknowledgments

We are indebted to Edyta Bieszczad-Bedrejczuk (Laboratory of Analytical Biochemistry, University of Rzeszów) for the excellent technical help.

Conflicts of Interest

The authors declare no conflict of interest.

References

  1. Akagawa, M.; Shigemitsu, T.; Suyama, K. Production of hydrogen peroxide by polyphenols and polyphenol-rich beverages under quasi-physiological conditions. Biosci. Biotechnol. Biochem. 2003, 67, 2632–2640. [Google Scholar] [CrossRef] [PubMed]
  2. Arakawa, H.; Maeda, M.; Okubo, S.; Shimamura, T. Role of hydrogen peroxide in bactericidal action of catechin. Biol. Pharm. Bull. 2004, 27, 277–281. [Google Scholar] [CrossRef]
  3. Grzesik, M.; Bartosz, G.; Stefaniuk, I.; Pichla, M.; Namieśnik, J.; Sadowska-Bartosz, I. Dietary antioxidants as a source of hydrogen peroxide. Food Chem. 2019, 278, 692–699. [Google Scholar] [CrossRef] [PubMed]
  4. Long, L.H.; Lan, A.N.B.; Hsuan, F.T.Y.; Halliwell, B. Generation of hydrogen peroxide by “antioxidant” beverages and the effect of milk addition. Is cocoa the best beverage? Free Radic. Res. 1999, 31, 67–71. [Google Scholar] [CrossRef]
  5. Fujita, Y.; Wakabayashi, K.; Nagao, M.; Sugimura, T. Implication of hydrogen peroxide in the mutagenicity of coffee. Mutat. Res. Lett. 1985, 144, 227–230. [Google Scholar] [CrossRef]
  6. Nagao, M.; Fujita, Y.; Wakabayashi, K.; Nukaya, H.; Kosuge, T.; Sugimura, T. Mutagens in coffee and other beverages. Environ. Health Perspect. 1986, 67, 89–91. [Google Scholar] [CrossRef] [PubMed]
  7. Tsiju, S.; Shibata, T.; Ohara, K.; Okada, N.; Ito, Y. Studies on the factors affecting the formation of hydrogen peroxide in coffee. Food Hyg. Saf. Sci. (Shokuhin Eiseigaku Zasshi) 1991, 32, 504–512. [Google Scholar]
  8. Tama, A.; Bartosz, G.; Sadowska-Bartosz, I. Is hydrogen peroxide generated in wine? Food Biosci. 2022, 45, 101487. [Google Scholar] [CrossRef]
  9. Bartosz, G.; Rajzer, K.; Grzesik-Pietrasiewicz, M.; Sadowska-Bartosz, I. Hydrogen peroxide is formed upon cooking of vegetables. Acta Biochim. Pol. 2022, 69, 471–474. [Google Scholar] [CrossRef]
  10. Bartosz, G.; Baran, S.; Grzesik-Pietrasiewicz, M.; Sadowska-Bartosz, I. The Antioxidant capacity and hydrogen peroxide formation by black and orange carrots: Black and orange carrots. Agric. Food Sci. 2022, 31, 71–77. [Google Scholar] [CrossRef]
  11. Tama, A.; Pieńkowska, N.; Stefaniuk, I.; Bartosz, G.; Kapusta, I.; Sadowska-Bartosz, I. Is hydrogen peroxide generated in infusions of medicinal herbs? Processes 2023, 11, 2855. [Google Scholar] [CrossRef]
  12. Brudzynski, K. A current perspective on hydrogen peroxide production in honey. A review. Food Chem. 2020, 332, 127229. [Google Scholar] [CrossRef]
  13. Pulido, R.; Bravo, L.; Saura-Calixto, F. Antioxidant activity of dietary polyphenols as determined by a modified ferric reducing/antioxidant power assay. J. Agric. Food Chem. 2000, 48, 3396–3402. [Google Scholar] [CrossRef]
  14. Bors, W.; Michel, C. Chemistry of the antioxidant effect of polyphenols. Ann. N. Y. Acad. Sci. 2002, 957, 57–69. [Google Scholar] [CrossRef] [PubMed]
  15. Martins, N.; Barros, L.; Ferreira, I.C. In vivo antioxidant activity of phenolic compounds: Facts and gaps. Trends Food Sci. Technol. 2016, 48, 1–12. [Google Scholar] [CrossRef]
  16. Faller, A.; Fialho, E. Polyphenol content and antioxidant capacity in organic and conventional plant foods. J. Food Compos. Anal. 2010, 23, 561–568. [Google Scholar] [CrossRef]
  17. Gündeşli, M.A.; Korkmaz, N.; Okatan, V. Polyphenol content and antioxidant capacity of berries: A review. Int. J. Agric. For. Life Sci. 2019, 3, 350–361. [Google Scholar]
  18. Liu, H.; Qiu, N.; Ding, H.; Yao, R. Polyphenols contents and antioxidant capacity of 68 Chinese herbals suitable for medical or food uses. Food Res. Int. 2008, 41, 363–370. [Google Scholar] [CrossRef]
  19. Kirsch, M.; De Groot, H. NAD (P) H, a directly operating antioxidant? FASEB J. 2001, 15, 1569–1574. [Google Scholar] [CrossRef] [PubMed]
  20. Zhou, B.; Wu, L.-M.; Yang, L.; Liu, Z.-L. Evidence for α-tocopherol regeneration reaction of green tea polyphenols in SDS micelles. Free Radic. Biol. Med. 2005, 38, 78–84. [Google Scholar] [CrossRef] [PubMed]
  21. Mochizuki, M.; Yamazaki, S.-I.; Kano, K.; Ikeda, T. Kinetic analysis and mechanistic aspects of autoxidation of catechins. Biochim. Biophys. Acta Gen. Sub. 2002, 1569, 35–44. [Google Scholar] [CrossRef]
  22. Geng, Y.; Liu, X.; Yu, Y.; Li, W.; Mou, Y.; Chen, F.; Hu, X.; Ji, J.; Ma, L. From polyphenol to o-quinone: Occurrence, significance, and intervention strategies in foods and health implications. Compr. Rev. Food Sci. Food Saf. 2023, 22, 3254–3291. [Google Scholar] [CrossRef]
  23. Sang, S.; Yang, I.; Buckley, B.; Ho, C.-T.; Yang, C.S. Autoxidative quinone formation in vitro and metabolite formation in vivo from tea polyphenol (-)-epigallocatechin-3-gallate: Studied by real-time mass spectrometry combined with tandem mass ion mapping. Free Radic. Biol. Med. 2007, 43, 362–371. [Google Scholar] [CrossRef]
  24. Wagner, M.; Nicell, J.A. Detoxification of phenolic solutions with horseradish peroxidase and hydrogen peroxide. Water Res. 2002, 36, 4041–4052. [Google Scholar] [CrossRef] [PubMed]
  25. Yvonne, O.; Driss, F.; Dang, P.M.-C.; Elbim, C.; Gougerot-Pocidalo, M.-A.; Pasquier, C.; El-Benna, J. Antioxidant effect of hydroxytyrosol, a polyphenol from olive oil: Scavenging of hydrogen peroxide but not superoxide anion produced by human neutrophils. Biochem. Pharmacol. 2004, 68, 2003–2008. [Google Scholar]
  26. Eskandari, M.; Rembiesa, J.; Startaitė, L.; Holefors, A.; Valančiūtė, A.; Faridbod, F.; Ganjali, M.R.; Engblom, J.; Ruzgas, T. Polyphenol-hydrogen peroxide reactions in skin: In vitro model relevant to study ROS reactions at inflammation. Anal. Chim. Acta 2019, 1075, 91–97. [Google Scholar] [CrossRef]
  27. Sroka, Z.; Fecka, I.; Cisowski, W. Antiradical and anti-H2O2 properties of polyphenolic compounds from an aqueous peppermint extract. Z. Nat. C 2005, 60, 826–832. [Google Scholar] [CrossRef]
  28. Sroka, Z.; Cisowski, W. Hydrogen peroxide scavenging, antioxidant and anti-radical activity of some phenolic acids. Food Chem. Toxicol. 2003, 41, 753–758. [Google Scholar] [CrossRef] [PubMed]
  29. Özyürek, M.; Bektaşoğlu, B.; Güçlü, K.; Güngör, N.; Apak, R. A novel hydrogen peroxide scavenging assay of phenolics and flavonoids using cupric reducing antioxidant capacity (CUPRAC) methodology. J. Food Compos. Anal. 2010, 23, 689–698. [Google Scholar] [CrossRef]
  30. Mansouri, A.; Makris, D.P.; Kefalas, P. Determination of hydrogen peroxide scavenging activity of cinnamic and benzoic acids employing a highly sensitive peroxyoxalate chemiluminescence-based assay: Structure–activity relationships. J. Pharm. Biomed. Anal. 2005, 39, 22–26. [Google Scholar] [CrossRef]
  31. Ma, X.; Li, H.; Dong, J.; Qian, W. Determination of hydrogen peroxide scavenging activity of phenolic acids by employing gold nanoshells precursor composites as nanoprobes. Food Chem. 2011, 126, 698–704. [Google Scholar] [CrossRef]
  32. Kılıçgün, H.; Altıner, D. Correlation between antioxidant effect mechanisms and polyphenol content of Rosa canina. Pharmacogn. Mag. 2010, 6, 238–241. [Google Scholar] [CrossRef] [PubMed]
  33. Fu, L.; Xu, B.-T.; Gan, R.-Y.; Zhang, Y.; Xu, X.-R.; Xia, E.-Q.; Li, H.-B. Total phenolic contents and antioxidant capacities of herbal and tea infusions. Int. J. Mol. Sci. 2011, 12, 2112–2124. [Google Scholar] [CrossRef]
  34. Re, R.; Pellegrini, N.; Proteggente, A.; Pannala, A.; Yang, M.; Rice-Evans, C. Antioxidant activity applying an improved ABTS radical cation decolorization assay. Free Radic. Biol. Med. 1999, 26, 1231–1237. [Google Scholar] [CrossRef] [PubMed]
  35. Kut, K.; Cieniek, B.; Stefaniuk, I.; Bartosz, G.; Sadowska-Bartosz, I. A modification of the ABTS decolorization method and an insight into its mechanism. Processes 2022, 10, 1288. [Google Scholar] [CrossRef]
  36. Benzie, I.F.; Strain, J.J. The ferric reducing ability of plasma (FRAP) as a measure of “antioxidant power”: The FRAP assay. Anal. Bochem. 1996, 239, 70–76. [Google Scholar] [CrossRef]
  37. Özyürek, M.; Güçlü, K.; Tütem, E.; Başkan, K.S.; Erçağ, E.; Çelik, S.E.; Baki, S.; Yıldız, L.; Karaman, Ş.; Apak, R. A comprehensive review of CUPRAC methodology. Anal. Methods 2011, 3, 2439–2453. [Google Scholar] [CrossRef]
  38. Gay, C.A.; Gebicki, J.M. Measurement of protein and lipid hydroperoxides in biological systems by the ferric–xylenol orange method. Anal. Biochem. 2003, 315, 29–35. [Google Scholar] [CrossRef]
  39. Vignoli, J.; Bassoli, D.; Benassi, M.D.T. Antioxidant activity, polyphenols, caffeine and melanoidins in soluble coffee: The influence of processing conditions and raw material. Food Chem. 2011, 124, 863–868. [Google Scholar] [CrossRef]
  40. Di Majo, D.; La Guardia, M.; Giammanco, S.; La Neve, L.; Giammanco, M. The antioxidant capacity of red wine in relationship with its polyphenolic constituents. Food Chem. 2008, 111, 45–49. [Google Scholar] [CrossRef]
  41. Blasa, M.; Candiracci, M.; Accorsi, A.; Piacentini, M.P.; Albertini, M.C.; Piatti, E. Raw Millefiori honey is packed full of antioxidants. Food Chem. 2006, 97, 217–222. [Google Scholar] [CrossRef]
  42. Bertoncelj, J.; Doberšek, U.; Jamnik, M.; Golob, T. Evaluation of the phenolic content, antioxidant activity and colour of Slovenian honey. Food Chem. 2007, 105, 822–828. [Google Scholar] [CrossRef]
  43. Vasić, V.; Gašić, U.; Stanković, D.; Lušić, D.; Vukić-Lušić, D.; Milojković-Opsenica, D.; Tešić, Ž.; Trifković, J. Towards better quality criteria of European honeydew honey: Phenolic profile and antioxidant capacity. Food Chem. 2019, 274, 629–641. [Google Scholar] [CrossRef]
  44. Kiselova, Y.; Ivanova, D.; Chervenkov, T.; Gerova, D.; Galunska, B.; Yankova, T. Correlation between the in vitro antioxidant activity and polyphenol content of aqueous extracts from Bulgarian herbs. Phytother. Res. 2006, 20, 961–965. [Google Scholar] [CrossRef]
  45. Olszewska, M.A.; Presler, A.; Michel, P. Profiling of phenolic compounds and antioxidant activity of dry extracts from the selected Sorbus species. Molecules 2012, 17, 3093–3113. [Google Scholar] [CrossRef] [PubMed]
  46. Bucić-Kojić, A.; Planinić, M.; Tomas, S.; Jakobek, L.; Šeruga, M. Influence of solvent and temperature on extraction of phenolic compounds from grape seed, antioxidant activity and colour of extract. Int. J. Food Sci. Technol. 2009, 44, 2394–2401. [Google Scholar] [CrossRef]
  47. Souza, J.N.; Silva, E.M.; Loir, A.; Rees, J.F.; Rogez, H.; Larondelle, Y. Antioxidant capacity of four polyphenol-rich Amazonian plant extracts: A correlation study using chemical and biological in vitro assays. Food Chem. 2008, 106, 331–339. [Google Scholar] [CrossRef]
  48. Alañón, M.E.; Castro-Vázquez, L.; Díaz-Maroto, M.C.; Gordon, M.H.; Pérez-Coello, M.S. A study of the antioxidant capacity of oak wood used in wine ageing and the correlation with polyphenol composition. Food Chem. 2011, 128, 997–1002. [Google Scholar] [CrossRef]
  49. Konan, Y.; Witabouna, K.M.; Bassirou, B.; Kagoyire, K. Antioxidant activity and total phenolic content of nine plants from Côte d’Ivoire (West Africa). J. Appl. Pharm. Sci. 2014, 4, 036–041. [Google Scholar]
  50. Pu, F.; Ren, X.-L.; Zhang, X.-P. Phenolic compounds and antioxidant activity in fruits of six Diospyros kaki genotypes. Eur. Food Res. Technol. 2013, 237, 923–932. [Google Scholar] [CrossRef]
  51. Martínez-Valverde, I.; Periago, M.J.; Provan, G.; Chesson, A. Phenolic compounds, lycopene and antioxidant activity in commercial varieties of tomato (Lycopersicum esculentum). J. Sci. Food Agric. 2002, 82, 323–330. [Google Scholar] [CrossRef]
  52. Materska, M.; Perucka, I. Antioxidant activity of the main phenolic compounds isolated from hot pepper fruit (Capsicum annuum L.). J. Agric. Food Chem. 2005, 53, 1750–1756. [Google Scholar] [CrossRef] [PubMed]
  53. Kreicbergs, V.; Dimins, F.; Mikelsone, V.; Cinkmanis, I. Biologically active compounds in roasted coffee. In Proceedings of the 6th Baltic Conference on Food Science and Technology FOODBALT, Jelgava, Latvia, 5–6 May 2011; pp. 110–115. [Google Scholar]
  54. López-Barrera, D.M.; Vázquez-Sánchez, K.; Loarca-Piña, M.G.F.; Campos-Vega, R. Spent coffee grounds, an innovative source of colonic fermentable compounds, inhibit inflammatory mediators in vitro. Food Chem. 2016, 212, 282–290. [Google Scholar] [CrossRef] [PubMed]
  55. Honda, S.; Masuda, T. Identification of pyrogallol in the ethyl acetate-soluble part of coffee as the main contributor to its xanthine oxidase inhibitory activity. J. Agric. Food Chem. 2016, 64, 7743–7749. [Google Scholar] [CrossRef] [PubMed]
  56. Gupta, A.; Jeyakumar, E.; Lawrence, R. Pyrogallol: A competent therapeutic agent of the future. Biotechnol. Environ. Sci. 2021, 23, 213–217. [Google Scholar]
  57. Singh, P.; Arif, Y.; Bajguz, A.; Hayat, S. The role of quercetin in plants. Plant Physiol. Biochem. 2021, 166, 10–19. [Google Scholar] [CrossRef] [PubMed]
  58. Bellion, P.; Olk, M.; Will, F.; Dietrich, H.; Baum, M.; Eisenbrand, G.; Janzowski, C. Formation of hydrogen peroxide in cell culture media by apple polyphenols and its effect on antioxidant biomarkers in the colon cell line HT-29. Mol. Nutr. Food Res. 2009, 53, 1226–1236. [Google Scholar] [CrossRef] [PubMed]
  59. Long, L.H.; Hoi, A.; Halliwell, B. Instability of, and generation of hydrogen peroxide by, phenolic compounds in cell culture media. Arch. Biochem. Biophys. 2010, 501, 162–169. [Google Scholar] [CrossRef]
  60. Mu, K.; Kitts, D.D. Hydrogen peroxide produced from selective phenolic acids in cell culture underlies Caco-2 changes in cell proliferation parameters. J. Agric. Food Chem. 2023, 71, 3022–3032. [Google Scholar] [CrossRef]
  61. Long, L.H.; Clement, M.V.; Halliwell, B. Artifacts in cell culture: Rapid generation of hydrogen peroxide on addition of (−)-epigallocatechin,(−)-epigallocatechin gallate,(+)-catechin, and quercetin to commonly used cell culture media. Biochem. Biophys. Res. Commun. 2000, 273, 50–53. [Google Scholar] [CrossRef]
  62. Suh, K.S.; Chon, S.; Oh, S.; Kim, S.W.; Kim, J.-W.; Kim, Y.S.; Woo, J.-T. Prooxidative effects of green tea polyphenol (−)-epigallocatethin-3-gallate on the HIT-T15 pancreatic beta cell line. Cell Biol. Toxicol. 2010, 26, 189–199. [Google Scholar] [CrossRef]
  63. Valdés, A.; García-Cañas, V.; Koçak, E.; Simó, C.; Cifuentes, A. Foodomics study on the effects of extracellular production of hydrogen peroxide by rosemary polyphenols on the anti-proliferative activity of rosemary polyphenols against HT-29 cells. Electrophoresis 2016, 37, 1795–1804. [Google Scholar] [CrossRef]
  64. Chai, P.C.; Long, L.H.; Halliwell, B. Contribution of hydrogen peroxide to the cytotoxicity of green tea and red wines. Biochem. Biophys. Res. Commun. 2003, 304, 650–654. [Google Scholar] [CrossRef]
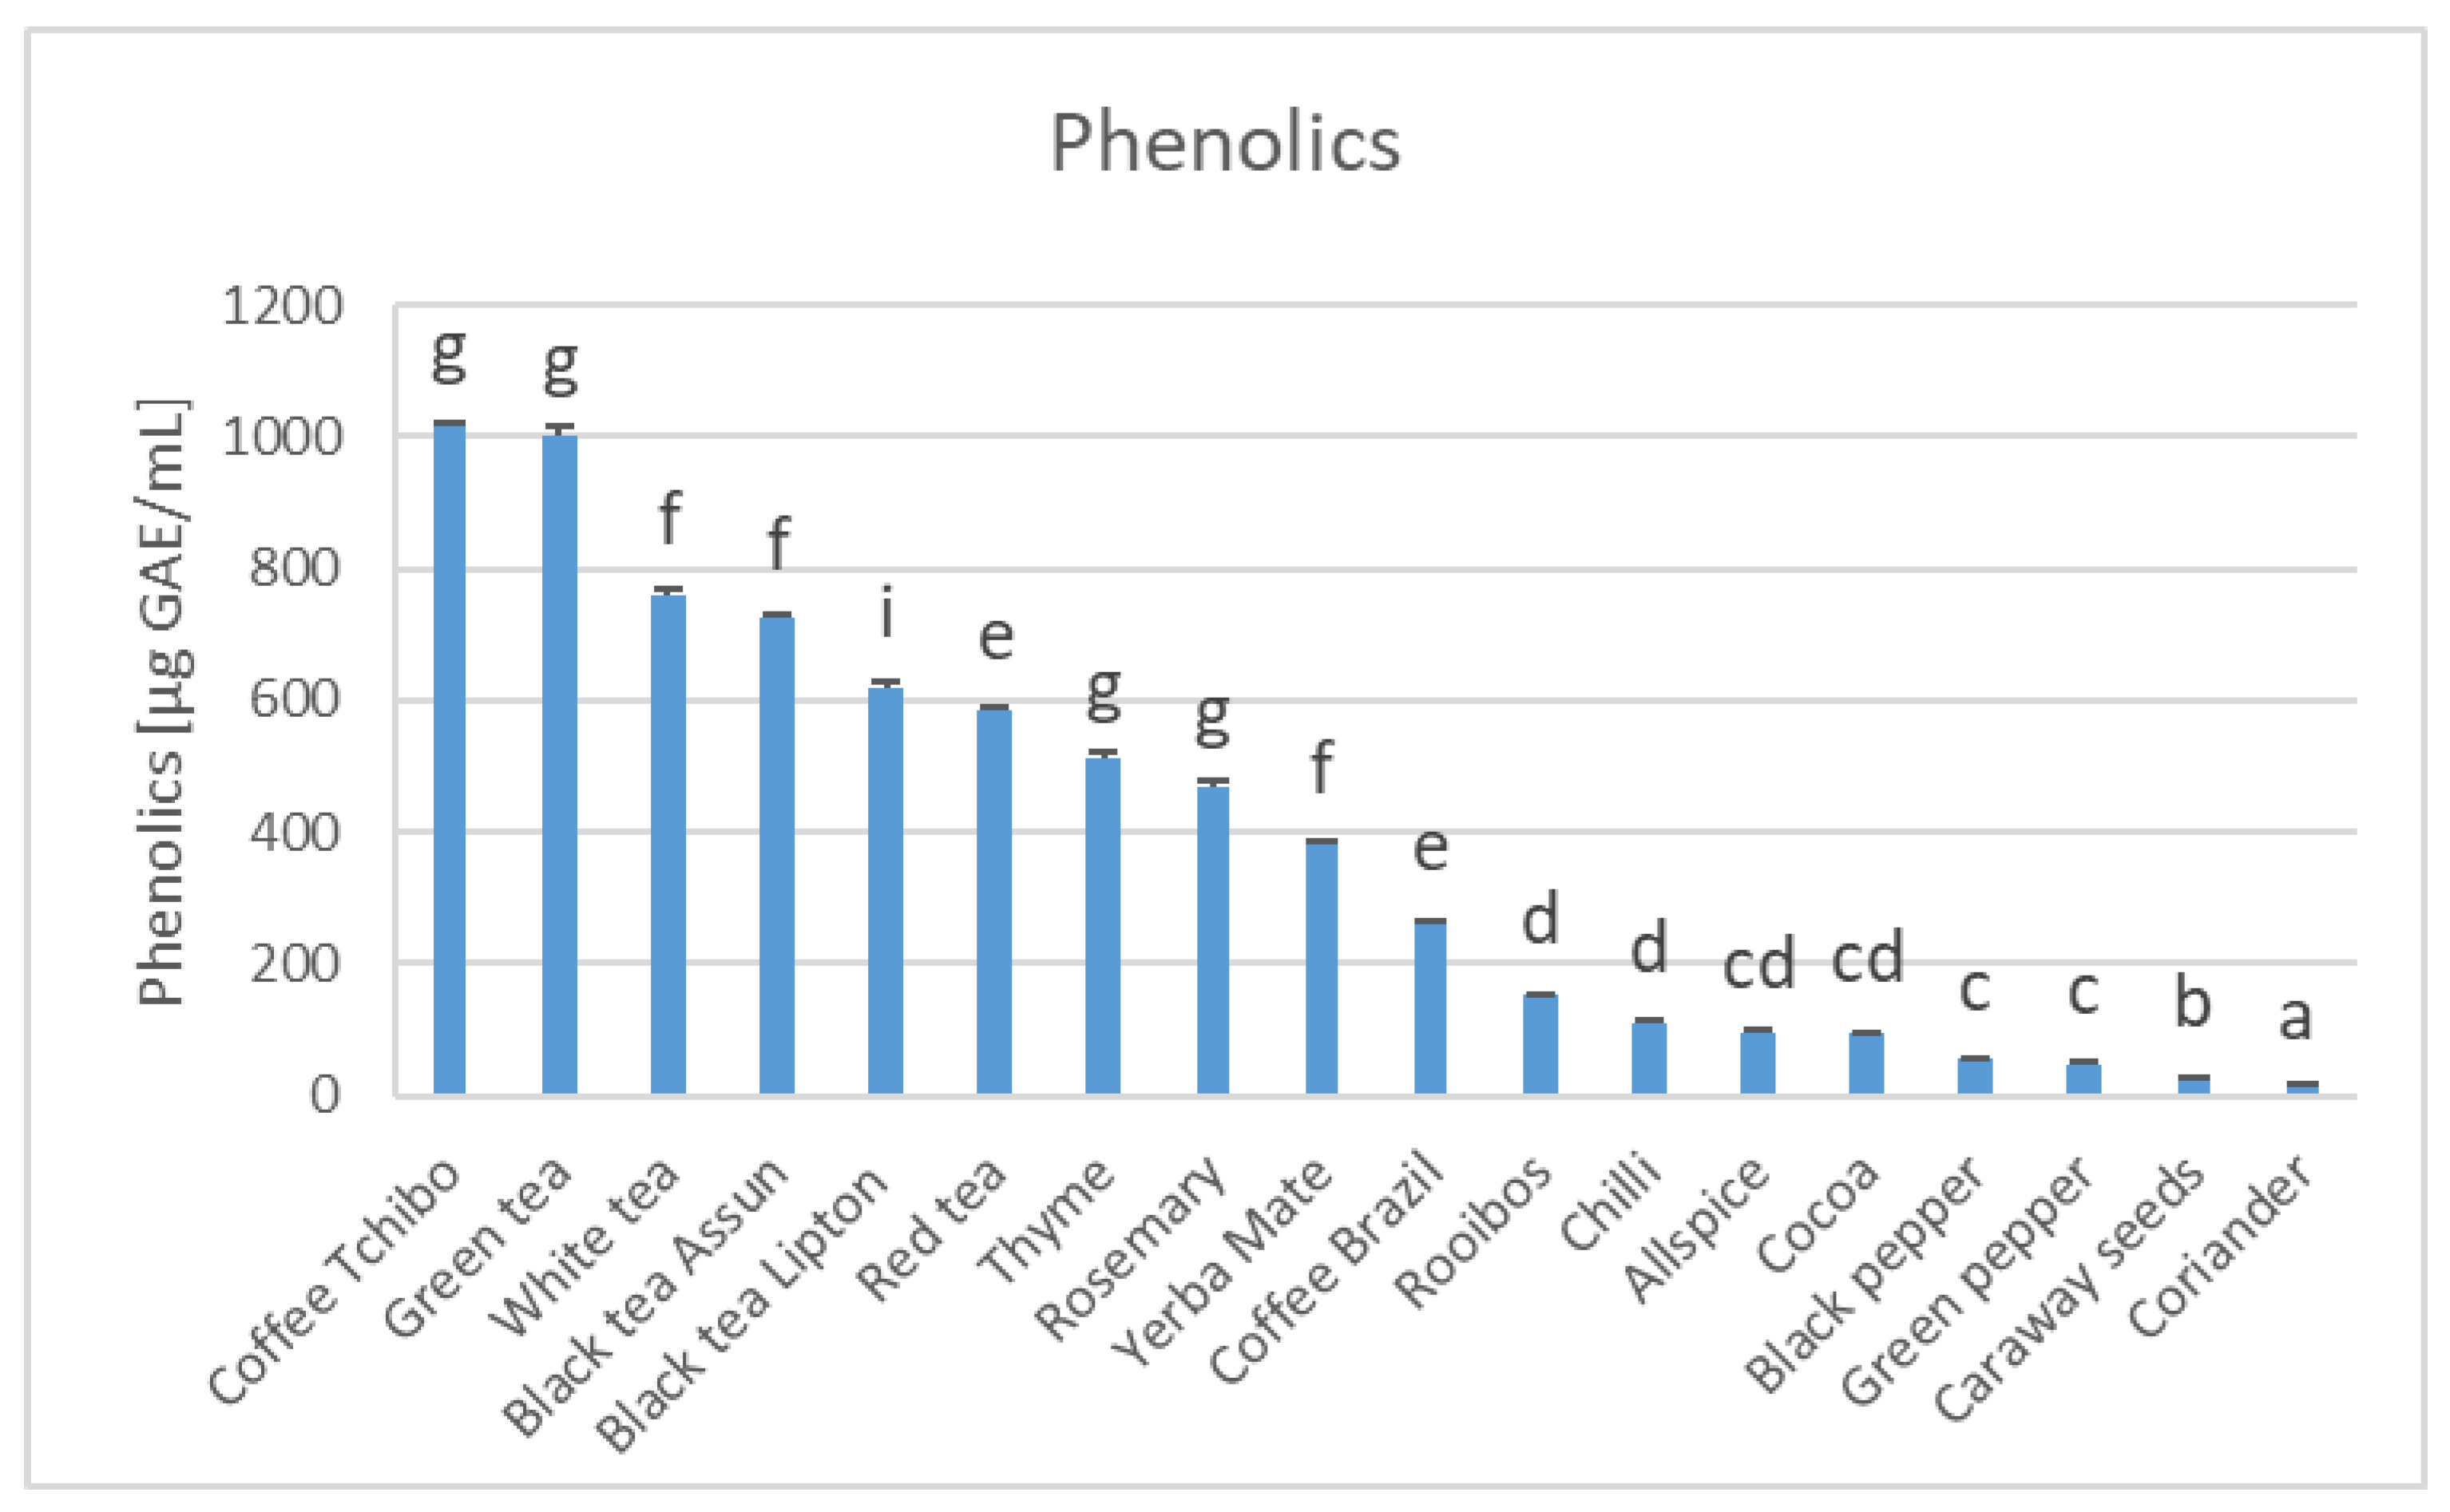
Figure 1. The content of phenolic compounds and TAC estimated by various methods of coffee, cocoa, tea, and extracts of medicinal herbs and spices. Values with different letter superscripts are significantly different at p < 0.05 (ANOVA test).
Processes 12 00166 g001aProcesses 12 00166 g001bProcesses 12 00166 g001c
Figure 2. Concentration of hydrogen peroxide in the infusions at “zero time” and after 1 h (A) and the difference between the readings after 1 h and at “zero time” (B). Values with different letter superscripts are significantly different at p < 0.05 (ANOVA test).
Processes 12 00166 g002aProcesses 12 00166 g002b
Figure 3. Generation of hydrogen peroxide as a function of concentration of three polyphenols (0.5–5 mM) and incubation time (0–3 h). Values with different letter superscripts are significantly different at p < 0.05 (ANOVA test).
Processes 12 00166 g003aProcesses 12 00166 g003b
Figure 4. Hydrogen peroxide concentrations found in polyphenol solutions containing various concentrations (5–50 μM) of exogenous hydrogen peroxide. Values with different letter superscripts are significantly different at p < 0.05 (ANOVA test).
Processes 12 00166 g004aProcesses 12 00166 g004b
Figure 5. Deficit of hydrogen peroxide (sum of H2O2 concentrations generated in the absence of exogenous H2O2 and of added hydrogen peroxide minus H2O2 concentration detected) during incubation of 2 mM polyphenols with exogenous hydrogen peroxide (5–50 μM).
Processes 12 00166 g005aProcesses 12 00166 g005b
Table 1. Pearson correlation coefficients between the parameters measured.
ParameterPhenolics [μg GAE/mL]TAC-ABTS [μmol TE/mL]TAC-FRAP [μmol TE/mL]TAC-CUPRAC [μmol TE/mL]TAC-DPPH [μmol TE/mL]H2O2 Time “0” [μM]
TAC-ABTS0.94 ***
TAC-FRAP0.90 ***0.83 ***
TAC-CUPRAC0.93 ***0.88 ***0.95 ***
TAC-DPPH0.78 ***0.74 ***0.63 **0.68 ***
H2O2 time “0”0.250.400.130.210.31
H2O2 1 h−0.37−0.37−0.31−0.30−0.400.48 *
Delta H2O2−0.61 **0.73 ***0.45 *0.49 *0.69 ***0.16
Delta H2O2, the difference between H2O2 concentration after 1 h incubation and time “0”; * p < 0.05, ** p < 0.01, *** p < 0.001.
Table 2. Reported correlation coefficients between various TAC assays of plant-derived products.
Correlation between Total Phenolic Content and:MaterialCorrelation Coefficient r Reference
TAC/DPPH decolorizationCoffee0.88[39]
TAC/ABTS decolorizationCoffee0.82[39]
TAC/Crocin bleaching Sicilian wines 0.98[40]
TAC/FRAPMillefiori honeys0.97[41]
TAC/DPPH decolorizationSlovenian honeys0.93[42]
TAC/FRAPSlovenian honeys0.97[42]
TAC/DPPH decolorizationEuropean honeydew honeys0.86[43]
TAC/ABTS decolorizationExtracts of 23 Bulgarian plants0.92[44]
TAC/ABTS decolorization Extracts of inflorescences and/or leaves of seven Sorbus species0.80[45]
TAC/DPPH decolorizationExtracts of inflorescences and/or leaves of seven Sorbus species0.74[45]
TAC/FRAPExtracts of inflorescences and/or leaves of seven Sorbus species0.65[45]
TAC/DPPH decolorizationExtracts of grape seeds0.99[46]
TAC/FRAPExtracts of various parts of four Amazonian plants0.80[47]
TAC/ABTS decolorizationExtracts of oak wood used in wine aging0.95[48]
TAC/DPPH decolorizationExtracts of oak wood used in wine aging0.97[48]
TAC/FRAPExtracts of oak wood used in wine aging0.96[48]
TAC/DPPH decolorizationChosen Côte d’Ivoire plants0.97[49]
TAC/ABTS decolorization,Various persimmon genotypes0.91[50]
TAC/DPPH decolorizationVarious persimmon genotypes 0.96[50]
TAC/FRAPVarious persimmon genotypes 0.97[50]
TAC/ABTS decolorizationNine tomato varieties0.42[51]
TAC/DPPH decolorizationGreen peppers0.84[52]
TAC/DPPH decolorizationRed peppers0.59[52]
Disclaimer/Publisher’s Note: The statements, opinions and data contained in all publications are solely those of the individual author(s) and contributor(s) and not of MDPI and/or the editor(s). MDPI and/or the editor(s) disclaim responsibility for any injury to people or property resulting from any ideas, methods, instructions or products referred to in the content.