Article

Development Law of Water-Conducting Fracture Zones in Overburden above Fully Mechanized Top-Coal Caving Face: A Comprehensive Study

by
Tao Hu
,
Kaiqiang Han
*,
Chunhua Song
*,
Jiancheng Che
,
Bo Li
,
Taihu Huo
and
Tongxu Hu
School of Energy & Architectural Engineering, Shandong Huayu Institute of Technology, Dezhou 253034, China
*
Authors to whom correspondence should be addressed.
Processes 2024, 12(10), 2076; https://doi.org/10.3390/pr12102076
Submission received: 30 August 2024 / Revised: 15 September 2024 / Accepted: 19 September 2024 / Published: 25 September 2024

Abstract

:
Although it is of great significance to master the height of the water-conducting fracture zone (WCFZ) to prevent coal mine disasters and ensure safe production, the most important thing is to predict the height and range of the WCFZ ahead of the working face design before coal mining. Therefore, the 150313 fully mechanized top-coal caving working face of the Yinying coal mine was taken as the engineering background. The development laws of WCFZ were studied using comprehensive research methods, including similar simulation experiments, key strata theory, the experience formula, the numerical simulation, etc. The results show that the WCFZ evolution stage is “goaf–caving zone–fracture zone” and the developing pattern is in a non-isosceles trapezoid gradually developing upward and forward. The height of the WCFZ in the 150313 working face is 89.36 m, and the fracture/mining ratio is 12.46, which is consistent with the actual production. Apparently, the set of indoor research methods in this paper is feasible to predict the height and scope of the WCFZ. The research results can provide a scientific reference for safe mining of the 15# coal seam in Shanxi Province and the prevention and control of roof water hazards.

1. Introduction

At present, the overburden strata above the goaf will undergo spatiotemporal deformation processes such as caving, fracturing, and settlement in the fully mechanized longwall top caving mining due to the influence of the gradual increase in the roof suspension area as the working face advances. Overburden would deform the fracture and undergo the process of developing three vertical zones and three horizontal zones [1,2], that is, the three vertical zones—caving zone, fracture zone, and bending subsidence zone—will form vertically upward from the stope roof; the three transverse zones—mining support pressure affected zone, fissure development zone, and the re-compacting zone—will form from the inner of coal seams to the goaf, as shown in Figure 1. Among them, the caving zone and the fracture zone are collectively referred to as the water-conducting fracture zone (WCFZ). They are channels for the storage and transportation of fluids such as water and gas [3], and the WCFZ would trigger a series of problems and accidents, mainly including the formation of ground fractures, surface collapse, the decline of underground water level, water and soil erosion, gas outburst explosion accident, and underground water/sand inrush accidents [4,5]. So, the WCFZ would pose a serious threat to the safety of production in a coal mine [6]. The study of the evolution law of the WCFZ can provide a basis for the prevention and control of water and gas in coal mining. Accurately predicting the development of the WCFZ height and range in advance is a necessary condition for scientific and reasonable mining design of the coal mining face. Therefore, the WCFZ has always been a hot research spot for all coal mine scientists and technicians.
According to the latest scientific research achievements, the WCFZ is a key focus of scientific research in coal mine safety. Zhang et al. [6] obtained the height of the WCFZ and the split-to-mining ratio in the Kongzhuang coal mine. Hu et al. [7] predicted the height of the WCFZ under a high overburden caving strength based on a distributed fiber optic sensing approach. Wei et al. [8] discovered the number and the development height of fractures undergoing the change–growth process of “slow–rapid–uniform” and found that, overall, the WCFZ is “saddle-shaped”. Zhang et al. [4,9] studied the height and characteristic developments of the WCFZ in weakly cemented overlying strata of Jurassic coal mines in western China. Cao et al. [10] studied the actual development height of the WCFZ and the fracture production ratio under the influence of a water-rich fault. Chang et al. [11] found that the development and evolution of the height of the WCFZ present four stages: “development–slow increase–sudden increase–stability”. Mai et al. [12] studied the development of the WCFZ in fault-bearing roofs under repeated mining of extra-thick coal seams. Recently, with the development of AI, deep learning, etc., many researchers have studied the height of the WCFZ using these new technologies—for example, Gao et al. [13] predicted the WCFZ height in the Jurassic coalfield of the Ordos Basin using an IRMO-BP-NN model, Wang et al. [5] utilized an improved back propagation neural network to predict the WCFZ height, and so on. It can be seen that scholars have been applying and developing various advanced methods to predict the height of the WCFZ and contribute to the safety of coal mine production.
From the aforementioned, it can be summarized that the research methods for the development law of the mining-induced WCFZ mainly include an indoor similar simulation physical experiment, numerical simulation, theoretical analysis, on-site field experiments, etc. Although the reliability of on-site monitoring data is higher and closer to the actual situation, the duration of on-site monitoring cycles is quite long, the cost of on-site monitoring is quite high, and the human resources required for on-site monitoring are considerable, often making it daunting. Obviously, on-site monitoring poses a risk of personnel injury, and if the monitoring results are abnormal, the coal mining design must be modified, which can also cause significant national property damage. Therefore, the height and development pattern of the WCFZ need to be predicted in advance before the design and mining of the working face. We must pay more attention and various efforts to study the WCFZ before coal mining and use indoor methods to predict the development law of the mining-induced WCFZ.
Based on traditional underground coal mining and a mining pressure theory, this paper adopts a comprehensive indoor research method, including theoretical empirical formulas, numerical simulations, and indoor similar simulation experiments, and combines that with the key strata theory to scientifically predict the height of the WCFZ in the 150313 working face of the Yinying coal mine and further reveal the overall, comprehensive, and integrated deformation movement laws of the WCFZ in time and space, making contributions to the safety production in the Yinying coal mine and other coal mines with similar geological and productive conditions.

2. Project Profile

2.1. Engineering Outline

The Yinying coal mine is located in Yinying Town, Yangquan City, Shanxi Province, about 11.0 km away from Yangquan City. Its geographical position is located in the northeast of the Qinshui coalfield in Shanxi Province, on the western wing of the northern section of the Taihang Mountains. The mountains in the area are steep and the gullies are crisscrossing. The production scale of the mine is 2.4 million tons per year, with a maximum width of 8.2 km from east to west and a maximum length of 6.5 km from north to south, covering an area of 23.46 km2.

2.2. Hydrogeological Engineering Geology and Coal Measure Strata

2.2.1. Hydrogeological Engineering Geology

The geological strata of overburden in the 150313 working face, from old to new, are as follows: Paleozoic Ordovician (O), Carboniferous (C), Permian (P), Mesozoic Triassic (T), Jurassic (J), Cenozoic Neogene (N), and Quaternary (Q). The topsoil layer is relatively thin and widely distributed, mainly consisting of the Quaternary Middle Pleistocene and Upper Pleistocene. The internal structure of the coal measure strata is simple, with an overall northwest trending and southwest dipping monocline structure. The stratigraphic orientation is generally gentle. The aquifer mainly includes the Quaternary loose layer pore aquifer, the Permian sandstone fissure aquifer, the Carboniferous Taiyuan Formation thin layer limestone aquifer, and the Ordovician limestone aquifer. Among them, the loose layer pore aquifer and the Ordovician limestone are far away from the 15# coal seam, which has a relatively small impact on coal seam mining. The direct aquifer of the roof of the 15# coal seam is the K2 limestone dissolution fracture aquifer of the Taiyuan Formation, and the indirect water filling aquifer is the sandstone fracture aquifer of the Shanxi Formation and the lower Shihezi Formation. The Permian sandstone fissure aquifer in the roof contains multiple layers of sandstone fissure aquifers, belonging to weak-to-moderate water-rich strata.

2.2.2. Coal Measure Strata

The coal-bearing strata are mainly composed of the Taiyuan Formation of the Paleozoic Carboniferous and the Shanxi Formation of the Permian.
The mining coal seam is the 15# coal seam of the Taiyuan Formation with an average thickness of 7.23 m, which is relatively stable. The geological conditions for the occurrence of the 15# coal seam are simple, with a stratigraphic orientation and attitude close to horizontal. The direct roof of the coal seam is mainly composed of mudstone, with an average thickness of 1.0 m, and locally developed carbonaceous mudstone pseudo-top-roof with a thickness of 0.1~0.5 m. The basic roof is K2 limestone, which is relatively intact, with an average thickness of 12.5 m. The overlying rock formations of the K2 limestone basic roof are a composite of fine sandstone and mudstone. The direct floor layer is the 1.31 m sandy mudstone of the bottom plate, and the hard K1 coarse sandstone of 6 m thick is directly beneath the direct floor, as shown in Figure 2.

2.3. Brief Description of the 150313 Working Face in Yinying Coal Mine

The working face of the WCFZ to be studied in this paper is the 150313 working face of 15# coal seam in the Yinying mine. The inclined length of the 150313 working face is 228 m, the advancing distance of the strike is 1000 m, and the average burial depth of the coal seam is 400 m. The working face adopts the fully mechanized longwall top-coal caving method, the roof is managed by the full caving method, the coal cutting height is 3 m, and the top coal thickness is 4.23 m. The ventilation of the working face adopts a basic dual roadway setup of an intake airway and a return airway, with the intake airway serving as both a transportation roadway and a personnel access channel, as shown in Figure 2.
To study the development law of the WCFZ in the working face, the empirical formula mandated by the state was first used to calculate the height of the WCFZ. Then, FLAC3D 5.0 finite difference software was used to simulate the evolution process of the WCFZ during the working face advance. Finally, the development law of the WCFZ was verified through an indoor similar simulation experiment combined with the key strata theory.

3. Height Prediction of the WCFZ in a Fully Mechanized Mining Face

The “Code for Retaining and Mining Coal Pillars in Buildings, Water Bodies, Railways, and Main Mines” is a mandatory regulation jointly issued by the State Administration of Work Safety, the State Administration of Coal Mine Safety, the National Energy Administration, and the State Railway Administration [14]. Due to the fact that underground coal mining must first comply with the requirements stipulated in this regulation, the height of the WCFZ is calculated according to this regulation. Owing to the fact that the 15# coal seam in the Yinying coal mine is mined by layered top-coal caving in thick coal seams and that its basic roof is composed of hard K2 limestone, the WCFZ height is predicted based on the corresponding Formulas (1)–(3).
H k = 100 M 2.1 M + 16 ± 2.5
H li = 100 M 1.2 M + 2.0 ± 8.9
H l i = 30 M + 10
Here, the formulas are applicable to the hard rock layers’ roof, such as quartz sandstone, limestone, and conglomerate. The formula application range stipulates “single layer mining thickness of 1–3 m, cumulative mining thickness not exceeding 15 m”. Hk is the height of the caving zone, m; M is the accumulated thickness of the coal seam, m, with a maximum value of 7.23 m. Hli is the height of the WCFZ. The height of the caving zone and the height of the WCFZ are calculated as follows.
From Formula (1), H k 1 = 20.685 ~ 25.685   (m); from Formula (2), H l i 2 = 58.822 ~ 76.622 (m); from Formula (3), H l i 3 = 90.666   ( m ) .
In addition, according to actual coal mining production experience, the broken rock blocks in the caving zone have fragmentation and swelling properties. After the goaf is filled with broken rock blocks, overburden strata will stop fracturing and collapsing under their support. Therefore, we can use the fragmentation and swelling properties of rock blocks to calculate the height of the caving zone. According to the experience value in the production practice of coal mining, the fragmentation coefficient of the basic roof is about 1.24, and the height of 30.125 m of the caving zone is obtained:
H = M k 1 = 7.23 1.24 1 = 30.125   ( m )
Due to the presence of multiple aquifers above the 150313 working face, for the sake of safety and conservatism, the larger value of the calculated results is taken as the calculation value for the empirical formula. Therefore, the heights of the caving zone and WCFZ are 30.125 m and 90.666 m, respectively, per the empirical formula calculation.
Furthermore, the fracture/mining ratio of 12.54 and the caving/mining ratio of 4.17 can be calculated per the regulation when computing the WCFZ.

4. Numerical Simulation of the WCFZ Height

Practice and research have disclosed that the maximum height of the WCFZ occurs when the advancing distance of the working face is equivalent to the length of the working face [15]. The length of the studied working face from the intake airway to the return airway is about 220 m; therefore, the maximum height and evolution law of the WCFZ is numerically simulated by FLAC3D 5.0 by simulating the working face advancing 220 m based on the engineering background of the working face, as shown in Figure 2.
FLAC3D 5.0 is a three-dimensional explicit finite-difference program for engineering mechanics computation. The principle of simulating overburden deformation with FLAC3D 5.0 can be referred to in the literature [16,17,18]. The model is established according to the direction of the 150313 working face with dimensions of (length) 420 m × (width) 100 m × (height) 200 m. The x and y directions of the model constrain the horizontal displacement of the boundary, the bottom boundary of the model imposes a vertical (z-direction) displacement constraint, and the upper part of the model is a free boundary. Using the Mohr–Coulomb criterion to simulate rock layers and the zone failure criterion, rocks/coal seams were constructed in the order of the stratigraphic column chart. The model has a total of 346,080 zone units and 369,495 grid points. To eliminate the influence of boundary effects, 100 m are left on both sides, and the advancing distance of the working face is 200 m. The total thickness of the simulated rock layer is 200 m. The equivalent load applied to the upper part of the model is the self-weight stress σz = ρgH where ρ is the average density of the overlying rock layer, 2500 kg/m3; H is the depth from the top boundary of the model to the roof of surface; and the average burial depth of 15# coal seams is 400 m.
During the numerical simulation process, first, the initial model was constructed and the simulation was run until the initial stable state; second, the open-off cut and the stopping line in the model were excavated, and then, the model was run until the equilibrium state, so the simulated working face with a length of 220 m was created; third, according to the equal excavation step distance, the 7.23 m thick of simulated 15# coal seam mining was carried out from the open-off cut to the stopping mining line, with an excavation step distance of 30 m, and the simulation was executed until the equilibrium balance state after every each excavation. The calculation was repeated until the end of the excavation to the stopping line. In the simulation, ten working conditions, when the excavation reached 20 m, 40 m, 60 m, 80 m, 120 m, 160 m, 180 m, and 200 m of the working face, were selected for calculation and explanation. To facilitate modeling and calculation, some thin strata and the Permian strata were merged, respectively, during modeling. The specific physical and mechanical parameters of coal and rock mass found through indoor rock mechanics testing and related stratigraphic data investigation are shown in Table 1 below.

4.1. Contour Maps of Z-Displacement in the Simulation Process

In order to study the displacement deformation of overlying strata after coal mining in the working face, the overall evolution process of the WCFZ is indirectly reflected by analyzing the change in vertical displacement of overlying strata in the stope [10]. As the working face advances, the overlying rock layers gradually break down and continue to expand upward. The vertical displacement of the working face roof shows a decreasing trend. When the working face is sufficiently mined, the height of the caving zone and the fracture zone above the goaf tends to a stable value, which can be approximated as the maximum height of the WCFZ.
At the beginning, the height of the caving zone and the WCFZ gradually increases with the advancement of the working face. The settlement displacement of the overlying rocks in the mining area shows an arch zoning distribution. The displacement arch zone is symmetrically distributed with the centerline of the goaf as the axis of symmetry. The height of the zoning curved arch increases in a strip-like pattern as excavation progresses, as shown in Figure 3 below. Due to the collapse of fractured rock blocks, the displacement of rock layers in the caving zone is significant; the rock layer in the fracture zone maintains the original rock layer connection after the fracture, only maintaining a rotating sinking state, and its settlement displacement is relatively small. Therefore, the height prediction of the WCFZ can be carried out based on the zoning of settlement displacement.
As shown in Figure 3, the goaf formed after the excavation was 20 m. At this point, the direct roof of the coal seam became the unloading space or depressurized zone, with a settlement of 4 cm. The basic roof of the K2 limestone layer had a settlement deformation of 3.6 cm; in the meantime, there was a 9 cm bottom bulge on the bottom floor. When the excavation reached 40 m, the settlement and deformation of the roof intensified, and the direct roof settlement reached 8 cm. There are three subsidence arches in the basic roof of the K2 limestone layer, which are 7.1 cm, 6.7 cm, and 6.2 cm, respectively. When the excavation reached 60 m, the settlement of both the direct and the basic roof reached more than 10 cm, which was significantly different from the displacement of the previous settlement state. This indicates that the basic roof began to collapse at this point, and the bottom bulge of the floor did not change much. So it can be concluded that the WCFZ began to appear with the caving of the direct and basic roof of 15# coal at the 60 m excavation. The height of the caving zone and that of the WCFZ are 7 m and 13 m, respectively, from the roof of the stope, as shown in Figure 3c. When the working face advanced to 100 m, the height of the caving zone reached a roof height of 23 m, and the height of the WCFZ reached 44.5 m, as shown in Figure 3e. When the working face advanced to 120 m, the height of the caving zone was 27 m, and the height of the WCFZ was 78 m. When the working face advanced to 160 m, the height of the caving zone was about 30 m, and the average height of the WCFZ was about 86.5 m. Afterward, the height of WCFZ remained basically stable, and the height of the caving zone also remained basically fixed. It can be seen that at this time, the overlying rock was sufficiently deformed by mining. Then, during the last stage, the WCFZ only expanded in line with the working face excavation, and the height did not change anymore. The height of the caving zone obtained from the vertical displacement contour is 30 m, and the height of the WCFZ is 86.5 m, just as shown in Figure 3a–j.

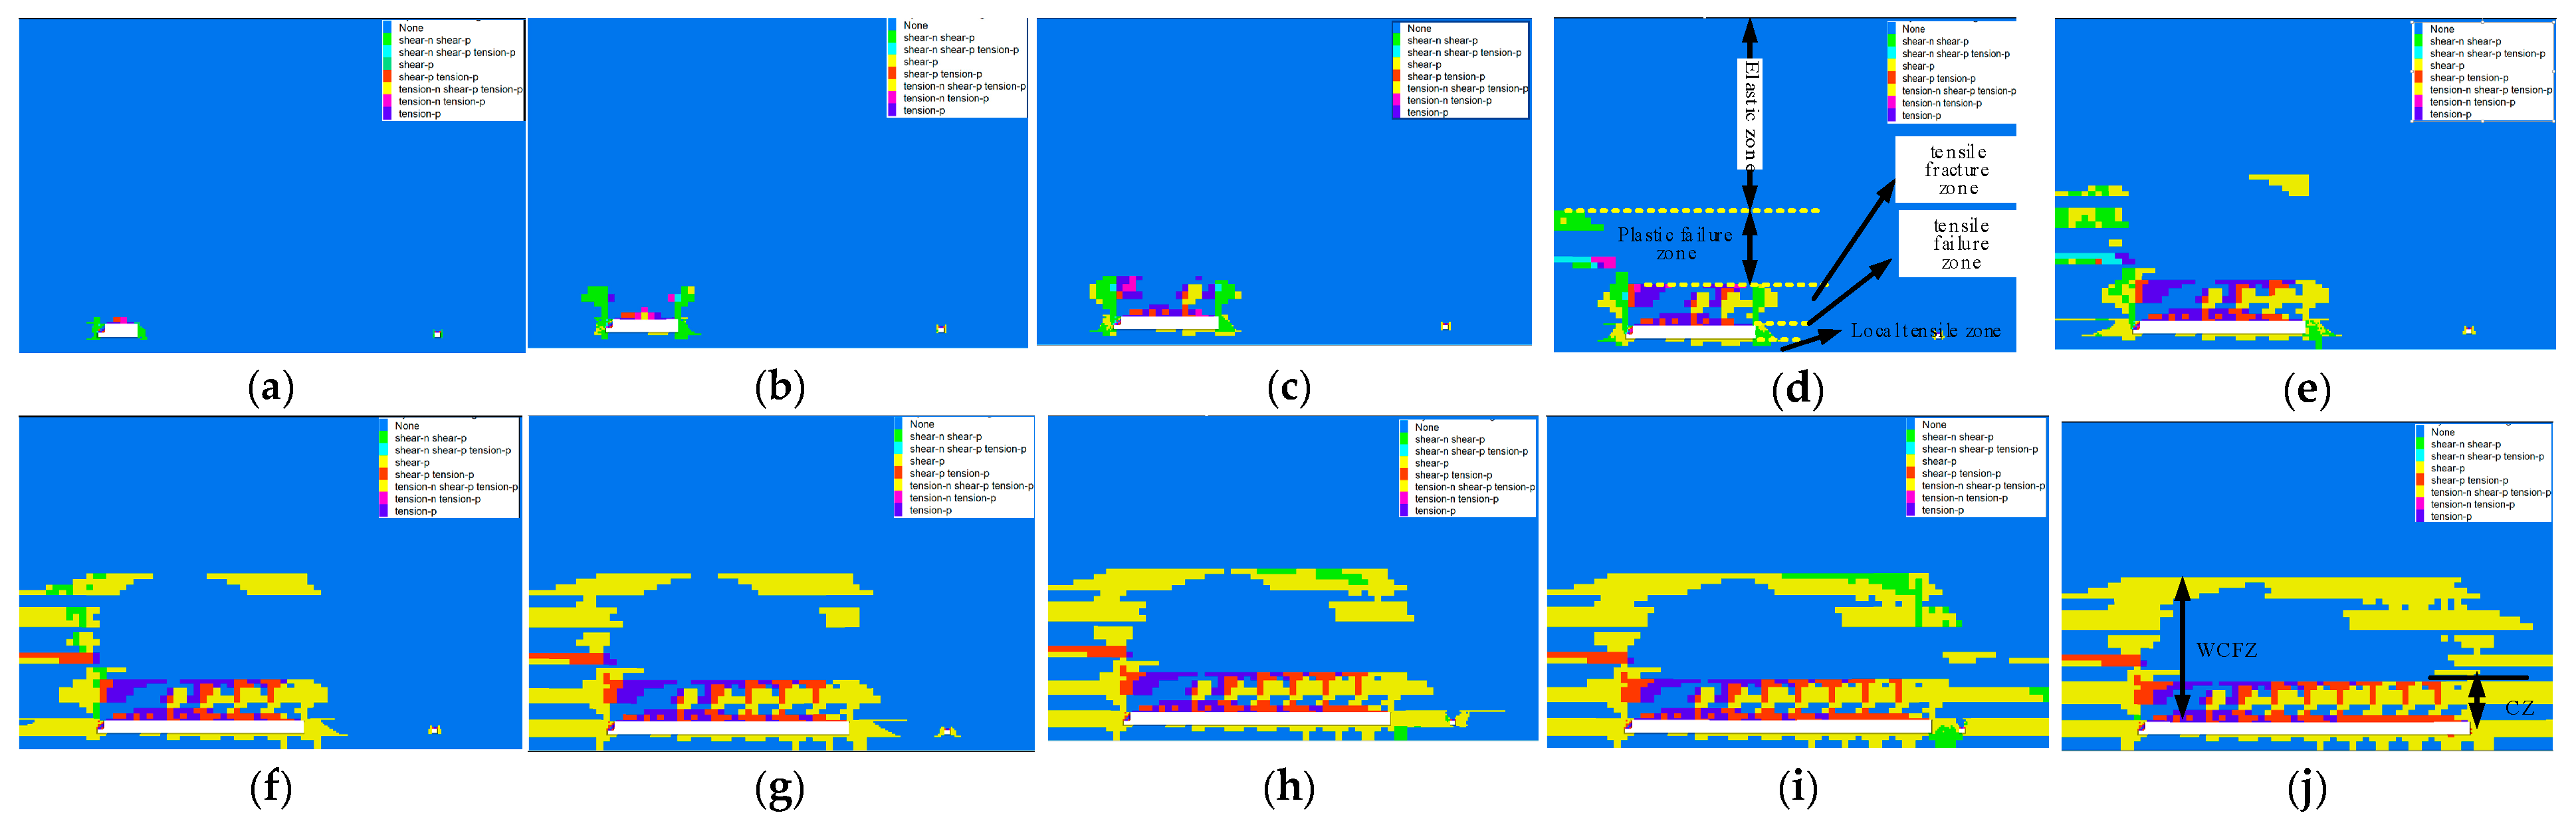
4.2. Distribution of Plastic Zones in Overlying Strata

After the mining of the working face, the overlying rock strata in the goaf are subjected to a tensile and shear failure, which disrupts the original state of elastic balance and forms five zones from top to bottom, namely, elastic zone, plastic failure zone, tensile fracture zone, tensile failure zone, and local tensile zone, as shown in Figure 4d. The upper limit of the fracture zone is determined by the height of the rock layer where plastic deformation or shear failure occurs when the stress of the rock layer exceeds the yield strength or shear strength, while the lower limit of the fracture zone is determined by the height of the rock layer where both tensile stresses of the rock layer exceed the tensile strength and begin to undergo large deformation. Therefore, in numerical simulation, the height of the WCFZ caused by the overlying rock failure is equivalent to the height of the pressure relief zone or plastic zone, and the maximum height of the WCFZ should be less than the maximum height of the tensile stress zone and the maximum height of the plastic deformation zone. FLAC3D indicated that a plastic zone was in a state of shear or tension induced by the high-intensity mining. The height of the WCFZ was taken as equivalent to the height of the de-stressed or plastic zone [18]. In this paper, the tensile failure zone in the lower part of the overlying rock can be regarded as a caving zone, and the shear failure zone in the upper part of the caving zone can be regarded as a fracture zone.
At the beginning of the excavation, there were thinner plastic failures appearing at the edge of the goaf, as shown in Figure 4a. At the early stage of excavation, although a saddle-shaped WCFZ appeared in overburden, the WCFZ height on the open-off cut and the working face was relatively high, as shown in Figure 4b,c. Then, the development of the WCFZ on the open-off cut side became stronger, while the development on the working face side was weaker, as shown in Figure 4d–j. This is due to the support effect of previously fallen gangue in the goaf as the fracture zone on the working face side was poorly developed.
It is also clear that the plastic failure range and height developed with the excavation. From the distribution of yield failure characteristics along the strike profile (Figure 4), it can be seen that due to the isolation of the key strata, there are two areas of plastic zone distribution in the overlying rock layers of the mining area. The lower area of the key strata is the tension failure part of the caving zone, and the upper area of the key strata is the shear failure part of the fracture zone. It can also be seen that after excavating to 140 m, overburden is sufficiently deformed and the height of the fracture zone remains basically stable. From Figure 4j, the height of the caving zone is about 30 m and the height of the WCFZ is somewhat 86.5 m from the stope roof.

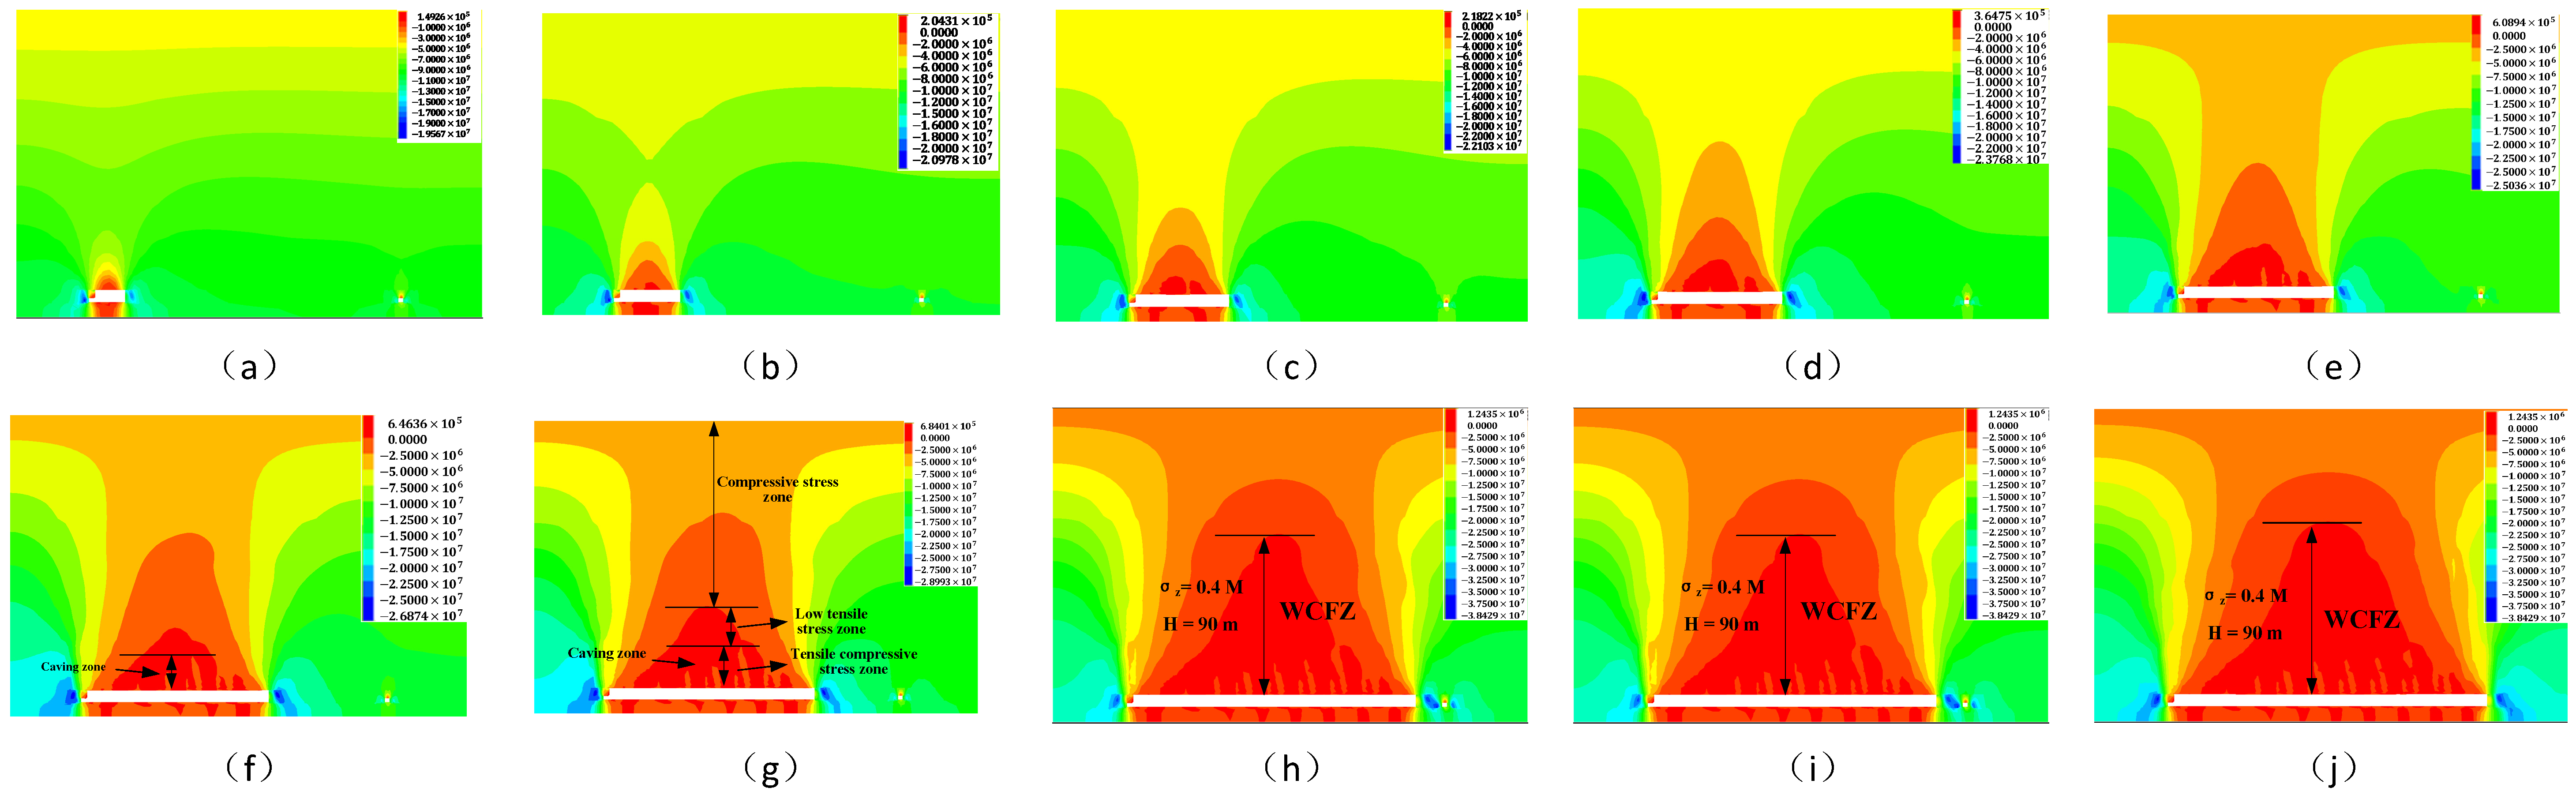
4.3. Distribution of Vertical Stress in Overburden Strata

Under the action of self-weight stress, the initial state of the overlying rock is a compressive stress state. After coal seam mining, the roof of the coal seam undergoes collapse, suspension, and cantilever beam and masonry beam states, causing the stress state of the overlying rock to change from the initial compressive stress to a depressurized state and, finally, to the tensile stress state.
According to the stress distribution, overburden can be divided into three zones based on their size and properties: low tensile stress zone, tensile compressive stress zone, and compressive stress zone, as shown in Figure 5g. Generally speaking, rock layers located in the caving zone experience severe caving and fragmentation, losing their resistance to stress. After the collapse stabilizes, due to the presence of pressure arches, the rock mass remains in the low tensile and compressive stress zone, which is known as the caving zone. Although the rock layers in the fracture zone are in a state of low tensile stress with developed fissures, they basically maintain their original continuity, and the rock layers in the middle of the goaf still have a certain ability to withstand pressure. Above the fracture zone, up to the upper boundary, there is a widespread distribution of compressive stress zones, and the rock layers are basically undamaged.
It is obvious that a large area of roof collapse occurs with the advancement of the working face, and the stress of overburden above the goaf is significantly reduced, which forms low-stress arch zones that gradually develop upward. The range of low-stress arch zones gradually increases and the height and shape also change continuously. Because of the arch zones, the caving zone and fracture zone are fully depressurized zones. The depressurized stress arch develops upward and to both sides with the excavation, as shown in Figure 5.
From the aforementioned, the low tensile stress zone and tensile compressive stress zone can be regarded as the WCFZ and caving zone, respectively, so the height of this fully depressurized zone can also be approximated as the maximum height of the WCFZ, as shown in Figure 5. When the excavation is 40 m, there is a low tensile stress zone appearing above the goaf. As the excavation continues, there will be low tensile and compressive stress zones reappearing in the re-compacting zone of the caving zone, as shown in Figure 5f,g. In summary, the depressurized zone gradually expands its scope and enhances its height with the excavation. After exceeding the excavation depth of 160 m, the tensile stress zone above the goaf is stable in height, as shown in Figure 5h–j. The obtained height of the WCFZ and caving zone are 90 m and 30 m, respectively, as seen in Figure 5.

4.4. Displacement Analysis of Survey Line

According to the chart line profile function on the FLAC3D 5.0 control panel, various survey lines were set up in the simulation to monitor the displacement and deformation status of overburden. They include two survey lines for monitoring the deformation of the overlying rock during excavation: a vertical measuring line set up in the middle of the model, and a horizontal measuring line set up in the basic roof of the K2 limestone layer. They also include five horizontal survey lines set up in the overlying rock layers at model heights of 18 m, 50 m, 80 m, 100 m, and 150 m to monitor the overall settlement and deformation of the overlying rocks.

4.4.1. Horizontal Survey Line for Monitoring the Settlement of Overburden

To disclose the movement law in the mining-induced deformation of overburden, the horizontal line from coordinate point (0, 0, 22) to coordinate point (420, 0, 22) was set in the K2 limestone layer of the 15# coal seam roof. The displacement variation curve with the excavation advance of the survey line is shown in Figure 6a below.
From the open-off cut side to the excavating position, the settlement curve of the roof shows a sinking semi-circular shape, with the center position continuously advancing with the excavation of the working face. It is evident from the figure that the settlement displacement of the roof gradually increases with the excavation of the working face. As can also be seen in the figure, due to the sufficient collapse on the side of the open-off cut and the support of the gangue fragmentation, the settlement displacement and strength on the side of the open-off cut are relatively smaller compared with the working face side.

4.4.2. Vertical Settlement of Survey Lines at Various Heights in the Model

To explore the development laws of the WCFZ in both horizontal and vertical directions, horizontal measuring lines were set at different heights of the overlying rock to monitor its settlement displacement, as shown in Figure 6b.
These survey lines were set up during the excavation of 200 m on the working face. As shown in the figure, the settlement deformation of the overlying rock gradually decreases from bottom to top. After reaching a height of over 100 m in the model, the deformation of the overlying rock is already very slight, indicating that this height belongs to the bending subsidence zone. The height of 18 m is located directly at the top roof of the coal seam, and the settlement is significant and strong, indicating that the roof has collapsed and it belongs to the caving zone. Although the survey line at the 50 ~ 80 m height of the model is large, there is a significant difference in the displacement compared with that of the direct roof survey line, and the value is relatively small, indicating that this layer is located within the range of the fracture zone.

4.4.3. Vertical Survey Line for Monitoring the Settlement of Overburden

The vertical line is located in the middle of the model. The displacement curve of the vertical measuring line shown in Figure 6c has a curved shape that gradually bends to the right from top to bottom. It can be seen that the upper part of the curve belongs to the bending subsidence zone where the displacement deformation of overburden is relatively small. The curved part of the lower curve has a large displacement and belongs to the WCFZ, and the part with a larger curvature and displacement of overburden is a caving zone. With the excavation, the various curves continue shifting to the right, which means the vertical displacement of the overlying rock gradually increases.
By integrating the vertical displacement cloud map, vertical stress cloud map, and plastic failure state cloud map, combined with the analysis of vertical and horizontal measurement lines, the height of the caving zone was estimated as 30 m, and the height of the WCFZ was estimated as 86.5 m in the FLAC3D 5.0 numerical simulation.
Furthermore, it can be calculated that the fracture/mining ratio is 11.96 and the caving/mining ratio is 4.15 in the FLAC3D 5.0 numerical simulation of the WCFZ in the 150313 working face.

5. Similar Simulation Physical Experiment for a Movement Law of the WCFZ

Due to the fact that the WCFZ is the result of overburden mining deformation, it is necessary to study the overburden mining deformation in order to accurately predict the development height of the WCFZ. Research and practice have shown that the deformation caused by overburden mining is the result of the movement of rock blocks. Rock movement is a comprehensive reflection of the movement of “rock blocks” formed by the overlying hard rock layers (key strata) as the working face advances [19]. In fact, the evolution of the WCFZ caused by coal seam mining is related to the movement of rock strata breaking during mining. The fracturing movement of mining rock layers is controlled by key strata, and the evolution of the WCFZ is inevitably influenced by the structure of key strata [20]. The development of the WCFZ is highly controlled by the primary key strata (PKS) and subkey strata (SKS). The method of predicting the WCFZ height based on the KS theory is closer to the realistic in situ measured value and more objective [21]. All other methods must comply with the requirements of the key strata theory. The PKS plays a decisive role in the rock movement and would cause the overburden fracture in the earth’s surface if it fractures and breaks. In contrast, the SKS refers to the stratum that plays a subordinate decisive role in rock movements [8]. The method for determining the WCFZ height using the KS theory is as follows:
  • The position of the KS in the overlying rock will affect the height of the WCFZ. Only when the distance between the KS and the mined coal seam is less than a certain critical height, the fractures in the KS will penetrate and become water-conducting fractures. Moreover, the fractures in the overlying rock layer controlled by the KS will also penetrate and become water-conducting fractures.
  • The critical height for the breakthrough of KS fractures can be roughly estimated as (7–10) M (where M is the coal seam cutting thickness). When the PKS of the overlying rock is located within the critical height (7~10) M, the WCFZ will develop to the top of the bedrock, and the height of the WCFZ will be equal to or greater than the thickness of the bedrock.
  • When the distance from the PKS to the coal seam is greater than (7~10) M, the WCFZ in the roof will develop to the position below the nearest KS being (7~10) M more away from the coal seam, and then, the height of the WCFZ equals the distance of the KS to the coal seam.
Based on the KS theory, the overburden’s key strata are harder and stronger than other layers, and when they fracture or collapse, the soft rock above them also collapses [22]. Obviously, in order to accurately predict the height of the WCFZ, the process of determining the key strata in overburden is the key and focus of research. Therefore, this paper carried out a similar simulation physics model experiment based on Brillouin optic frequency domain analysis (BOFDA) to achieve the following two objectives: the first is to predict the height of WCFZ based on the key strata positions determined through experiments; the second is to use the optical fiber strain variations of buried optical fibers in the model to characterize the height and development law of the WCFZ.

5.1. Outline of the Similar Simulation Experiment

To explore the height and development law of the WCFZ in the working face, BOFDA distributed fiber optic sensing technology (DFOS) and close-range photography technology (CRP) were applied as monitoring methods. The 150313 working face was taken as the engineering background, and the geological rock column chart and rock physical and mechanical parameters of the working face were used as the basis. The EWM two-dimensional test bench was used, and a similar simulation experiment model with a length × width × height of 4200 mm × 250 mm × 1600 mm was constructed using fine sand, lime, gypsum, mica powder, black ink, and water. This experiment adopts a geometric similarity ratio of 1:150, a density similarity ratio of 1:1, a time similarity ratio of 1:12.25, and an elastic modulus-to-strength similarity ratio of 1:150. The experimental model and BOFDA testing system are shown in Figure 7.

5.2. Layout of Optical Fiber Monitoring System and CRP System

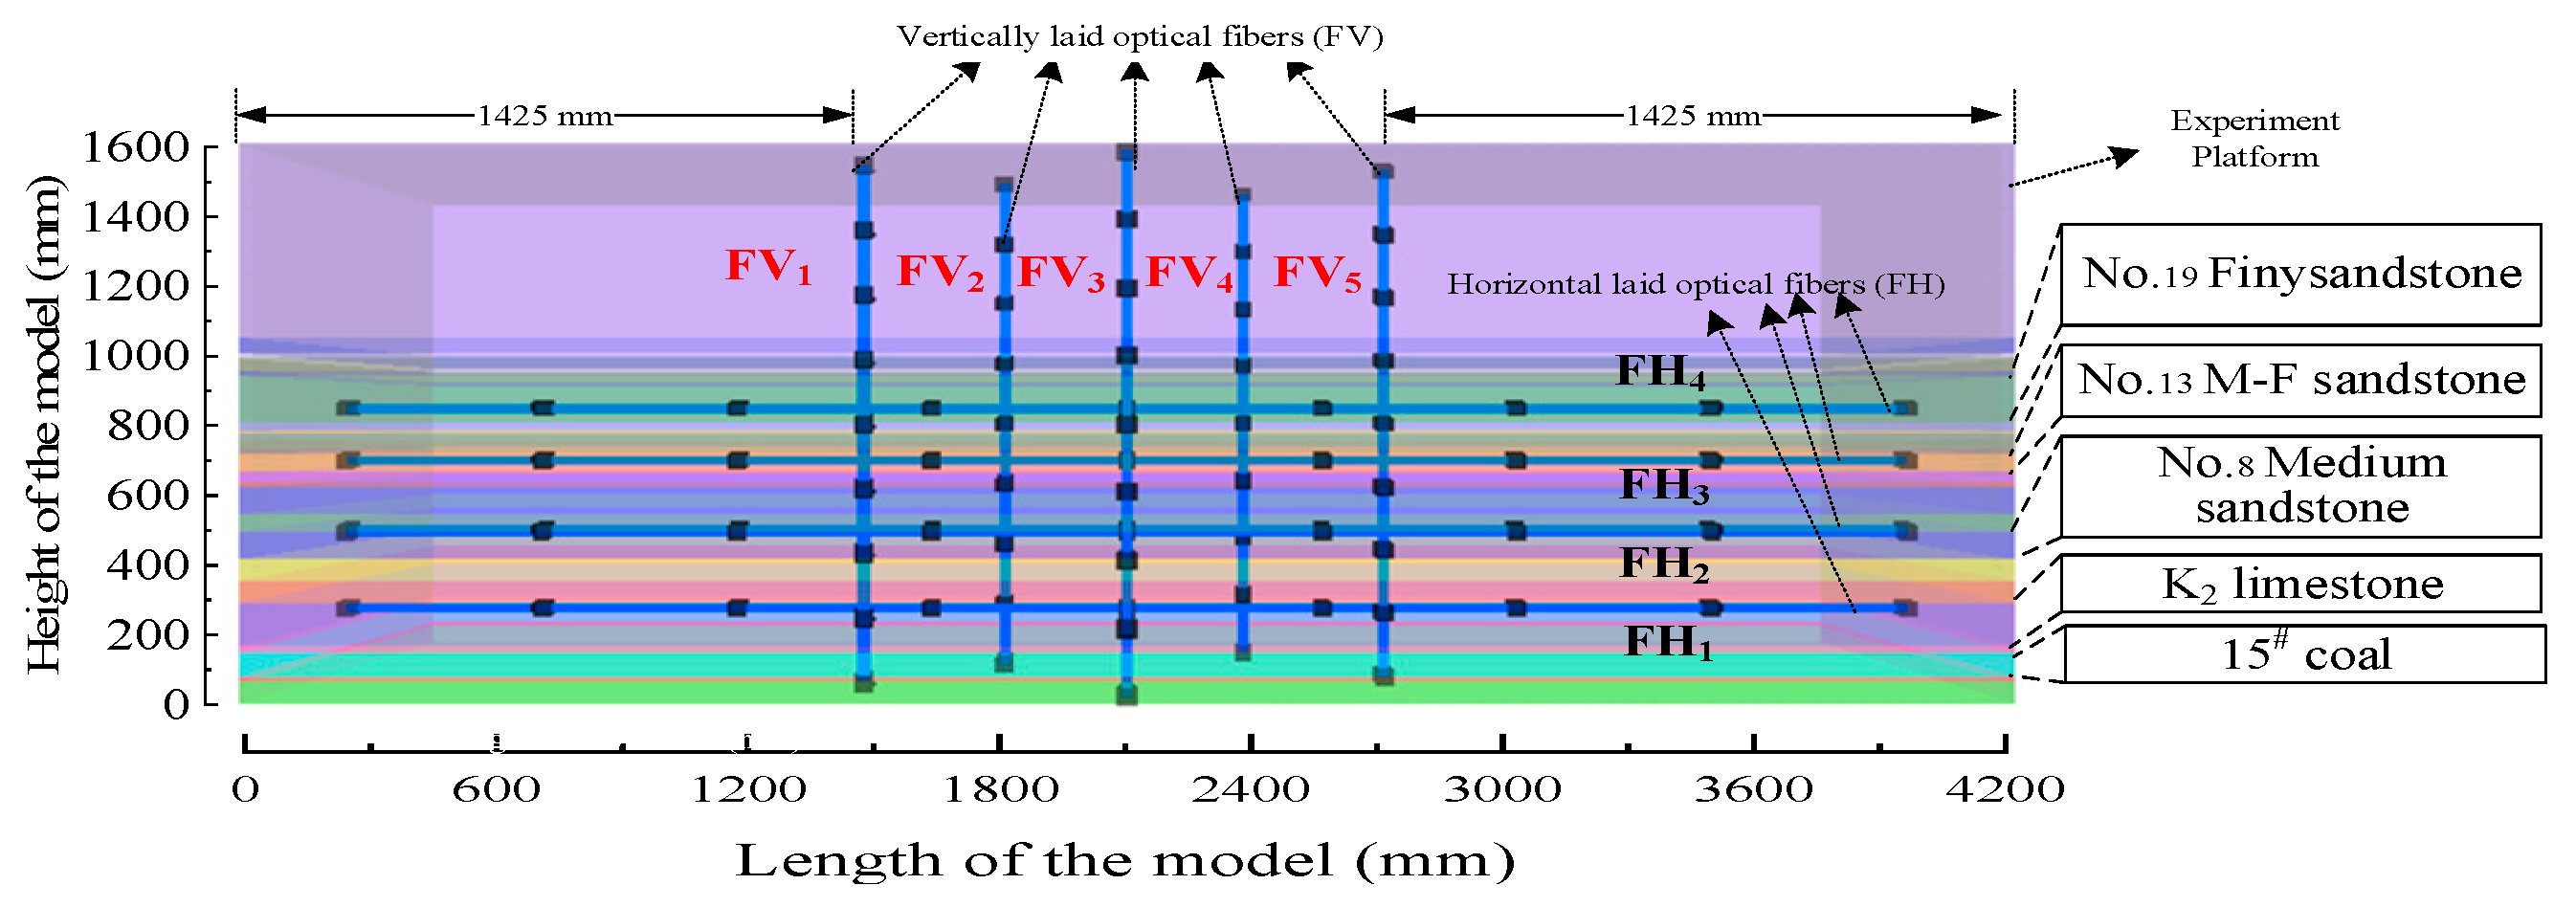
5.2.1. Layout of Optical Fibers in the Model

To fully represent the deformation of the overlying rock strata during the excavation of the working face, five sections of vertical optical fibers are uniformly laid from the open-off cut side to the stopping line position, denoted as FV1, FV2, FV3, FV4, and FV5. In the meantime, four horizontal optical fibers are laid with different height levels in advance, labeled as FH1, FH2, FH3, and FH4, as shown in Figure 8.

5.2.2. The Close-Range Photogrammetry System

At the same time, a close-range photogrammetry (CRP) image processing system was constructed to measure the displacement of rock deformation and verify the accuracy of optical fiber strain measurement. A CRP system consists of a high-speed camcorder, a DSLR digital camera, measuring points, and image processing software (computer), as shown in Figure 9a.
The camera adopts a Nikon DSLR digital camera with a resolution of 3008 × 1960 pixels, and the photos taken are stored in JPG format; a high-definition camcorder is used to continuously capture the deformation of the overlying rock during the excavation process. The coordinate system takes the inner edge of the left border as the y-axis, the inner edge of the bottom border as the x-axis, and the lower left corner of the border where the x-axis and y-axis intersect as the plane coordinate origin.
Before the experiment, manual markings (measurement points) were pasted on the surface of the model, on both sides of the model frame, and on the upper and lower plates of the model frame, as shown in Figure 7a. The marked points on both sides of the model steel frame, as well as the marked points on the upper and lower steel plates of the model frame, are used as reference points or benchmarks. Because their positions are fixed and unchanged during the experimental process, they can be used to observe and calculate the displacement changes of the marked points on the surface of the model during the mining process, that is, the vertical and horizontal displacement of the overburden layers.
After the marker points were pasted, 13 horizontal and 16 vertical survey lines were defined to facilitate a clear description of the test process, as shown in Figure 9b. In this physical similarity model experiment, 13 horizontal survey lines are named H0 to H12, and 16 vertical survey lines are named V0 to V15. Survey points are represented by the intersection of vertical and horizontal lines, which means that the coordinate position of each measurement point can be indicated by the number of the vertical and horizontal lines. Importantly, the positions of H1, H2, H3, and H5 survey lines are consistent with the horizontal fiber of FH1, FH2, FH3, and FH4, respectively. The three vertical survey lines that are consistent with the fiber of FV2, FV3, and FV4 are V4, V8, and V12, respectively.

5.2.3. The Principle of BOFDA Monitoring and Close-Range Photogrammetry

In this paper, the brief principle of the BOFDA and CRP can be introduced as below:
  • BOFDA
BOFDA is a distributed fiber optic monitoring technology. It combines signal transmission and physical measurand sensing and can continuously measure temperature and strain changes along the whole length of the optical fiber [23,24]. BOFDA measures temperature and strain by monitoring the changes in Brillouin frequency drift in optical fibers, as shown in the following formula [25,26,27,28]
υ B ε , T = υ B 0 + C ε ε + C T ( T T 0 )
where ν B (0) is the Brillouin frequency shift in the initial state, ν B ( ε , T ) is the Brillouin frequency shift at any time, T T 0 is the temperature change, and ε is the change in strain. C T is the temperature coefficient of the optical fiber, and C ε is the strain coefficient where the standard single-mode fiber SMF-28 at room temperature C T = 1   MHz / ° C and C ε = 500   MHz z / ε . Based on actual testing experience, when the ambient temperature change during fiber optic testing is less than 5 °C, the temperature effect can be basically ignored, and only the influence of strain on the frequency of Brillouin backscattering light can be considered [29]. Equation (5) can be simplified as
υ B ε = υ B 0 + C ε ε
It can be seen that when the monitored structure and fiber optic coupling deform uniformly, the strain change of the structural object can be specifically manifested by the fiber optic strain change obtained from Formulas (5) to (6). In the experiment, a polyurethane tightly wrapped optical fiber, which has a diameter of 2 mm, was adopted as the sensing optical fiber, whose strain coefficient was 0.05 MHz/με and the temperature coefficient was 1.07 MHz/ ° C .
In the experiment, the strain measurement interrogator was the fTB2505 BOFDA, which is the commonly used worldwide BOFDA measuring instrument produced by Fibris Terre in Berlin of Germany, and the performance parameters are shown in Table 2.
In order to obtain the best results, according to the experience acquired from numerous BOFDA monitoring performed by the author, the test parameters were set in this experiment as below: the starting frequency, and end frequency of the instrument were 10~12 GHz, the frequency interval was 5 MHz, the spatial resolution was 20 cm, the sampling interval was 0.05 m, and the fiber center frequency was 10.85 GHz.
  • CRP
In order to more accurately measure the movement of overburden during the mining process, the digital camera was fixed at a position about 3 m away from the model during testing, and the camera was ensured to be roughly orthophoto and able to capture all marker points. Only one photo was taken during each observation period.
The observations were made of the initial coordinates Hm0 and Vm0 of any point M in the pre-mining model, as well as coordinates Hmi and Vmi after the i-th excavation mining. The vertical displacement of point M is obtained by Formula (7).
V m = V m i V m 0
Using Formula (8), the horizontal displacement of point M can be obtained.
U m = H m i H m 0
In the formula, Vm0 represents the initial y coordinate of point M; Vmi represents the y coordinate of point M after i-th excavation. Hm0 is the initial x-axis coordinate of point M, and Hmi is the x-axis coordinate of point M after i-th excavation.

5.3. Similar Simulation Model Experiments of Overburden Deformation Movement

Because the geometric similarity ratio of the model is 1:150, and it is difficult to excavate the 15# coal in layers, it is excavated from the open-off cut in the direction of the stop-mining line according to the 30 mm step distance by means of one mining full height. When the deformation process of overburden is completed and reaches a stable state after each step of excavation, BOFDA fiber strain testing and CRP measuring are performed. During the experiment, as shown in Figure 10 below, a total of 45 excavations were executed, and the raw data of horizontal and vertical fiber strain were monitored. With the continuous excavation, the deformation failure of overlying strata can be divided into four stages in time and space, named: “goaf~caving zone~fracture zone~subsidence bending zone” according to their chronological order.

5.3.1. Experimental Process and Theoretical Analysis of Key Strata in the Experiment

Starting from the opening of the open-off cut, the goaf first appeared and the area of the suspended roof gradually increased. After excavating to 270 mm, the caving zone began to form with the direct roof beginning to collapse. After excavating to 360 mm, the basic roof of the K2 limestone began to collapse layer by layer, until the excavation reached 480 mm at the No. 6 shale layer and the basic roof completely collapsed. Subsequently, the overburden fracture occurred, but these fractures did not cave to the goaf, only sank and rotated in a voussoir beam state, which meant that the fracture zone appeared. When excavation reached 570~690 mm, the breaking and fracturing of No. 7 fine sandstone led to the breakage and fracture of the overlying No. 8 fine sandstone and No. 9 medium grained sandstone simultaneously. According to the phenomenon and its harder and stronger nature, the No. 7 fine sandstone can be regarded as a subkey strata at least, as shown in Figure 10a.
When excavated to 810 mm, the No. 10 medium sandstone layer began to fracture. At this time, a delamination gap appeared below the No. 12 K3 limestone, which gradually increased with excavation until reaching 930 mm, and the delamination gap continued to increase. When excavated to 960 mm, the No. 12 K3 limestone began to fracture, and there were increasing interlayer voids between the goaf and the overlying No. 13 medium-fine sandstone. When the excavation to 960 mm was completed, with the fracturing of the No. 13 rock layer, the overlying rock layer collapsed until the top layer of the No. 19 fine sandstone layer, and seven rock layers collapsed altogether at the same time with a height difference of 21 m. Obviously, due to the properties of hardness, strength, and thickness, the No. 13 layer can be taken as subkey strata at least, as shown in Figure 10b.
Later, the overburden rock layer fractured and sank with the excavation. After excavating to 1170 mm, the rock layer below the No. 24 K7 medium sandstone layer fractured and developed delamination cracks. As the underlying rock layers continued to fracture and sink, the separation cracks gradually increased until the excavation was completed. The width of the separation cracks increased to 571 mm, and there was no fracture in the No. 24 rock layer. It can be seen that the No. 24 K7 sandstone layer is the primary key strata with significant thickness and strength. It dominates and controls the developmental height of WCFZ in the 150313 working face, as shown in Figure 10c.
From the KS theory, due to the coal mining height of 3 m and the top coal height of 4.23 m at the 150313 working face, the critical distance range for 8–10 times the mining height is (8~10) × 3 = (24~30 m) < 90 m of the critical distance, which is the distance from the roof of the coal seam to the bottom of the PKS. It is feasible to predict the height of the WCFZ according to the empirical formula in the regulations using Formulas (1)–(3). In the meantime, the height of the WCFZ can be predicted to be less than the height of critical distance based on KS theory, that is, the height of the WCFZ < 90 m. Furthermore, using the KS theory, it can be calculated that the fracture/mining ratio of the 150313 working face is 12.45.

5.3.2. Optical Fiber Strain Characterization of the Height and Range of WCFZ

In order to faithfully represent the influence of mining on the WCFZ, that is, to truly reflect the influence on buried optical fibers, the optical fiber strain represented in the study is the actual optical fiber strain from the actual test, that is, the absolute strain. In this paper, the strain curves of the vertical fiber are the strain curves of each vertical fiber segment within the height range of the model after the working face is excavated. The horizontal fiber strain curve is the strain curve of each horizontal fiber segment in the model length at different excavation distances.
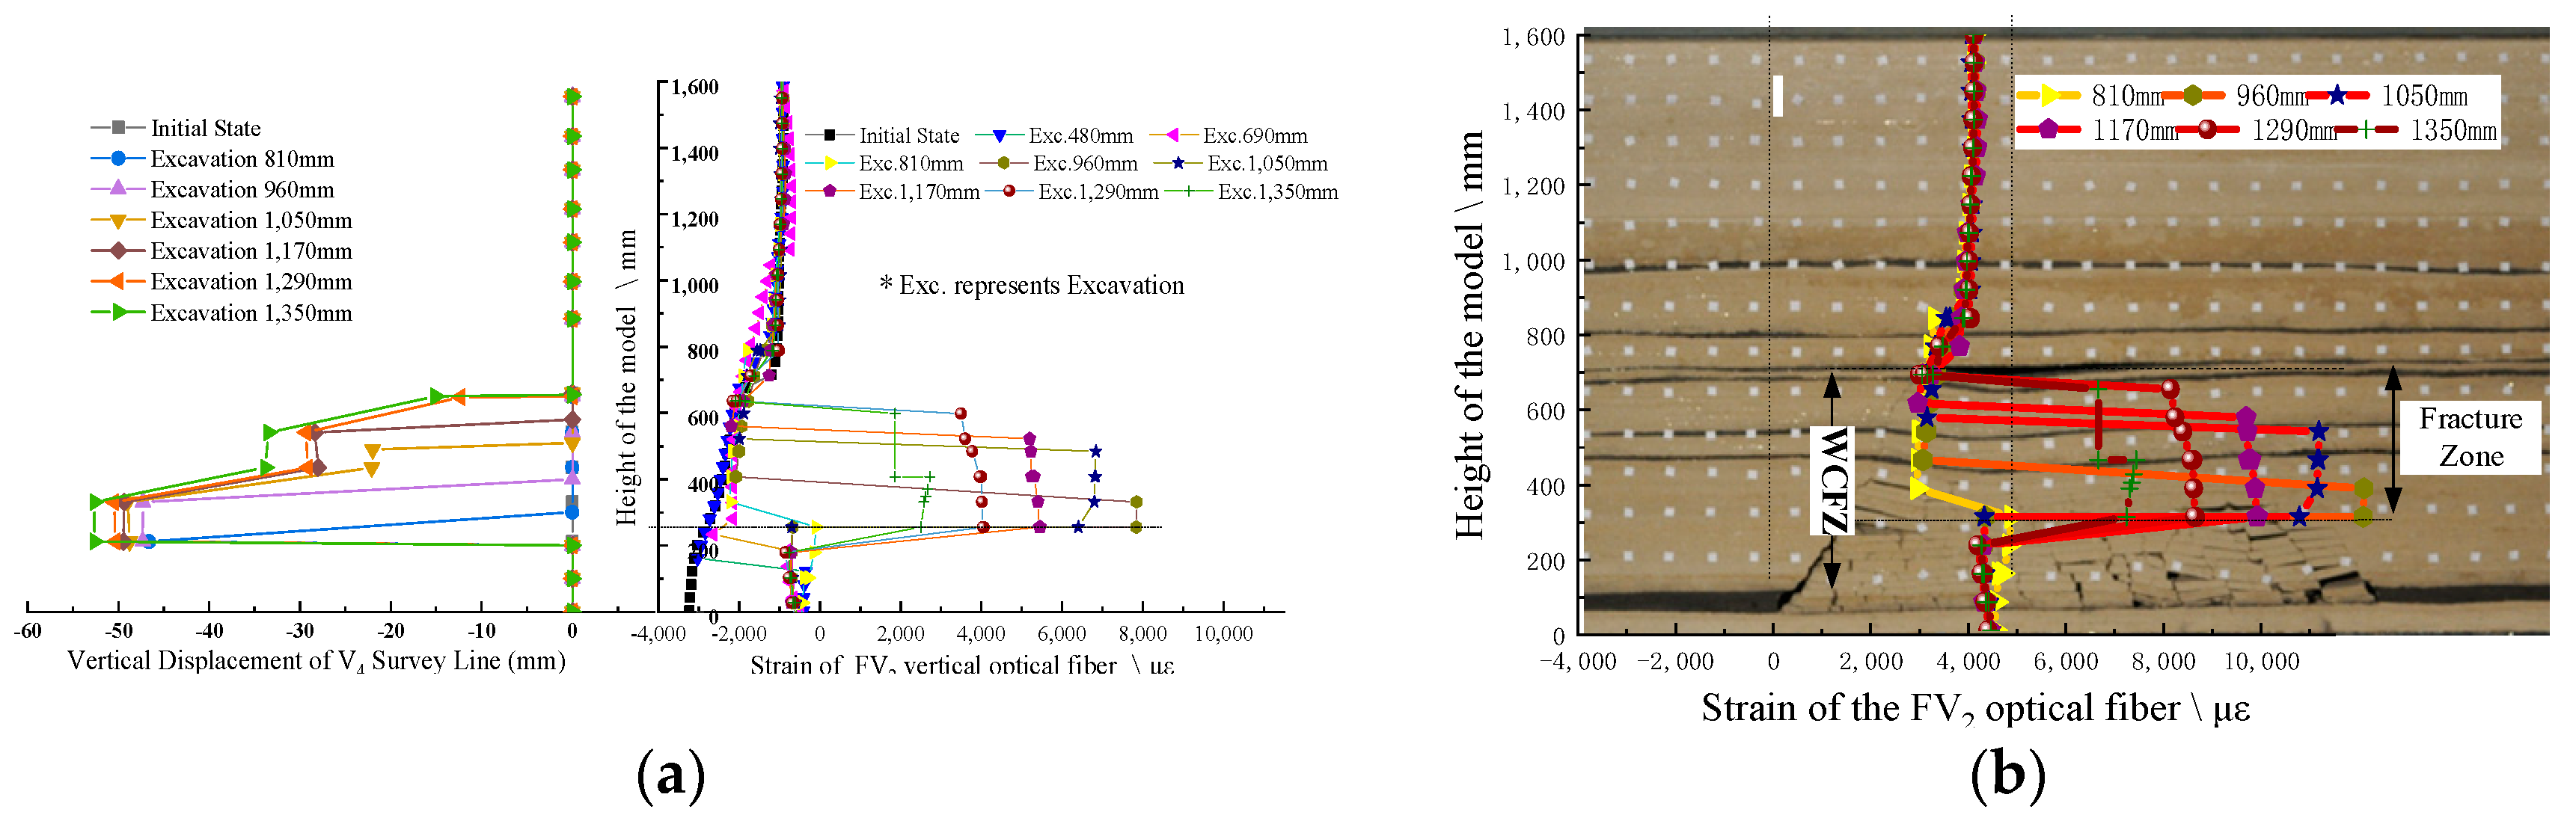
  • Characterization of the development law of the WCFZ by vertical optical fiber strain
In order to reflect the WCFZ development law with the working face advancing, five vertical optical fibers are evenly laid between the open-off cut line and the stopping line; these fibers can cover the entire excavation process in the time dimension, and the vertical optical fibers strain will fully reflect the development law of the WCFZ.
Because the FV1 and FV5 fibers are at the positions of open-off cut and stopping line, respectively, the distribution of their strain curves is similar to their initial strain state, which shows compressive strain in the whole coal mining process. These changes in strain distribution are consistent with the theory of underground coal mining [19].
FV2~FV4 optical fibers are evenly distributed and laid at equal intervals in the middle. The three optical fibers obviously show the strain variation characteristics of the “horizontal 3 zones” and “the vertical 3 zones” in the stope with the working face advancing, and the three optical fibers have a similar strain variation law. In the meantime, the surface displacement of the survey lines and survey points is measured by CRP. The results of BOFDA sensing and CRP measuring can be illustrated by the typical FV2 vertical optical fiber and the V4 survey line, as shown in Figure 11a below.
As shown in Figure 11, before excavating to 690 mm, the working face did not pass through FV2 optical fiber. At this time, the optical fiber strain curve showed a negative value, indicating that the optical fiber was in a compressed state; after the working face passed through FV2, the fiber optic strain curve suddenly changed into a rightward convex shape at the lower end of the model along the height direction of the model. As the working face advanced, the value of fiber optic strain gradually became positive, reaching the maximum strain value at the excavation of 960 mm, and the height of strain change continued to increase with excavation. After excavating to 960 mm, although the height of the overburden fracturing and breakage gradually increased, the strain value of the optical fiber gradually decreased with the support of the rock block fragmentation and expansion in the caving zone, and the strain curve continued to develop upward in a “boss” shape, alone, with the incremental change in the WCFZ height. Comparing the strain curve and the settlement of the measuring points on the survey line, the trend for the two changes is consistent. The greater the height of the rock settlement, the greater the strain change of the optical fiber. The location of rock fracturing is equivalent to the upper and lower boundaries of the fiber optic strain bulge. The peak height of the upper boundary of the fiber optic strain curve convex platform indicates the development height of the WCFZ; the peak height of the lower boundary of the convex platform represents the development height of the caving zone, as shown in Figure 11b, and the strain change of the optical fiber illustrates mining-induced overburden deformation well.
The development law of the WCFZ height obtained by synthesizing the strain curves of five vertical fibers is shown below: first, the height of the WCFZ continues to increase as excavation continues; second, it is in the middle of the mining area or goaf where the WCFZ has the highest height and gradually decreases toward both sides; third, the height of the WCFZ on the side of the open-off cut is greater than that of the working face, as shown in Figure 12a.
According to the height curve of the WCFZ obtained from the upper and lower boundaries of the strain curve of the vertical fiber convex platform shown in Figure 12b, it can be seen that the WCFZ only appears after the excavation of the working face reaches a certain distance of 270 mm at first and then gradually increases with the excavation of the working face. Second, the caving zone develops at the early stage and later remains stable after the excavation reaches a certain distance of 690 mm. Third, the height of the fracture zone continues to increase with the excavation later. Fourth, the height of the WCFZ reaches its maximum after the excavation reaches 1170 mm and remains constant until the end of the excavation. The WCFZ height value characterized by the upper boundary of the vertical fiber strain curve convex platform is about 700 mm model height, and the height of the caving zone development is about 270 mm model height.
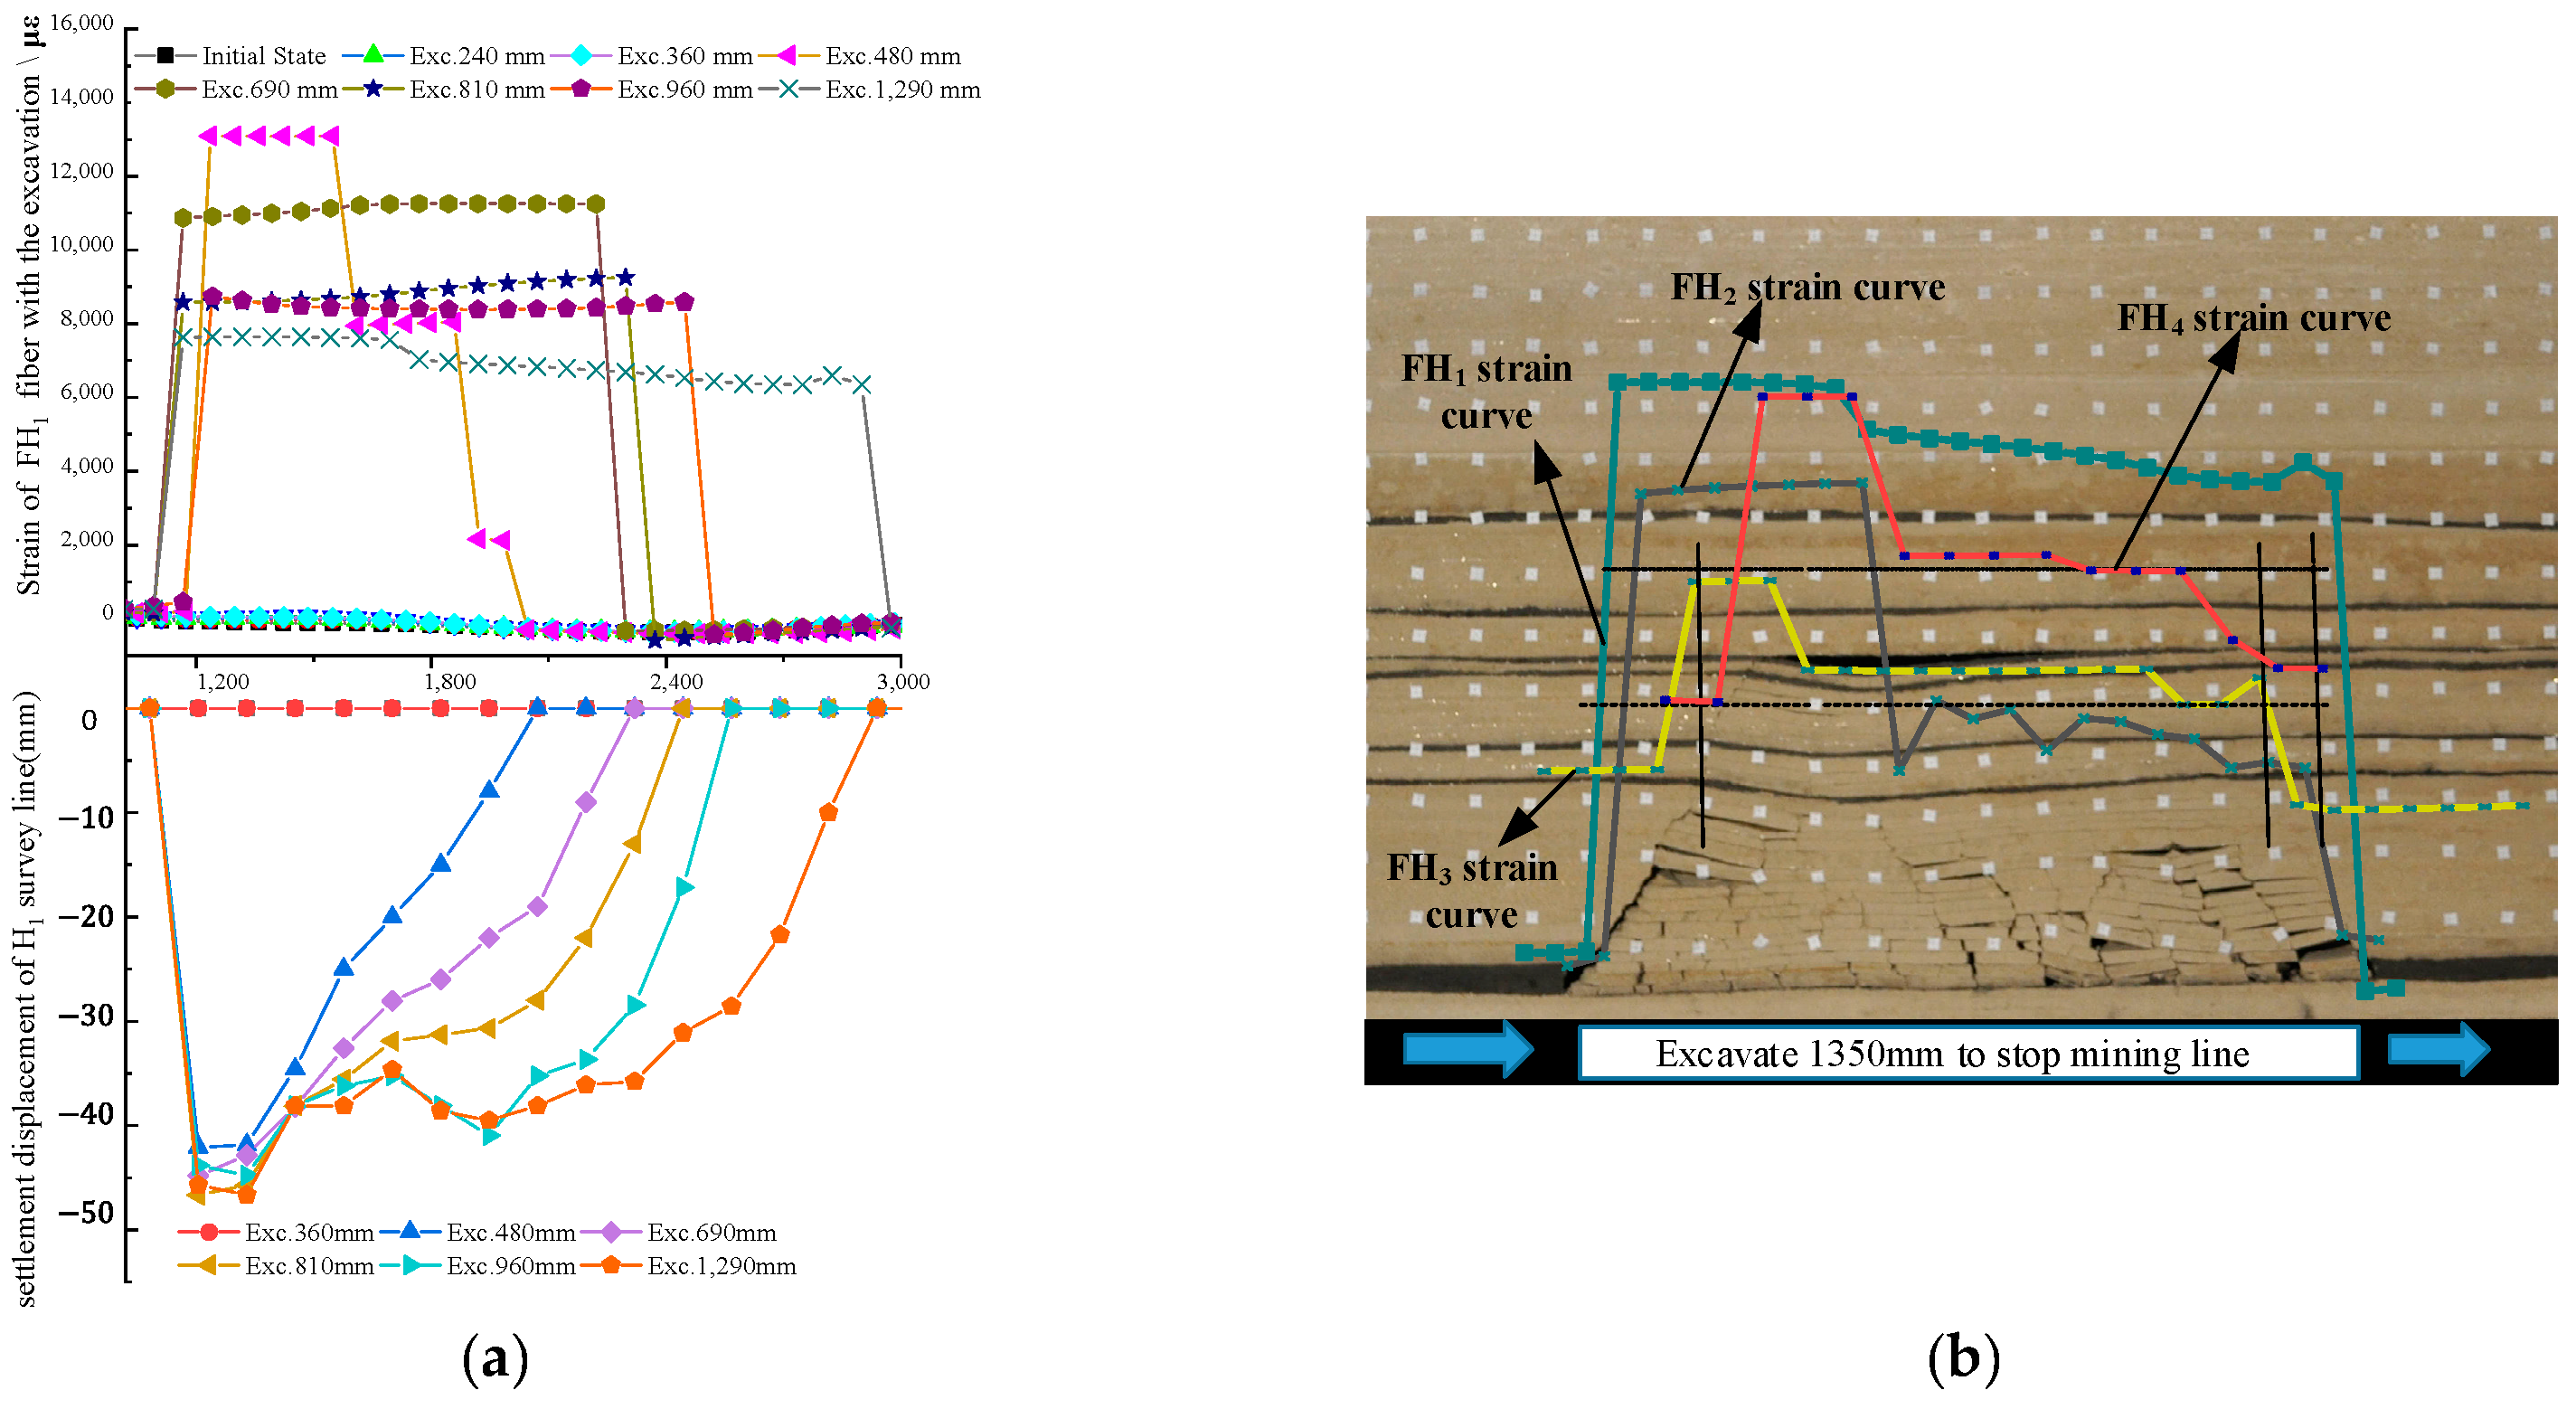
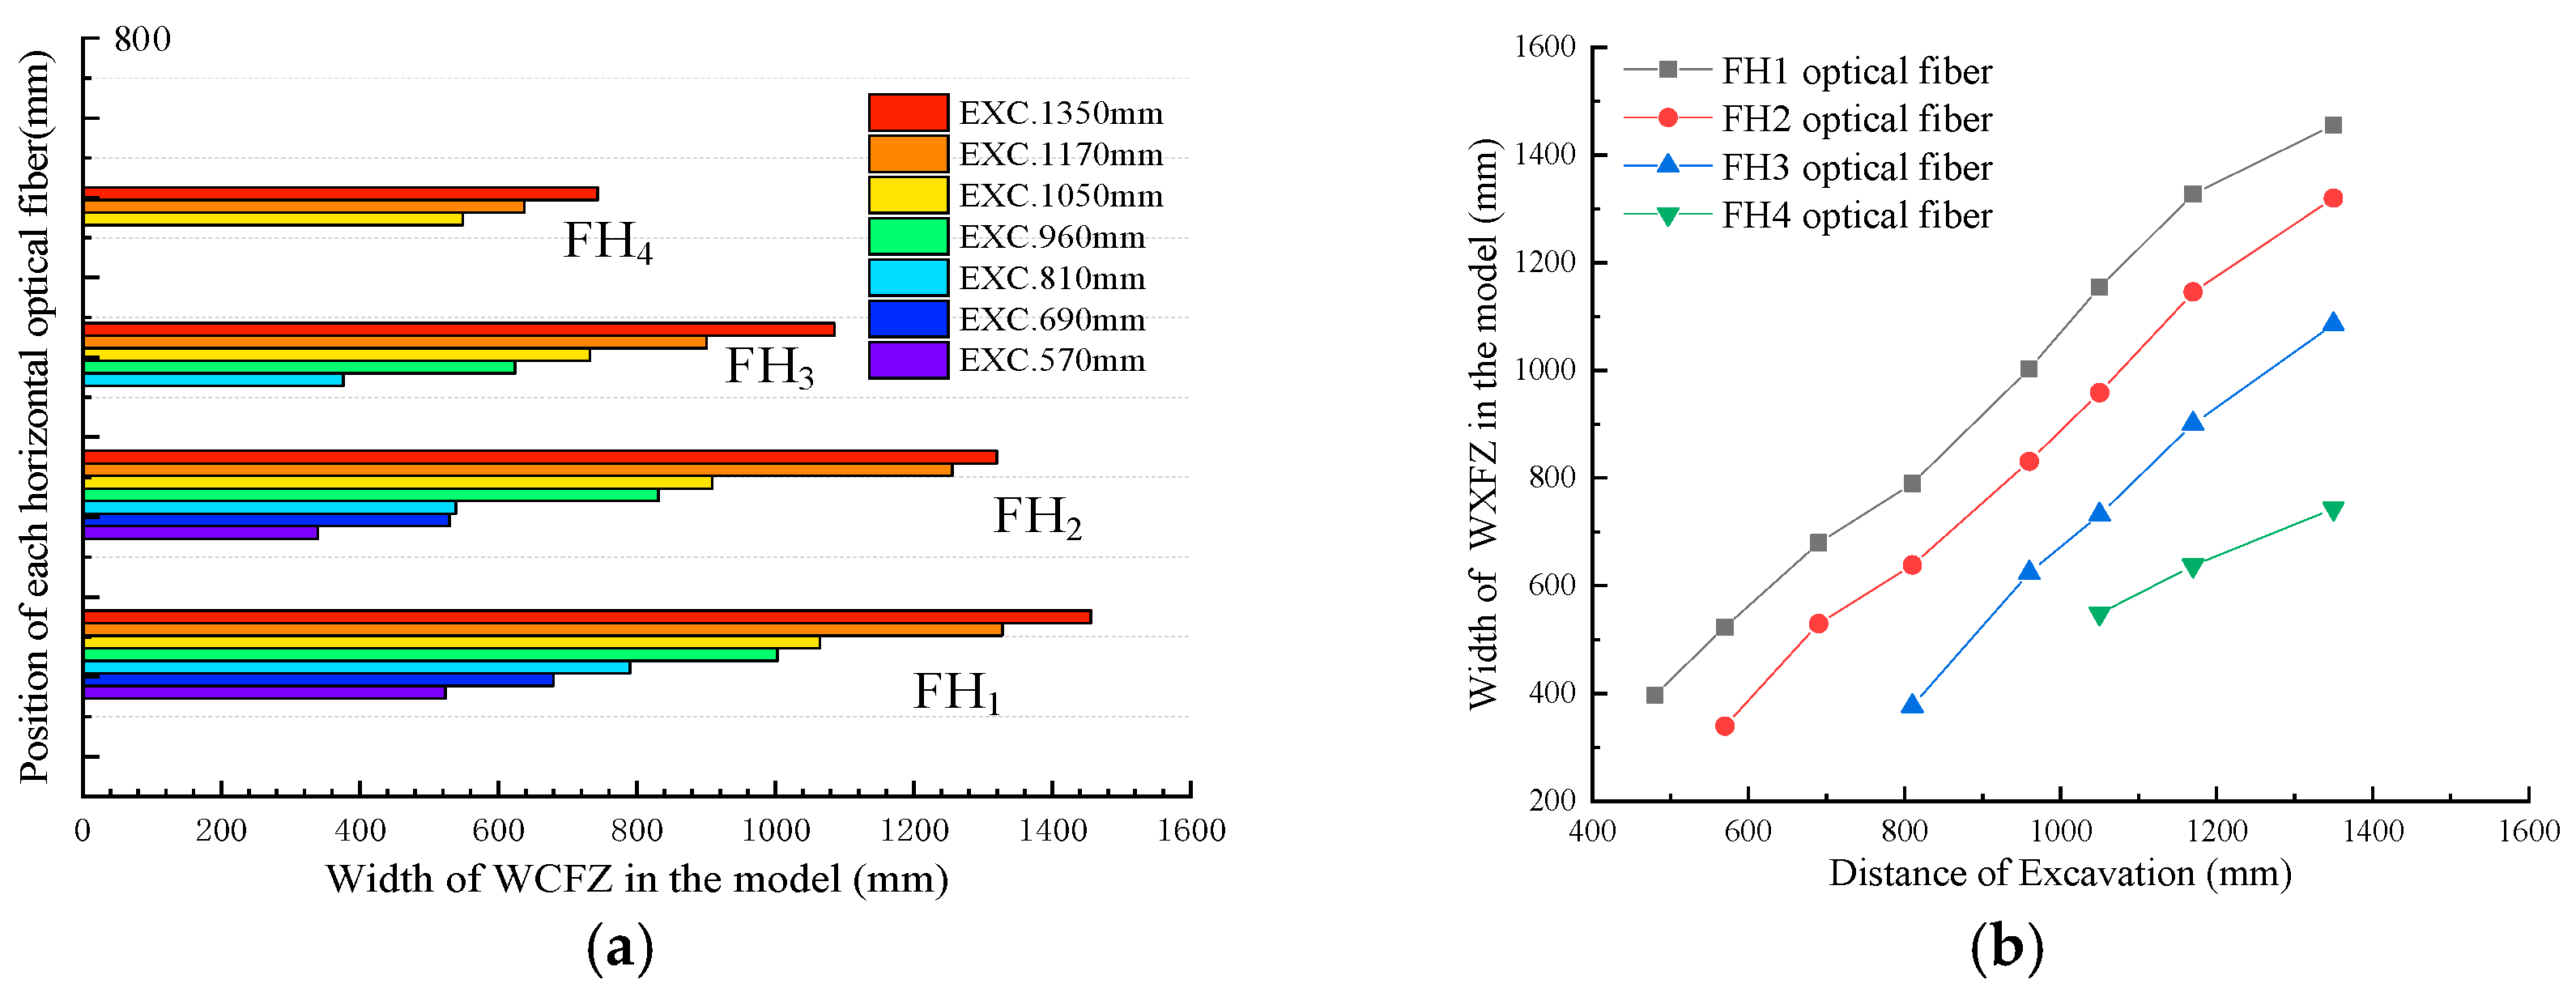
  • Characterization of the developing law of the WCFZ by horizontal optical fiber strain
The strain variation curves of various horizontal optical fibers vary with overburden fracture or collapse. Only the fracturing position and fracturing strength of overburden deformation affect the shape and value of the fiber optic strain. So, the strain curves of FH1~FH4 have similar characteristics and common variation laws. Since FH1 is located in the basic roof of the hard and thick K2 limestone layer, which can reflect the whole process of the WCFZ, it is the best way to discuss and analyze the optical fiber strain characterization of the WCFZ evolution taking FH1 as an example and combing with the displacement measurement of H1 survey line by CRP, as shown in Figure 13.
The comparison between the test results of horizontal FH1 optical fiber and the vertical displacement of the horizontal H1 survey line is shown in Figure 13a. From the vertical direction of the rock collapse morphology, after excavation to 480 mm, the fiber optic strain suddenly changes, with an initial value of 13,000 με, showing a convex shape. The height of the strain convex platform generally decreases with excavation. Subsequently, with the support of the caving zone, the strain height gradually decreases. After the excavation distance exceeds 1290 mm, the average strain step height remains at 7850 με, and there is no longer a sudden change in the optical fiber strain height during the excavation. In the excavation direction, the rock layer on the left side (open-off cut side) of the model breaks first, and the collapse shape gradually stabilizes over time without the peak position increasing with the working face advancing. The rock layer on the right side of the model (working face side) will continue to break and collapse with the excavation of the working face. The position of the peak on the right side will continue to develop to the right as the working face advances, while the position of the left peak will always remain about 140 cm away from the left boundary of the model, which is basically consistent with the position where the roof begins to fracture. The strain curve of horizontal fiber optic testing reflects the position and magnitude of rock movement deformation along the optical fiber, as well as the magnitude of the impact of mining on the rock layer.
The comparison between the H1 displacement curve and the FH1 strain curve shows that the location of rock fracture is equivalent to the abrupt change point on the fiber optic strain curve. The strength or height of rock fracture collapse is highly correlated with the height of the fiber optic strain curve, and the horizontal fiber optic strain change can be used to characterize the development law of the WCFZ in the transverse direction, just as shown in Figure 13b.
From this, we can obtain the development law of the WCFZ characterized by the strain of horizontally buried optical fibers. At the same horizontal level, the WCFZ continuously increases in the horizontal range with excavation; the width of WCFZ gradually decreases from the bottom to the top in the vertical direction, as shown in Figure 14.
  • Optic fiber strain characterization of the WCFZ in space and time based on BOFDA
From the aforementioned, during the coal seam excavation, BOFDA is applied to monitor the real-time distribution changes of optical fiber strain curves, which can be used to characterize the dynamic spatiotemporal development law of the WCFZ.
As the excavation of the working face progresses, the overlying rock layers may fracture or collapse, causing the fiber optic cables to be subjected to tensile stress, resulting in a peak change point in the strain curve and ultimately forming a convex-shaped fiber optic strain curve. Figure 15 is an area chart formed by integrating the peak points of the strain curves generated by horizontal and vertical optical fibers during each excavation.
According to Figure 15, the WCFZ exhibits a dynamic development rightward and upward as the excavation forms an unequal trapezoidal shape. The left caving angle remains fixed, and the position of the initial collapse line on the left is fixed, continuously extending upward. The right caving angle is basically stable too, and the right collapse line continuously moves parallel to the right during its upward development until it reaches the final collapse line on the far right at the end of the excavation.
It is particularly important to note that after excavating to 1170 mm, the working face only grows slightly in the horizontal range and has stopped developing in the vertical direction. This indicates that WCFZ height reached its vertex, maximum value.
Based on the peak points of the upper and lower boundaries of the rightwards convex platform in the strain curve of the vertical optical fiber, it can be seen that the model height of the WCFZ determined by BOFDA is 700 mm, and the model height of the caving zone is 270 mm. According to the geometric similarity ratio of 1:150, the actual height of WCFZ can be calculated as 90.27 m, and the actual height of the caving zone is 25.77 m.

6. Discussions

The height of the WXFZ and the height of the caving zone in the overlying rock of the 150313 fully mechanized top-coal mining face were obtained through empirical formulas, numerical simulations, the key strata theory, and indoor similar simulation model experiments. The results are shown in Table 3.
From Table 3, it can be seen that the numerical value range predicted by the empirical formula of the regulations is relatively large, and other means need to be combined to jointly determine the height of the WCFZ. The predicted height of the WCFZ based on the numerical simulation is relatively small, which is related to the setting of the constitutive model. The height of the caving zone characterized by fiber optic strain is relatively small too, which is related to the spatial resolution setting of BOFDA. Overall, to eliminate human error, the average of these four prediction methods can be used as the actual prediction value. As a result, the WCFZ height of the 150313 working face in the comprehensive mechanized top-coal mining is 89.36 m, and the height of the caving zone is determined as 28.63 m.
Based on the actual on-site monitoring results conducted by the author using BOTDR technology on the 150313 working face [7], the actual height of the caving zone is 27.058 m and the actual height of WCFZ is 85.697 m. It can be seen that their errors are only about 4.1% and 5.5%, respectively, and the reasons are discussed below.
Compared with the in situ test of optical fiber sensing, the overestimation in the indoor comprehensive study is due to the difference between the in situ test and the indoor test study: (1) In order to facilitate the simulation calculation, the similar simulation model test uses the average occurrence of the overlying rock formation, and the rock layer with an inclination angle of less than 5° is idealized into a horizontal rock formation. (2) The mechanical parameters used in the similar model test are the average mechanical parameters of individual borehole rock samples obtained in the laboratory. (3) The in situ rock strata are in a natural geological environment and will not appear as completely horizontal rock strata. Although the overburden rock layer on-site is relatively stable, it is obvious that it will not be homogeneously distributed. (4) The on-site test cost is larger and the time period is longer, so the in situ fiber test is only one test result of a drilled hole.
Therefore, it is rational to believe that if a few more boreholes are drilled at various locations in the field test, the results will be closer to the results of the indoor test.
Above all, although the indoor research results are slightly higher in numerical value, the indoor predicted values not only meet the requirements of the regulations and comply with the key strata coal mining theory but can also ensure safer production design and minimize resource waste, as much as possible with slightly higher indoor research values. Therefore, the “four in one” comprehensive research method proposed in this paper, which combines empirical formula calculation, numerical simulation, key layer analysis, and the indoor physical similar simulation experiment is feasible and effective for indoor prediction of the WCFZ height and research of the WCFZ development law.

7. Conclusions

In order to scientifically design the 150313 working face of fully mechanized top-coal mining preventing water inrush accidents, gas explosions, etc., this paper proposed a set of indoor comprehensive research schemes for predicting the WCFZ height and its movement law, which uses the regulation formulas, numerical simulation, key strata analysis, and indoor similar simulation experiments. The average of the predicted results is taken as the predicted height of the WCFZ of the working face. In the meantime, some development laws of the WCFZ were obtained as well. The following conclusions were drawn during the research processes:
  • Research has found that the No. 24 K7 sandstone layer is the primary key strata, and the No. 7 fine sandstone and the No. 13 medium-fine sandstone are the subkey strata in the overlying rock of the 150313 working face; they dominate and control the developmental height of the WCFZ in the 150313 working face.
  • When the critical distance of the primary key strata is less than 10 times the mining height, the application of standard formulas to calculate the WCFZ is effective. Otherwise, the fracture zone will develop to the surface. The height of the WCFZ is below the PKS in this study, which is the No. 24 coarse sandstone.
  • The optical fiber strain presents a multi-step boss curve as the working face is being excavated. For vertical optical fiber, the height of the lower boundary of the boss represents the height of the caving zone, while the height of the upper boundary represents the height of the WCFZ. For the horizontal optical fiber, the width of the boss strain curve presents the developing width of the WCFZ.
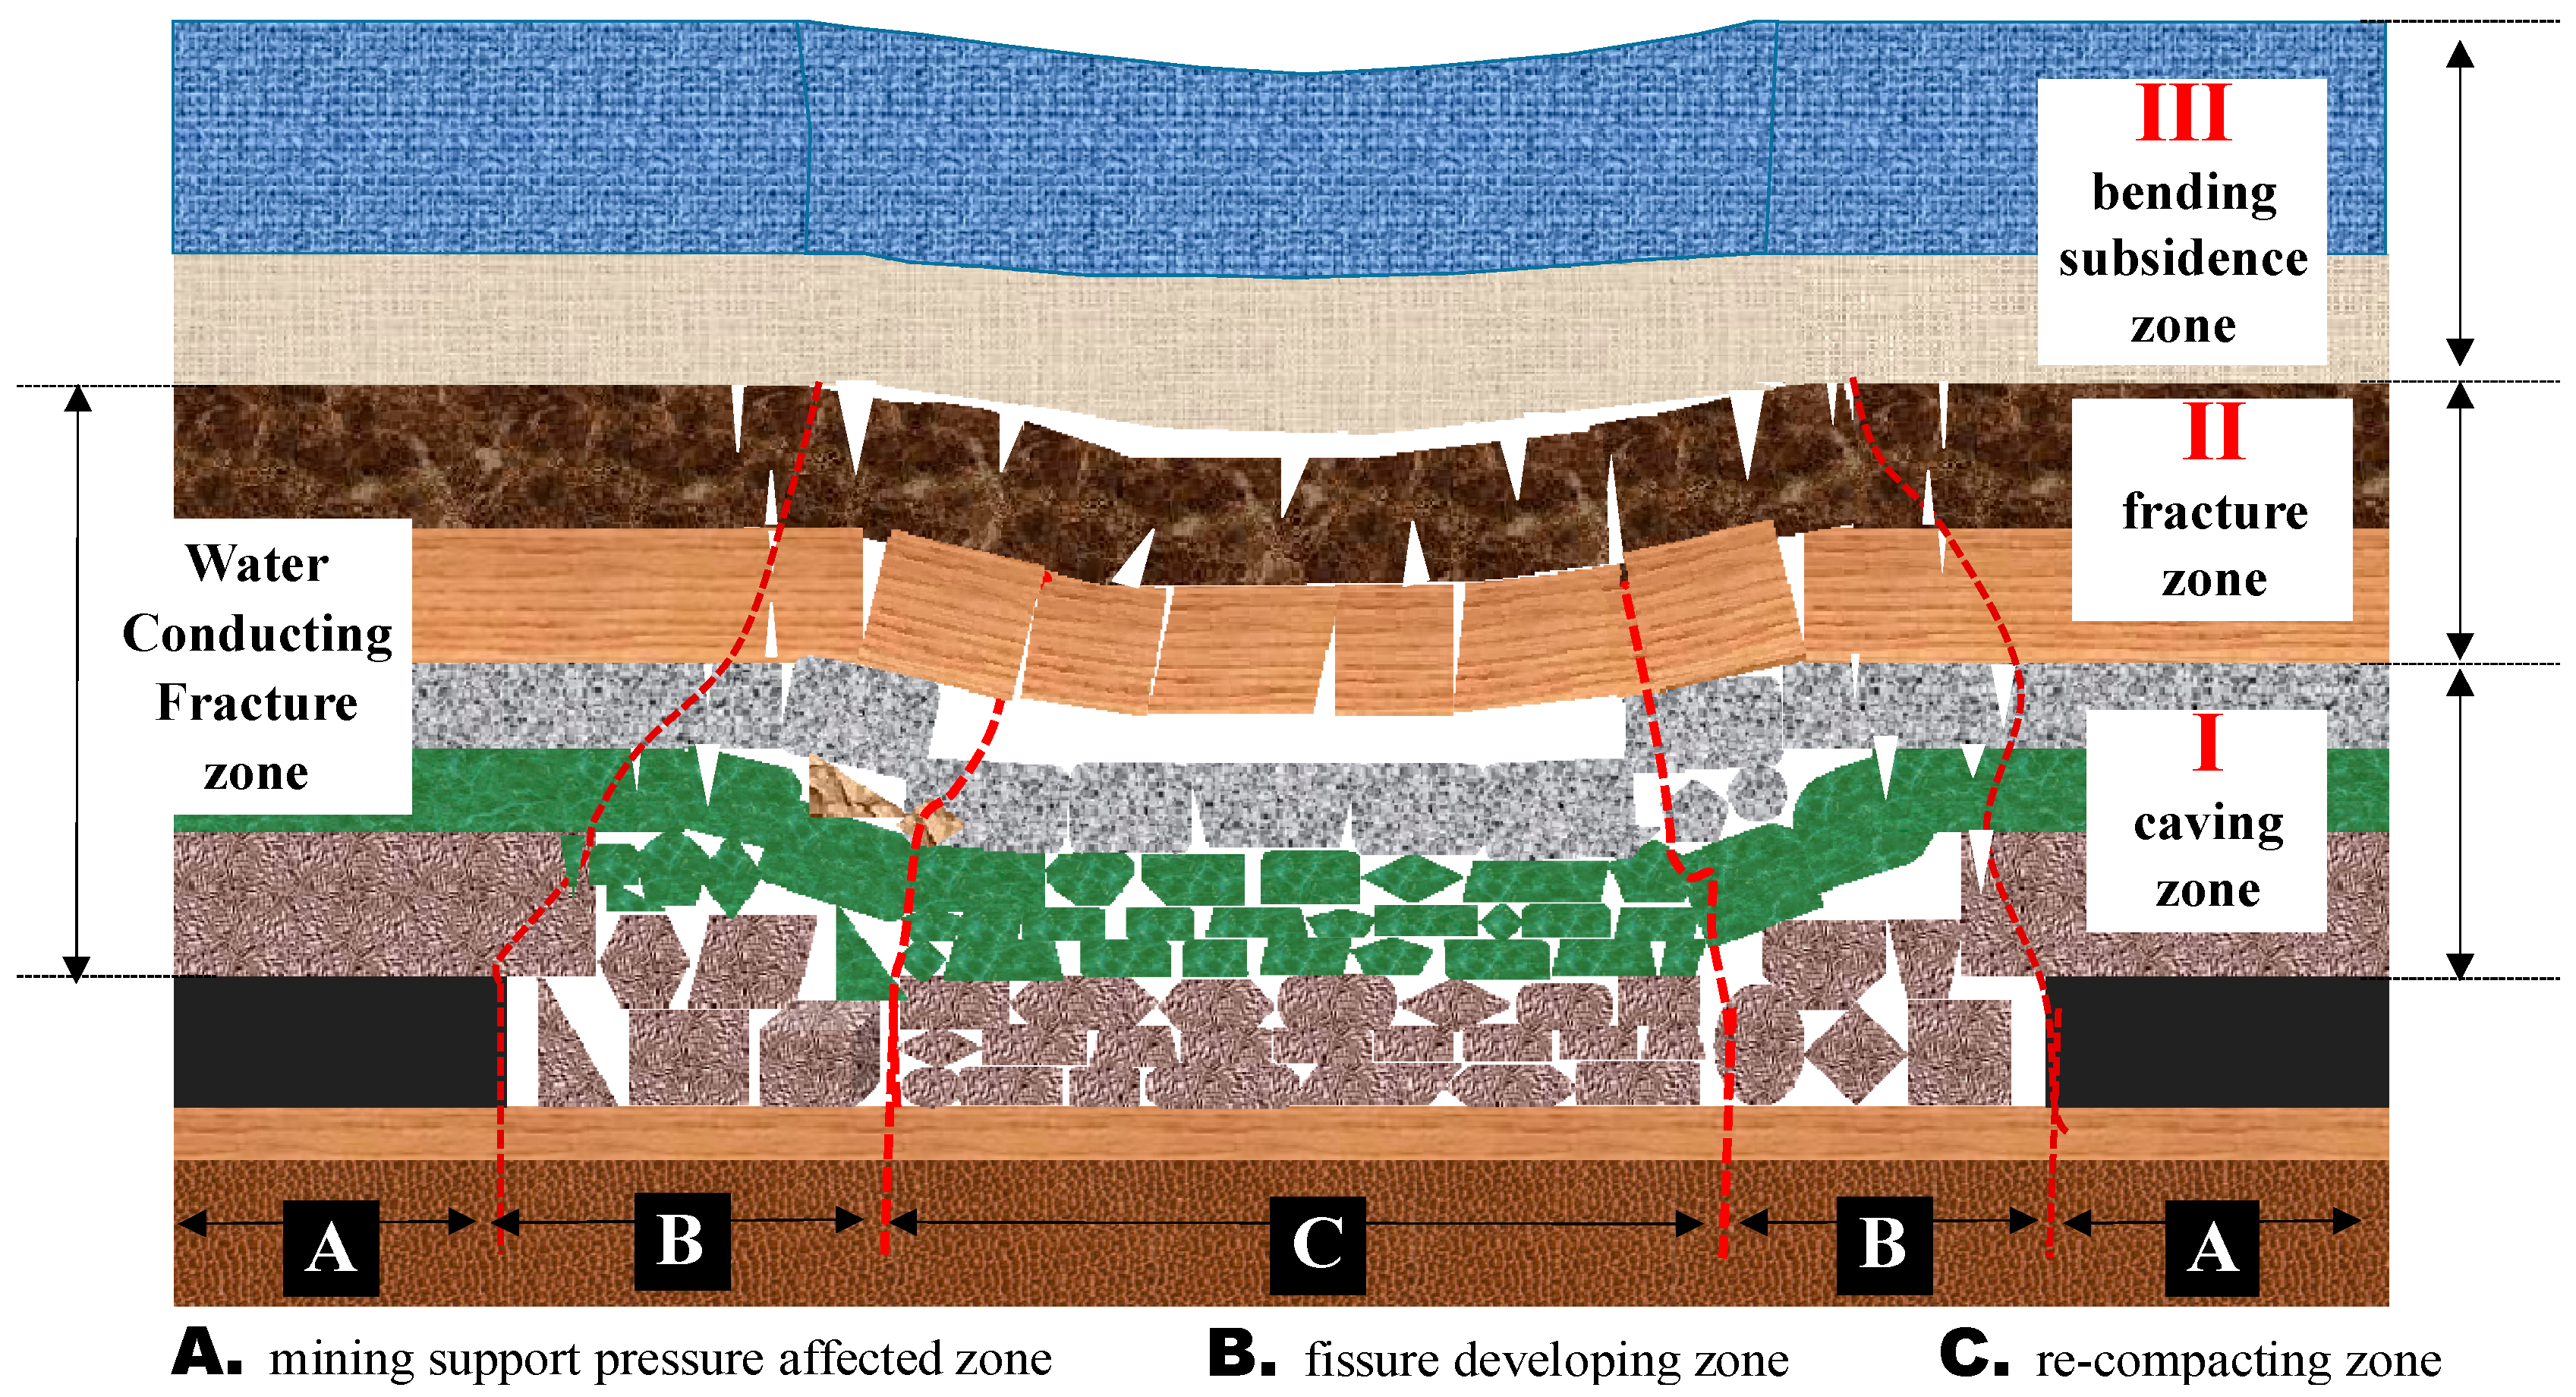
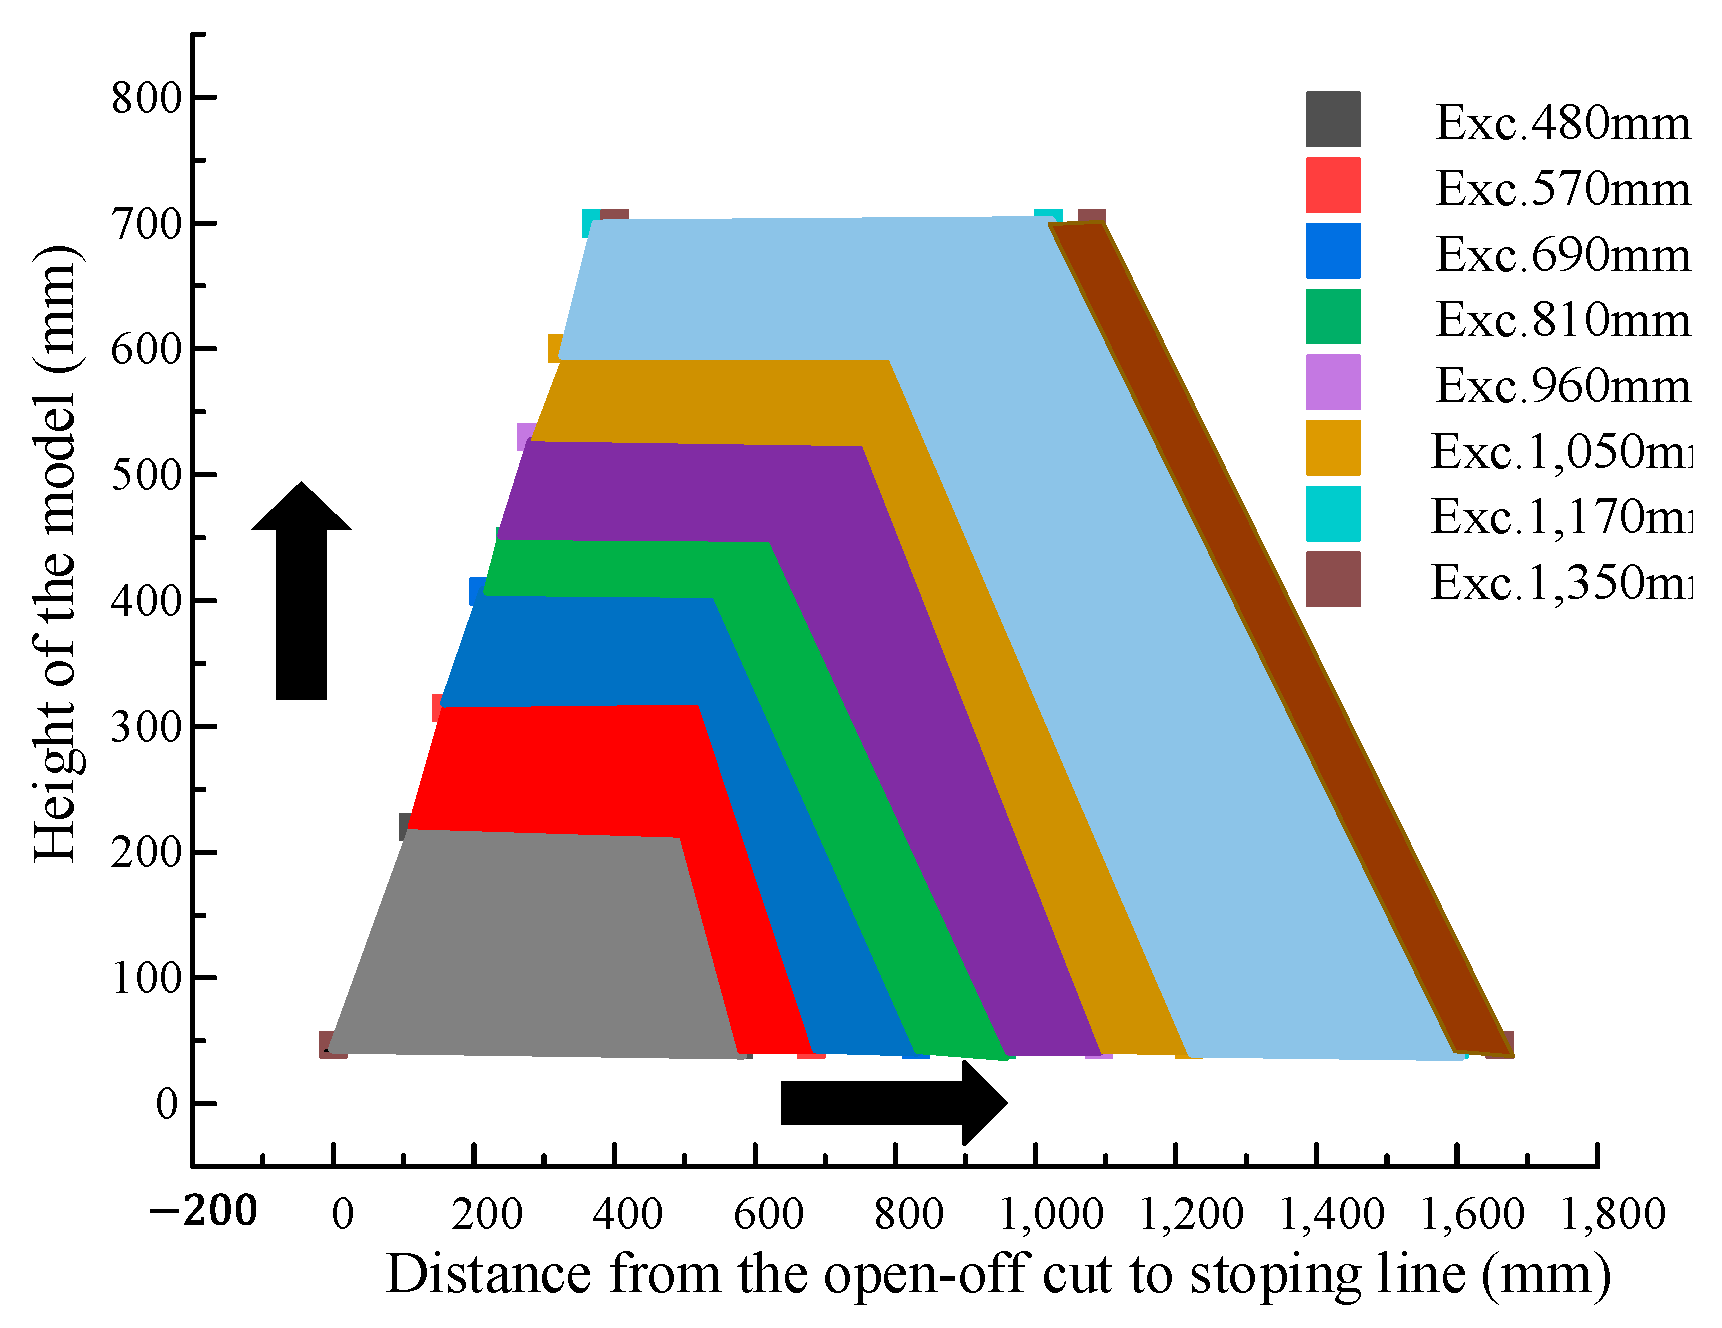
  • The WCFZ exhibits a dynamic development rightward and upward in an unequal trapezoidal shape during the excavation of the working face.
  • The WCFZ height of the 150313 working face in the comprehensive mechanized top-coal mining is 89.36 m with a fracture/mining ratio of 12.46, and the height of the caving zone is determined as 28.63 m with a caving/mining ratio of 3.96.

Author Contributions

Conceptualization, T.H. (Tao Hu); methodology, C.S. and B.L.; investigation, J.C.; validation, K.H.; formal analysis, T.H. (Tongxu Hu); software, T.H. (Taihu Huo); writing—original draft preparation, T.H. (Tao Hu); writing—review and editing, C.S. and J.C.; project administration, K.H.; supervision, T.H. (Tao Hu). All authors have read and agreed to the published version of the manuscript.

Funding

This research received no external funding.

Data Availability Statement

The data presented in this study are available on request from the corresponding author.

Acknowledgments

First of all, the authors would like to thank the editors and the anonymous reviewers for their valuableand constructive comments, for their help in revising and improving the paper.

Conflicts of Interest

The authors declare no conflicts of interest.

References

  1. Feng, D.; Hou, E.; Wang, S.; Xie, X.; Yuan, F.; Guo, L.; Wang, G.; Xie, Y.; Chen, Z. Research on 3D development characteristics of water-conducting fractured zone based on field measurement. Front. Earth Sci. 2022, 10, 808931. [Google Scholar] [CrossRef]
  2. Zhang, F.; Wang, G.; Wang, B. Study and application of high-level directional extraction borehole based on mining fracture evolution law of overburden strata. Sustainability 2023, 15, 2806. [Google Scholar] [CrossRef]
  3. Xu, B.; Xu, W.; Zhang, Y. Experimental Study on the Characteristics of Overlying Rock Movement in Mining Area. Geotech. Geol. Eng. 2024, 42, 1779–1791. [Google Scholar] [CrossRef]
  4. Zhang, L.; Zhang, Z.; Wang, K.; Tan, X.; Zhang, T.; Zhang, L. Characteristic developments of the water-conducting fracture zones in weakly cemented overlying strata of Jurassic coal mines in Western China. Water 2023, 15, 1097. [Google Scholar] [CrossRef]
  5. Wang, H.; Zhu, J.; Li, W. An Improved Back Propagation Neural Network Based on Differential Evolution and Grey Wolf Op-timizer and Its Application in the Height Prediction of Water-Conducting Fracture Zone. Appl. Sci. 2024, 14, 4509. [Google Scholar] [CrossRef]
  6. Pei-ding, Z.; Chao-shang, S.; Xuan, F.; Song-tao, L.; Long-jing, W.; Zheng-zheng, C. Temporal and Spatial Evolution Mechanisms of the Water-Conducting Fractured Zone of Overlying Strata in the Kongzhuang Coal Mine. Geofluids 2023, 2023, 3790998. [Google Scholar] [CrossRef]
  7. Hu, T.; Hou, G.; Bu, S.; Zhu, Z.; Wang, Y.; Hu, Z.; Li, Z. A novel approach for predicting the height of water-conducting fracture zone under the high overburden caving strength based on optimized processes. Processes 2020, 8, 950. [Google Scholar] [CrossRef]
  8. Wei, D.; Gu, H.; Wang, C.; Wang, H.; Zhu, H.; Guo, Y. Extension Mechanism of Water-Conducting Cracks in the Thick and Hard Overlying Strata of Coal Mining Face. Water 2024, 16, 1883. [Google Scholar] [CrossRef]
  9. Zhang, L.; Zhang, Z.; Wang, K.; Tan, X.; Zhang, L.; Zhang, T. Development and Height Prediction of Fractured Water-Conducting Zone in Weakly Cemented Overburden: A Case Study of Tashidian Erjingtian Mine. Sustainability 2023, 15, 13899. [Google Scholar] [CrossRef]
  10. Zhengzheng, C.; Xiangqian, Y.; Zhenhua, L.; Feng, D. Evolution mechanism of water-conducting fractures in overburden under the influence of water-rich fault in underground coal mining. Sci. Rep. 2024, 14, 5081. [Google Scholar] [CrossRef]
  11. Chang, X.; Wang, M.; Zhu, W.; Fan, J.; Liu, M. Study on height development characteristics of water-conducting fracture zone in fully mechanized mining of shallow thick coal seam under water. Sustainability 2023, 15, 7370. [Google Scholar] [CrossRef]
  12. Mai, L.; Li, H. Finite–Discrete Element Method Simulation Study on Development of Water-Conducting Fractures in Fault-Bearing Roof under Repeated Mining of Extra-Thick Coal Seams. Sustainability 2024, 16, 5177. [Google Scholar] [CrossRef]
  13. Gao, Z.; Jin, L.; Liu, P.; Wei, J. Height Prediction of Water-Conducting Fracture Zone in Jurassic Coalfield of Ordos Basin Based on Improved Radial Movement Optimization Algorithm Back-Propagation Neural Network. Mathematics 2024, 12, 1602. [Google Scholar] [CrossRef]
  14. State Administration of Safety Production, State Administration of Coal Mine Safety Supervision, State Energy Administration, State Railway Administration. Regulations for Retaining Coal Pillars and Coal Mining in Buildings, Water Bodies, Railways, and Main Mines [L]. May 17, 2017. Available online: https://www.mem.gov.cn/gk/gwgg/201707/W020190911694189457062.pdf (accessed on 29 August 2024). (In Chinese)
  15. Liu, Z.; Yang, B.S. Using numerical simulation methods to determine the development height of water conducting fracture zones Mining Safety and Environmental Protection. Min. Saf. Environ. Prot. 2006, 33, 16–19. (In Chinese) [Google Scholar]
  16. Zhang, Z.; Dai, L.; Sun, H.; Liu, Y.; Yang, H.; Li, R.; Zhang, Y. Study on the spatiotemporal dynamic evolution law of a deep thick hard roof and coal seam. Processes 2023, 11, 3173. [Google Scholar] [CrossRef]
  17. Du, F.; Zhang, Y.; Dai, L.; Cui, W.; Wang, B.; Sun, J. Research on Multi-Physical Field Characteristics of Deep Coal Seam Mining Based on the Rock-Coal-Rock Model. Processes 2024, 12, 726. [Google Scholar] [CrossRef]
  18. Guo, W.; Zhao, G.; Lou, G.; Wang, S. A new method of predicting the height of the fractured water-conducting zone due to high-intensity longwall coal mining in China. Rock Mech. Rock Eng. 2019, 52, 2789–2802. [Google Scholar] [CrossRef]
  19. Qian, M.G.; Xu, J. Behaviors of strata movement in coal mining. J. China Coal Soc. 2019, 44, 973–984. (In Chinese) [Google Scholar]
  20. Hu, G.L.; Zhu, W.B.; Wang, X.Z. New method to predict the height of fractured water-conducting zone by location of key strata. J. China Coal Soc. 2012, 37, 762–769. (In Chinese) [Google Scholar]
  21. Wang, Z.Q.; Li, P.F.; Wang, L.; Gao, Y.; Guo, X.F.; Chen, C.F. Method of division and engineering use of “three band” in the stope again. J. China Coal Soc. 2013, 38, 287–293. (In Chinese) [Google Scholar]
  22. Chen, X.; Huang, Z.; Wang, L.; Dong, X.; Cui, P. Determination of the Height of Overburden Water-Conducting Fracture Zone in 215102 Working Face of Yue Nan Coal Mine. Geofluids 2022, 2022, 3124374. [Google Scholar] [CrossRef]
  23. Garus, D.; Krebber, K.; Schliep, F.; Gogolla, T. Distributed sensing technique based on Brillouin optical-fiber frequency-domain analysis. Opt. Lett. 1996, 21, 1402–1404. [Google Scholar] [CrossRef] [PubMed]
  24. Hartog, A.H. An Introduction to Distributed Optical Fiber Sensors; CRC Press: Boca Raton, FL, USA, 2017. [Google Scholar]
  25. Wang, X.; Shi, B.; Wei, G.; Chen, S.E.; Zhu, H.; Wang, T. Monitoring the behavior of segment joints in a shield tunnel using distributed fiber optic sen-sors. Struct. Control. Health Monit. 2017, 25, e2056. [Google Scholar] [CrossRef]
  26. Wang, X.; Shi, B.; Wei, G.Q.; Cheng, G.; Zgang, C. Performance and characteristics of BOFDA, a new monitoring technology for civil and geotechnical engineering. J. Disaster Prev. Mitig. Eng. 2015, 35, 763–768. [Google Scholar]
  27. Zhang, Q.; Xiong, Z. Crack detection of reinforced concrete structures based on BOFDA and FBG sensors. Shock. Vib. 2018, 2018, 6563537. [Google Scholar] [CrossRef]
  28. Ding, Y.; Shi, B.; Cui, H.; Suo, W.; Liu, J. Application of Optical Fiber Sensing Network in Slope Stability Monitoring. J. Geotech. Eng. 2005, 27, 338–342. (In Chinese) [Google Scholar]
  29. Shi, B.; Xu, H.Z.; Zhang, D.; Ding, Y.; Cui, H.L.; Chen, B.; Gao, J.Q. Feasibility study on application of BOTDR to health monitoring for large infrastructure engineering. Chin. J. Rock Mech. Eng. 2004, 23, 493–499. (In Chinese) [Google Scholar]
Figure 1. Conceptual model of overburden strata deformation and movement.
Processes 12 02076 g001
Figure 2. Diagram of the 150313 working face and coal-bearing strata in the Yinying coal mine.
Processes 12 02076 g002
Figure 3. Vertical displacement cloud map of overburden mining deformation:(a) excavation (Exc.) 20 m; (b) Exc. 40 m; (c) Exc. 60 m; (d) Exc. 80 m; (e) Exc. 100 m; (f) Exc. 120 m; (g) Exc. 140 m; (h) Exc. 160 m; (i) Exc. 180 m; (j) Exc. 200 m.
Processes 12 02076 g003
Figure 4. Distribution of mining-induced elastic-plastic zone in overburden rock: (a) Exc. 20 m; (b) Exc. 40 m; (c) Exc. 60 m; (d) Exc. 80 m; (e) Exc. 100 m; (f) Exc. 120 m;(g) Exc. 140 m; (h) Exc. 160 m; (i) Exc. 180 m; (j) Exc. 200 m.
Processes 12 02076 g004
Figure 5. Distribution of vertical stress in overburden rock: (a) Exc. 20 m; (b) Exc. 40 m; (c) Exc. 60 m; (d) Exc. 80 m; (e) Exc. 100 m; (f) Exc. 120 m; (g) Exc. 140 m; (h) Exc. 160 m; (i) Exc. 180 m; (j) Exc. 200 m.
Processes 12 02076 g005
Figure 6. Vertical displacement curves of survey lines in the simulation model: (a) vertical displacement of the horizontal survey line in the K2 limestone stratum; (b) the settlement displacement curve of the horizontal measuring lines at various heights of the model; and (c) vertical displacement of the vertical survey line set in the middle of the working face with mining.
Processes 12 02076 g006
Figure 7. Similar simulated model experiment: (a) real picture of similar simulation model taken on site; (b) composition of the BOFDA monitoring system.
Processes 12 02076 g007
Figure 8. The layout of vertical and horizontal sensing optical fiber segments.
Processes 12 02076 g008
Figure 9. Close-range photography system and survey points, survey line layout diagram, listed as (a) CRP system configuration; (b) layout diagram of measurement points and lines.
Processes 12 02076 g009
Figure 10. Diagram of rock deformation and collapse with the process of coal seam excavation: (a) excavation at 690 mm; (b) excavation at 1050 mm; (c) excavation at 1350 mm.
Processes 12 02076 g010
Figure 11. Strain of FV2 vertical optical fibers and vertical displacement of V4 survey line with different excavation distances in the experiment: (a) comparison chart; (b) strain curve characterization of the WCFZ projection diagram.
Processes 12 02076 g011
Figure 12. The development height of WCFZ characterized by a vertical fiber optic strain curve: (a) a dynamic height histogram of the WCFZ characterized by five vertical optical fibers; (b) a development height curve of the WCFZ and the caving zone.
Processes 12 02076 g012
Figure 13. Strain of horizontal optical fibers and subsidence of horizontal survey lines: (a) strain of FH1 and settlement of H1; (b) FH1~FH4 fiber strain curves on the model at 1350 mm excavation.
Processes 12 02076 g013
Figure 14. Fiber strain characterization of the WCFZ development and evolution in horizontally buried optical fibers: (a) WCFZ development scope histogram of horizontal fiber optic strain characterization; (b) curve of WCFZ development range changing with excavation development.
Processes 12 02076 g014
Figure 15. Temporal and spatial variation process diagram of the WCFZ with excavation of the working face.
Processes 12 02076 g015
Table 1. Physical and mechanical parameters of rock mass.
No.LithologyBulk Modulus
(Gpa)
Shear Modulus
(GPa)
Density
(kg/m3)
Internal Friction Angle
(o)
Cohesion
(Mpa)
Tensile Strength
(Mpa)
25Permian Shanxi Formation5.234.82500503.32.00
24K7 Coarse Sandstone9.788.5124705862.00
23Medium Sandstone9.447.942590505.52.67
229# Coal with mud shale4.523.891540281.81.00
21Fine Sandstone4.086.828103542.17
20Mud Shale 3.462.782660292.22.13
19K4 Limestone8.197.182660433.31.70
18Mud Shale 3.622.582450281.90.67
17Medium Sandstone8.546.7526005151.26
16Sandstone–Shale interbed5.675.382660394.21.67
1512# Coal3.32.981390302.11.00
14Medium-Fine Sandstone8.267.722750545.31.69
13K3 Limestone6.445.922800433.31.97
1213# Coal3.523.461380292.01.00
11Medium-Fine Sandstone76.6625805052.5
10Fine Sandstone7.246.962870574.41.67
9Medium Sandstone8.216.9425905252.67
8Fine Silt Stone7.626.822640464.12.00
7Mud Shale3.473.262660312.22.13
6K2 Limestone7.487.232720473.52.08
5Mudstone2.792.552540371.31.00
415# Coal3.892.961360351.82.41
3Sandy Mudstone6.746.572530292.01.00
2Medium Sandstone87.662580484.32.5
1K1 Sandstone8.087.4726405452.00
Table 2. Parameters of instrument BOFDA fTB2505.
Parameter TypeThe Value of the Parameter
Type of the optical fiberSingle mode
Spatial resolution/m0.2
Highest sampling resolution/m0.05
Accuracy of strain testing/με±2
Strain test repeatability/με≤±4
Strain test range/με−15,000~+15,000
Frequency sweep range/GHz9.9~12.0
Table 3. Comparison of the development height of water-conducting fracture zones.
Research MethodsHeight of WCFZHeight of Caving ZoneFracture/Mining RatioCaving/Mining Ratio
Regulation formula90.666 m 30.125 m12.544.17
Numerical simulation86.5 m30 m11.964.15
Key strata90 m-12.45-
Physical simulation90.27 m25.77 m12.493.56
Average value89.36 m28.63 m12.463.96
Disclaimer/Publisher’s Note: The statements, opinions and data contained in all publications are solely those of the individual author(s) and contributor(s) and not of MDPI and/or the editor(s). MDPI and/or the editor(s) disclaim responsibility for any injury to people or property resulting from any ideas, methods, instructions or products referred to in the content.

