Abstract
Apple and ginger mixed pomace is a by-product that can be valorized by drying. In this study, mixed pomace was subjected to hot-air drying (HAD) at 45, 62, and 70 °C and stepwise at 45 °C followed by at 62 °C or the reverse, at 62 °C followed by at 45 °C (2.5 mm layer), and microwave drying (MWD) at 100, 180, and 300 W (2.5 mm and 1.5 mm layers) and stepwise at 100 W followed by at 300 W (2.5 mm layer). The results show that the Crank model well fitted the HAD kinetics, with a water effective diffusivity (Deff) of 2.28 ± 0.06 × 10⁻¹⁰–4.83 ± 0.16 × 10⁻¹⁰ m2/s and energy of activation of 23.9 kJ/mol. The step approach of drying at 45 °C followed by at 62 °C resulted in a higher Deff than the reverse approach (drying at 62 °C followed by at 45 °C). The Midilli et al. model presented a good fit for the MWD kinetics. The drying time was calculated using these models to achieve 12% moisture content in the pomace and found to be 125.0 ± 9.2–439.5 ± 118.2 min for HAD, and 11.1 ± 0.2–61.5 ± 6.0 min for MWD. The specific energy required was 410.78 ± 6.30–763.79 ± 205.4 kWh/kg and 1.32 ± 0.01–2.26 ± 0.05 kWh/kg, respectively. MWD at 180 W preserved the total phenolic content and the antioxidant activity (ABTS, DPPH) better than HAD at 62 °C. The former technology also preserved the pomace color well, with a low color difference, ΔE, of 7.39 ± 1.1. Therefore, MWD is more promising than HAD to dry apple and ginger pomace, reducing the environmental impact of the drying process due to its lower energy consumption, shorter drying time, and better quality. The dried product could be converted into apple and ginger pomace flour to be used as a novel food ingredient.
1. Introduction
About one-third of all food produced for human consumption is lost and wasted across the entire supply chain every year. To overcome this problem, the UN has established Sustainable Development Goal 12.3, which aims for a 50% reduction in food waste at the retail and consumer levels, in addition to reducing food losses along production and supply chains, by 2030 [1]. The prevention of this waste would result in a decrease in the environmental impact, over-production, and processing upstream [1]. Of all produced apples in the world, 70% are consumed fresh, while the remaining 30% are processed into juice, cider, wine, vinegar, etc [2]. Apple pomace, the residue from processing apples, is a solid biomass with a high moisture content [2]. It is composed of skin and flesh, seeds, and stems [3] and accounts for 25% of the original fruit weight [4]. In some industries, this residue is used for animal feed [3], but in other cases, it is discarded in landfills, or is even incinerated [5]. There is a lot of potential value in that residue since it may contain health-promoting compounds, such as dietary fiber, polyphenols [3], protein, natural antioxidants, etc [2]. Some of these compounds present in apple pomace have demonstrated hypoglycaemic, hypocholesterolemic, anti-cancerogenic, anti-inflammatory, anti-microbial, antiallergic, and anticoagulant properties [3]. Similarly, ginger residue is generated in a significant amount after the extraction of numerous active ingredients in herbal medicine and beverage industries and results in a residue with a high content of dietary fiber [6]. As with apple pomace, it is used as animal feed, disposed of in a landfill, or incinerated. The potential of ginger residue lies in the compounds that it contains, such as gingerols, shogaols, and zingerone, which are substances with health benefits studied for their anti-inflammatory and anti-cancer effects. Nowadays, ginger residue is used as a source of bioactive substances, such as essential oils and phenolic compounds with antimicrobial and antioxidant properties [7]. Conversely, after drying and grinding, for instance, apple pomace becomes a flour that can be used as an ingredient in different product formulations. In bakery products, for example, apple pomace was explored in the composition of bread, cakes, and cookies to improve the dietary fibre content [8]. Muffins with apple pomace had higher dietary fiber content, total phenolic content, and antioxidant activity than without it [8].
The most common air-drying process is by convection. Hot air dehydration is very common in the food industry due to it being considered an economical method to produce dehydrated products from higher initial moisture content as well as employing easily operated drying equipment [9]. Unlike other drying processes, microwave drying causes internal vapor generation, which means that the foodstuff is heated from the inside out. Therefore, the drying time is lower, and the quality of the product is higher than with other drying processes. The disadvantages of this type of drying are the high cost and the non-uniformity of the heating process [10].
The Lewis [11], Henderson and Pabis [12], Crank [13], and Midilli et al. [14] models may be used to model the drying process. Both the Lewis and the Henderson and Pabis models are simple and easy to apply, and respective equations can be linearized to enable the calculation of the constant/s of each model. While the Lewis model provides a good approximation for materials with relatively drying rates, Henderson and Pabis, which is a semi-empirical model, can present an advantage when dealing with more complex materials as is the case of the apple and ginger pomace. The Crank model is a phenomenological model that considers the diffusion of water in liquid and gas states within the product. This is particularly useful for materials where diffusion is the primary moisture removal mechanism. The Midilli et al. model combines empirical and theoretical approaches, providing a more accurate and detailed description of the drying kinetics.
This present study is on apple and ginger pomace, a by-product from the juice industry, which is very rich in health-promoting compounds, such as fiber and phenols. This mixed pomace has never been studied before. There has been research performed with apple pomace, but studies on ginger pomace are seldom reported in the literature and a mixed pomace has never been studied before. The objectives of this work were as follows: (i) to make a comparative study, in terms of drying time and specific energy consumption, between two drying technologies applied to apple and ginger pomace, hot-air drying (HAD)—at 45, 62, and 70 °C and stepwise, drying at 45 °C followed by drying at 62 °C and the reverse, drying at 62 °C followed by drying at 45 °C in a thin layer of 2.5 mm—and microwave drying (MWD)—at 100, 180, and 300 W in 2.5 and 1.5 mm layers, and stepwise at 100 W followed by at 300 W in a layer of 2.5 mm; (ii) to test the adequacy of the fitness of some mathematical models—Crank, Lewis, and Henderson and Pabis for HAD and MWD, and Midilli et al. for MWD—to describe the moisture content of the product during HAD and MWD; and (iii) to assess and compare the quality of the product dried by HAD and MWD through water activity, color, total phenolic content, and antioxidant activity (ABTS, DPPH, ORAC).
2. Materials and Methods
2.1. Plant Material
The plant material was graciously supplied by Frubaça (Copa, Alcobaça, Portugal). It was an apple (Malus domestica) pomace combined with ginger (Zingiber officinale) pomace (approximately 3:1 ratio, respectively). The combined pomace is what remains from the production of apple and ginger juice. It presents a highly heterogeneous composition with chunks of the fruit and root and also a heterogeneous color due to the mixture. It contains skin, seeds, and stems. The pomace was frozen at −20 °C. It was later defrosted by placing it in the refrigerator at 4 °C to be analyzed or used in the drying experiments. Part of this thawed apple and ginger pomace was blended (Bimby TM5, Vorwerk Elektrowerke GmbH, and Co. KG Blombacher Bach 3, Wuppertal, Germany) for 105 s at 10,200 rpm, stopping every 15 s to mix the pomace with a spatula.
2.2. Nutritional Composition Analysis of the Apple and Ginger Pomace
The moisture, fat, protein, ash, fiber, and carbohydrate contents of the thawed apple and ginger pomace (raw material) were determined.
2.2.1. Moisture Content
About 2 g of sample was placed in a Petri dish inside an oven (Memmert, Schwabach, Germany) at 105 °C for 24 h [15]. Three replicates were performed. The moisture content was calculated through the following equation:
Moisture (%) = (weight at time 0 − weight of dried sample)/weight at time 0 × 100
2.2.2. Ash
About 20 g of sample was incinerated in a muffle furnace at 550 °C ± 15 °C until constant weight [16].
2.2.3. Fat
About 20 g of sample was boiled in a beaker (in reflux conditions, with dilute hydrochloric acid 4 M for 30 min) and filtered. The fat was extracted for 4 h with petroleum ether in a Soxhlet extractor into a previously weighed round bottom flask. The solvent was evaporated in a rotary evaporator (Buchi R-210, Buchi Labortechnik AG, Flawil, Switzerland) and the residue was dried to constant weight at 102 ± 2 °C [16].
2.2.4. Protein
The protein content was determined using ISO 1871:2009 [17]. Briefly, about 2 g of sample was digested in a mineralization block (Kjeltec Foss, Foss, Zurich, Switzerland), with concentrated sulfuric acid (96% w/w) in the presence of a catalyst. From the quantity of ammonia produced, the nitrogen content (N) was calculated. The protein was calculated using the following formula %protein = %N × 6.25.
2.2.5. Total Fiber
Briefly, the methods used were AOAC 991.43 [18] and AOAC 985.29 [19], and the assay was performed in duplicate. About 7 g of sample was submitted to enzymatic digestion using 3 enzymes: α-amylase (30 min at 90 °C), followed by protease (30 min at 60 °C) and followed by amyloglucosidase (30 min at 60 °C). To obtain the insoluble and soluble fibers in the first filtration (using celite), the residue was cleaned with 10 mL of water at 70 °C, and, then, with 10 mL of EtOH 95% and 10 mL of acetone. To determine the soluble fiber, 4 volumes of EtOH pre-heated at 60 °C were added and allowed to precipitate for 60 min; the filtration was then performed using celite and the residue was washed with 15 mL of EtOH 75%, EtOH 95%, and acetone. This residue was dried and the protein and ash contents were determined, the remainder being soluble fiber, subtracting the weight of celite. The total fiber was calculated by adding the insoluble and soluble fiber contents.
2.2.6. Carbohydrates
The carbohydrates are determined by difference, using the equation:
Carbohydrates (%) = 100 − (moisture + ash + fat + protein)
2.3. Hot-Air Drying (HAD)
The hot-air drying (HAD) experiments were performed at 45, 62, and 70 °C and stepwise at 62 °C (10 min) followed by at 45 °C and at 45 °C (10 min) followed by at 62 °C. For HAD, a food dehydrator (Serial# 200137658, model 4900, Excalibur Products, U.S.A. Sacramento, CA, USA) was used, with an air flow rate between 0.12 and 0.15 m3/s, corresponding to an airspeed between 1.1 and 1.4 m/s (mini-anemometer UT363 BT, Dongguan City, Guangdong Province, China). The temperatures were selected to use a gentle drying process (rather low temperatures) to preserve the quality of the pomace. The step experiments were established after carrying out the first experiments at 45–70 °C and based on the temperatures. These first HAD experiments revealed a constant rate drying period of about 10 min. For each experiment, a portion of around 60 g of apple and ginger pomace (whole or ground) was spread on a net (previously weighed) in an oval shape with dimensions of 154 mm × 166.7 mm, and this net was placed on the central tray of the dryer. The net was withdrawn and weighed (AND, A&D Company, Limited, Fx-500, Seul, Republic of Korea), and the weight was registered every 10 min until 2 h and, then, every 30 min until the pomace reached around 10–12% water (pre-calculated based on the initial moisture content). The dried product had a slab shape with a thickness of around 2.5 mm. Each experiment was performed in duplicate.
2.4. Microwave Drying (MWD)
MWD experiments were conducted in a microwave (Samsung MS23K3513AW, Dublin, Ireland) using different power settings of 100, 180, 300, and 450 W and stepwise at 100 W followed by at 300 W. The step conditions were established based on the results of the application of the steps in HAD. For each experiment, a portion of around 55 g (for a 2.5 mm thickness) or 45 g (for a 1.5 mm thickness) of apple and ginger pomace was spread on a ceramic plate (previously weighed) in a region with a diameter of around 145 mm. The weight was registered every 90 s until 3 min and, then, every 60 s until the pomace reached around 10–12% water (pre-calculated). The dehydrated product was slab-shaped with a thickness of around 2.5 mm or 1.5 mm. Each experiment was performed in duplicate.
2.5. Moisture Content Determination
The moisture content of the apple and ginger pomace was determined before and after (about 2 g) each drying experiment. It was determined in an oven (Memmert, Schwabach, Germany) at 105 °C for 24 h, using the same method mentioned in Section 2.2.1. [15]. The determinations were performed in duplicate.
2.6. Water Activity Determination
The water activity of both the thawed (before drying) and the dried apple and ginger pomace (app. 2 g) was determined in a LabMaster-aw Neo (Novasina AG, CH-8853, Lachen, Switzerland). The reading temperature was around 25 °C. Three replicates were performed for each experiment.
2.7. Mathematical Models Used
The moisture ratio (MR) of the samples was used to describe the experimental data during the drying process:
X0 is the initial moisture content, X is the moisture content at time t, and X∞ is the moisture content at equilibrium, all on a dry basis (kgwater·kgdry matter−1). Some mathematical models, phenomenological and empirical or semi-empirical, were used to fit the experimental data. The equations of the models are the following:
Lewis’s [11],
Henderson and Pabis’s [12],
Crank’s 1st term of the series solution of Fick’s second law applied to a slab [13],
Deff is the water effective diffusivity and L0 is half of the slab thickness.
Midilli et al.’s [14],
k, a, n, and b in Equations (4)–(7) are the parameters of the models.
2.8. The Arrhenius Behaviour
Deff is influenced by the temperature as shown in Equation (8) [20].
Equation (8) can be linearized (Equation (9)). Plotting as a function of results in a linear relation, and , the activation energy, can be calculated from the slope. In Equation (8), R (8.314 J/(mol·K)) is the universal gas constant and T (K) is the absolute temperature.
2.9. Specific Energy Consumption Determination
The energy consumption during the drying process can be calculated both for HAD and MWD. For HAD, Equation (10) [21,22] represents the specific energy Es_HAD (kWh/kg) required to dry the pomace.
A (m2) is the cross-sectional area of the equipment in which the sample is placed, (m/s) is the air velocity, ρair is the air density (kg/m3) at the air temperature, Cpair is the average specific heat of the air (kJ/kg/K), ΔT (°C) is the difference between the air temperature and the room temperature (25 °C), t (h) is the drying time and m0 (kg) is the initial mass of the pomace sample.
For MWD, the specific energy Es_MWD (kWh/kg) can be calculated using Equation (11) [22].
P (W) is the power.
2.10. Color Analysis
The color of both the thawed (before drying) and the dried apple and ginger pomace was assessed using a colorimeter (Chroma Meter, CR-400, Konica Minolta Sensing, Inc., Tokyo, Japan). Ten measurements were performed for each replicate. Three replicates were performed for each experiment. The parameters obtained were a* (red/green coordinate), b* (yellow/blue coordinate), and L* (lightness). Hue (h) was calculated using Equation (12), Chroma (C) was calculated using Equation (13), and the color difference () was calculated using Equation (14) [23].
* is the difference between the lightness of the sample (L*) and the control (L0*). * is the difference between the red/green coordinate of the sample (a*) and the control (a0*). * is the difference between the yellow/blue coordinate of the sample (b*) and the control (b0*).
2.11. Total Phenolic Content (TPC) and Antioxidant Activity (AA) Determinations
The samples selected to determine TPC and AA were an unground sample dried by HAD at 62 °C with 2.5 mm thickness and another ground sample dried by MWD at 180 W with 1.5 mm thickness. These conditions were selected after the drying experiments in order not only to minimize the quality degradation during drying but also to not compromise the drying kinetics and drying times. Therefore, 62 °C was selected because it resulted in kinetics close to 70 °C and these kinetics were faster than those at 45 °C. An unground sample was selected for HAD in order to avoid a high degree of quality change. The TPC and AA of the samples before drying (thawed apple and ginger pomace) were also determined.
A classical solvent extraction was performed with a hydroalcoholic solution (water:ethanol 1:9). For this, 2 g of thawed or dried apple and ginger pomace was placed in the solution (60 mL) at room temperature and 120 rpm (Bench Top Shaking Incubator, SI-100C Wiggenhauser, Berlin, Germany) for 120 min (repeated twice). After that, the solution was filtered, the ethanol evaporated, and the extract re-suspended in water. This solution was lyophilized to obtain a solid and dried extract. For the determination of the TPC and AA, this dried extract was suspended in distilled water to obtain a concentration of 20 mg/mL. Three replicates were performed.
The TPC was determined by the Folin–Ciocalteu method as described by Martins et al. [24]. Gallic acid was used as the standard for the calibration curve and the results were expressed in mg GAE/g extract DW, and also in mg GAE/g pomace DW, based on the extraction yield. Three independent analyses were performed in each of the triplicates.
The antioxidant activity of the solution prepared above (20 mg/mL) was determined using three different methods.
2.11.1. The ABTS Method
The ABTS (2,2′-azinobis(3-ethylbenzothiazoline-6-sulphonic acid)) assay performed is described by Martins et al. [24]. Trolox was used as the standard for the calibration and the results were expressed as mg of Trolox equivalent per gram of extract dry weight (mg TE/100 g extract DW), and also per g of pomace dry weight (mg TE/g pomace DW), based on the extraction yield. Three independent analyses were performed in each of the triplicates.
2.11.2. The DPPH Method
The DPPH (2,2-diphenyl-1-picrylhydrazyl) assay was carried out according to the procedure described by Martins et al. [24]. Trolox was used as the standard for the calibration. The results were expressed as mg of Trolox equivalent per gram of extract dry weight (mg TE/g extract DW), and also per gram of the pomace dry weight (mg TE/g pomace DW), based on the extraction yield. Three independent analyses were performed in each of the triplicates.
2.11.3. The ORAC Method
The ORAC assay performed is described by Martins et al. [24]. The results were expressed in mg of Trolox equivalent per gram of extract dry weight (µmol TE/100 mg DW) and also per gram of the pomace dry weight (mg TE/g pomace DW), based on the extraction yield. Three independent analyses were performed in each of the triplicates.
2.12. Statistical Analysis
The results were treated using IBM SPSS Statistics for Windows, Version 28.0 (2021) for Windows (IBM Corp., Armonk, NY, USA). They were expressed as mean ± standard deviation of three independent replicates. Shapiro–Wilk (for normality) and Levene (for homogeneity of variance) tests were performed on the residuals of the fitted model. After that, the analysis of variance (one-way ANOVA) was used to compare the means of different groups and identify if they are equal or if they have a significant difference between them. Tukey’s test was then performed to identify which group or groups were different considering that ANOVA resulted in rejection of the null hypothesis (groups means are different). For the data that did not present homogeneity of variance, Kruskal–Wallis, a non-parametric test considering multiple comparisons, was used to evaluate whether groups are significantly different. The significance level assumed was 5% (p < 0.05) in all tests and analyses performed.
3. Results and Discussion
3.1. Nutritional Composition of the Apple and Ginger Pomace
The moisture content of the raw material (RM1 and RM2) was 73.55 ± 0.75%, the fat content was 0.65 ± 0.05%, the protein content was 1.1 ± 0.1%, the ash content was 0.58 ± 0.05%, the total fiber content was 9.55 ± 0.55%, and the carbohydrates content was 24.12 ± 0.85%. The total sugars were 14.57 ± 1.98% (calculated by the difference between the carbohydrates and the total fiber). These values are within the ranges presented in the literature for apple pomace [25].
3.2. Hot-Air Drying (HAD) Modelling
The Lewis and the Henderson and Pabis models were tested to describe the hot-air drying (HAD) kinetics of the apple and ginger pomace. Figure 1 shows the experimental results for MR and the fit by the Henderson and Pabis model as an example. The drying times to reach 10–12% water in the pomace were between 120 min, for 70 °C, and 300 min, for the stepwise approach starting at 62 °C followed by at 45 °C (Figure 1). As a constant drying-rate period was observed during approximately the first 10 min, the models, which are valid to describe the falling drying-rate period, were applied only after that time. The values of the parameters of the models, as well as the statistical parameters of the fits, R2, and RMSE, are given in Table 1. Overall, both models are a good fit to the HAD data for the temperatures tested. Both models presented high R2 values, between 0.977 and 0.998, and low values of and RMSE, below 0.014 and 0.11, respectively.
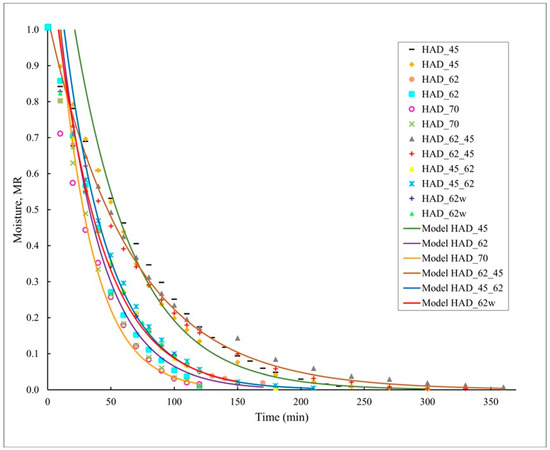
Figure 1.
Experimental data for HAD at 45, 62, 70 °C and stepwise at 45 °C followed by at 62 °C and at 62 °C followed by at 45 °C and the fit of Henderson and Pabis model to the moisture ratio (MR) of apple and ginger pomace in a 2.5 mm layer.

Table 1.
Parameters k and a of the fits of Lewis and Henderson and Pabis models to the MR during HAD at 45, 62, 70 °C and stepwise at 45° C followed by at 62 °C and at 62 °C followed by at 45 °C.
The drying constant, k, depends on material properties such as moisture content and size, and on the airflow properties, such as humidity, temperature, and velocity [26]. As can be seen, the k value increases with temperature (45 °C–70 °C) for both the Lewis and the Henderson and Pabis models. In the case of the steps, since the temperature was switched after 10 min of drying (approximate duration of the constant drying rate) and there was a delay (6–10 min after the switch) before the new temperature was reached, the experimental data used in the modeling were from 20 min on. Therefore, the models were applied only to data from drying at the second temperature. In the step experiments, the k maintained the same behavior as in the experiments without the step: the higher the temperature after the switch, the higher the k (Table 1). Xu et al. [27] studied the effect of two-stage drying on the quality and drying efficiency of paddy rice by hot air. They concluded that drying at 60 °C followed by at 45 °C resulted in a shorter drying time than air drying at a constant temperature of 50 °C. This was not the case in the present study as drying at 62 °C followed by at 45 °C resulted in a higher drying time (lower k value) than drying at 45 °C (Figure 1, Table 1). This could be explained by the formation of a crust of solids that remain at the surface of the product when the liquid water evaporates during the constant rate period (about the first 10 min) of air drying [28,29] at 62 °C, which is higher than 45 °C and, therefore, might aggravate this crust formation. This crust would hinder the subsequent water removal from the inside of the product even when after that first period, the temperature is lowered to 45 °C. Chua et al. [30] also found that a step change in the drying air temperature with the appropriate starting temperature could reduce significantly the drying time to reach the desired moisture content with improved product color. The value of this parameter tended to be lower for the whole (unground pomace) than for the ground one (62 °C), which may be due to a lower area/volume exposure to the air. Tulej and Głowacki [31] used the Page model and estimated it was suitable to describe the experimental data obtained by HAD of apple pomace at 40 °C and 80 °C.
The parameters of the Henderson and Pabis model are also valid for the 1st term of the series solution of Fick’s second law (Equation (6)). The water effective diffusivity (Deff) was calculated using the k values of the fit Henderson and Pabis model (Table 1) and the results are presented in Table 2. The Deff values increased with temperature in the range 45 to 70 °C, in the same way as the k values (Table 1). The same relation was observed for the steps: the higher the temperature after the switch, the higher the Deff. Also, the unground sample presented a Deff value lower than the ground one, following the behavior of the k parameter. The Deff values obtained for apple and ginger pomace (1.29 ± 0.27 × 10⁻¹⁰ to 4.83 ± 0.16 × 10⁻¹⁰ m2/s) are similar to Kara and Doymaz’s [32] results, who found an effective moisture diffusivity from 1.73 × 10⁻¹⁰ to 4.40 × 10⁻¹⁰ m2/s when drying apple pomace.
Table 2.
Water effective diffusivity (Deff) of Crank model calculated using k values of Henderson and Pabis model.
The activation energy () calculated using Equation (9) applied to Deff values determined for 45, 62, and 70 °C was 23.90 kJ/mol. Even though the R2 of the linear relation was low (0.7204), the value is within the range found in the literature. Agro-food products are known to present an of between 12 and 110 kJ/mol [33]. More specifically, apple pomace drying presented an activation energy of 24.725 kJ/mol in the second falling rate period [34] and 29.65 kJ/mol overall [32]. Ginger slices presented an of 19.313–22.722 kJ/mol [35].
Horuz et al. [36] used a hybrid microwave–hot air domestic oven at 120–180 W coupled with 50–70 °C to dry apple slices. They observed the constant rate period only at low microwave powers and air temperatures and they used the Modified Logistic Model to fit the experimental data. The Deff values ranged from 1.42 × 10⁻⁹ to 3.31 × 10⁻⁹ m2/s, higher than the values of the present study, suggesting that hybrid drying is more effective than HAD. The varied from 13.04 to 33.52 kJ/mol.
3.3. Microwave Drying (MWD) Modeling
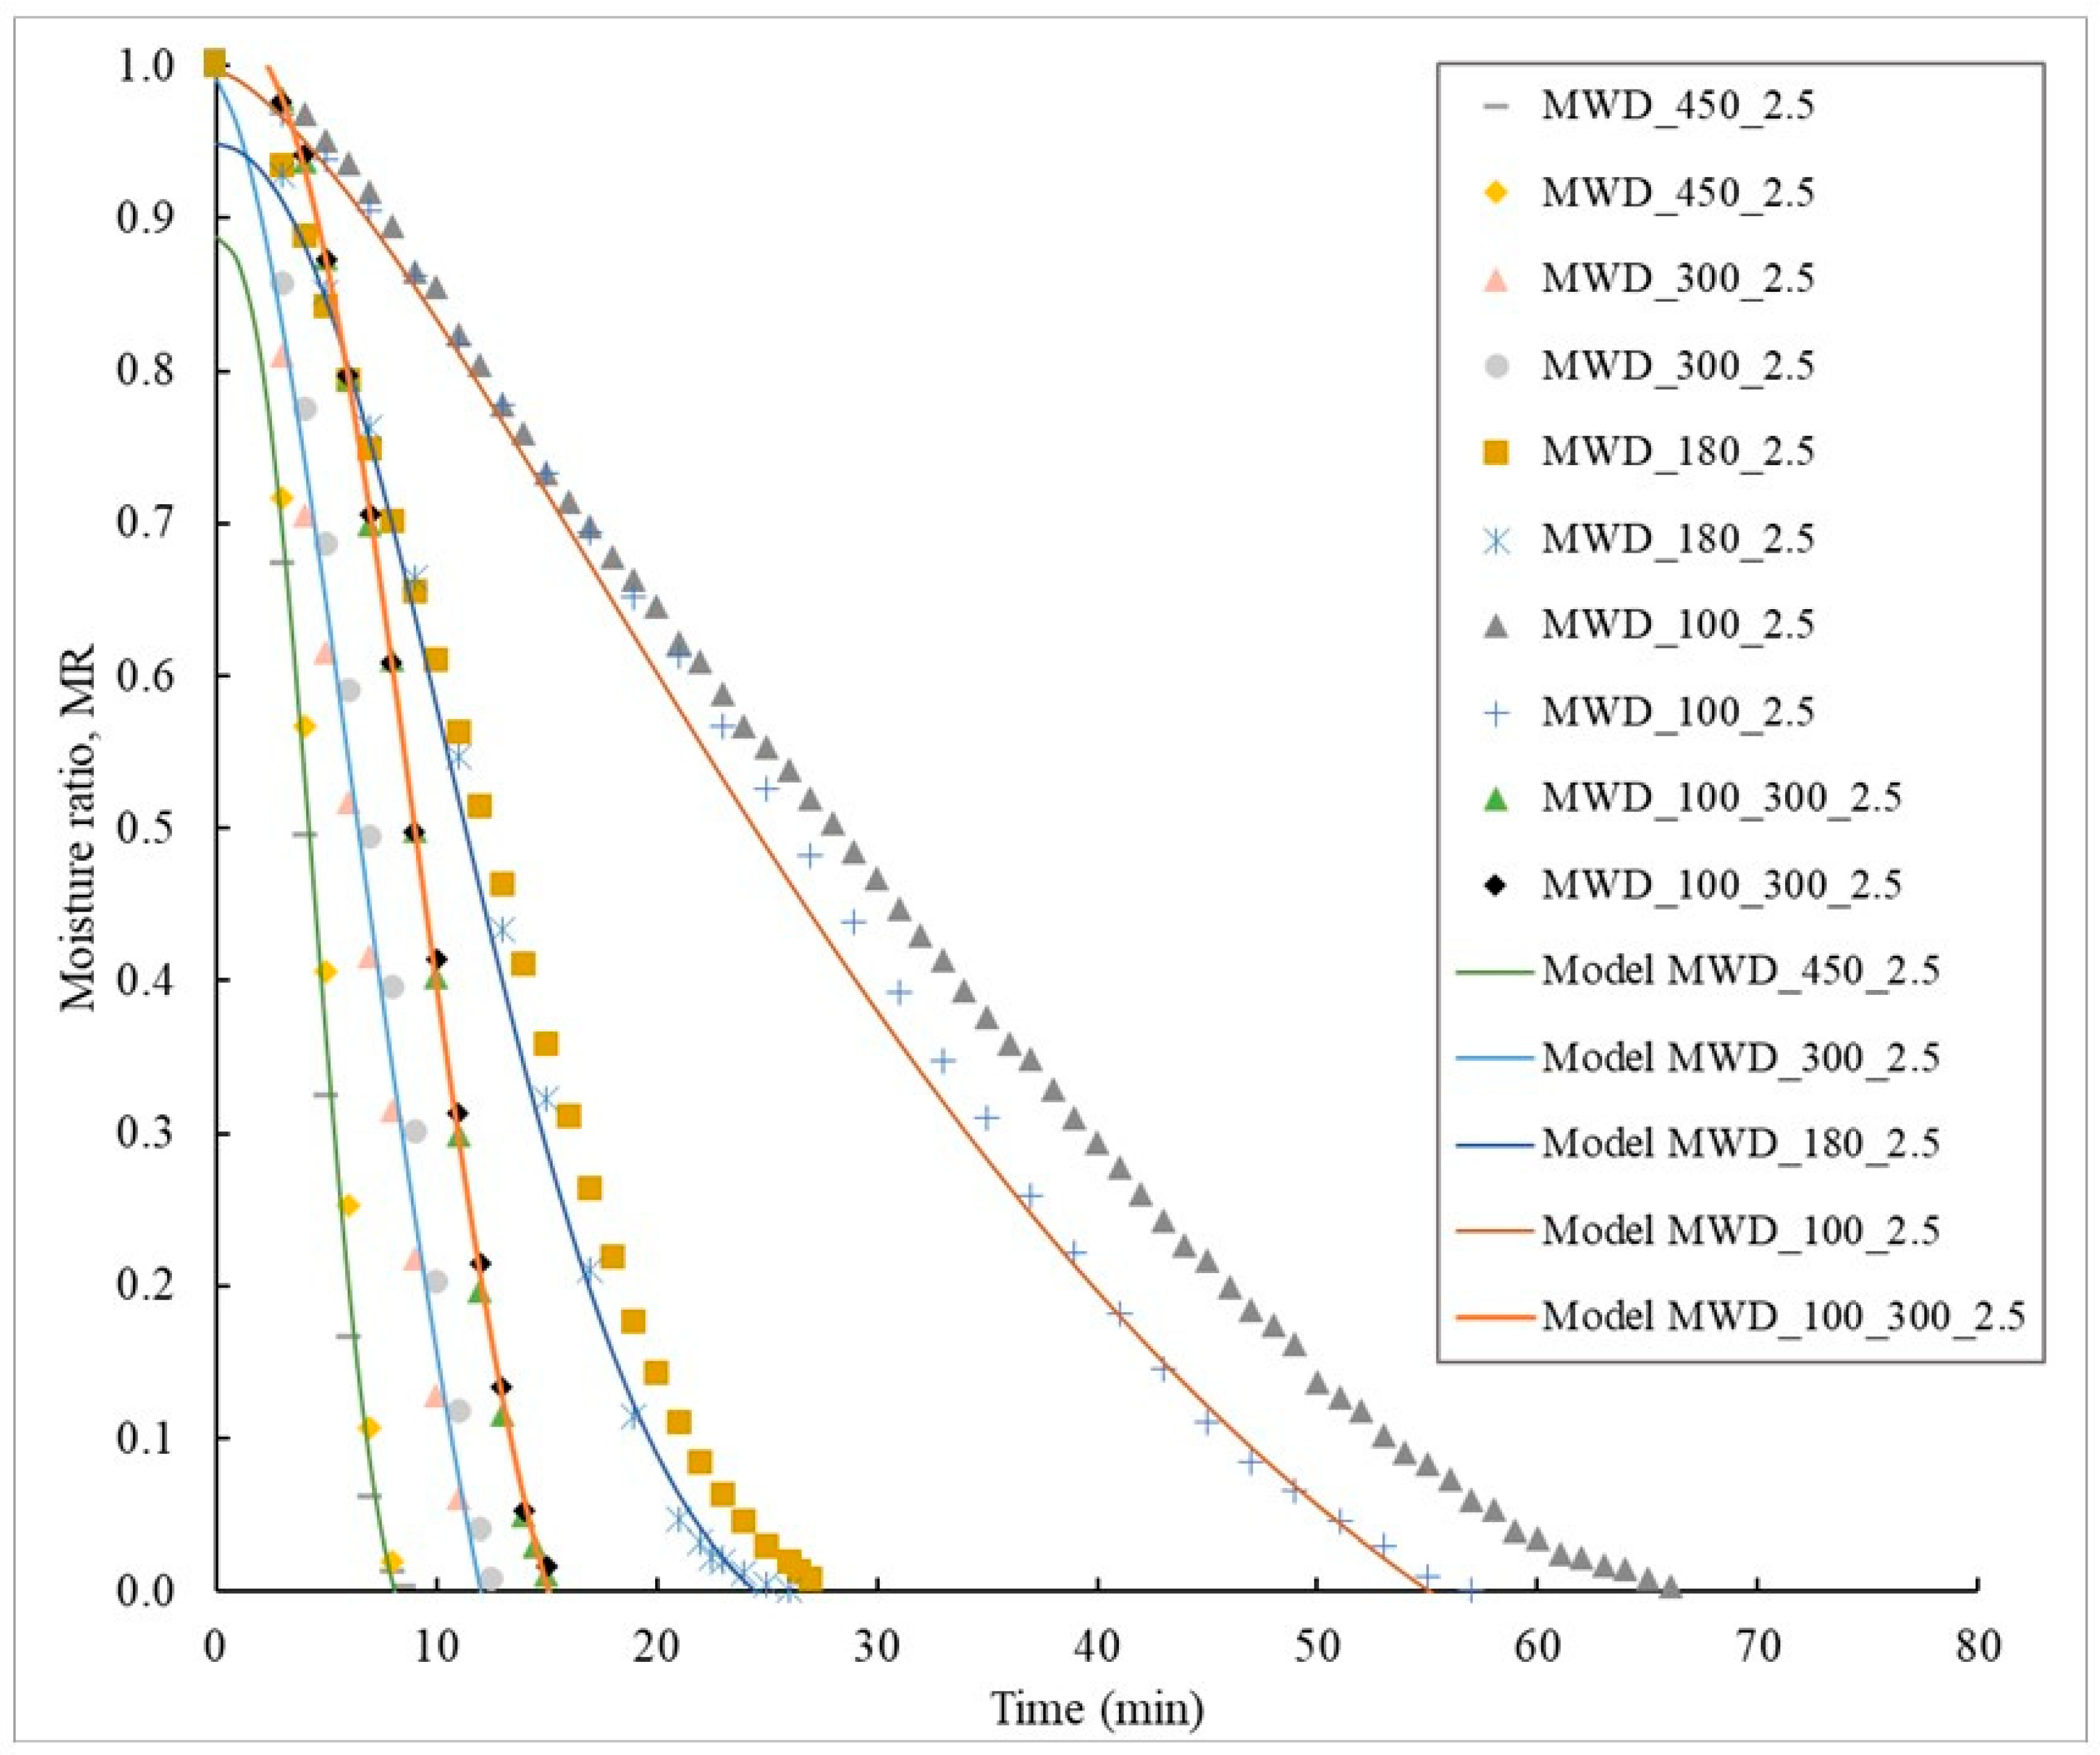
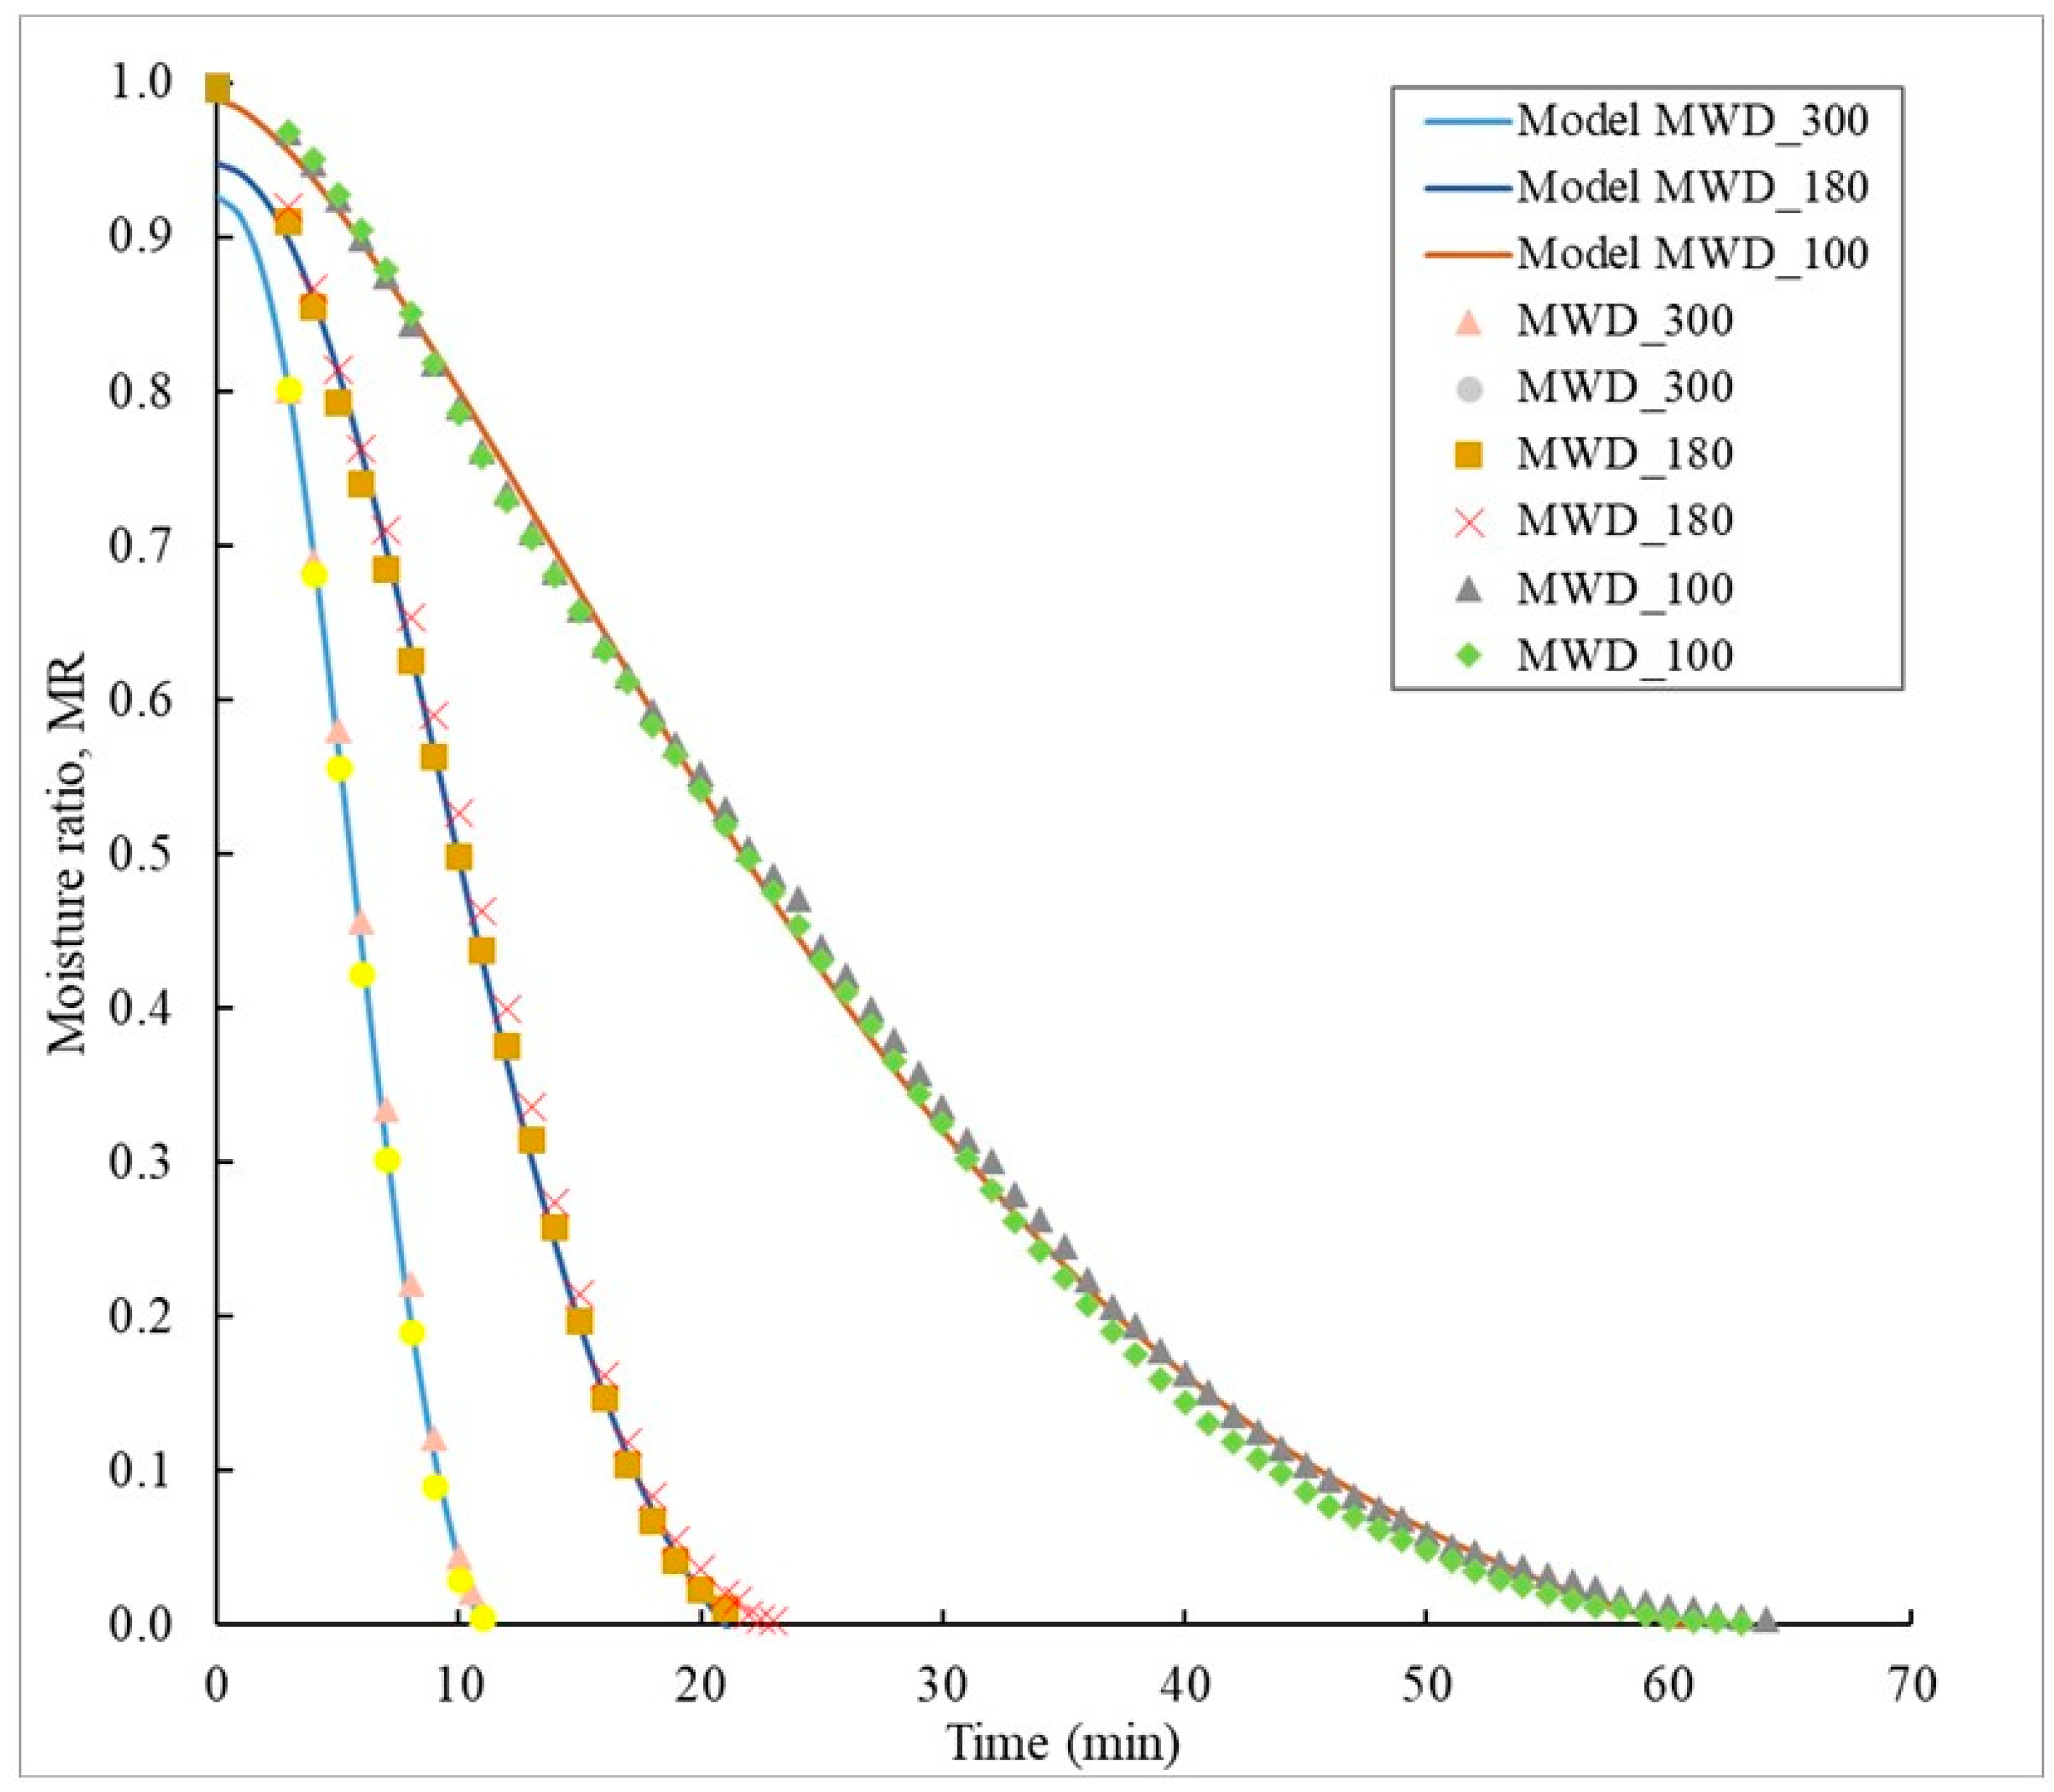
With microwave drying, the drying times to reach 10–12% water in the pomace were between 8 min for 450 W and 62 min for 100 W for 2.5 mm thickness (Figure 2) and 11 min for 300 W and 57 min for 100 W for 1.5 mm thickness (Figure 3). The Lewis and the Henderson and Pabis models did not well fit the experimental data of the microwave drying (R2 < 0.795; and RMSE above 0.012 and 0.16, respectively). Instead, the Midilli et al. model was suitable to describe the experimental data of MWD (Figure 2 and Figure 3, Table 3 and Table 4). and RMSE values from the Midilli et al. model were much lower compared to those of the other two models. It could also be seen that, in general, the higher the power, the better the fits of the Midilli et al. model, reflected in low and RMSE values (Table 3 and Table 4). Tulej and Głowacki [31] used the Page model and they estimated it was suitable to describe the experimental data obtained by HAD of apple pomace at 60 °C with microwave support.
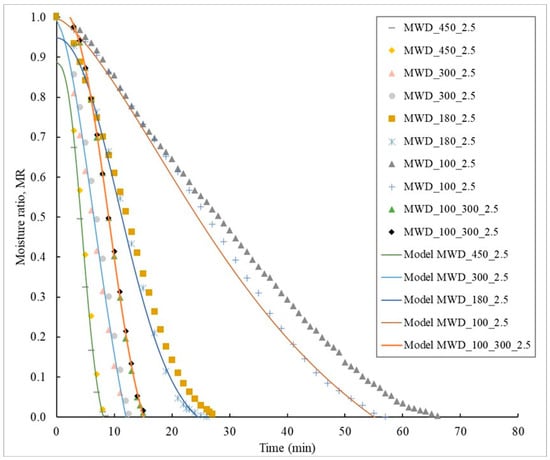
Figure 2.
Experimental data for MWD at 100, 180, 300 and 450 W and stepwise at 100 W followed by at 300 W, and the fit of the Midilli et al. model to the moisture ratio (MR) of apple and ginger pomace in a layer of 2.5 mm.
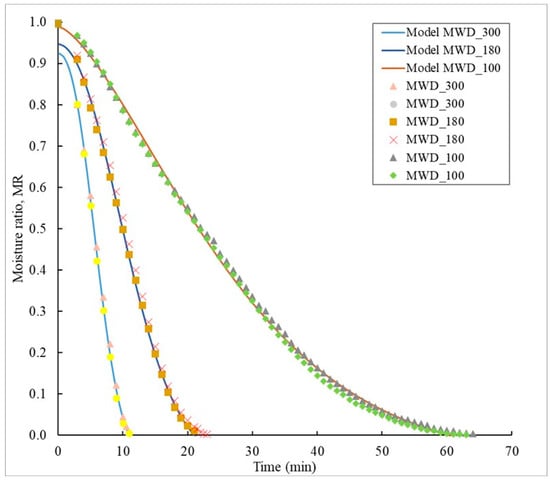
Figure 3.
Experimental data for MWD at 100, 180, and 300 W, and the fit of Midilli et al. model to the moisture ratio (MR) of apple and ginger pomace in a layer of 1.5 mm.
Table 3.
Parameters k, a, b, and n of the fit of Midilli et al. model to the MR during MWD of apple and ginger pomace in a layer of 2.5 mm at 100, 180, 300 and 450 W and stepwise at 100 W followed by at 300 W.
Table 4.
Parameters k, a, b, and n of the fit of Midilli et al. model to the MR during MWD of apple and ginger pomace in a layer of 1.5 mm at 100, 180, and 300 W.
As expected, the higher the power, the lower the time required and the faster the kinetic to dry the apple and ginger pomace to the same final amount of water content of around 10% (Figure 2 and Figure 3). The stepwise MWD at 100 W followed by at 300 W did not improve the kinetic in comparison to MWD at 300 W alone.
Despite the interesting results of the mathematical modeling, it was possible to observe that the MWD process was not homogeneous since some parts of the pomace were more humid than others. This illustrates one of the challenges of MWD, which is the non-uniformity of the drying process. In fact, some burnt areas were observed after MWD at 450 W. This process causes spots where the temperature is not enough to evaporate the water from the foodstuff, resulting in parts that remained wet in the pomace after MWD [37].
For all powers tested with reduced thickness (1.5 mm), the water activity and dry matter results met the expectations (aw < 0.52 and DM > 88%) of safety and quality. When compared to MWD samples with a thickness of 2.5 mm, the ones with a thickness of 1.5 mm dried more homogeneously and presented fewer burnt areas.
3.4. Drying Time and Specific Energy Consumption
The drying times to achieve 12% (0.136 kg water/kg DW) were predicted by the Lewis model (Equation (4)) for HAD and the Midilli et al. model (Equation (7)) for MWD. In each case, since the models apply only to the falling rate period of the drying, which lasted for 10 and 3 min and corresponded to the constant drying rate for HAD and MWD, respectively, were added to the predicted values.
The total drying time for HAD at constant temperature was between 125.0 ± 9.2 min (70 °C) and 236.5 ± 3.6 min (45 °C), whereas for MWD, it was between 11.1 ± 0.2 min (450 W, 2.5 mm) and 61.5 ± 6.0 min (100 W, 2.5 mm), for the same slab thickness (Table 5). For all conditions studied, MWD was about 7 to 11 times faster (86% to 91% reduction in the drying time) than HAD.
Table 5.
Drying times predicted by Lewis model for HAD experiments and Midilli et al. model for MWD experiments to reach 12% moisture content and respective specific energy consumptions.
The specific energy consumption was calculated considering the estimated total drying time. For the HAD, it varied between 410.78 ± 6.30 kWh/kg (45 °C) and 763.74 ± 205.40 kWh/kg (step 62 °C–45 °C), whereas for the MWD, it was between 1.51 ± 0.02 kWh/kg (300 W, 1.5 mm) and 1.86 ± 0.18 kWh/kg (100 W, 2.5 mm) (Table 5). So, there is a huge difference between the specific energy for HAD and MWD. There are other studies that compare the specific energy consumption between HAD and MWD. Motevali [22] studied the drying of pomegranate arils. In this case, for HAD, the specific energy consumption at 45 °C with 1.5 m/s air velocity was 252.33 kWh/kg whereas for MWD, it was 0.35 kWh/kg at 100 W. The results are different from those obtained in the present study, which may be due to many factors, such as the raw material and quantity taken for drying, the equipment type, air-product contact area, and drying time. Despite the differences, it is possible to observe that the specific energy consumption in MWD was significantly lower than in HAD in both studies, which suggests that MWD has a higher potential to dry apple and ginger pomace than HAD. Popescu et al. [21] also obtained lower specific energy consumption values for HAD of tomato peels: from 56.70 ± 0.52 at 50 °C to 63.00 ± 0.67 kWh/kg at 75 °C. The specific energy consumption in HAD of the whole (not ground) pomace at 62 °C was 25% higher than for the ground pomace, reflecting the advantages of exposing more surface area for the heat and mass transfer by grinding the pomace.
The results on the specific energy consumption and drying time suggest that MWD is more promising than HAD as an approach to minimize the loss of bioactivity (antioxidant and antimicrobial properties) and to better preserve the quality of dried apple and ginger pomace while saving operating costs.
3.5. Water Activity (aw)
All dried samples presented a water activity lower than 0.6, which is recommended for the safety of food products [38]. HAD-dried pomace presented an average aw of 0.3264 ± 0.630, with the unground (whole) sample dried at 62 °C presenting an aw of 0.4546 ± 0.0060. The ground samples presented a higher superficial area to exchange heat and moisture with the air, which may explain the lower aw values for the same final water content (below 12.0%). MWD-dried pomace presented an aw equal to or below 0.5126 ± 0.0142 (in this case the final water content was 14.0%, 100 W), with an average value of 0.4103 ± 0.092.
3.6. Color
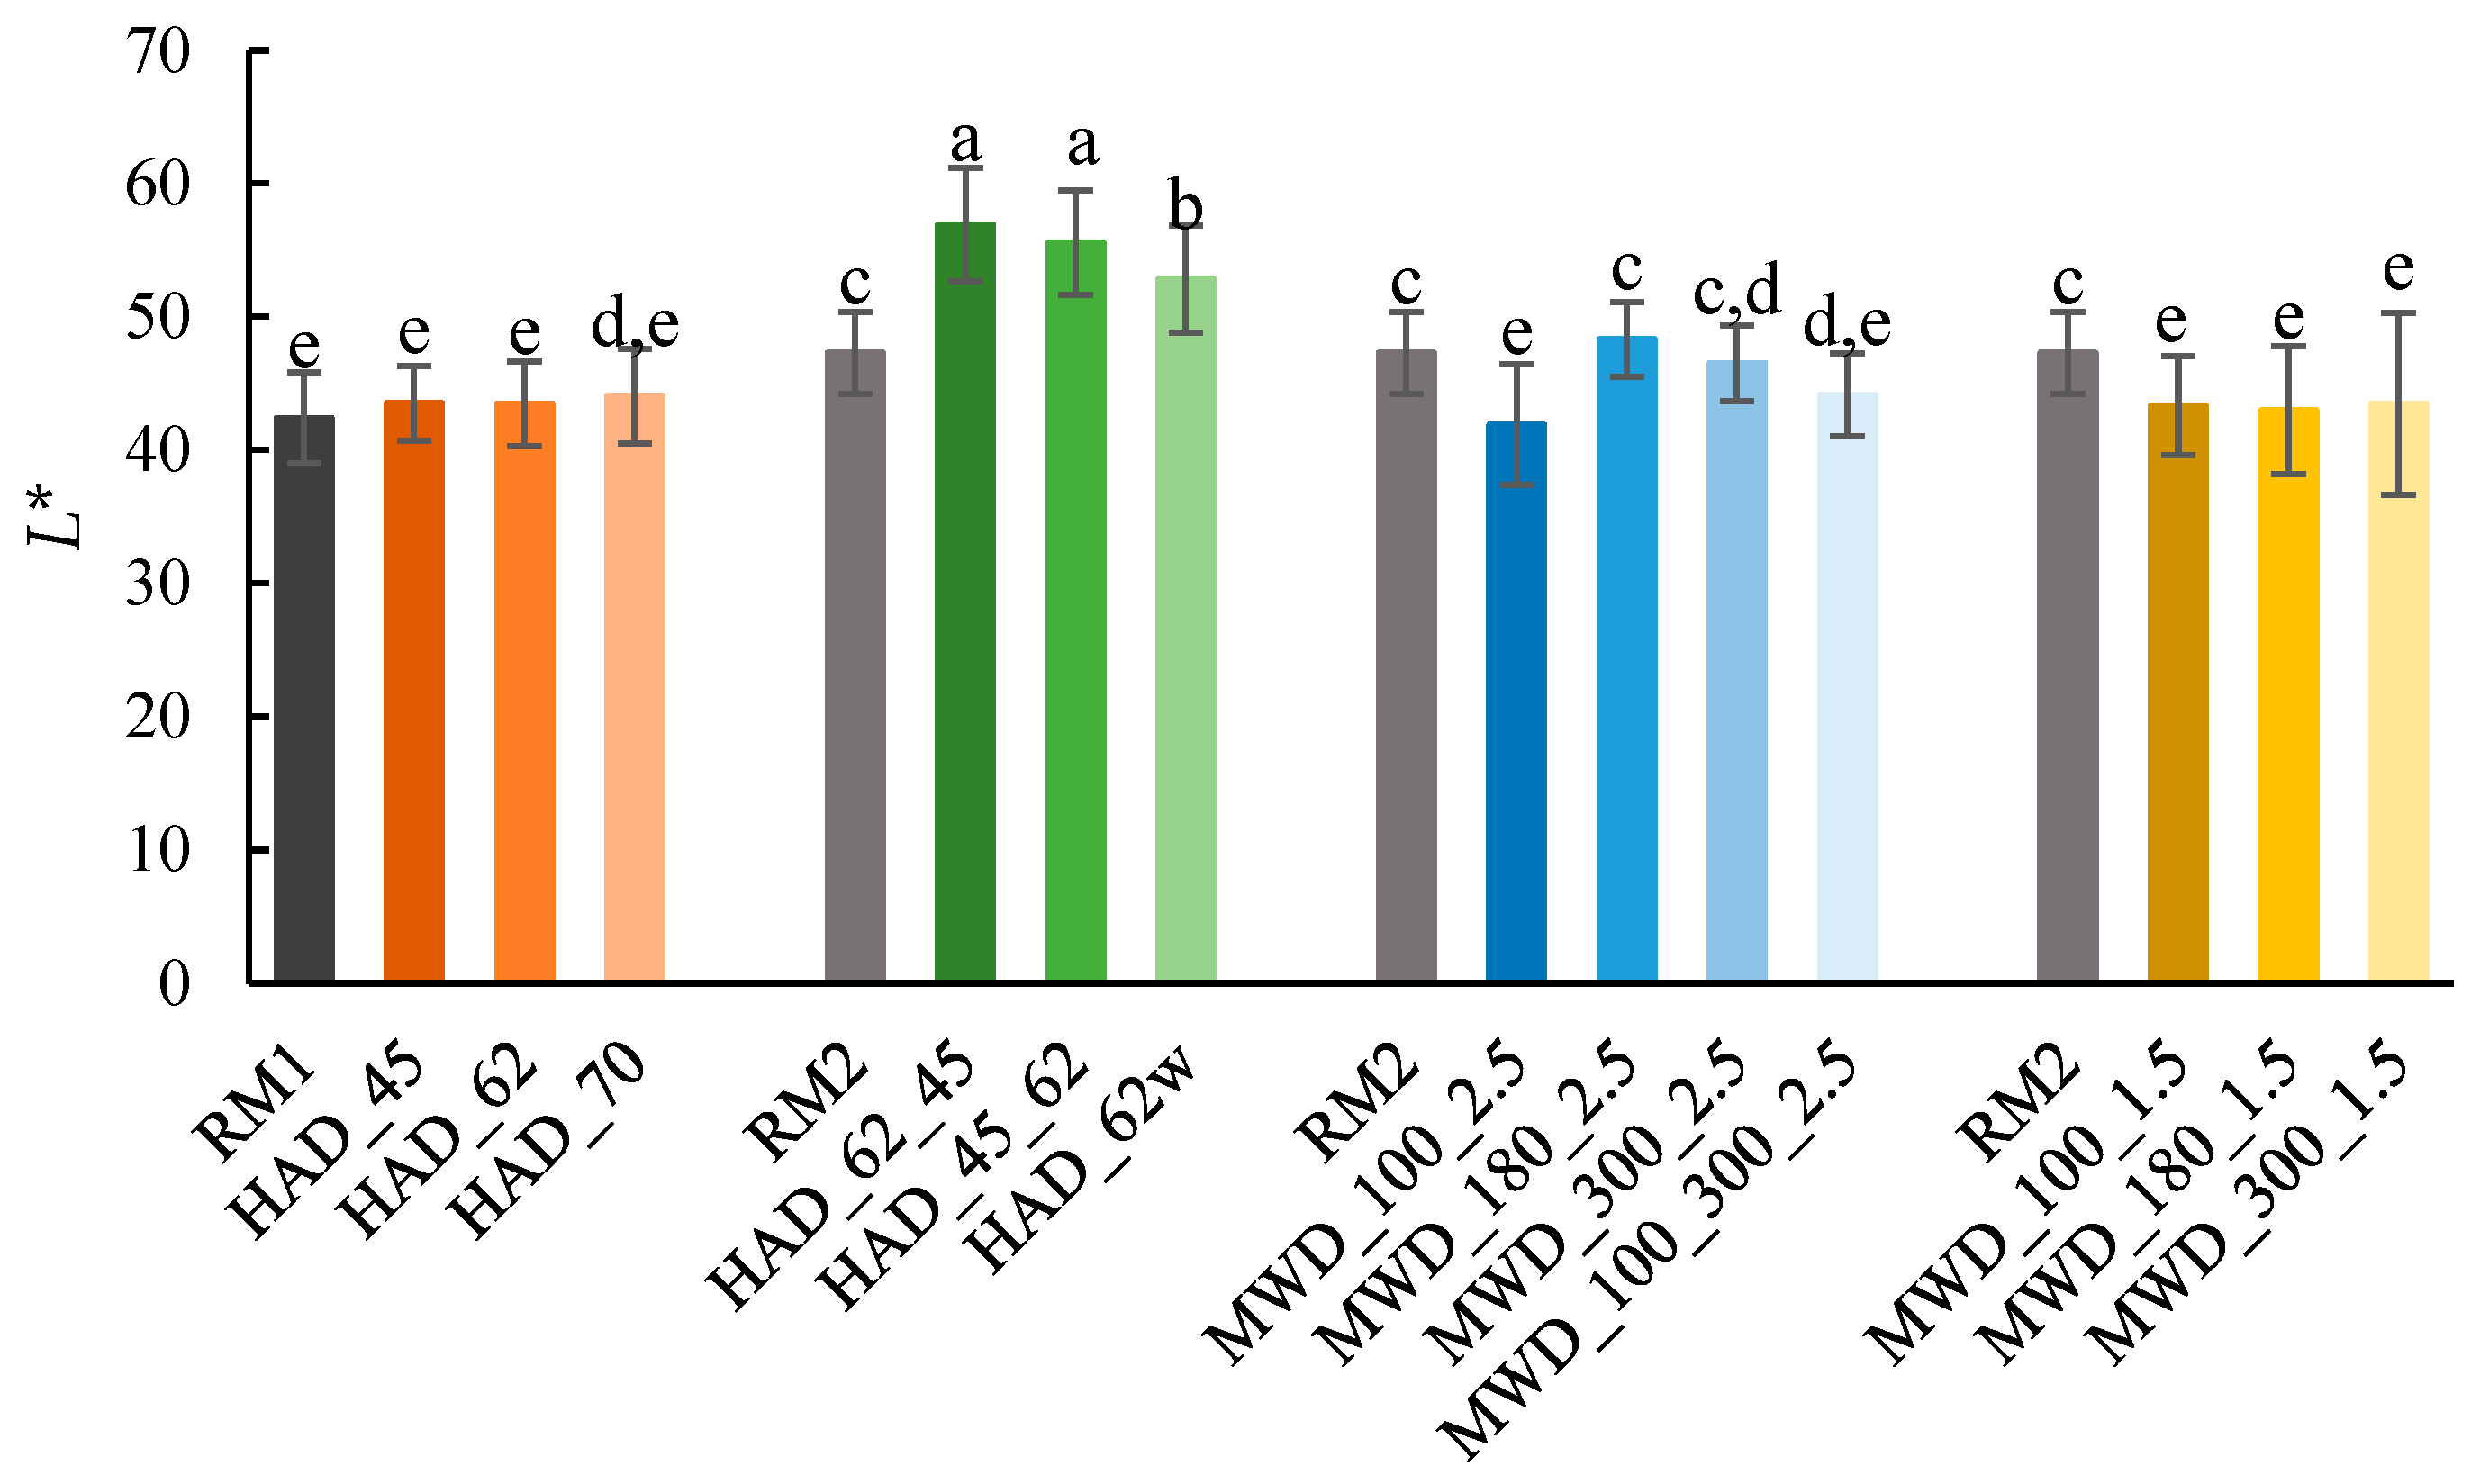
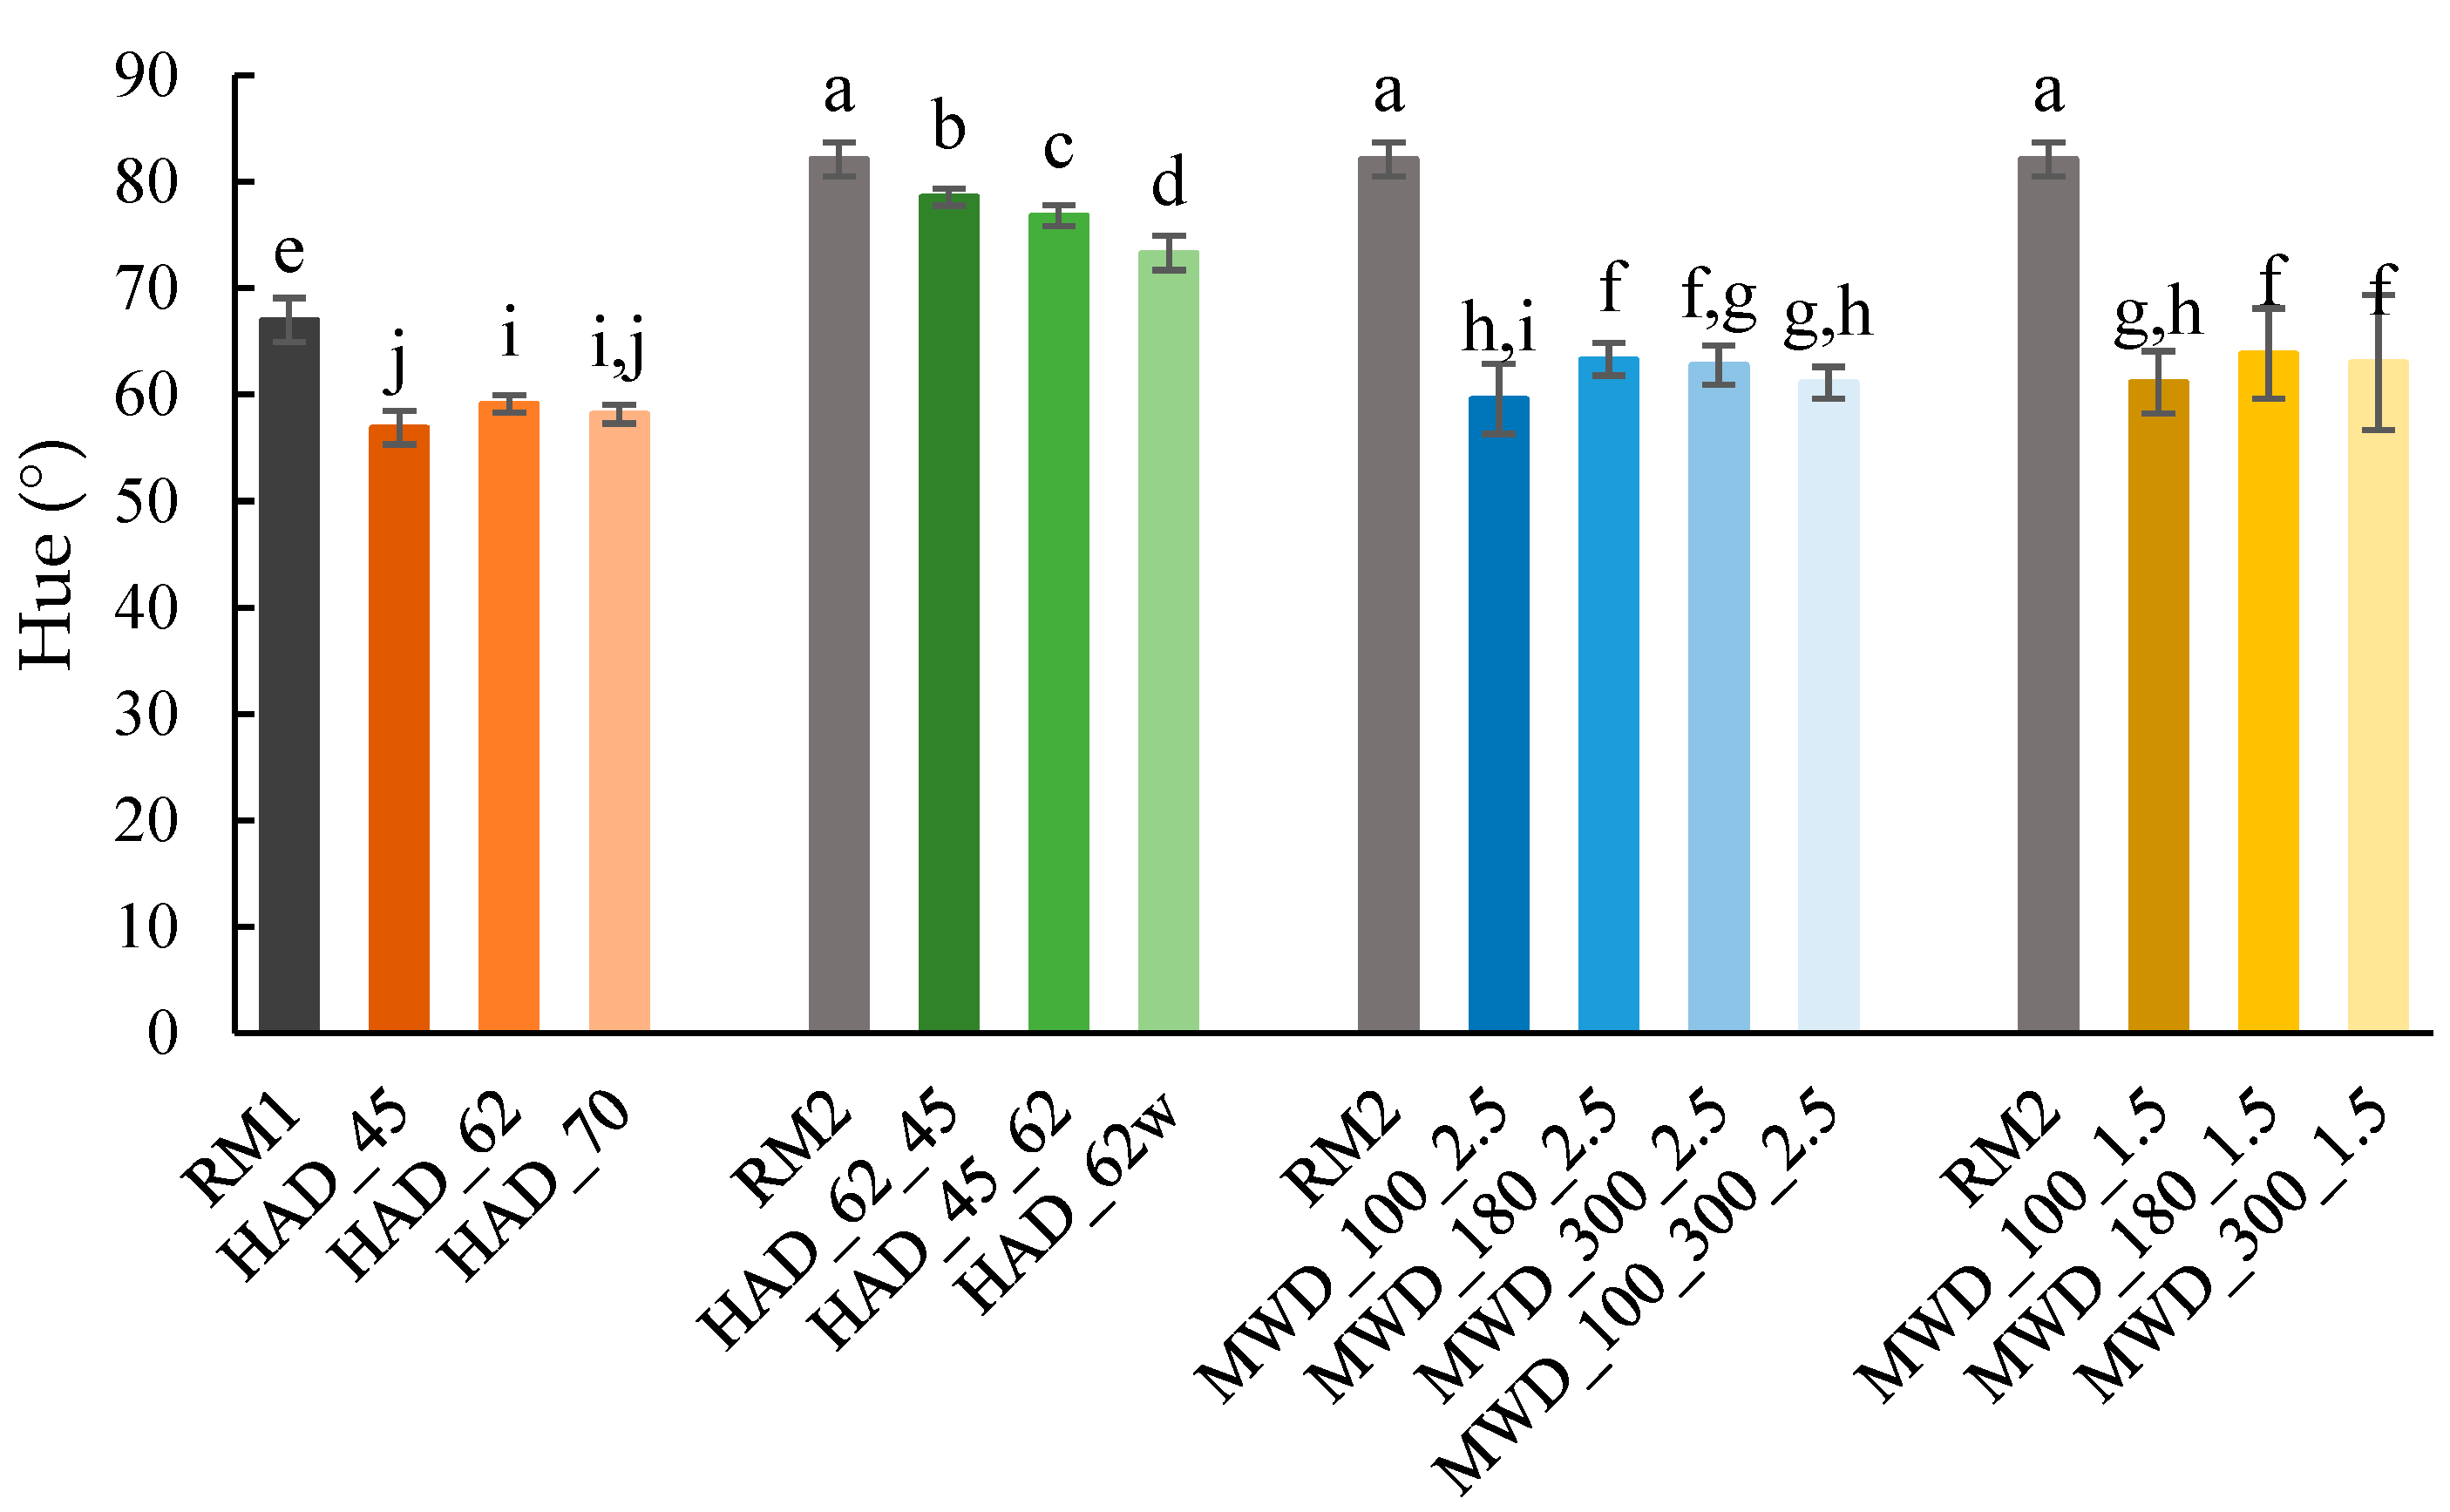
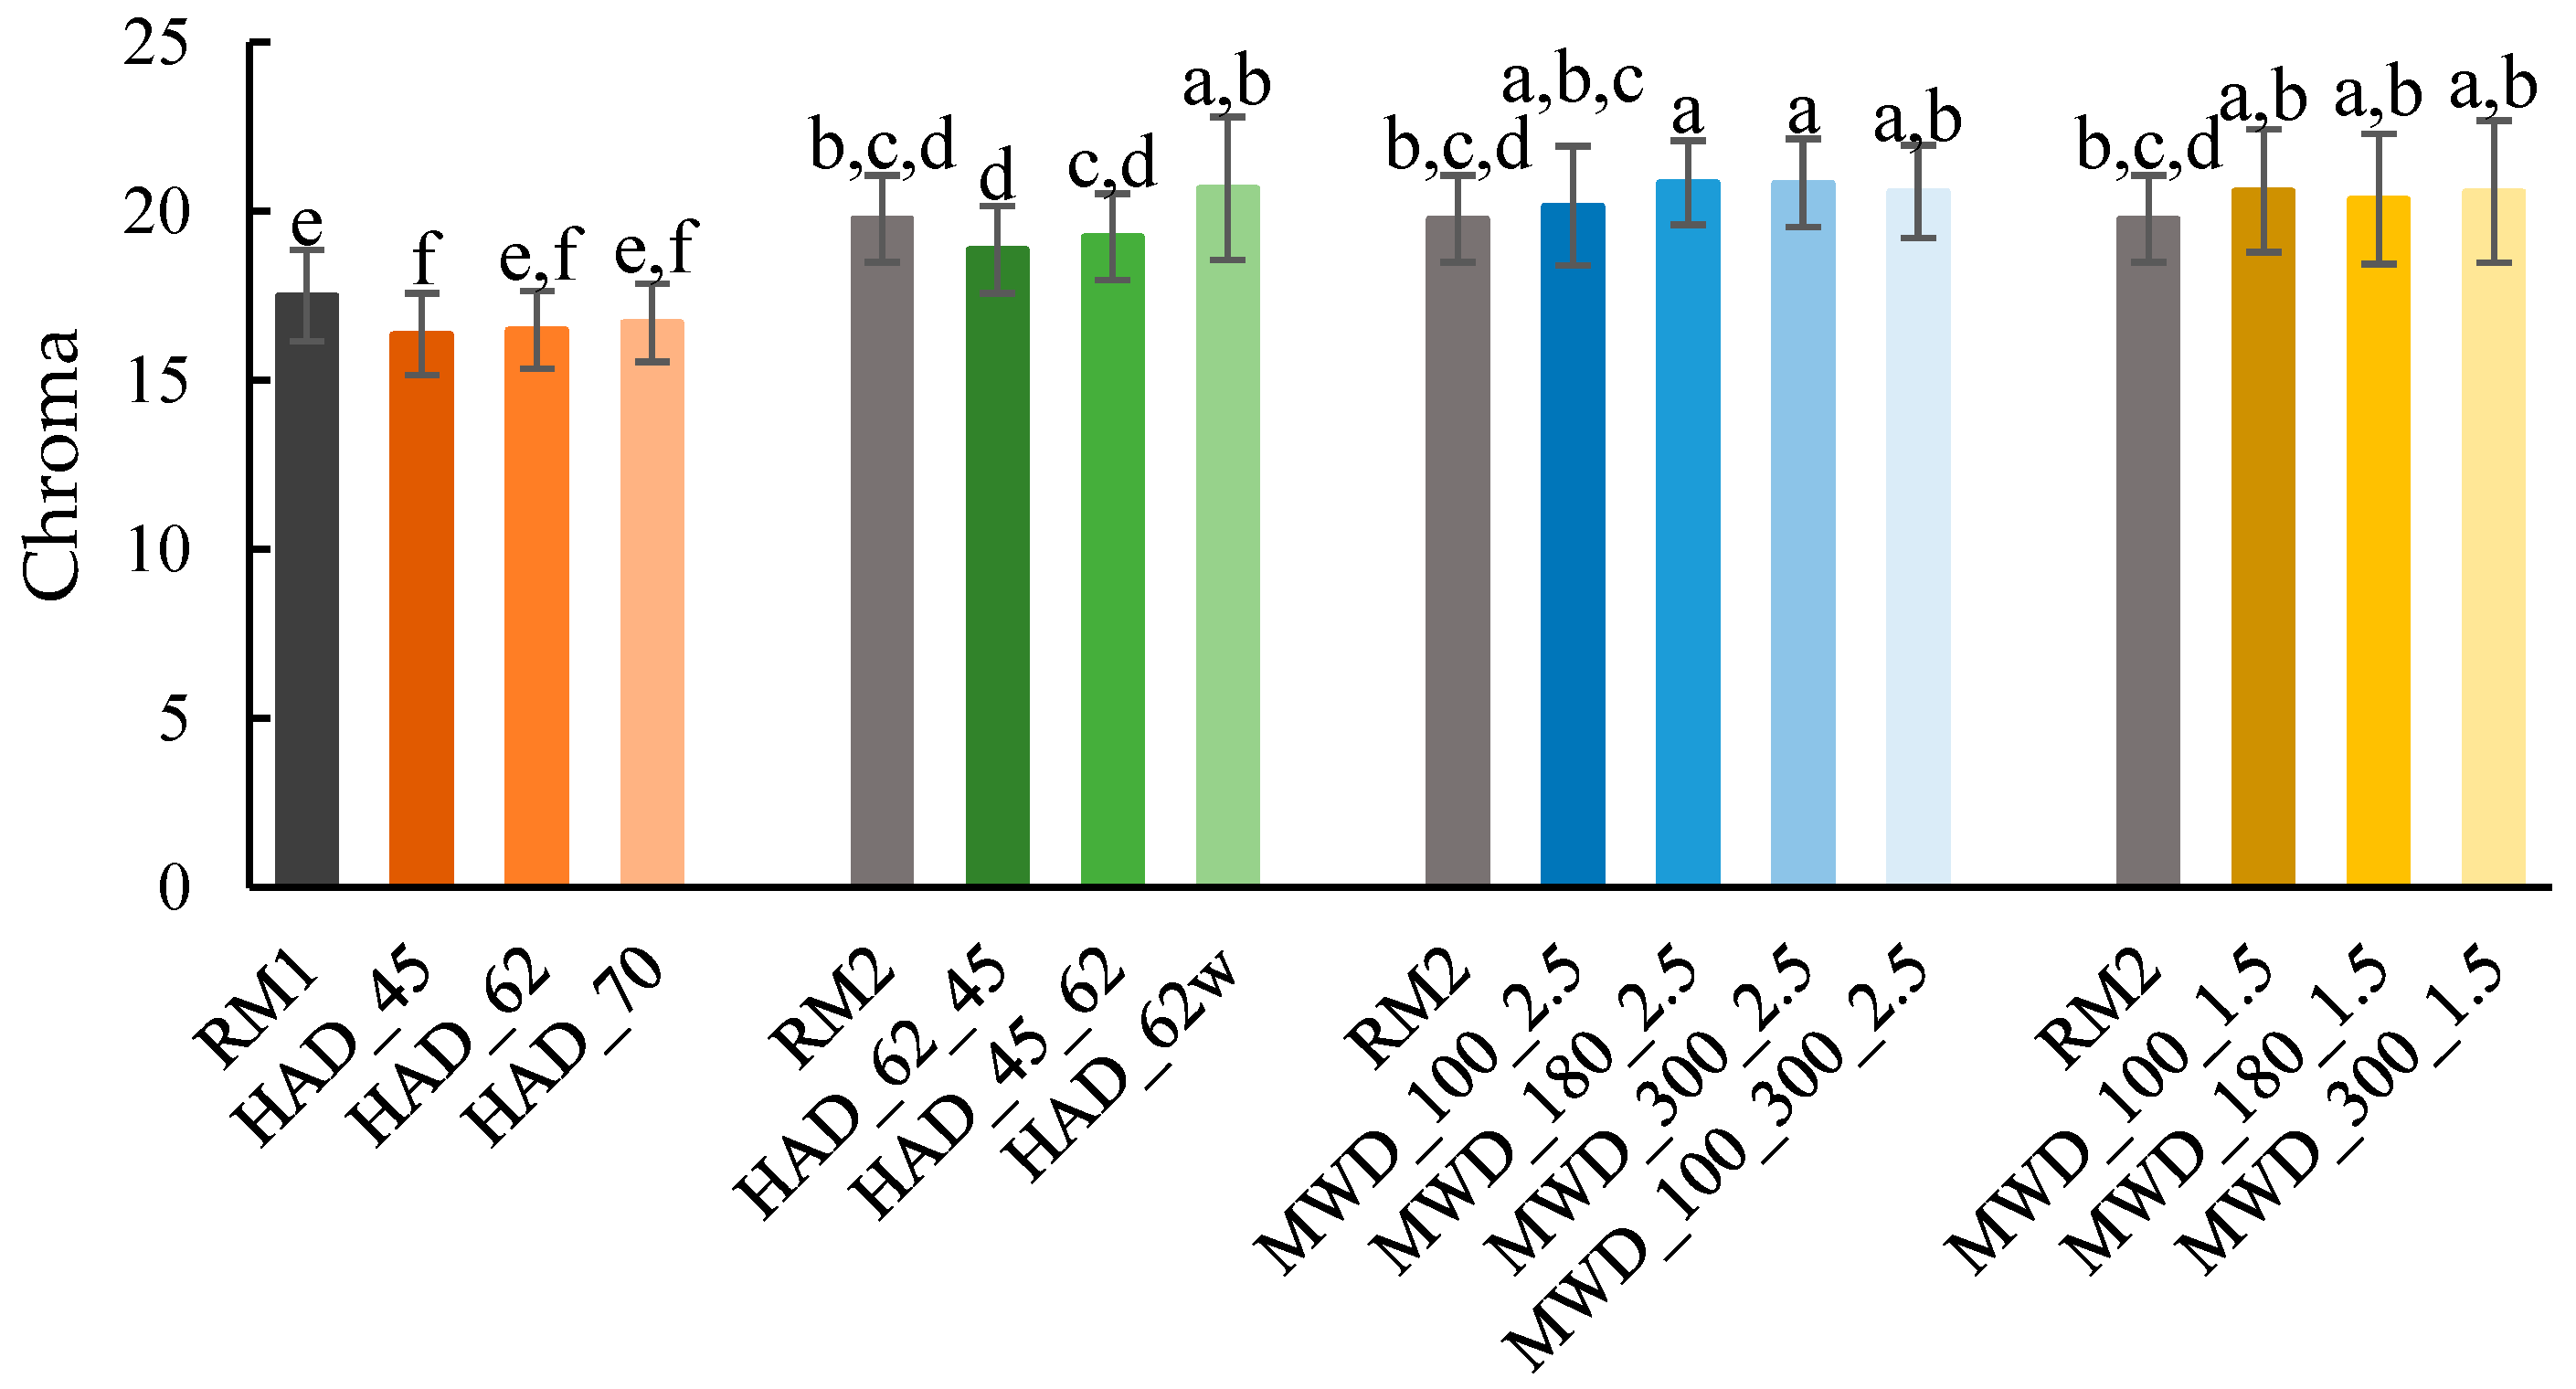
For all dried samples and raw materials (defrosted apple and ginger pomace), L* values varied from 41.91 ± 4.54 to 56.92 ± 4.26 (Figure 4), a* values from 2.71 ± 0.53 to 10.16 ± 1.13, and b* values from 13.71 ± 1.13 to 19.80 ± 2.07. Hue values varied between 56.90 ± 1.58 ° and 82.11 ± 1.60 ° (Figure 5) and Chroma values were between 16.36 ± 1.21 and 20.84 ± 1.25 (Figure 6). There was a difference in the color parameters between the two raw materials used (Figure 4, Figure 5 and Figure 6), which was due to the heterogeneity of the apple and ginger pomace produced.
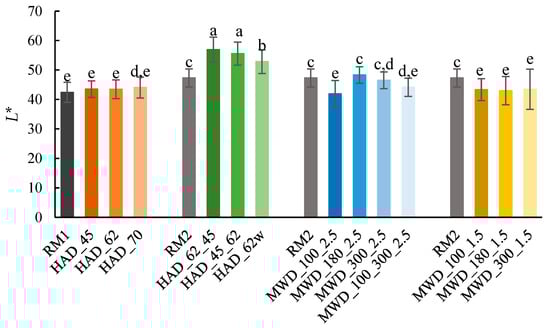
Figure 4.
L* values of apple and ginger pomace dried by HAD and by MWD (HAD_62w: unground sample dried by HAD at 62 °C) and raw material (RM1 and RM2). Different letters mean statistically significant differences (p < 0.05).
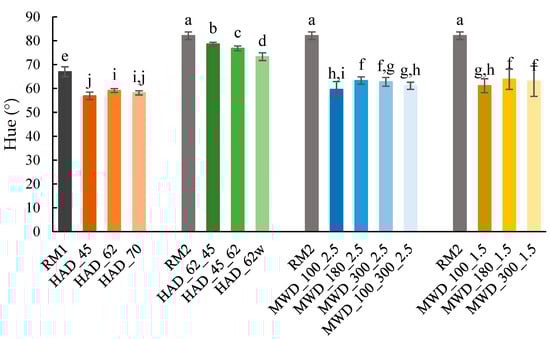
Figure 5.
Hue (°) values of apple and ginger pomace dried by HAD and by MWD (HAD_62w: unground sample dried by HAD at 62 °C) and raw material (RM1 and RM2). Different letters mean statistically significant differences (p < 0.05).
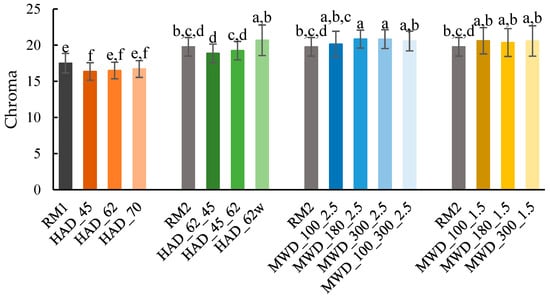
Figure 6.
Chroma values of apple and ginger pomace dried by HAD and by MWD (HAD_62w: unground sample dried by HAD at 62 °C) and raw material (RM1 and RM2). Different letters mean statistically significant differences (p < 0.05).
L* values of HAD samples from the second raw material (RM2) were higher (p < 0.05) than the L* values of MWD samples from the same raw material (Figure 4), which showed they were lighter. L* values after MWD were lower (p < 0.05) than after the HAD stepwise approach and the L* value of the whole sample dried at 62 °C (HAD_62w). However, the HAD samples at 45–70 °C presented lower (p < 0.05) L* values than the other HAD samples. This may be because the respective raw material, RM1, also presented a lower (p < 0.05) L* value than RM2. This difference observed between raw materials may be explained by the high heterogeneity of the apple and ginger pomace. So, HAD samples from RM2 were also expected to be lighter. In general, these HAD samples presented similar L* values to MWD, despite RM2 being lighter than RM1. Overall, L* values decreased after MWD, in comparison with the raw material (Figure 4).
Hue values of the raw materials were higher (p < 0.05) than all respective dried samples. In agreement with the L* results, the HAD dried samples from RM2 (steps and whole sample) also presented higher (p < 0.05) hue values than the MWD samples (Figure 5). There was a similar behavior in h in comparison to L* for HAD at 45–70 °C, and also for these experiments compared to MWD.
Except for the Chroma value of HAD_62w, the C values of the MWD samples were higher (p < 0.05) than those of HAD samples from the same raw material (RM2) (Figure 6). Nevertheless, the low C values (C < 21) obtained for all MWD and HAD experiments mean that C is not a good parameter to characterize the color of dried apple and ginger pomace.
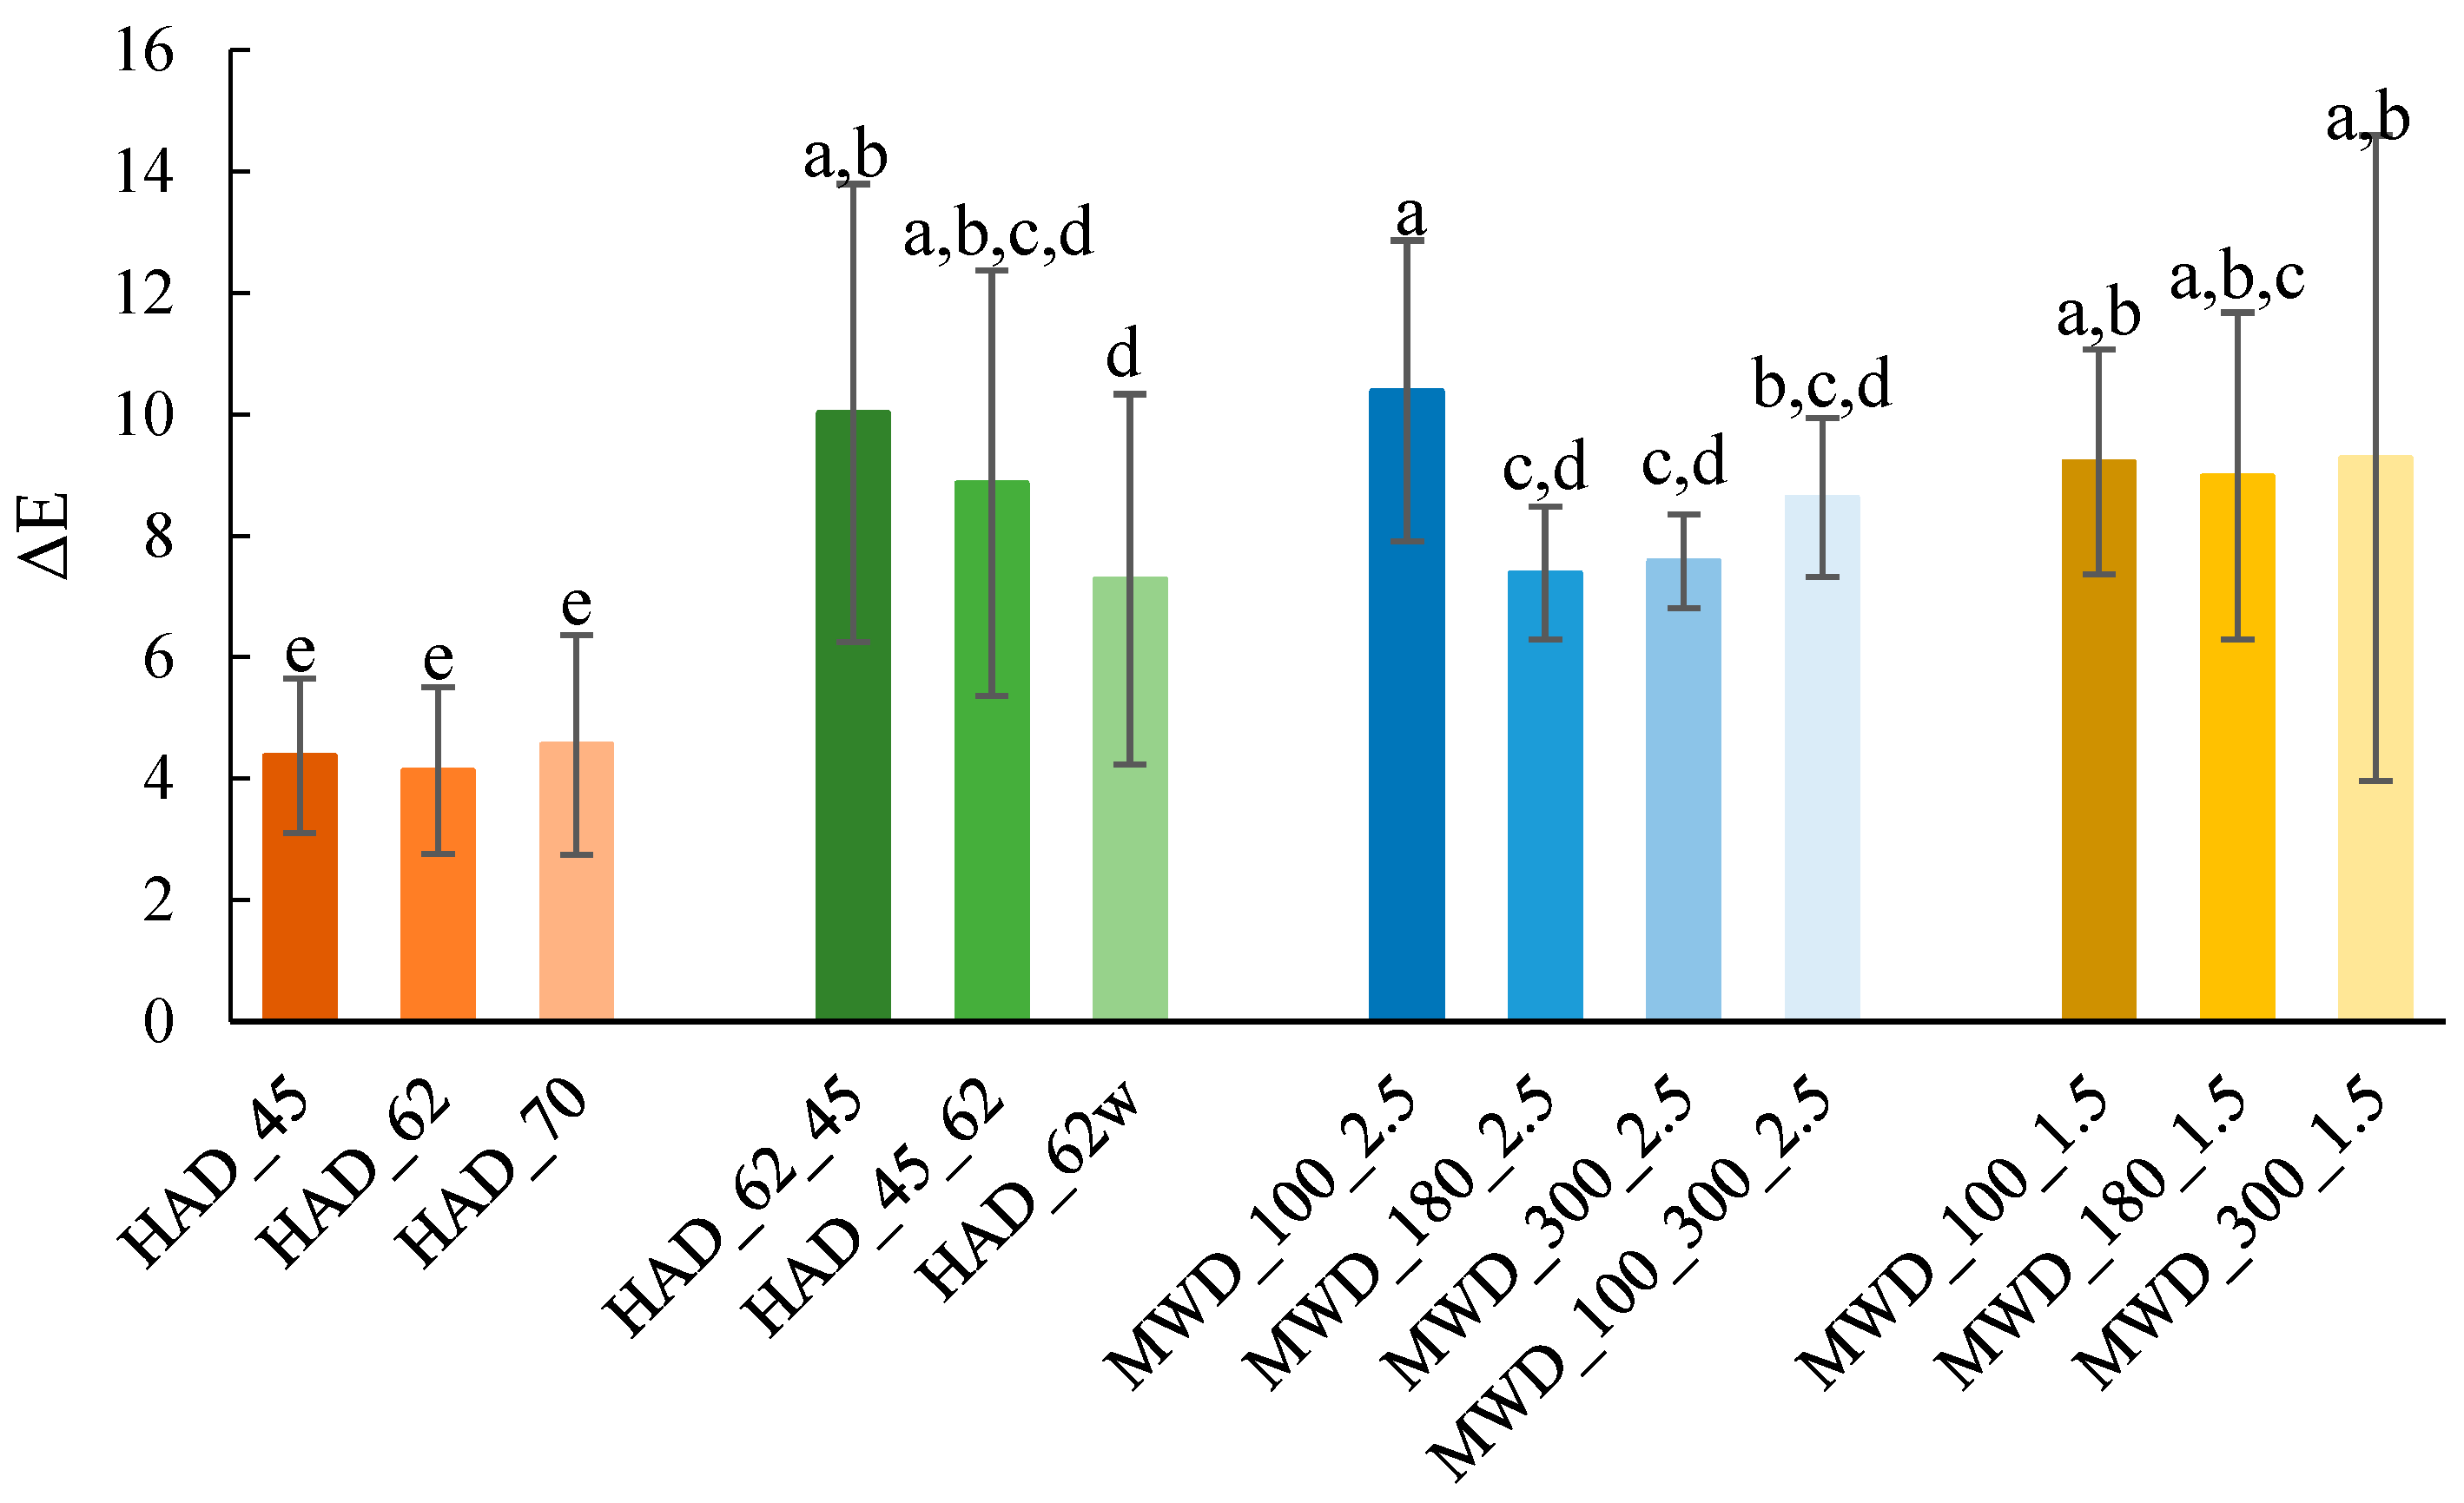
Figure 7 shows values of the color difference, ΔE, for all drying experiments calculated using their respective raw material color parameters values. The smallest ΔE values were observed for HAD at 45, 62, and 70 °C, confirming that HAD (at constant temperature) preserves the color of apple and ginger pomace better than MWD. The use of the steps increased ΔE. Xu et al. [27] concluded that stepwise drying at 60 °C followed by at 45 °C resulted in a lower color difference (ΔE) and better sensory quality than air drying at a constant temperature of 50 °C when drying paddy rice using hot air. Chua et al. [30] also found that the product color was improved by using a step change in drying air temperature. HAD of the whole sample resulted in a higher ΔE than HAD of a ground sample. The lowest power used in MWD, 100 W for a slab thickness of 2.5 mm, produced the highest ΔE value, but it was not significantly different from ΔE values of all MWD experiments with 1.5 mm thick slabs. All these observations might be explained by the high heterogeneity of the raw material, as mentioned previously for the L* parameter. Nevertheless, except for HAD at 45, 62, and 70 °C, no substantial differences in ΔE were observed between HAD and MWD (Figure 7). Due to the severity of the burning, the color of the samples after MWD at 450 W was not assessed.
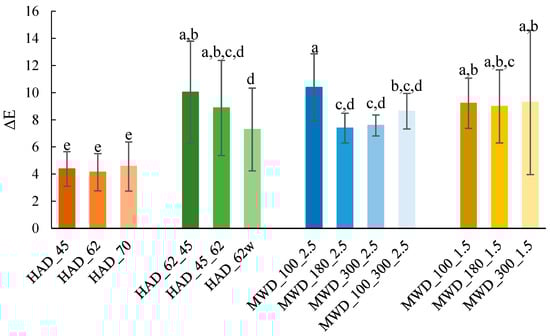
Figure 7.
Color difference of the apple and ginger pomace dried by HAD and by MWD (HAD_62w: unground sample dried by HAD at 62 °C). Different letters mean statistically significant differences (p < 0.05).
3.7. Total Phenolic Content (TPC) and Antioxidant Activity (AA)
The TPC of the defrosted apple and ginger pomace was 8.22 ± 0.97 mg GAE/g pomace DW. The ABTS was 4.99 ± 0.31 mg TE/g pomace DW, the DPPH was 2.15 ± 0.21 mg TE/g pomace DW, and the ORAC was 17.39 ± 2.43 mg TE/g pomace DW. The values for TPC and DPPH were higher than those found in the literature for apple pomace (5.78 ± 0.08 mg GAE/g pomace DW and 2.68 ± 0.28 mg TE/ g extract DW, respectively [39]), which may reflect the contribution of the ginger in the pomace. Nevertheless, Vlad [40] found that freeze-dried apple pomace presented a TPC of 5.32 ± 0.06 mg GAE/g DM. For ORAC, the value was within the range of the values reported by Li et al. [41]. However, these values varied substantially with the batch of raw material used (RM1 and RM2) and, consequently, the values for the dried pomace. ABTS and DPPH values were higher (p < 0.05) for the MWD sample (ground pomace, 1.5 mm thickness) than for the HAD sample (pomace not ground, 2.5 mm thickness). For TPC and ORAC, the differences were not statistically different (p > 0.05) (Table 6). Baht et al. [42] also found that TPC and DPPH values were significantly higher in apple pomace dried by vacuum-assisted microwave drying at 50 °C than by air drying at 60 °C. Chen et al. [43] studied the AA of polysaccharides extracted from ginger pomace, but no studies were found on the drying of this pomace or of mixed apple and ginger pomace. Gonelimali et al. [44] found that apple pomace dried in a conventional air oven at 60 °C presented a higher AA than using a vacuum dryer.
Table 6.
Total phenolic content and antioxidant activity (ABTS, DPPH, ORAC) of the dried apple and ginger pomace.
ABTS and DPPH values were higher (p < 0.05) for the MWD sample than for the HAD sample. For TPC and ORAC, the differences were not statistically different (p > 0.05).
The TPC and AA results of the present study suggest that MWD is a better drying technology than HAD for preserving the phenolic compounds and the antioxidant activity of apple and ginger pomace, which is supported by the results on the drying times (Section 3.4).
4. Conclusions
Microwave drying (MWD) was significantly faster than hot-air drying (HAD), with drying times predicted by the Midilli et al. model for MWD being 86% to 91% shorter than those predicted by the Lewis model for HAD. In terms of energy consumption, MWD was more efficient than HAD. Additionally, grinding the pomace before HAD reduced energy consumption by 25% compared to using whole pomace at 62 °C, highlighting the advantages of an increased surface area for heat and mass transfer. The Lewis, Henderson and Pabis, and Crank models were suitable for describing the HAD data of apple and ginger pomace, while the Midilli et al. model was suitable for describing the MWD data. These models are useful tools for predicting drying times and estimating energy consumption.
All drying processes induced color changes in the apple and ginger pomace. The total phenolic content and the antioxidant activity of the apple and ginger pomace were better preserved by MWD at 180 W than HAD at 62 °C, particularly for unground samples.
Despite the initial equipment cost, MWD proves to be more promising than HAD for drying apple and ginger pomace due to its low energy consumption, short drying time, and quality preservation. It also reduces the environmental impact of the drying process. Future research on hybrid and MW-assisted drying processes is recommended, although industrial implementation may present challenges.
Author Contributions
Conceptualization, A.M.M.B.M.; methodology, B.Z.R.A. and V.F.R.M.; software, B.Z.R.A. and V.F.R.M.; validation, A.M.M.B.M.; formal analysis, A.M.M.B.M.; investigation, B.Z.R.A. and V.F.R.M.; resources, M.E.P.; data curation, B.Z.R.A. and V.F.R.M.; writing—original draft preparation, B.Z.R.A. and A.M.M.B.M.; writing—review and editing, A.M.M.B.M. and R.M.S.C.M.; visualization, A.M.M.B.M. and B.Z.R.A.; supervision, A.M.M.B.M.; project administration, M.E.P.; funding acquisition, A.M.M.B.M. and M.E.P. All authors have read and agreed to the published version of the manuscript.
Funding
This work was supported by National Funds from FCT—Fundação para a Ciência e a Tecnologia through Project UIDB/50016/2020. Beatriz Araujo thanks the European Master of Science in Sustainable Food Systems Engineering, Technology and Business (BiFTec-FOOD4S) of the European Commission as part of the Erasmus+ Program (Reference 619864-EPP-1-2020-1-BE-EPPKA1-JMD-MOB). Financial support for the author V.F.R. Martins was provided by the Ph.D. research grant, reference UI/BD/152825/2022, granted by the Portuguese government through FCT.
Data Availability Statement
The original contributions presented in the study are included in the article, further inquiries can be directed to the corresponding author.
Acknowledgments
All authors acknowledge Frubaça for the generous supply of the apple and ginger pomace.
Conflicts of Interest
The authors declare no conflicts of interest. The funders had no role in the design of the study; in the collection, analyses, or interpretation of data; in the writing of the manuscript; or in the decision to publish the results.
References
- Scherhaufer, S.; Moates, G.; Hartikainen, H.; Waldron, K.; Obersteiner, G. Environmental impacts of food waste in Europe. Waste Manag. 2018, 77, 98–113. [Google Scholar] [CrossRef] [PubMed]
- Bhushan, S.; Kalia, K.; Sharma, M.; Singh, B.; Ahuja, P.S. Processing of apple pomace for bioactive molecules. Crit. Rev. Biotechnol. 2008, 28, 285–296. [Google Scholar] [CrossRef] [PubMed]
- Gumul, D.; Kruczek, M.; Ivanišová, E.; Słupski, J.; Kowalski, S. Apple pomace as an ingredient enriching wheat pasta with health-promoting compounds. Foods 2023, 12, 804. [Google Scholar] [CrossRef] [PubMed]
- Issar, K.; Sharma, P.C.; Gupta, A. Utilization of apple pomace in the preparation of fiber-enriched acidophilus yoghurt. J. Food Proc. Preserv. 2017, 41, e13098. [Google Scholar] [CrossRef]
- Jovanović, M.; Petrović, M.; Miočinović, J.; Zlatanović, S.; Laličić Petronijević, J.; Mitić-Ćulafić, D.; Gorjanović, S. Bioactivity and sensory properties of probiotic yogurt fortified with apple pomace flour. Foods 2020, 9, 763. [Google Scholar] [CrossRef]
- Wang, C.; Song, R.; Wei, S.; Wang, W.; Li, F.; Tang, X.; Li, N. Modification of insoluble dietary fiber from ginger residue through enzymatic treatments to improve its bioactive properties. LWT 2020, 125, 109220. [Google Scholar] [CrossRef]
- Gulzar, R.; Afzaal, M.; Saeed, F.; Samar, N.; Shahbaz, A.; Ateeq, H.; Farooq, M.U.; Akram, N.; Asghar, A.; Rasheed, A.; et al. Bio valorization and industrial applications of ginger waste: A review. Int. J. Food Prop. 2023, 26, 2772–2780. [Google Scholar] [CrossRef]
- Lyu, F.; Luiz, S.F.; Azeredo, D.R.P.; Cruz, A.G.; Ajlouni, S.; Ranadheera, C.S. Apple pomace as a functional and healthy ingredient in food products: A review. Processes 2020, 8, 319. [Google Scholar] [CrossRef]
- Kowalski, S.J.; Szadzińska, J.J.C.E. Convective-intermittent drying of cherries preceded by ultrasonic assisted osmotic dehydration. Chem. Eng. Proc. 2014, 82, 65–70. [Google Scholar] [CrossRef]
- Feng, H.; Yin, Y.; Tang, J. Microwave drying of food and agricultural materials: Basics and heat and mass transfer modelling. Food Eng. Rev. 2012, 4, 89–106. [Google Scholar] [CrossRef]
- Lewis, W.K. The Rate of Drying of Solid Materials. J. Ind. Eng. Chem. 1921, 13, 427–432. [Google Scholar] [CrossRef]
- Henderson, S.M.; Pabis, S. Grain drying theory. II. Temperature effects on drying coefficients. J. Agric. Eng. Res. 1961, 6, 169–174. [Google Scholar]
- Crank, J. The Mathematics of Diffusion, 2nd ed.; Clarendon Press: Oxford, UK, 1975; p. 414. [Google Scholar]
- Midilli, A.; Kucuk, H.; Yapar, Z. A new model for single-layer drying. Dry. Technol. 2002, 20, 1503–1513. [Google Scholar] [CrossRef]
- A.O.A.C. Official Methods of Analysis, 18th ed.; Method A.O.A.C. 930.15; Association of the Official Analytical Chemists: Arlington, VA, USA, 2005. [Google Scholar]
- Slack, P.T. Analytical Methods Manual, 3rd ed.; Leatherhead Food R.A.: London, UK, 1997; Issue 2. [Google Scholar]
- ISO 1871:2009; Food and Feed Products—General Guidelines for the Determination of Nitrogen by the Kjeldahl Method. International Organization for Standardization: Geneva, Switzerland, 2009.
- A.O.A.C. Official Methods of Analysis; Method A.O.A.C. 991.43; Association of the Official Analytical Chemists: Arlington, VA, USA, 2003. [Google Scholar]
- A.O.A.C. Official Methods of Analysis; Method A.O.A.C. 985.29; Association of the Official Analytical Chemists: Arlington, VA, USA, 2000. [Google Scholar]
- Akgun, N.A.; Doymaz, I. Modeling of olive cake thin-layer drying process. J. Food Eng. 2005, 68, 455–461. [Google Scholar] [CrossRef]
- Popescu, M.; Iancu, P.; Plesu, V.; Bildea, C.S.; Manolache, F.A. Mathematical Modeling of Thin-Layer Drying Kinetics of Tomato Peels: Influence of Drying Temperature on the Energy Requirements and Extracts Quality. Foods 2023, 12, 3883. [Google Scholar] [CrossRef]
- Motevali, A.; Minaei, S.; Khoshtagaza, M.H. Evaluation of energy consumption in different drying methods. Energy Convers. Manag. 2011, 52, 1192–1199. [Google Scholar] [CrossRef]
- Commission Internationale de L’Eclairage, C.I.E. Recommendations on Uniform Color Spaces, Color-Difference Equations, Psychometric Color Terms; Supplement No. 2 to C.I.E. Publication No. 15, (E.-1.3 1) 1971; C.I.E.: Paris, France, 1978; TC 1. [Google Scholar]
- Martins, V.F.R.; Ribeiro, T.B.; Lopes, A.I.; Pintado, M.E.; Morais, R.M.S.C.; Morais, A.M.B. Comparison among Different Green Extraction Methods of Polyphenolic Compounds from Exhausted Olive Oil Pomace and the Bioactivity of the Extracts. Molecules 2024, 29, 1935. [Google Scholar] [CrossRef]
- Antonic, B.; Jancikova, S.; Dordevic, D.; Tremlova, B. Apple pomace as food fortification ingredient: A systematic review and meta-analysis. J. Food Sci. 2020, 85, 2977–2985. [Google Scholar] [CrossRef]
- Krokida, M.K.; Foundoukidis, E.; Maroulis, Z. Drying constant: Literature data compilation for foodstuffs. J. Food Eng. 2004, 61, 321–330. [Google Scholar] [CrossRef]
- Xu, X.; Zhao, T.; Ma, J.; Song, Q.; Wei, Q.; Sun, W. Application of two-stage variable temperature drying in hot air-drying of paddy rice. Foods 2022, 11, 888. [Google Scholar] [CrossRef]
- Mujumdar, A.S. Handbook of Industrial Drying, 3rd ed.; CRC Press: Boca Raton, FL, USA, 2006. [Google Scholar]
- Mayor, L.; Sereno, A.M. Modeling shrinkage during convective drying of food materials: A review. J. Food Eng. 2004, 61, 373–386. [Google Scholar] [CrossRef]
- Chua, K.J.; Hawlader, M.N.A.; Chou, S.K.; Ho, J.C. On the study of time-varying temperature drying—Effect on drying kinetics and product quality. Dry. Technol. 2002, 20, 1559–1577. [Google Scholar] [CrossRef]
- Tulej, W.; Głowacki, S. Modeling of the Drying Process of Apple Pomace. Appl. Sci. 2022, 12, 1434. [Google Scholar] [CrossRef]
- Kara, C.; Doymaz, İ. Effective moisture diffusivity determination and mathematical modelling of drying curves of apple pomace. Heat Mass Transf. 2015, 51, 983–989. [Google Scholar] [CrossRef]
- Majumder, P.; Sinha, A.; Mishra, L.; Gupta, R. Prediction of moisture ratios (MRs) during fluidized bed drying of ginger (Zingiber officinale) cubes by using mathematical modeling and experimental validation. In Advances in Mechanical Engineering, Proceedings of the ICRIDME 2018, Shillong, India, 8–10 November 2018; Springer: Singapore, 2020; pp. 729–740. [Google Scholar]
- Wang, Z.; Sun, J.; Liao, X.; Chen, F.; Zhao, G.; Wu, J.; Hu, X. Mathematical modelling on hot air drying of thin layer apple pomace. Food Res. Int. 2007, 40, 39–46. [Google Scholar] [CrossRef]
- Akpinar, E.K.; Toraman, S. Estimation of the moisture diffusivity and activation energy in thin layer drying of ginger slices. Int. J. Nutr. Food Eng. 2013, 7, 415–418. [Google Scholar]
- Horuz, E.; Bozkurt, H.; Karataş, H.; Maskan, M. Simultaneous application of microwave energy and hot air to whole drying process of apple slices: Drying kinetics, modeling, temperature profile and energy aspect. Heat Mass Transf. 2018, 54, 425–436. [Google Scholar] [CrossRef]
- Hazervazifeh, A.; Nikbakht, A.M.; Nazari, S. Industrial Microwave Dryer an Effective Design to Reduce Non-Uniform Heating. Eng. Agric. Environ. Food 2021, 14, 110–121. [Google Scholar]
- Barbosa-Cánovas, G.V.; Fontana, A.J., Jr.; Schmidt, S.J.; Labuza, T.P. Water Activity in Foods: Fundamentals and Applications; John Wiley & Sons, Inc.: Hoboken, NJ, USA; Institute of Food Technologists: Chicago, IL, USA, 2020; p. 640. [Google Scholar]
- Rana, S.; Gupta, S.; Rana, A.; Bhushan, S. Functional properties, phenolic constituents and antioxidant potential of industrial apple pomace for utilization as active food ingredient. Food Sci. Hum. Wellness 2015, 4, 180–187. [Google Scholar] [CrossRef]
- Vlad, C.C.; Păcularu-Burada, B.; Vasile, A.M.; Milea, Ș.A.; Bahrim, G.E.; Râpeanu, G.; Stănciuc, N. Upgrading the functional potential of apple pomace in value-added ingredients with probiotics. Antioxidants 2022, 11, 2028. [Google Scholar] [CrossRef]
- Li, W.; Yang, R.; Ying, D.; Yu, J.; Sanguansri, L.; Augustin, M.A. Analysis of polyphenols in apple pomace: A comparative study of different extraction and hydrolysis procedures. Ind. Crops Prod. 2020, 147, 112250. [Google Scholar] [CrossRef]
- Bhat, I.M.; Wani, S.M.; Mir, S.A.; Naseem, Z. Effect of microwave-assisted vacuum and hot air oven drying methods on quality characteristics of apple pomace powder. Food Prod. Process. Nutr. 2023, 5, 26. [Google Scholar] [CrossRef]
- Chen, G.T.; Yuan, B.; Wang, H.X.; Qi, G.H.; Cheng, S.J. Characterization and antioxidant activity of polysaccharides obtained from ginger pomace using two different extraction processes. Int. J. Biol. Macromol. 2019, 139, 801–809. [Google Scholar] [CrossRef] [PubMed]
- Gonelimali, F.D.; Szabó-Nótin, B.; Máté, M. Optimal drying conditions for valorization of industrial apple pomace: Potential source of food bioactive compounds. Prog. Agric. Eng. Sci. 2021, 17, 69–75. [Google Scholar] [CrossRef]

Disclaimer/Publisher’s Note: The statements, opinions and data contained in all publications are solely those of the individual author(s) and contributor(s) and not of MDPI and/or the editor(s). MDPI and/or the editor(s) disclaim responsibility for any injury to people or property resulting from any ideas, methods, instructions or products referred to in the content. |
© 2024 by the authors. Licensee MDPI, Basel, Switzerland. This article is an open access article distributed under the terms and conditions of the Creative Commons Attribution (CC BY) license (https://creativecommons.org/licenses/by/4.0/).