Article

Multi-Criteria Optimization Conditions for the Recovery of Bioactive Compounds from Levisticum officinale WDJ Koch Roots Using Green and Sustainable Ultrasound-Assisted Extraction

1
Future Production AS, Svanedamsveien 10, 4621 Kristiansand, Norway
2
Department of Machinery Exploitation and Management of Production Processes, University of Life Sciences in Lublin, Akademicka 13, 20-950 Lublin, Poland
3
Department of Landscape Management, Faculty of Agriculture and Technology, University of South Bohemia in České Budějovice, 370 05 České Budějovice, Czech Republic
4
Department of Plant Production, Faculty of Agriculture and Technology, University of South Bohemia in České Budějovice, 370 05 České Budějovice, Czech Republic
*
Author to whom correspondence should be addressed.
Processes 2024, 12(2), 275; https://doi.org/10.3390/pr12020275
Submission received: 23 December 2023 / Revised: 23 January 2024 / Accepted: 25 January 2024 / Published: 26 January 2024
(This article belongs to the Special Issue Current Trends in Food and Food Byproducts Processing)

Abstract

:
Given that ultrasound-assisted aqueous extraction is gaining importance within “green technology” and to increase the efficiency of extracting bioactive compounds from Levisticum officinale root waste, optimization of its parameters was undertaken. Multi-objective (multi-criteria) optimization can be an extremely promising tool not only for designing and analyzing the extraction process, but also for making process-control decisions. Therefore, the main objective of this study was to develop and optimize an environmentally friendly ultrasound-assisted extraction methodology for the aqueous extraction of bioactive compounds from the roots of Levisticum officinale, which are considered a by-product. The focus was on determining the optimal extraction conditions of the independent variables, such as solid–liquid ratio, extraction time and ultrasound power, so that the optimized extracts present the highest bioactive potential expressed in terms of levels of phenolic compounds, flavonoids, sugars and antioxidant potential. Based on the Pareto-optimal solution sets, it was found that to maximize the criteria, aqueous extraction should be carried out at a Levisticum officinale biomass/solvent ratio of 0.0643 g/mL for a time of 8.1429 to 9.0000 min, with ultrasound assistance of 162.8571 to 201.4286 W. Among the compromise solutions, the so-called “best efficient solution” was indicated as the solution for which the Euclidean distance from the ideal point of Utopia was the smallest (among all analyzed points of the collection), which had coordinates x1comp = 0.0750 g/mL, x2comp = 9.0000 min and x3comp = 214.2857 W. The results obtained will provide a valuable tool to assist in the decision-making process of controlling such an extraction process.

1. Introduction

Extraction is the process of deriving the biologically active compounds from a variety of materials, including plant matrices. A number of different methods in line with the principles of ‘Green chemistry’ are used for extraction, including maceration, infusion, microwave-assisted extraction (MAE) [1], ultrasound-assisted extraction (UAE) [2], supercritical carbon dioxide [3], Soxhlet extraction, ultrahigh pressure extraction [4], enzyme-assisted extraction (EAE) and infrared radiation (IR) [5]. The process parameters, including solvent type, temperature, time and material/solvent ratio determine the efficiency of the extraction procedure. Nowadays, the observed development of extraction techniques is mainly related to minimizing the cost of the process while maximizing the efficiency of the extraction of biologically active compounds (e.g., maximum antioxidant potential or antimicrobial or biostimulatory potential) [6]. However, in terms of increasing environmental concerns, water is indicated as a safe solvent that is widely used to produce plant extracts [7].
Among the extraction methods, ultrasound-assisted technology (UAE) is currently used for the extraction of bioactive phytochemicals from various plant materials and by-products [8]. UAE additionally allows an efficient and uncomplicated transfer of the designed method from the laboratory to the industrial scale [9]. However, the efficiency of many compound’s extraction in this method is determined by a number of process parameters including, but not limited to, the temperature, time, power and frequency of the ultrasound [9,10,11,12]. Studies by He et al. [13] and Rocha et al. [8] even indicate that, compared to conventional extraction, the use of ultrasound leads to improved extraction efficiency of bioactive compounds, including phenolic compounds and anthocyanins [14]. Considering that phenolic compounds have a wide range of biological activities and applications (including agrochemicals), the development and prototyping of efficient methods for their extraction from natural sources is currently of invaluable importance. However, depending on the potential applications of the extracts, it is still challenging to design the process appropriately, despite the efforts made in this direction by many researchers [12,15,16]. According to Batinić et al. [17], it is extremely challenging to develop a single, general and efficient protocol for the extraction of active compounds, including phenolic compounds, from different plant materials. Therefore, the extraction process should be optimized for each plant matrix [17]. Mathematical and statistical tools are, therefore, used to analyze not only the influence of process variables, but also to optimize the experimental conditions of the process [14,18]. Extraction optimization is carried out using a number of methods, including empirical, statistical and combined methods. It should be emphasized that an appropriate optimization procedure and its results are essential for the future industrial application of the process and the commercialization of the manufactured product [19].
Among the aromatic plants used by the food, cosmetic and pharmaceutical industries is Levisticum officinale WDJ Koch, commonly known as lovage [20]. Many studies indicate the medicinal potential of this plant [21]. Recent studies also indicate the agropotential of this plant [22,23,24]. Currently, the leaves of Levisticum officinale are used primarily as a spice, and as a result, the roots of this plant seem to go unnoticed, which means that they are often treated as a by-product [25]. The results of several research endeavors indicate that water extract form lovage roots contains a broad and diverse range of bioactive compounds and secondary metabolites (saponins, flavonoids, phenolic acids, steroids, carbohydrates, organic acids) [22,25,26,27,28]. However, the active phytochemicals of plants are mainly located inside the cells, and an efficient extraction method is required to isolate them. Ultrasound-assisted extraction appears to be an excellent tool for this objective [29]. Additionally, there is interest in the possibility of using organic aqueous extraction to increase the efficiency of extracting bioactive compounds from lovage roots, which can be transformed from an agri-food by-product into valuable intermediates or products in various industries [25]. As many plant extracts have therapeutic or antimicrobial effects, it seems forward thinking to approach their unconventional use in, among other industries, agriculture. The reason is the fact that their action may have biostimulating potential for crop plants. This is particularly relevant in the current agricultural situation, where excessive use of fertilizers is associated with a range of environmental problems in different ecosystems [30]. Thus, improving crop production, which is a major agronomic challenge, while reducing the use of chemicals, will be possible if new agronomic methods are incorporated, including the use of natural biostimulants, which are currently considered among the best products, targeting action to increase plant protection and growth, while improving yield quantity and quality [31,32].
Given that UAE aqueous extraction is gaining importance within ‘green technology’ and to increase the efficiency of extracting bioactive compounds from Levisticum officinale root waste, optimization of its parameters was undertaken. Multi-objective (multi-criteria) optimization can be an extremely promising tool not only for designing and analyzing the extraction process, but also for making process-control decisions. Therefore, the main objective of this study was to develop and optimize an environmentally friendly UAE-based methodology for the aqueous extraction of bioactive compounds from the roots of Levisticum officinale, which are considered a by-product. The focus was on determining the optimal extraction conditions of the independent variables, such as the solid–liquid ratio, extraction time and ultrasound power, so that the optimized extracts present the highest bioactive potential expressed in terms of levels of phenolic compounds, flavonoids, sugars and antioxidant potential.

2. Materials and Methods

2.1. Plant Material—Levisticum Officinale

The dried roots of the Levisticum officinale (sourced from Runo Polska, PL-EKO 07 EU Organic Farming) were ground to a powder (fraction size of 500 μm). The ground powder was stored at 4 °C in airtight bags until further use.

2.2. Ultrasound-Assisted Extraction (UAE) Procedure

The extraction was performed using an Ultron U-509 ultrasonic system with an operating frequency set at the 20 kHz. The lovage-root biomass was mixed with ultrapure deionized water (extraction solvent) in a 150 mL flat-bottomed amber glass bottle with the appropriate extractant:solid ratio. The glass bottle was immersed in an ultrasonic bath in a fixed position to ensure that the acoustic field in the bottle was as regular as possible. During extraction, the temperature was controlled at a constant 60 °C by circulating water from a thermostated water bath. UAE extraction parameters were extraction time (3, 6 and 9 min), sample/solvent ratio (w/v) (2.5 g/100 mL (0.025 g/mL), 5 g/100 mL (0.050 g/mL), 7.5 g/100 mL (0.075 g/mL) and ultrasound power (60, 120 and 240 W).
All extractions were carried out in triplicate. Extractions were followed by centrifugation (9500 rpm, 20 min) and filtration (Whatman® No. 1 filter paper). The supernatant was collected and stored at 4 °C in sealed dark glass bottles until further use and analysis.

2.3. Quantification of Bioactive Compounds in the Produced Extracts

The total phenolic content (TPC) was determined in the samples obtained using ultrasound-assisted extraction. The quantification of the pool of phenolic compounds was performed using a modified spectrophotometric method proposed by Mugwagwa and Chimphango [33] with anhydrous sodium carbonate and Follin-Ciocalteau reagents. A standard curve was prepared and used (gallic acid as a standard). TPC was expressed as mg gallic acid equivalent/g extract.
The total flavonoid content (TFC) in the extracts was evaluated using the spectrophotometric method (with the AlCl3 reagent) presented by Iqbal et al. [34]. The concentration of TFC in the samples was determined as catechin equivalent (μmol/L) from a standard curve for this compound.
The total antioxidant activity (TAA) was also analyzed in water extracts from Levisticum officinale using the spectrophotometric method. The antioxidant activity of DPPH was assessed based on the method of Lee et al. [2]. A methanol solution of DPPH (2,2-difenylo-1-pikrylohydrazyl) was used. The scavenging activity was calculated according to [(Abscontrol − Abssample)/Abscontrol)] × 100.
The total reducing sugar content (RSC) was determined using a spectrophotometric method using 3,5-dinitrosalicylic acid (DNSA). The measurement was carried out based on the method of Krivorotov and Sereikaite [35]. The level of reducing sugars in the extracts was determined using a standard curve for D-glucose, and the results were expressed as g of D-glucose equivalent (GE) per L of extract.

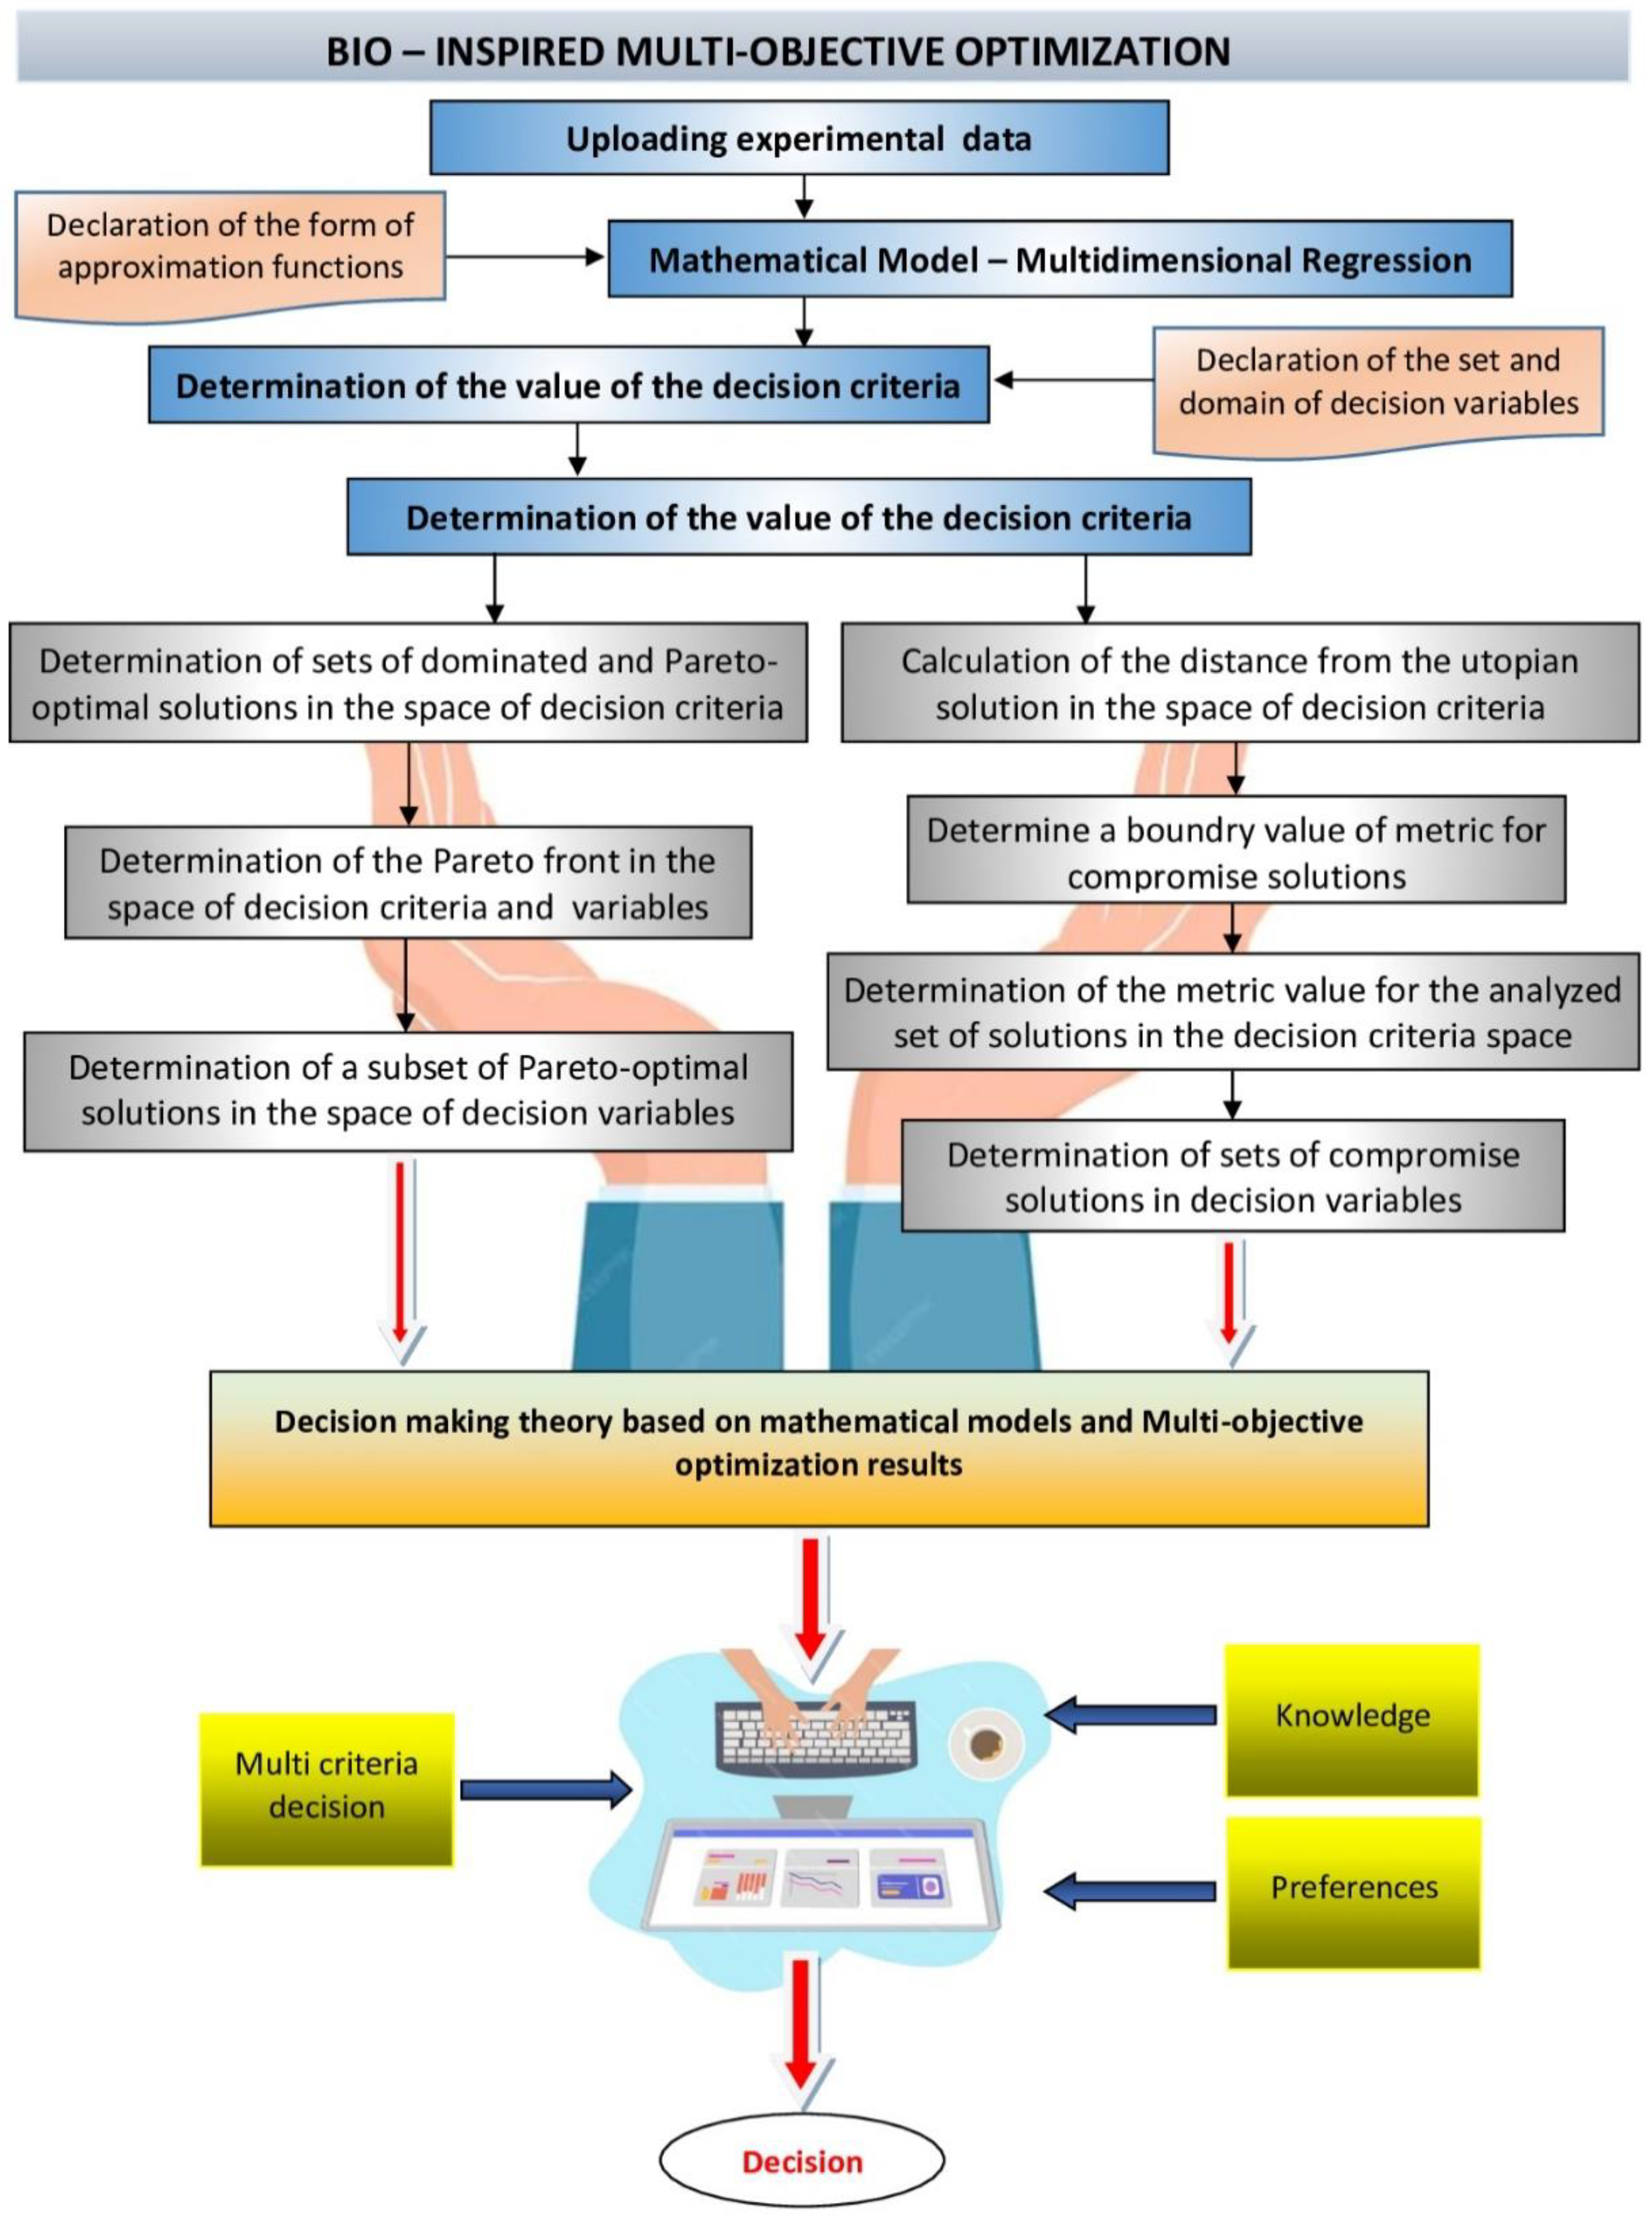
2.4. Mathematical Model

For the majority of engineering processes, the relationships between the system’s responses and the independent variables are unknown. Therefore, it is necessary to identify the correct approximation to represent these responses as functions of these variables. For this purpose, polynomial functions are used [36]. Multivariate regression models (generated in Matlab R2021a) were used to perform ultrasound-assisted extraction optimization. The models were created, based on experimental data (content of bioactive compounds in extracts from Levisticum officinale—decision criteria). The sample/solvent ratio (g/mL) (x1), time of extraction (s) (x2) and ultrasound power (W) (x3) were selected as process parameters (in the optimization procedure—decision variables).
The multivariable polynomial, describing the analyzed decision criteria as a function of the decision variables, was defined as (1):
y r e g x 1 ,   x 2 ,   x 3 = a 0 + a 1 x 1 + a 2 x 2 + a 3 x 3 + a 4 x 1 x 2 + a 5 x 1 x 3 + a 6 x 2 x 3 + a 7 x 1 2 + a 8 x 2 2 + a 9 x 3 2
The Fisher test value (F-value), p-value, the coefficient of determination (R2), the adjusted determination coefficient (Adj R2), and the mean squared prediction error (MSE) were used to evaluate the model accuracy [37].
R2 (2) and Adj R2 (3) were expressed as follows:
R 2 = i = 1 n w i ( y ^ i y ¯ ) 2 i = 1 n w i ( y i y ¯ ) 2 = 1 i = 1 n w i ( y i y i ) ^ 2 i = 1 n w i ( y i y ¯ ) 2
A d j   R 2 = 1 i = 1 n w i ( y i y i ) ^ 2   ( n 1 ) i = 1 n w i ( y i y ¯ ) 2 ( v )
The mean squared prediction error (MSE) is the index of the mean square deviation between the experimental data and the values, resulting from the adopted model (4):
M S E = i = 1 n w i ( y i y i ) ^ 2 v

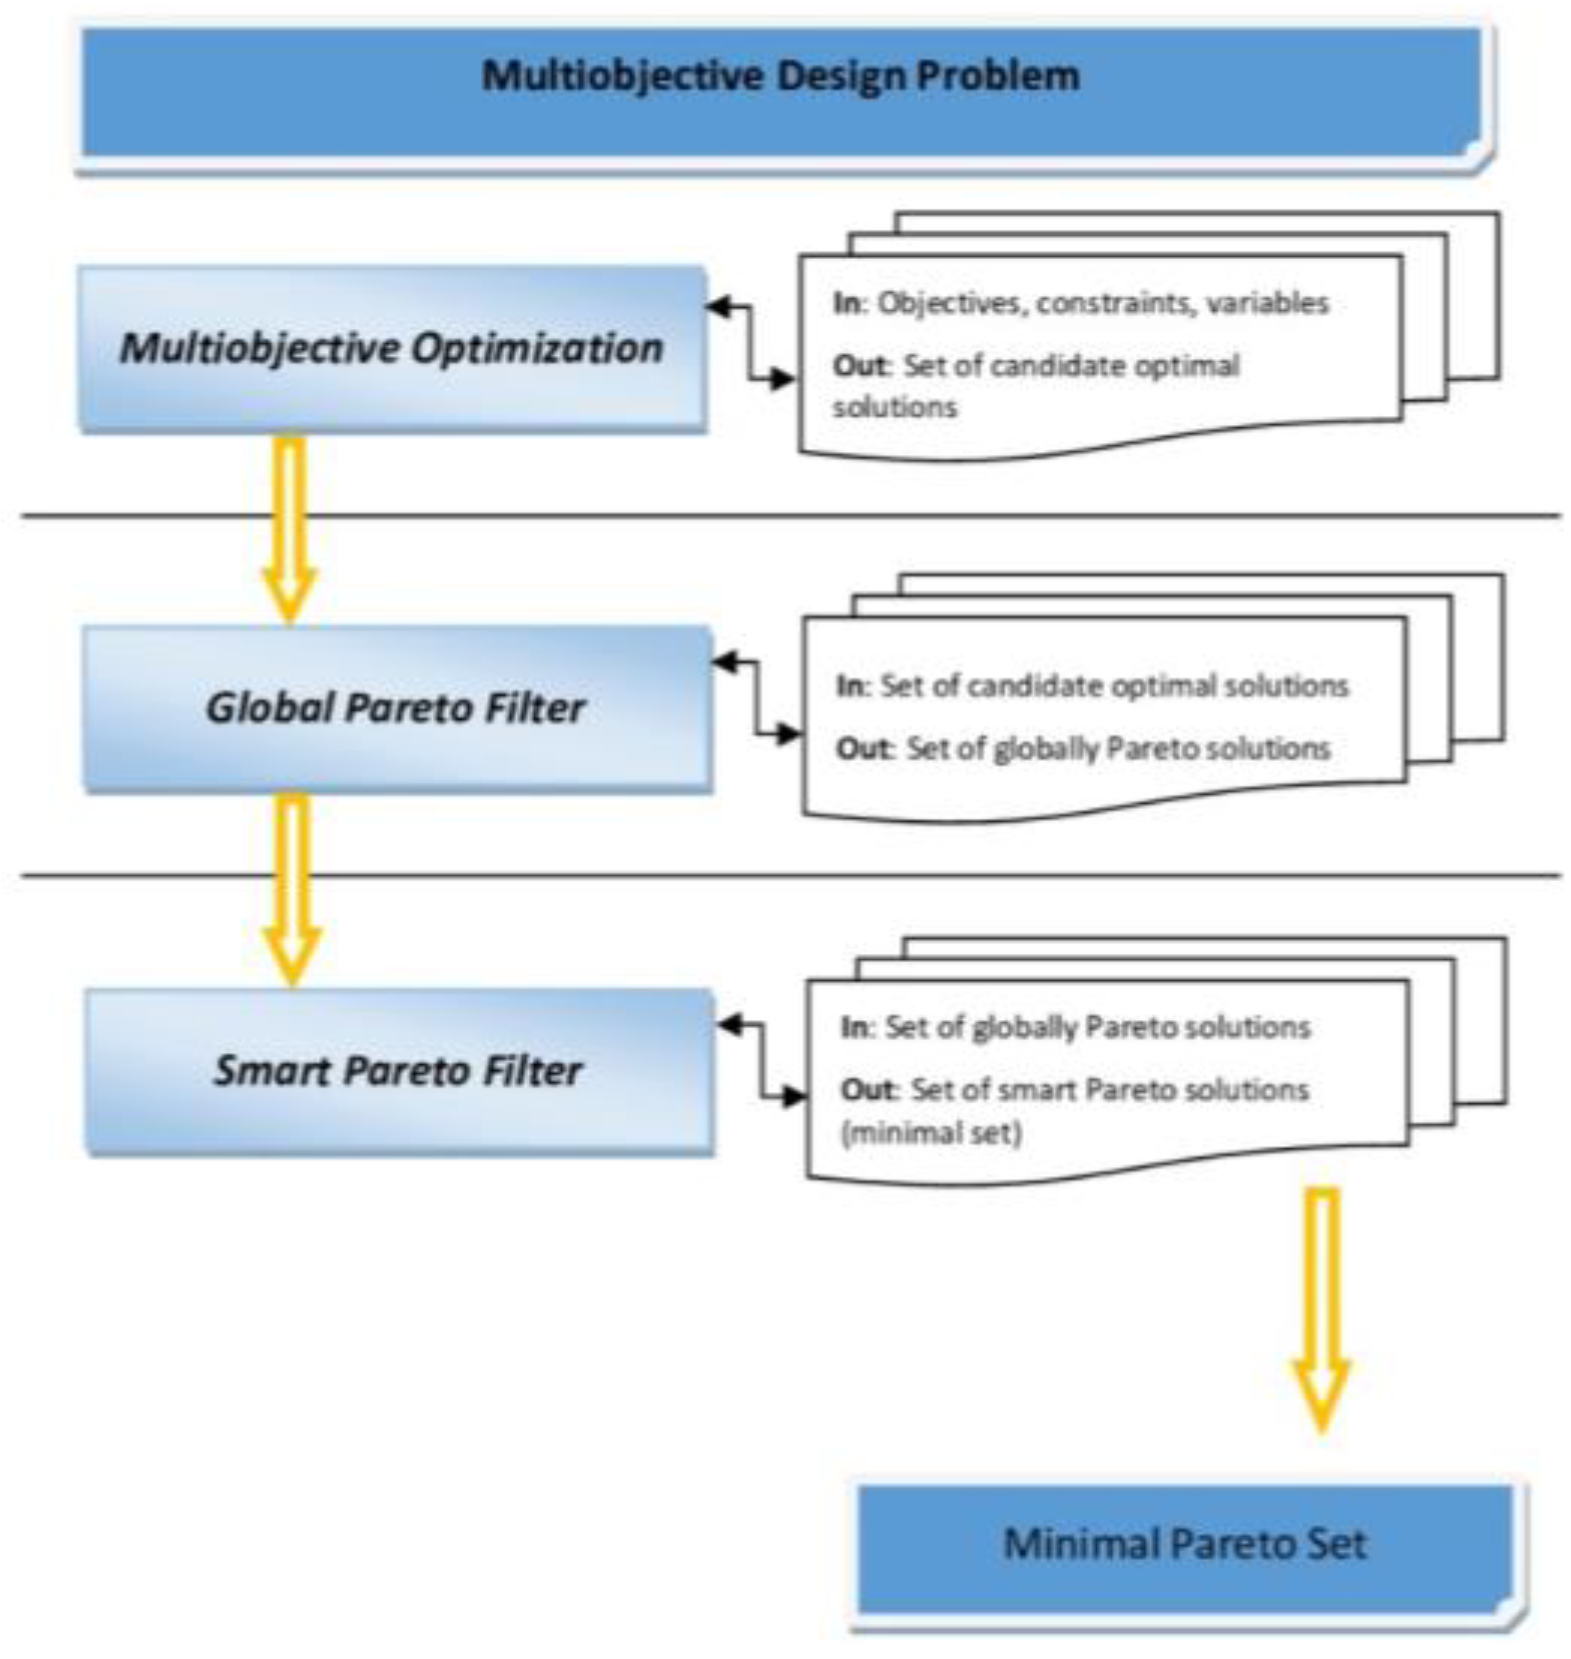
2.5. Multi-Criteria Optimization

The defined optimization task was considered in a four-dimensional criteria space (5):
K = [K1, K2, K3, K4] ∈ R4
In this space, solutions were sought for which all four analyzed criteria would have extreme values. The decision criteria were defined as K1—TPC total phenolic content (mg GAE/g); K2—TFC total flavonoids content (μmol CAT/L); K3—TAA total antioxidant activity (DPPH- %inh); K4—RSC reducing sugar content (g GE/L). The aforementioned criteria were determined for a specific set of decision variables for the extraction process, assisted with ultrasound: x1—sample/solvent ratio (g/mL); x2—time (min); x3—ultrasound power (W). The objective of the optimization procedure was to identify the parameters for the production of aqueous extracts from Levisticum officinale, for which criteria K1–K4 will have the maximum value. The domain (D) of the set of decision variables was defined as the Cartesian product (6):
D = x 1 × x 2   × x 3
The restrictions/limitations on the decision variables were as follows (7)–(9):
x 1 0.025   ; 0.075   g / m L
x 2   60   ; 240   [ W ]
x 3   3   ; 9   [ m i n ]
For the defined domain (D) of the set of decision variables (x1–x3), the values of K1–K4 were determined using multivariate approximation of the obtained experimental results.
A diagram of the optimization procedure is shown in Figure 1. The various stages of the procedures related to the determination of Pareto fronts (Pareto-optimal solutions) and compromise solutions are presented. Details related to the determination of compromise and preferred solutions are presented in Section 2.6 and Section 2.7.
The multi-criteria optimization task was related to the determination of a set of solutions in the domain D for decision criteria that satisfied the following conditions (10):
K 1     m a x ,   K 2 m a x ,   K 3 m a x ,   K 4 m a x
In the subsequent step, all decision criteria were scaled to dimensionless variables and normalized, assuming that Kimin i Kimax are, respectively, the minimum and maximum values of the criteria for the analyzed set of decision variables (11), (12):
K i ( n ) = K i m a x K i K i m a x K i m i n
i = 1, 2, 3, 4
K i ( n ) 0 ; 1
This approach provided an opportunity to compare the values of criteria that involved different characteristics and were initially expressed in different units. After this procedure, the highest value of the actual criterion corresponded to the value 0 (in the space of normalized criteria). Then, a dominance relation was introduced between two, arbitrary vectors of decision criteria K = [k1, k2, k3, k4] i K′ = [k1′, k2′, k3′, k4′] belonging to D (13) [38]:
K K   K K   C       C = a 1 ;   a 2   ;   a 3 ;   a 4 R 4

2.6. Quantification of Bioactive Compounds in the Produced Extracts

The method for obtaining a smart representation of solutions from Pareto fronts was used. In the proposed method, multi-objective Pareto front topology optimization is based on the weighted sum method for each criterion [39]. For the analyzed criteria, the relationship was assumed (14):
K = K 1 2 + K 2 2 + K 3 2 + K 4 2
After assigning weights for each decision criteria, the relationship was of the form (15):
K = w 1 K 1 2 + w 2 K 2 2 + w 3 K 3 2 + w 4 K 4 2
The criteria were assigned weights: w 1 + w 2 + w 3 + w 4 = 1 . The scheme for reducing the set of Pareto-optimal solutions and determining preferred solutions is shown in Figure 2.
For criteria K1–K3, the values of weights w1, w2 and w3 were 0.3. And for criterion K4, the value of weight w4 was 0.1.

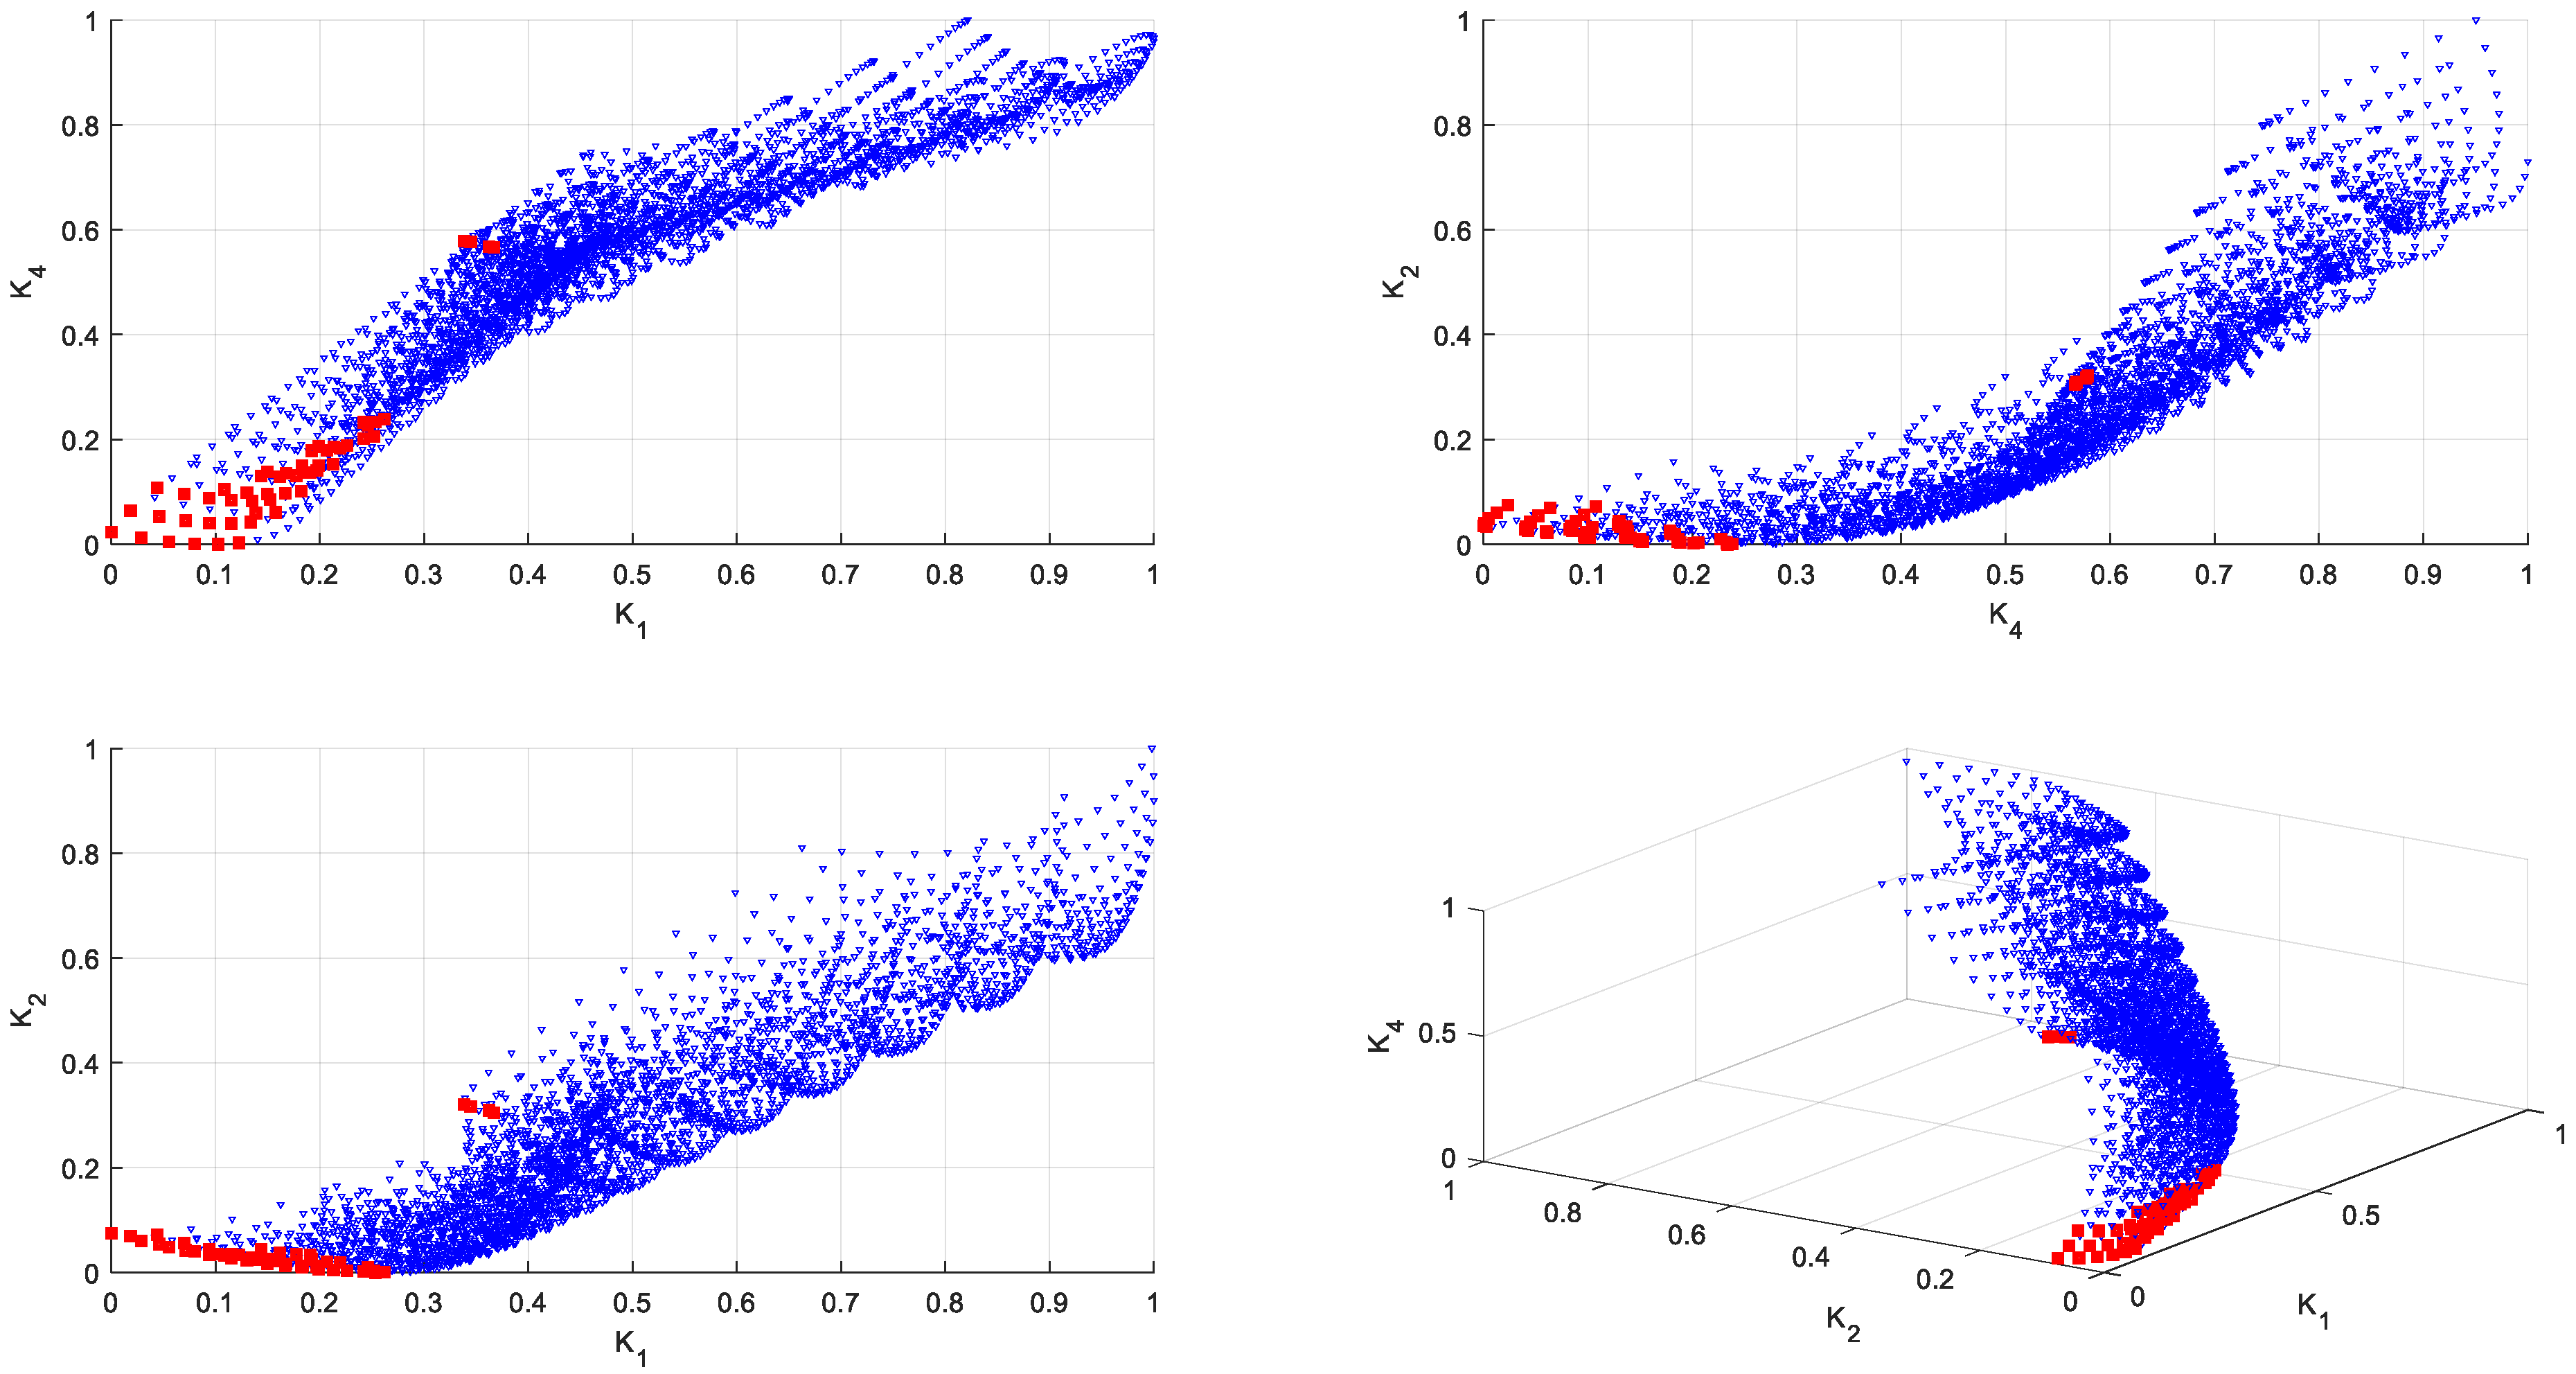
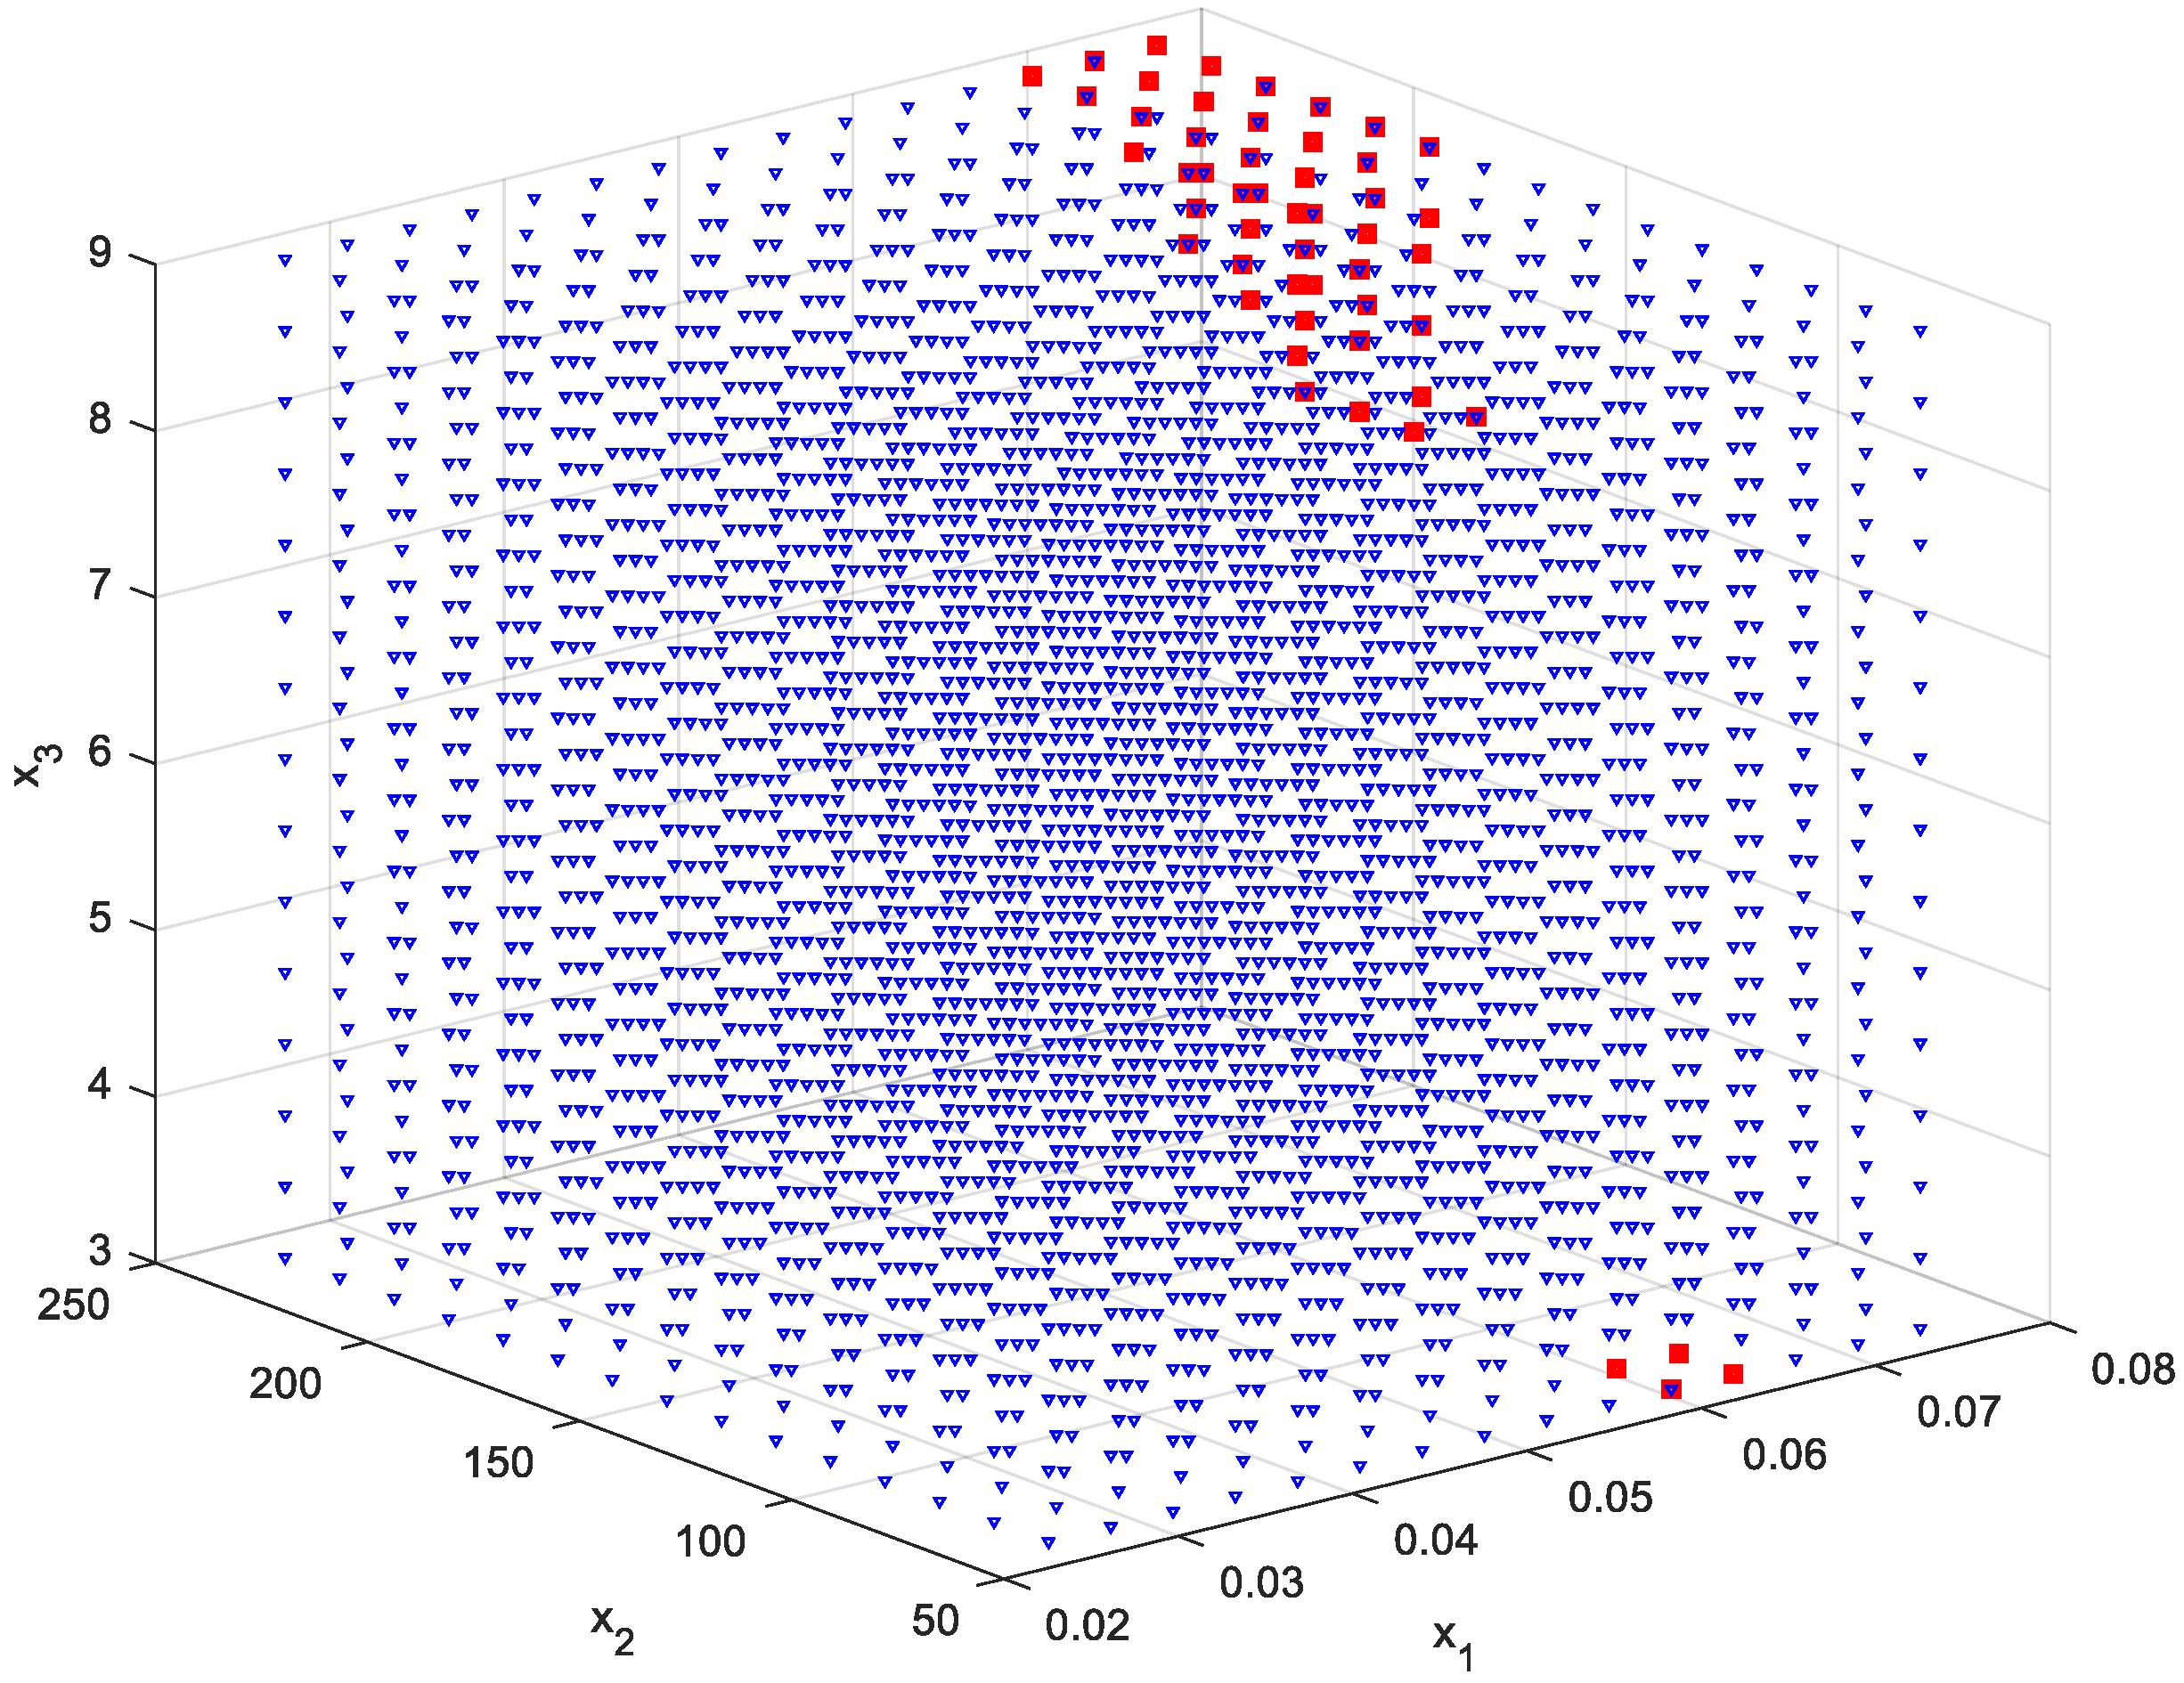
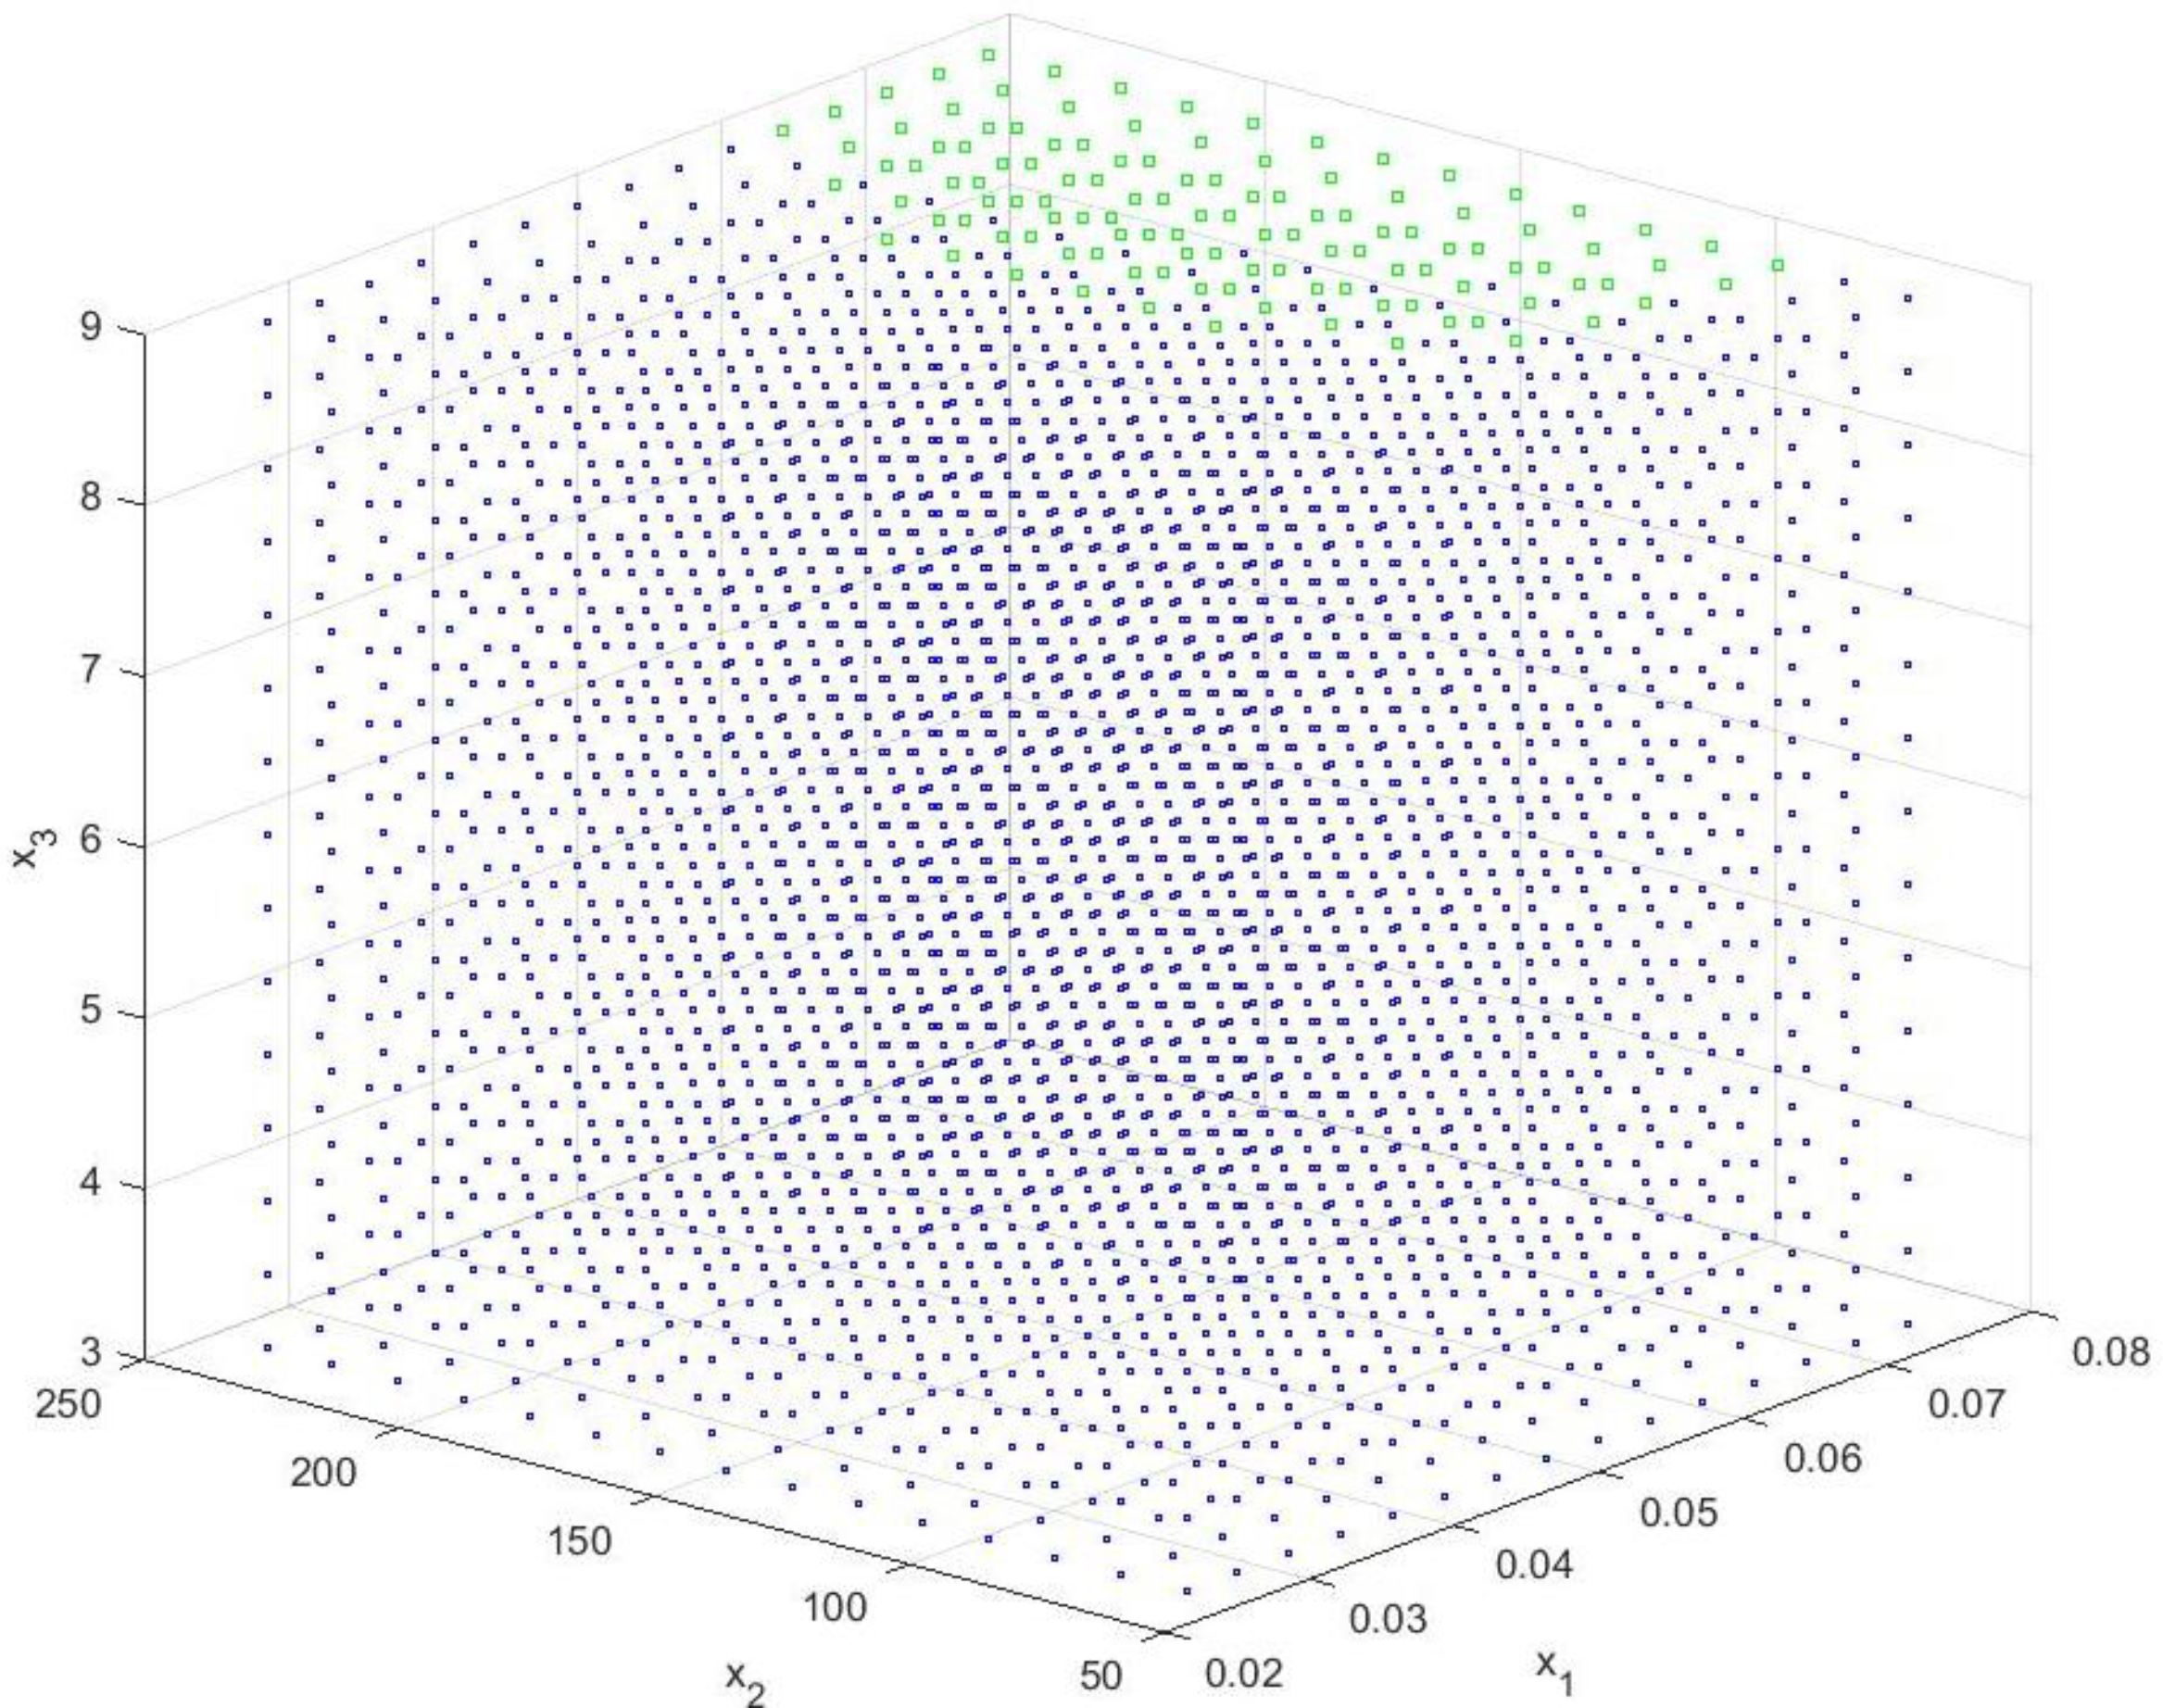
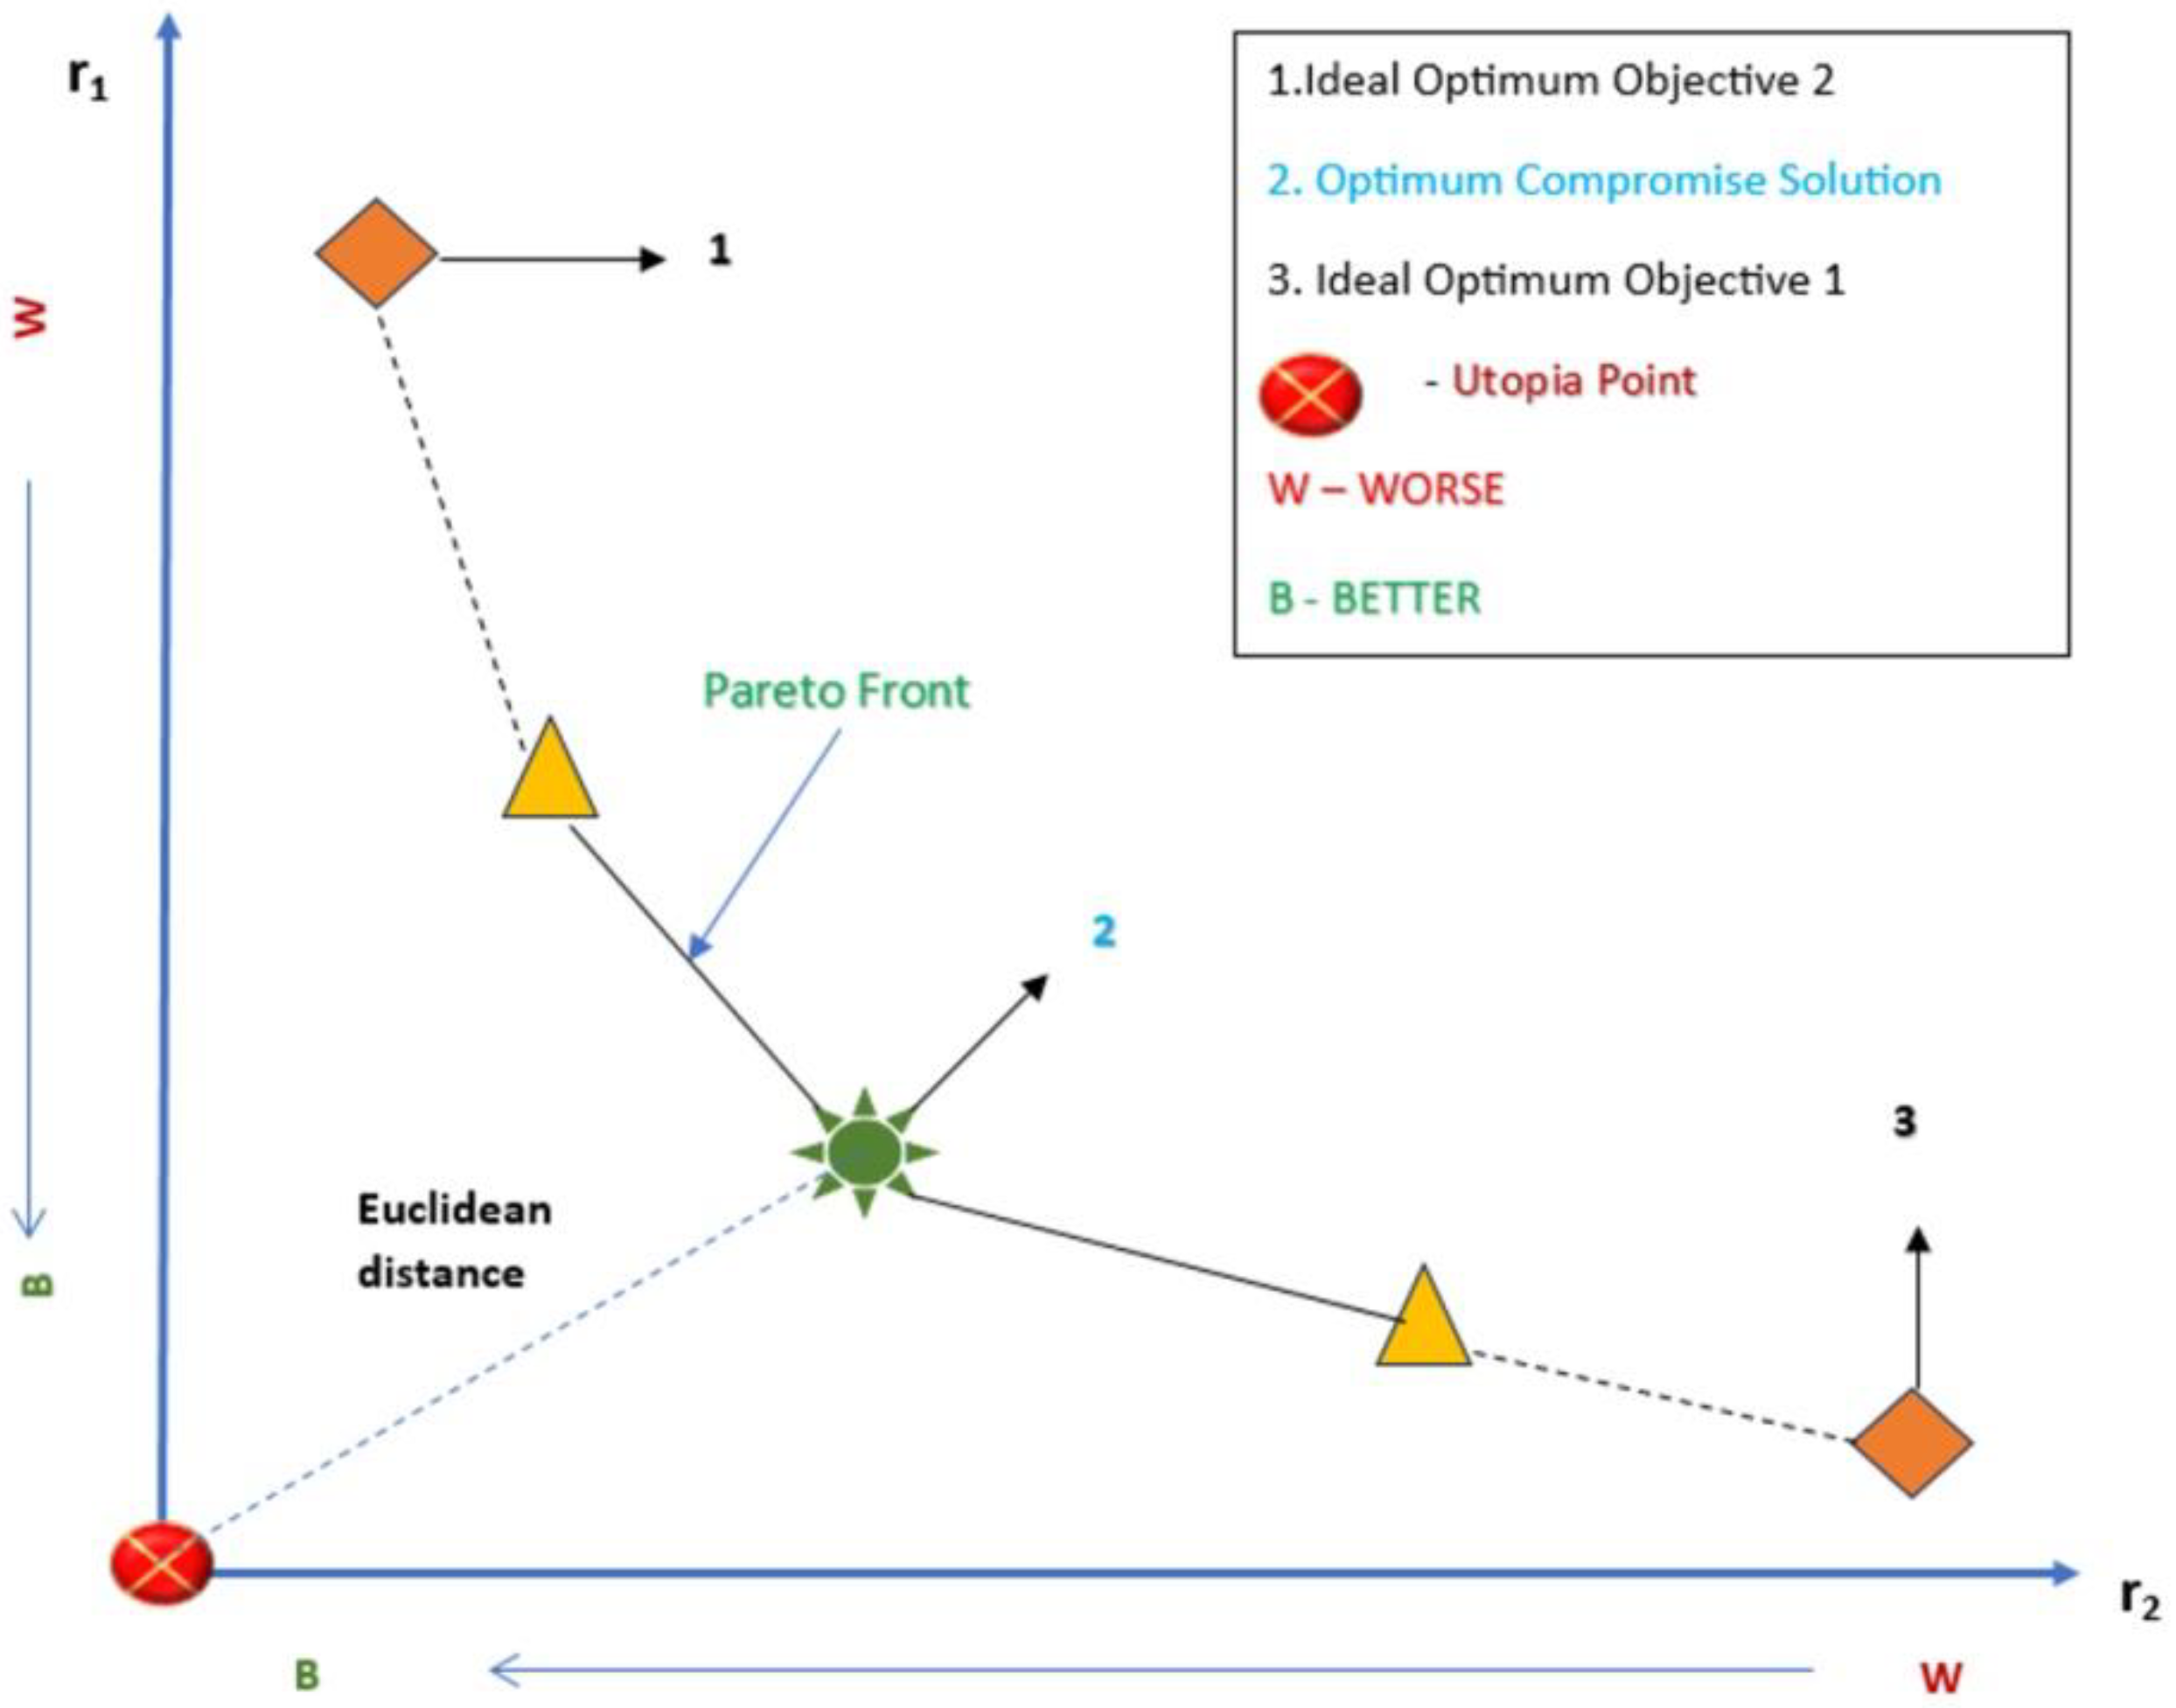
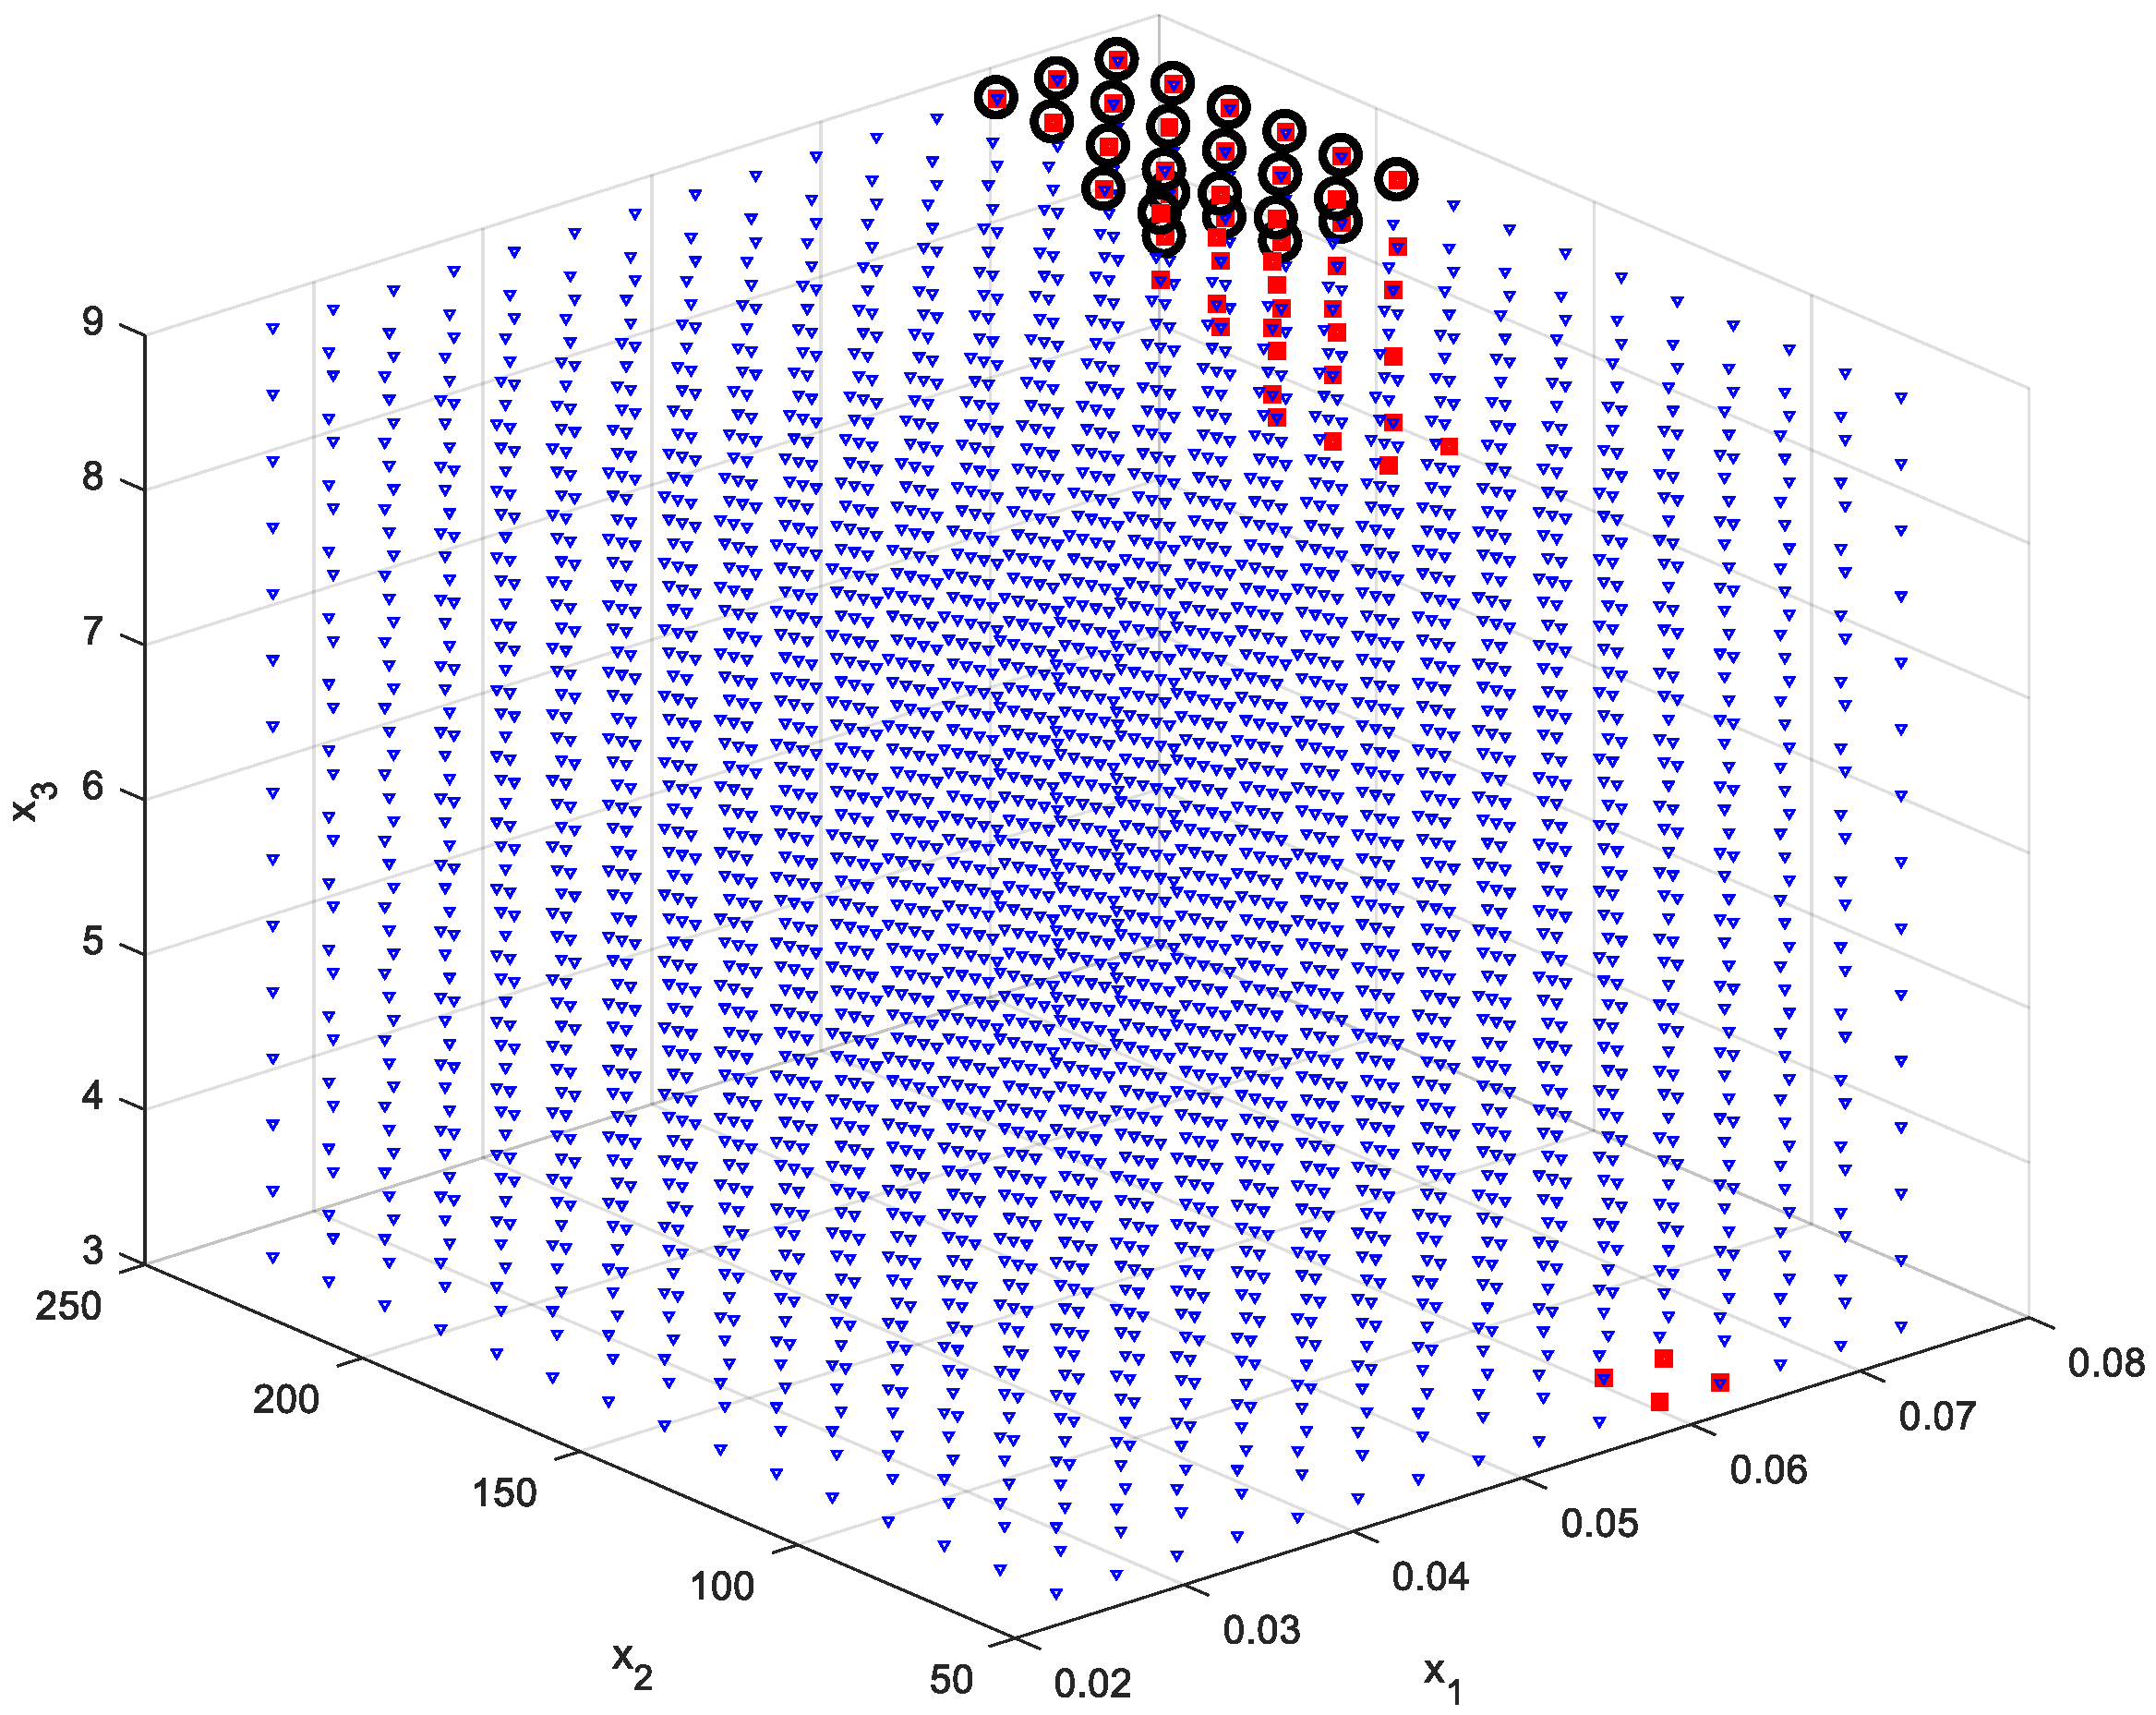
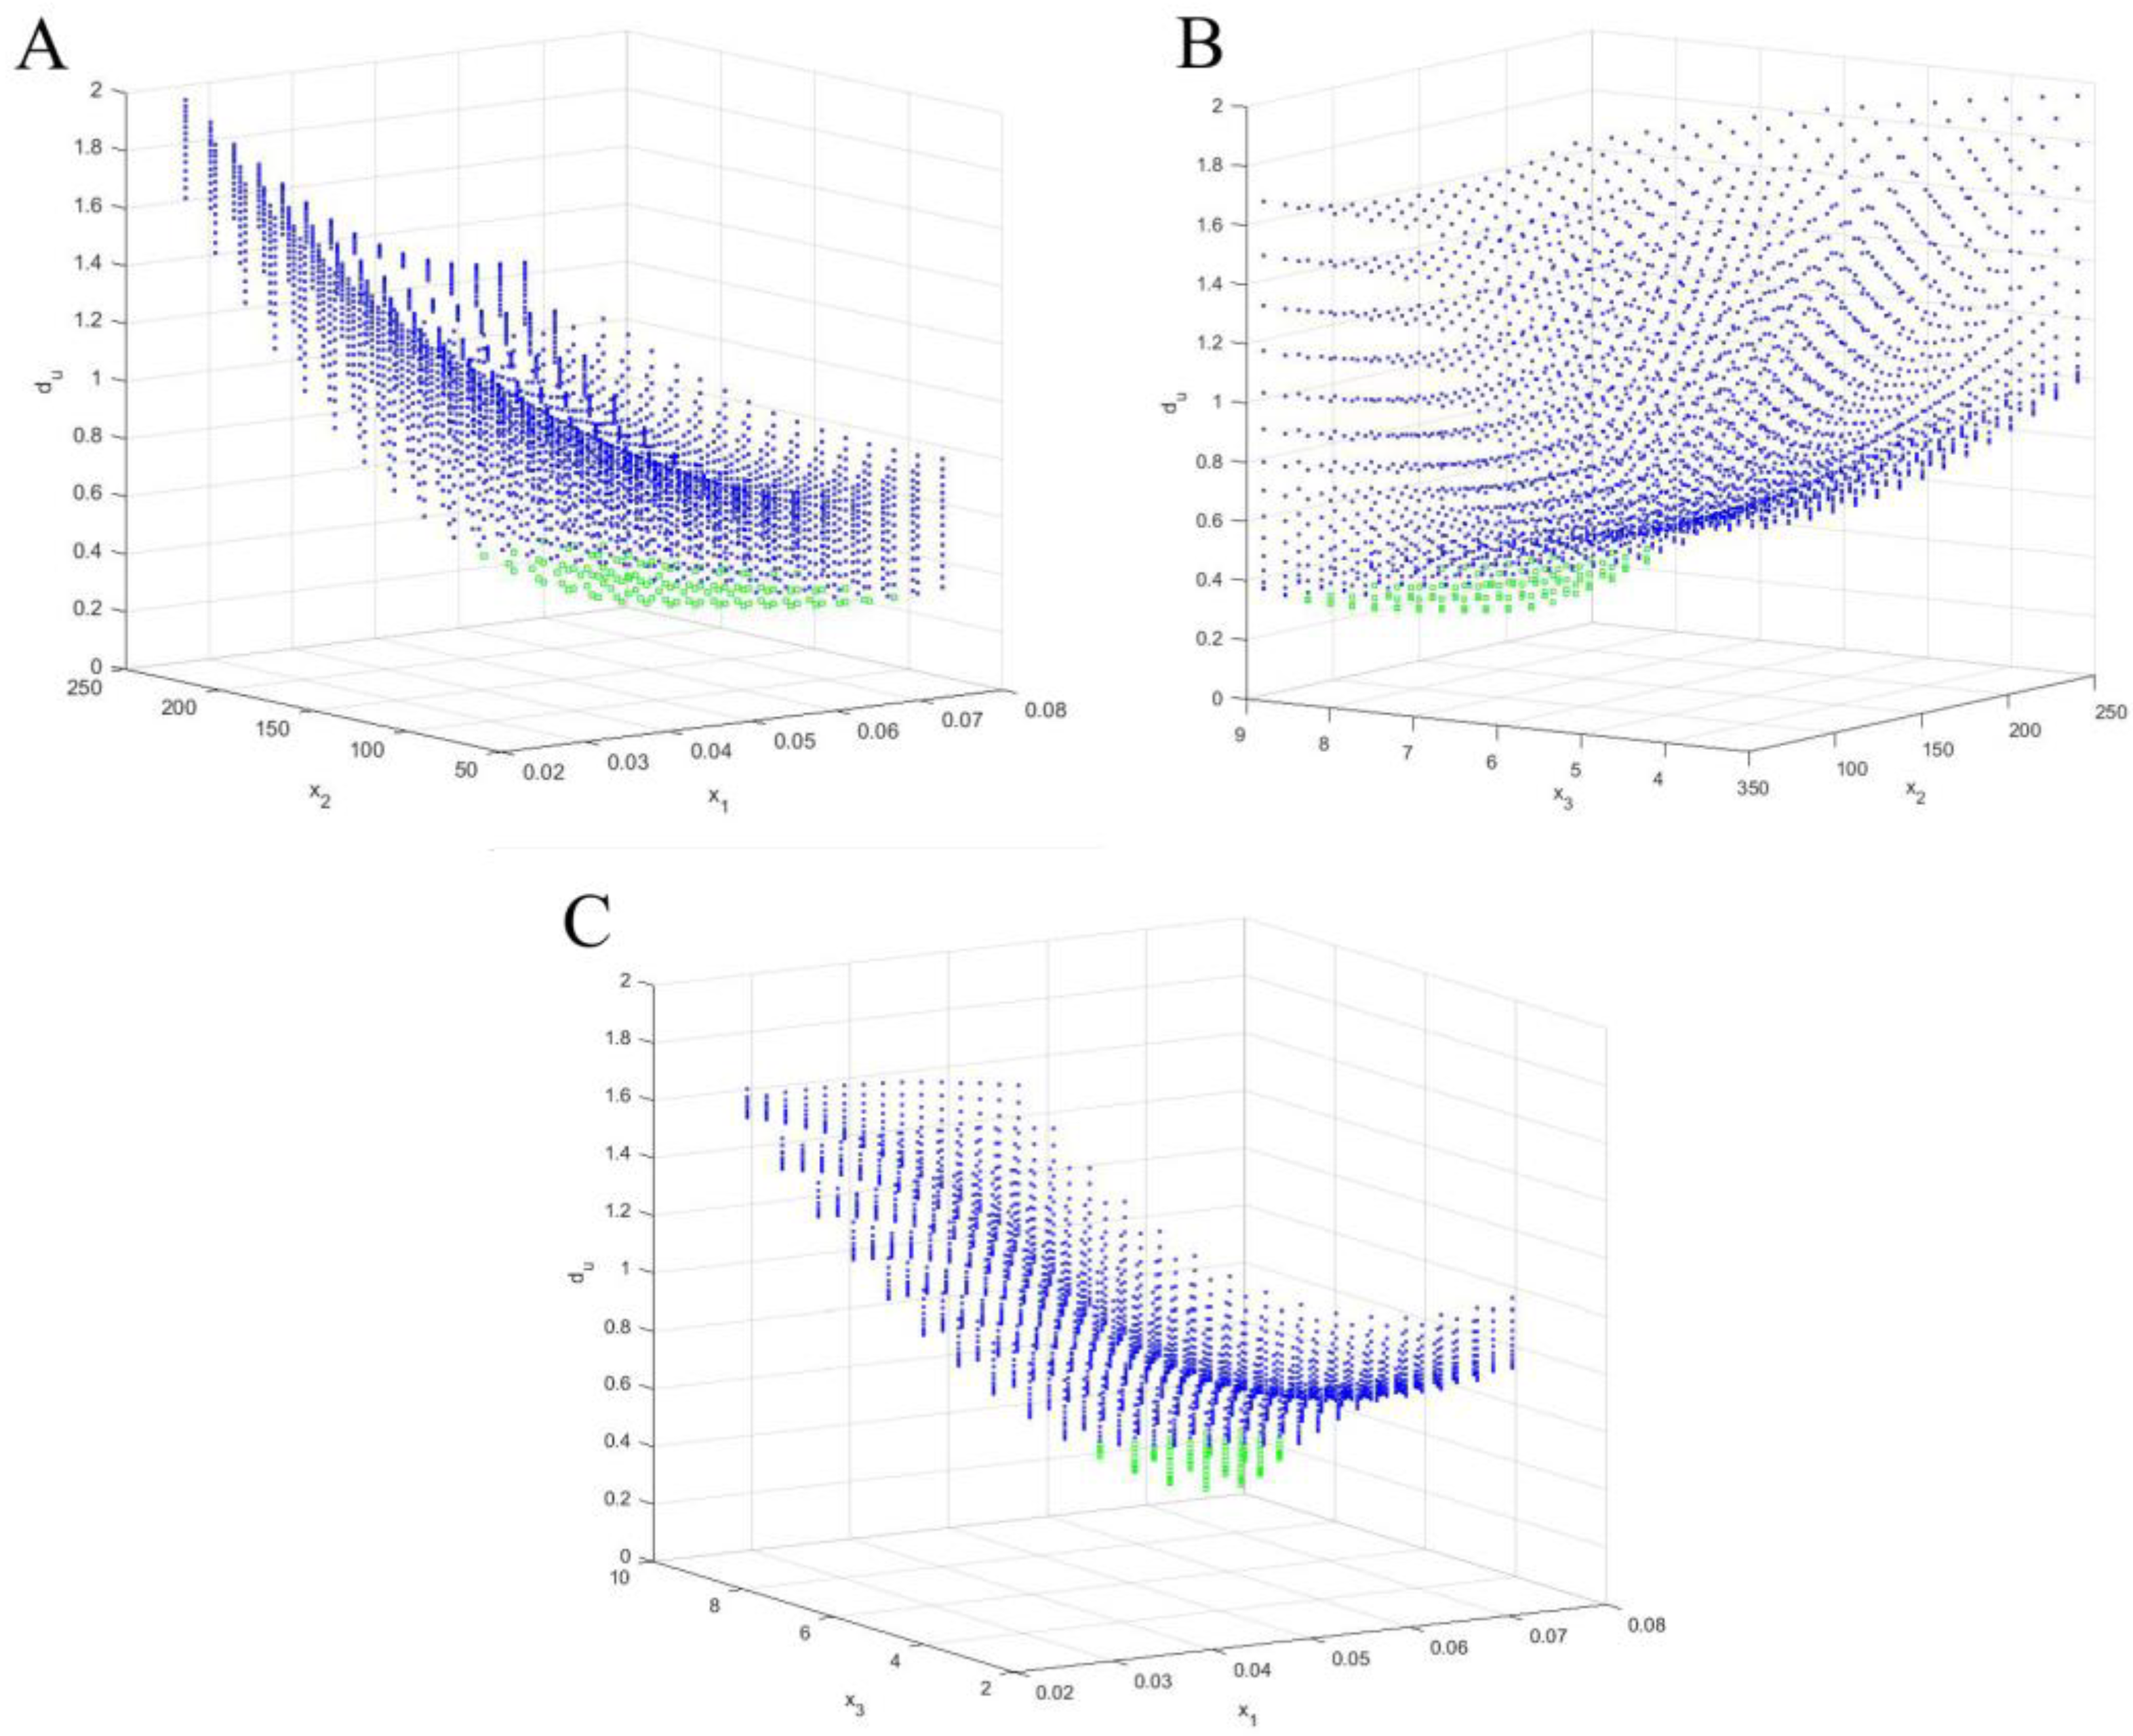
2.7. Reducing the Set of Pareto Optimal Solutions—The Compromise Solutions

At this stage of the optimization procedure, the definition of the Utopia point, considered the optimal solution in all respects, was adopted [40]. The Utopia point is referred to as the “ideal point” that maximizes all goals simultaneously, but it is also the so-called “unattainable point”. Therefore, the concept of achievable compromise solutions on the Pareto front with a minimum Euclidean distance from the Utopia point (dU) was introduced. In the search for compromise solutions on the Pareto front, a normalization of the objective function in the range [0,1] was introduced. A schematic of the procedure is shown in Figure 3.
In the subsequent step, the distance of all solutions on the Pareto front, measured from the Utopia point, was determined. The Pareto-optimal solution with the minimum distance from the Utopia point was selected as the best solution from the given set [41].
Thus, in order to analyze the set of all permissible solutions, a Euclidean metric of the form was introduced in the space of the normalized decision criteria (16):
d U = d K 0   K = i = 1 4 K i 2
where K0 = (0, 0, 0, 0) is the beginning of the coordinate system, the so-called utopian solution (dU).

3. Results and Discussion
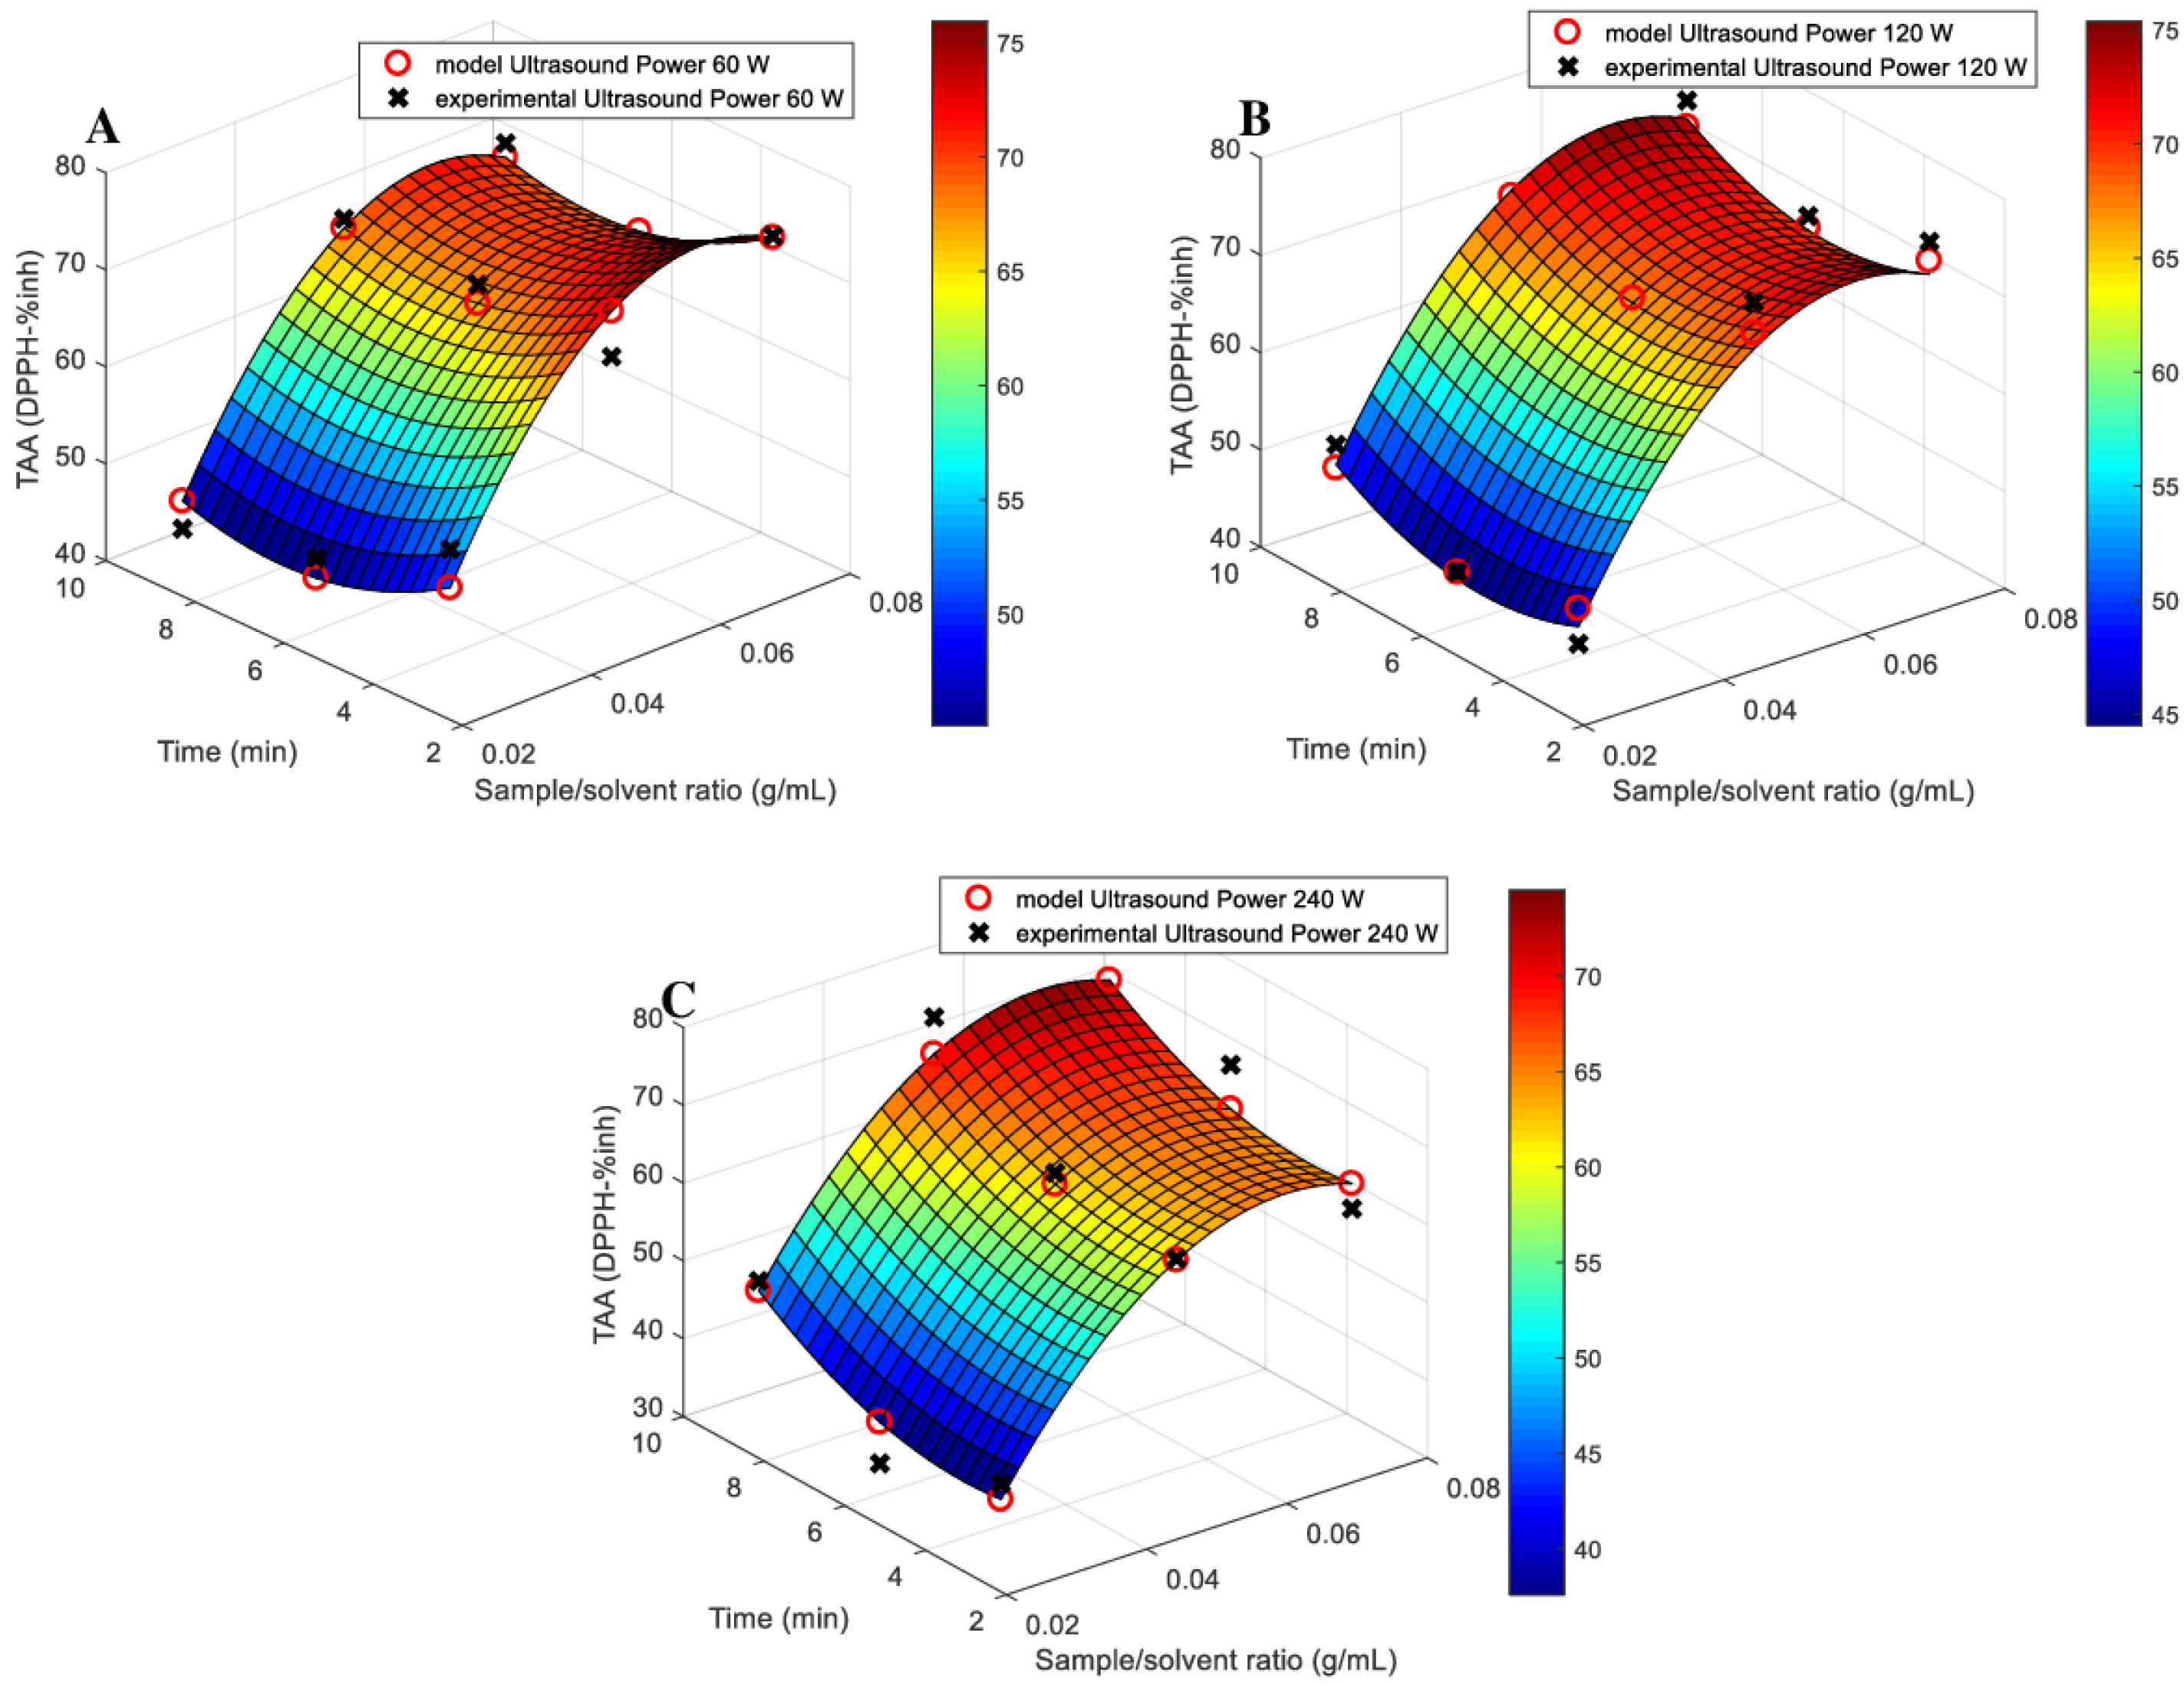
3.1. Models Fitting

The experimental data were fitted using a multivariate polynomial model. The regression coefficients of the resulting equations describing the individual extract-quality criteria in terms of the decision factors/variables analyzed were presented as Table 1.
Analysis of the regression coefficients in Table 1 shows that both process time and ultrasound power had a negative effect, while the biomass/water ratio had a positive effect on the TPC. A similar relationship was found for TAA. However, for TFC, it was shown that all factors had a positive effect on this characteristic of Levisticum officinale extracts. For the RSC the positive effect correlated with the root biomass/water ratio and ultrasound power, while extraction time had a negative effect on RSC.
An analysis of the proposed models for ultrasound-assisted aqueous extraction of Levisticum officinale roots is shown in Table 1. The high R2 values (>0.80) of 0.91 for TPC (K1), 0.88 for TFC (K2), 0.93 for TAA and 0.93 for RSC, respectively, indicate that the models based on multivariate polynomials sufficiently reflected the experimental data. According to Ahmed et al. [42], a high correlation and strong fit is shown using a regression model with an R2 value greater than 0.8. In addition, the analyses showed that the Adj R2 values were 0.86, 0.81, 0.89 0.85 for TPC, TFC, TAA and RSC, respectively, confirming a good model fit. Based on the analyses, it can be concluded that the generated models were characterized using the predictive ability of the characteristics of Levisticum officinale extracts depending on the parameters of the extraction process [43].
The fit of the polynomial models to the experimental results of the phenolic compound content together with the interpolation is shown in Figure 4.
The research showed that the content of phenolic compounds in the extracts increased when extraction of Levisticum officinale roots was carried out using an increased plant biomass to solvent ratio. Admittedly, the increases in TPC were no longer as significant when the root-to-water ratio was increased from 0.05 to 0.075 g/mL. Additionally, it was found that increasing the extraction time led to the production of extracts with higher levels of phenolic compounds. The results also showed that increasing the ultrasound power affected the total pool of phenols extracted from Levisticum officinale. The highest TPC extraction yields (above 300 mg GAE/g) were recorded for extracts produced using a biomass/solvent ratio of 0.075 g/mL, for 9 min and at an ultrasound power of 240 W. This is supported by the results obtained by Nikolić et al. [41], in which the authors analyzed the effect of ultrasound-assisted extraction parameters on the content of phenolic compounds in the extracts. According to the researchers, changing the ratio of solvent to plant biomass also had a greater effect on TPC than process time [44]. Similar observations were reached by Brahmi et al. [45], who analyzed the effect of ultrasound-assisted extraction conditions on the amount of extracted phenolic compounds from Opuntia ficusindica. The researchers showed that both the content of phenolic compounds and the antioxidant potential of the extracts reached a certain level at a certain time, after which no more significant differences caused by increasing this extraction parameter were observed. Also, Irakli et al. [9], who showed that the total polyphenols content of the extracts increased with increasing extraction time, noted a limiting time for the effect of ultrasound, after which the TPC extraction efficiency stabilized and then gradually decreased. Medina-Torres et al. [46] explain these observations with the fact that ultrasound-assisted extraction time is generally divided into two phases. The first is the ‘washing stage’, and it is during this process that the maximum number of active compounds is extracted. On the other hand, in the next stage, the so-called ‘slow extraction phase’, compounds contained in the plant biomass are transferred to the solvent using a diffusion mechanism. Therefore, it is important to determine the influence of the time of the ultrasound-assisted extraction procedure and to optimize this parameter, as unskillfully controlling such a process and increasing the time of the procedure may, consequently, lead to degradation of bioactive compounds induced by radiation generated using ultrasound [45]. Kutlu et al. [47] also highlighted the importance of ultrasound power for the extraction efficiency of phenolic compounds. The aforementioned researchers found that the amount of TPC extracted from Artemisia dracunculus increased by 15% with increasing ultrasonic power at the same analyzed sonication time and solvent-to-sample ratio. Similar observations were made by Garcia-Mendoza et al. [48] who extracted active compounds from Juglans regia. They found that TPC levels in the extracts increased by 12% when the process was carried out at increased ultrasonic power (from 180 to 220 W) [47].
Analysis of the flavonoids’ levels in extracts from the roots of Levisticum officinale showed that this characteristic was influenced by the parameters of the extraction process, assisted with ultrasound (Figure 5). It was found that increasing the time of the extraction procedure generally resulted in a higher pool of flavonoids in the samples. However, such significant differences in TFC were no longer observed for extraction times of 6 min and 9 min.
The study also showed that flavonoids’ levels in the extracts changed with changes in the ratio of root biomass to solvent. These changes were greater the longer the extraction process time was. When analyzing the effect of ultrasound power, it was found that the lowest concentration of TFC occurred in extracts produced when the process was assisted with ultrasound at 60 W. In contrast, the increase in flavonoids in the aqueous extracts was highest as a result of power at 120 W. Assefa et al. [46] evaluated the effect of extraction time on the antioxidant activity and flavonoid content of extracts from Citrus junos. The study of the aforementioned authors proved that antioxidant potential and flavonoid levels increased with increasing extraction process duration until a critical time value was reached, after which the analyzed indicators already assumed a constant value. The researchers suggest that this is due to the fact that both antioxidant compounds and flavonoids were completely extracted. They also came to similar conclusions regarding the effect of changing the biomass/solvent ratio. The authors, therefore, emphasize the need to optimize these extraction process parameters. An ill-considered increase in the use of plant biomass is not only connected with a negative economic impact, but also disturbs the efficiency of the extraction of bioactive compounds from different matrices, which is based on mass-transfer principles. Rational control of the process in terms of this parameter leads to a reduction in biomass consumption, which in turn results in reduced process and energy costs [49].
Increasing the time of the extraction procedure and increasing the plant biomass/water ratio were shown to be beneficial for increasing TAA (Figure 6). However, when the process was assisted with ultrasound at 60–120 W at the average analyzed time parameters and the mentioned biomass ratio, a certain state of stabilization was observed in the total antioxidant potential, expressed as % inh DPPH. In addition, increasing the ultrasound power to the maximum analyzed (240 W) no longer led to significant changes in the TAA of the extracts. Nikolić et al. [44] even found that increasing the UAE time and excessively increasing the solid/liquid ratio lead to a decrease in the antioxidant potential of Centaurium erythraea extracts. The authors suggest that the effect of prolonged exposure to cavitation energy may be to degrade plant metabolites and reduce the antioxidant potential of the compounds. Babotă et al. [50] additionally indicate that increasing the ratio of the plant matrix to solvent too much may, after reaching a certain limiting phase, already reduce mass transfer, leading to a reduction in the extraction efficiency of bioactive compounds [44].
According to Dawidowicz et al. [51], the observed slight decrease in TAA could be related to a decrease in the concentration of hydrogen ions, which in turn led to an increase in the reaction rate between DPPH and flavonoids. The results of the research by Pekal and Pyrzynska [52] proved that radicals had higher antioxidant activity in the DPPH test of tea extracts due to the dominance of the electron transfer mechanism with a conjugated proton. The above-mentioned authors showed that the pH of the extracts determined the results obtained in the DPPH antioxidant activity test, leading to differences in the assessment of their antioxidant activity recorded in less-acidic environments. Additionally, Dawidowicz and Olszowy [53] proved that changing the concentration of hydrogen ions leads to changes in the mechanism of the DPPH scavenging process [52]. Another reason for the decrease in TAA could be the amount of compounds extracted after 6 min, resulting from the biomass to solvent ratio used. According to Bolling et al. [54], this is due to the fact that there is a non-linear function between sample concentration and antioxidant activity as a result of synergistic or antagonistic interactions between the components of the extracts [55].
The situation was different for the content of reducing sugars (Figure 7).
The RSC did not change if the extraction time was extended, using low biomass/water ratios. In contrast, in the other cases analyzed, this characteristic increased with increased procedure duration. Increased ultrasound power resulted in higher sugar-extraction efficiency. However, the differences between 120 and 240 W were no longer significant. Similar observations were reached by Mondal et al. [56] who analyzed the extraction efficiency of reducing sugars from Arctium lappa L. root waste. The researchers showed that the highest concentration of sugars was contained in extracts produced with increased ultrasound-assisted extraction parameters (biomass/solvent ratio and process time) [56]. However, as highlighted by AlYammahi et al. [57], there are few reports in the literature concerning the ultrasonic extraction of sugars. Particularly in regard to targeted optimization of extraction parameters for maximizing the extraction of reducing sugars. AlYammahi et al. [57] evaluated the effect of extraction parameters on the level of sugars in extracts produced using ultrasound from Phoenix dactylifera. The researchers showed that both extraction time and biomass/solvent ratio had a significant effect on this characteristic of the extracts. The authors explained the observed relationships using the increased solubility of sugars in the solvent, resulting in increased release and diffusivity of these compounds from the plant biomass. Nuerxiati et al. [58] show that unjustified prolongation of extraction time already leads to a decrease in extraction rate and amount of extracted sugars [57]. On the other hand, da Silva Donadone et al. [59] put forward the conclusion that an additional aspect of the extraction process, determining the efficiency of carbohydrate extraction from the plant matrix, is the power of ultrasound. Chen et al. [18] showed that RSC extraction from mulberry fruit was increased as a result of increasing the ultrasound power from 60 to 180 W. Hu et al. [60] explain this by the fact that increased ultrasound power increases the effect of cavitation and vibration and thus leads to greater disintegration of the plant matrix cell walls, thereby promoting carbohydrate dissolution and diffusion [59].
Summarizing this stage of experimental research, it was found that the content of polyphenols, flavonoids and the antioxidant potential of the extracts changed with the process parameters. A longer extraction procedure and an increased biomass/solvent ratio led to a simultaneous increase in the analyzed quality parameters of the extracts, mainly as the antioxidant potential of plant extracts is determined by the level of phenolic compounds. According to Wong et al. [61], there is a correlation between high polyphenol content and high antioxidant activity. Othman et al. [62] showed that all samples of herbal plant extracts had a positive correlation between TPC and DPPH free-radical scavenging activity. The high DPPH inhibition capacity may also be a result of the presence of low-molecular-weight phenolic compounds [63,64]. Othman et al. [62] proved that there is a low positive correlation found for antioxidant activity and total flavonoid content in the composition of plant extracts. These observations confirm the study by Miliauskas et al. [65], in which the authors proved that the observed low correlations are influenced by flavonoids present in extracts with specific structures (hydroxyl position in the molecule), which determine antioxidant properties. Thus, it is indicated that depending on the extracts studied and the compounds extracted from them, the levels and correlations between the biologically active compounds should be determined individually [66].

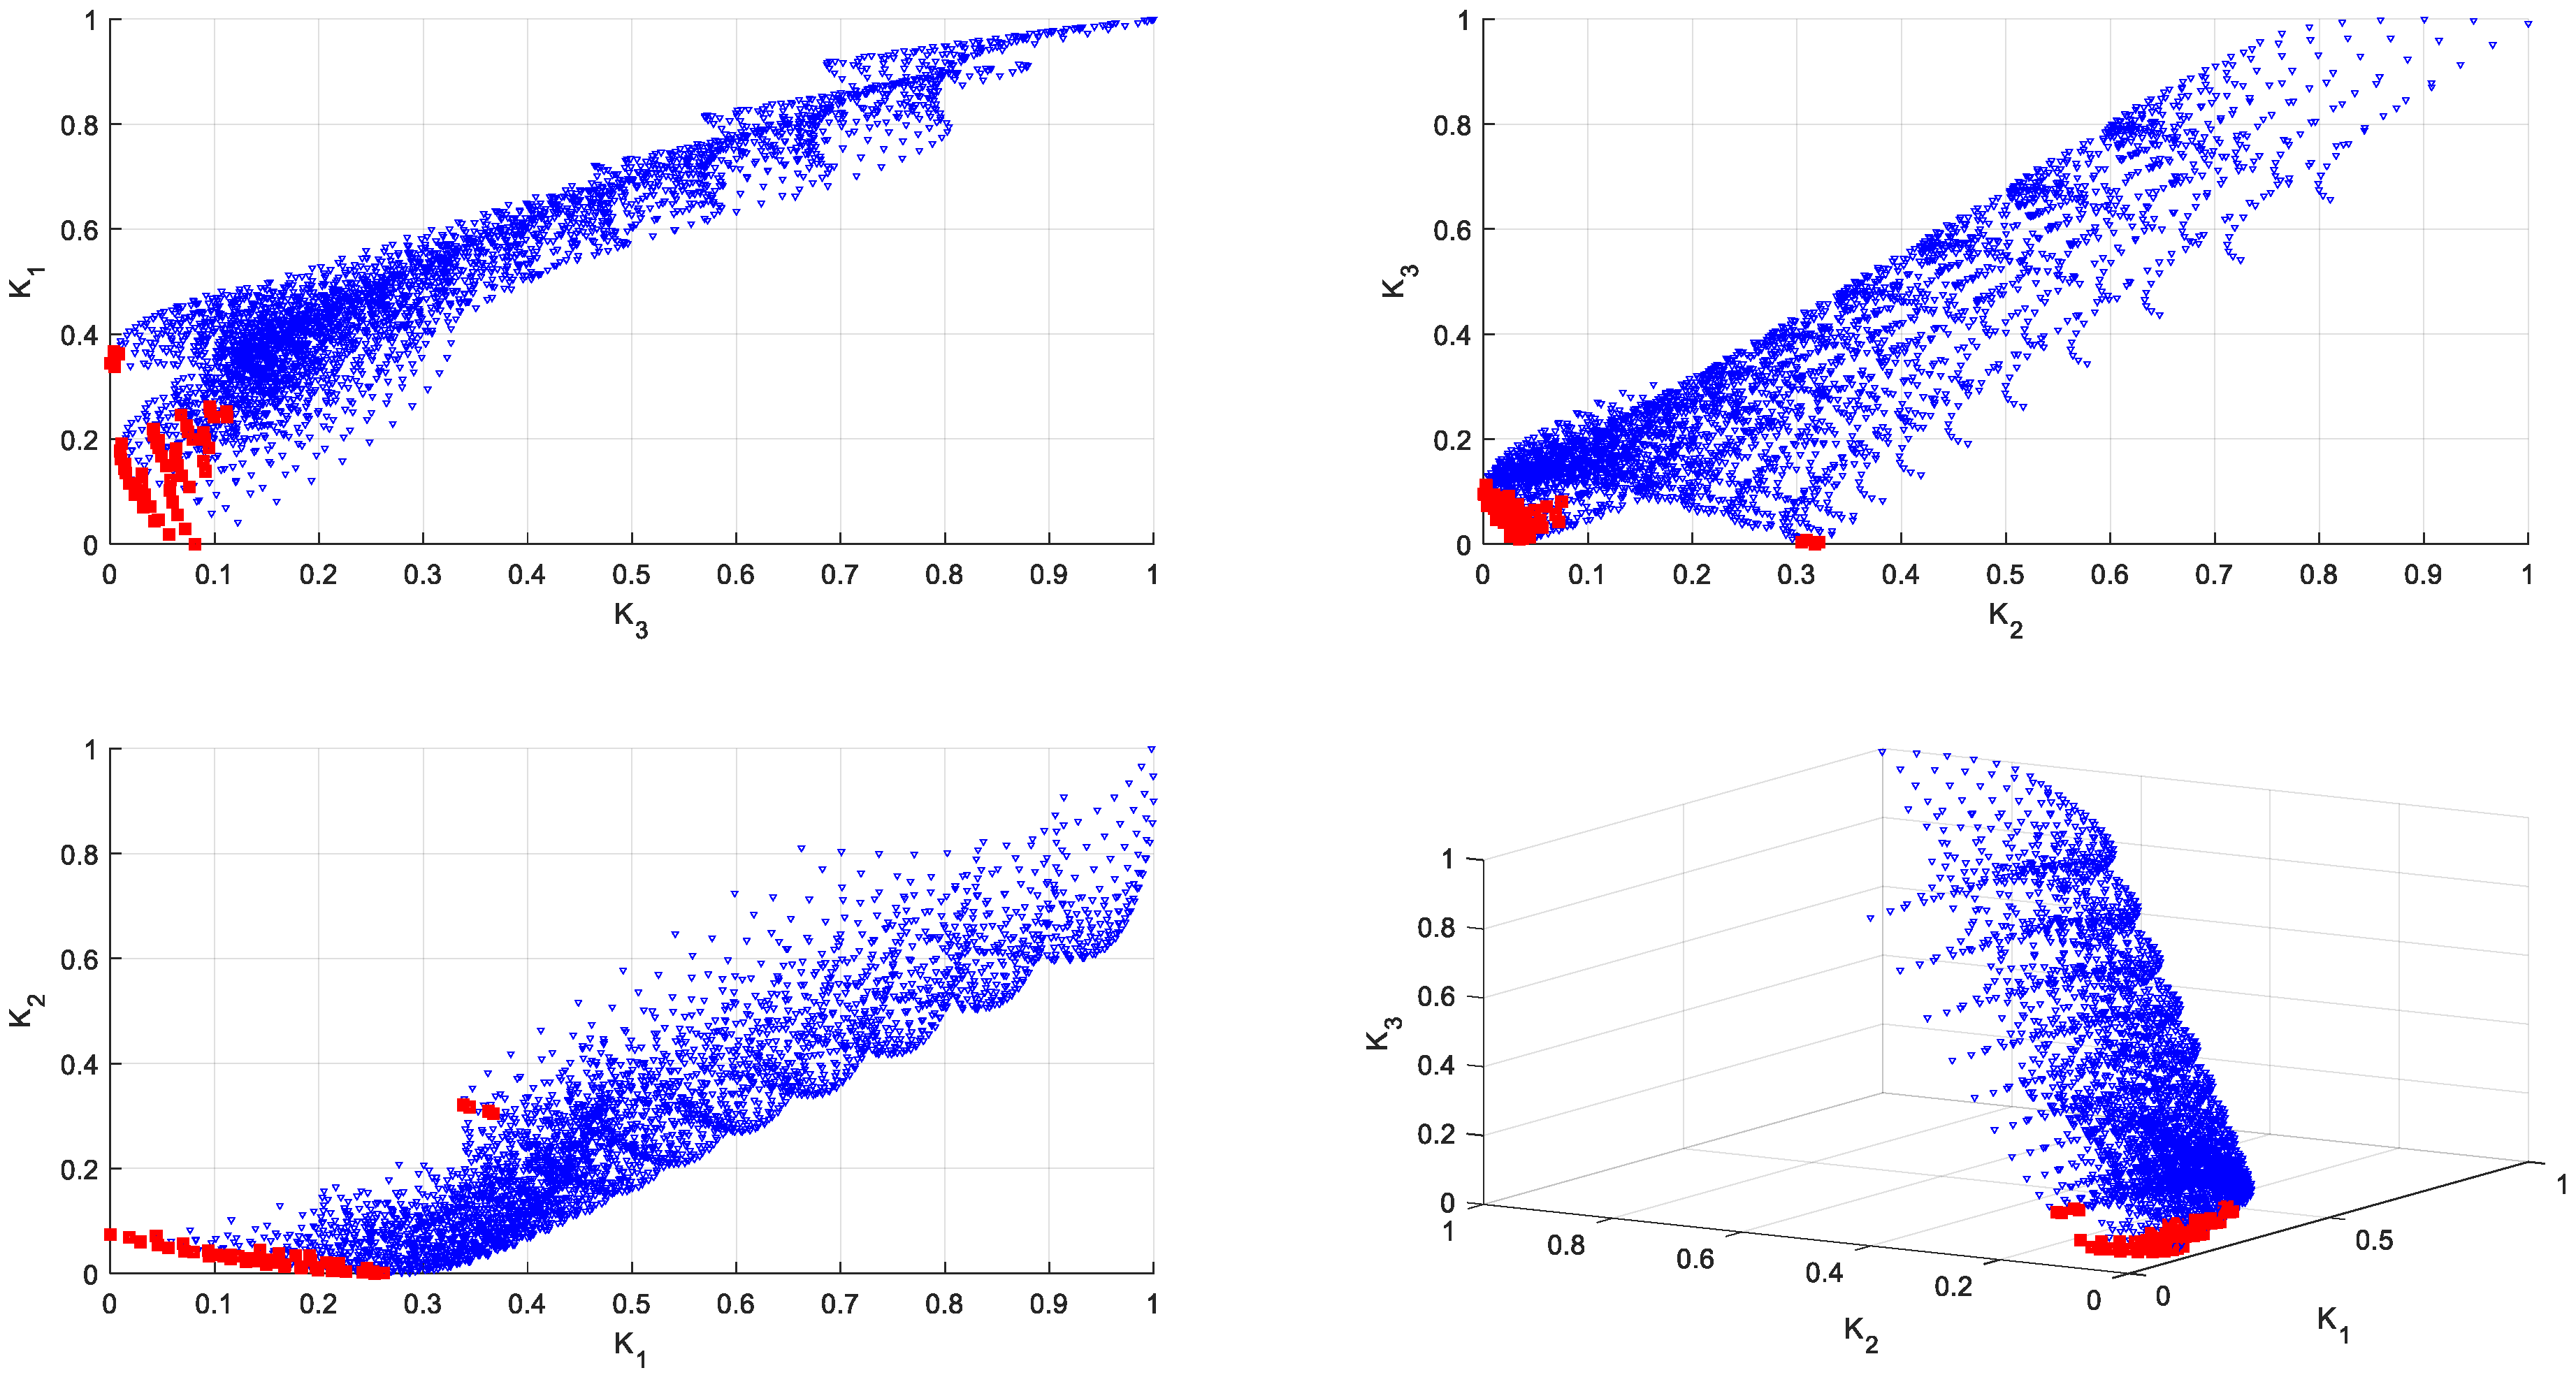
3.2. Multi-Criteria Optimization

The mathematical models generated, together with the interpolation and the corresponding equations, were used in a further procedure to optimize the parameters of the extraction processes. The objective of the optimization was to identify sets of optimal solutions that would yield extracts with the highest possible TPC, TFC, TAA and RSC. Figure 8 and Figure 9 show the Pareto fronts in the decision criteria space (TPC, TFC, TAA, RSC). There were two sets of optimal solutions in the analyzed criteria space. The representation of the fronts in the decision criteria space (2D and 3D option) allowed us to obtain a global view into the entire studied domain of the efficiency of the extraction procedure, defined in terms of the maximization of the individual decision criteria. It should be emphasized that the correlations observed in Figure 8 and Figure 9 were obtained after the process of normalizing the decision criteria, as a result of which, for the maximized decision criteria, 0 is the best scenario. The demonstrated multifaceted degree of difficulty of the research problem, as well as the post-optimization theory of decision making, necessitated depicting the effects of multi-objective (multi-criteria) optimization (Figure 10) in the space of decision variables x1 (sample/solvent ratio), x2 (time) and x3 (ultrasound power).
Thus, in this optimization task, several objectives have been considered simultaneously, and the effect of multi-criteria optimization will be to generate sets of optimal solutions, based on the trade-off between the different objectives and the corresponding values of the decision variables [67]. Pareto front analysis showed that the optimal solutions in the space of decision variables form two disjointed sets (Figure 10). It should also be mentioned that the parameters of the ultrasound-assisted water extraction (i.e., decision variables x1, x2 and x3) were also determinants of the objective function of the identified domain. Navigating the Pareto fronts, it was shown that two scenarios could be adopted for the simultaneous maximization of the decision criteria. The first assumes that ultrasound-assisted extraction can be carried out for 3 min, using low ultrasound power (60.0000 to 72.8571 W) and a biomass/solvent ratio of 0.0607 to 0.0643 g/mL (Table 2).
The second scenario is based on a second set of Pareto-optimal solutions. In this case, maximization of the criteria can be achieved using Levisticum officinale aqueous extraction at a biomass/solvent ratio of 0.0643 g/mL for a time between 8.1429 and 9.0000 min, with ultrasound assistance of 162.8571 to 201.4286 W. Thus, for satisfactory maximization of TPC, TFC, TAA and RSC in the extracts, the process boundary conditions (maximum parameter values) are not required. The set of Pareto-optimal solutions (Table 2) also shows that maximization of the criteria can occur as a result of increasing the plant biomass/water ratio (0.714 g/mL), when the extraction procedure can be carried out at the average ultrasonic power analyzed (150- 188.5714 W) in a time ranging from 7.7143 to 9.000 min.
According to Woinaroschy and Damşa [67], the effect of multi-objective optimization (as opposed to optimization with only one objective) is to determine multiple points (as shown in Figure 10 and Table 2). These points are referred to as optimal in the sense that an improvement in one objective (criterion) can only be achieved if one or more others (criteria) are made worse [68]. According to Kao and Jacobson [69], analyzing a large set of Pareto-optimal solutions can be a kind of challenge. Often there is a need, voiced by decision makers in technological processes rather than engineers, for the necessity of selecting from a small set of preferred Pareto-optimal solutions. On the one hand, obtaining large sets of Pareto-optimal solutions is an ideal approach (on the formal side), additionally providing the decision-maker with a diverse set of solutions. However, in many situations where the decision maker has unassessed importance, his or her preferences indicate that it is often impractical to identify a good subset of solutions from among too many options [70,71]. Therefore, the focus of the presented research was to extend the multi-objective optimization procedure with the objective of generating smaller subsets of Pareto-optimal solutions called preferred solutions [59,72,73,74]. The effects of this approach to navigating and reducing the set of Pareto-optimal solutions are shown in Figure 11.
Pareto set reduction and the use of the so-called smart Pareto approach made it possible to determine subsets of preferred solutions. The allocation of criterion weights focused on awarding greater importance to the first three criteria for the quality of the aqueous extracts, extracted using ultrasound-assisted extraction (K1, K2, K3) (Table 3). In the optimal subset (Figure 11, Table 3), it was noted that with the enhanced performance of TPC, TFC and TAA (maximized with weights of criteria K1-K3), the extraction procedure could be carried out in 8.5714 min, with biomass/solvent ratios of 0.0679, 0.0714, 0.0750 g/mL and ultrasound power of 201.4286, 214.2857 and 188.5714 W. In contrast, the second option in this subset indicates a marginal (boundary analyzed) extraction time of 9 min, a Levisticum officinale root/water weight ratio of 0.0643 to 0.0750 g/mL and ultrasound power of 175.7143 to 240.0000 W.
Turning to further the analysis of the multi-objective optimization procedure, which is an important part of operations research, it should be emphasized that there is no single optimal solution to multi-objective problems, but a set of solutions. From this set, it is possible to extract Pareto-optimal, efficient, non-dominated, compromise or equivalent solutions [75]. At this stage of the research, the focus was on determining a set of compromise solutions. The search for these solutions was based on the definition of a Utopia point (an ideal, unattainable point). The best solution from this set has the smallest Euclidean distance from the Utopia point. The use of this optimization procedure is an extension of the trade-off methods proposed by Gebreel [75] and Gebreel [76], in which the researcher shows the possibility of solving multi-objective optimization problems based on obtaining the best solution that is close to the Utopia point in space. The sets of compromise solutions in the space of two decision variables are shown in Figure 12.
For better visualization and to enhance the decision maker’s operational capabilities, Figure 13 shows the set of trade-off solutions in the space of all decision variables analyzed. The locations of these set points are defined in Table 4.
A very large set of compromise solutions was demonstrated. The values of the decision variables for this subset ranged from the average to the maximum analyzed (boundary conditions) values of the ratio of Levisticum officinale biomass to solvent. The extraction procedure time started at 8.1429 to 9 min. While the power had a wide range from 85.7143 to 240.0000 watts. Thus, the presented procedure provides the decision maker with ample opportunities and shows precise options for controlling the ultrasound-assisted extraction process for maximizing the total content of phenolic compounds, flavonoids, sugars and antioxidant potential.
Among the compromise solutions, the so-called super compromise solution also called the best efficient solution [76] was identified. This was the solution whose Euclidean distance from the ideal point of Utopia was the smallest among all analyzed points of the set. Such a solution had coordinates x1comp = 0.0750 g/mL, x2comp = 9.0000 min and x3comp = 214.2857 W. At this stage, it should be emphasized that Pareto sets are particularly extremely useful in understanding the trade-off relationships between different objectives and criteria in a multi-objective problem [77,78].
Figure 14 shows a graphical visualization of the sets of preferred solutions in the context of the compromise solutions. In fact, the choice of path in post-optimization interpretation will be the result of the knowledge, experience and preferences of specific decision makers. Only the combination of mathematical methods and optimization procedures with knowledge of processes, technologies or apparatus or industry capabilities will allow informed control of the extraction process for increased extraction of bioactive compounds.
However, it should be emphasized that the challenge associated with the articulation of preferences by decision makers is a current research problem. According to Wang et al. [79], only by building a practical bridge between the process designer’s preferences and knowledge and optimization capabilities and procedures will a complete decision-making process be achieved [80].

4. Conclusions

The research focused on the design, analysis and optimization of an environmentally friendly ultrasonic-assisted extraction using water as an eco-friendly solvent for the plant matrix in the form of Levisticum officinale roots. This approach will enable future use of the extracts in various industries including food, cosmetics and pharmaceuticals. In addition, the resulting post-extracted plant material can be further and safely revalorized, due to the use of water as a solvent. The study showed that the total pool of phenolic compounds and flavonoids, as well as the antioxidant potential, increased with prolongation of the extraction process until a critical time value was reached, after which the analyzed indicators already assumed a similar constant value. A similar relationship was noted when increasing the biomass ratio of Levisticum officinale roots to water and the power of ultrasound. Only in the case of reducing sugars, the highest efficiency of their extraction was found when the boundary analyzed process conditions were applied. Based on the Pareto-optimal solution sets, it was found that to maximize the criteria aqueous extraction should be carried out at a Levisticum officinale biomass/solvent ratio of 0.0643 g/mL for a time of 8.1429 to 9.0000 min, with ultrasound assistance of 162.8571 to 201.4286 W. Pareto set reduction and the use of the so-called smart Pareto approach made it possible to determine subsets of preferred solutions. In the optimal subsets, it was noted that, for the increased extraction efficiency of TPC, TFC and TAA, the extraction procedure could be carried out in 8.5714 min, with biomass/solvent ratios of 0.0679, 0.0714, 0.0750 g/mL and ultrasound power of 201.4286, 214.2857 and 188.5714 W. In contrast, the second option in this subset indicates an edge extraction time of 9 min, a Levisticum officinale root/water ratio of 0.0643 to 0.0750 g/mL and ultrasound power of 175.7143 to 240.0000 W. Among the compromise solutions, the so-called “best efficient solution” was indicated The solution for which the Euclidean distance from the ideal point of Utopia was the smallest (among all analyzed points of the collection) had coordinates x1comp = 0.0750 g/mL, x2comp = 9.0000 min and x3comp = 214.2857 W. The novelty and originality of the presented research is the design and optimization of balanced extraction, assisted using ultrasound, for maximizing the yield of the extracted valuable bioactive compounds, with the identification of Pareto-optimal, preferred and compromise solutions. The results obtained will provide a valuable tool to assist in the decision-making process of controlling such an extraction process, assuming that there is a possibility of increasing the scale of industrial processing of Levisticum officinale roots into extracts with added value from the point of view of bioactive compounds.

Author Contributions

Conceptualization, M.P. and S.K.; methodology, M.P.; software, M.P.; validation, M.P., S.K. and A.B.; formal analysis, M.P.; investigation, M.P.; resources, M.P.; data curation, M.P.; writing—original draft preparation, M.P.; writing—review and editing, M.P., S.K. and A.B.; visualization, M.P. and S.K.; supervision, S.K.; project administration, S.K. and A.B. All authors have read and agreed to the published version of the manuscript.

Funding

This research received no external funding.

Data Availability Statement

The data presented in this study are available on request from the corresponding author.

Conflicts of Interest

Author Michał Plawgo was employed by the company Future Production AS. The remaining authors declare that the research was conducted in the absence of any commercial or financial relationships that could be construed as a potential conflict of interest.

References

  1. Li, D.C.; Jiang, J.G. Optimization of the microwave-assisted extraction conditions of tea polyphenols from green tea. Int. J. Food Sci. Nutr. 2010, 61, 837–845. [Google Scholar] [CrossRef] [PubMed]
  2. Lee, L.S.; Lee, N.; Kim, Y.H.; Lee, C.H.; Hong, S.P.; Jeon, Y.W.; Kim, Y.E. Optimization of ultrasonic extraction of phenolic antioxidants from green tea using response surface methodology. Molecules 2013, 18, 13530–13545. [Google Scholar] [CrossRef]
  3. Chang, C.J.; Chiu, K.L.; Chen, Y.L.; Chang, C.Y. Separation of catechins from green tea using carbon dioxide extraction. Food Chem. 2000, 68, 109–113. [Google Scholar] [CrossRef]
  4. Jun, X.; Deji, S.; Ye, L.; Rui, Z. Comparison of in vitro antioxidant activities and bioactive components of green tea extracts by different extraction methods. Int. J. Pharm. 2011, 408, 97–101. [Google Scholar] [CrossRef] [PubMed]
  5. Barba, F.J.; Zhu, Z.; Koubaa, M.; Sant’Ana, A.S.; Orlien, V. Green alternative methods for the extraction of antioxidant bioactive compounds from winery wastes and by-products: A review. Trends Food Sci. Technol. 2016, 49, 96–109. [Google Scholar] [CrossRef]
  6. Banerjee, S.; Chatterjee, J. Efficient extraction strategies of tea (Camellia sinensis) biomolecules. J. Food Sci. Technol. 2015, 52, 3158–3168. [Google Scholar] [CrossRef] [PubMed]
  7. Ayyildiz, S.S.; Karadeniz, B.; Sagcan, N.; Bahar, B.; Us, A.A.; Alasalvar, C. Optimizing the extraction parameters of epigallocatechin gallate using conventional hot water and ultrasound assisted methods from green tea. Food Bioprod. Process. 2018, 111, 37–44. [Google Scholar] [CrossRef]
  8. Rocha, J.C.G.; Procopio, F.R.; Mendonça, A.C.; Vieira, L.M.; Perrone, I.T.; Barros, A.R.; Stringheta, P.C. Optimization of ultrasound-assisted extraction of phenolic compounds from jussara (Euterpe edulis M.) and blueberry (Vaccinium myrtillus) fruits. Food Sci. Technol. 2018, 38, 45–53. [Google Scholar] [CrossRef]
  9. Irakli, M.; Chatzopoulou, P.; Ekateriniadou, L. Optimization of ultrasound-assisted extraction of phenolic compounds: Oleuropein, phenolic acids, phenolic alcohols and flavonoids from olive leaves and evaluation of its antioxidant activities. Ind. Crops Prod. 2018, 124, 382–388. [Google Scholar] [CrossRef]
  10. Chanioti, S.; Tzia, C. Optimization of ultrasound-assisted extraction of oil from olive pomace using response surface technology: Oil recovery, unsaponifiable matter, total phenol content and antioxidant activity. LWT—Food Sci. Technol. 2017, 79, 178–189. [Google Scholar] [CrossRef]
  11. Kumar, K.; Srivastav, S.; Sharanagat, V.S. Ultrasound assisted extraction (UAE) of bioactive compounds from fruit and vegetable processing by-products: A review. Ultrason. Sonochem. 2021, 70, 105325. [Google Scholar] [CrossRef]
  12. Ivanović, M.; Albreht, A.; Krajnc, P.; Vovk, I.; Razboršek, M.I. Sustainable ultrasound-assisted extraction of valuable phenolics from inflorescences of Helichrysum arenarium L. using natural deep eutectic solvents. Ind. Crops Prod. 2021, 160, 113102. [Google Scholar] [CrossRef]
  13. He, B.; Zhang, L.L.; Yue, X.Y.; Liang, J.; Jiang, J.; Gao, X.L.; Yue, P.X. Optimization of ultrasound-assisted extraction of phenolic compounds and anthocyanins from blueberry (Vaccinium ashei) wine pomace. Food Chem. 2016, 204, 70–76. [Google Scholar] [CrossRef] [PubMed]
  14. Ryu, D.; Koh, E. Optimization of ultrasound-assisted extraction of anthocyanins and phenolic compounds from black soybeans (Glycine max L.). Food Anal. Methods 2019, 12, 1382–1389. [Google Scholar] [CrossRef]
  15. Ferreira, I.C.F.R.; Martins, N.; Barros, L. Phenolic compounds and its bioavailability: In vitro bioactive compounds or health promoters? In Advances in Food and Nutrition Research; Elsevier Inc.: Amsterdam, The Netherlands, 2017; Volume 82, pp. 1–44. [Google Scholar] [CrossRef]
  16. Piccolella, S.; Crescente, G.; Candela, L.; Pacifico, S. Nutraceutical polyphenols: New analytical challenges and opportunities. J. Pharm. Biomed. Anal. 2019, 175, 112774. [Google Scholar] [CrossRef] [PubMed]
  17. Batinić, P.; Čutović, N.; Mrđan, S.; Jovanović, A.A.; Čirić, K.; Marinković, A.; Bugarski, B. The comparison of Ocimum basilicum and Levisticum officinale extracts obtained using different extraction solvents and techniques. Lek. Sirovine 2022, 42, 43. [Google Scholar] [CrossRef]
  18. Chen, C.; You, L.J.; Abbasi, A.M.; Fu, X.; Liu, R.H. Optimization for ultrasound extraction of polysaccharides from mulberry fruits with antioxidant and hyperglycemic activity in vitro. Carbohydr. Polym. 2015, 130, 122–132. [Google Scholar] [CrossRef]
  19. Rodrigues, S.; Pinto, G.A.; Fernandes, F.A. Optimization of ultrasound extraction of phenolic compounds from coconut (Cocos nucifera) shell powder by response surface methodology. Ultrason. Sonochem. 2008, 15, 95–100. [Google Scholar] [CrossRef]
  20. Mozaffarian, V. Flora of Iran; No. 54: Umbelliferae; Publication of Research Institute of Forests and Rangelands; Research Institute of Forests and Rangelands: Tehran, Iran, 2007. [Google Scholar]
  21. Ghaedi, N.; Pouraboli, I.; Askari, N. Antidiabetic properties of hydroalcoholic leaf and stem extract of Levisticum officinale: An implication for α-amylase inhibitory activity of extract ingredients through molecular docking. Iran. J. Pharm. Res. 2020, 19, 231. [Google Scholar] [CrossRef]
  22. Szparaga, A.; Kocira, S.; Kapusta, I.; Zaguła, G. Exploring the agro-potential of extract from Levisticum officinale WDJ Koch in soybean cultivation. Ind. Crops Prod. 2023, 203, 117235. [Google Scholar] [CrossRef]
  23. Szparaga, A. Biostimulating Extracts from Arctium lappa L. As Ecological Additives in Soybean Seed Coating Applications. Agric. Eng. 2023, 27, 1–10. [Google Scholar] [CrossRef]
  24. Szparaga, A.; Kocira, S.; Kapusta, I.; Zaguła, G. Solid–liquid extraction of bioactive compounds as a green alternative for developing novel biostimulant from Linum usitatissimum L. Chem. Biol. Technol. Agric. 2023, 10, 108. [Google Scholar] [CrossRef]
  25. Spréa, R.M.; Fernandes, Â.; Finimundy, T.C.; Pereira, C.; Alves, M.J.; Calhelha, R.C.; Canan, C.; Barros, L.; Amaral, J.S.; Ferreira, I.C. Lovage (Levisticum officinale WDJ Koch) roots: A source of bioactive compounds towards a circular economy. Resources 2020, 9, 81. [Google Scholar] [CrossRef]
  26. Spréa, R.M.; Fernandes, Â.; Calhelha, R.C.; Pereira, C.; Pires, T.C.S.P.; Alves, M.J.; Canan, C.; Barros, L.; Amaral, J.S.; Ferreira, I.C.F.R. Chemical and bioactive characterization of the aromatic plant Levisticum officinale W.D.J. Koch: A comprehensive study. Food Funct. 2020, 11, 1292–1303. [Google Scholar] [CrossRef] [PubMed]
  27. Zhang, H.; Birch, J.; Pei, J.; Mohamed Ahmed, I.A.; Yang, H.; Dias, G.; Abd El-Aty, A.M.; Bekhit, A.E.-D. Identification of Six Phytochemical Compounds from Asparagus officinalis L. Root Cultivars from New Zealand and China Using UAE-SPE-UPLC-MS/MS: Effects of Extracts on H2O2-Induced Oxidative Stress. Nutrients 2019, 11, 107. [Google Scholar] [CrossRef] [PubMed]
  28. Szparaga, A.; Kocira, S.; Findura, P.; Kapusta, I.; Zaguła, G.; Świeca, M. Uncovering the Multi-Level Response of Glycine max L. to the Application of Allelopathic Biostimulant from Levisticum officinale Koch. Sci. Rep. 2021, 11, 15360. [Google Scholar] [CrossRef] [PubMed]
  29. Wen, C.; Zhang, J.; Zhang, H.; Dzah, C.S.; Zandile, M.; Duan, Y.; Ma, H.; Luo, X. Advances in ultrasound assisted extraction of bioactive compounds from cash crops—A review. Ultrason. Sonochem. 2018, 48, 538–549. [Google Scholar] [CrossRef] [PubMed]
  30. Tamreihao, K.; Devi, L.J.; Khunjamayum, R.; Mukherjee, S.; Ashem, R.S.; Ningthoujam, D.S. Biofertilizing potential of feather hydrolysate produced by indigenous keratinolytic Amycolatopsis sp. MBRL 40 for rice cultivation under field conditions. Biocatal. Agric. Biotechnol. 2017, 10, 317–320. [Google Scholar] [CrossRef]
  31. Colla, G.; Hoagland, L.; Ruzzi, M.; Cardarelli, M.; Bonini, P.; Canaguier, R.; Rouphael, Y. Biostimulant action of protein hydrolysates: Unraveling their effects on plant physiology and microbiome. Front. Plant Sci. 2017, 8, 2202. [Google Scholar] [CrossRef]
  32. Kaur, M.; Bhari, R.; Singh, R.S. Chicken feather waste-derived protein hydrolysate as a potential biostimulant for cultivation of mung beans. Biologia 2021, 76, 1807–1815. [Google Scholar] [CrossRef]
  33. Mugwagwa, L.R.; Chimphango, A.F.A. Box-Behnken design based multi-objective optimisation of sequential extraction of pectin and anthocyanins from mango peels. Carbohydr. Polym. 2019, 219, 29–38. [Google Scholar] [CrossRef]
  34. Iqbal, S.; Younas, U.; Sirajuddin; Chan, K.W.; Sarfraz, R.A.; Uddin, M.K. Proximate Composition and Antioxidant Potential of Leaves from Three Varieties of Mulberry (Morus sp.): A Comparative Study. Int. J. Mol. Sci. 2012, 13, 6651–6664. [Google Scholar] [CrossRef]
  35. Krivorotova, T.; Sereikaite, J. Determination of fructan exohydrolase activity in the crude extracts of plants. Electron. J. Biotechnol. 2014, 17, 329–333. [Google Scholar] [CrossRef]
  36. Rocha, M.S.; Rocha, L.C.S.; Feijó, M.B.D.S.; Marotta, P.L.L.D.S.; Mourão, S.C. Multiobjective optimization of the flaxseed mucilage extraction process using normal-boundary intersection approach. Br. Food J. 2021, 123, 3805–3823. [Google Scholar] [CrossRef]
  37. Curve Fitting Toolbox for Use with Matlab. The MathWorks Inc., Natick. Available online: http://cda.psych.uiuc.edu/matlab_pdf/curvefit.pdf (accessed on 14 November 2024).
  38. Gómez-Salazar, J.A.; Patlán-González, J.; Sosa-Morales, M.E.; Segovia-Hernandez, J.G.; Sánchez-Ramírez, E.; Ramírez-Márquez, C. Multi-objective optimization of sustainable red prickly pear (Opuntia streptacantha) peel drying and biocompounds extraction using a hybrid stochastic algorithm. Food Bioprod. Process. 2022, 132, 155–166. [Google Scholar] [CrossRef]
  39. Infantes, M.; Naranjo-Pérez, J.; Sáez, A.; Jiménez-Alonso, J.F. Determining the best Pareto-solution in a multi-objective approach for model updating. In Proceedings of the IABSE Symposium, Towards a Resilient Built Environment–Risk and Asset Management, Guimarães, Portugal, 27–29 March 2019; pp. 523–530. [Google Scholar]
  40. Das, I. A preference ordering among various Pareto optimal alternatives. Struct. Optim. 1999, 18, 30–35. [Google Scholar] [CrossRef]
  41. Foroughi, A.H.; Razavi, M.J. Multi-objective shape optimization of bone scaffolds: Enhancement of mechanical properties and permeability. Acta Biomater. 2022, 146, 317–340. [Google Scholar] [CrossRef] [PubMed]
  42. Ahmed, T.; Rana, M.R.; Maisha, M.R.; Sayem, A.S.M.; Rahman, M.; Ara, R. Optimization of ultrasound-assisted extraction of phenolic content & antioxidant activity of hog plum (Spondias pinnata L. f. kurz) pulp by response surface methodology. Heliyon 2022, 8, e11109. [Google Scholar] [CrossRef]
  43. Bouloumpasi, E.; Skendi, A.; Christaki, S.; Biliaderis, C.C.; Irakli, M. Optimizing conditions for the recovery of lignans from sesame cake using three green extraction methods: Microwave-, ultrasound-and accelerated-assisted solvent extraction. Ind. Crops Prod. 2024, 207, 117770. [Google Scholar] [CrossRef]
  44. Nikolić, V.G.; Troter, D.Z.; Savić, I.M.; Gajić, I.M.S.; Zvezdanović, J.B.; Konstantinović, I.B.; Konstantinović, S.S. Design and optimization of “greener” and sustainable ultrasound-assisted extraction of valuable bioactive compounds from common centaury (Centaurium erythraea Rafn) aerial parts: A comparative study using aqueous propylene glycol and ethanol. Ind. Crops Prod. 2023, 192, 116070. [Google Scholar] [CrossRef]
  45. Brahmi, F.; Blando, F.; Sellami, R.; Mehdi, S.; De Bellis, L.; Negro, C.; Haddadi-Guemghar, H.; Madani, K.; Makhlouf-Boulekbache, L. Optimization of the conditions for ultrasound-assisted extraction of phenolic compounds from Opuntia ficus-indica [L.] Mill. flowers and comparison with conventional procedures. Ind. Crops Prod. 2022, 184, 114977. [Google Scholar] [CrossRef]
  46. Medina-Torres, N.; Ayora-Talavera, T.; Espinosa-Andrews, H.; Sánchez-Contreras, A.; Pacheco, N. Ultrasound assisted extraction for the recovery of phenolic compounds from vegetable sources. Agronomy 2017, 7, 47. [Google Scholar] [CrossRef]
  47. Kutlu, N.; Kamiloglu, A.; Elbir, T. Optimization of Ultrasound Extraction of Phenolic Compounds from Tarragon (Artemisia dracunculus L.) Using Box–Behnken Design. Biomass Convers. Biorefin. 2022, 12, 5397–5408. [Google Scholar] [CrossRef]
  48. Garcia-Mendoza, M.D.P.; Espinosa-Pardo, F.A.; Savoire, R.; Etchegoyen, C.; Harscoat-Schiavo, C.; Subra-Paternault, P. Recovery and antioxidant activity of phenolic compounds extracted from walnut press-cake using various methods and conditions. Ind. Crops Prod. 2021, 167, 113546. [Google Scholar] [CrossRef]
  49. Assefa, A.D.; Saini, R.K.; Keum, Y.S. Extraction of antioxidants and flavonoids from yuzu (Citrus junos Sieb ex Tanaka) peels: A response surface methodology study. J. Food Meas. Charact. 2017, 11, 364–379. [Google Scholar] [CrossRef]
  50. Babotă, M.; Frumuzachi, O.; Gâvan, A.; Iacoviță, C.; Pinela, J.; Barros, L.; Ferreira, I.C.; Zhang, L.; Lucini, L.; Rocchetti, G.; et al. Optimized ultrasound-assisted extraction of phenolic compounds from Thymus comosus Heuff. ex Griseb. et Schenk (wild thyme) and their bioactive potential. Ultrason. Sonochem. 2022, 84, 105954. [Google Scholar] [CrossRef]
  51. Dawidowicz, A.; Wianowska, D.; Olszowy, M. On practical problems in estimation of antioxidant activity of compounds by DPPH method (Problems in estimation of antioxidant activity). Food Chem. 2002, 131, 1037–1043. [Google Scholar] [CrossRef]
  52. Pekal, A.; Pyrzynska, K. Effect of pH and metal ions on DPPH radical scavenging activity of tea. Int. J. Food Sci. Nutr. 2015, 66, 58–62. [Google Scholar] [CrossRef]
  53. Dawidowicz, A.L.; Olszowy, M. Mechanism change in estimating of antioxidant activity of phenolic compounds. Talanta 2012, 97, 312–317. [Google Scholar] [CrossRef]
  54. Bolling, B.W.; Chen, Y.-Y.; Kamil, A.G.; Chen, C.Y.O. Assay dilution factors confound measures of total antioxidant capacity in polyphenol-rich juices. J. Food Sci. 2012, 77, H69–H75. [Google Scholar] [CrossRef]
  55. Ferri, M.; Gianotti, A.; Tassoni, A. Optimisation of assay conditions for the determination of antioxidant capacity and polyphenols in cereal food components. J. Food Compost. Anal. 2013, 30, 94–101. [Google Scholar] [CrossRef]
  56. Mondal, S.C.; Lee, W.H.; Eun, J.B. Ultrasonic extraction of reducing sugar and polyphenols from burdock (Arctium lappa L.) root waste and evaluation of antioxidants and α-glucosidase inhibition activity. Biomass Convers. Biorefin. 2023, 1, 1–18. [Google Scholar] [CrossRef]
  57. AlYammahi, J.; Hai, A.; Krishnamoorthy, R.; Arumugham, T.; Hasan, S.W.; Banat, F. Ultrasound-assisted extraction of highly nutritious date sugar from date palm (Phoenix dactylifera) fruit powder: Parametric optimization and kinetic modeling. Ultrason. Sonochem. 2022, 88, 106107. [Google Scholar] [CrossRef]
  58. Nuerxiati, R.; Abuduwaili, A.; Mutailifu, P.; Wubulikasimu, A.; Rustamova, N.; Jingxue, C.; Aisa, H.A.; Yili, A. Optimization of ultrasonic-assisted extraction, characterization and biological activities of polysaccharides from Orchis chusua D. Don (Salep). Int. J. Biol. Macromol. 2019, 141, 431–443. [Google Scholar] [CrossRef] [PubMed]
  59. da Silva Donadone, D.B.; Giombelli, C.; Silva, D.L.G.; Stevanato, N.; da Silva, C.; Bolanho Barros, B.C. Ultrasound-assisted extraction of phenolic compounds and soluble sugars from the stem portion of peach palm. J. Food Process. Preserv. 2020, 44, e14636. [Google Scholar] [CrossRef]
  60. Hu, H.; Zhao, Q.; Pang, Z.; Xie, J.; Lin, L.; Yao, Q. Optimization extraction, characterization and anticancer activities of polysaccharides from mango pomace. Int. J. Biol. Macromol. 2018, 117, 1314–1325. [Google Scholar] [CrossRef] [PubMed]
  61. Wong, S.P.; Lai, P.L.; Jen, H.W.K. Antioxidant activities of aqueous extracts of selected plants. Food Chem. 2006, 99, 775–783. [Google Scholar] [CrossRef]
  62. Othman, A.; Mukhtar, N.J.; Ismail, N.S.; Chang, S.K. Phenolics, flavonoids content and antioxidant activities of 4 Malaysian herbal plants. Int. Food Res. J. 2014, 21, 759–766. [Google Scholar]
  63. Paixao, N.; Perestrelo, R.; Marques, J.; Camara, J. Relationship between antioxidant capacity and total phenolic content of red, rosé and white wines. Food Chem. 2007, 105, 204–214. [Google Scholar] [CrossRef]
  64. Thoo, Y.Y.; Ho, S.K.; Liang, J.Y.; Ho, C.W.; Tan, C.P. Effects of binary solvent extraction system, extraction time and extraction temperature on phenolic antioxidants and antioxidant capacity from mengkudu (Morinda citrifolia). Food Chem. 2010, 120, 290–295. [Google Scholar] [CrossRef]
  65. Miliauskas, G.; Venskutonis, P.R.; Van Beek, T.A. Screening of radical scavenging activity of some medicinal and aromatic plant extracts. Food Chem. 2004, 85, 231–237. [Google Scholar] [CrossRef]
  66. Muflihah, Y.M.; Gollavelli, G.; Ling, Y.-C. Correlation Study of Antioxidant Activity with Phenolic and Flavonoid Compounds in 12 Indonesian Indigenous Herbs. Antioxidants 2021, 10, 1530. [Google Scholar] [CrossRef]
  67. Woinaroschy, A.; Damşa, F. Multiobjective Optimization of Total Monomeric Anthocyanins and Total Flavonoids Contents in Ultrasound-Assisted Extraction from Purple Potato Tubers. J. Food Process Eng. 2017, 40, e12422. [Google Scholar] [CrossRef]
  68. Rangaiah, G.P. Multi-Objective Optimization: Techniques and Applications in Chemical Engineering; World Scientific: Singapore, 2009. [Google Scholar]
  69. Kao, G.K.; Jacobson, S.H. Finding preferred subsets of Pareto optimal solutions. Comput. Optim. Appl. 2008, 40, 73–95. [Google Scholar] [CrossRef]
  70. Kasprzak, E.M.; Lewis, K.E. An approach to facilitate decision tradeoffs in Pareto solution sets. J. Eng. Valuat. Cost Anal. 2000, 3, 173–187. [Google Scholar]
  71. Mattson, C.A.; Mullur, A.A.; Messac, A. Smart Pareto filter: Obtaining a minimal representation of multiobjective design space. Eng. Optim. 2004, 36, 721–740. [Google Scholar] [CrossRef]
  72. Kasprzak, E.M.; Lewis, K.E. Pareto analysis in multiobjective optimization using the collinearity theorem and scaling method. Struct. Multidiscip. Optim. 2001, 22, 208–218. [Google Scholar] [CrossRef]
  73. Messac, A.; Ismail-Yahaya, A.; Mattson, C.A. The normalized normal constraint method for generating the Pareto frontier. Struct. Multidiscip. Optim. 2003, 25, 86–98. [Google Scholar] [CrossRef]
  74. Messac, A.; Mattson, C.A. Normal constraint method with guarantee of even representation of complete Pareto frontier. AIAA J. 2004, 42, 2101–2111. [Google Scholar] [CrossRef]
  75. Gebreel, A.Y. The Best Compromise Solution for Multi-objective Programming Problems. Int. J. Glob. Oper. Res. 2023, 4, 189–204. [Google Scholar] [CrossRef]
  76. Gebreel, A.Y. Solving the multi-objective convex programming problems to get the best compromise solution. Aust. J. Basic Appl. Sci. 2021, 15, 17–29. [Google Scholar]
  77. Hancock, B.J.; Mattson, C.A. The smart normal constraint method for directly generating a smart Pareto set. Struct. Multidiscip. Optim. 2013, 48, 763–775. [Google Scholar] [CrossRef]
  78. Machuca, E.; Mandow, L.; Galand, L. An evaluation of best compromise search in graphs. In Conference of the Spanish Association for Artificial Intelligence, Proceedings of the 15th Conference of the Spanish Association for Artificial Intelligence, CAEPIA 2013, Madrid, Spain, 17–20 September 2013; Springer: Berlin/Heidelberg, Germany, 2013; pp. 1–11. [Google Scholar] [CrossRef]
  79. Wang, H.; Olhofer, M.; Jin, Y. A mini-review on preference modeling and articulation in multi-objective optimization: Current status and challenges. Complex Intell. Syst. 2017, 3, 233–245. [Google Scholar] [CrossRef]
  80. Reynoso-Meza, G.; Sanchis, J.; Blasco, X.; Garcia-Nieto, S. Physical programming for preference driven evolutionary multi-objective optimization. Appl. Soft Comput. 2014, 24, 341–362. [Google Scholar] [CrossRef]
Figure 1. The schematic chart of multi-objective optimization of ultrasound-assisted extraction (UAE) process.
Processes 12 00275 g001
Figure 2. Methodology of smart Pareto.
Processes 12 00275 g002
Figure 3. Illustration of the Pareto front and the Utopia point.
Processes 12 00275 g003
Figure 4. Experimental and predicted values (regression function with interpolation) for TPC in function of decision variables x1 (sample/solvent ratio, g/mL) and x3 (time, min) for (A) ultrasound power x2 = 60 W, (B) ultrasound power x2 = 120 W, (C) ultrasound power x2 = 240 W.
Processes 12 00275 g004
Figure 5. Interpolation and regression function of criterion K2 (TFC, total flavonoid content) as a function of process parameters (decision variables) x1 (sample/solvent ratio (g/mL)) and x3 (time (min)) for (A) x2 = 60 W (ultrasound power), (B) x2 = 120 W (ultrasound power), (C) x2 = 240 W (ultrasound power).
Processes 12 00275 g005
Figure 6. Interpolation and regression function of criterion K3 (TAA, total antioxidant activity) as a function of process parameters (decision variables) x1 (sample/solvent ratio (g/mL)) and x3 (time (min)) for (A) x2 = 60 W (ultrasound power), (B) x2 = 120 W (ultrasound power), (C) x2 = 240 W (ultrasound power).
Processes 12 00275 g006
Figure 7. Interpolation and regression function of criterion K4 (RSC, reducing sugar content) as a function of process parameters (decision variables) x1 (sample/solvent ratio (g/mL)) and x3 (time (min)) for (A) x2 = 60 W (ultrasound power), (B) x2 = 120 W (ultrasound power), (C) x2 = 240 W (ultrasound power).
Processes 12 00275 g007
Figure 8. Pareto solution sets for maximizing regression equations for the relationship between criteria K1 (TPC total phenolic content—maximized), K2 (TFC total flavonoid content—maximized), K3 (TAA total antioxidant activity—maximized). Red color indicates Pareto-optimal solutions (Pareto front); blue color indicates dominated solutions.
Processes 12 00275 g008
Figure 9. Pareto solution sets for maximizing regression equations for the relationship between criteria K1 (TPC total phenolic content—maximized), K2 (TFC total flavonoid content—maximized), K4 (RSC reducing sugar content). Red color indicates Pareto-optimal solutions; blue color indicates dominated solutions.
Processes 12 00275 g009
Figure 10. Pareto solution sets for maximizing regression equations as a function of decision variables x1 (sample/solvent ratio), x2 (ultrasound power) and x3 (time). Red color indicates Pareto-optimal solutions; blue color indicates dominated solutions.
Processes 12 00275 g010
Figure 11. Visualization of smart Pareto solutions in the context of Pareto front optimal solutions in the decision variable spaces x1 (sample/solvent ratio), x2 (ultrasound power) and x3 (time). Red color indicates Pareto-optimal solutions; blue color indicates dominated solutions; black dots/circles indicate smart Pareto solutions (preferred solutions).
Processes 12 00275 g011
Figure 12. Sets of trade-off solutions based on distance from the Utopia point as a function of decision variables (A)—x1 (sample/solvent ratio) and x2 (ultrasound power), (B)—x2 (ultrasound power) and x3 (time), (C)—x1 (sample/solvent ratio) and x3 (time). Green color indicates compromise solutions; blue color indicates dominated solutions.
Processes 12 00275 g012
Figure 13. Illustration of trade-off solutions based on distance from the Utopia point as a function of decision variables x1 (sample/solvent ratio), x2 (ultrasound power) and x3 (time). Green color indicates compromise solutions; blue color indicates dominated solutions.
Processes 12 00275 g013
Figure 14. Visualization of preferred solutions vs. compromise solutions x1 (sample/solvent ratio), x2 (ultrasound power) and x3 (time). Red color—smart Pereto solution; Green color—compromise solutions; blue color—dominated solutions.
Processes 12 00275 g014
Table 1. The predicted quadratic polynomial models for properties extracted from Levisticum officinale polyphenols, flavonoids, antioxidant potential and reducing sugars.
SourceTotal Phenolic Content (TPC)
(mg GAE/g)
Total Flavonoids Content (TFC)
(μmol CAT/L)
Total Antioxidant Activity (TAA)
(DPPH—%inh)
Reducing Sugar Content (RSC)
(g GE/L)
Absolute term, a0166.92−12622.94.02
Linear
a14852.110,707.82122.2587.53
a2−0.9560.29−0.330.02
a3−20.53344.8−5.97−1.79
Interaction
a45.582.890.320.035
a5213.7105.3−2.2221.12
a60.0430.0450.0120.003
Quadratic
a7−49,195.96−87,147.45−16,726.9−1197.48
a80.0012−0.0026−0.00029−0.0001
a90.66−3.870.3870.059
Indicators
MSE373.841308.2816.841.11
R-square0.910.880.930.91
Adjusted R square0.860.8040.8890.854
F-statistic
sse6.36 × 1032.22 × 104286.148218.8592
F-value18.2112.79624.000417.9322
ssr6.13 × 1041.51 × 1053.64 × 1031.79 × 102
p-value4.74 × 10−76.05 × 10−65.91 × 10−85.31 × 10⁻⁷
Legend: sse—sum of squared errors (residuals), expressed as a numerical value; ssr—the sum of squares due to regression (SSR) or explained sum of squares (ESS) is the sum of the differences between the predicted value and the mean of the dependent variable; p-value—a vector of p-values for testing whether elements of b are 0.
Table 2. Optimal values of decision variables—Pareto front solutions.
x1opt (Sample/Solvent Ratio)x3opt (Time)x2opt (Ultrasound Power)x1opt (Sample/Solvent Ratio)x3opt (Time)x2opt (Ultrasound Power)
0.06073.000060.00000.06798.5714188.5714
0.06073.000072.85710.06799.0000188.5714
0.06433.000060.00000.06798.5714201.4286
0.06433.000072.85710.06799.0000201.4286
0.06438.1429162.85710.06799.0000214.2857
0.06438.5714162.85710.06799.0000227.1429
0.06439.0000162.85710.06799.0000240.0000
0.06438.5714175.71430.07147.7143150.0000
0.06439.0000175.71430.07147.7143162.8571
0.06438.5714188.57140.07148.1429162.8571
0.06439.0000188.57140.07148.5714162.8571
0.06439.0000201.42860.07148.1429175.7143
0.06797.7143150.00000.07148.5714175.7143
0.06797.7143162.85710.07149.0000175.7143
0.06798.1429162.85710.07148.1429188.5714
0.06798.5714162.85710.07148.5714188.5714
0.06797.7143175.71430.07149.0000188.5714
0.06798.1429175.71430.07148.5714201.4286
0.06798.5714175.71430.07149.0000201.4286
0.06799.0000175.71430.07148.5714214.2857
0.06798.1429188.57140.07149.0000214.2857
Table 3. Set of preferred solutions from Pareto fronts—smart Pareto approach.
x1 (Sample/Solvent Ratio)x3 (Time)x2 (Ultrasound Power)x1 (Sample/Solvent Ratio)x3 (Time)x2 (Ultrasound Power)
0.06439.0000188.57140.07149.0000201.4286
0.06439.0000201.42860.07148.5714214.2857
0.06799.0000175.71430.07149.0000214.2857
0.06799.0000188.57140.07149.0000227.1429
0.06798.5714201.42860.07149.0000240.0000
0.06799.0000201.42860.07509.0000175.7143
0.06799.0000214.28570.07508.5714188.5714
0.06799.0000227.14290.07509.0000188.5714
0.06799.0000240.00000.07509.0000201.4286
0.07149.0000175.71430.07509.0000214.2857
0.07148.5714188.57140.07509.0000227.1429
0.07149.0000188.57140.07509.0000240.0000
0.07148.5714201.4286
Table 4. Compromise solutions based on distance from Utopia point.
x1 (Sample/Solvent Ratio)x3 (Time)x2 (Ultrasound Power)x1 (Sample/Solvent Ratio)x3 (Time)x2 (Ultrasound Power)
0.06079.0000162.85710.07149.0000137.1429
0.06079.0000175.71430.07148.1429150.0000
0.06079.0000188.57140.07148.5714150.0000
0.06079.0000201.42860.07149.0000150.0000
0.06079.0000214.28570.07148.1429162.8571
0.06079.0000227.14290.07148.5714162.8571
0.06079.0000240.00000.07149.0000162.8571
0.06439.0000124.28570.07148.1429175.7143
0.06439.0000137.14290.07148.5714175.7143
0.06439.0000150.00000.07149.0000175.7143
0.06438.5714162.85710.07148.1429188.5714
0.06439.0000162.85710.07148.5714188.5714
0.06438.5714175.71430.07149.0000188.5714
0.06439.0000175.71430.07148.1429201.4286
0.06438.5714188.57140.07148.5714201.4286
0.06439.0000188.57140.07149.0000201.4286
0.06438.5714201.42860.07148.1429214.2857
0.06439.0000201.42860.07148.5714214.2857
0.06438.5714214.28570.07149.0000214.2857
0.06439.0000214.28570.07148.1429227.1429
0.06438.5714227.14290.07148.5714227.1429
0.06439.0000227.14290.07149.0000227.1429
0.06438.5714240.00000.07148.1429240.0000
0.06439.0000240.00000.07148.5714240.0000
0.06799.000098.57140.07149.0000240.0000
0.06799.0000111.42860.07509.000085.7143
0.06798.5714124.28570.07509.000098.5714
0.06799.0000124.28570.07508.5714111.4286
0.06798.5714137.14290.07509.0000111.4286
0.06799.0000137.14290.07508.5714124.2857
0.06798.5714150.00000.07509.0000124.2857
0.06799.0000150.00000.07508.1429137.1429
0.06798.5714162.85710.07508.5714137.1429
0.06799.0000162.85710.07509.0000137.1429
0.06798.1429175.71430.07508.1429150.0000
0.06798.5714175.71430.07508.5714150.0000
0.06799.0000175.71430.07509.0000150.0000
0.06798.1429188.57140.07508.1429162.8571
0.06798.5714188.57140.07508.5714162.8571
0.06799.0000188.57140.07509.0000162.8571
0.06798.1429201.42860.07508.1429175.7143
0.06798.5714201.42860.07508.5714175.7143
0.06799.0000201.42860.07509.0000175.7143
0.06798.1429214.28570.07508.1429188.5714
0.06798.5714214.28570.07508.5714188.5714
0.06799.0000214.28570.07509.0000188.5714
0.06798.1429227.14290.07508.1429201.4286
0.06798.5714227.14290.07508.5714201.4286
0.06799.0000227.14290.07509.0000201.4286
0.06798.1429240.00000.07508.1429214.2857
0.06798.5714240.00000.07508.5714214.2857
0.06799.0000240.00000.07509.0000214.2857
0.07149.000085.71430.07508.1429227.1429
0.07149.000098.57140.07508.5714227.1429
0.07148.5714111.42860.07509.0000227.1429
0.07149.0000111.42860.07508.1429240.0000
0.07148.5714124.28570.07508.5714240.0000
0.07149.0000124.28570.07509.0000240.0000
0.07148.5714137.1429
Disclaimer/Publisher’s Note: The statements, opinions and data contained in all publications are solely those of the individual author(s) and contributor(s) and not of MDPI and/or the editor(s). MDPI and/or the editor(s) disclaim responsibility for any injury to people or property resulting from any ideas, methods, instructions or products referred to in the content.

