Article

Experimental Study on Gas–Liquid Two-Phase Flow Upstream and Downstream of U-Bends

1
School of Thermal Engineering, Shandong Jianzhu University, Jinan 250101, China
2
School of Energy and Power Engineering, Shandong University, Jinan 250061, China
3
School of Mechanical and Electronic Engineering, Shandong Jianzhu University, Jinan 250101, China
4
Shandong Huatai Paper Co., Ltd., Dongying 257335, China
5
Shandong Yellow Triangle Biotechnology Industry Research Institute Co., Ltd., Dongying 257345, China
*
Authors to whom correspondence should be addressed.
Processes 2024, 12(2), 277; https://doi.org/10.3390/pr12020277
Submission received: 19 November 2023 / Revised: 9 January 2024 / Accepted: 17 January 2024 / Published: 26 January 2024

Abstract

:
In this study, the influence of U-bends on the flow and pressure propagation characteristics of a gas–liquid two-phase flow in upstream and downstream straight pipes was investigated experimentally. The superficial velocities of the gas and liquid are 0.18–25.11 m/s and 0.20–1.98 m/s, respectively, covering plug flow, slug flow, and annular flow. The experiments were conducted in U-tubes with inner diameters of 9 mm and 12 mm and with a curvature ratio of 8.33. The U-tube was C-shaped. The pressure fluctuations at the axial measurement points of the straight tubes were measured. Flow images of the distal straight tubes and U-bends were obtained. The disturbance from U-bends in the two-phase flow in the vicinity of the bend is very obvious. The perturbation from U-bends in the fluid in the adjacent straight tubes is highly related to the incoming flow pattern. The slug flow has the most significant influence, whereas the effects of the plug and annular flows are small. Fundamentally, it mainly depends on the weight relationship between the gravity, centrifugal force, and inertial force of the gas–liquid two-phase fluid. The pressure fluctuation propagates in the form of a wave with the same dominant frequency in the straight pipes of the U-tube. The pressure pulsation energy in the straight tubes strengthens with decreasing distance from the 180° return bend. In addition, the pressure fluctuation energy downstream of the U-bend is greater than that upstream of the return bend.

1. Introduction

U-shaped tubes are widely used as basic flow and heat transfer components in heat exchangers (such as evaporators, condensers, and steam generators) and two-phase flow pipelines due to their ability to change the flow direction and save space. The centrifugal force, buoyancy, and gravity are applied to the two-phase flow in a U-bend, which produces a secondary vortex flow and a complicated gas–liquid interface distribution. These phenomena not only make the internal fluid in U-bends more complex and changeable but also affect the flow regime, pressure drop, and heat transfer of the fluid in the adjacent straight tube sections. Hence, it is imperative to investigate the flow properties of two-phase flows in U-shaped elbows and the adjacent straight tubes.
Many scholars have investigated the two-phase flow regimes [1,2,3,4,5,6,7,8], gas fraction [3,5,9], and liquid film thickness [10,11,12,13] along the bend itself under various geometrical conditions and flow media. The results indicate that the rearrangement of the gas–liquid interface and the secondary vortex caused by return bends significantly affect the variation in the two-phase flow parameters. This may be because, after entering the bend, the two-phase fluid is impacted by the centrifugal force, which produces a pressure gradient on the cross-section perpendicular to the two-phase flow direction. This resulting pressure gradient results in a secondary flow that is ideally presented as two symmetric Dean vortices.
However, previous studies [14,15,16,17,18,19,20,21,22] suggest that the bending effects can be observed immediately before and after U-bends. In addition, some scholars [14,23,24,25,26,27,28,29,30,31] quantitatively studied the influence length of elbows on the flow characteristics in the vicinity of U-bends. The results showed that the influence lengths of the downstream and upstream sections were 20D–60D and 10D–40D, respectively. The pressure drop coefficient of the refrigerant R12 in the downstream straight tube section of a 180° return bend (D = 8 mm, 2R/D = 3.17 and 6.35) was obtained by Traviss and Rohsenow [14]. The findings indicate that the impact length of U-bends on the pressure drop in the downstream straight pipe can reach 90D. The flow regime and static pressure changes in gas–liquid bubbly fluid in an inversed U-tube (D = 25.4 mm, 2R/D = 4 and 6) were investigated experimentally by Hoang and Davis [23]. The impact on the U-tube’s downstream section was found to be only 9D. This result is 10 times smaller than that of Traviss and Rohsenow, which could be attributed to the greater mass velocity of the water in the experiment. The results showed that the effect of the U-bend on the downstream pressure gradient was about 141D. An investigation of the pressure gradient of the refrigerant R134a in a U-bend (D = 13.4 mm, 2R/D = 9) was conducted by Da Silva Lima and Thome [24]. The outcomes indicated that the U-bend had a 141D influence on the downstream pressure gradient. Moreover, Da Silva Lima and Thome [25] visualized the R134a flow in a U-shaped tube and its adjacent straight tubes in three different directions. The researchers indicated that the influence length of the downstream section was greater under the vertical upward flow. Padilla et al. [26,27] determined the disturbance length by measuring the pressure drop of R134a and HFO-1234yf along the upstream and downstream straight segments of vertical and horizontal U-tubes. Their results show that the influence length of the upstream section is less than 10D, and that of the downstream section is less than 20D. By studying the void fraction and pressure drop along the upstream and downstream sections of the vertical U-bend, de Oliveira et al. [28] found that the influence lengths of the upstream and downstream pressure drop were 40D and 60D, respectively. Kerpel et al. [29] obtained the two-phase flow characteristics in the adjacent region of a U-bend using a capacitance sensor and derived the void fraction and wavelet variance. They demonstrated that the influence length of the elbow in the upstream section was less than 10D and that in the downstream section was more than 30D. Aliyu et al. [30] experimentally investigated the gas–liquid flow properties of an upward flow in a vertical serpentine U-shaped tube (D = 101.6 mm). The results showed that the influence of the return bend on the flow characteristics was significantly reduced at 30D downstream of the U-tube. Later, Ma et al. [31] carried out a study of the perturbation length for the air–water flow upstream and downstream of U-bends and proposed an experimental correlation equation for the influence length within the experimental range.
The fluid pressure drop is an important hydraulic characteristic of the two-phase flow. Many scholars have studied the macroscopic pressure drop characteristics in straight channels [32,33,34] and curved pipes [35,36,37,38]. In addition to the above macroscopic characteristics of the pressure drop, some researchers have also studied the pressure fluctuation performance under different flow and structural conditions [39,40]. However, there are few studies on the pressure drop and pressure propagation characteristics in the adjacent straight tubes of U-bends.
In general, most of these works studied the disturbance length of the U-bend based on the flow characteristics along the upstream and downstream straight pipes, but the study of factors affecting the degree of fluid interference was not comprehensive enough. Therefore, more in-depth studies are required. In addition, the macroscopic characteristics of the pressure drop and pressure propagation in the adjacent straight pipes of U-bends also need further study.
This work aimed to continue to investigate the influence of a U-bend on gas–liquid two-phase flow characteristics along upstream and downstream straight pipes. Specifically, the aims of this work are as follows: (1) to compare the frictional pressure gradient in straight pipe sections close and distal to the U-bend; (2) to analyze the relationship between the incoming flow pattern and the disturbance degree of the U-bend; (3) to determine the axial propagation characteristics of the pressure pulsation. These studies are helpful for understanding the influence of U-bends on the fluid in their adjacent straight tubes and provide a theoretical basis for the design of two-phase flow heat exchangers.

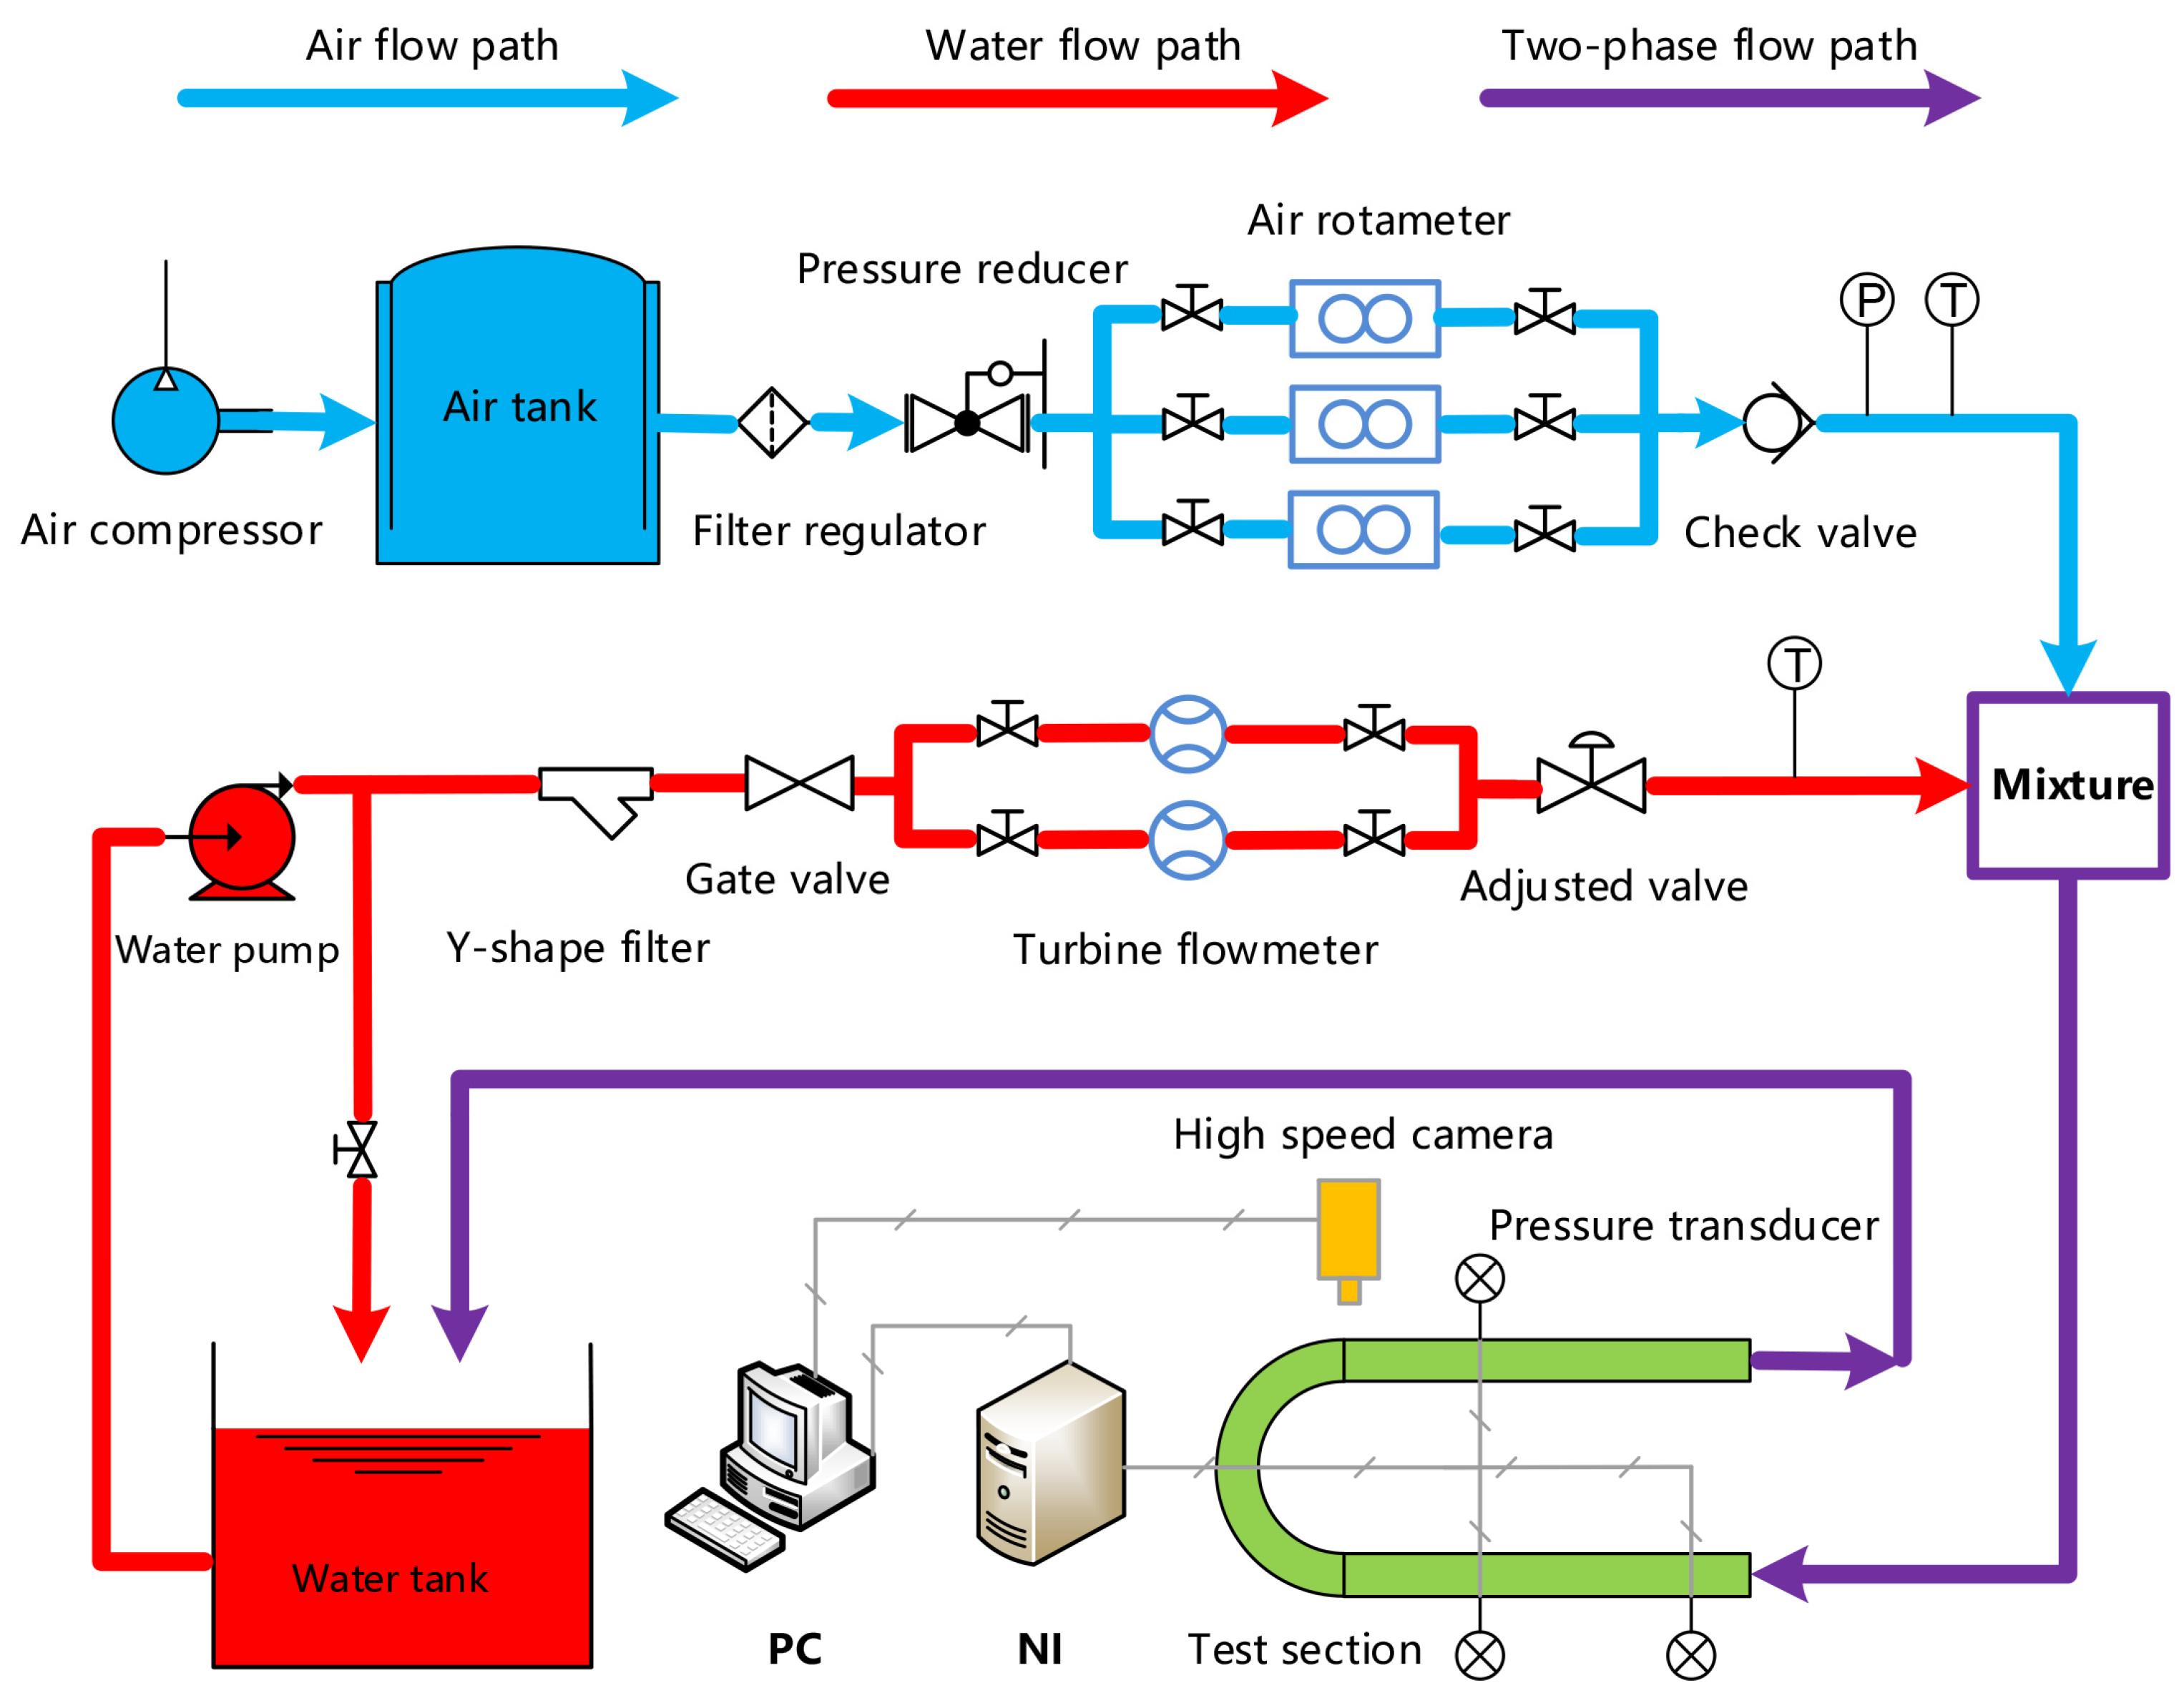
2. Experimental Setup

2.1. Experimental Equipment

The experiments were conducted in the air–water experimental apparatus depicted in Figure 1. There was a water flow path (red line), an air flow path (blue line), two-phase flow path (purple line), a test section (Green area), and a system for collecting and recording data in the schematic layout of the experimental setup. One of the air rotameters and one of the turbine flow meters were used to measure the air and water flow, respectively. The air and water flow meters exhibited accuracies of 2.5% and 1% in the test range, respectively. The air and water flow meters exhibited 0.5% and 0.12% repeatability in the test range, respectively. Air and water entered the experimental section via a mixture and were separated in an open water tank. The experimental equipment and the reliability of the experimental system were described in detail by Ma X et al. [41]. It is noted that the test section was altered to investigate the flow characteristics for an air–water flow in straight tube sections of U-tubes. The complete description of the test section is discussed below.

2.2. Test Section for Pressure Drop Measurements and Visualization

When the pressure gradient in the horizontal tube is almost constant along the straight tube, it can be considered that the adiabatic air–water flow in the horizontal tube has reached a developed state [14,24,28,42]. As a result, a series of pressures at different axial positions in the adjacent horizontal tubes of a 180° return bend were obtained to investigate the interference intensity of a U-bend.
The pressure drop measured in the experiment is detailed in Figure 2. The experimental device is a U-tube. It is composed of a U-bend (AB in Figure 2) and two straight tubes (IA and BO in Figure 2). The U-tube is manufactured from transparent quartz glass to observe the flow patterns. During the experimental tests, the U-tubes were arranged in a C-shape. The two straight pipe sections of the U-tubes were placed horizontally and were in the same vertical plane. The plane was parallel to the direction of gravity. Eight pressure taps were set up to measure the pressure at different axial positions in the U-tube. They were placed at the axial 5D, 10D, 20D, 30D, 45D, 60D, 80D, and 130D positions both upstream and downstream of the return bend. The pressure taps are shown in Figure 2, where they are denoted by P1–P8 and P1′–P8′. The pressure taps were situated externally to the tube cross-section and had a diameter of 1.0 mm. The influence of the setting on the accuracy of pressure measurements can be ignored. The specific process of verification was described in detail by Ma X et al. [31]. The experimental pressure drop must be measured in a fully developed flow state. Therefore, the straight tube (IP8) with a length of 80D was set at the inlet section and installed upstream of P7P8.
Figure 2 illustrates that the positive direction of the x-axis was oriented toward the right. In this way, the dimensionless distance from the pressure taps to the inlet and outlet (A and B) of the U-bend is expressed in detail. The pressure tap positions in the inlet straight tube section were represented by −5D, −10D, −20D, −30D, −45D, −60D, −80D, and −130D. In addition, the pressure tap positions in the outlet straight tube section were represented by +5D, +10D, +20D, +30D, +45D, +60D, +80D, and +130D. Among them, the negative sign indicates that the two-phase flow direction is opposite to the x-axis direction, and the positive sign indicates that the two-phase flow direction is the same as the x-axis direction. In this way, the distribution of the axial pressure taps throughout the whole U-tube can be described accurately.
The pressure fluctuation at each axial tap was measured, and the pressure gradient in each section (P8P7 to P2P1 and P1′P2′ to P7′P8′) of the straight tube was obtained by calculation. What needs to be known here is that the segmented pressure drop refers to the differential in pressure between the upstream and downstream sections of a segmented straight tube, such as the pressure difference between P8 and P7. As defined by the pressure taps, the distance from the center of each tube segment to the inlet (A) or outlet (B) of the bend is indicated in Table 1.
The pressure measured in this experiment was acquired by a diffused silicon pressure transducer. The repeatability and precision of the pressure transducer are 0.05% and 0.2%, respectively. The data-acquisition device PXIe 4492 from National Instruments (Austin, TX, USA) was used to record pressure signals in LABVIEW 2017 operating settings. The PXIe 4492 has 24-bit analog input and IEPE constant-current signal conditioning, which can be used for precision measurement when combined with a diffused silicon pressure transducer. Experimental flow pattern images were captured with a high-resolution and high-speed camera (HX-6 manufactured by NAC Company in Tokyo, Japan). HX-6 has a shooting frequency of up to 650,000 frames per second and has a 5-million-pixel CCD sensor. The time error of capture is 20 nanoseconds. In order to obtain a clearer flow image, an LED lamp was arranged as an auxiliary background light source, and two layers of sulfuric acid paper were used to promote the uniform distribution of light. In this experiment, the shooting frequency was 1500 frames per second.

2.3. Experimental Conditions

In the experiment, the superficial velocities of water and air were in the ranges of 0.20–1.98 m/s and 0.18–25.11 m/s, respectively. The superficial velocity of the gas or liquid phase is assumed to be the velocity when the gas or liquid phase flows through the entire tube cross-section alone and is defined, respectively, by Equations (1) and (2):
Ug = Qg/A
Ul = Ql/A
The gas- and liquid-phase volumetric flow rates Qg and Ql refer to the gas- and liquid-phase volumes flowing through the cross-section of the tube per unit time, respectively. A is the cross-sectional area of the tube.
The entire experiment was conducted at an ambient temperature of around 25 °C and an atmospheric pressure of around 0.1 MPa. The gas has a viscosity of 1.84 × 10⁻⁵ kg/(m·s) and a density of 1.18 kg/m3. The liquid has a viscosity of 9.03 × 10⁻⁴ kg/(m·s) and a density of 996.95 kg/m3. The experiment was carried out under two conditions of upward and downward flow. The uncertainty of measured parameters was estimated on the basis of the standard uncertainty evaluation of Taylor [43]. The maximum fractional uncertainties of the liquid superficial velocity, gas superficial velocity, and pressure drop were 5.65%, 8.78%, and 3.26%, respectively.
Two kinds of U-tubes with different structural parameters were selected and measured. The difference in structural parameters is mainly concentrated in the diameter of the small U-tube. The U-tubes have internal diameters of 9 and 12 mm with curvature ratios of 8.33. The length of the straight tube section (IA and BO in Figure 2) is 210 times the inner diameter of the tube. These tube diameters and curvature ratios are also within the range of two-phase flow heat exchange in household air-conditioning and heat pump systems.

3. Results and Discussion

3.1. Frictional Pressure Gradient in Straight Pipe Sections of U-Tubes

Since the experimental fluid in this study focuses on the adiabatic flow of air and water, and there are no height differences or pipe fittings along the inlet (IA in Figure 2) or outlet (BO in Figure 2) straight test sections, the accelerational pressure drop, gravitational pressure drop, and local pressure drop in the straight pipe sections are negligible.

3.1.1. Frictional Pressure Gradient in the Distant Straight Tube Section

The frictional pressure gradients measured at the inlet and outlet straight tube sections (P7P8 and P7′P8′ in Figure 2) are compared to the classically predicted correlations for the frictional pressure drop in a two-phase flow in straight tubes. In total, two HFM-based (homogeneous flow model) and four SFM-based (separated flow model) correlations were selected in this work, as indicated in Table 2.
The comparison between the measurements and these correlations is presented in Table 3, where MAD represents the average absolute relative deviation, and MRD represents the average relative deviation. The MAD and MRD are defined, respectively, by Equations (3) and (4):
MAD = 1 N i = 1 N ( d P / d L ) pred ( d P / d L ) exp ( d P / d L ) exp 100
MRD = 1 N i = 1 N ( d P / d L ) pred ( d P / d L ) exp ( d P / d L ) exp 100
where (dP/dL)pred and (dP/dL)exp are the predicted value and the experimental value of the i-th data point, respectively. N represents the number of data points.
Based on the compared results shown in Table 3, it can be seen that most of the experimental data measured at the inlet and outlet straight tube sections (P7P8 and P7′P8′ in Figure 2) are predicted within about a ±30% error band. The experimental values are in good agreement with the predicted values. Thus, the fluid in these sections is considered developed and not disturbed by the return U-bend. Therefore, the frictional pressure gradients measured at the inlet (−105D) and outlet (+105D) are regarded as the base references for comparison and analysis.

3.1.2. Comparison of Pressure Gradients in Straight Pipe Sections Close and Distant to the U-Bends

To assess the interference degree of the elbow on the fluid in the vicinity of the U-bend, the ratio S between the pressure gradient in the section interval close to the U-bend (±7.5D) and that in the reference developed section (−105D) is analyzed. Figure 3 shows the variation in the ratio S for different flow conditions in the downward flow. It can be noted that the pressure gradients in the downstream (+7.5D) and upstream (−7.5D) pipe sections are larger compared to the pressure gradient in the reference interval (−105D). Furthermore, the ratio S under the flow conditions in Figure 3 ranges from approximately 1.5 to 6. It can also be seen from the figure that the degree of the ratio S is significantly influenced by the superficial gas and liquid velocities. The pressure gradient ratio S is larger, and the influence of the U-bend on the flow characteristics in the adjacent straight pipe is stronger.
The above variation law of the pressure gradient ratio S is essentially due to the redistribution and evolution of the gas–liquid interface when different incoming flow patterns flow across the U-bend. The redistribution of the phase interface in U-bends and their contiguous straight tubes is mainly caused by interactions among gravity, centrifugal, viscous, and surface tension forces. The detailed interpretation of the link between the flow pattern and U-bend disturbance is presented in Section 3.2 below.
In summary, the influence of U-bends on the two-phase flow in their contiguous straight tubes is very obvious. The degree of perturbation has an important connection with the two-phase flow pattern. Therefore, the next section will focus on the connection between the incoming flow pattern and the degree of perturbation.

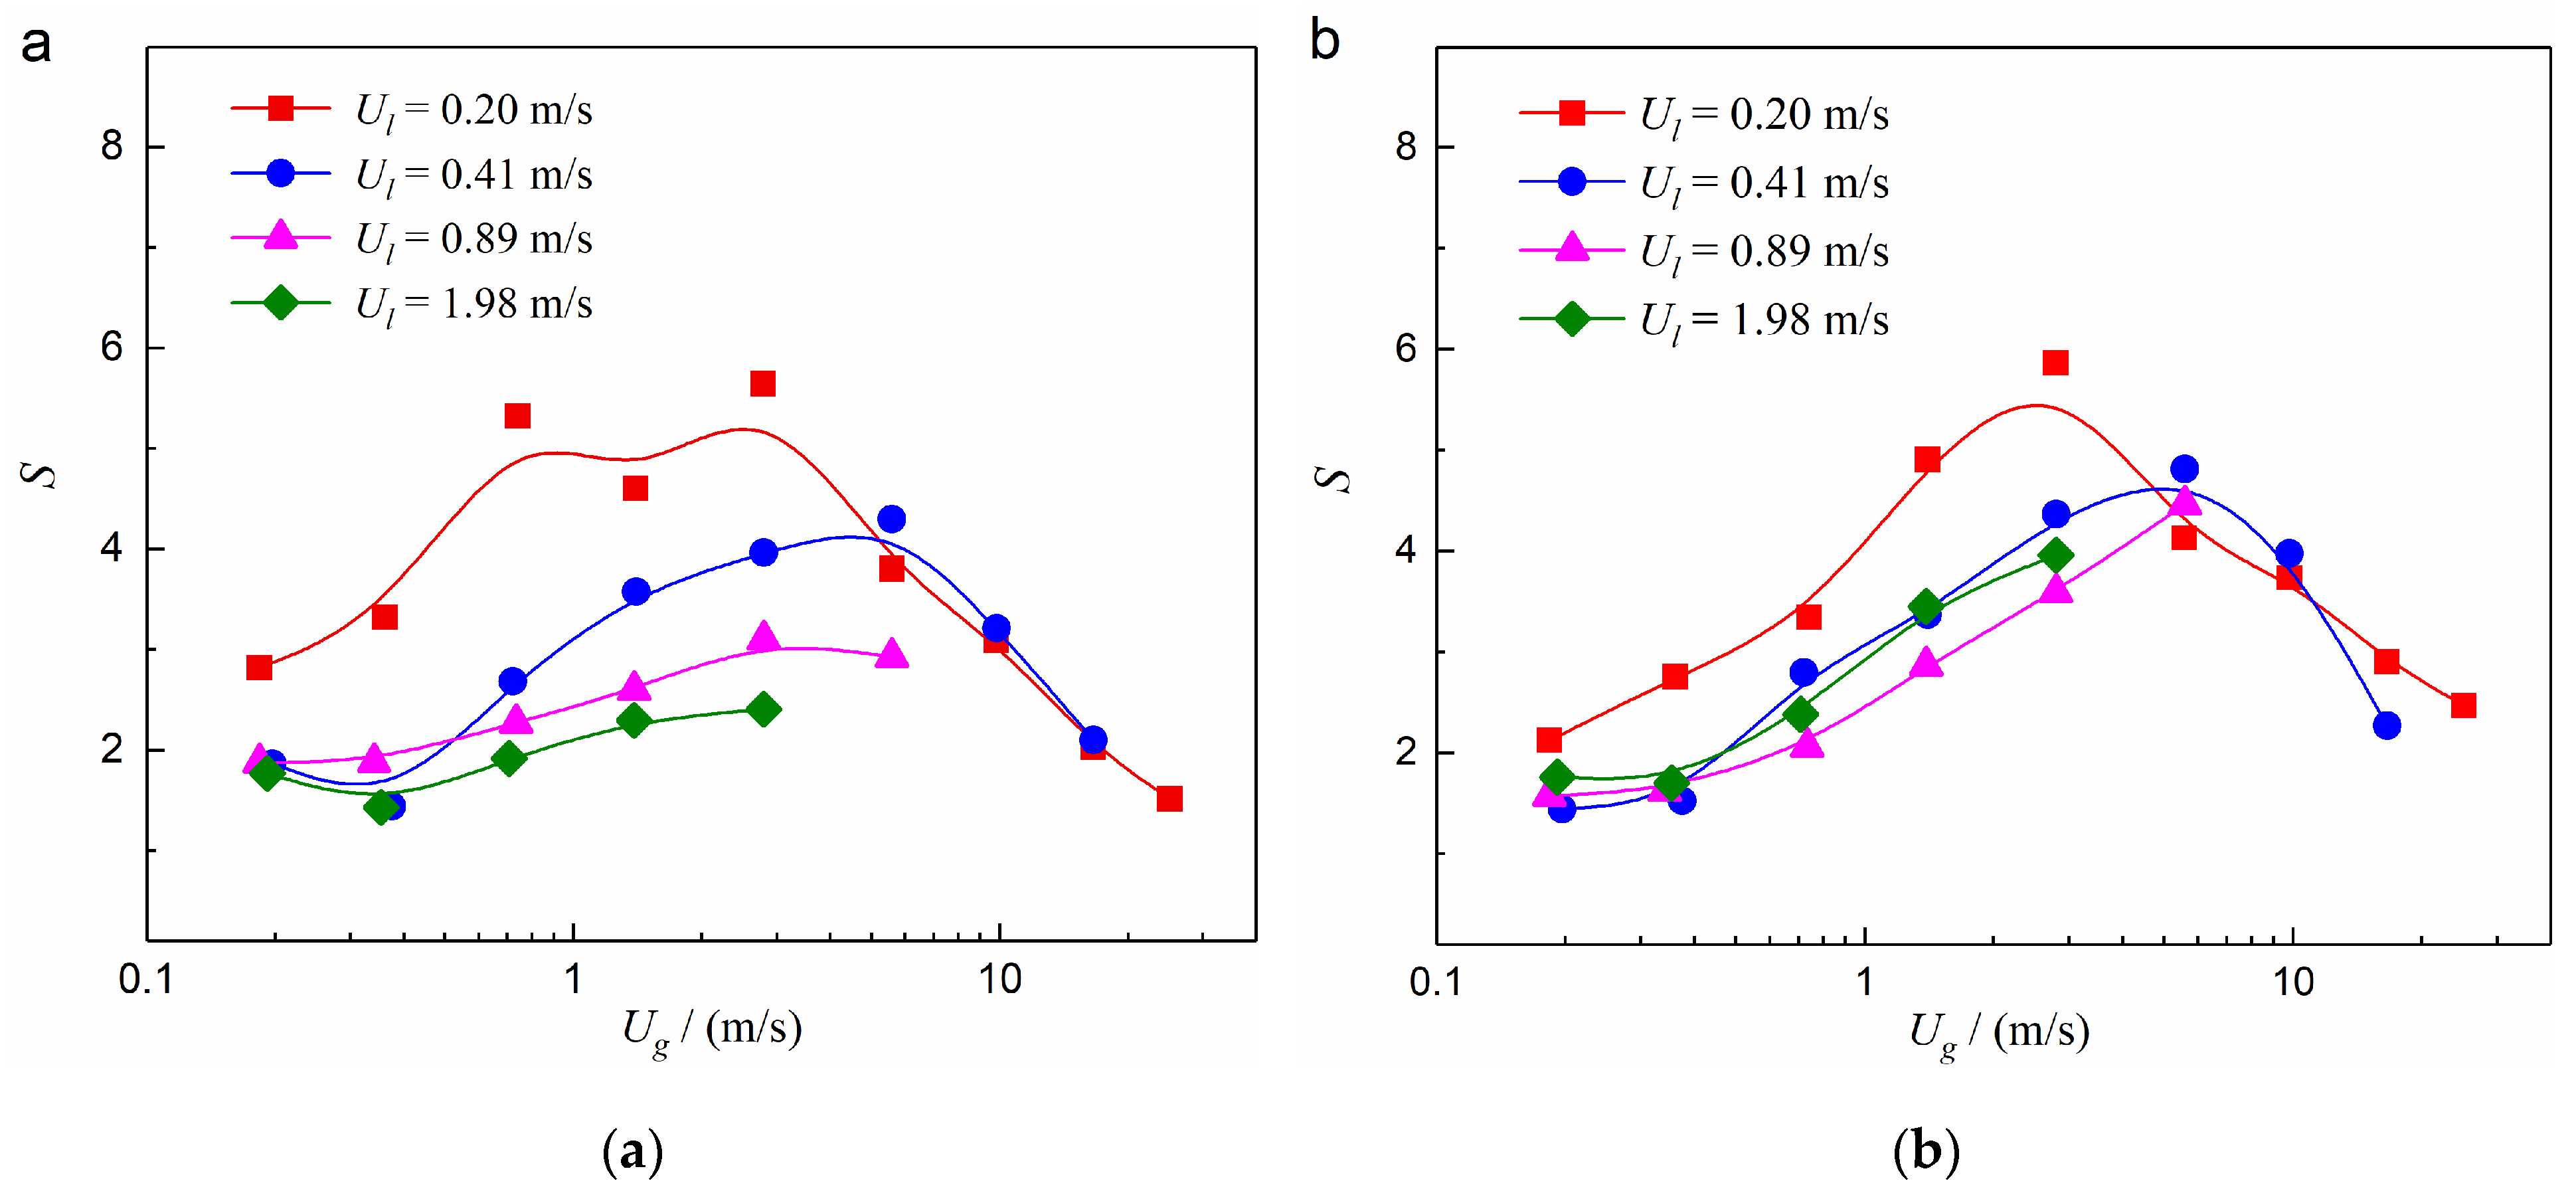
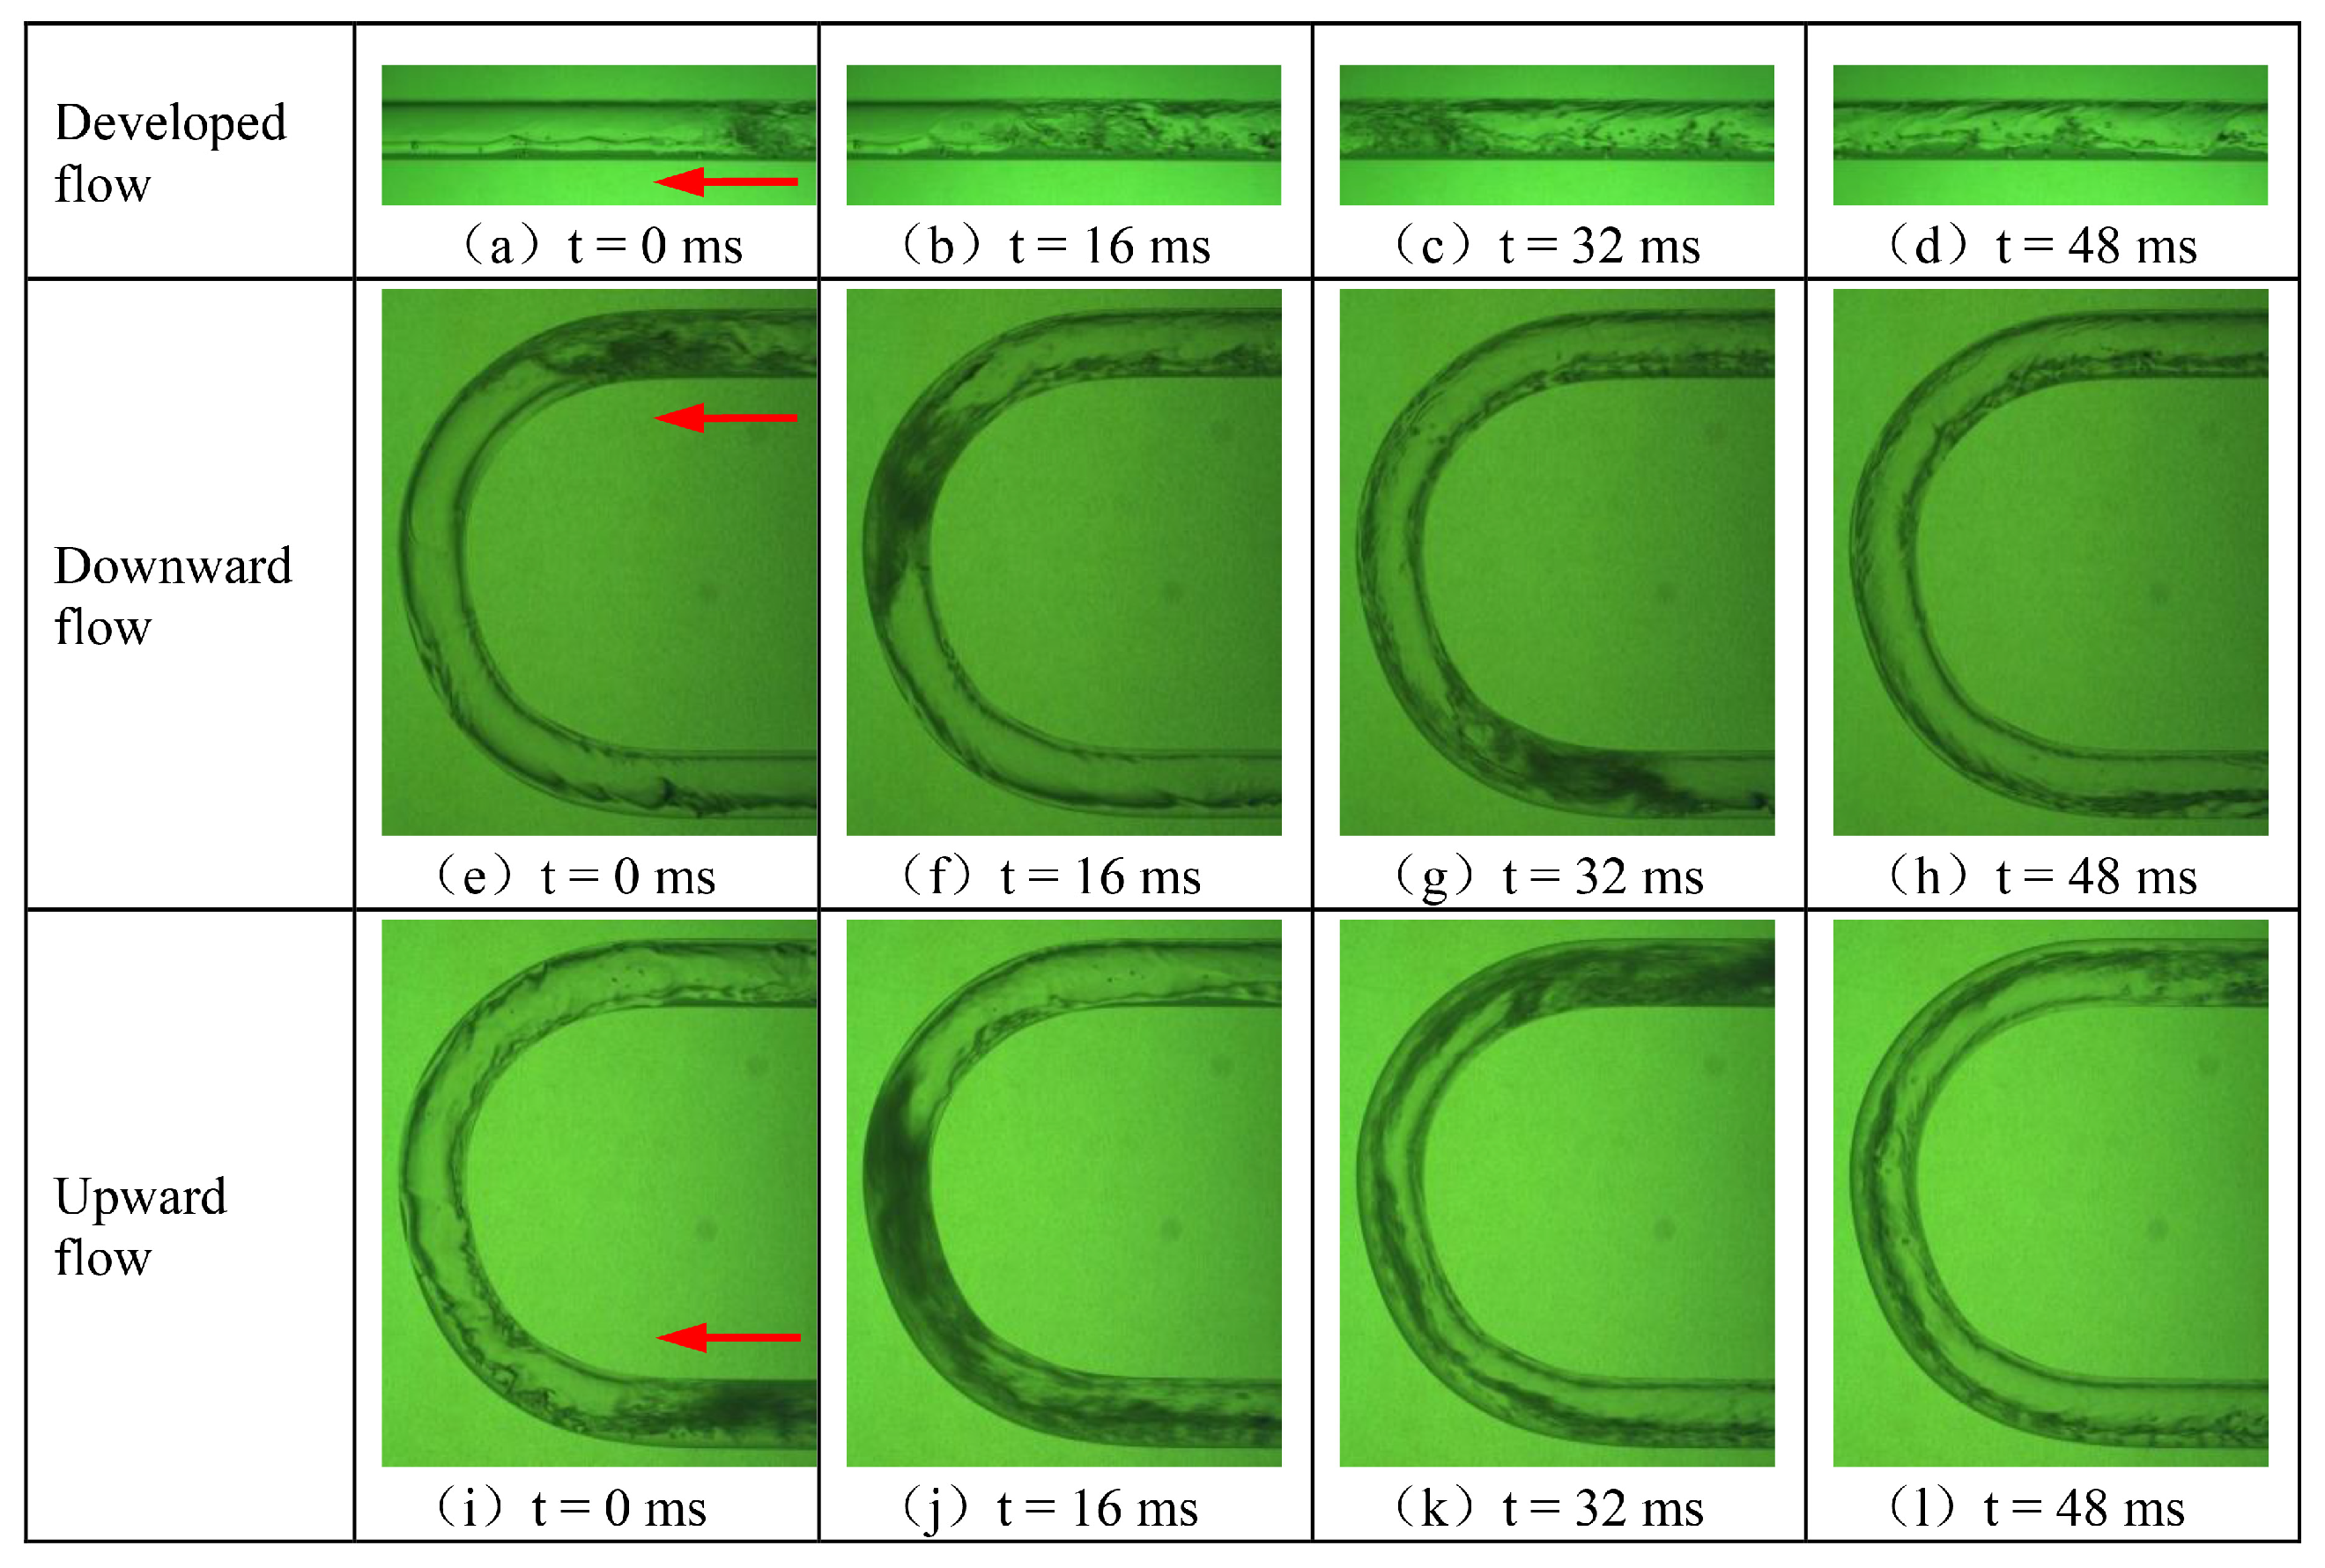
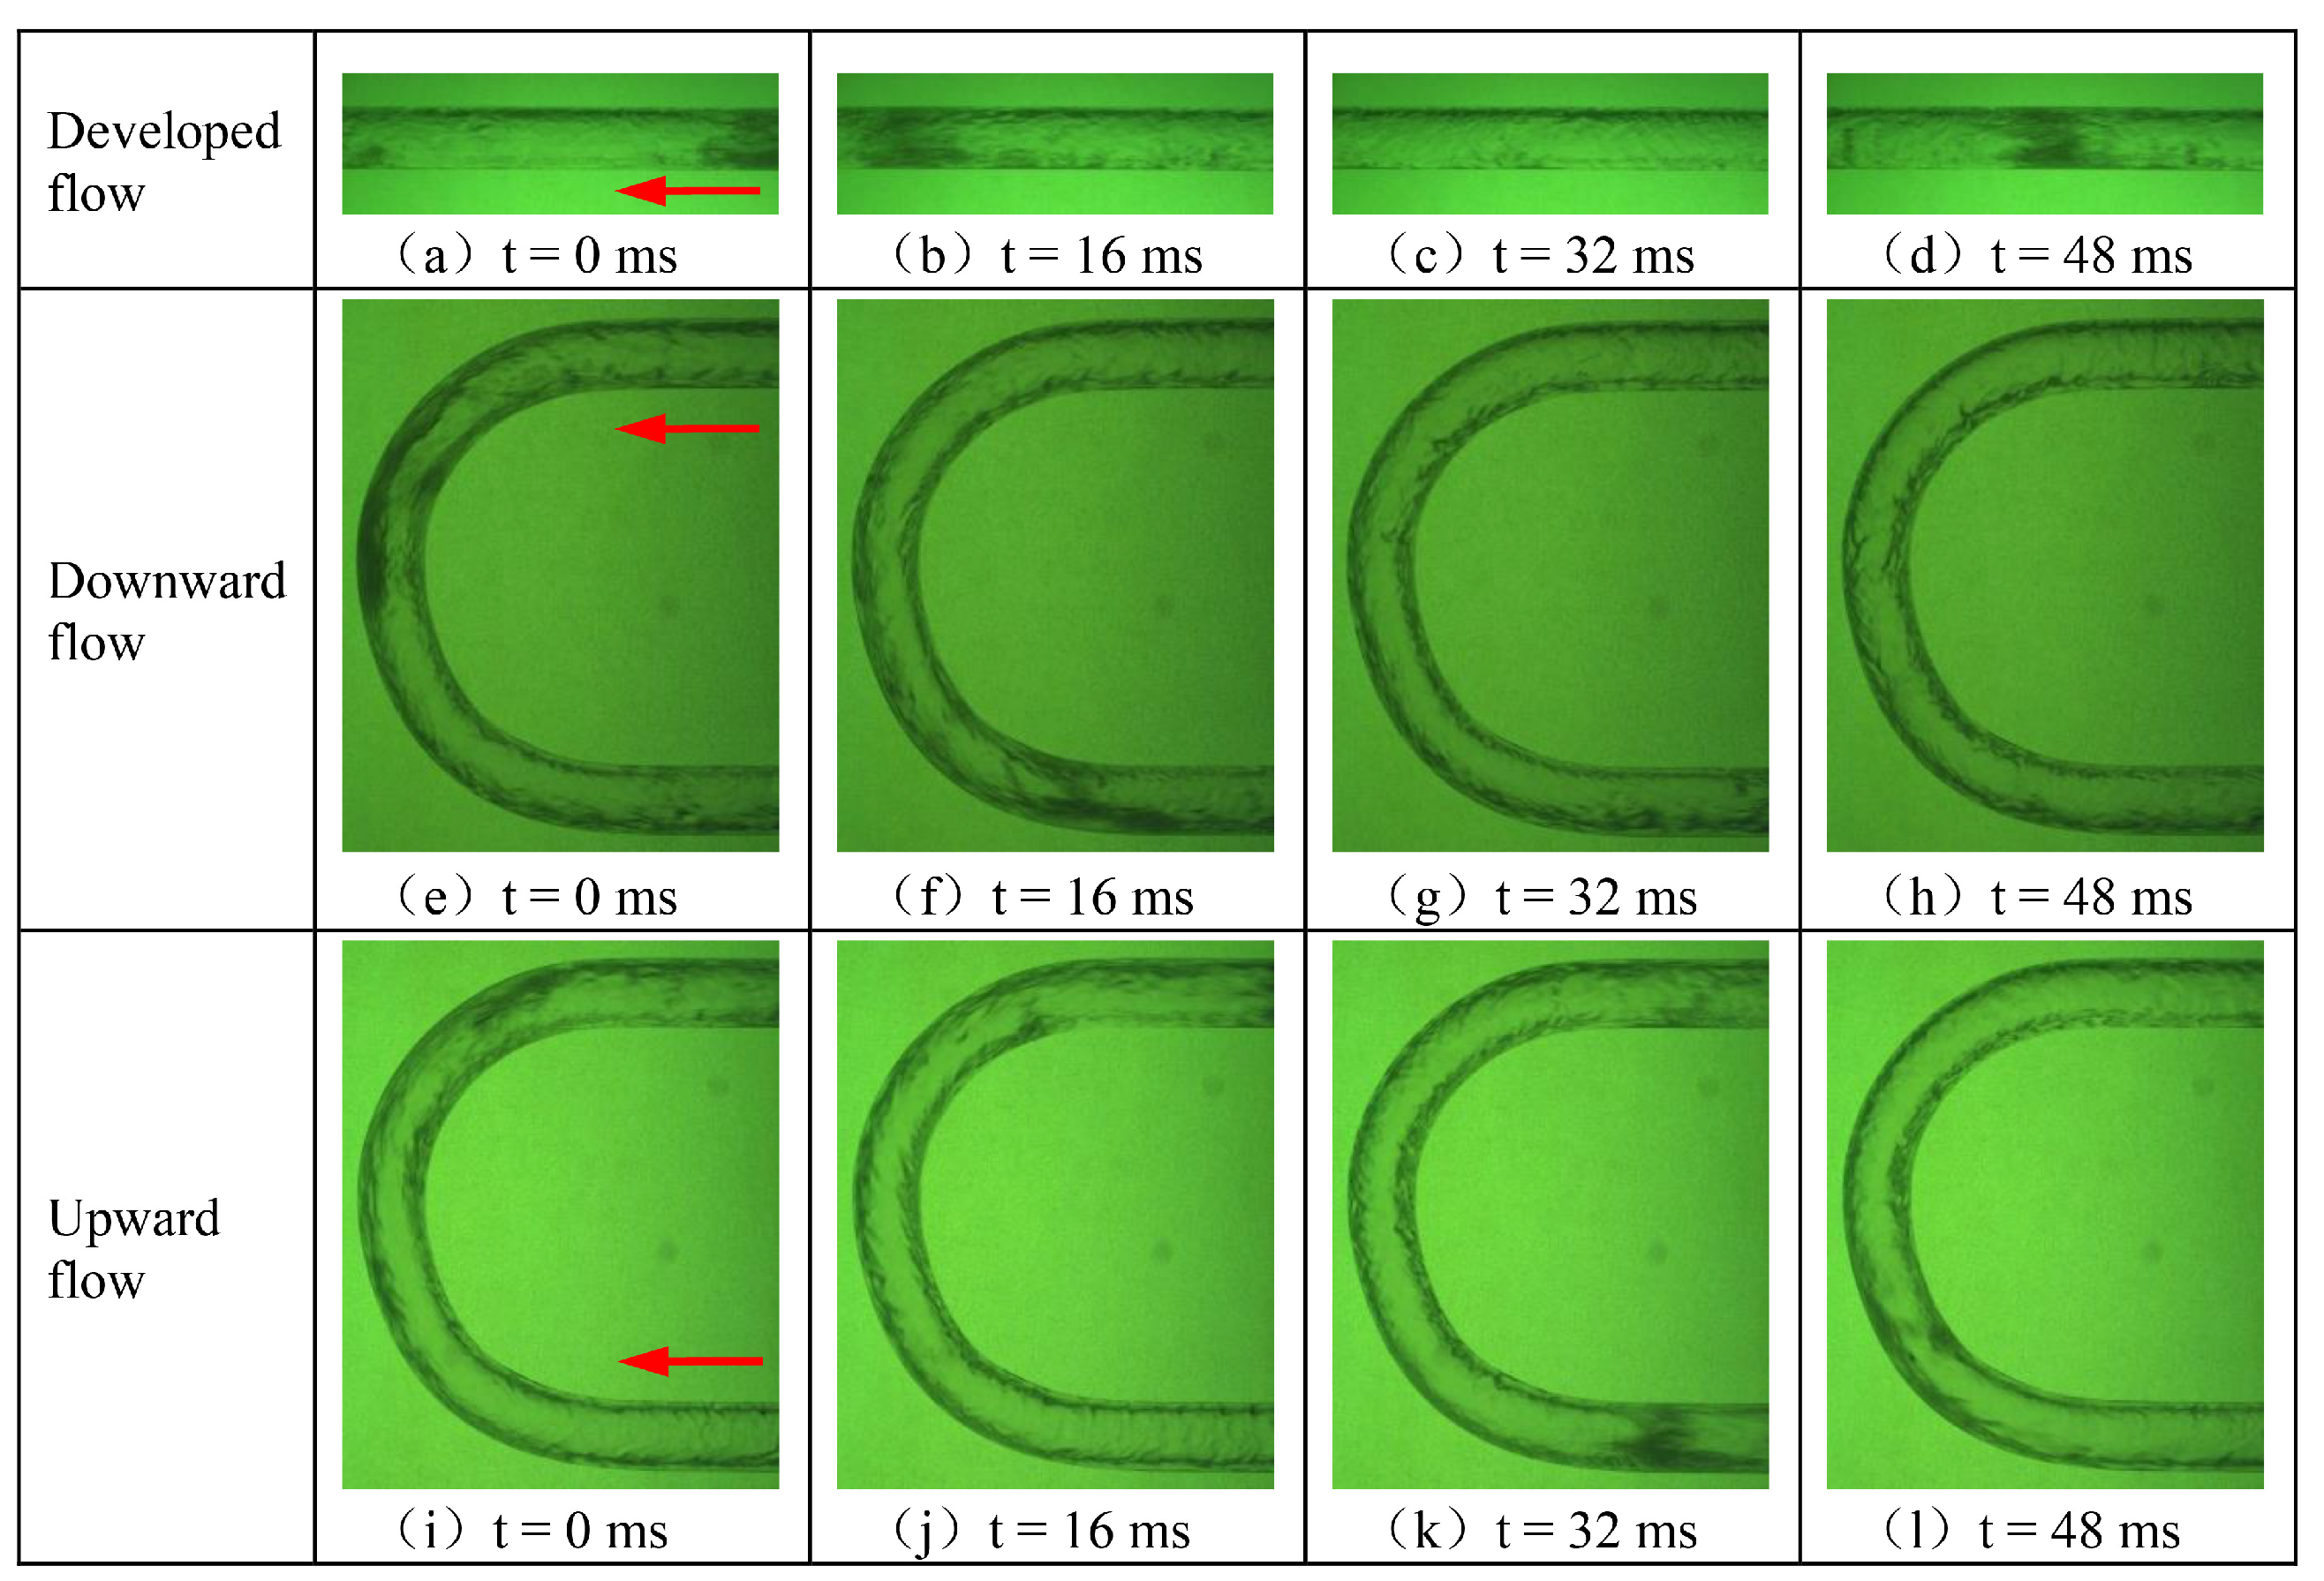
3.2. Link between Flow Pattern and Disturbance Degree

In this section, the relationship between the flow pattern in the inlet straight tube and the perturbation degree of the U-bend will be discussed. Three main flow patterns (plug, slug, and annular flow) were identified in the inlet horizontal straight pipes within the scope of the experiment. The pressure gradient ratio S under different incoming flow patterns (seen in Figure 4) is used to characterize the disturbance degree of U-bends. Figure 5a–d, Figure 6a–d, and Figure 7a–d depict the distributions of the two-phase interfaces for the plug, slug, and annular flow, respectively. As is known, the flow pattern is the two-phase distribution and the existing form of the two-phase interface. The difference in the flow pattern in the inlet straight tube will inevitably lead to a difference in the phase-interface distribution and velocity slip of the two phases in the U-bend. At the same time, the disturbance degree of the gas–liquid interface and the strength of the Dean vortex caused by the secondary flow will be different. Therefore, the length and strength of the effect of U-bends on flow characteristics will also be different for distinct incoming flow patterns.
As can be seen in Figure 4, there are obvious differences in the pressure gradient ratio S under different incoming flow patterns. The range of the pressure gradient ratio S for the plug flow and annular flow is 2–3.3, while that of the slug flow is 3.6–6. These indicate that U-bends under a plug flow and an annular flow have little influence, while those under a slug flow have great influence. As mentioned in Section 3.1.2, the influence intensity of a U-shaped elbow on the flow characteristics is also closely related to the incoming flow pattern. The reasons for the different disturbance degrees under distinct flow patterns are described in detail below.
Figure 5, Figure 6 and Figure 7 depict the flow pattern images for the downward and upward plug, slug, and annular flows through the inlet developed section and the return bend of the U-tube (D = 9 mm, R = 37.5 mm), respectively.
As shown in Figure 5a–d, the fluid in the developed straight pipe section presents a very stable plug flow. The long gas plug and liquid plug flow alternately through the straight section. Under this flow regime in this condition, the Reynolds number (the ratio of inertial force to viscous drag force), Weber number (the ratio of inertia to surface tension), and Froude number (the ratio of inertial force to gravity) are relatively small. These results imply that gravity, viscous force, and surface tension are dominant. The flow characteristics of the downward (Figure 5e–h) and upward (Figure 5i–l) plug flow across the U-bend are similar to those of the plug flow in the straight pipe (Figure 5a–d). The primary difference is that the shape and location of the liquid plug (Figure 5f) and gas plug (Figure 5g,j,k) in the U-bend vary continuously due to the role of gravity and interface shear force, similar to the results of de Oliveira et al. [28]. In general, the disturbance of the plug flow in the U-bend is relatively small.
Figure 6a–d show the evolution of developed slug flow in an inlet straight tube. The foamy liquid slug decelerates at the entrance of the U-bend and occupies the whole cross-section (Figure 6e,i), resulting in an increase in the liquid slug length and an accumulation of more bubbles. The centrifugal force, gravity, and interfacial shear force of the fluid in the U-bend have a significant impact on the evolution of the flow pattern. When fluid flows through the U-bend, the gas inertial force and liquid centrifugal force push the heavier liquid to the outer wall of the U-bend (Figure 6g,k). The thin liquid film remains at the inner wall of the U-bend. At the same time, a wavy flow appears with the increase in the gas–liquid interface shear force. As a result, an annular–wavy flow is gradually generated (Figure 6h,l). The mass flow rate and fluid inertial force of this flow pattern increase correspondingly. Additionally, there is a great difference between the densities of water and air. Therefore, the alternating flow of the heavier liquid slug and gas slug in the elbow produces a stronger turbulent disturbance and momentum change. The flow pattern and liquid film will persist along the adjacent straight tubes for a distance due to higher gas–liquid velocities, similar to the findings of de Oliveira et al. [9] and Da Silva Lima and Thome [25]. Significant flow pattern changes occur in the U-bend and its adjacent tube sections. Therefore, the U-bend significantly affects the flow characteristics of the adjacent tube sections when the slug flow pattern appears in the inlet tube sections.
Figure 7a–d depict the flow behavior of an annular flow in an inlet fully developed section, which commonly occurs at a very high gas velocity. The annular flow exhibits a state of stability, which is mainly represented by a stable film covering the inner peripheral wall and a central gas core entraining many small liquid droplets. In the U-bend, the downward (Figure 7e–h) and upward (Figure 7i–l) annular flows are qualitatively similar to those flows in the inlet straight tube sections (Figure 7a–d). The resemblance arises from the fact that this flow pattern is mostly influenced by gas inertial and liquid centrifugal forces; similar results can be found in the literature [25,28]. When the Reynolds number of the gas phase is higher, the inertial force plays a leading role in areas of high-speed flow, similar to the findings of Yan G. et al. [51]. The mixing effect of turbulent pulsation rapidly weakens the various disturbances and inhomogeneity caused by factors such as position and shape. So, the annular flow is mostly unaffected by the U-bend, except for the uneven distribution of film thickness along the circumferential inner wall of the U-bend.
Based on the above discussion, the disturbance from the U-bend in the fluid in adjacent straight pipes is closely related to the flow pattern in the inlet straight tube. The slug flow has the most significant influence, while the effect of plug and annular flow is small. Fundamentally, it depends on the weighting relationship among the gravity, centrifugal force, and inertial force of the gas–liquid two-phase fluid in the elbow.

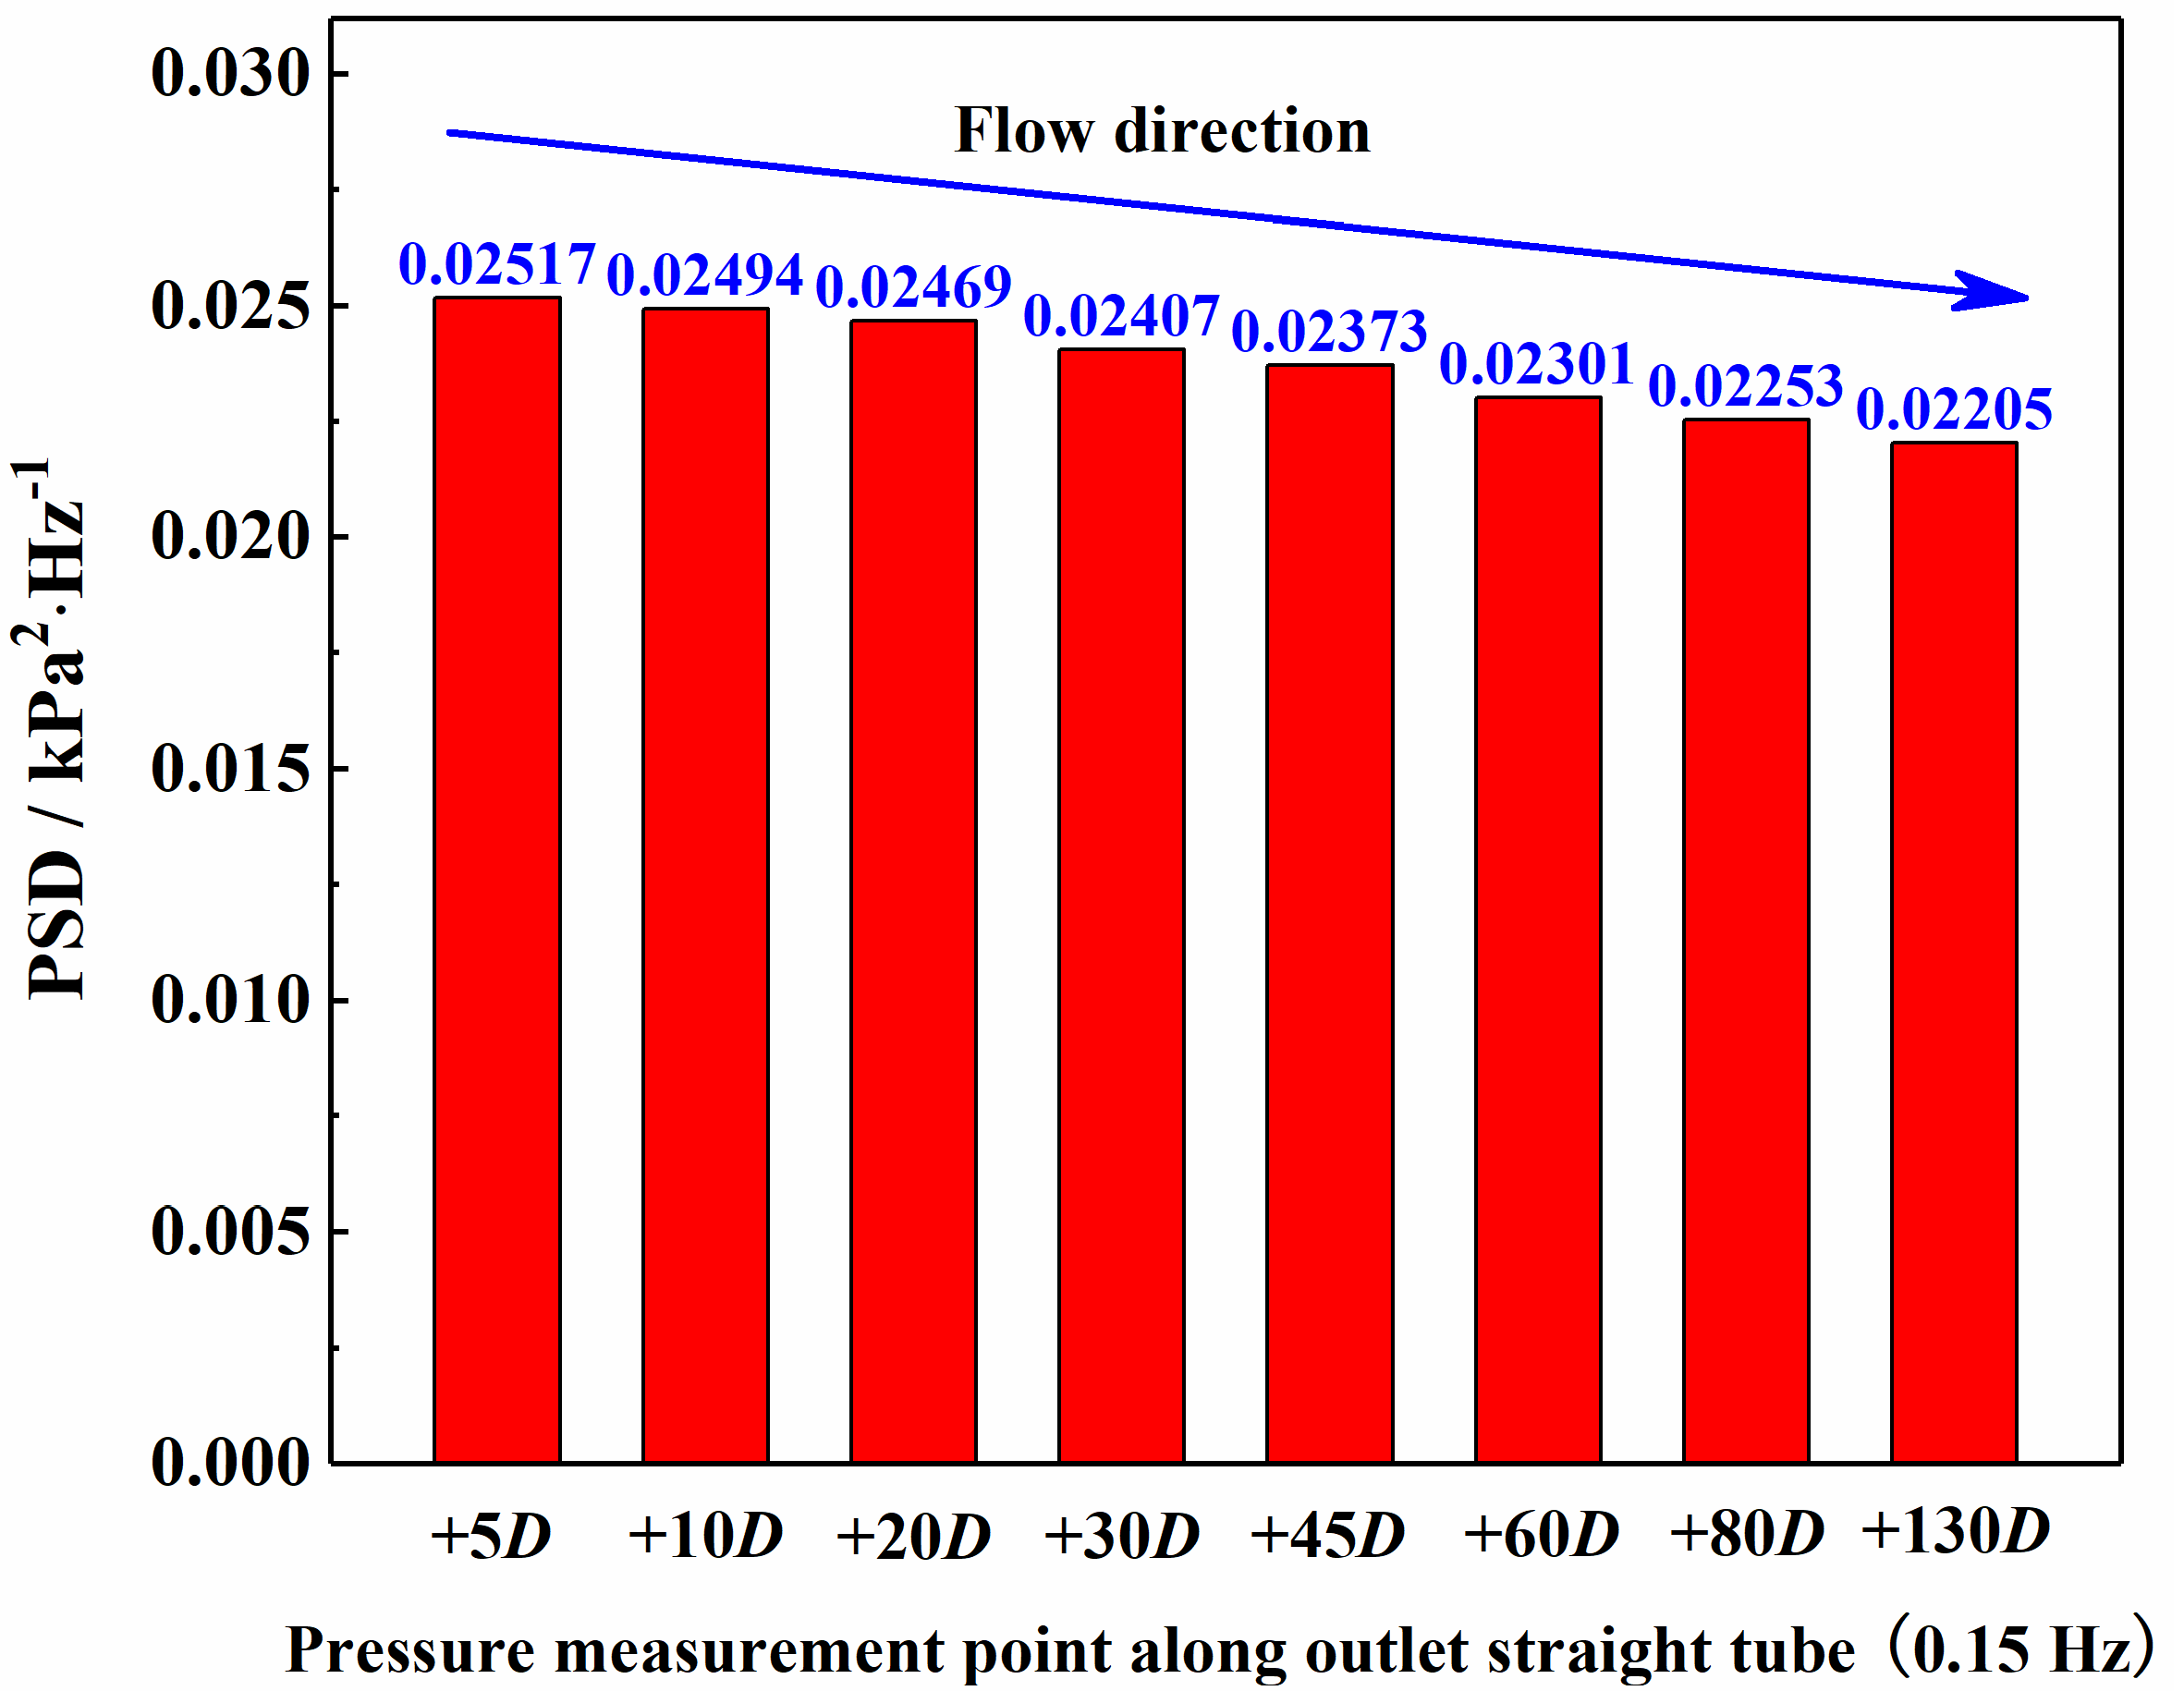
3.3. Axial Propagation Characteristics of Pressure Pulsation

Figure 8 and Figure 9 show the pressure pulsation at measurement points along the inlet and outlet straight pipes of the U-tube (D = 12 mm, R = 50 mm) within 1 s. The above measurement was conducted for the downward two-phase flow (Ug = 0.34 m/s, Ul = 0.90 m/s) in the U-tube. As can be seen in Figure 8 and Figure 9, the temporal loggings of pressure variation at all axial measurement points mutually agree in terms of the fluctuating pattern but show disagreements in the magnitude.
In order to find the propagation law of pressure pulsation more clearly, Figure 10 shows the pressure pulsation at different axial measurement points in the outlet straight pipe within 0.1s (the blue dotted frame in Figure 9). It can be seen in Figure 10 that the intensity of the pressure fluctuation peaks and troughs weakens gradually with the increase in the dimensionless axial distance (along the flow direction). As indicated by the black arrow shown in Figure 10, the extremum values of pressure fluctuations at positions of +5D, +10D, +20D, +30D, +45D, +60D, and +80D appear successively over time. In summary, the pressure pulsation propagates in the direction of the axial flow and gradually attenuates.
Figure 11 and Figure 12 show the pressure pulsation power spectral density at measurement points along the inlet and outlet straight pipes of a U-tube (D = 12 mm, R = 50 mm), respectively. The above measurement was conducted for the downward two-phase flow (Ug = 0.34 m/s, Ul = 0.90 m/s) in the U-tube. As can be seen in Figure 11 and Figure 12, the pressure pulsations at different measurement points in the upstream and downstream straight tubes of the U-bend have a stable and consistent dominant frequency (0.15 Hz) under the same working conditions, which can be compared with the results in the literature [52].
Figure 13 and Figure 14 show the power spectrum values of the pressure measurement points along the inlet and outlet straight pipes at the same dominant frequency of 0.15 Hz, respectively. At this time, the differences and change rules at each measuring point can be clearly expressed. It is also observed that the amplitude of the pressure pulsation power spectrum of the upstream straight pipe of the U-bend gradually increases along the flow direction (−130D, −80D, −60D, −45D, −30D, −20D, −10D, and −5D), as shown by the blue arrows in Figure 11 and Figure 13; however, that of the downstream straight pipe of the U-bend gradually decreases along the flow direction (as shown in Figure 12 and Figure 14). Overall, the amplitude of the pressure fluctuation power spectrum in the straight pipes upstream and downstream of the U-bend is larger when it is closer to the bend. Meanwhile, it can be found that the amplitude of the pressure pulsation power spectrum in the straight pipe downstream of the U-bend is greater than that in the straight pipe upstream of the bend by comparing Figure 11 with Figure 12. The reason may be that the velocity of the fluid in the upstream straight pipe gradually decreases when it flows into the entrance of the elbow, and the fluid energy gradually accumulates. As a result, the amplitude of the pressure pulsation power spectrum in the upstream straight pipe gradually increases along the flow direction. Another reason is probably due to the influence of the secondary flow. After entering the U-bend, the gas–liquid two-phase flow is subjected to centrifugal force, which generates a pressure gradient in the cross-section perpendicular to the direction of the mainstream. As a result of the pressure difference, the fluid flows in this direction to form a secondary flow, ideally represented by two symmetrical Dean vortices. The secondary flow is superimposed on the main flow along the tube axis, resulting in a helical shape of the streamlines. The secondary flow promotes the mixing degree of the two-phase flow and increases the turbulent disturbance intensity of the fluid, thus enhancing the pressure fluctuation intensity of the two-phase flow across the downstream straight tube.
To sum up, the pressure pulsation propagates in the form of a wave in the upstream and downstream straight tubes of the U-bend, and the dominant frequency of the pulsation remains unchanged during the propagation process. However, the pulsation energy gradually increases along the flow direction in the pipe upstream of the U-bend, while it gradually attenuates along that downstream of the bend. Additionally, the pressure fluctuation energy downstream of the U-bend is larger than that upstream of the return bend.

4. Conclusions

This work conducted experimental investigations on the influence of U-bends on the flow and pressure propagation characteristics of a gas–liquid two-phase flow in the adjacent straight tubes. The two-phase fluid system selected in this experiment was an air–water flow under adiabatic conditions. The superficial velocities of air and water were 0.18–25.11 m/s and 0.20–1.98 m/s, respectively, covering plug flow, slug flow, and annular flow. The experiments were carried out in U-tubes with inner diameters of 9 mm and 12 mm and with a curvature ratio of 8.33. The U-tube was arranged in a C-shape. The pressure fluctuations at several axial measurement points in the straight tubes upstream and downstream of the elbow were measured. Images of the two-phase flow in tubes and U-bends were captured using a high-resolution and high-speed camera. The main conclusions are as follows:
(1)
The disturbance from the U-bend in the two-phase flow in the vicinity of the bend was very obvious. The ratios of pressure gradients in straight pipe sections close and distal to the U-bends ranged from approximately 1.5 to 6 under the experimental conditions.
(2)
The disturbance degree of U-bends in the flow in their adjacent straight tubes was highly related to the incoming two-phase flow pattern. The slug flow had the most significant influence, while the effect of plug and annular flows was smaller in comparison. Fundamentally, it depends on the weighting relationship among the gravity, centrifugal force, and inertial force of the gas–liquid two-phase fluid in the elbow.
(3)
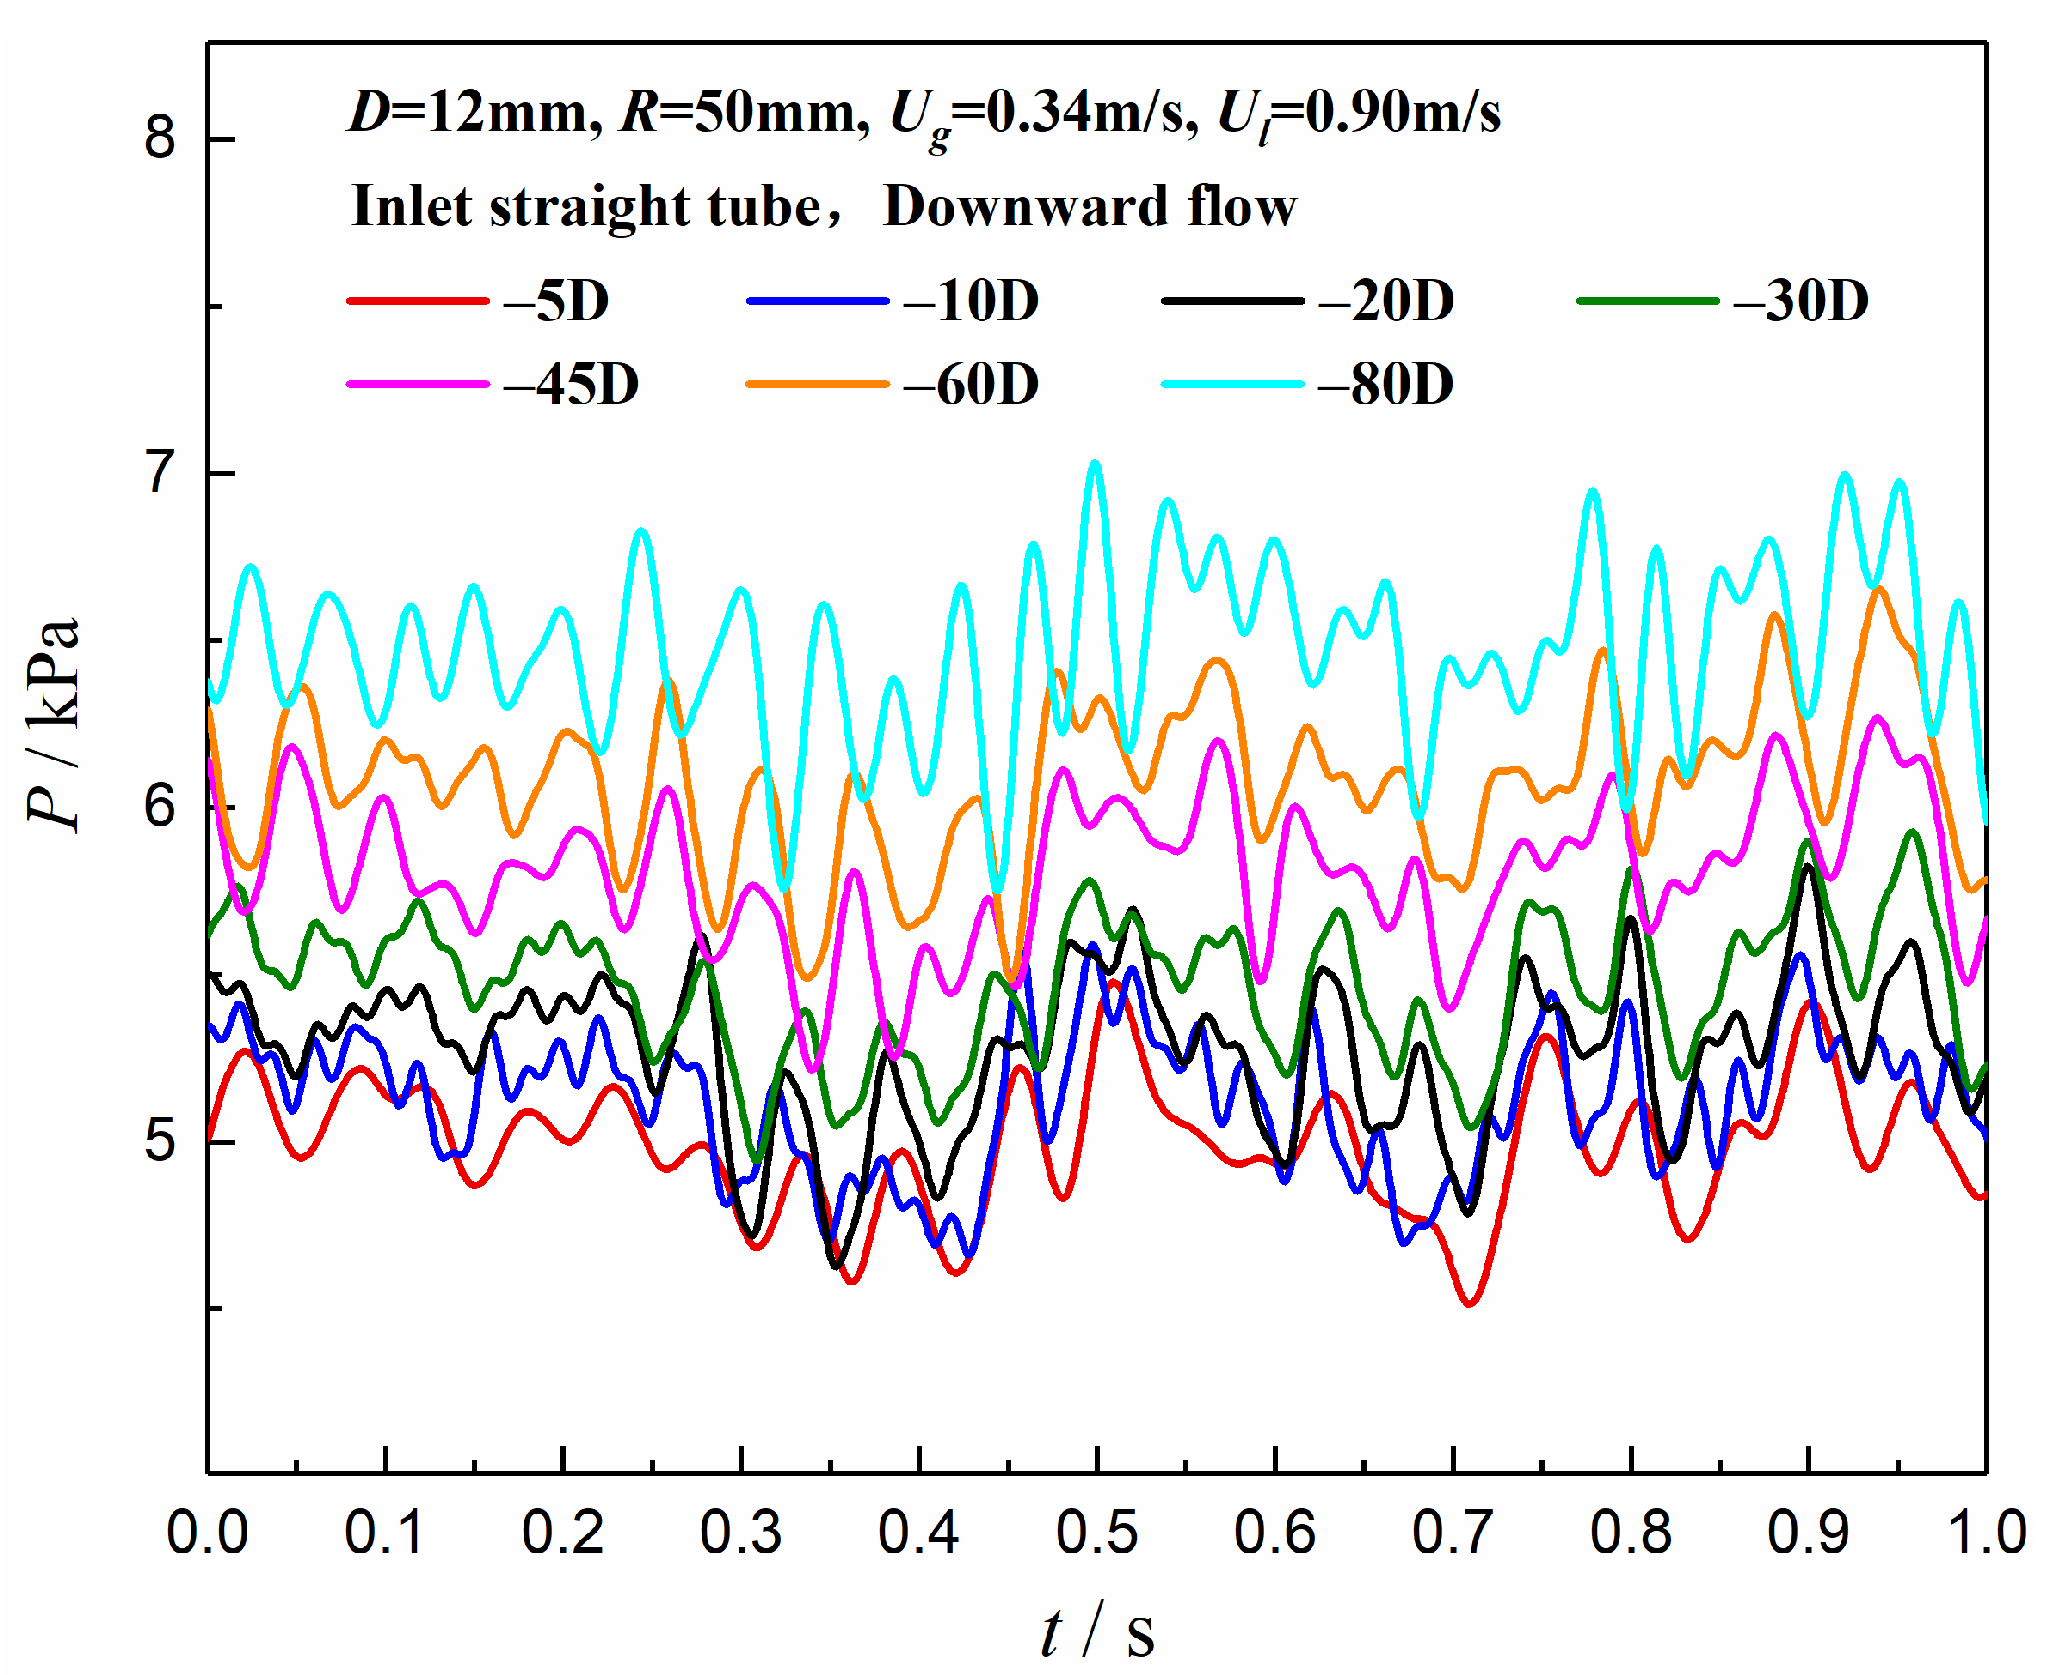
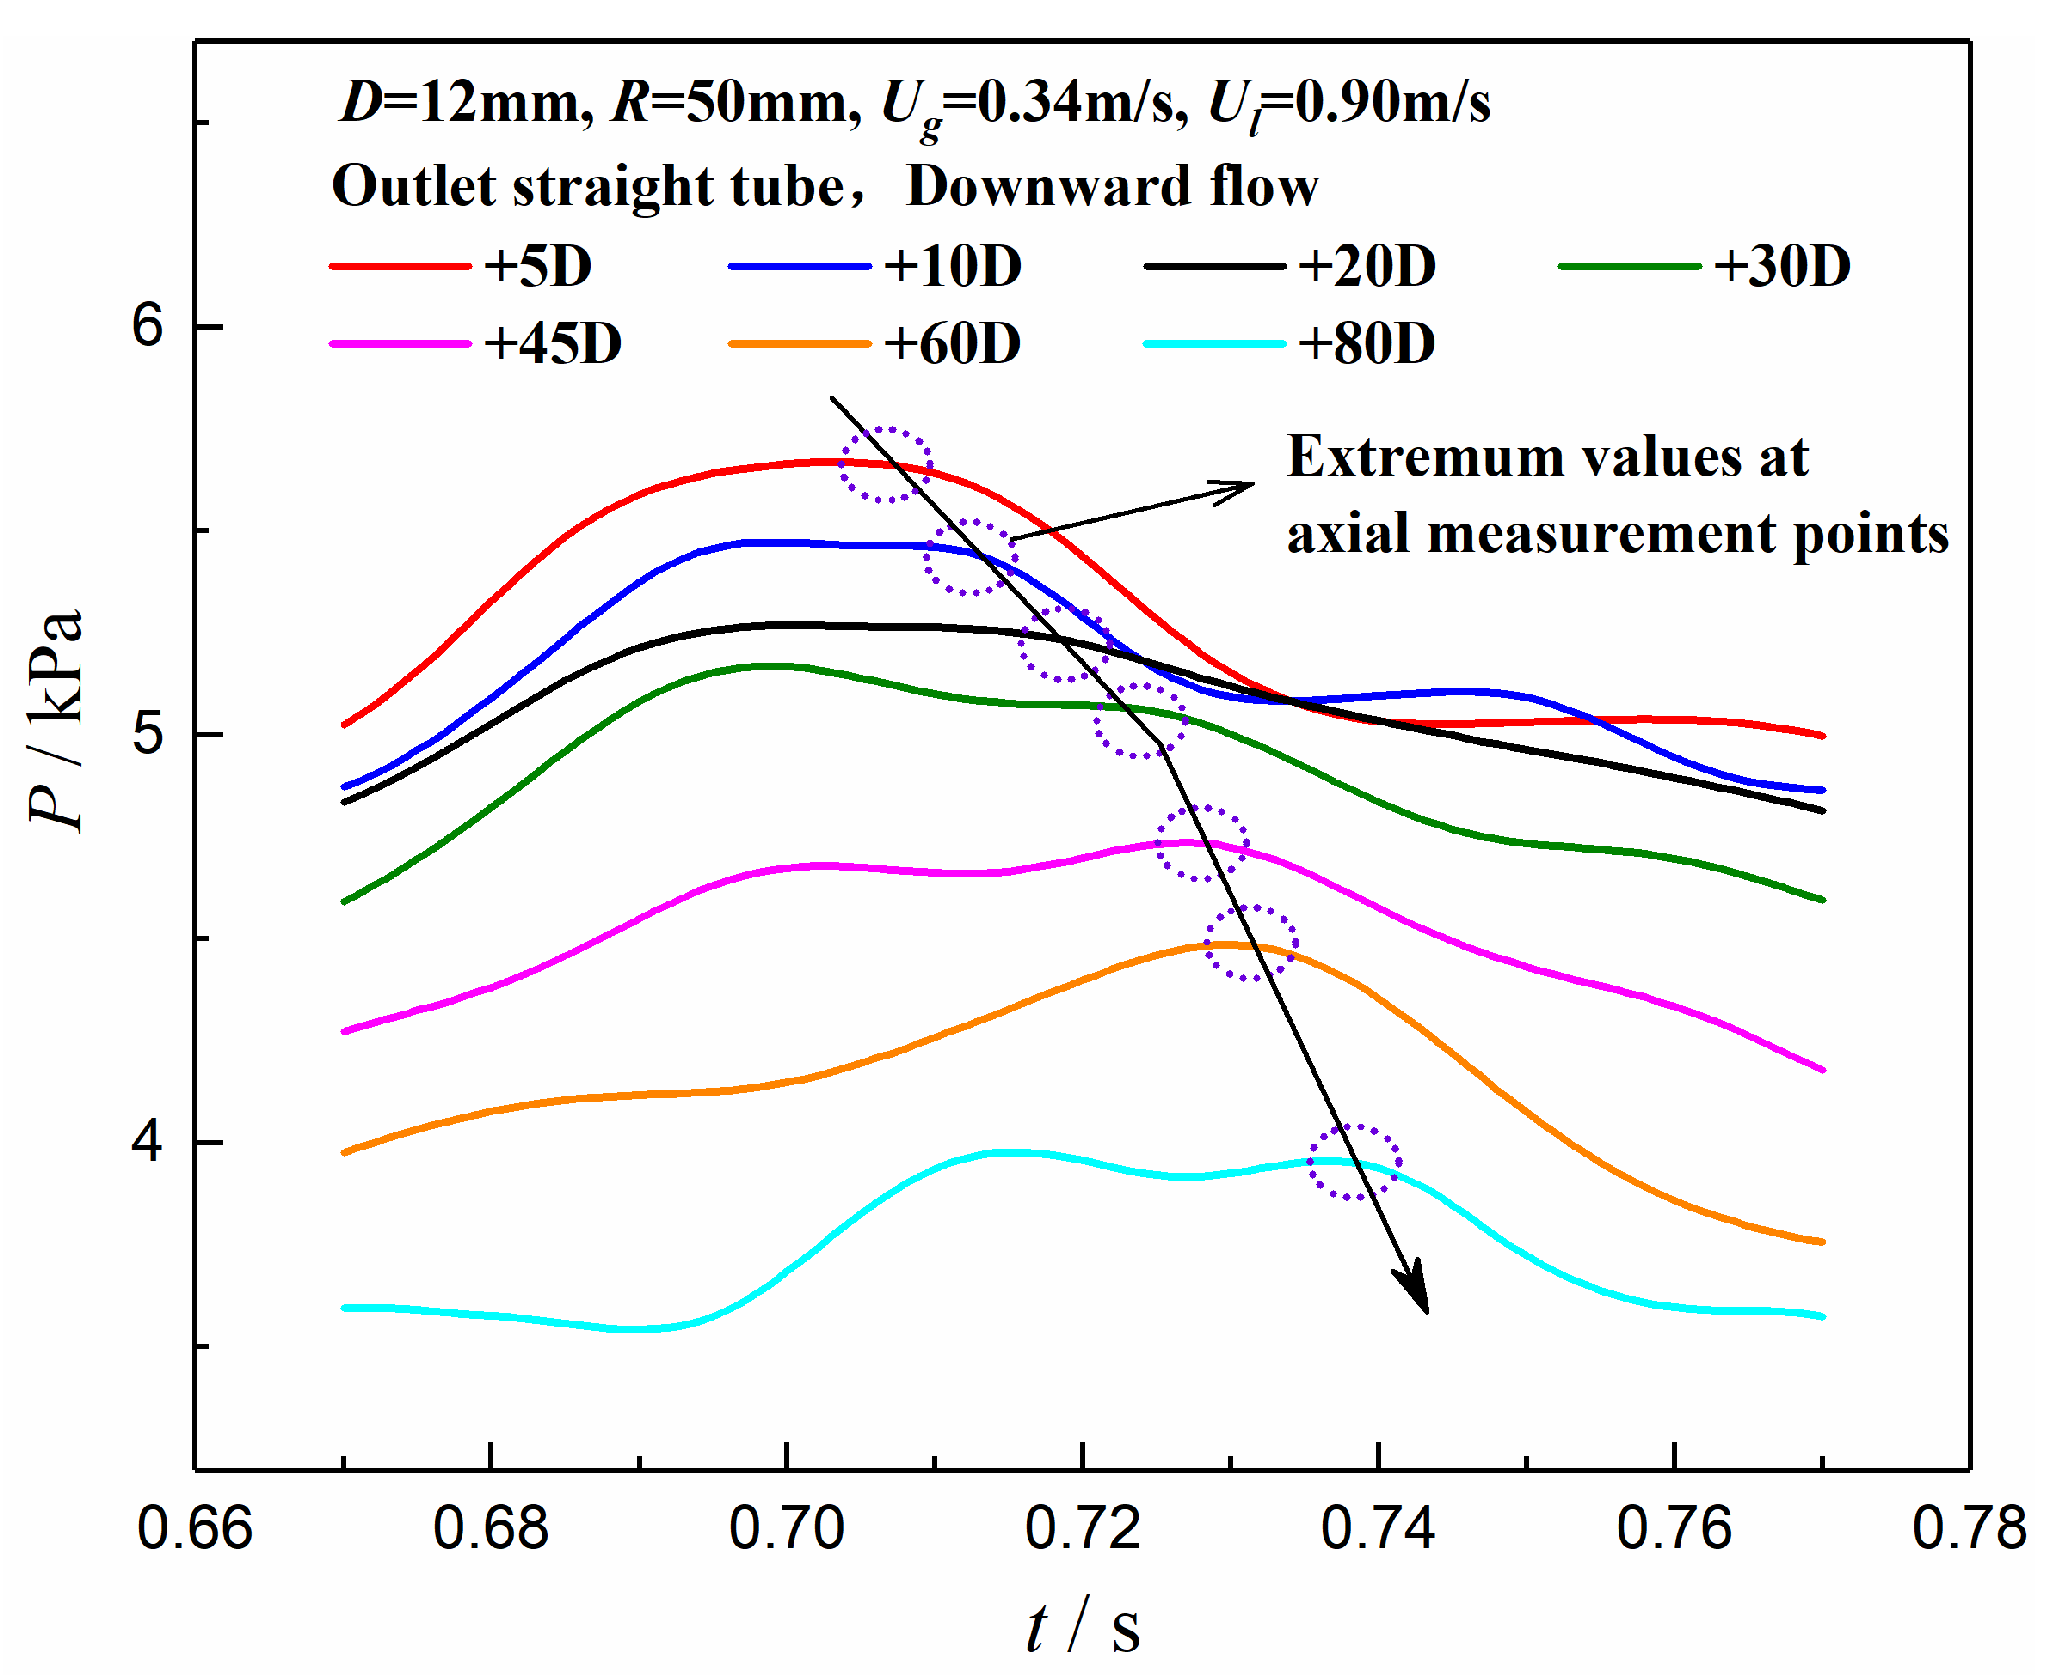
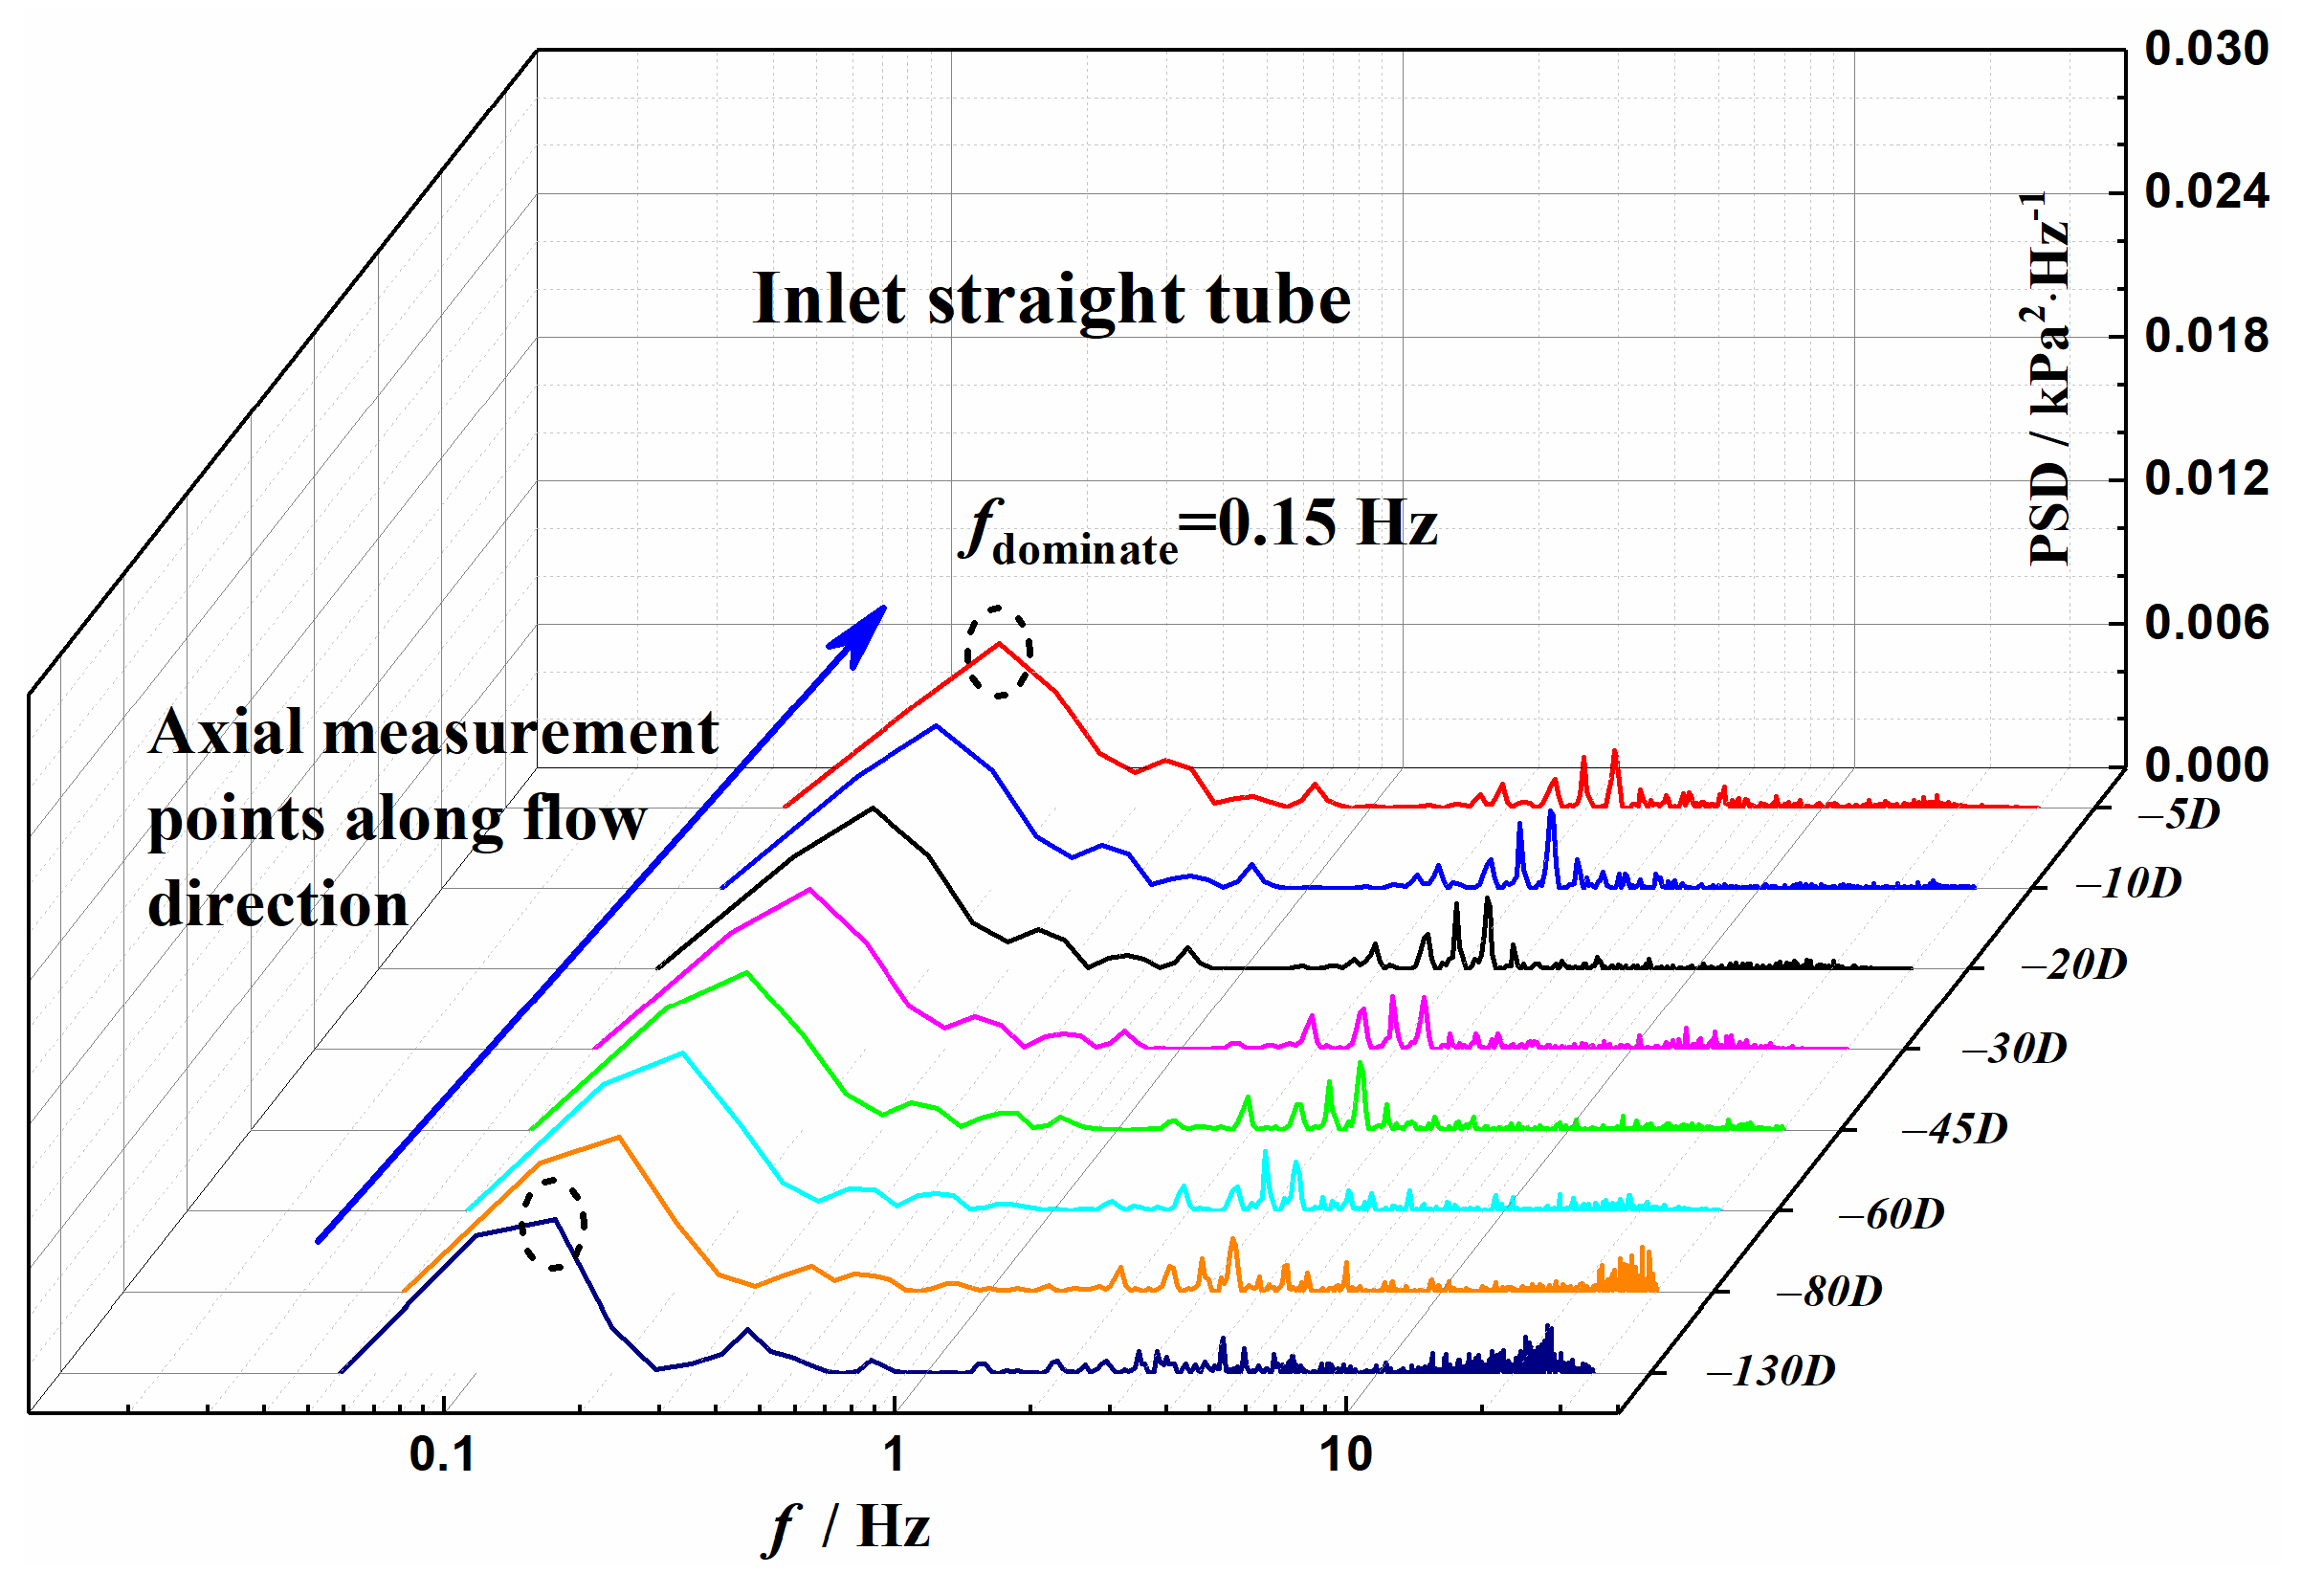
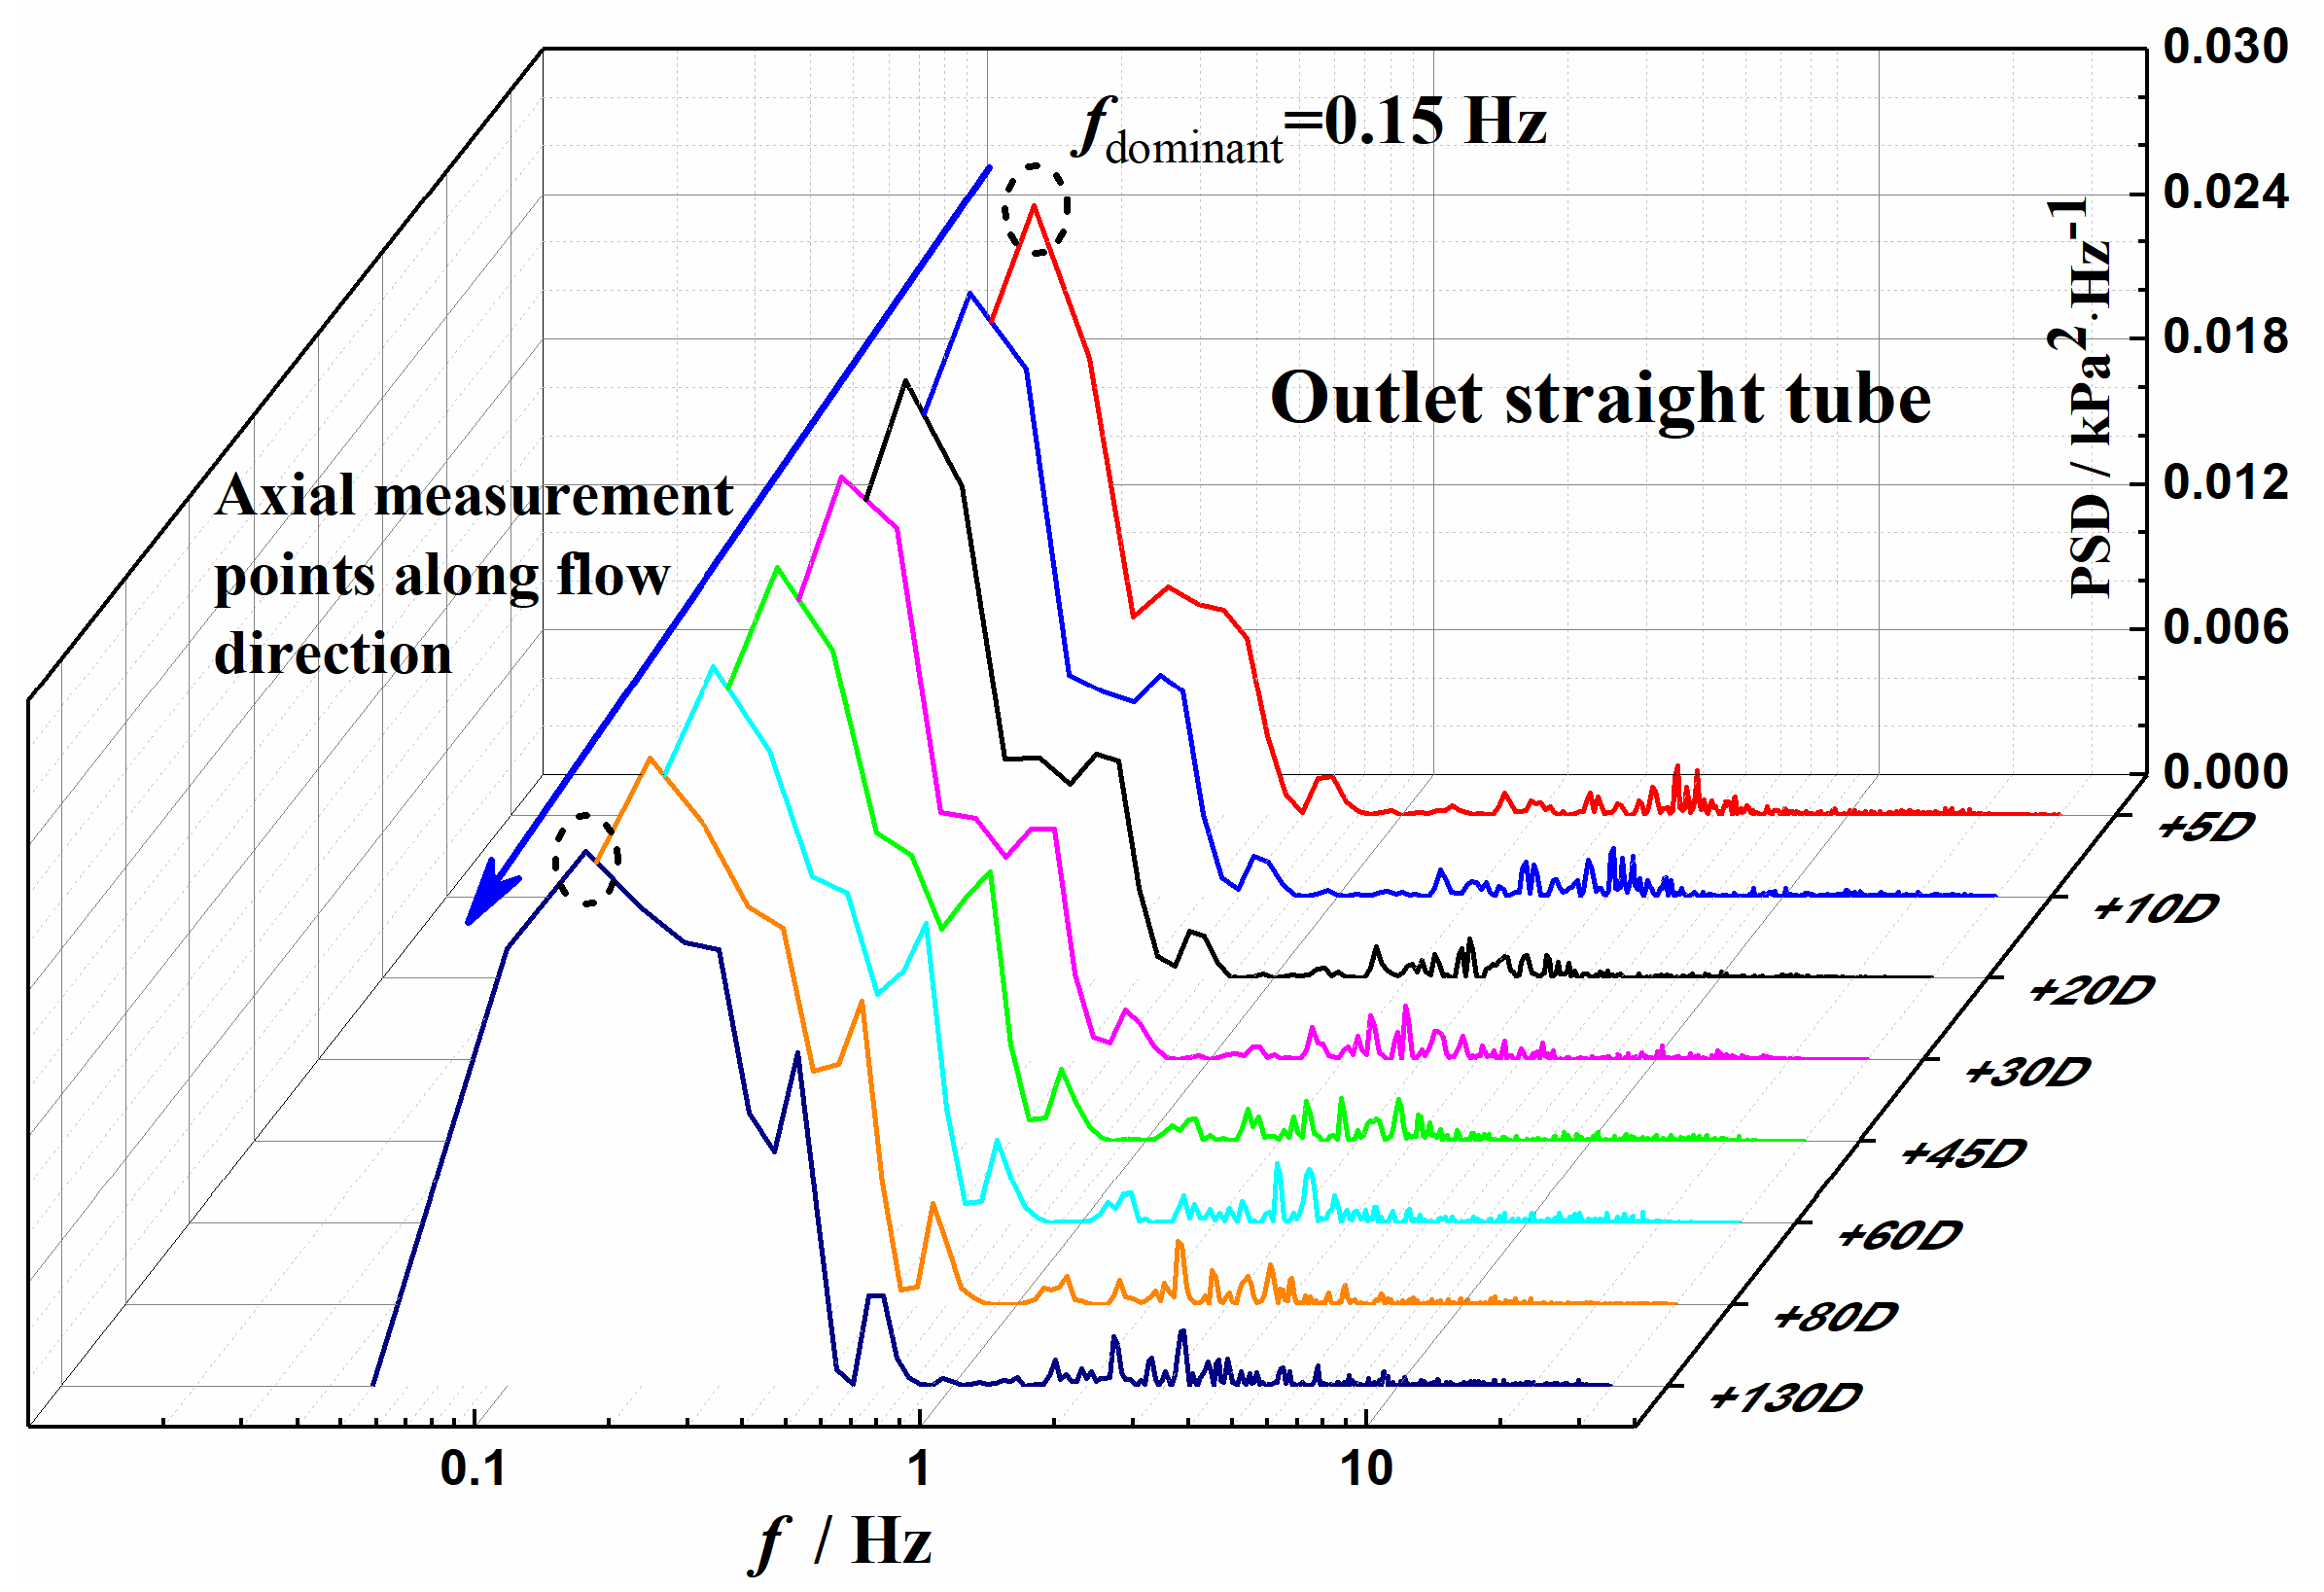
The pressure fluctuation propagates in the form of a wave in the upstream and downstream straight tubes of the U-bend, and the dominant frequency of the pulsation remains stable during the propagation process. With an increase in the axial distance along the flow direction, the pressure pulsation energy for the straight tube upstream of the U-bend increases gradually, while that of the downstream section attenuates. Additionally, the pressure fluctuation energy downstream of the U-bend was larger than that upstream of the return bend.
These conclusions are helpful for understanding the influence of U-bends on the flow and pressure propagation characteristics of a gas–liquid two-phase flow in upstream and downstream straight pipes and, hence, make a contribution to the safe design and operation of gas–liquid two-phase flow pipelines and heat exchangers.

Author Contributions

Conceptualization, X.M., F.Z. and M.T.; methodology, X.M., F.Z. and M.T.; formal analysis, X.M., Z.G., D.N., C.L. and W.Z.; investigation, X.M. and Z.G.; resources, X.M., M.T., F.Z. and W.Z.; data curation, X.M. and Z.G.; writing—original draft preparation, X.M. and Z.G.; writing—review and editing, X.M., Z.G., D.N., C.L. and F.Z.; supervision, X.M., F.Z. and M.T.; project administration, X.M. and M.T. All authors have read and agreed to the published version of the manuscript.

Funding

This research was funded by the Shandong Provincial Natural Science Foundation of China (Nos. ZR2021ME045 and ZR2020QE299), the National Natural Science Foundation of China (No. 52176080), the Doctoral Fund of Shandong Jianzhu University (No. X19034Z), and the China Postdoctoral Science Foundation (No. 2023M733286).

Data Availability Statement

Data are contained within the article.

Conflicts of Interest

Author Fengshan Zhang was employed by the company Shandong Huatai Paper Co., Ltd. and Shandong Yellow Triangle Biotechnology Industry Research Institute Co., Ltd. The remaining authors declare that the research was conducted in the absence of any commercial or financial relationships that could be construed as a potential conflict of interest.

References

  1. Jo, Y.; Song, Y.J.; Jo, D. Gas Accumulation Induced by Temperature Rise and Sudden Pressure Drop in an Inverse U-Bend. Ann. Nucl. Energy 2022, 169, 108928. [Google Scholar] [CrossRef]
  2. Liu, W.; Jiang, S.; Li, H. Experimental Study of Liquid-Carrying by Swirling Flow in a U-Shaped Tube. Exp. Therm. Fluid Sci. 2022, 130, 110479. [Google Scholar] [CrossRef]
  3. Pietrzak, M. Flow Patterns and Gas Fractions of Air-Oil and Air-Water Flow in Pipe Bends. Chem. Eng. Res. Des. 2014, 92, 1647–1658. [Google Scholar] [CrossRef]
  4. Pietrzak, M. Flow Patterns and Volume Fractions of Phases during Liquid-Liquid Two-phase Flow in Pipe Bends. Exp. Therm. Fluid Sci. 2014, 4, 247–258. [Google Scholar] [CrossRef]
  5. Pietrzak, M.; Witczak, S. Flow Patterns and Void Fractions of Phases during Gas-Liquid Two-phase and Gas-Liquid-Liquid Three-Phase Flow in U-Bends. Int. J. Heat Fluid Flow 2013, 44, 700–710. [Google Scholar] [CrossRef]
  6. Sharma, M.; Ravi, P.; Ghosh, S.; Das, G.; Das, P.K. Hydrodynamics of Lube Oil-Water Flow through 180° Return Bends. Chem. Eng. Sci. 2011, 66, 4468–4476. [Google Scholar] [CrossRef]
  7. Graham, P.B.; Mike, J.B.; Jerome, A.N. Upscaling multiphase viscous-to-capillary transitions in heterogeneous porous media. J. Fluid Mech. 2021, 911, A59. [Google Scholar]
  8. Wang, L.Y.; Golfier, F.; Tinet, A.-J.; Chen, W.Z.; Vuik, C. An efficient adaptive implicit scheme with equivalent continuum approach for two-phase flow in fractured vuggy porous media. Adv. Water Resour. 2022, 163, 104186. [Google Scholar] [CrossRef]
  9. de Oliveira, P.M.; Barbosa, J.R. Pressure Drop and Gas Holdup in Air-Water Flow in 180° Return Bends. Int. J. Multiph. Flow 2014, 61, 83–93. [Google Scholar] [CrossRef]
  10. Abdulkadir, M.; Azzi, A.; Zhao, D.; Lowndes, I.S.; Azzopardi, B.J. Liquid Film Thickness Behaviour within a Large Diameter Vertical 180° Return Bend. Chem. Eng. Sci. 2014, 107, 137–148. [Google Scholar] [CrossRef]
  11. Abdulkadir, M.; Samson, J.N.; Zhao, D.; Okhiria, D.U.; Hernandez-Perez, V. Annular Liquid Film Thickness Prediction in a Vertical 180° Return Bend. Exp. Therm. Fluid Sci. 2018, 96, 205–215. [Google Scholar] [CrossRef]
  12. López, J.; Ratkovich, N.; Pereyra, E. Analysis of Two-phase Air-Water Annular Flow in U-Bends. Heliyon 2020, 6, e05818. [Google Scholar] [CrossRef] [PubMed]
  13. Li, Z.; Li, J.; Yan, G.; Galindo-Torres, S.; Scheuermann, A.; Li, L. Mesoscopic model framework for liquid slip in a confined parallel-plate flow channel. Phys. Rev. Fluids 2021, 6, 034203. [Google Scholar] [CrossRef]
  14. Traviss, D.P.; Rohsenow, W.M. The Influence of Return Bends on the Downstream Pressure Drop and Condensation Heat Transfer in Tubes; Tech. Rep.; Heat Transfer Laboratory, Department of Mechanical Engineering, MIT: Cambridge, MA, USA, 1971. [Google Scholar]
  15. Wang, C.C.; Chen, I.Y.; Huang, P.S. Two-phase Slug Flow across Small Diameter Tubes with the Presence of Vertical Return Bend. Int. I. Heat Mass Transf. 2005, 48, 2342–2346. [Google Scholar] [CrossRef]
  16. Wang, C.C.; Chen, I.Y.; Lin, Y.T.; Chang, Y.J. A Visual Observation of the Air-Water Two-phase Flow in Small Diameter Tubes Subject to the Influence of Vertical Return Bends. Chem. Eng. Res. Des. 2008, 86, 1223–1235. [Google Scholar] [CrossRef]
  17. Wang, C.C.; Chen, I.Y.; Yang, Y.W.; Chang, Y.J. Two-phase Flow Pattern in Small Diameter Tubes with the Presence of Horizontal Return Bend. Int. J. Heat Mass Transf. 2003, 46, 2975–2981. [Google Scholar] [CrossRef]
  18. Wang, C.C.; Youn Chen, I.; Yang, Y.W.; Hu, R. Influence of Horizontal Return Bend on the Two-Phase Flow Pattern in Small Diameter Tubes. Exp. Therm. Fluid Sci. 2004, 28, 145–152. [Google Scholar] [CrossRef]
  19. Dang, Z.; Yang, Z.; Yang, X.; Ishii, M. Experimental Study of Vertica and Horizontal Two-phase Pipe Flow through Double 90 Degree Elbows. Int. Heat Mass Transf. 2018, 120, 861–869. [Google Scholar] [CrossRef]
  20. Qiao, S.; Kim, S. Air-water Two-phase Bubbly Flow across 90° Vertical Elbows. Part I: Experiment. Int. J. Heat Mass Transf. 2018, 123, 1221–1237. [Google Scholar] [CrossRef]
  21. Qiao, S.; Kong, R.; Kim, S. Air-water Two-phase Bubbly Flow across 90° Vertical Elbows Part II. Model. Int. J. Heat Mass Transf. 2018, 123, 1238–1252. [Google Scholar] [CrossRef]
  22. Jatau, T.; Bello-Ochende, T. Heat Transfer and Flow Pattern Map Development of R134A in a U-Bend Tube for Flow Boiling Evaporation. Int. Commun. Heat Mass Transf. 2021, 128, 105629. [Google Scholar] [CrossRef]
  23. Hoang, K.; Davis, M.R. Flow Structure and Pressure Loss for Two Phase Flow in Return Bends. J. Fluid Eng. 1984, 106, 30–37. [Google Scholar] [CrossRef]
  24. Da Silva Lima, R.J.; Thome, J. Two-Phase Pressure Drops in Adiabatic Horizontal Circular Smooth U-Bends and Contiguous Straight Pipes (RP-1444). Hvac&R Res. 2010, 16, 383–397. [Google Scholar]
  25. Da Silva Lima, R.J.; Thome, J.R. Two-phase Flow Patterns in U-Bends and Their Contiguous Straight Tubes for Different Orientations Tube and Bend Diameters. Int. J. Refrig. 2012, 35, 1439–1454. [Google Scholar] [CrossRef]
  26. Padilla, M.; Revellin, R.; Bonjour, J. Two-phase Flow Visualization and Pressure Drop Measurements of HFO-1234yf and R-134a Refrigerants in Horizontal Return Bends. Exp. Therm. Fluid Sci. 2012, 39, 98–111. [Google Scholar] [CrossRef]
  27. Padilla, M.; Revellin, R.; Wallet, J.; Bonjour, J. Flow Regime Visualization and Pressure Drops of HFO-1234yf, R-134a and R-410A during Downward Two-phase Flow in Vertical Return Bends. Int. J. Heat Fluid Flow 2013, 40, 116–134. [Google Scholar] [CrossRef]
  28. de Oliveira, P.M.; Strle, E.; Barbosa, J.R. Developing Air-Water Flow Downstream of a Vertical 180° Return Bend. Int. J. Multiph. Flow 2014, 67, 32–41. [Google Scholar] [CrossRef]
  29. De Kerpel, K.; De Schampheleire, S.; De Keulenaer, T.; De Paepe, M. Two-phase Frictional Pressure Drop and Flow Behaviour up- and Downstream of a Sharp Return Bend. Appl. Therm. Eng. 2016, 93, 824–838. [Google Scholar] [CrossRef]
  30. Aliyu, A.M.; Almabrok, A.A.; Baba, Y.D.; Lao, L.; Yeung, H.; Kim, K.C. Upward Gas-Liquid Two-phase Flow after a U-Bend in a Large Diameter Serpentine Pipe. Int. J. Heat Mass Transf. 2017, 108, 784–800. [Google Scholar] [CrossRef]
  31. Ma, X.; Liu, T.; Dai, N.; Tian, M.; Li, S. Experimental investigation on the perturbation length for Air-Water flow upstream and downstream of U-Bends. Front. Energy Res. 2022, 10, 906809. [Google Scholar] [CrossRef]
  32. Cepeda-Vega, A.; Amaya-Gómez, R.; Asuaje, M.; Torres, C.; Valencia, C.; Ratkovich, N. Pipeline Two-Phase Flow Pressure Drop Algorithm for Multiple Inclinations. Processes 2022, 10, 1009. [Google Scholar] [CrossRef]
  33. Zhang, H.; Shi, L.; Wang, X.; Sun, R.; Ding, Y.; Tian, H.; Shu, G. Experimental study on the pressure drop characteristics of a supercritical CO2/R134a mixture in a rectangular microchannel. Phys. Fluids 2023, 35, 082013. [Google Scholar] [CrossRef]
  34. Zhang, R.; Tao, F.; Jin, H.; Guo, X.; He, G.; Ma, L.; Zhang, R.Y.; Gu, Q.; Yang, S. Effect of Liquid Properties on Frictional Pressure Drop in a Gas-Liquid Two-Phase Microchannel. Processes 2022, 10, 799. [Google Scholar] [CrossRef]
  35. Domanski, P.A.; Hermes, C.J.L. An Improved Correlation for Two-phase Pressure Drop of R-22 and R-410A in 180° Return Bends. Appl. Therm. Eng. 2008, 28, 793–800. [Google Scholar] [CrossRef]
  36. Padilla, M.; Revellin, R.; Bonjour, J. Prediction and Simulation of Two-phase Pressure Drop in Return Bends. Int. J. Refrig. 2009, 32, 1776–1783. [Google Scholar] [CrossRef]
  37. Sharma, M.; Ravi, P.; Ghosh, S.; Das, G.; Das, P.K. Studies on Low Viscous Oil-Water Flow through Return Bends. Exp. Therm. Fluid Sci. 2011, 35, 455–469. [Google Scholar] [CrossRef]
  38. Dassler, C.; Janoske, U. Experimental Investigation of Single- and Two-phase Pressure Drop in Slender Rectangular 180° Return Bends. Exp. Therm. Fluid Sci. 2019, 103, 126–132. [Google Scholar] [CrossRef]
  39. Zhu, H.; Hu, J.; Gao, Y. Severe slug flow-induced nonlinear dynamic behavior of a flexible catenary riser. Phys. Fluids 2021, 33, 071705. [Google Scholar] [CrossRef]
  40. Li, C.; Fang, X.; Dai, Q. An experimental investigation of flow boiling instability of R245fa in a horizontal tube. Phys. Fluids 2023, 35, 084122. [Google Scholar] [CrossRef]
  41. Ma, X.; Tian, M.; Zhang, J.; Tang, L.; Liu, F. Flow pattern identification for two-phase flow in a U-bend and its contiguous straight tubes. Exp. Therm. Fluid Sci. 2018, 93, 218–234. [Google Scholar] [CrossRef]
  42. De Kerpel, K.; Ameel, B.; Huisseune, H.; Tjoen, C.; Canire, H.; De Paepe, M. Two-phase Flow Behaviour and Pressure Drop of R134a in a Smooth Hairpin. Int. Heat Mass Transf. 2012, 55, 1179–1188. [Google Scholar] [CrossRef]
  43. Taylor, J.R. An Introduction to Error Analysis: The Study of Uncertainties in Physical Measurements; University Science Books: Sausalito, CA, USA, 1997. [Google Scholar]
  44. McAdams, W.H.; Wood, W.K.; Bryan, R.L. Vaporization inside horizontal tubes-II-benzene-oil mixtures. Trans. ASME 1942, 66, 671–684. [Google Scholar] [CrossRef]
  45. Awad, M.M.; Muzychka, Y.S. Effective property models for homogeneous two-phase flows. Exp. Therm. Fluid Sci. 2008, 33, 106–113. [Google Scholar] [CrossRef]
  46. Chisholm, D. Pressure gradients due to friction during the flow of evaporating two-phase mixtures in smooth tubes and channels. Int. J. Heat Mass Transf. 1973, 16, 347–358. [Google Scholar] [CrossRef]
  47. Friedel, L. Improved Friction Pressure Drop Correlation for Horizontal and Vertical Two-Phase Pipe Flow. In Proceedings of the European Two-Phase Flow Group Meeting, Ispra, Italy, 5–8 June 1979; pp. 485–492. [Google Scholar]
  48. Müller-Steinhagen, H.; Heck, K. A simple friction pressure drop correlation for two-phase flow in pipes. Chem. Eng. Prog. 1986, 20, 297–308. [Google Scholar] [CrossRef]
  49. Xu, Y.; Fang, X. A new correlation of two-phase frictional pressure drop for evaporating flow in pipes. Int. J. Refrig. 2012, 35, 2039–2050. [Google Scholar] [CrossRef]
  50. Zhang, W.; Hibiki, T.; Mishima, K. Correlations of two-phase frictional pressure drop and void fraction in mini-channel. Int. J. Heat Mass Transf. 2010, 53, 453–465. [Google Scholar] [CrossRef]
  51. Yan, G.; Li, Z.; Bore, T.; Torres, S.A.G.; Scheuermann, A.; Li, L. A lattice Boltzmann exploration of two-phase displacement in 2D porous media under various pressure boundary conditions. J. Rock Mech. Geotech. 2022, 14, 1782–1798. [Google Scholar] [CrossRef]
  52. Qiu, B.; Yang, Q.; Yan, J.; Li, G.; Revankar, S. Experimental investigation on the propagation characteristics of pressure oscillation in direct contact condensation with low mass flux steam jet. Exp. Therm. Fluid Sci. 2017, 88, 400–408. [Google Scholar] [CrossRef]
Figure 1. Schematic diagram of the experimental apparatus [31].
Processes 12 00277 g001
Figure 2. Test sections for pressure drop measurements. (a) Downward flow; (b) upward flow [31].
Processes 12 00277 g002
Figure 3. Ratio S between the pressure gradient in the interval section (P1′P2′ or P2P1 in Figure 2) close to the U-bend (D = 9 mm and R = 37.5 mm) and that in the reference developed section (P8P7 in Figure 2) for downward flow. (a) Downstream straight tube, +7.5D; (b) upstream straight tube, –7.5D.
Processes 12 00277 g003
Figure 4. Comparison of pressure gradient ratio S for different flow patterns (green bar: annular flow; red bar: slug flow; black bar: plug flow).
Processes 12 00277 g004
Figure 5. Flow visualizations of the U-tube (D = 9 mm R = 37.5 mm) with Ul = 0.20 m/s and Ug = 0.37 m/s for plug flow (red arrow in the figure represents flow direction; time interval is 160 ms; (ad, eh, il) represent the evolution of gas–liquid distribution along the inlet straight tube section, along the downward flow, and along the upward flow of the U-bend, respectively).
Processes 12 00277 g005
Figure 6. Flow visualizations of the U-tube (D = 9 mm R = 37.5 mm) with Ul = 0.20 m/s and Ug = 5.59 m/s for slug flow (red arrow in the figure represents flow direction; time interval is 16 ms; (ad, eh, il) represent the evolution of gas–liquid distribution along the inlet straight tube section, along the downward flow, and along the upward flow of the U-bend, respectively).
Processes 12 00277 g006
Figure 7. Flow visualizations of the U-tube (D = 9 mm R = 37.5 mm) with Ul = 0.20 m/s and Ug = 16.59 m/s for annular flow (red arrow in the figure represents flow direction; time interval is 16 ms; (ad, eh, il) represent the evolution of gas–liquid distribution along the inlet straight tube section, along the downward flow, and along the upward flow of the U-bend, respectively).
Processes 12 00277 g007
Figure 8. Pressure pulsations at different axial measurement points of the inlet straight tube (1 s).
Processes 12 00277 g008
Figure 9. Pressure pulsations at different axial measurement points of the outlet straight tube (1 s).
Processes 12 00277 g009
Figure 10. Pressure pulsations at different axial measurement points of outlet straight tube (0.1 s).
Processes 12 00277 g010
Figure 11. Spectral variation in pressure pulsations along the U-tube inlet straight tube.
Processes 12 00277 g011
Figure 12. Spectral variation in pressure pulsations along the U-tube outlet straight tube.
Processes 12 00277 g012
Figure 13. Power spectrum values at the pressure measurement points along the inlet straight tube.
Processes 12 00277 g013
Figure 14. Power spectrum values at the pressure measurement points along the outlet straight tube.
Processes 12 00277 g014
Table 1. Distance from the center of each segmental measurement section to the bend inlet (A) or outlet (B) [31].
Inlet Interval
Segments
Location of
Center/D
Outlet Interval
Segments
Location of
Center/D
P8P7−105P1′P2+7.5
P7P6−70P2′P3+15
P6P5−52.5P3′P4+25
P5P4−37.5P4′P5+37.5
P4P3−25P5′P6+52.5
P3P2−15P6′P7+70
P2P1−7.5P7′P8+105
Table 2. Six selected two-phase frictional pressure drop correlations.
AuthorCorrelation
HFM-based
correlations
McAdams et al. [44] 1 μ t p = x μ g + 1 x μ l   1
Awad and Muzychka [45] μ t p = μ l 2 μ l + μ g 2 μ l μ g x 2 μ l + μ g + μ l μ g x     2
SFM-based
correlations
Chisholm [46] ϕ l o 2 = 1 + Y 2 1 B x 1 x 0.875 + x 1.75 Y 2 = Δ p / Δ L g o Δ p / Δ L l o     3 If   0 < Y < 9.5 , B = 55 / G t p 0.5   G t p 1900   kg / m 2 s 2400 500 < G t p < 1900   kg / m 2 s 4.8 G t p 500   kg / m 2 s     4 If   9.5 < Y < 28 , B = 520 / Y G t p 0.5 G t p 600   kg / m 2 s 21 / Y G t p > 600   kg / m 2 s 5 If   Y > 28 , B = 15,000 / Y 2 G t p 0.5     6
Friedel [47] ϕ l o 2 = 1 x 2 + x 2 ρ l f g o ρ g f l o + 3.24 x 0.78 1 x 0.224 H F r t p 0.045 W e t p 0.035     7 H = ρ l ρ g 0.91 μ g μ l 0.19 1 μ g μ l 0.7 F r t p = G t p 2 g D ρ t p 2 , 1 ρ t p = x ρ g + 1 x ρ l     8
Muller-Steinhagen and Heck [48] ϕ l o 2 = Y 2 x 3 + 1 x 1 / 3 1 + 2 x Y 2 1
Xu and Fang [49] ϕ l o 2 = Y 2 x 3 + ( 1 x ) 0.33 1 + 2 x Y 2 1 1 + 1.54 1 x 0.5 L a     9
where Y is defined according to Chisholm [46], La is defined according to Zhang [50].
1,2 µtp: two-phase viscosity; µg: vapor viscosity; µl: liquid viscosity; x: dryness. 3ϕl0: the Lockhart–Martinelli two-phase multiplier; Y: physical property coefficient; equation B: coefficient; ∆p: pressure drop; ∆L: length. 4,5,6 Gtp: mass velocity. 7 ρl: density of liquid phase; ρg: density of gas phase; fgo: gas-phase friction factor; flo: liquid-phase friction factor; Frtp: two-phase Froude number; Wetp: two-phase Weber number. 8 g: acceleration of gravity; D: outside diameter; ρtp: two-phase density. 9 La: Laplace constant.
Table 3. Comparison of frictional pressure drop between measurements and correlations.
AuthorInlet Tube Section (P7P8)Outlet Tube Section (P7′P8′)
MADMRDMADMRD
McAdams [44]+27.9−24.1+32.4−30.6
Awad and Muzychka [45]+28.0−15.5+29.0−23.1
Chisholm [46]+27.8−12.7+27.4−20.4
Friedel [47]+30.7+19.9+21.4+9.7
Muller-Steinhagen and Heck [48]+33.0−28.9+36.7−35.2
Xu and Fang [49]+27.9−10.3+27.3−18.2
Disclaimer/Publisher’s Note: The statements, opinions and data contained in all publications are solely those of the individual author(s) and contributor(s) and not of MDPI and/or the editor(s). MDPI and/or the editor(s) disclaim responsibility for any injury to people or property resulting from any ideas, methods, instructions or products referred to in the content.

