Abstract
The distribution law of the ground stress field is of great significance in guiding the design of coal mine roadway alignment, determining the parameters of roadway support, and preventing and controlling the impact of ground pressure in coal mines. A geostress inversion method combining Rhino surface modeling and FLAC3D 6.0 numerical simulation software is proposed. Based on the geological data of the coal mine and the results of on-site measurements, a three-dimensional geological model of Yingcheng Coal Mine is established for the geostress inversion, and the distribution law of the geostress field in Yingcheng Coal Mine is obtained. Research shows the following: (1) The horizontal maximum principal stress values of the Yingcheng Mine are between 33.9 and 35.3 MPa, the horizontal minimum principal stress values are between 23.6 and 25.4 MPa, and the direction of the horizontal maximum principal stress is roughly in the southwest to west direction; (2) the three-way principal stress magnitude relationship is , indicating that the horizontal stress dominates in the study area, which belongs to the slip-type stress state; (3) The maximum principal stress of No. 3 coal seam is 33.1–34.8 MPa, the middle principal stress is 27.5–29.2 MPa, and the minimum principal stress is 17.3–22.9 MPa. Due to the influence of topography and burial depth, there is a phenomenon of stress concentration in some areas. By comparing the inversion values with the measured values, the accuracy of the geostress inversion is high, and the initial geostress inversion method based on Rhino surface modeling accurately inverts the geostress distribution pattern of the Yingcheng coal mine.
1. Introduction
Geopathic stress is the internal stress, also known as protolithic stress, of a rock mass under naturally occurring conditions [1,2,3]. Coal is an important basic energy source, and with the increasing depletion of shallow resources, coal mining is deepening year by year [4,5,6,7]. Compared with shallow mining, the deep mining project faces a more complex geostress environment. The basic physical and mechanical properties of the deep rock body under the action of the initial geostress field and the kinetic response characteristics of the downhole excavation perturbation will also change, and the difficulty of the downhole roadway support as well as the risk of impact ground pressure will increase [8,9,10,11,12,13]. Practice has proved that the study of the distribution law of geostress in underground coal mines is of great significance for the rational design of the direction of the roadway in underground coal mines, determining the support parameters of the roadway section, and further improving the prevention and control of impact ground pressure in coal mines [14,15,16,17,18,19]. Difficulties exist in directly measuring geostress conditions in all areas of a coal mine due to the high cost of geostress field testing. Based on the geological data of the Yingcheng coal mine and the measured results of ground stress, the initial ground stress of the coal mine is inverted to obtain the distribution law of the ground stress of the coal mine, which can provide data support for the design of the direction of the underground roadway and the selection of the roadway support parameters of the Yingcheng coal mine, so as to effectively prevent the occurrence of impact ground pressure.
Many experts and scholars have performed extensive and in-depth research on geostress inversion [20,21,22,23,24,25]. Tian Yong et al. [26] used ANSYS numerical software to establish a well model considering the boundary effect, and the inversion of the stress field was carried out using a multi-constraint method; Kong Peng et al. [27] used ABAQUS finite element software to establish a geological model considering different fault zones, and also calculated the geostress in Kakizhuang South area considering the accuracy of the magnitude and direction of the geostress; Zhao Yu et al. [28] used the pre-processing software Hypermesh to establish the underground plant model and combined it with MATLAB for multiple regression analysis to study the ground stress inverse in the underground plant of the water storage station; Liu Quansheng et al. [29] simplified the stratigraphy into an inclined stratigraphy to establish a mine model, optimized the model boundary conditions using a vector regression algorithm, and applied the best boundary conditions to the model to obtain the ground stress field of the whole region; Meng Wei et al. [30,31] used Surfer software to interpolate the actual terrain onto the three-dimensional (3D) model and inverted the initial ground stress field in the rockburst area based on the lateral pressure coefficient.
All of the above geostress inversion methods have achieved some success. However, in the initial geostress inversion process, the construction of the geological model has an important influence on the calculation results. In most cases, different areas of the same formation are not at the same elevation, and existing geostress inversion models are generally constructed without taking into account that the individual formations are undulating surfaces. In order to solve this problem and improve the accuracy of the inversion results of the initial ground stress field, it is necessary to model the inversion by fitting the interfaces of the rock layers into undulating surfaces. Based on the geological data of the Yingcheng coal mine and the on-site measurement results, the inversion method of Rhino surface modeling combined with FLAC3D numerical simulation was adopted to study the initial geostress distribution law of the Yingcheng coal mine.
2. Project Overview
Yingcheng Coal Mine is located between Jilin City and Changchun City, in the east of Jiutai City; there are Longjiabao Coal Mine and Yangcaogou Coal Mine in the southwest of Yingcheng Coal Mine, and Hua’an Coal Mine and Shuangxin Coal Mine in the south. Yingcheng Coal Mine is located in the Songliao Plain sub-district. The terrain is gradually low and gentle from southeast to northwest, and the terrain is flat, with an elevation of +170 to +183 m. Most of the area is covered by the Quaternary System, with the main lithology of sandstone, shale, and sandy shale, and the coal-forming stratum is the Lower Cretaceous Yingchengzi Formation. The minefield covers an area of 16.916 km2 and five mining areas within the field, namely, the new first mining area, the new second mining area, the new third mining area, the new fourth mining area, and the new fifth mining area, and the current production mining area is the new first mining area, the new second mining area, with the elevation of coal seams ranging from −630 to −980 m, and the main mining of the No. 3 coal seam. The average thickness of the No. 3 coal seam is 7.5 m, with a relatively stable thickness and simple structure. The direct top of the coal seam is white sandstone and siltstone, with a thickness of 10 m. The old top is coarse sandstone, with a thickness of 17–20 m. The direct bottom is fine sandstone and coarse sandstone, with a thickness of 10 m. The geological structure of the well field is dominated by fracture structures, and there are more small fracture structures, which have been proved by underground mining to have little influence on the coal seams, and their influence can be ignored when constructing the three-dimensional geological model of the mining area.
3. In-Situ Ground Stress Tests
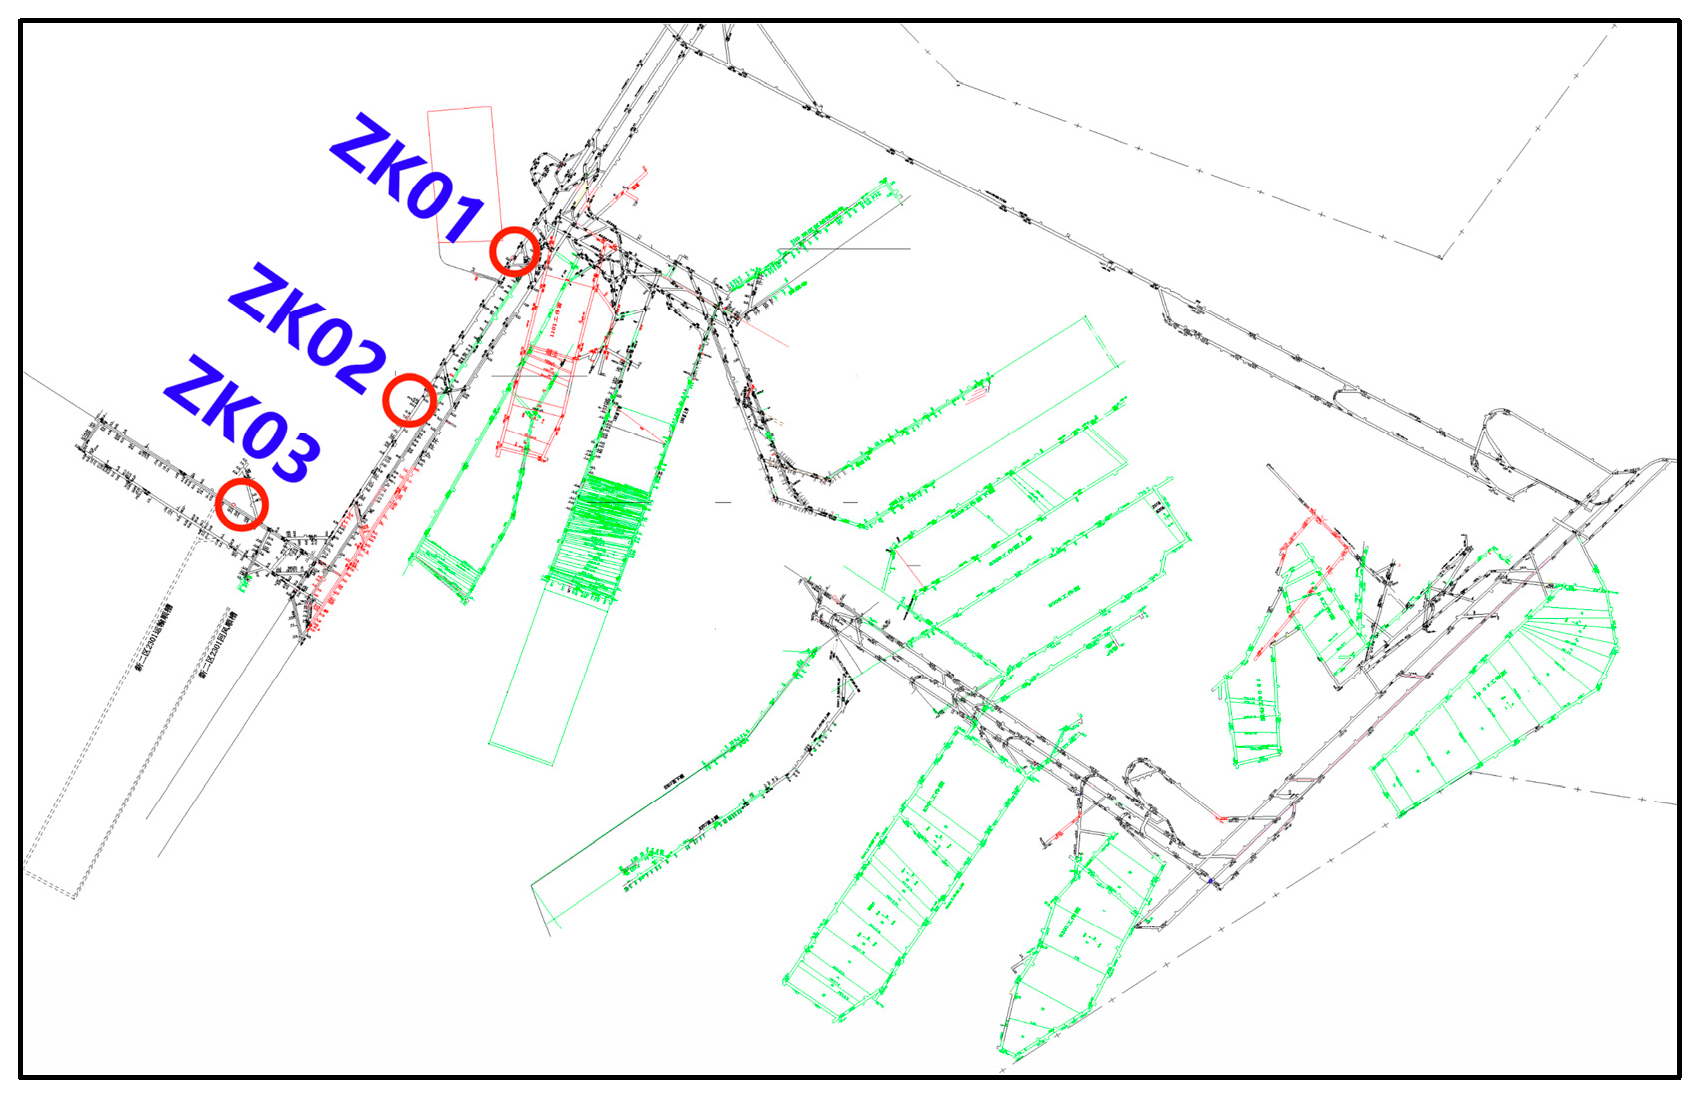
Ground stress tests were conducted in the field using the hollow envelope stress relief method. According to the mining layout of the mine, three measurement locations were identified, namely, 2301 lower downwind (ZK01), the second mining area transportation alley No. 2 Xiaochuan (ZK02), and the second mining area transportation alley No. 1 Xiaochuan (ZK03). The locations of the measurement points are shown in Figure 1, and the technical parameters of the measurement points are shown in Table 1. All of the field boreholes are in the stress zone of the original rock, and the stress relief holes are located in the stabilized rock layer.
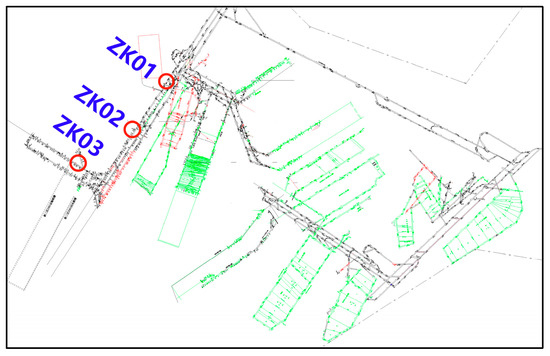
Figure 1.
Arrangement of boreholes for ground stress measurements in the field.

Table 1.
Borehole parameters for field geostress measurements.
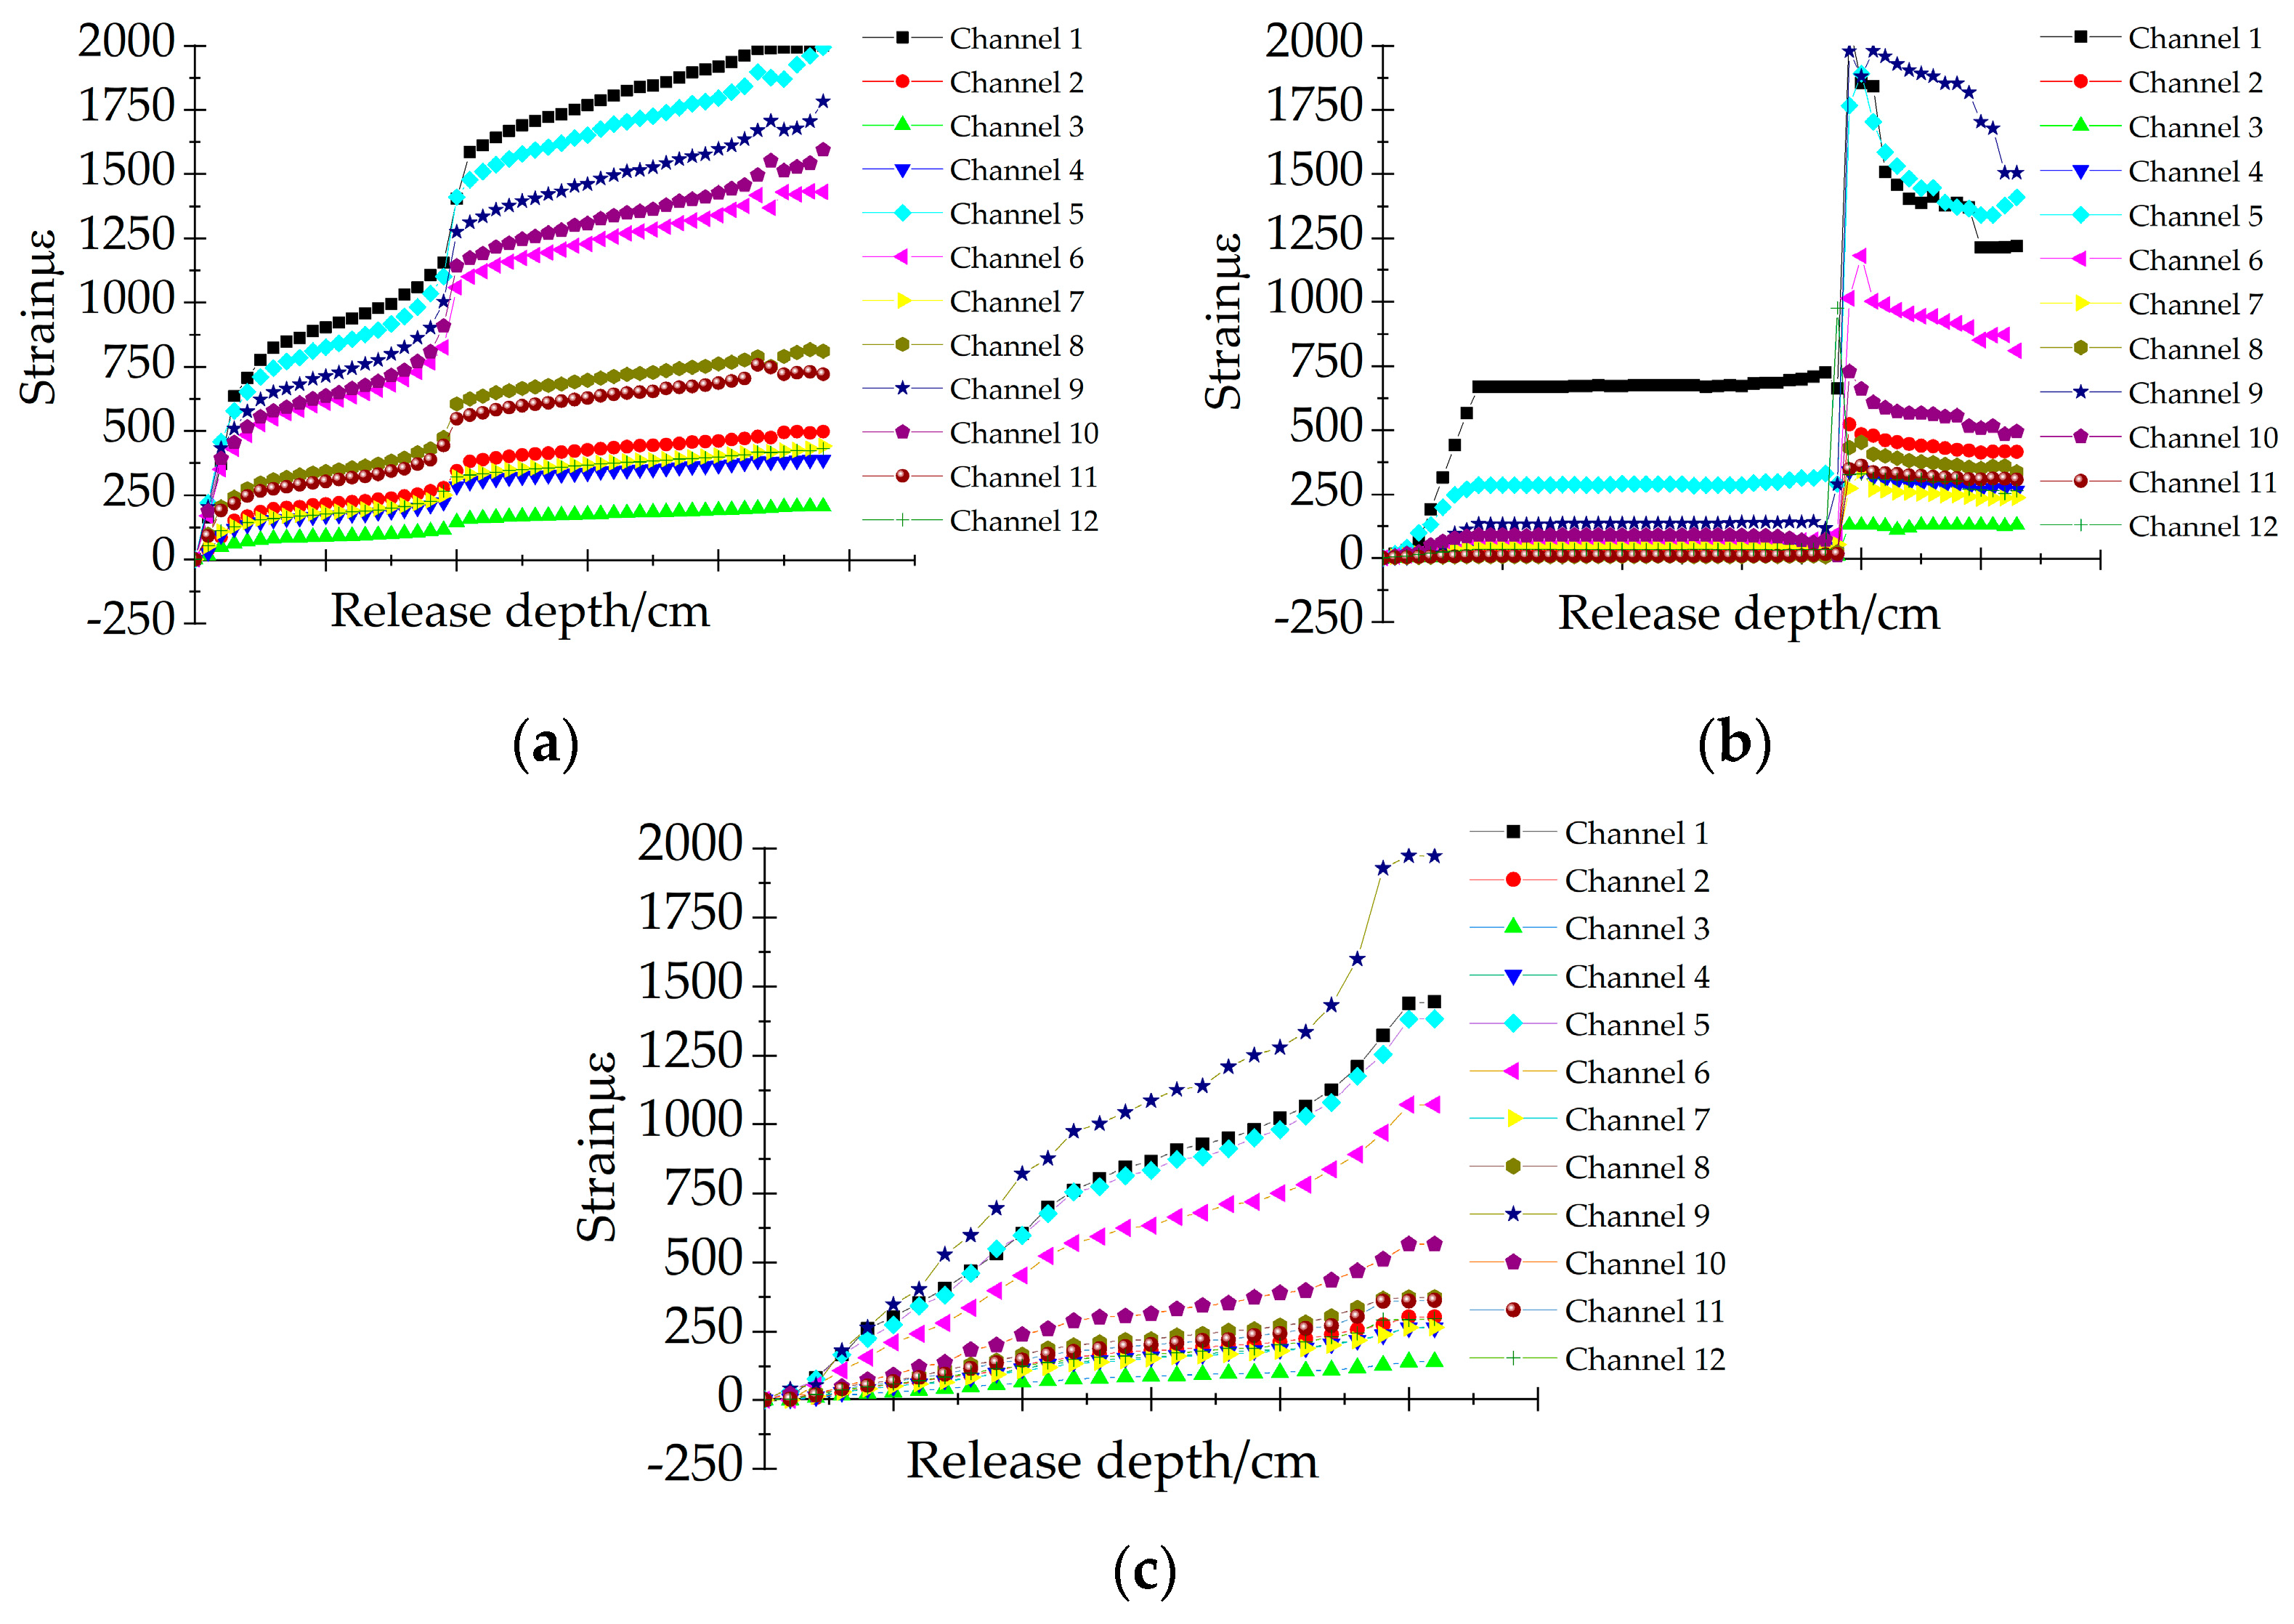
The cores with hollow envelope strain gauges were placed in a perimeter pressure ratemeter for ratemaking, and the modulus of elasticity and Poisson’s ratio of the cores were calculated. Table 2 shows the data table of the ground stress measurement test, and the stress relief process of the boreholes at the three measurement points is shown in Figure 2.
Table 2.
Experimental data from on-site geostress boreholes and core measurements.
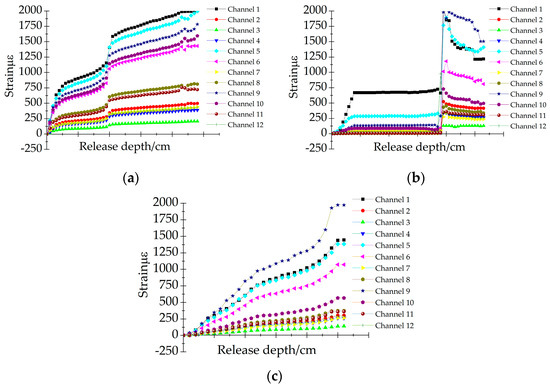
Figure 2.
Strain–displacement graph during stress relief of drilled hole: (a) Drilling ZK01; (b) Drilling ZK02; (c) Drilling ZK03.
According to the strain value obtained from the lifting curve, the orientation information of the measurement point, and the elastic modulus and Poisson’s ratio of the core, the magnitude and direction of the principal stress at the three measurement points can be obtained, and the results of the ground stress measurements at the three measurement points are shown in Table 3.
Table 3.
Geostress measurements in the field.
Analyzing the results of the measurements,
- (1)
- The maximum principal stresses at the three measurement points were 33.9 MPa, 35.3 MPa, and 34.8 MPa, with an average of 34.7 MPa; The intermediate principal stresses were 26.2 MPa, 27.4 MPa, and 27.9 MPa, with an average of 27.2 MPa; the minimum principal stresses were 23.6 MPa, 24.8 MPa, and 25.4 MPa, with an average of 24.6 MPa. According to the relevant standards of the geostress level in the mining area, the geostress of the Yingcheng coal mine belongs to the high-stress area;
- (2)
- The maximum principal stress azimuths of the three measurement points are 263.1°, 229.8°, and 222.8°, with an average of 238.6°, and the inclination angles are −3.7°, −5.4°, and −0.5°, with an average of −3.2°; the intermediate principal stress azimuths were 19.2°, 28.5°, and 23.8° with an average of 23.8°, and the inclinations were −81.6°, −84.2°, and −89.3° with an average of −85.0°; minimum principal stress azimuths were 172.6°, 139.6°, and 132.8°, with an average of 148.3°, and inclination angles were −7.5°, −2.1°, and 0.5°, with an average of −3.0;
- (3)
- The maximum principal stress in the area of the three measurement points is horizontal stress, the middle principal stress is vertical principal stress, and the inclination angle of the minimum principal stress is close to horizontal, indicating that the horizontal stress in the area of the measurement points is dominant, and it belongs to the state of go-slip type stress.
- (4)
- The ratio of the maximum horizontal principal stress to the minimum horizontal principal stress at the three measurement points ranges from 1.37 to 1.44, and the horizontal principal stresses show obvious directionality, with the direction of the maximum horizontal principal stress at the level of the three measurement points being in the direction of SW~W.
4. Inversion of the Initial Ground Stress Field in the Mining Area
4.1. Model Building
According to the inversion range of Yingcheng Coal Mine, the model size was determined to be 3104 m in length and 2645 m in width, and the distribution elevation of coal seams in the inversion area was from −630 to −980 m, and the depth of the coal seams was more than below −800 m; therefore, it was determined that the model height was calculated from elevation-1100 m to elevation-600 m, which meant that the height was limited to 500 m. Combined with the geological data of Yingcheng Coal Mine, the coal rock layer is divided into seven layers, and the physical and mechanical parameters of each layer are shown in Table 4.
Table 4.
Coal and rock stratification and physical and mechanical parameters of each stratum.
- (1)
- The Rhino surface-based modeling process is as follows:
The histograms of 22 geological boreholes in the inversion area were analyzed to extract the height information of key rock stratigraphic interfaces, and the information is shown in Table 5.
Table 5.
Drill hole spatial coordinate data information.
- (2)
- Mark the borehole markers at key stratigraphic interfaces, connect the markers, and fit them to a rock surface using a B-spline curve.
The B-spline curve is a kind of segmented polynomial curve, which can change the shape of the curve by controlling the local coordinate points and is commonly used to construct various engineering geological models [32]. B-spline curves can be categorized into uniform B-spline curves, quasi-uniform B-spline curves, and non-uniform B-spline curves (NURBS) [33,34]. Where NURBS can represent any curved surface, the generalized B-spline curve mathematical formula is as follows:
where P(t) is the B-spline curve; Pi is the coordinates of the control point; n is the number of control points Pi; d is the order of the continuity of the control curve; Bi, n(t) is the d-order B-spline basis function.
The rock surface can be viewed as a splice of three times B-spline curves. According to Equation (1), after transformation, the expression of the cubic B-spline curve P(t) defined by the four points P0, P1, P2, and P3 can be obtained as follows:
Further, the cubic B-spline segments can be written as parabolic equations about t:
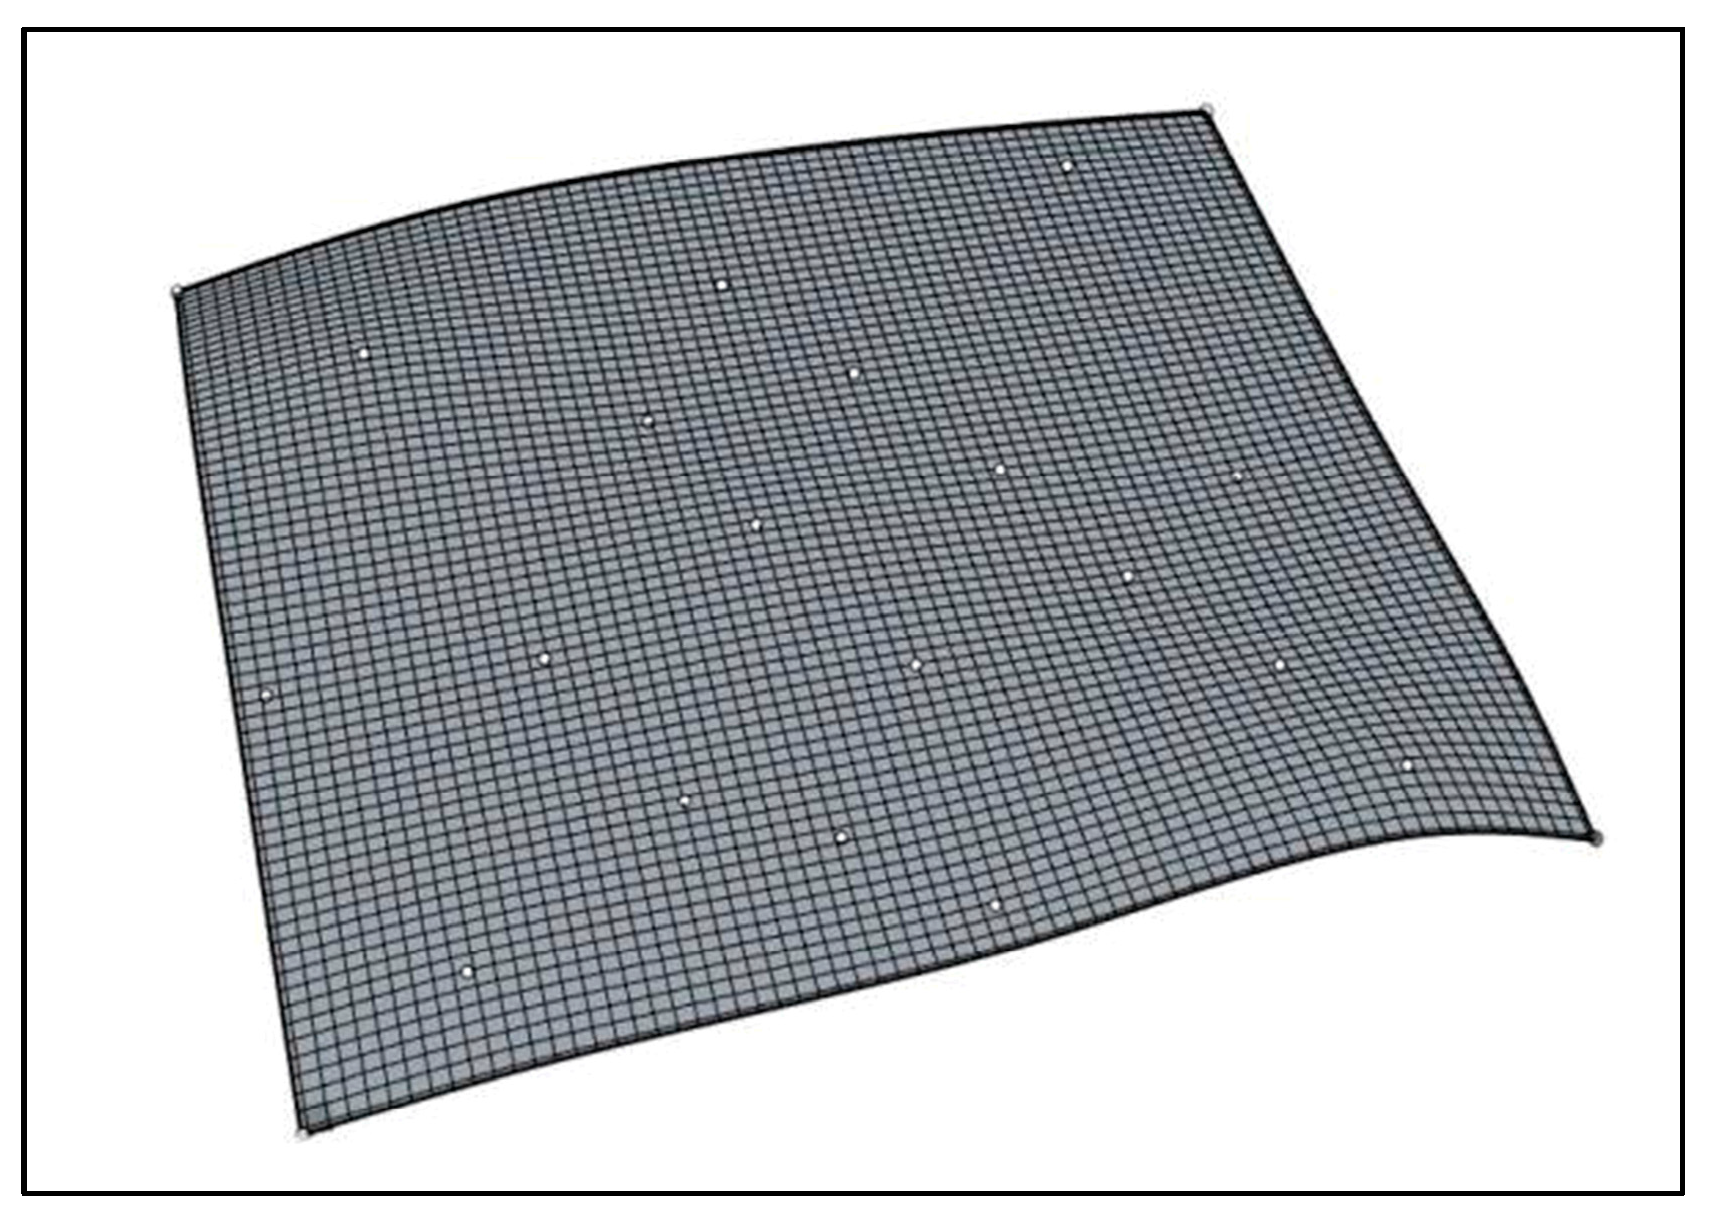
In the above Equation, P0, P1, P2, and P3 are the four control points of the B-spline curve, and according to the coordinates of the control points, we can obtain the three B-spline curves (surfaces) of the corresponding formations and then we finally fit the surface of the geologic formations, which is shown in Figure 3, and it can be seen that the surface’s undulation is very similar to that of the ground, and the surface can represent the rock formations in the modeling.
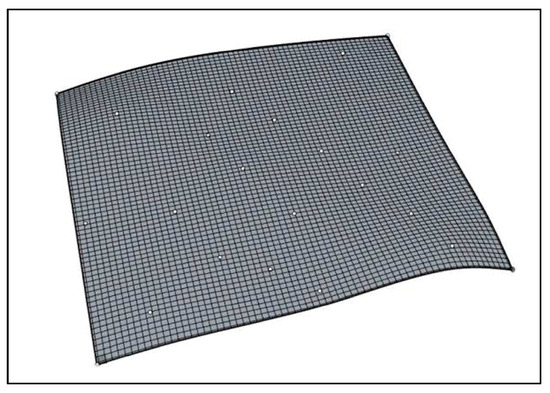
Figure 3.
Geological borehole fitted rock surface.
- (3)
- Using the griddle plug-in in Rhino 7.0 software to merge the fitted surfaces, the model was divided by the hexahedral meshing method, with a maximum grid of 20 m and a minimum grid of 2 m, generating a total of 919,113 cells and 165,564 nodes and obtaining the three-dimensional geological model of Yingcheng Coal Mine, as shown in Figure 4.
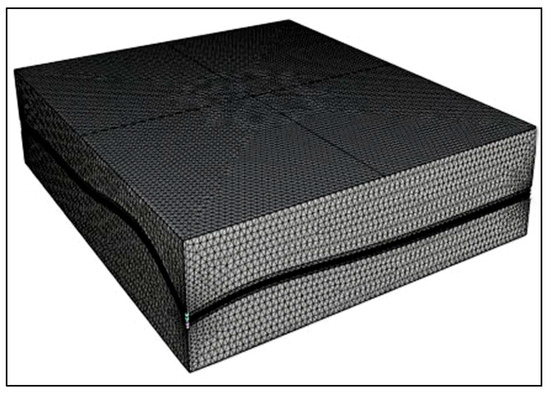 Figure 4. Three-dimensional geological model constructed by Rhino software.
 - (4)
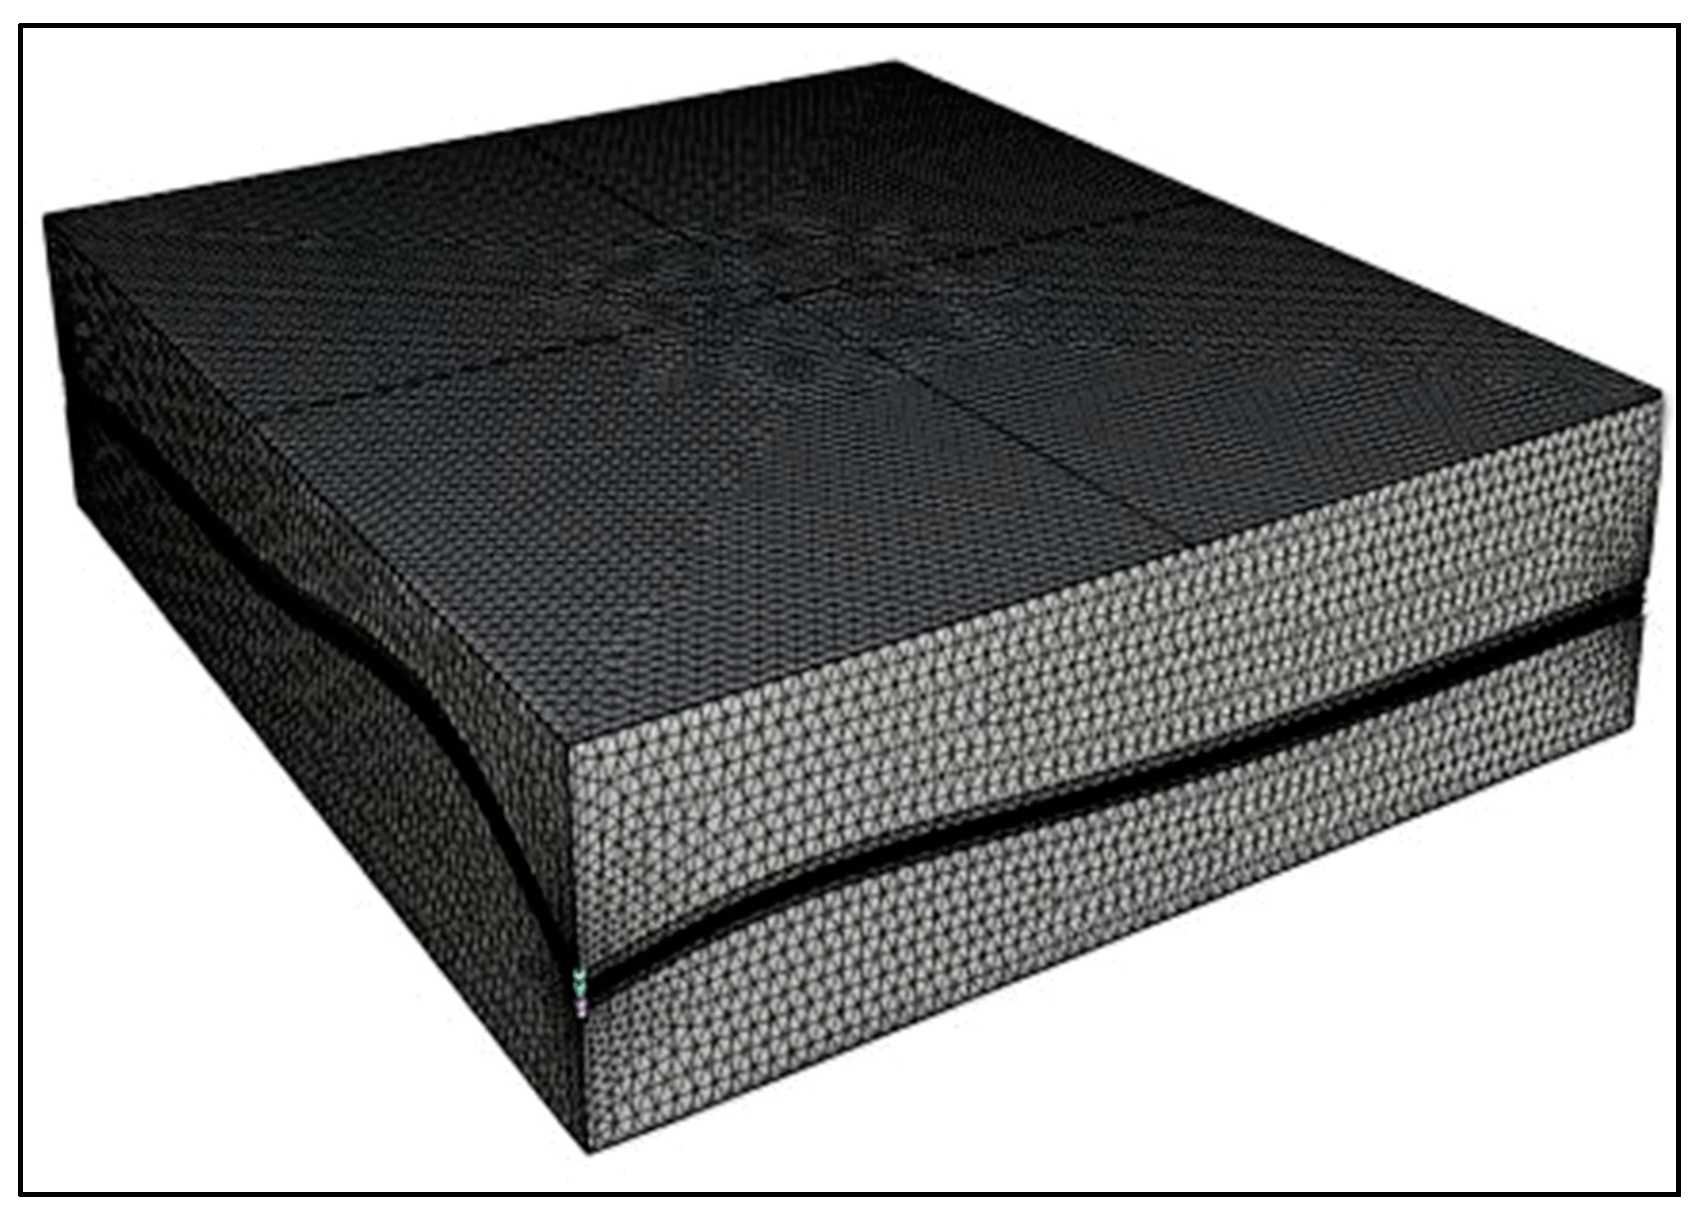
- The three-dimensional geologic model was imported into the FLAC3D 6.0 numerical simulation software, and the physical and mechanical parameters in Table 4 of each layer were assigned to generate the FLAC3D numerical calculation model, as shown in Figure 5. The Mohr–Coulomb yield criterion was adopted for the present constitutive relationship.
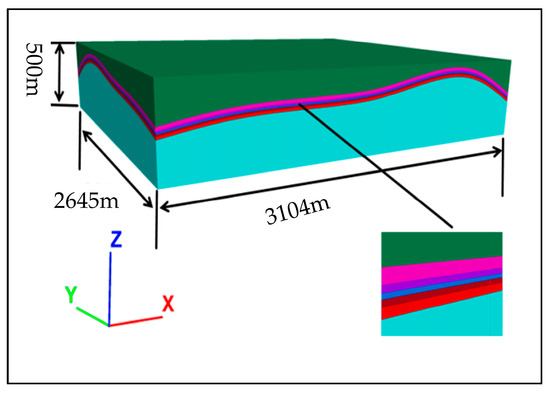 Figure 5. FLAC3D three-dimensional geological model and boundary range.
4.2. Model Inversion
The formation of the initial ground stress field in a coal mine is related to many factors; self-gravity and geological tectonics are the main influencing factors of the initial ground stress field, and the initial ground stress inversion is mainly the inversion of the horizontal stress field, which is mainly composed of self-gravitational stress field and horizontal stress field caused by tectonic movement, and the calculation formula is as follows:
where is the horizontal stress field generated by the action of self-weight, and is the horizontal stress field generated by the action of tectonic motion.
- where the self-gravitating stress field is shown in Equation (5):
The tectonic stress field is shown in Equations (6) and (7):
where is the horizontal pressure in the x-direction; is the horizontal pressure in the y-direction; k1, k2 are the lateral pressure coefficients under the action of self-weight stress.
There are six boundaries in the three-dimensional geological model of Yingcheng Coal Mine, and different boundary constraints and load conditions are applied in the inversion process, which is divided into two stages: inversion of self-gravity stress field and inversion of tectonic stress field.
- (1)
- Self-gravitating stress field inversion: Normal constraints are applied to the bottom surface and all around the model, and a free boundary is used on the top surface of the model, where the model reaches equilibrium under the effect of self-weight due to the self-gravitational stresses of the overlying rock layer applied on the top surface;
- (2)
- Tectonic stress field inversion: The boundary conditions that relieve the normal constraints on the four sides of the model, the stress boundary conditions imposed on the two side faces perpendicular to the x-axis, and the stress boundary conditions imposed on the two side faces perpendicular to the y-axis, are calculated until equilibrium.
5. Geostress Inversion Results and Analysis
5.1. Characteristics of the Stress Distribution in the Plane of the Measurement Point
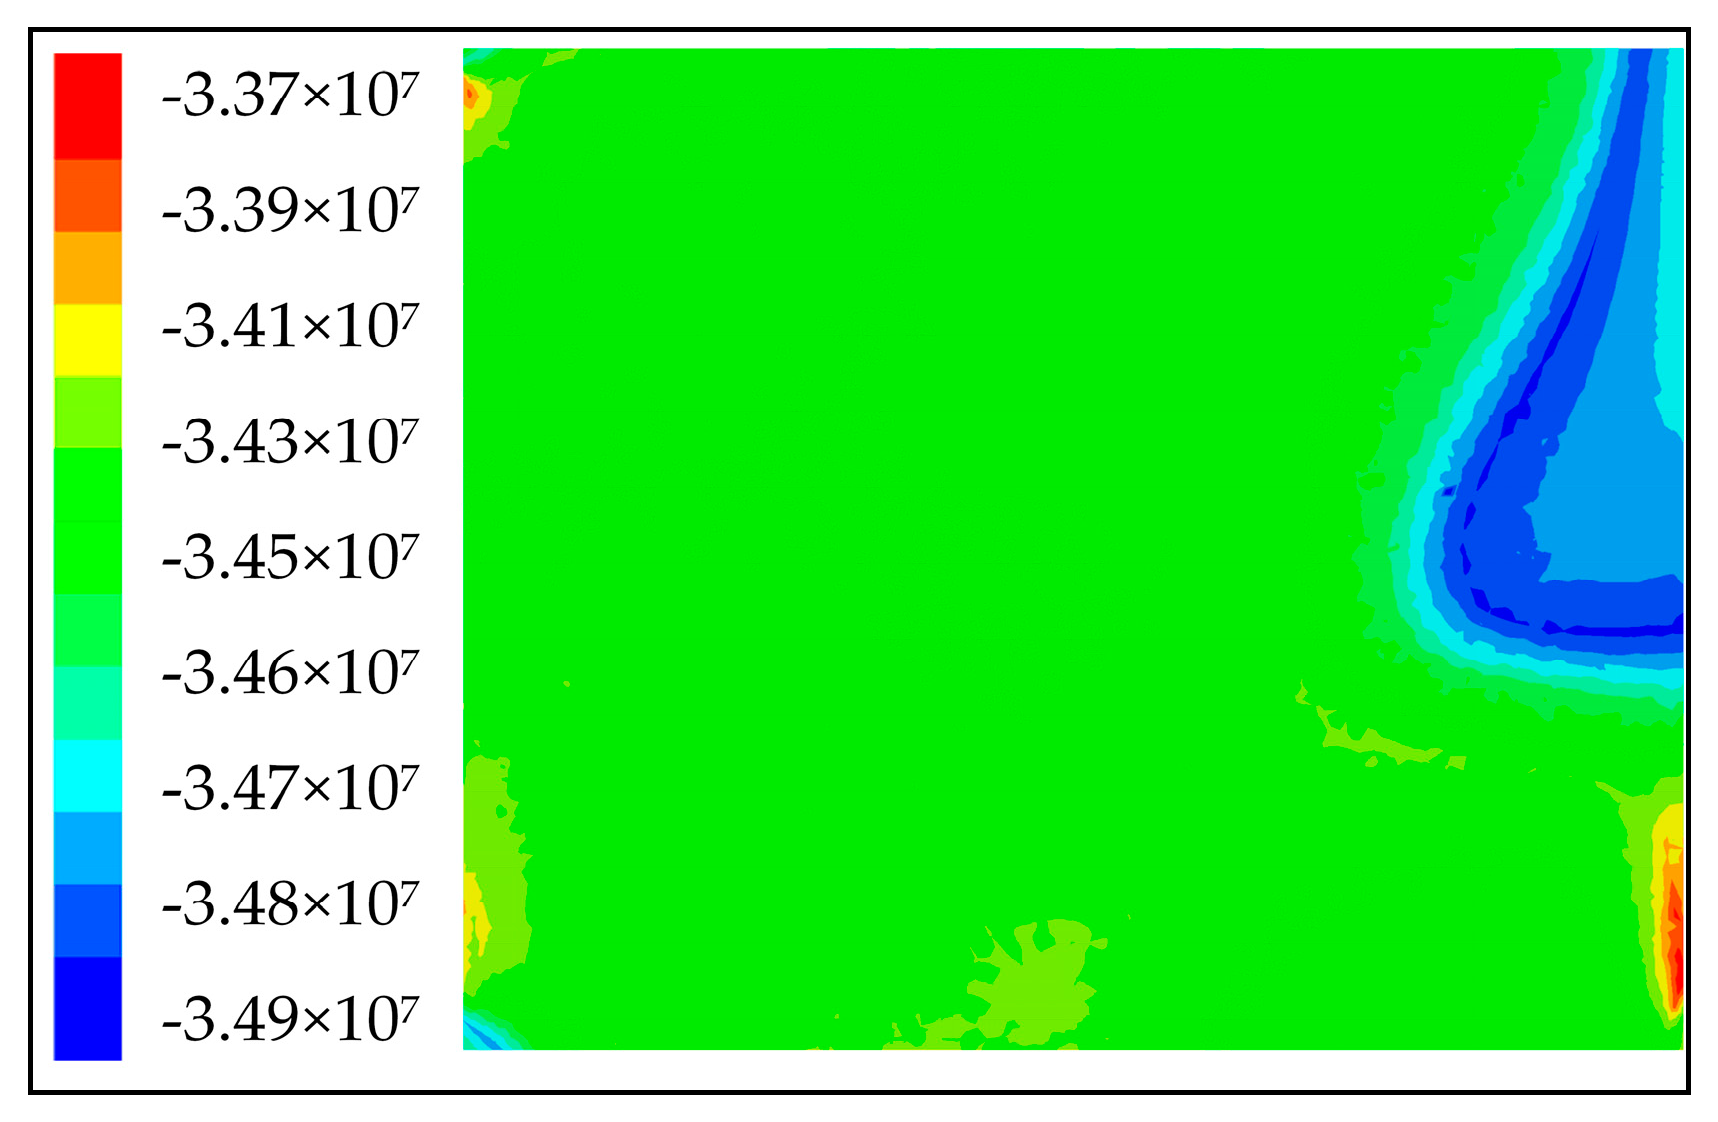
According to the numerical simulation results of Yingcheng Coal Mine, combined with the elevation of about −900 m at three measured points, the maximum principal stress cloud map of the −900 m horizontal elevation plane is extracted as Figure 6. From Figure 6, it can be seen that the maximum principal stress value of the rock layer in the plane of −900 level elevation is 33.7~34.9 MPa, and the maximum principal stress value of most of the area is in the range of 34.1~34.6 MPa, which belongs to the high-stress level. Overall, the northeast region of the level shows a significant stress concentration, and the maximum principal stresses in this region are significantly higher than those in other regions.
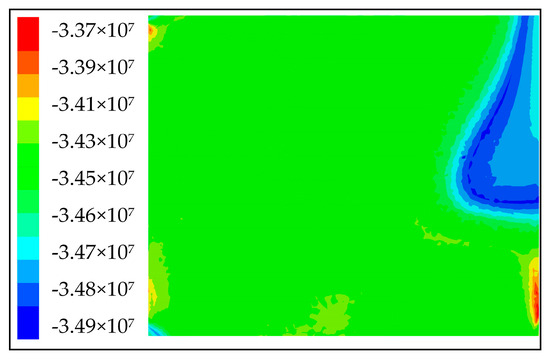
Figure 6.
The maximum principal stress cloud diagram of the −900 m horizontal elevation plane.
5.2. Stress Distribution Characteristics of No. 3 Coal Seam
- (1)
- Maximum principal stress
According to the numerical simulation results of Yingcheng Coal Mine, the maximum principal stress cloud map of the No. 3 coal seam was extracted and projected to the mining engineering plan, as shown in Figure 7.
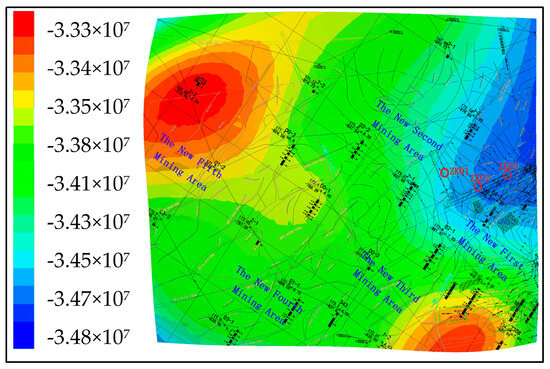
Figure 7.
Maximum principal stress cloud of No. 3 coal seam.
From the figure, it can be seen that the maximum geopathic stress varies from one mining area to another, which is described in the following subregions:
- (1)
- The maximum principal stress value in the new first mining area is 33.4~34.7 MPa, the maximum principal stress in the northern location of the new first mining area is 34.4~34.7 MPa, and the maximum principal stress value decreases sharply when it is arranged in the southern part of this mining area, and the minimum value appears near the demarcation of the new second and the new third mining areas, and its value is 33.4 MPal;
- (2)
- The new second mining area has the largest burial depth among all mining areas, and the maximum principal stress value of the measured positions of the three measuring points has risen sharply, and its maximum principal stress value is the largest in the area of No. 3 coal seam, which is 33.7~34.8 MPa;
- (3)
- The maximum principal stress value of the new third mining area is 33.2~34.2 MPa, and in the southeastern location of the new third mining area, the maximum principal stress value decreases sharply to 33.2 MPa;
- (4)
- As the topography of the new fourth mining area does not change much, the trend of the maximum principal stress value changes gently, and its value is 33.9~34.2 MPa;
- (5)
- The new fifth mining area has the smallest burial depth among all mining areas, and the maximum principal stress value is 33.1~33.8 MPa. As the depth of burial decreases, an “oval” red zone appears in the new five mining areas, where the maximum principal stress value is 33.1 MPa.
In summary, the maximum principal stress value of each mining area of the No. 3 coal seam is mainly affected by the burial depth and topography. Under the condition of certain tectonic stress, as the depth of burial increases, the rock gravity becomes larger with it, and the value of maximum principal stress becomes larger. Sudden increases or sharp decreases in geopathic stress values occur due to changes in topography in the region.
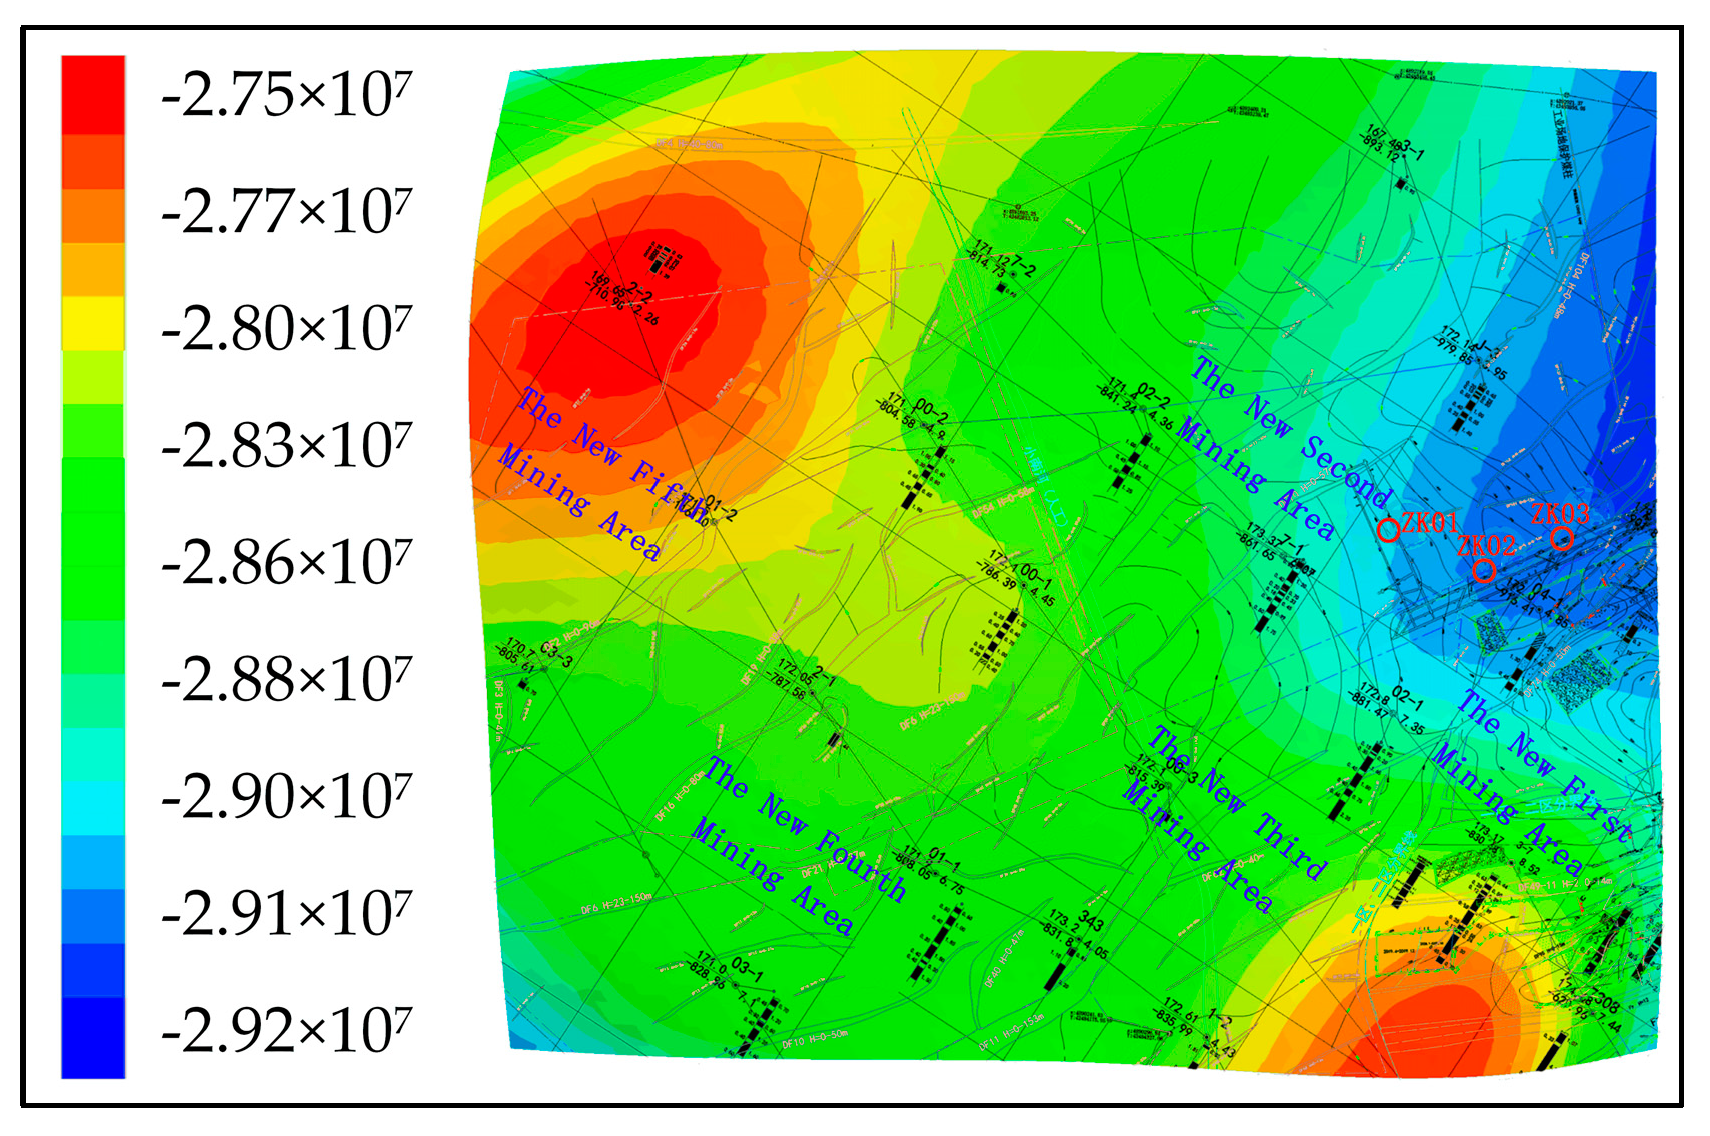
- (2)
- Intermediate principal stress
According to the numerical simulation results of Yingcheng Coal Mine, the middle principal stress cloud map of the No. 3 coal seam was extracted and projected to the mining engineering plan, as shown in Figure 8.

Figure 8.
Intermediate principal stress cloud of No. 3 coal seam.
As can be seen from Figure 8, the intermediate principal stress value of the No. 3 coal seam is between 27.5~29.2 MPa, which has a similar pattern with the maximum principal stress, and the intermediate principal stress value varies significantly with the burial depth and topography, and the stress concentration occurs near the three measuring points in the new No. 2 mining area, and its value is between 28.8~29.0 MPa.
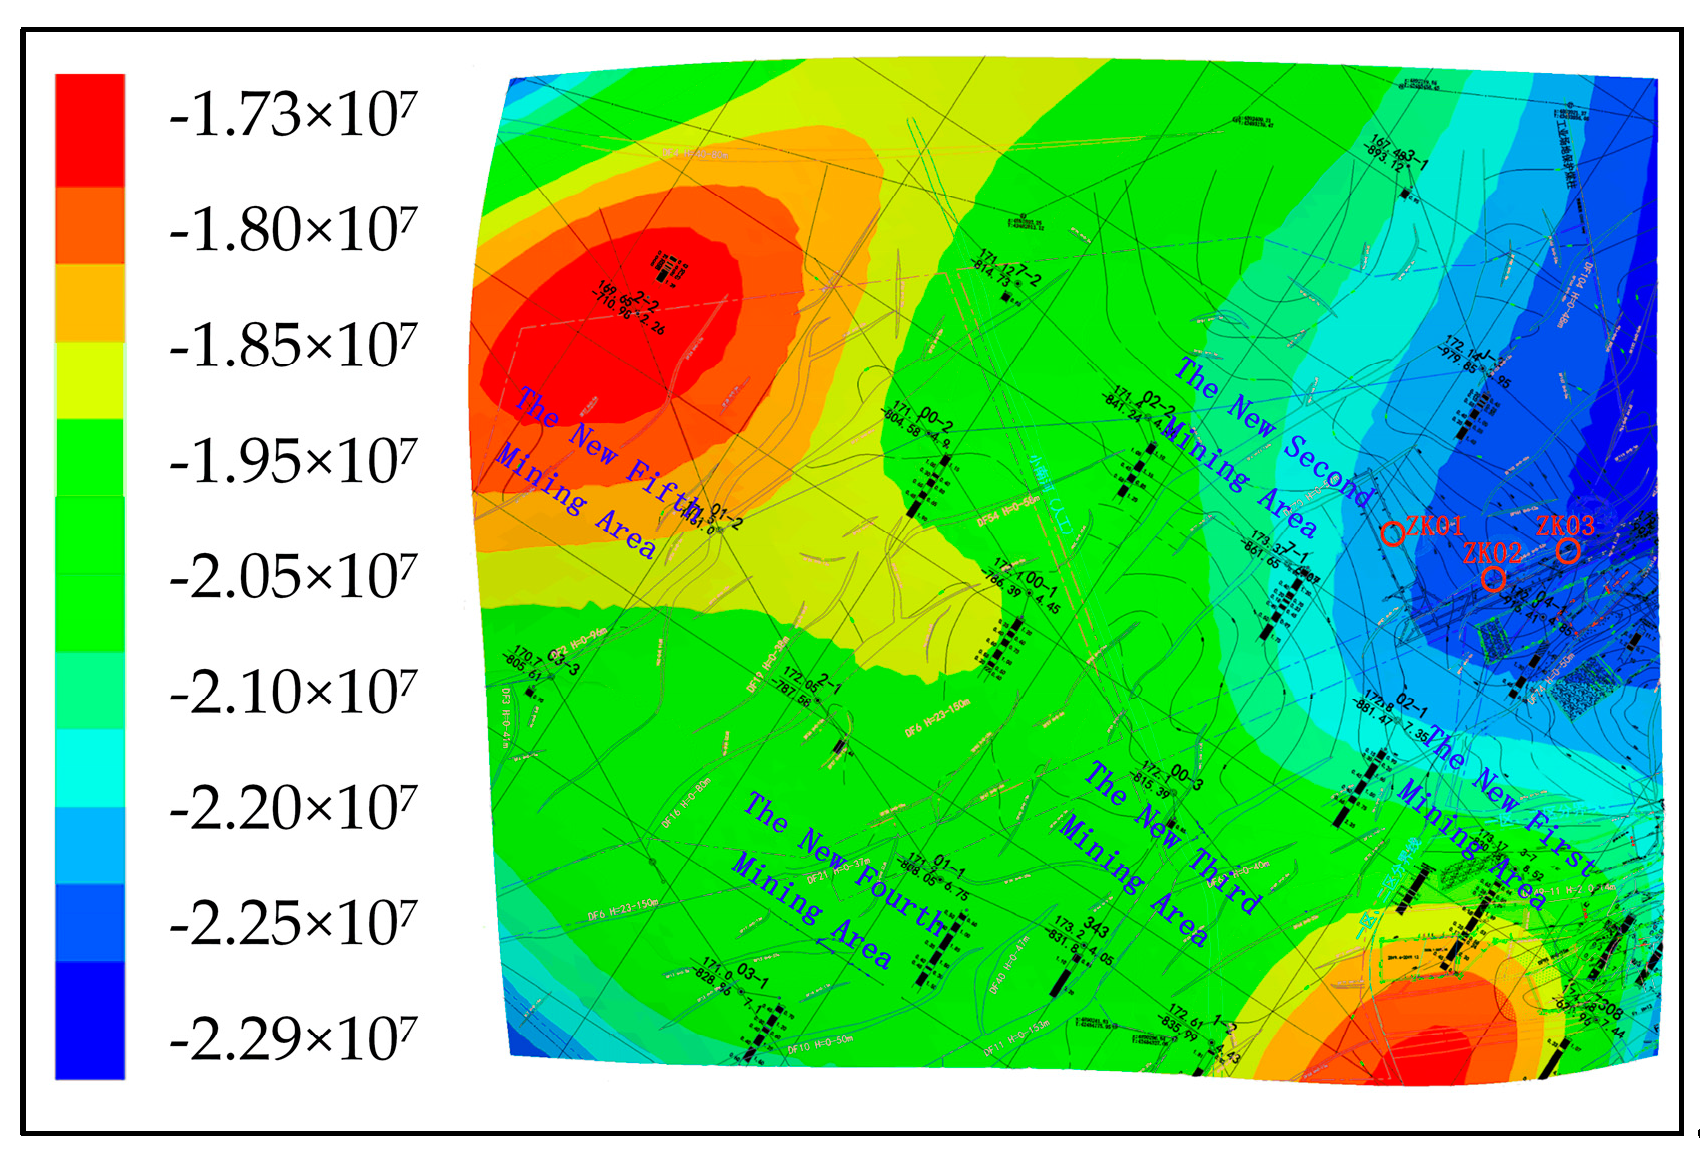
- (3)
- Minimum principal stress
The minimum principal stress cloud map of the No. 3 coal seam was projected to the mining engineering plan of Yingcheng Coal Mine, as shown in Figure 9. As can be seen from Figure 9, the minimum principal stress value of the No. 3 coal seam is in the range of 17.3~22.9 MPa, similar to the maximum principal stress law, which varies significantly with the burial depth and topography, and the stress concentration occurs at the location of three measuring points in the new second mining area, where the minimum principal stress value of the area is about 22.4~22.9 MPa.
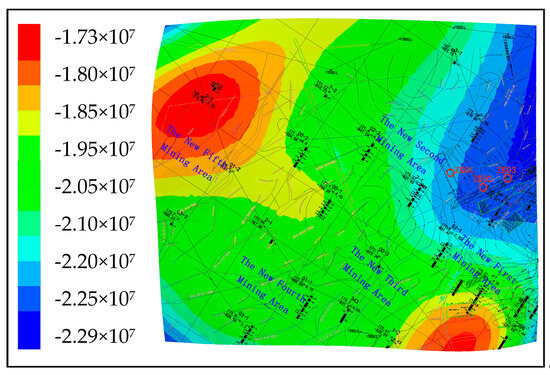
Figure 9.
Minimum principal stress cloud of the No. 3 coal seam.
5.3. Comparative Analysis of Inversion Results
Substituting the azimuth and inclination and principal stress , , and , and values of the three measurement points at the site into Equations (8) and (9). The six stress components transformed to , , , , , in the computed coordinate system shown in Table 6.
Table 6.
Comparison of measured stress components of geostress with calculated values.
The directional cosines li, mi, and ni of the principal stresses for the x, y, and z axes can be expressed as follows:
where is the azimuth of the measurement point and is the inclination of the measurement point.
The six stress components in the computed coordinate system are obtained by substituting the direction cosines, etc., into Equation (9):
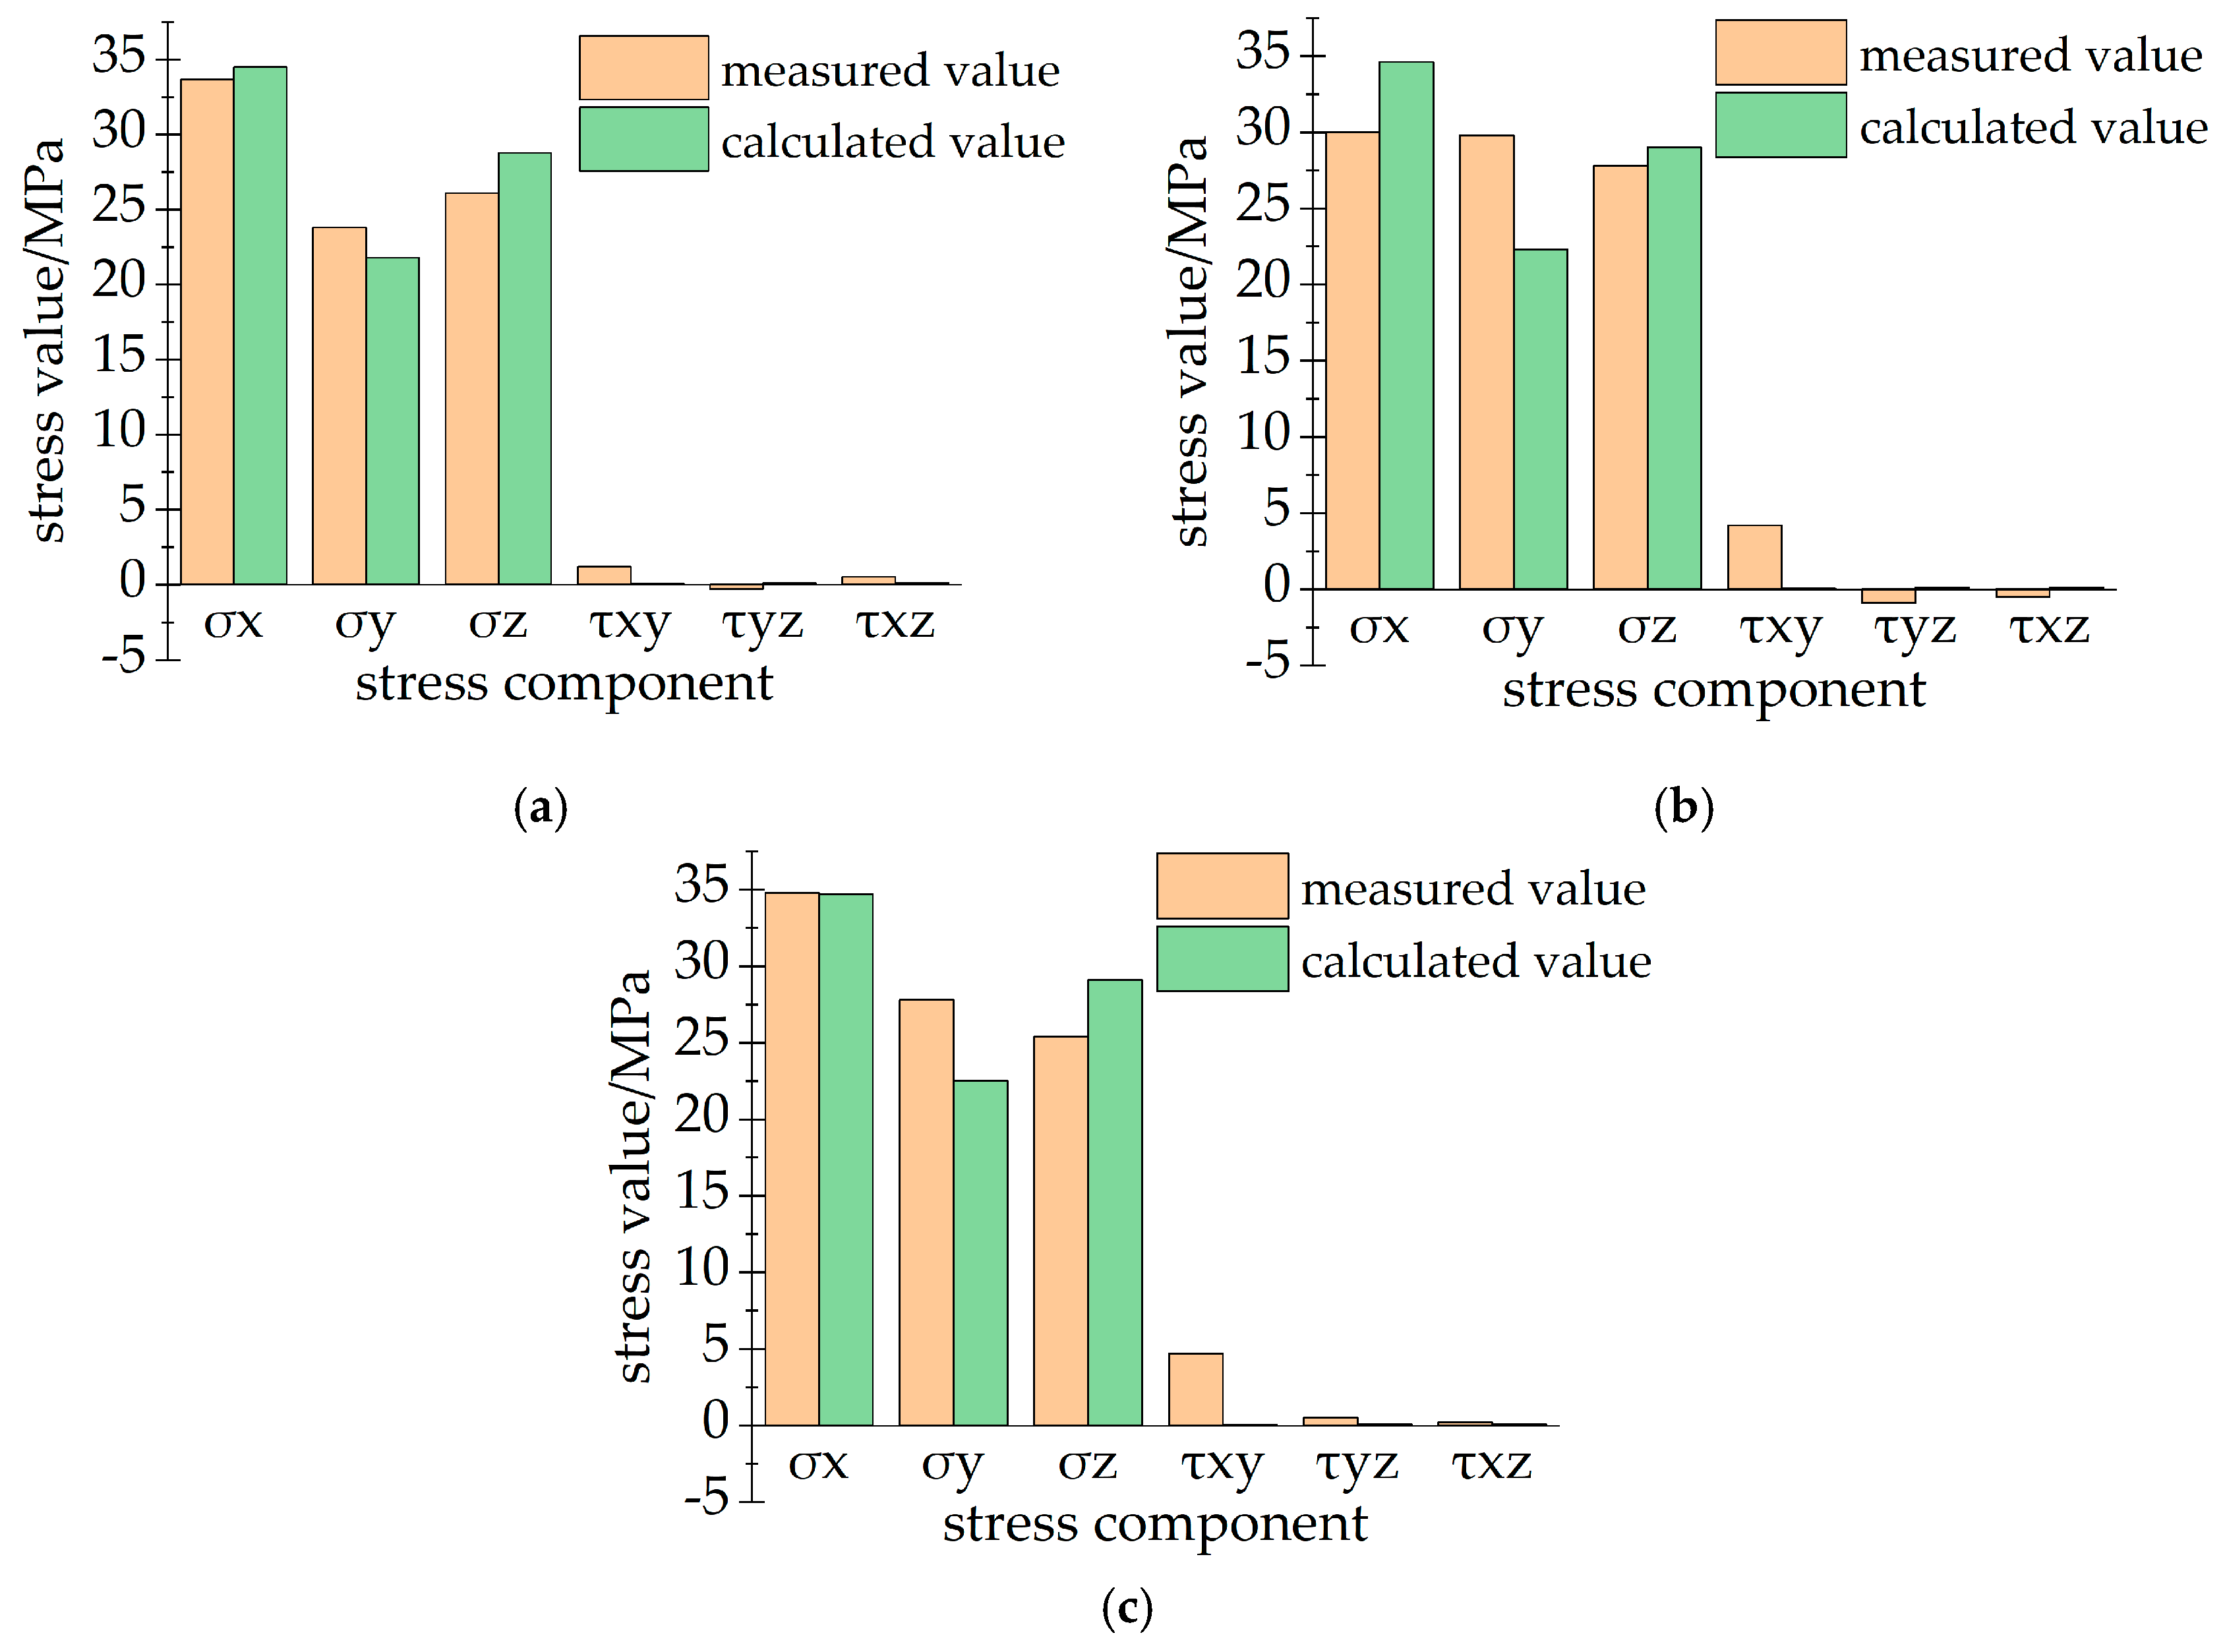
The six stress component values were analyzed for errors, and Equations (10) and (11) define the formulas for calculating the mean error ε and the mean square error Δ. The results of the stress component calculations were compared with the measured stress values as in Table 6, and a graph comparing the measured ground stress with the calculated ground stress was plotted, as shown in Figure 10.
where and denote field measured and numerically calculated values, respectively.
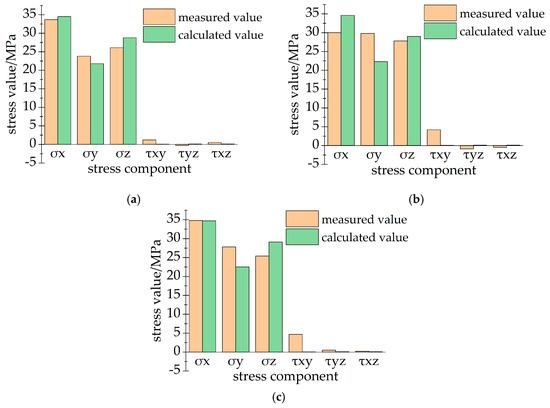
Figure 10.
Comparison of measured and calculated ground stress values: (a) Comparison of measured and calculated values for measurement point ZK01; (b) comparison of measured and calculated values for measurement point ZK02; (c) comparison of measured and calculated values for measurement point ZK03.
As can be seen from Table 6, the average errors of positive stress components , , and at the three measurement points of Yingcheng Mine are 17.9%, 17.6%, and 9.7%, respectively, and the mean square errors are 5.2%, 18.5%, and 9.5%, respectively; The mean errors for shear stress components , , and were 97.5%, 78.5%, and 52.0%, respectively, and the mean squared errors were 98.3%, 82.3%, and 73.6%, respectively.
A comparison of the above data shows that the calculated and measured values of ground stress are close in magnitude. The inversion data are in relatively good agreement with the measured data, both in terms of principal stress values and stress tensor values.
Overall, under the condition that the Rhino surface modeling highly reproduces the actual situation of the mine, the inversion of the geostress in the Yingcheng coal mine through FLAC3D numerical simulation can obtain the real and accurate distribution of the initial geostress field of the underground of the Yingcheng coal mine. It can make up for the insufficiency of the measured data in the geostress measurement and can provide theoretical support for the design of the underground tunnel and the prevention and control of impact ground pressure in the Yingcheng coal mine.
6. Conclusions
- (1)
- The measured ground stress at three measuring points of Yingcheng Coal Mine was obtained by using the stress relief method of the hollow envelope, and the inversion calculation of ground stress was carried out by utilizing the measured stress values, obtaining the stress value at any point of the inversion area and the stress distribution law of each coal and rock layer. It lays the foundation for the design of underground roadways and the prevention and control of impact ground pressure in coal mines;
- (2)
- The maximum principal stress in the elevation level area of the Yingcheng coal mine measurement point is about 34.6 MPa, and the middle principal stress is about 29.0 MPa, the minimum principal stress is about 22.7 MPa, and the geostress inversion data have relatively good consistency with the measured data;
- (3)
- Comparing the measured ground stress with the calculated values, the average errors of the calculated and measured positive stresses are 17.9%, 17.6%, 9.7%, with a mean value of 15.1%, and the mean squared errors are 5.2%, 18.5%, 9.5%, with a mean value of 11.1%, respectively;
- (4)
- Combining the modeling software Rhino 7.0 and the numerical calculation software FLAC3D 6.0 to invert the initial stress field distribution state of the coal mine underground, to a certain extent, solves the problem that the undulation of coal and rock stratum demarcation in the coal mine underground can not be accurately modeled, and the method can be more precisely inverted to perform the initial geostress of the Yingcheng coal mine.
Author Contributions
Conceptualization, Z.T.; methodology, Z.T.; software, Z.W.; validation, D.J. and Z.W.; formal analysis, Z.T.; investigation, Z.W.; resources, J.L.; data curation, Z.W.; writing—original draft preparation, Z.T. and Z.W.; writing—review and editing, D.J. and J.L.; visualization, J.L.; supervision, Z.T. All authors have read and agreed to the published version of the manuscript.
Funding
This research was funded by the National Natural Science Foundation of China (51804152), the University-local government scientific and technical cooperation cultivation project of Ordos Institute-LNTU (YJY-XD-2023-001).
Data Availability Statement
Data are contained within the article.
Acknowledgments
The authors would like to thank the anonymous reviewers for their valuable and constructive comments.
Conflicts of Interest
The authors declare no conflicts of interest.
References
- Cai, M.F. Review of principles and methods for rock stress measurement. Chin. J. Rock Mech. Eng. 1993, 03, 275–283. [Google Scholar]
- Cai, M.F.; Qiao, L.; Li, H.B. The Principle and Technology of Ground Stress Measurement; Hubei Science & Technology Press: Beijing, China, 2000; pp. 15–60. [Google Scholar]
- Liu, Y.F.; Yin, J.M.; Liu, Y.K. In-Situ Stress Measurement Method and Engineering Application; Hubei Science & Technology Press: Wuhan, China, 2014; pp. 135–186. [Google Scholar]
- He, M.C.; Xie, H.P.; Peng, S.P.; Jiang, Y.d. Study on rock mechanics in deep mining engineering. Chin. J. Rock Mech. Eng. 2005, 16, 2803–2813. [Google Scholar]
- Li, W. Current status and development direction of intelligent mining technology for deep coal resources. Coal Sci. Technol. 2021, 49, 139–145. [Google Scholar]
- Xie, H.P. Research review of the state key research development program of China: Deep rock mechanics and mining theory. J. China Coal Soc. 2019, 44, 1283–1305. [Google Scholar]
- Zhang, J.M.; Li, Q.S.; Zhang, Y.; Cao, Z.G.; Wang, X.Z. Definition of deep coal mining and response analysis. J. China Coal Soc. 2019, 44, 1314–1325. [Google Scholar]
- Du, C.H.; Cao, P.; Yu, C.; Liu, J.; Zhao, Y.L.; Liu, J.S. Study on the Stability and Deformation of the Roadway Subjected to High In-Situ Stresses. Geotech. Geol. Eng. 2017, 35, 1615–1628. [Google Scholar] [CrossRef]
- Pan, Y.S.; Gao, X.P.; Wang, W.; Xiao, Y.H. Research of hydraulic powered supports for entries’ advanced support in fully-mechanized working face of rock burst mine. Coal Sci. Technol. 2021, 49, 1–12. [Google Scholar]
- Wang, A.W.; Pan, Y.S.; Li, Z.H.; Zhao, B.Y. Analytical analysis of anti-impact mechanism of bolt supporting for bump-prone roadways. China Saf. Sci. J. 2016, 26, 110–115. [Google Scholar]
- Xu, J.S.; Pan, P.Z.; Chen, J.Q.; Zhao, S.K.; Wu, Z.H.; Liu, X.D. Study on burst risk assessment of coal seam in folded area based on pre-mining stress back analysis. Coal Sci. Technol. 2023, 51, 35–45. [Google Scholar]
- Zhao, S.K.; Deng, Z.G.; Ji, W.B.; Li, Z.G.; Zhang, G.H.; Li, Y.Z. Effects of multi-stage tectonic movement on regional tectonic stress characteristics and rockburst. J. Min. Saf. Eng. 2019, 36, 306–314. [Google Scholar]
- Funato, A.; Ito, T. A new method of diametrical core deformation analysis for in-situ stress measurements. J. Int. J. Rock. Mech. Min. 2017, 91, 112–118. [Google Scholar] [CrossRef]
- Zhang, k. Application Research of N2303 Roadway Support in Gucheng Mine Based on Geostress Inversion. Master’s Thesis, China University of Mining and Technology, Beijing, China, 2021. [Google Scholar]
- Dong, J.X.; Zhao, Y.R.; Xu, G.L.; Yang, R.X.; Li, Q.; Fu, J.F. Assessing Support Strength of Surrounding Rock of High Sidewalls in Underground Caverns with High Geostress Using Analogy Method. J. Changjiang River Sci. Res. Ins. 2021, 38, 94–101. [Google Scholar]
- Tao, W.B.; Tao, J.; Hou, J.L.; Jiang, J.P. In-Situ Stress Characteristics and Optimal Support Design of Deep Roadway. J. South China Univ. Technol. Nat. Sci. 2020, 48, 28–37. [Google Scholar]
- Feng, R.G. Stability Analysis of Surrounding Rock in Deep Roadway under Complex Stress Field. Master’s Thesis, Hebei University of Engineering, Handan, China, 2023. [Google Scholar]
- Zhang, Y.; Wang, Y.; Cui, B.; Feng, G.; Zhang, S.; Zhang, C.; Zhang, Z. A Disturbed Voussoir Beam Structure Mechanical Model and Its Application in Feasibility Determination of Upward Mining. J. Energies. 2023, 16, 7190. [Google Scholar] [CrossRef]
- Zhang, Y.; Cui, B.; Wang, Y.; Zhang, S.; Feng, G.; Zhang, Z. Evolution Law of Shallow Water in Multi-Face Mining Based on Partition Characteristics of Catastrophe Theory. J. Fractal Fract. 2023, 7, 779. [Google Scholar] [CrossRef]
- Pei, S.F.; Zhao, J.S.; Yu, H.C.; Liu, G.F.; Xia, Y.L.; Zhang, D.; Xu, J.P. Inversion method for local in situ stress considering stress-induced damage of cavern surrounding rock and its application. Rock Soil Mech. 2020, 41, 4093–4104. [Google Scholar]
- Chen, S.J.; Xiao, M.; Chen, J.T.; Ren, J.Q. Disturbance law of faults to in-situ stress field directions and its inversion analysis method. Chin. J. Rock Mech. Eng. 2020, 39, 1434–1444. [Google Scholar]
- Zhou, Z.H.; He, C.; Meng, W.; Wang, B.; Kou, H.; Chen, Z.Q. Back Analysis of Initial Geostress Field in Tunnel Site of Granitic Intrusive Rock Stratum. J. Southwest Jiaotong Univ. 2022, 57, 322–330. [Google Scholar]
- Li, F.; Zhou, J.X.; Wang, J.A. Back-analysis and reconstruction method of in-situ stress field based on limited sample data. J. China Coal Soc. 2019, 44, 1421–1431. [Google Scholar]
- Ma, N.; Yin, X.Y.; Sun, C.Y.; Zong, Z.Y. Inversion for crustal stress based on azimuthal seismic data. Chin. J. Geophys. 2018, 61, 697–706. [Google Scholar]
- Zhao, C.; Xiao, M.; Chen, J.T. Inversion analysis method for in-situ stress field under complex geological conditions. J. Huazhong Univ. Sci. Technol. Nat. Sci. Ed. 2017, 45, 87–92. [Google Scholar]
- Tian, Y.; Yu, R.G.; Zhang, N.; Zhang, Y.M. Numerical experimental technology for geo-stress inversion based on ANSYS software. Exp. Technol. Manag. 2019, 36, 168–170. [Google Scholar]
- Kong, P.; Ren, G.C.; Bo, H.J.; Ma, X.F.; Liu, Y.X.; Gao, H.B. Influence of Different Fault Treatment Modes on Simulation Result of In-Situ Stress Distribution in Coalbed Using ABAQUS. J. Xi’an Shiyou Univ. Nat. Sci. Ed. 2022, 37, 1–8. [Google Scholar]
- Zhao, Y.; Bai, J.P. Inversion of Multiple Linear Regression Analysis of Initial Stress Field of Underground Powerhouse Based on FLAC3D. Water Resour. Pow. 2022, 40, 149–152. [Google Scholar]
- Liu, Q.S.; Wang, D.; Zhu, G.Y.; Yang, Z.B.; Bo, X. Application of support vector regression algorithm in inversion of geostress field. Rock Soil Mech. 2020, 41, 319–328. [Google Scholar]
- Meng, W.; He, C.; Wang, B.; Zhang, J.B.; Wu, F.Y.; Xia, W.Y. Two-stage back analysis of initial geostress field in rockburst area based on lateral pressure coefficient. Rock Soil Mech. 2018, 39, 4191–4200. [Google Scholar]
- Meng, W.; He, C.; Chen, Z.Q.; Guo, D.P.; Zhou, Z.H.; Kou, H.; Wu, F.Y. Application of ridge regression in the inversion analysis of the initial geo-stress field of rock masses. Rock Soil Mech. 2021, 42, 1156–1169. [Google Scholar]
- Feng, F. Some Algorithm Study Based on Cubic B-Spline Curve. Master’s Thesis, Wuhan University, Wuhan, China, 2021. [Google Scholar]
- Zhang, Y.W.; Li, Y.J.; Deng, C.Y. Point- Normal Interpolatory B-Spline Curve and Surface with Minimal Energy. J. Comp. Aided Desg. Comp. Gp. 2024, 2, 1–6. [Google Scholar]
- Dai, Z.X.; Chen, G.F.; Chen, G. Three-dimensional simulation of multiple high-low loop tufting carpet based on Rhino-Python. J. Text. Res. 2020, 41, 69–75. [Google Scholar]


Disclaimer/Publisher’s Note: The statements, opinions and data contained in all publications are solely those of the individual author(s) and contributor(s) and not of MDPI and/or the editor(s). MDPI and/or the editor(s) disclaim responsibility for any injury to people or property resulting from any ideas, methods, instructions or products referred to in the content. |
© 2024 by the authors. Licensee MDPI, Basel, Switzerland. This article is an open access article distributed under the terms and conditions of the Creative Commons Attribution (CC BY) license (https://creativecommons.org/licenses/by/4.0/).