1. Introduction
Transformer bushings are pivotal for introducing leads and providing insulation from the ground, while also securing and stabilizing these leads. They must meet stringent criteria for electrical and mechanical durability, thermal resilience, and maintenance accessibility. The failure of a transformer bushing can precipitate disruptions in the power network and raise significant safety concerns [
1,
2,
3,
4]. Consequently, the upkeep and comprehensive inspection of transformer bushings are of paramount importance. Subject to variations in seasonal demand, these bushings endure heightened stress, expediting wear and tear and potentially catalyzing failures that result in grid outages [
5,
6,
7]. The research shows that the probability of heating failure at the top of the transformer bushing in practical applications is large, and the main reasons are as follows: (1) loose joint: due to the looseness of the joint connecting the transformer bushing and the guide wire, the contact area decreases, the contact resistance increases, and a lot of heat is generated, resulting in a high temperature at the wiring; (2) overload: when the transformer bushing bears too much load current, it will cause the temperature at the wiring point to be too high; (3) uneven conductor surface: an uneven conductor surface or foreign bodies on the conductor surface will also lead to poor contact, making the contact resistance increase, generating a lot of heat, resulting in high temperature at the wiring; (4) environmental factors: the ambient temperature of the transformer is too high; poor ventilation and other environmental factors will also lead to overheating of the joint. Therefore, it is of great significance to study the temperature detection of the top cylinder of transformer bushings.
Methods for monitoring the temperature of transformer bushings include direct measurement methods and indirect calculation methods. The direct measurement methods are mainly infrared, thermal resistance, thermocouple, and distributed optical fiber techniques, as well as a temperature-measuring wax sheet [
8,
9,
10,
11]. The indirect measurement methods mainly include the national standard calculation method and numerical calculation method [
12]. Infrared methods, advantageous for their non-contact nature and long-distance applicability, offer rapid response times yet are influenced by surface emissivity and environmental conditions. Thermal resistance methods, while boasting high accuracy and stability, necessitate regular calibration due to their slower response. Despite its affordability and broad measurement range, thermal resistance is prone to degradation from oxidation and corrosion. Distributed optical fiber technology, recognized for its precision and immunity to electromagnetic interference, remains cost-prohibitive for widespread adoption. The temperature-indicating wax sheet can reflect the thermal fault defects of power equipment in real time, and it is low in price and simple in structure. However, it is not reversible and needs to be replaced frequently, which increases the operation and maintenance cost. The national standard calculation method has the characteristics of being a simple calculation and easy to implement, but its calculation accuracy is poor. The results of the numerical calculation method are intuitive, and the temperature distribution inside the transformer can be obtained, but the computer hardware requirements are high and the cost is high.
Emerging research focuses on thermochromic materials for their sensitivity and versatility, presenting novel approaches for bushing temperature assessment [
13,
14,
15]. Innovations include thermally reversible color-changing coatings developed by Dong Bingbing, designed for identifying thermal anomalies in dry-type air-core reactors [
16]; and Chen Yuanyuan’s irreversible temperature-indicating coatings aimed at pinpointing lightning fault locations, facilitating temperature distribution analysis, and monitoring equipment for overheating [
17]. Wang Peng used room temperature vulcanized silicone rubber mixed with thermochromic microcapsules and nano-silica to prepare the superhydrophobic intelligent color-changing coating, which realized the consideration of thermochromic, superhydrophobic, and surface discharge performance [
18]. Zhou Ronghua used thermoplastic acrylic resin as the base material to prepare thermochromic color-changing paint that can be used for ABS plastic substrate, comprehensively discussed and analyzed the factors affecting the color-changing temperature of the thermochromic paint, and optimized the paint, finally preparing a one-component thermotemperature-reversible thermochromic color-changing paint with good performance and convenient construction [
19]. Rahul Bhattacharya combined the gain and loss mechanisms of crystal water to detect the temperature. (CHN
2)CuCl
4 absorbed water to form a green hydrate (CHN
2)CuCl
4·H
2O, it then lost crystal water to form (CHN
2)
2CuCl
4 when the temperature rose to about 43 °C. The color changed from green to yellow. When the temperature was lowered, green water and (CHN
2)CuCl
4·H
2O were formed again after water absorption [
20]. The standard DL/T 664-2016 states that a transformer casing cylinder head temperature of 55 °C is a serious defect [
21], but there is no research on defect temperature detection in transformer casing cylinder heads at present. In addition, the color-changing paint has the disadvantage of poor aging performance, and the temperature-indicating patch has good stability and is less affected by environmental factors. Based on this, research on a reversible temperature-indicating patch on the cylinder head of the transformer bushing is carried out.
This study presents the synthesis of reversible color-changing materials via a melting process, leading to the fabrication of two distinct types of temperature-indicating patches. Utilizing a cellulose–polyester blend fabric as the absorptive base, we developed both binder-based and vacuum-based temperature-indicating patches. These innovations were rigorously evaluated for their chromatic transitions, electrical characteristics, and water-repellent properties. The findings of this research offer valuable insights for the advancement of thermal defect detection methodologies in transformer bushings, potentially setting new benchmarks for diagnostic accuracy and reliability.
2. Test Part
2.1. Test Reagents and Instruments
Test reagents: crystalline violet lactone (Nanjing Bermuda Biotechnology Co., Ltd., Nanjing, China); bisphenol A (Shandong Zhengxing New Materials Co., Ltd., Jinan, China); octadecanol (Sinopharm Group Chemical Reagent Co., Ltd., Shanghai, China); Polyethylene Terephthalate (PET) film (Shenzhen Zhenhua Adhesive Products Co., Ltd., Shenzhen, China); sealed bag (Dongguan Yiguang Packaging Machinery Co., Ltd., Dongguan, China); binder (Anhui Maoyuan Co., Ltd., Hefei, China).
Test instruments: constant-temperature heating magnetic stirrer (110 V; Shanghai Iohua Instrument Co., Ltd., Shanghai, China); constant-temperature heating table (Dongguan Weitieke Automation Technology Co., Ltd., Dongguan, China).
2.2. Sample Preparation
2.2.1. Preparation of Color-Changing Materials
This study utilized the melting process to synthesize color-changing materials, employing crystalline violet lactone, bisphenol A, and octadecanol as primary raw materials. The proportions of crystalline violet lactone, bisphenol A, and octadecanol were meticulously calculated based on a mass ratio of 1:2:50. Initially, octadecanol was placed in a beaker and subjected to heating using a constant temperature magnetic stirrer, with the temperature precisely set to 80 °C. Upon complete melting of the octadecanol, crystalline violet lactone and bisphenol A were sequentially introduced, ensuring thorough mixing and homogenization at a stirring speed of 500 revolutions per minute (rpm). This mixture was continuously heated and stirred for 60 min. Following a 24 h period of natural cooling, the resultant solidified blue color-changing material was finely ground into a powder form.
2.2.2. Preparation of Reversible Thermochromic Patches
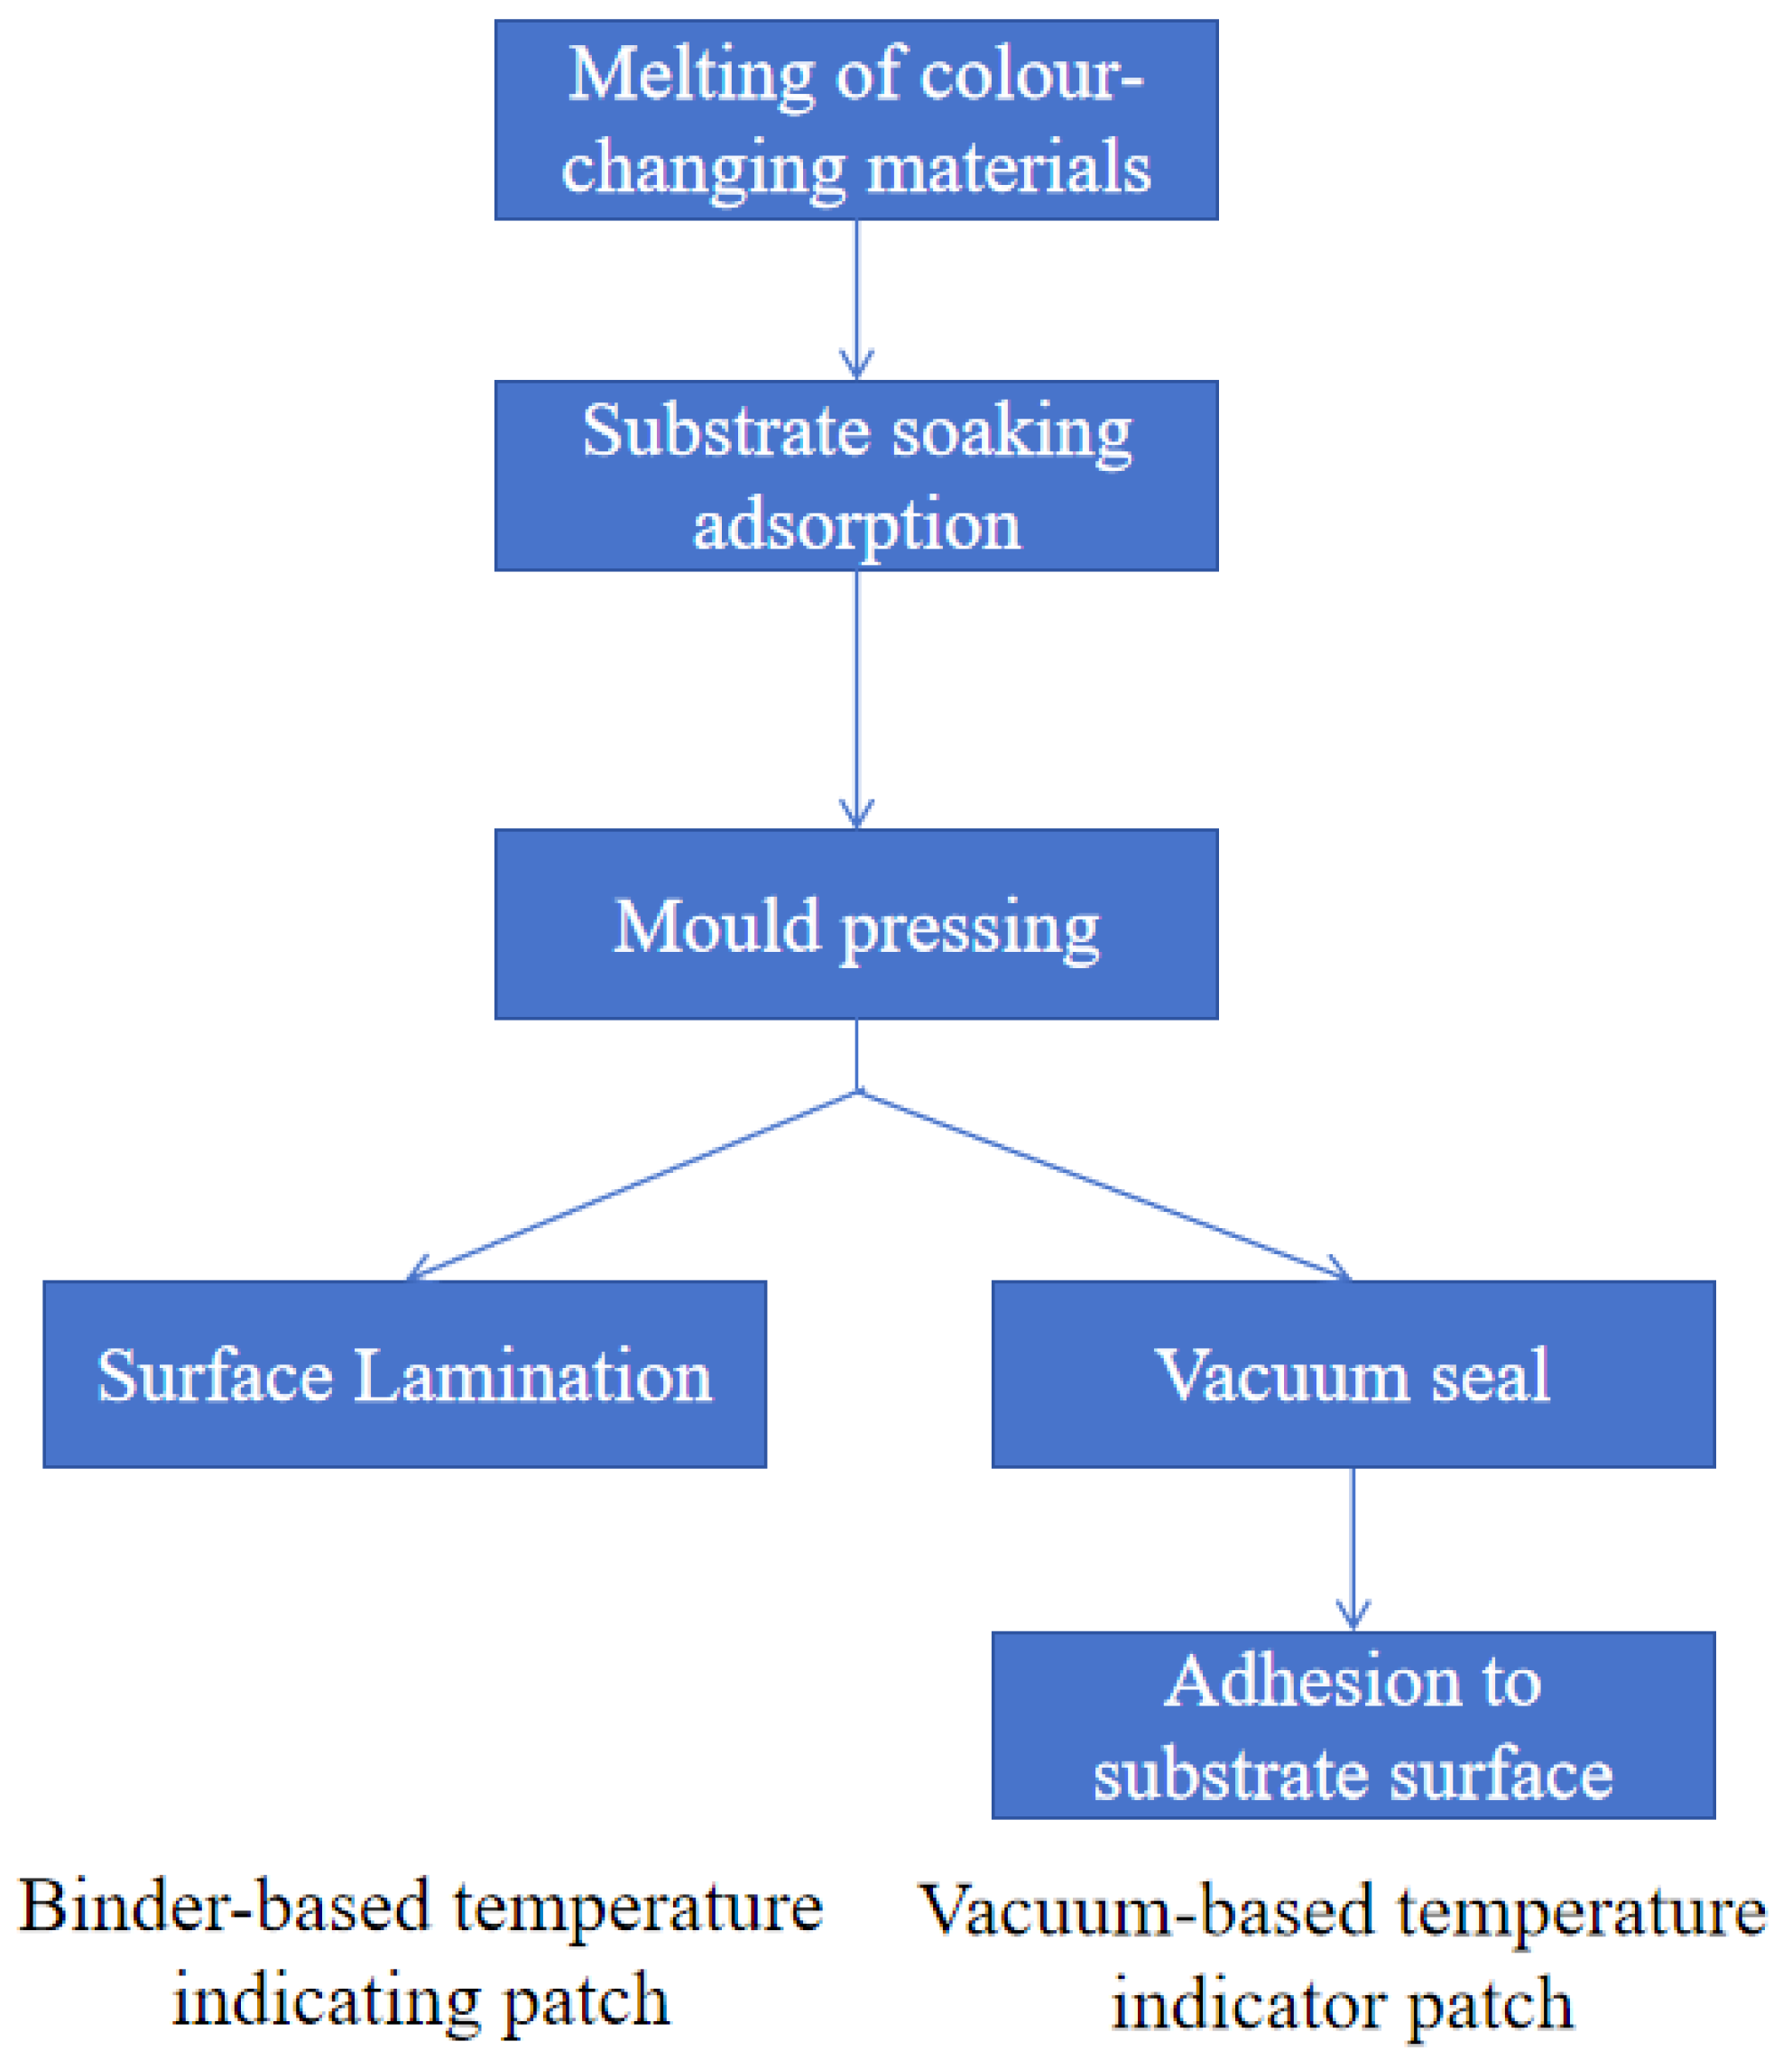
This research delineates the fabrication of two variants of oscillometric patches, binder-type and vacuum-based, with the preparation process shown in
Figure 1. Initially, a specified quantity of the previously synthesized color-changing powder was heated until molten in a beaker. A cellulose–polyester blend fabric, serving as the adsorption substrate, was then thoroughly saturated in the molten mixture, subsequently extracted, and placed into custom pressing molds. For the binder-type oscillometric patches, a uniform layer of binder was applied to one side of a PET film, which, upon pressure molding, ensured a secure adhesion to the aluminum substrate plate. This process eliminated air pockets, resulting in the formation of binder-type temperature-responsive patch samples. Conversely, the vacuum-based patches were produced by enclosing the cooled and pressed material within a high-temperature sealing bag and subjecting it to vacuum sealing. A binder was then applied to facilitate adherence to the aluminum substrate plate, culminating in the creation of vacuum-based temperature-responsive patch samples. These samples were specifically designed for the detection of thermal anomalies in the bushing columns of transformers.
2.3. Test Methods
2.3.1. Color-Changing Performance of Temperature-Indicating Patch
The temperature indicator patch prepared in this test for thermal defect detection in transformer bushing cylinder heads tests the following parameters [
22,
23]:
(1) Discoloration temperature: The experiment commenced with the placement of the temperature-sensitive patch, adhered to a substrate, on a precision-controlled heating platform. The platform’s initial temperature was meticulously set to 30 °C. Employing a graduated heating approach, the temperature was incrementally increased by 1 °C every three minutes. Throughout this process, the chromatic transition of the patch was systematically documented, establishing a detailed profile of its temperature responsiveness.
(2) Fading time: For this analysis, the heating platform upon which the test specimen was positioned was stabilized at 70 °C. Utilizing high-resolution videography, the chromatic evolution of the specimen was captured in real time. The onset of the color transformation was marked at zero seconds, and the interval required for the patch to undergo complete discoloration was precisely measured, defining the fading time.
(3) Recoloring time: Following the complete discoloration, the specimen was immediately subjected to ambient conditions to facilitate natural cooling. The recoloration process was recorded in real time using high-definition video capture. The recoloring time was calculated from the moment local color restoration commenced (marked as zero seconds) to the point of full chromatic recovery.
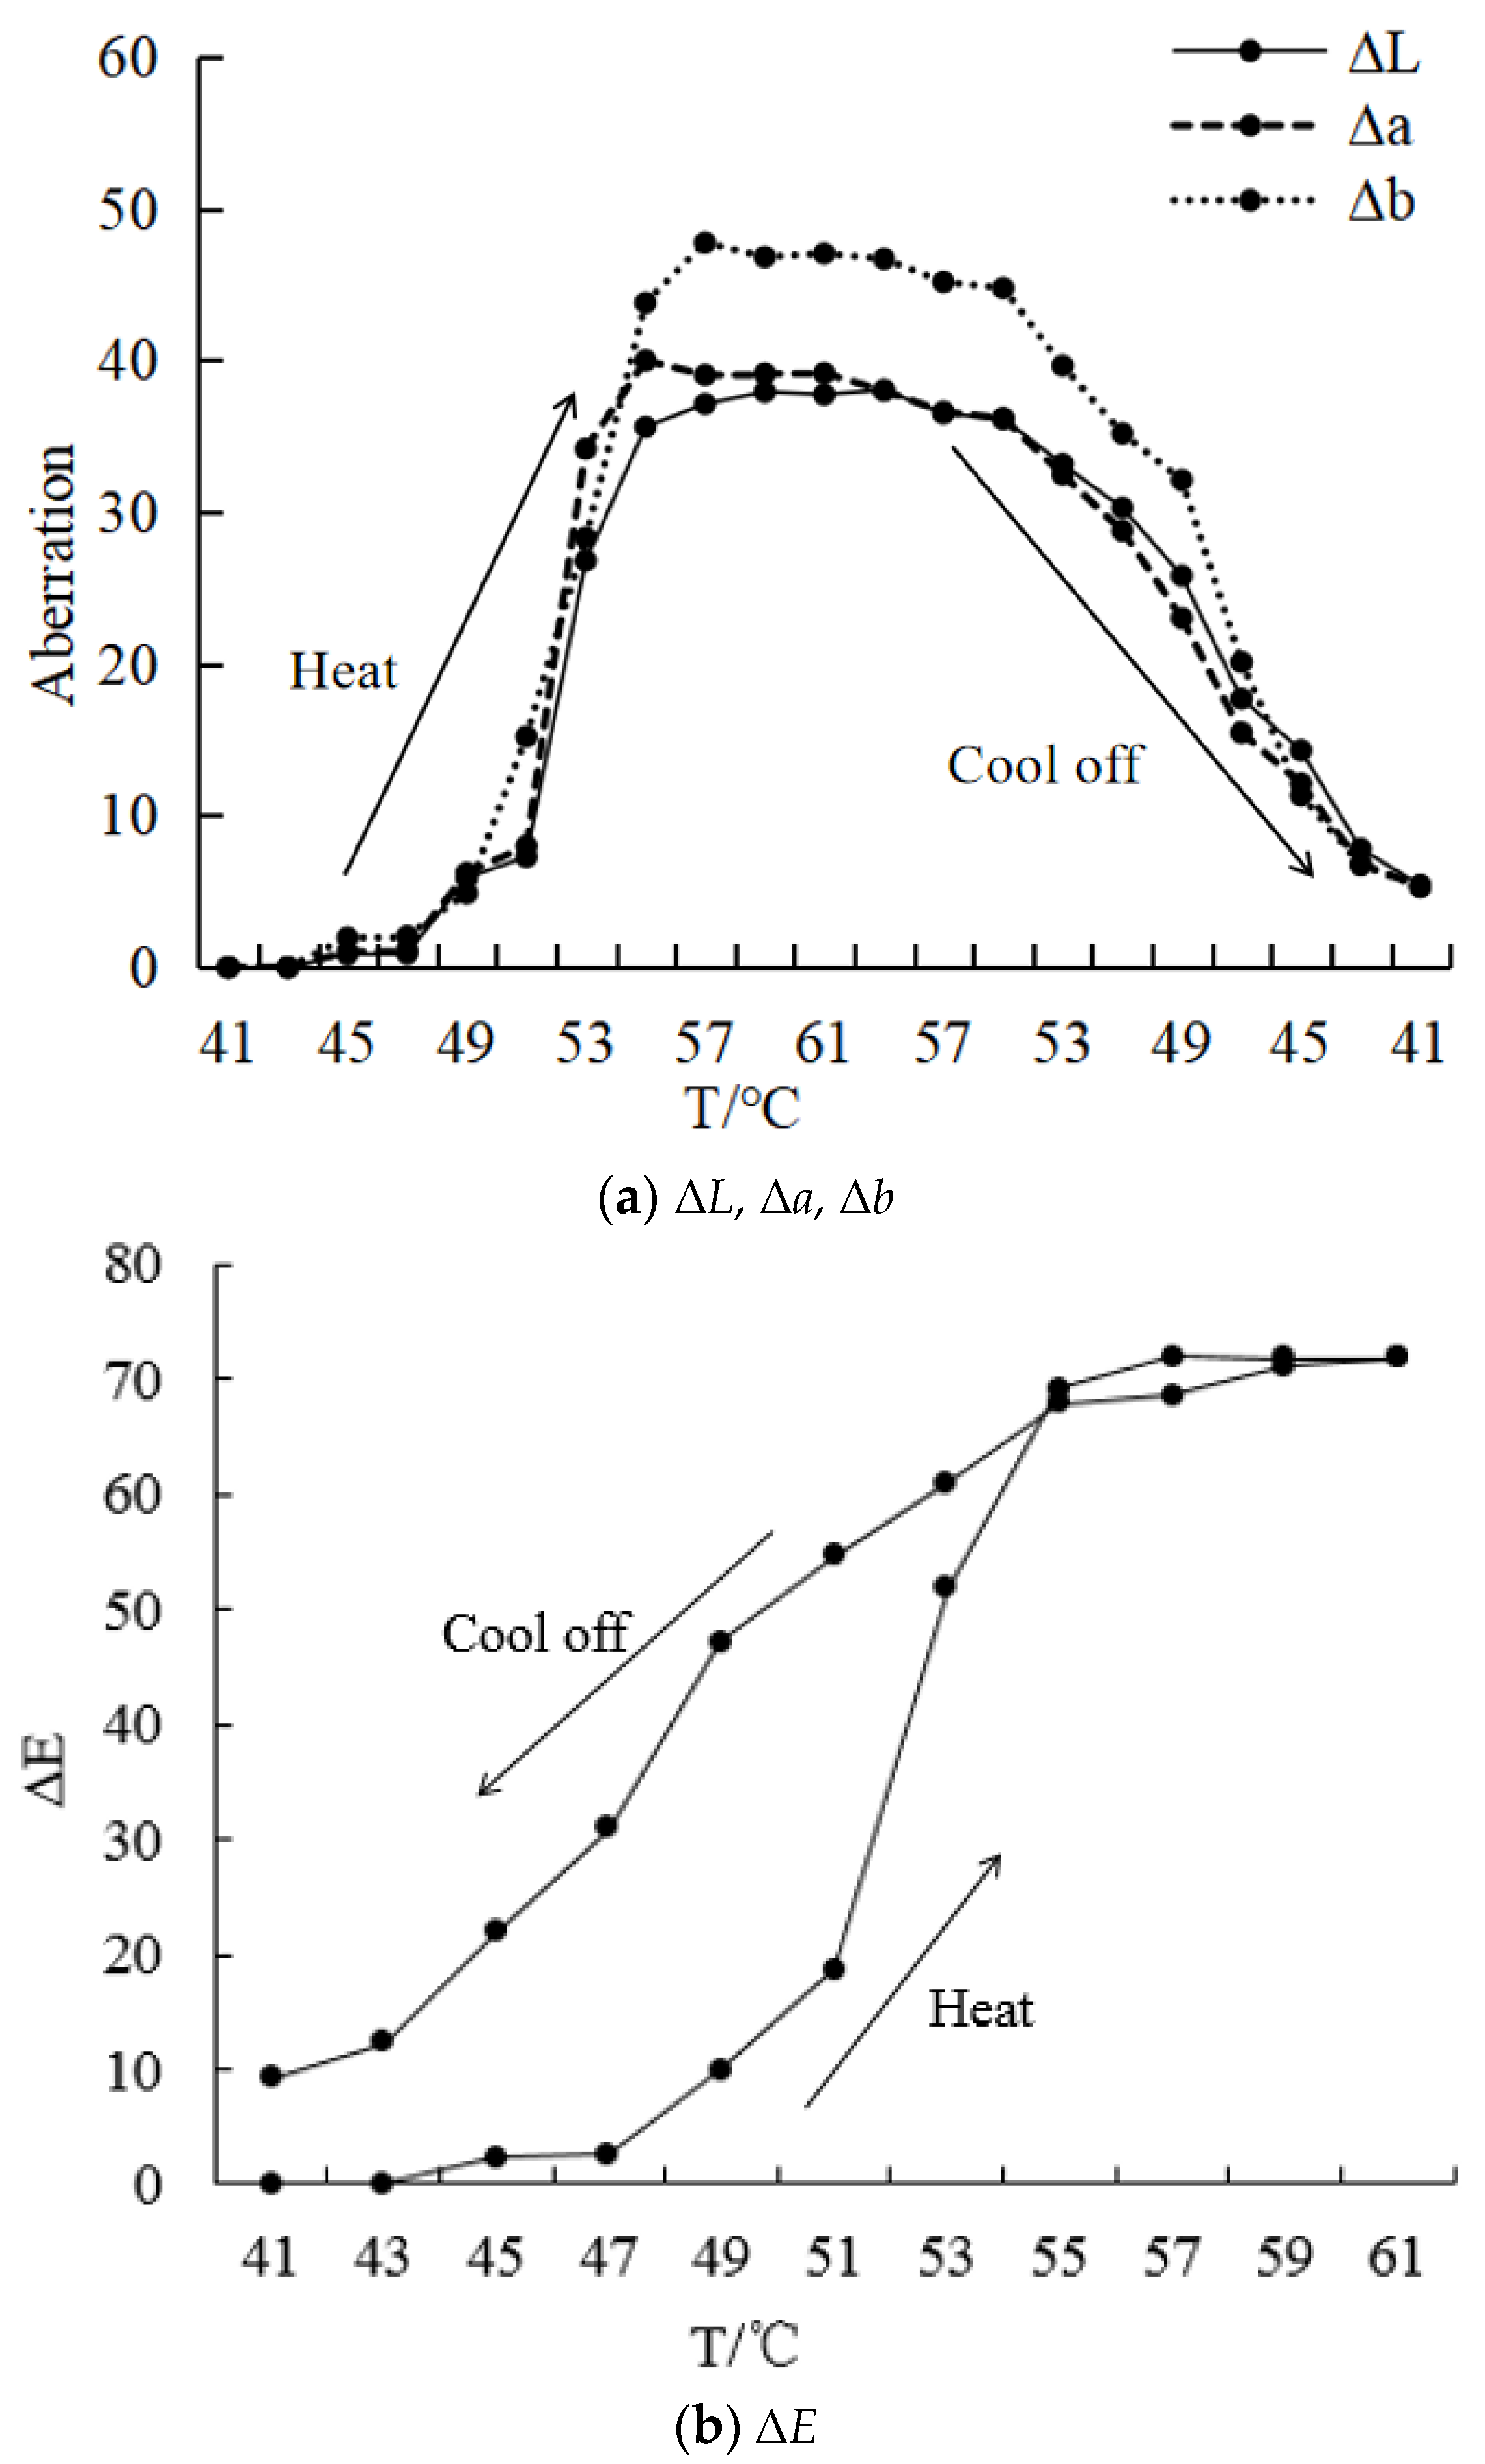
(4) Color representation: According to CIE 1976
L*
a*
b* uniform color space, a lab color space model was used to represent the color change of the temperature patch, namely, the brightness index (
L), red–green axis chromaticity index (
a), and yellow–blue axis chromaticity index (
b). The colorimetric parameters of the complex state (
L1,
a1,
b1) and faded state (
L2,
a2,
b2) were extracted, and the color difference Δ
E was calculated.
In the formula, ΔL, Δa, Δb are the differences between the colorimetric parameters before and after the discoloration of the discoloration material.
2.3.2. Thermal Patch Aging Test
(1) Thermal aging protocol: The study implemented a thermal aging assessment based on the guidelines set forth in GB 11026.1-1989 [
24], which provides a framework for determining the heat resistance of electrical insulation materials, including the formulation of aging test methods and the interpretation of test results. The temperature-indicating patches were subjected to an accelerated aging process within a constant temperature chamber, set to maintain an aging temperature of 80 °C. The evaluation was conducted by averaging the results across three distinct test batches to ensure reliability and statistical significance.
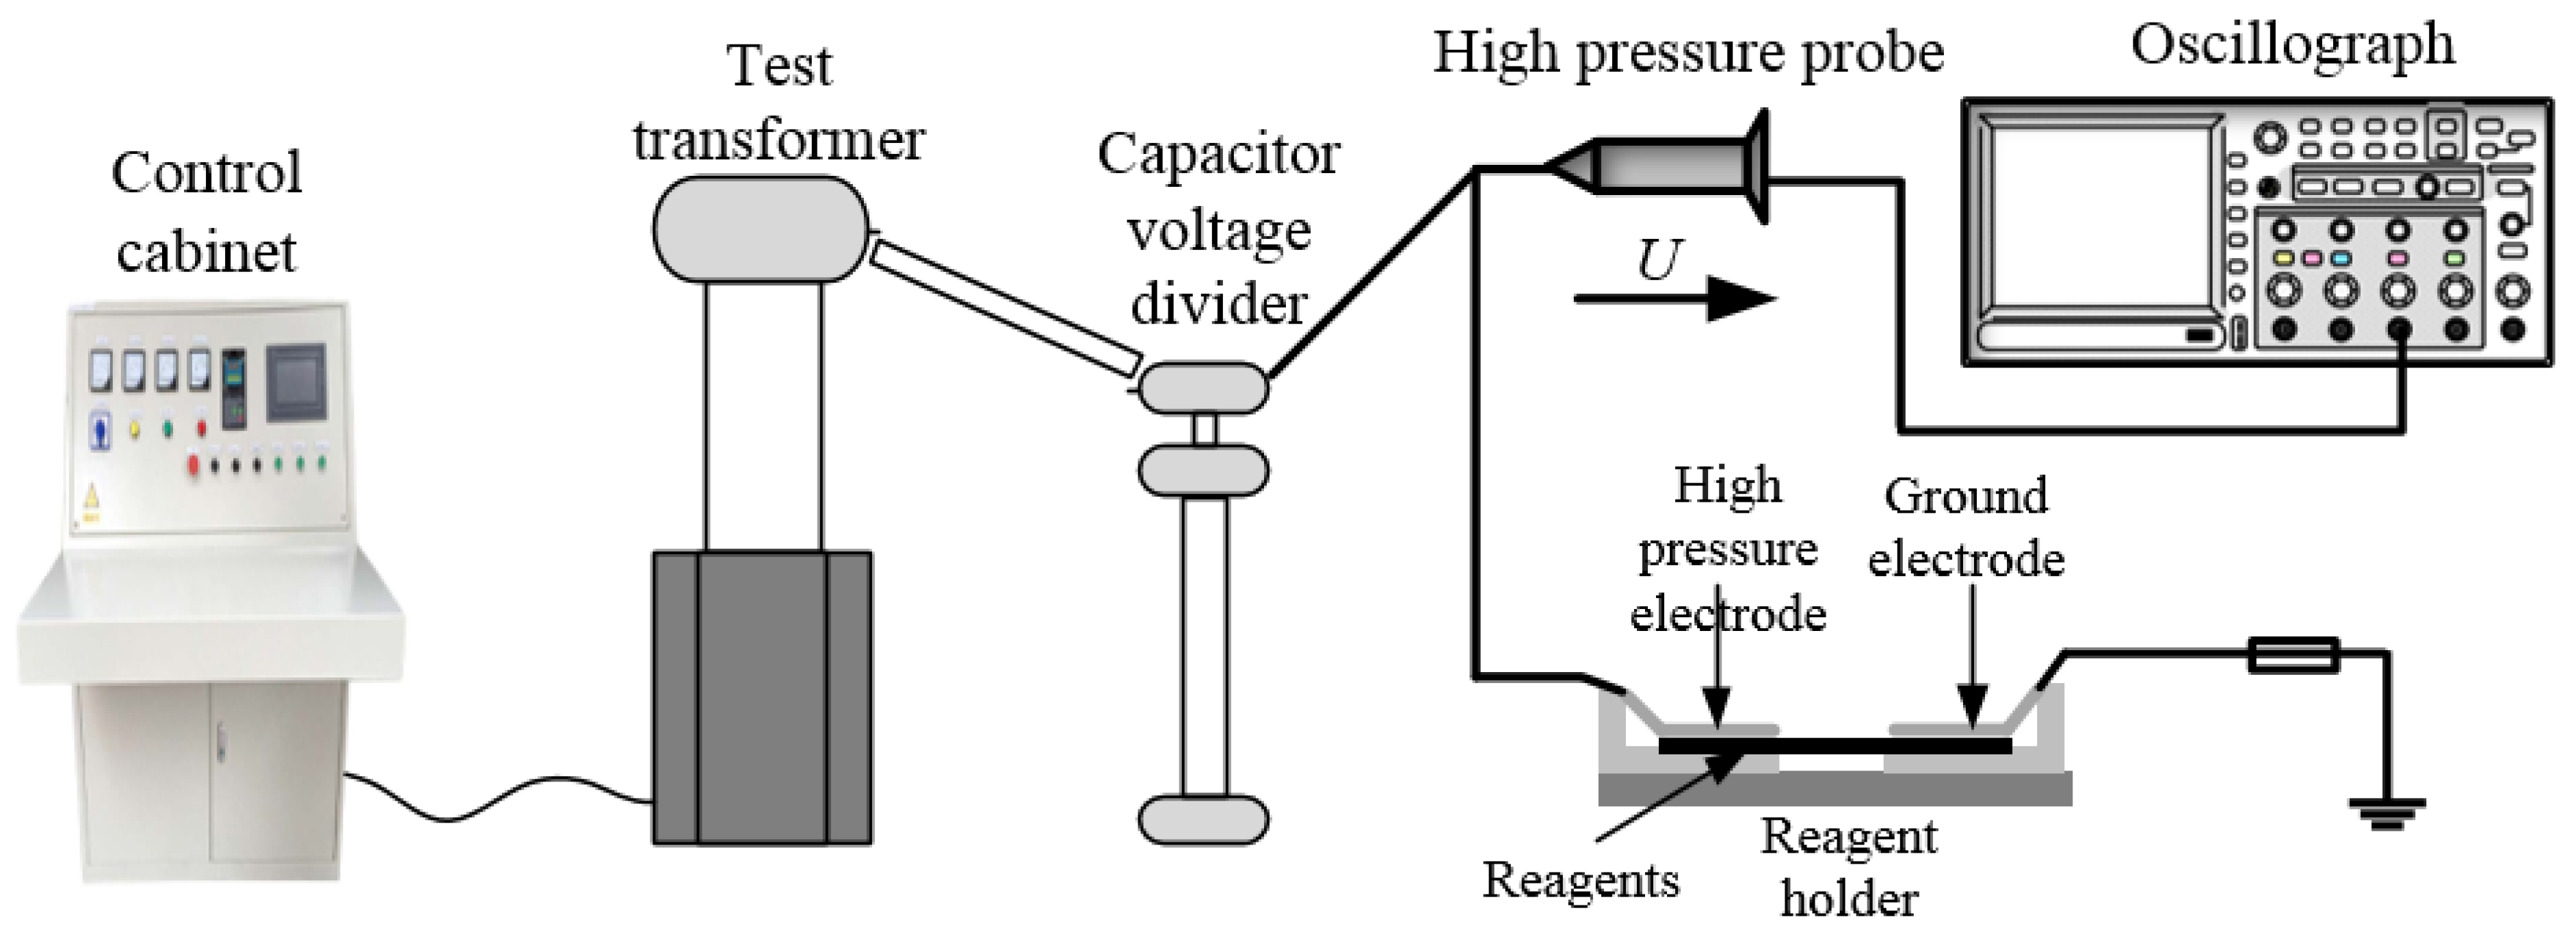
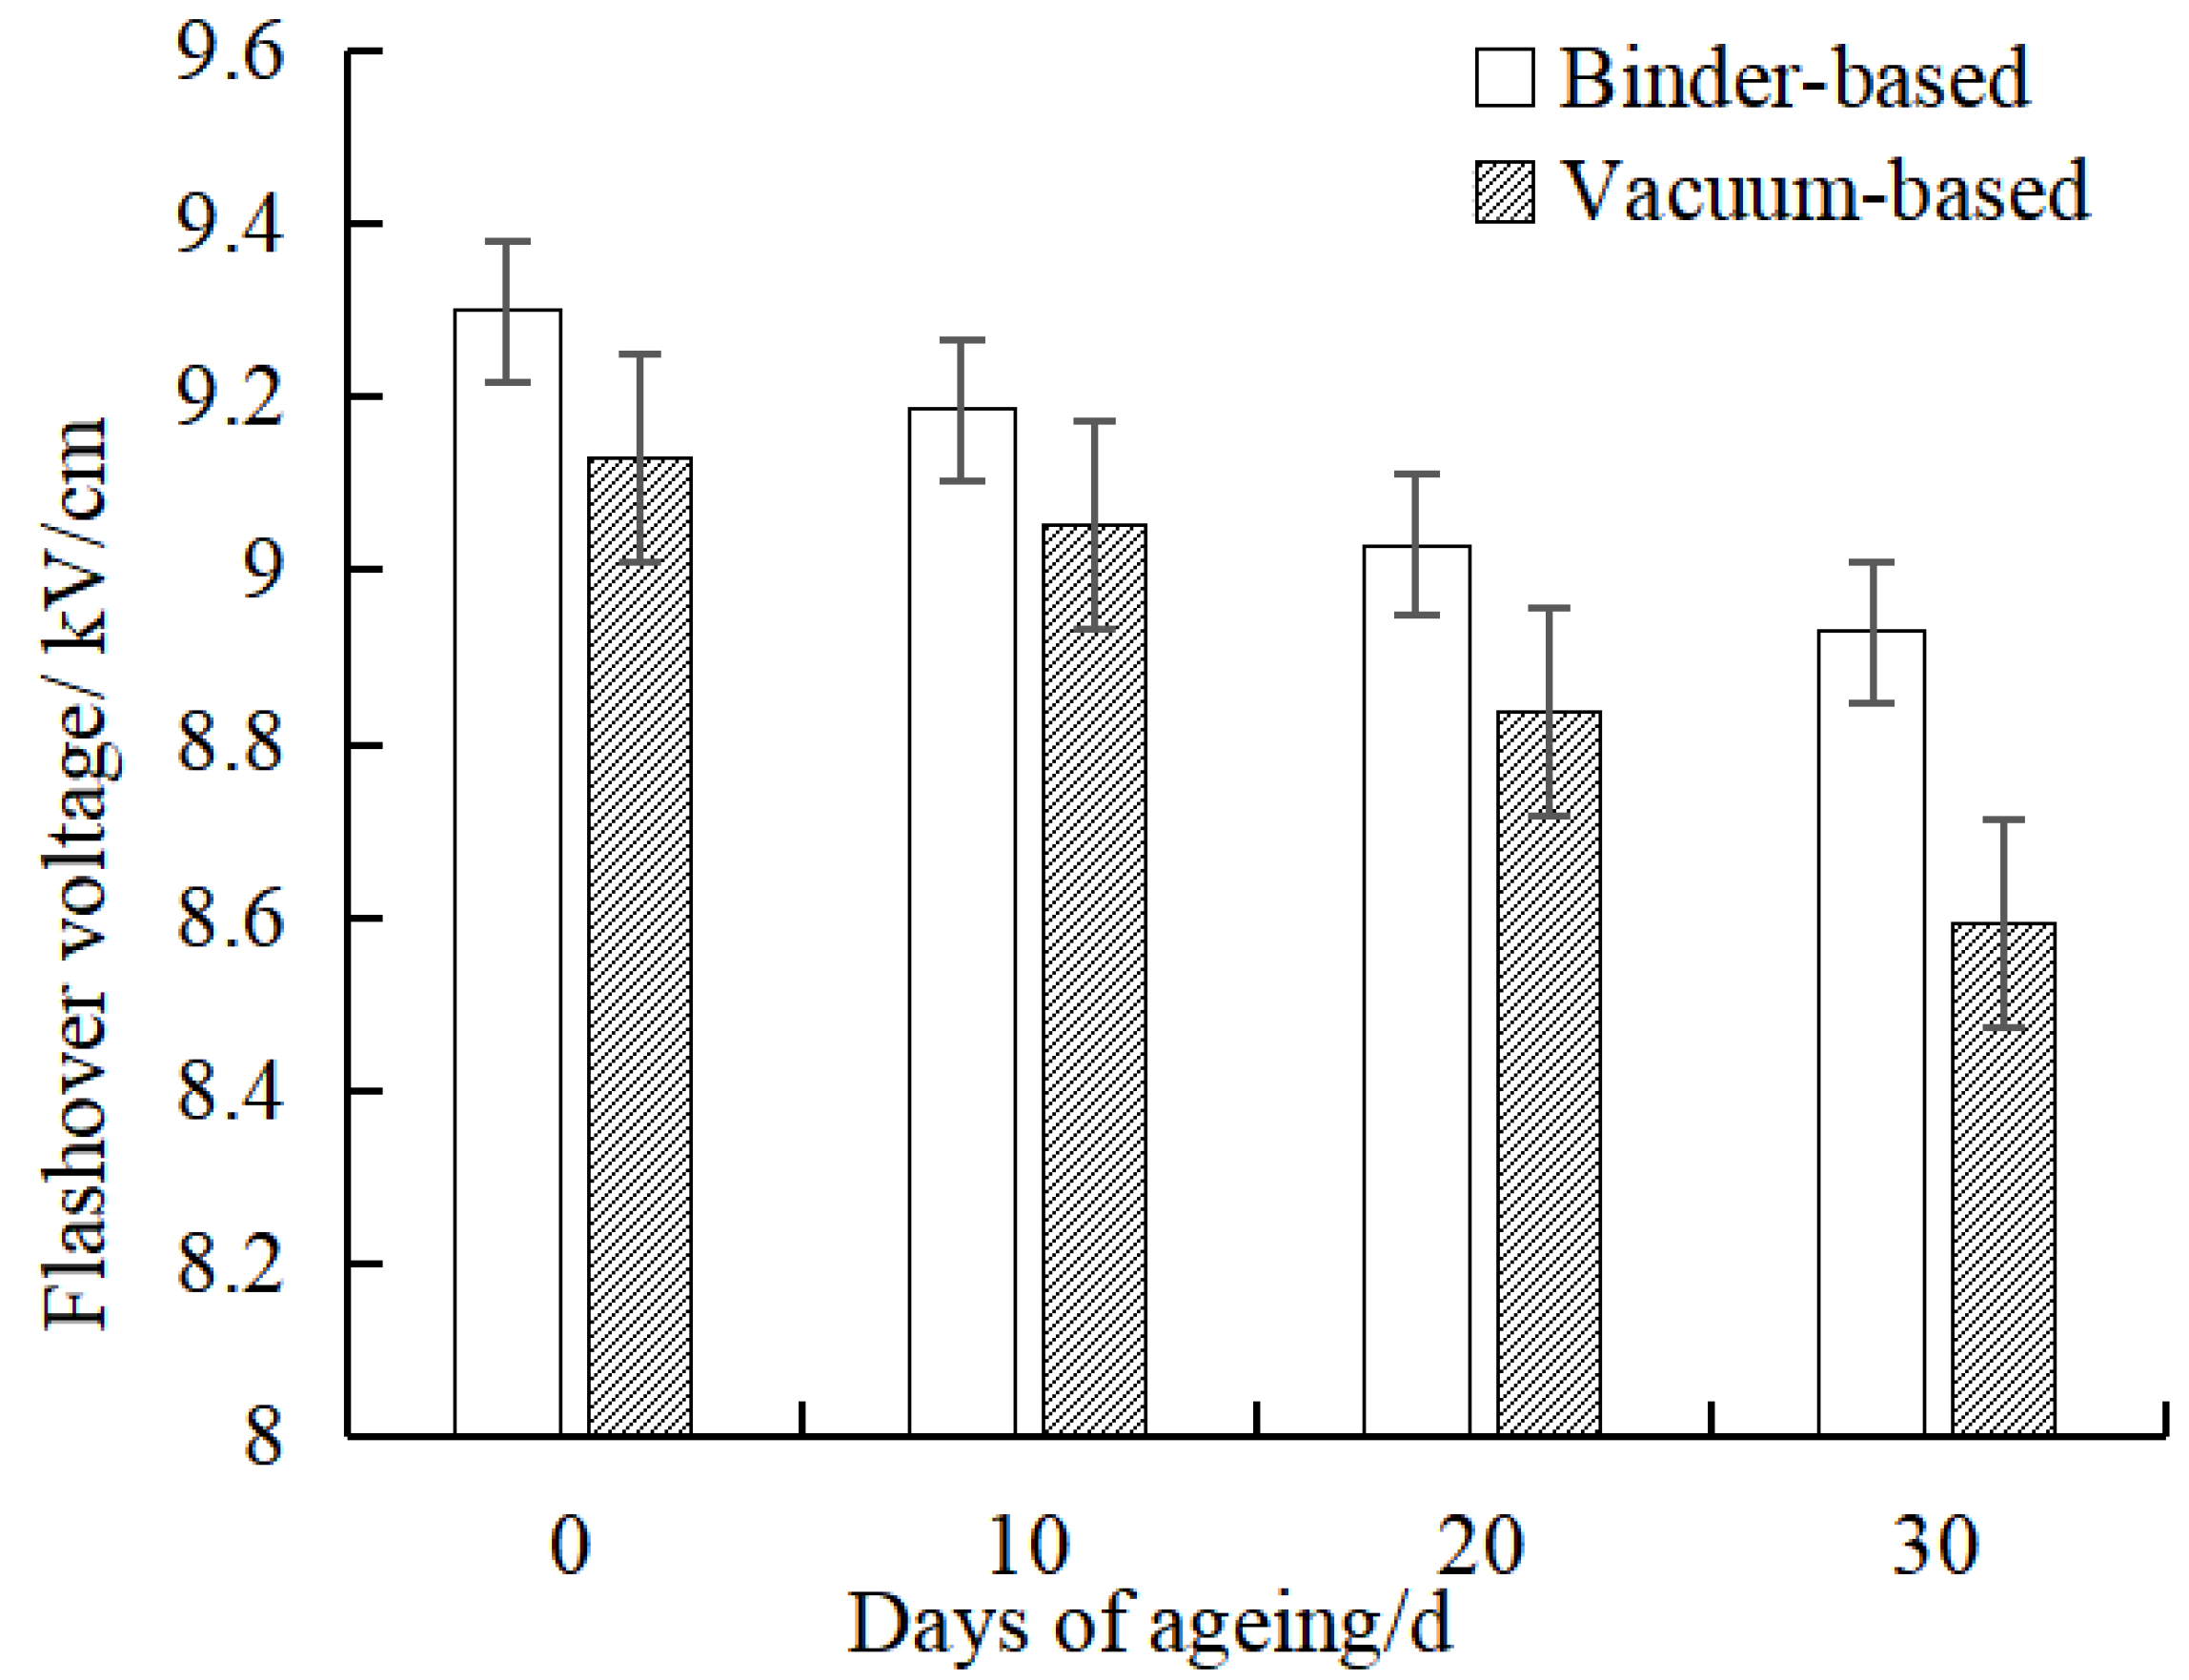
(2) Insulation performance analysis: Insulation integrity was assessed utilizing the surface flashover test principle, as depicted in
Figure 2. The test circuit consisted of a console, protection resistor, test transformer, and capacitor divider. The oscilloscope was connected to a high-voltage probe to detect the output voltage in real time. This examination was conducted under controlled environmental conditions, maintained at (25 ± 1) °C. Adhering to the standards outlined in GB/T 1408.1-2016 [
25], a gradual-voltage-increase test was employed, with a voltage ramp rate meticulously set to 0.5 kV/s. This method ensures a comprehensive evaluation of the insulation’s performance under electrical stress.
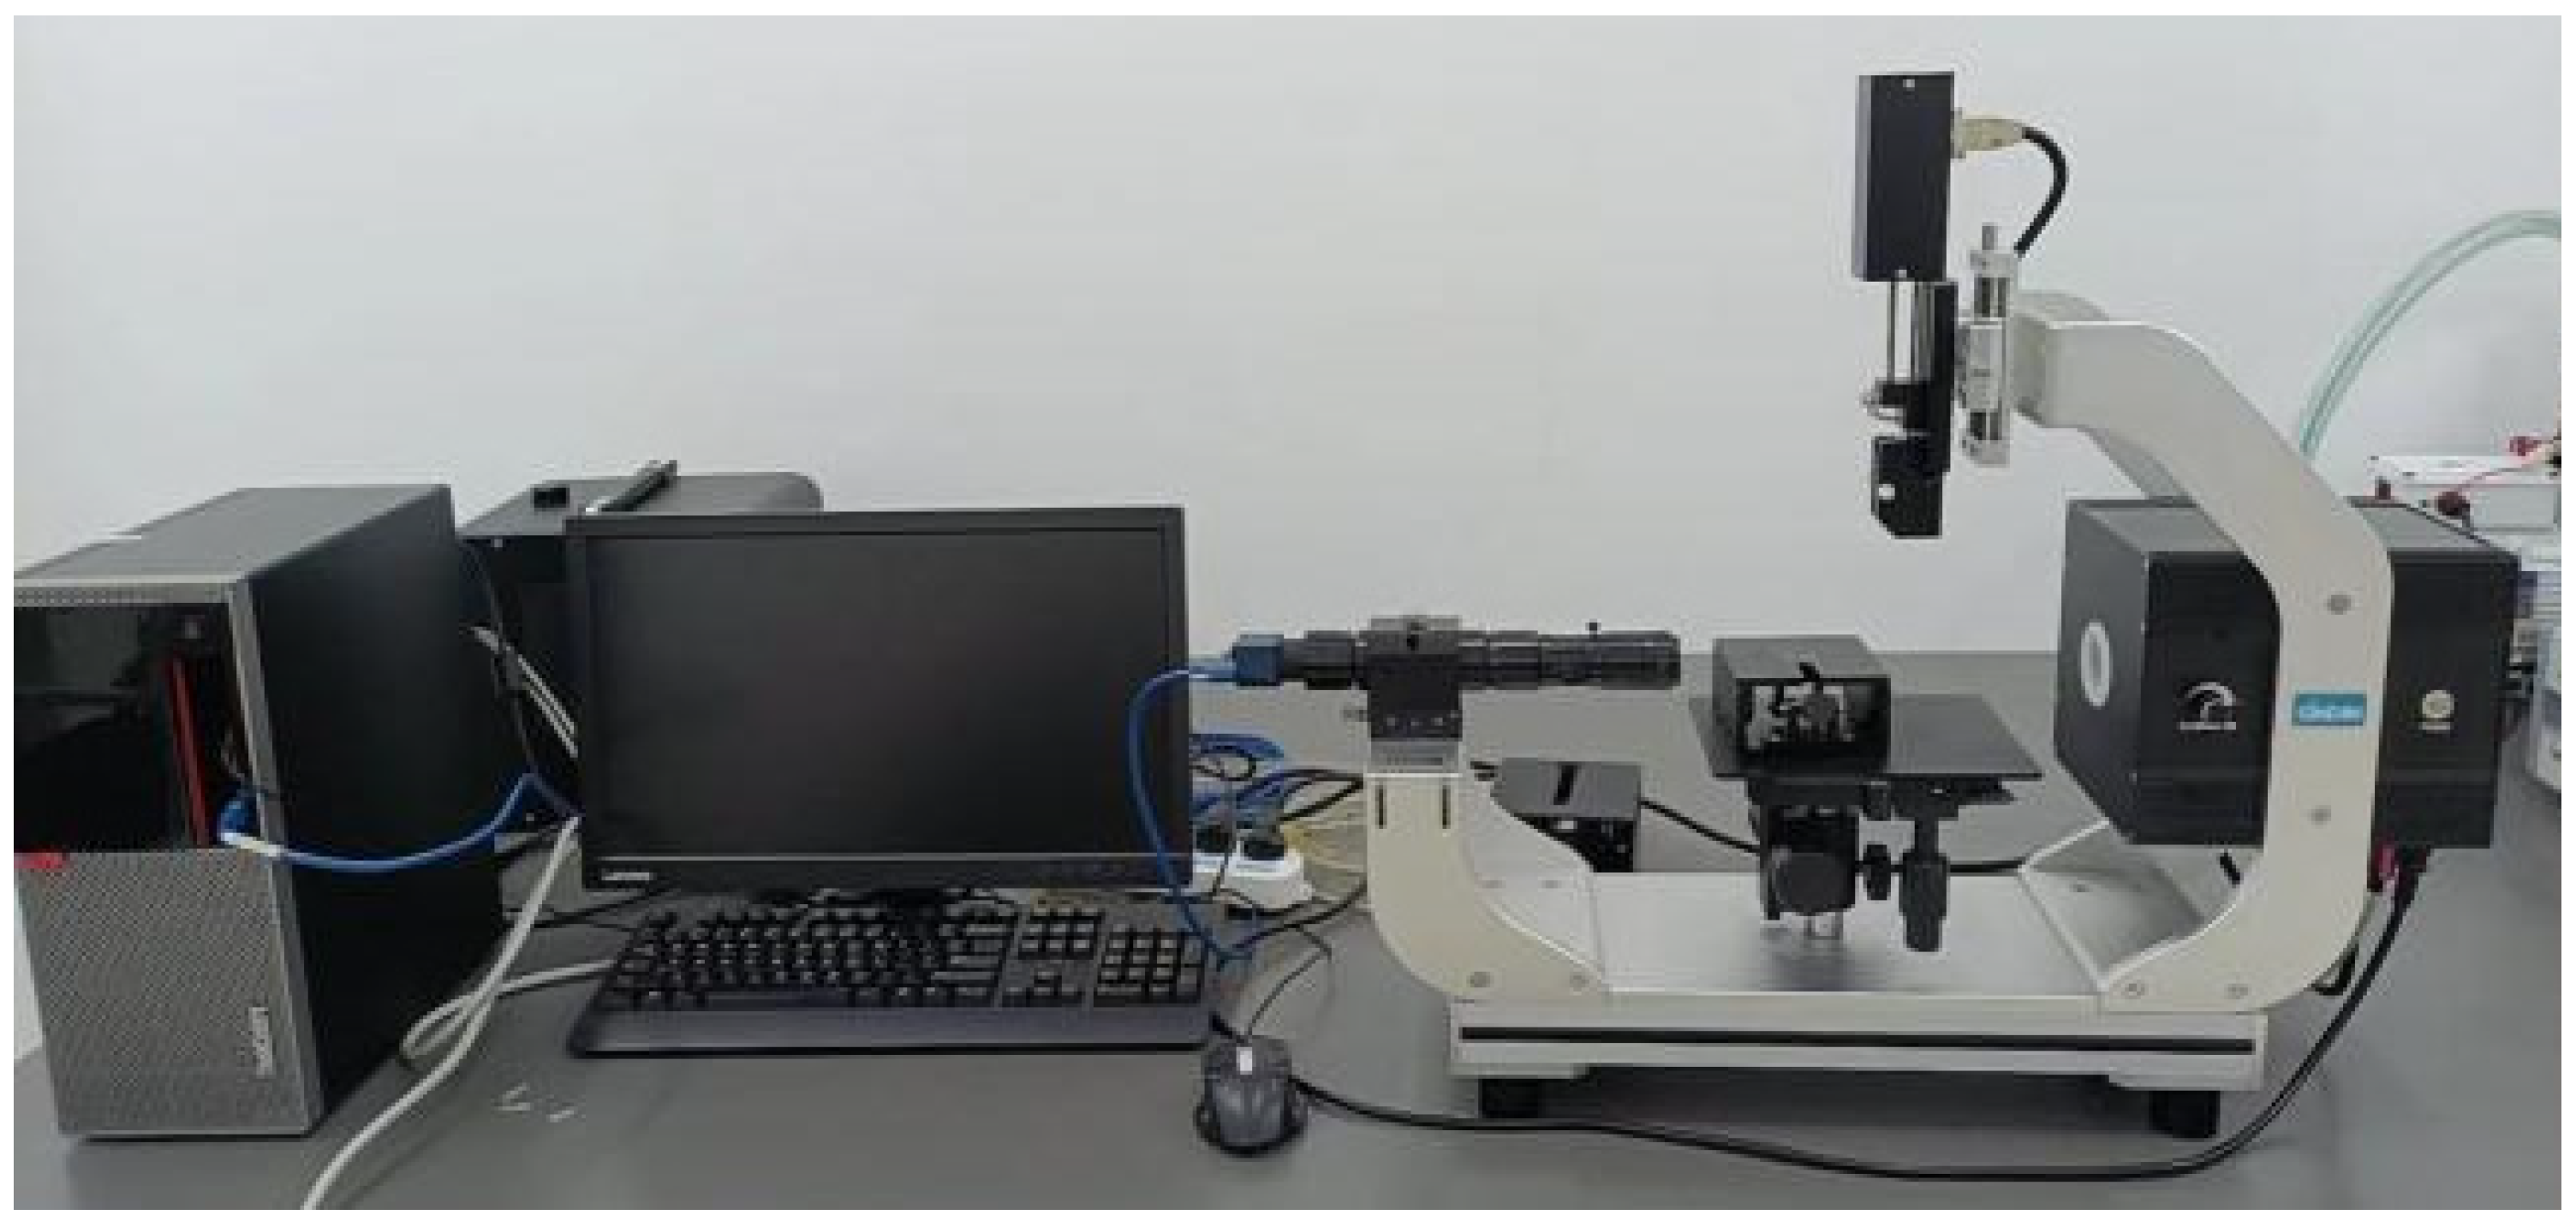
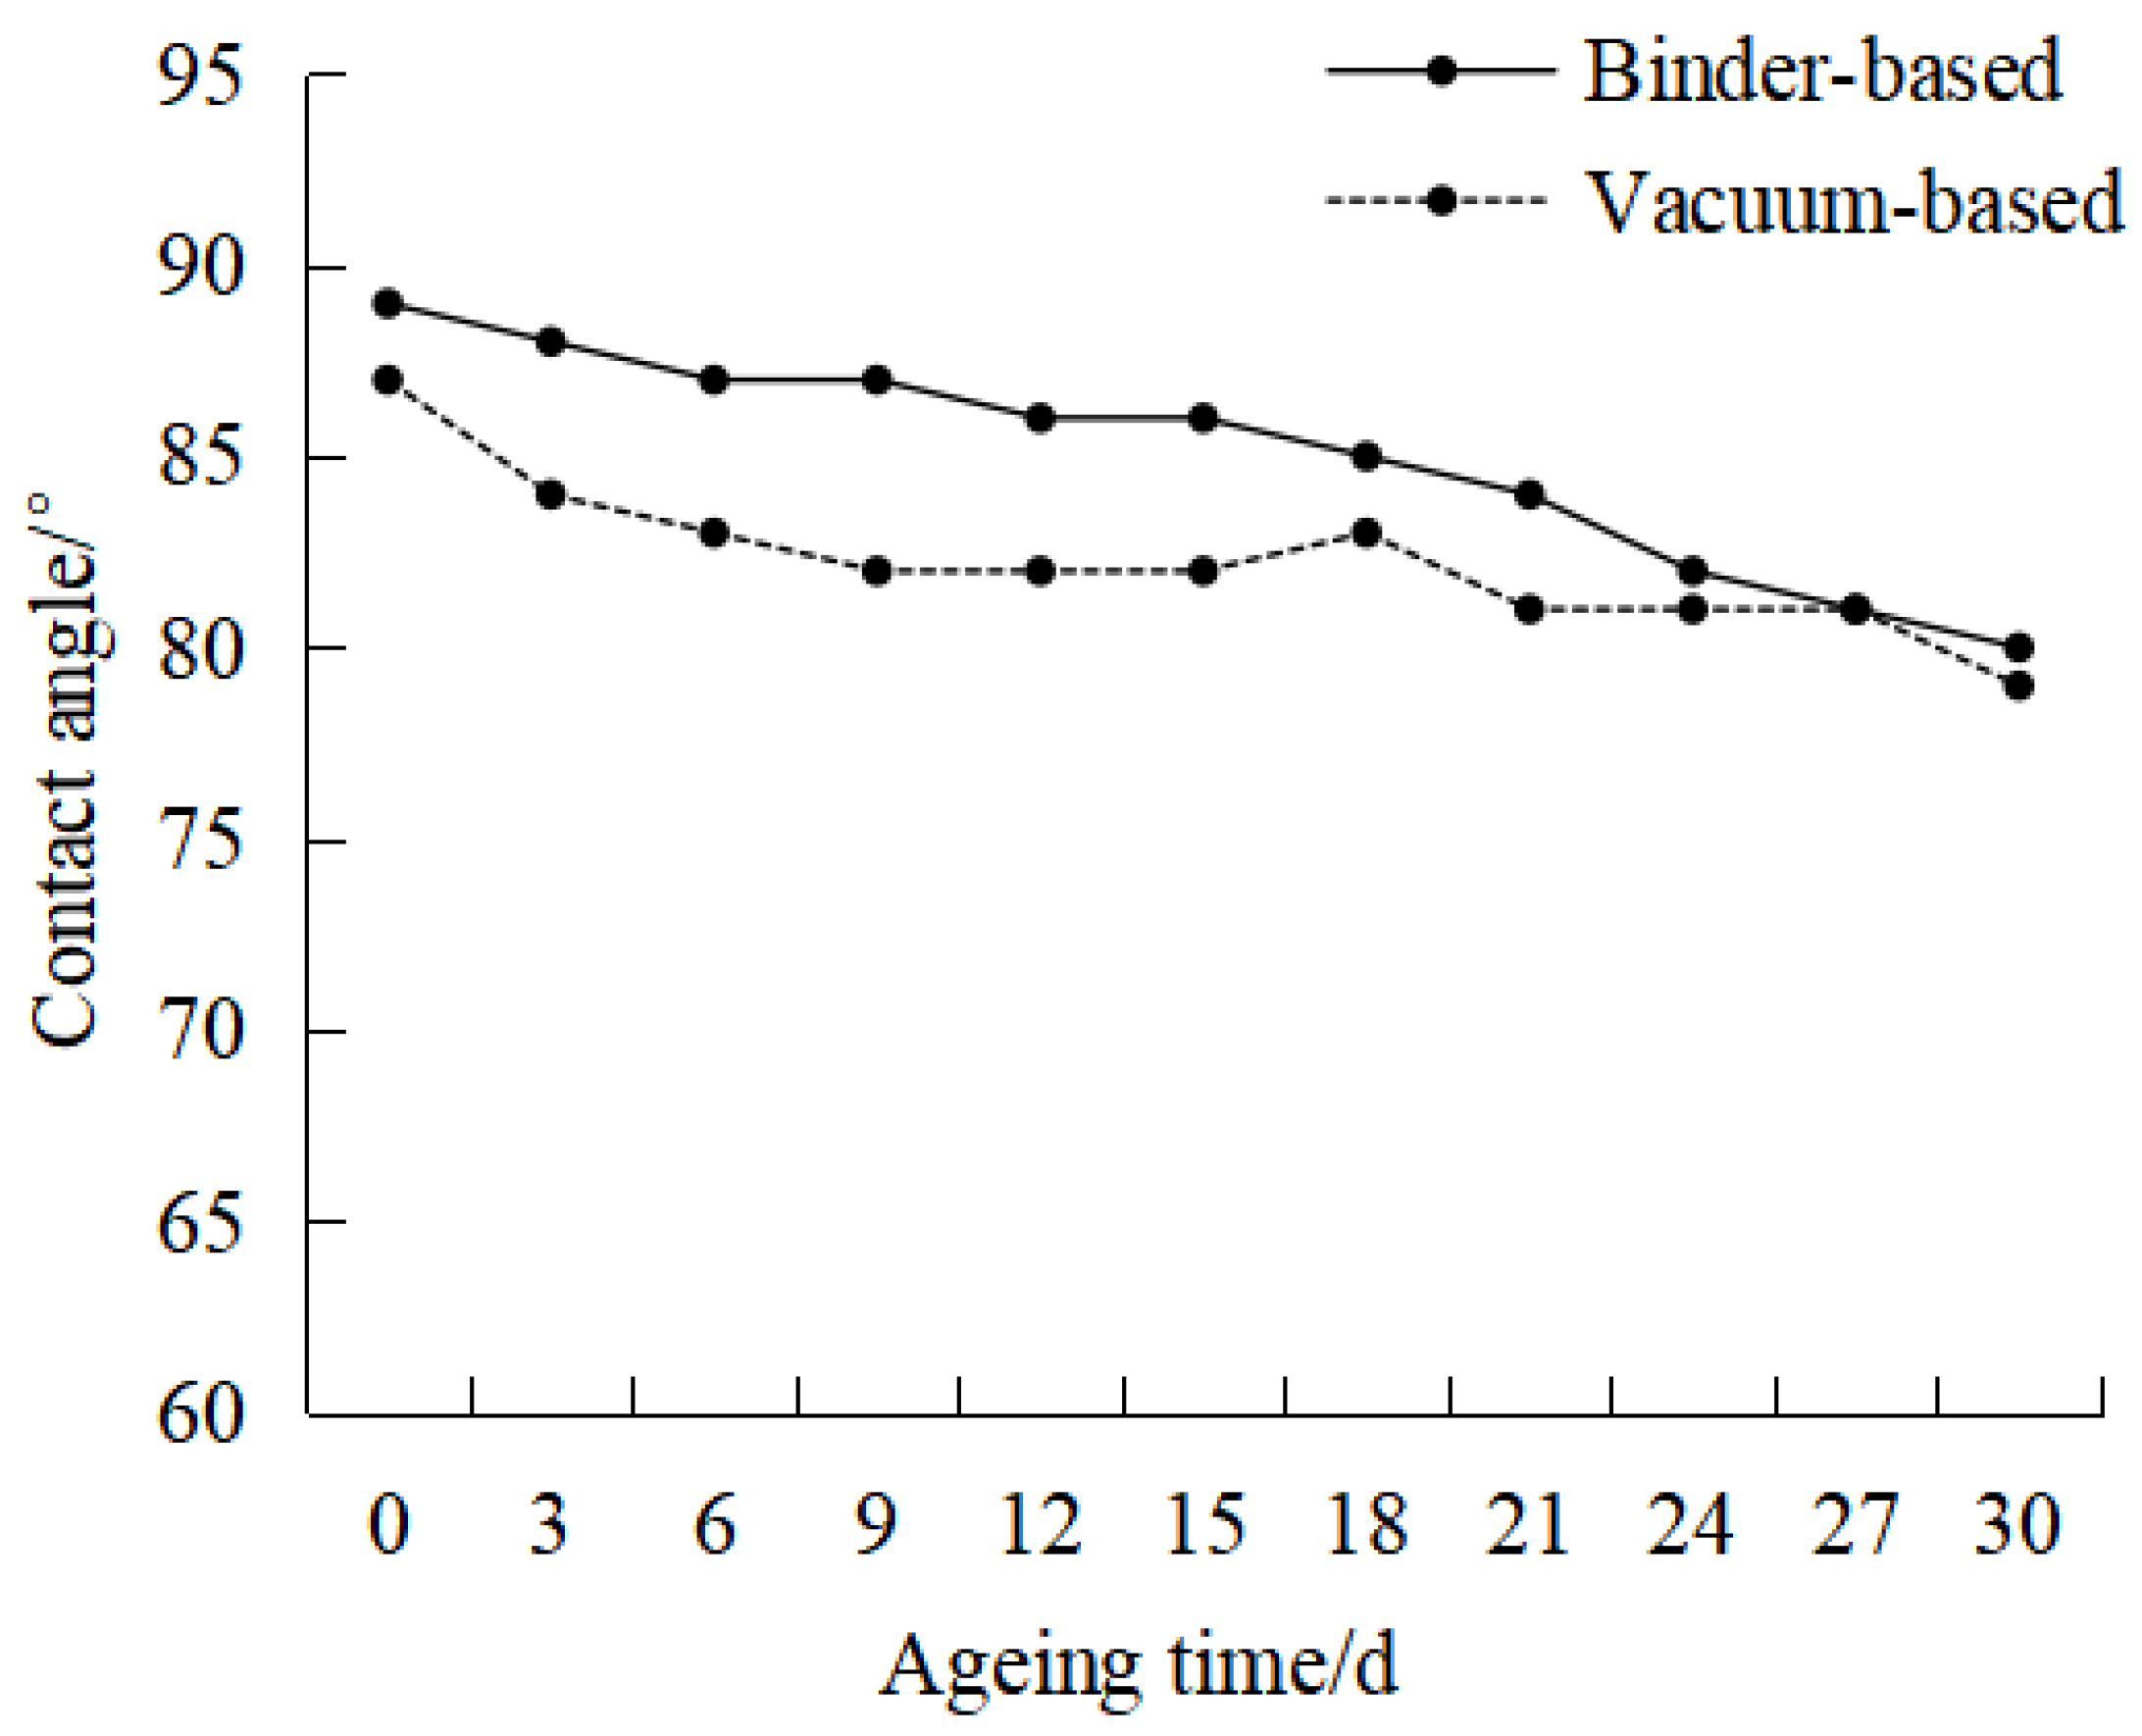
(3) Water contact angle test: The water contact angle test platform is shown in
Figure 3. The temperature indicator patch sample to be measured was placed on the sample table of the water contact angle measuring instrument, the position of the sample was adjusted so that the acquisition system could obtain a clear image, and the injection unit was triggered to make the liquid drop fall on the surface of the sample. The water contact angle data were obtained by using the automatic ellipse fitting method. Ten locations were measured for each group of samples, and the average water contact angle was obtained after removing the maximum and minimum values.
4. Conclusions
The conclusions drawn are as follows.
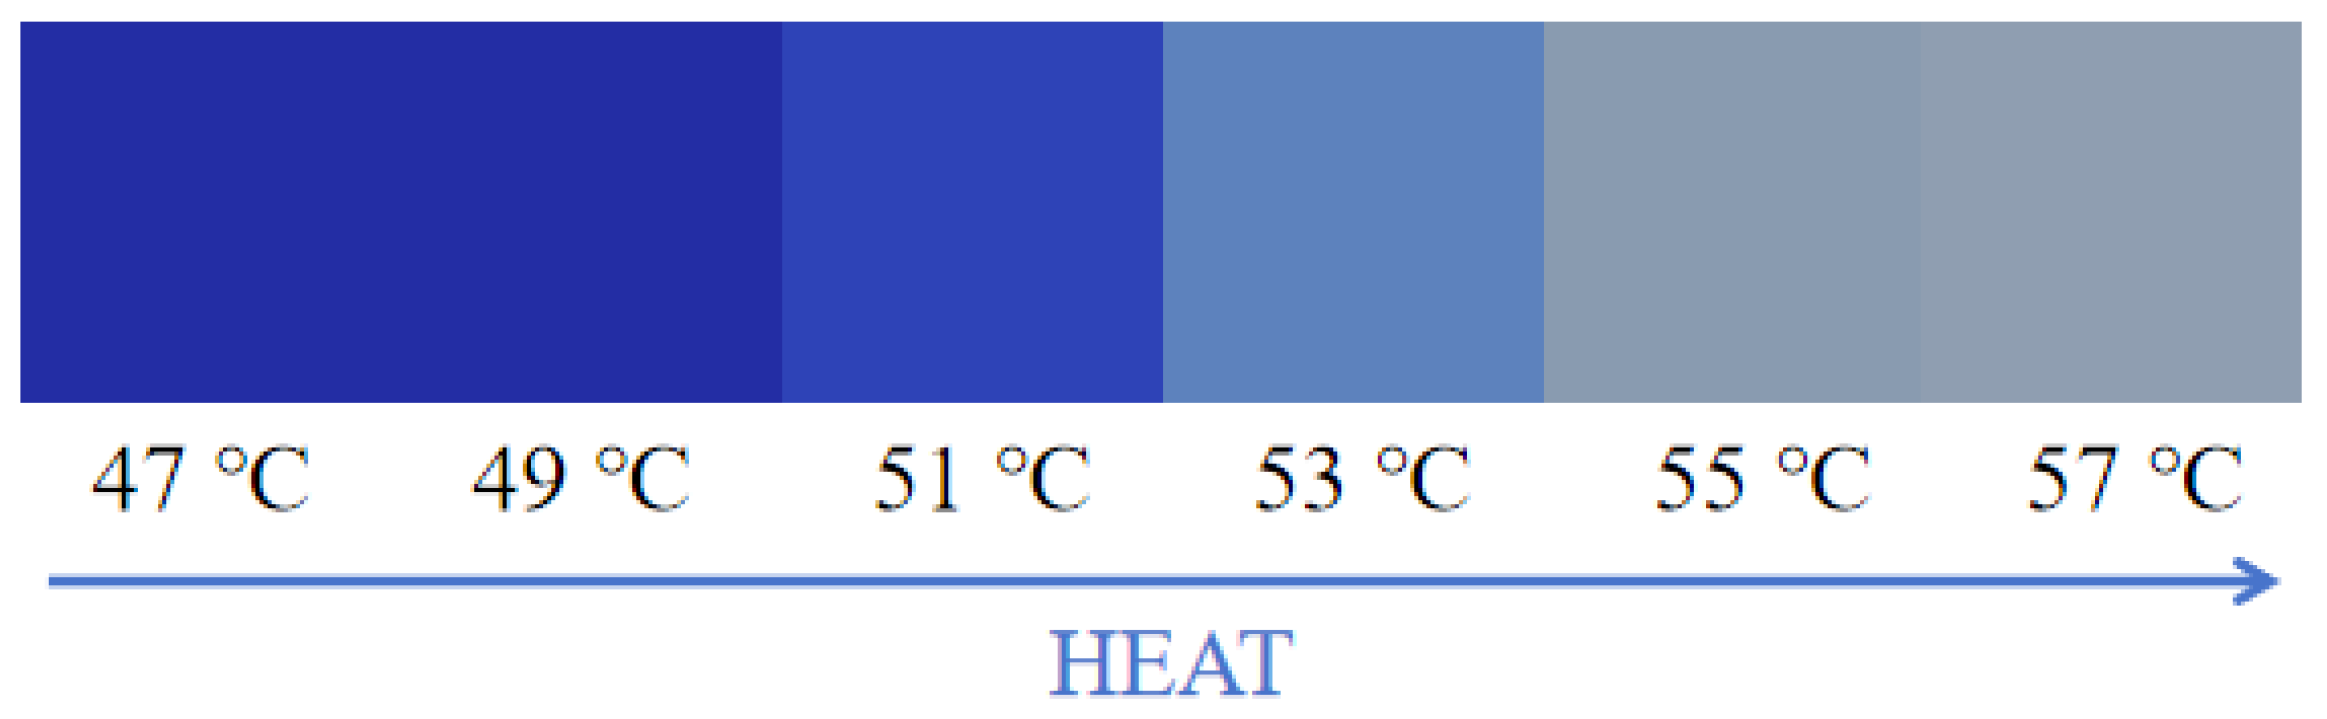
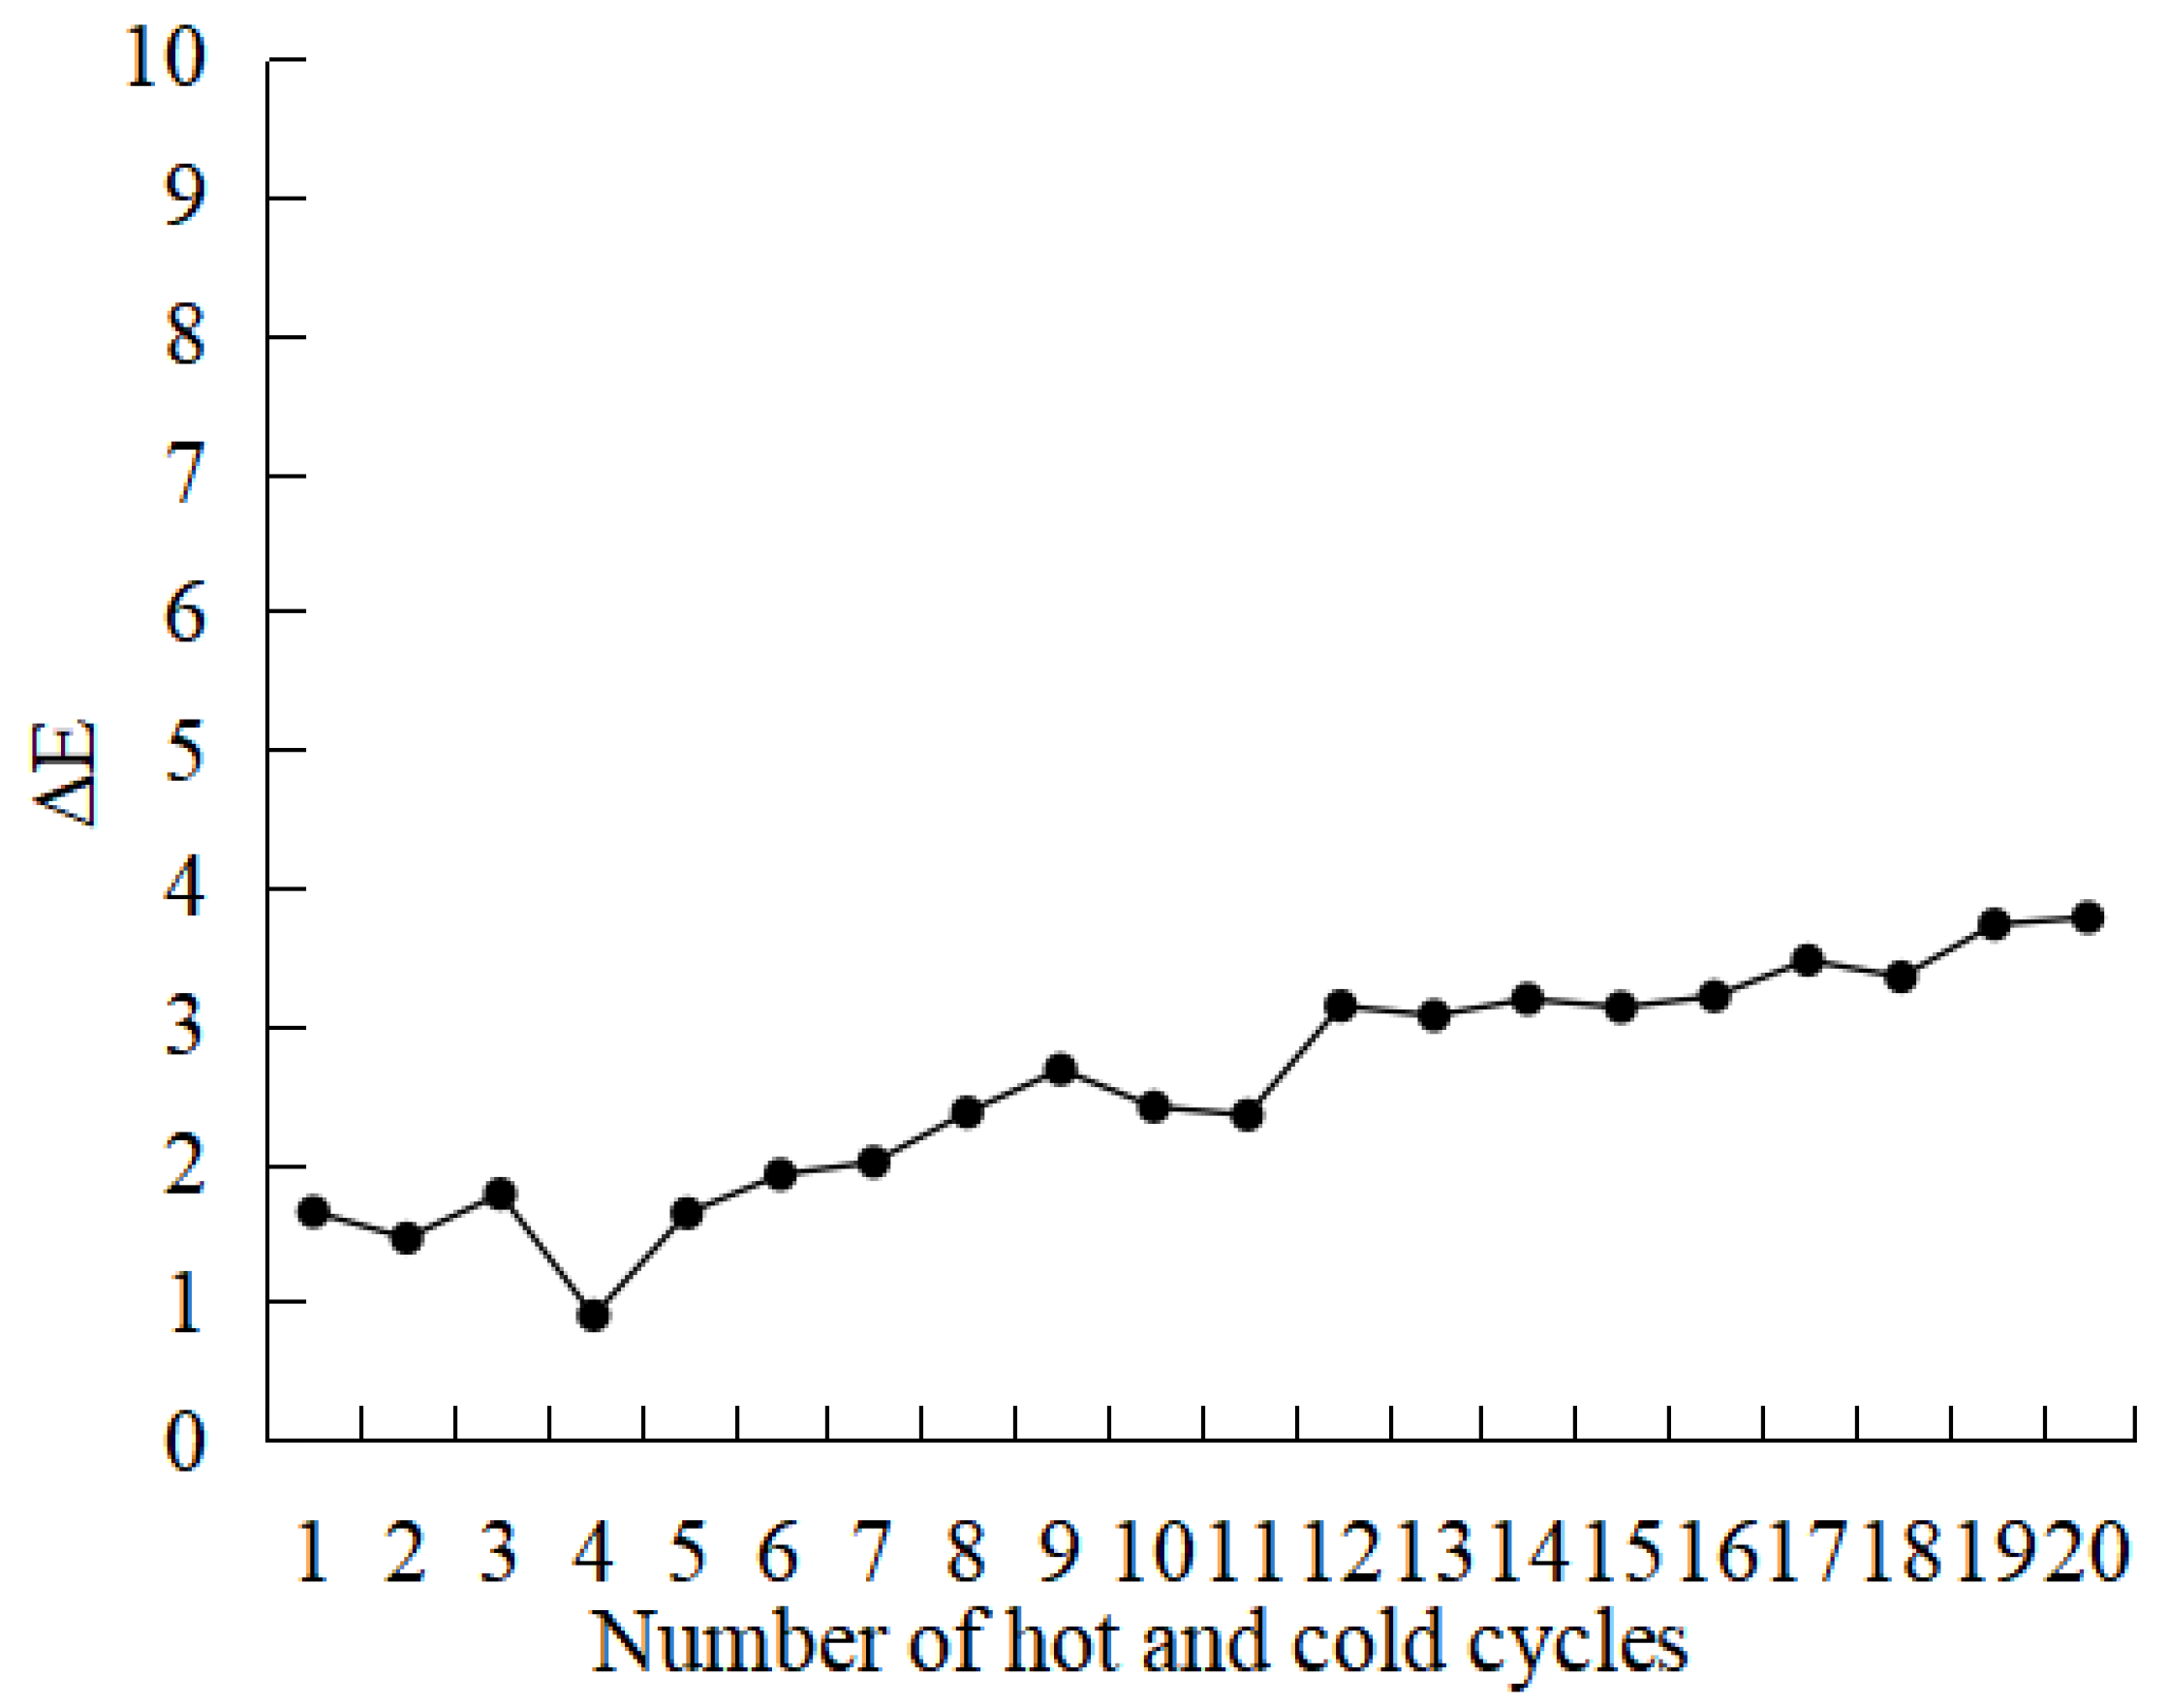
(1) A temperature-sensitive display patch was fabricated using the melt processing technique, characterized by a transitional phase with a fading interval of 49~55 °C and a reversible coloration span of 45~55 °C. This patch exhibits a pronounced chromatic transition, with the disappearance of color occurring within 15 s and color restoration taking approximately 69 s. Repeated thermal cycling tests, conducted 20 times, revealed a minimal variation in color difference (ΔE), ranging from 0.90 to 3.78. This represents a negligible proportion (1.25~5.26%) relative to the baseline color difference value of 71.86 observed upon complete color change. These findings underscore the patch’s robust reversible functionality, affirming its potential for applications requiring precise temperature monitoring.
(2) With increasing thermal aging duration, the water contact angles of both binder-based and vacuum-based temperature-indicating patches exhibit a consistent decline. Specifically, the contact angle for binder-based patches decreases from 89° to 80°, whereas for vacuum-based patches, it falls from 87° to 79°. Notably, the binder-based patches demonstrate superior flashover voltage per unit length compared to their vacuum-based counterparts, indicating enhanced electrical insulation properties. However, as aging progresses, both types of patches show a diminishing trend in flashover voltage per unit length, with reductions of 3.98% for binder-based and 5.91% for vacuum-based patches, respectively. This suggests that, despite a general decline in electrical performance over time, binder-based patches maintain relative stability in their electrical properties when compared to vacuum-based patches.


