1. Introduction
Renewable energy has been widely employed to alleviate energy crises and carbon emissions. However, this type of energy features random volatility, high intermittency, and an uneven regional distribution. A high proportion of renewable energy power plants brings great challenges to the safety of the grid. Gas turbine power plants are excellent peak regulation apparatus due to their fast start-up and shut-down capabilities and high operational flexibilities. These properties allow the grid to accommodate more new energy resources. To meet the pollutant emission standards, the original equipment manufacturers have proposed the dry lean premixed combustion technique for gas turbines. However, serious thermoacoustic instabilities are encountered in developing this type of low-emission gas turbine combustor [
1,
2]. Thermoacoustic instabilities cause large-amplitude pressure fluctuations, which damage critical components of the combustor and its downstream turbine blades [
3]. Meanwhile, using gas turbines to burn the hydrogen fuel produced from renewable energy is considered a nearly carbon-neutral method. The original equipment manufacturers are all developing hydrogen gas turbines to address the climate issue. For instance, the DLN 2.6e combustor for an H-class gas turbine developed by General Electric Company can burn 50% vol. H
2 at present. Hydrogen possesses a high chemical reactivity and a small Lewis number, which leads to the flame being more prone to wrinkle, and the heat release rate fluctuation is intensified. As a result, thermoacoustic instabilities become much more significant when using hydrogen fuel for carbon emission reductions [
4,
5,
6], which restricts the development of hydrogen gas turbines.
Thermoacoustic instabilities are caused by interactions between heat release fluctuations and pressure fluctuations [
7]. This phenomenon involves a combination of flame dynamics, combustor acoustics, burner aerodynamics, etc. [
8,
9,
10]. If the thermoacoustic instabilities for a certain gas turbine combustor can be accurately numerically predicted in the design stage, the development cost and period can be significantly reduced [
11]. Meanwhile, optimization of the geometric parameters can be performed based on a prediction method [
12,
13].
The methods for predicting thermoacoustic instabilities include the low-order network model [
14,
15,
16,
17], the Helmholtz method [
18,
19,
20,
21,
22,
23], and compressible large-eddy simulation [
24,
25,
26,
27]. The low-order network model is based on homogeneous acoustic elements. The acoustic wave is transmitted among the elements based on an acoustic wave equation. However, this method is available for only one- or quasi-two-dimensional structures. For real gas turbine combustors with complex three-dimensional structures, the Helmholtz solver and large-eddy simulation can be utilized to evaluate the stability of the combustion system. Large-eddy simulation needs to be combined with the time-domain impedance boundary condition [
24], leading to a high computational cost. Comparatively, the Helmholtz method solved in the frequency domain has an affordable cost and seems more appropriate for industrial applications.
The Helmholtz method has been reported in many literature works. Campa et al. [
28] analyzed the thermoacoustic instabilities of an annular gas turbine combustor using a three-dimensional Helmholtz method. The Helmholtz equation is discretized using the Galerkin finite element method. The corresponding growth rates, eigenfrequencies, and acoustic modes were solved using the n-τ flame transfer function. Silva et al. [
19] used an in-house Helmholtz solver named AVSP to predict the limit cycle characteristics of an annular combustor. Nonlinear flame describing functions are embedded into this solver. The results indicated that the flame shape had a weak influence at low frequencies due to the small flame scale compared with the acoustic wavelength, while the opposite results were found at high frequencies. Cuquel et al. [
29] compared the numerical results with experimental ones and those calculated using the low-order model. Both linear and nonlinear unstable modes, as well as the frequency and amplitude, can be obtained using the Helmholtz solver. Notably, the Helmholtz method has more potential than the low-order model when dealing with more complex geometries. Mensah et al. [
30] quantified the impact of uncertainties in variables such as the equivalence ratios, geometric parameters, boundary impedance, and flame response models on the mode frequencies and growth rates of an annular combustor using an adjoint method. Non-uniform distributions of the physical parameters and the spatial flame distributions have a great influence on the predicted numerical results. Laera et al. [
23] investigated the effect of the flame morphology used in the simulation on the predicted results. Conical, long cylindrical, and short cylindrical flame morphologies are compared in detail in their work. It is concluded that numerically calculated results are sensitive to flame morphologies.
The Helmholtz method has been used to numerically predict the thermoacoustic instabilities in gas turbine combustors in plentiful literature works. However, the flame response model has mainly been linear or weakly linear [
31], and the physical parameters and flames have been simplified into lumped distributions. The acoustic damping rate used to determine the limit cycle is based on cold tests, which are quite different from the hot firing condition. Furthermore, the predicted results are not well compared with the experimental ones, or the prediction accuracy is unreasonable. The impact of critical operational and geometric parameters on the robustness of the numerical method has not been well explored. The corresponding physical mechanisms have not been well discussed from the numerical results.
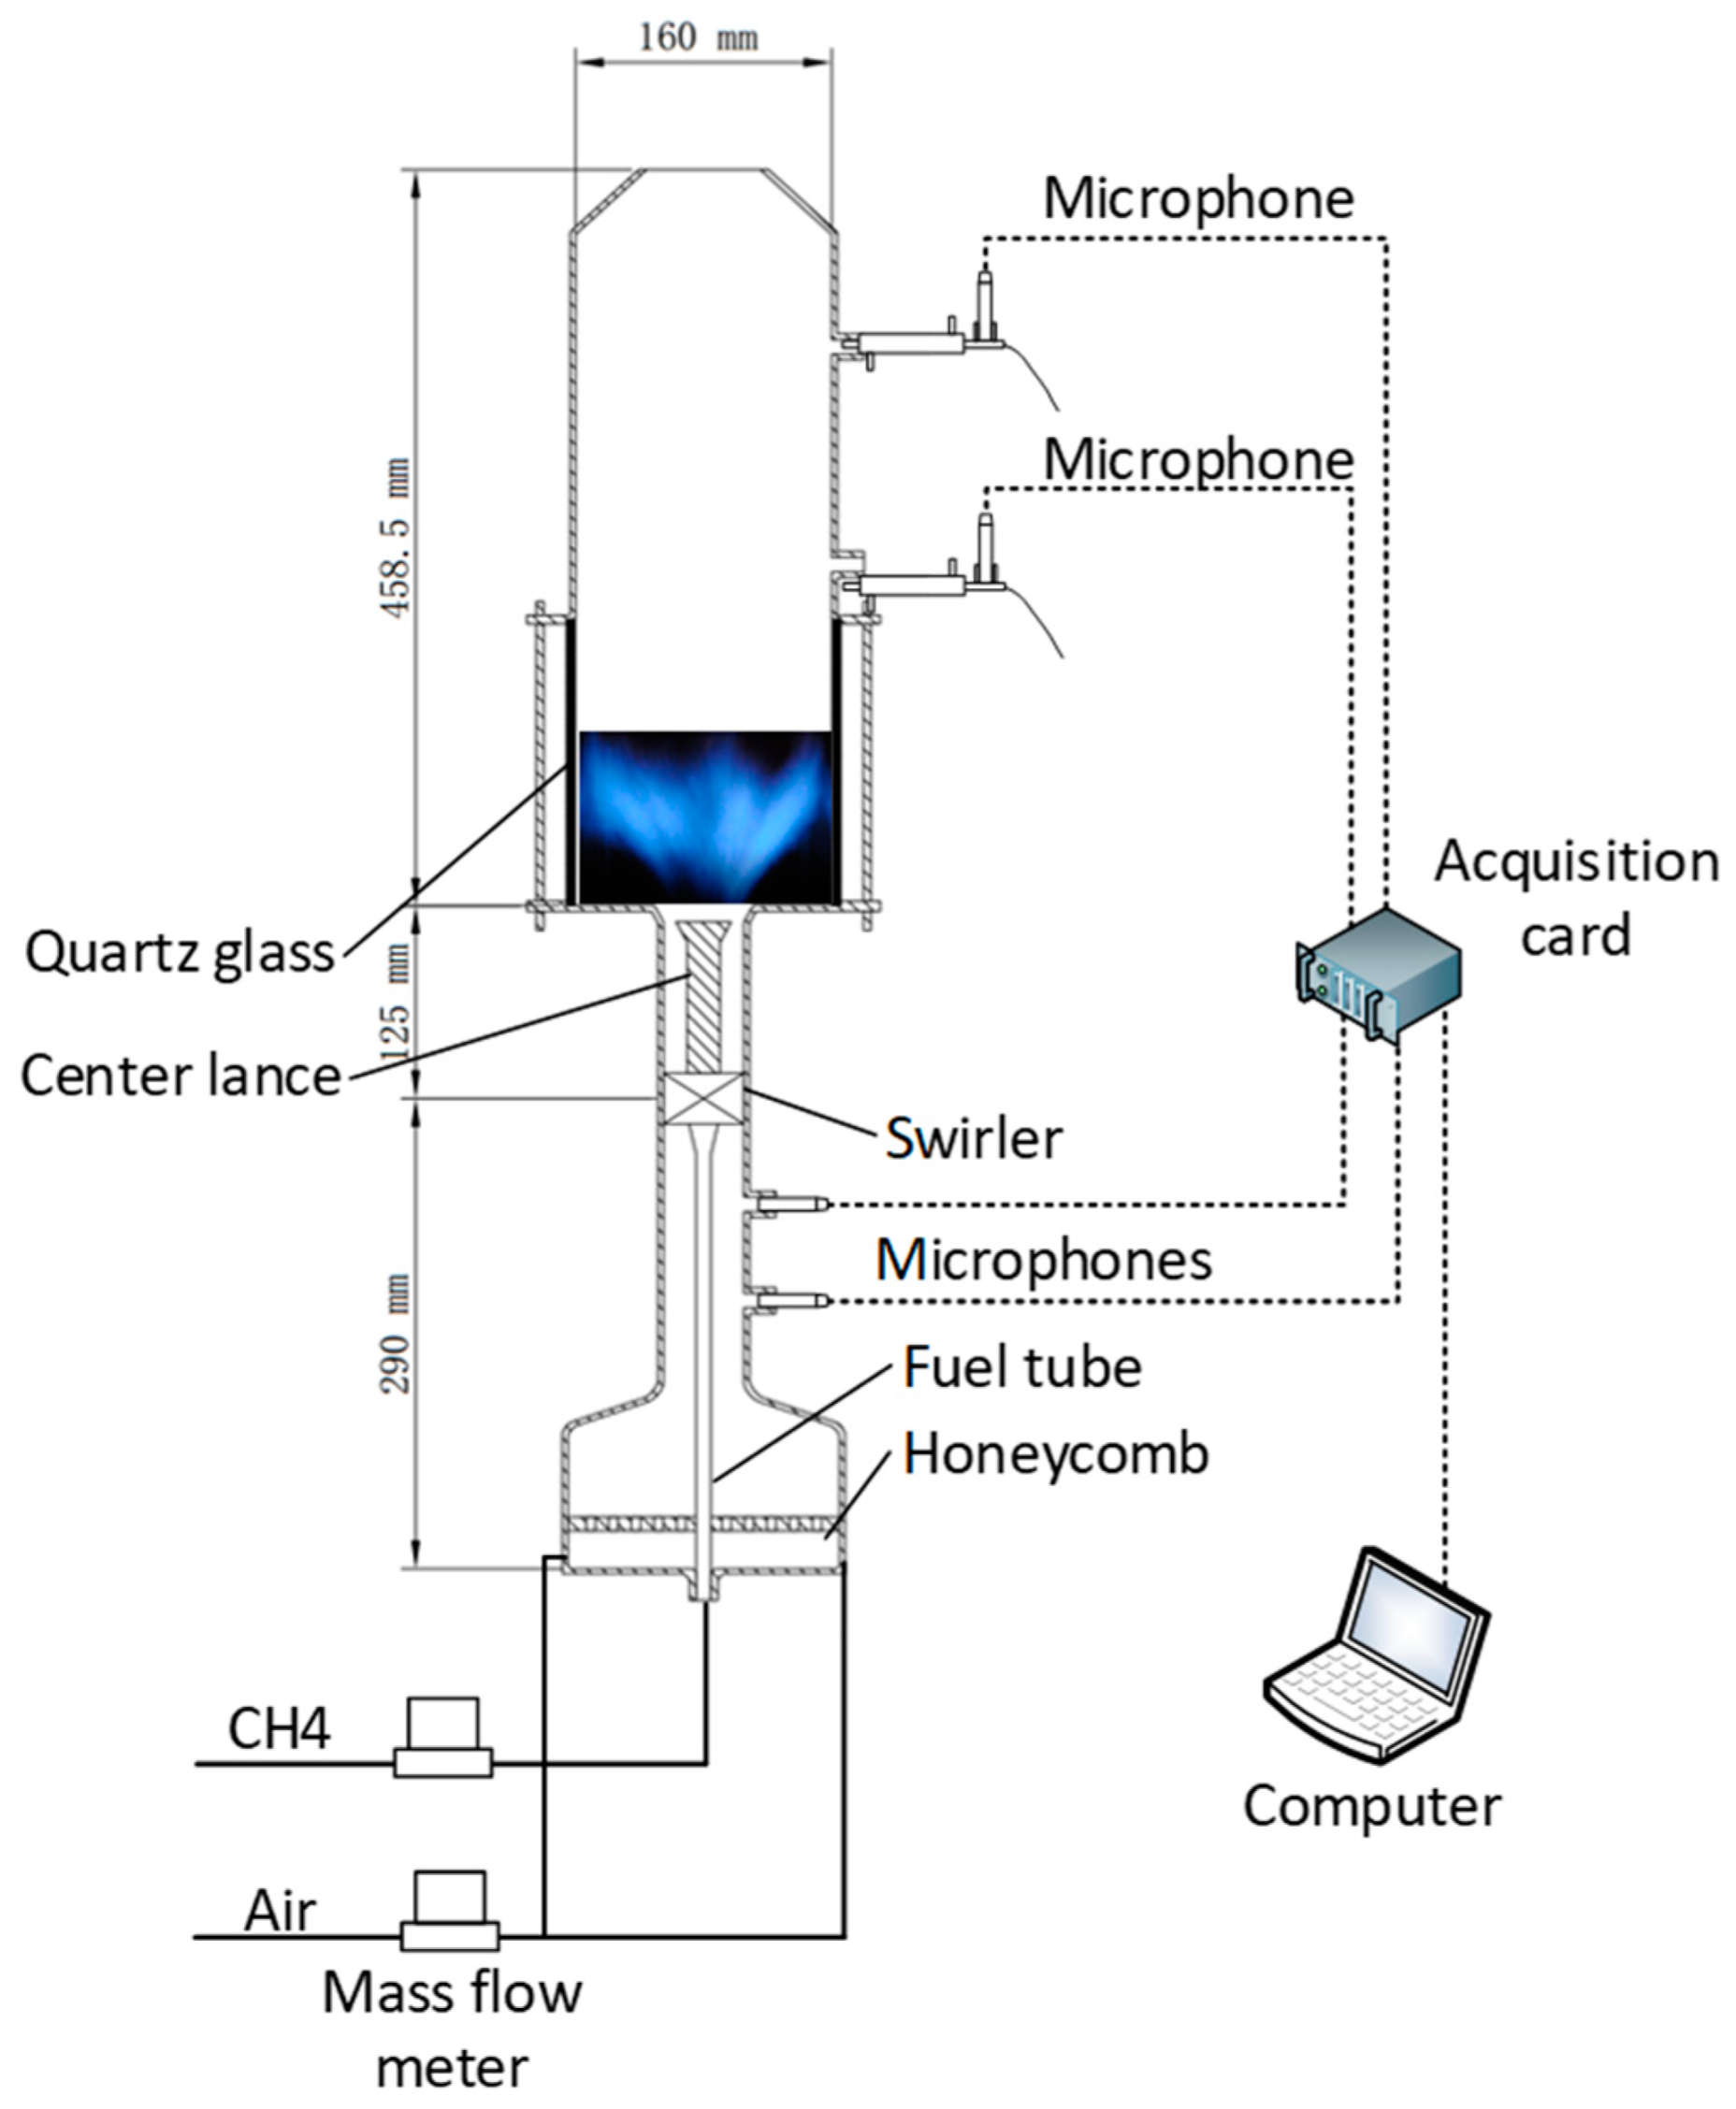
In this work, the Helmholtz method is further developed to predict the thermoacoustic instabilities in a swirled premixed combustor. The flame describing functions are experimentally measured. The non-uniform spatial distributions of the physical parameters and flames are calculated using the CFD method and embedded into the Helmholtz solver. The damping rate for determining the limit cycle is acquired under the firing condition. The predicted results, such as the frequency, amplitude, and mode distributions, are compared in detail with the experimentally measured data. The effect of three key parameters (the equivalence ratios, air flow rates, lengths of the flame tubes) on the thermoacoustic stabilities is numerically and experimentally investigated. The corresponding mechanisms are analyzed to shed light on the stability of the design of gas turbine combustors.
4. Results and Discussion
4.1. Measured Damping Rate
It is considered that the limit cycle state is reached when the numerically calculated growth rate equals the damping rate of the combustion system. In this paper, the damping rate is acquired using experimental frequency response tests. The damping rate is then estimated by analyzing the sharpness of the response curve.
The response curve under the cold condition shows a peak frequency of 455 Hz, which equals the first-order eigenfrequency of the combustion system in the cold state. When the air flow rate increases to 500 L/min, the damping rate under the cold condition decreases from 20.4 rad/s to 17.0 rad/s. This is due to the increasing air flow rate, which reduces the streamwise propagation resistance of an acoustic wave.
The previous results were mainly obtained under cold conditions and are quite different from those under hot conditions.
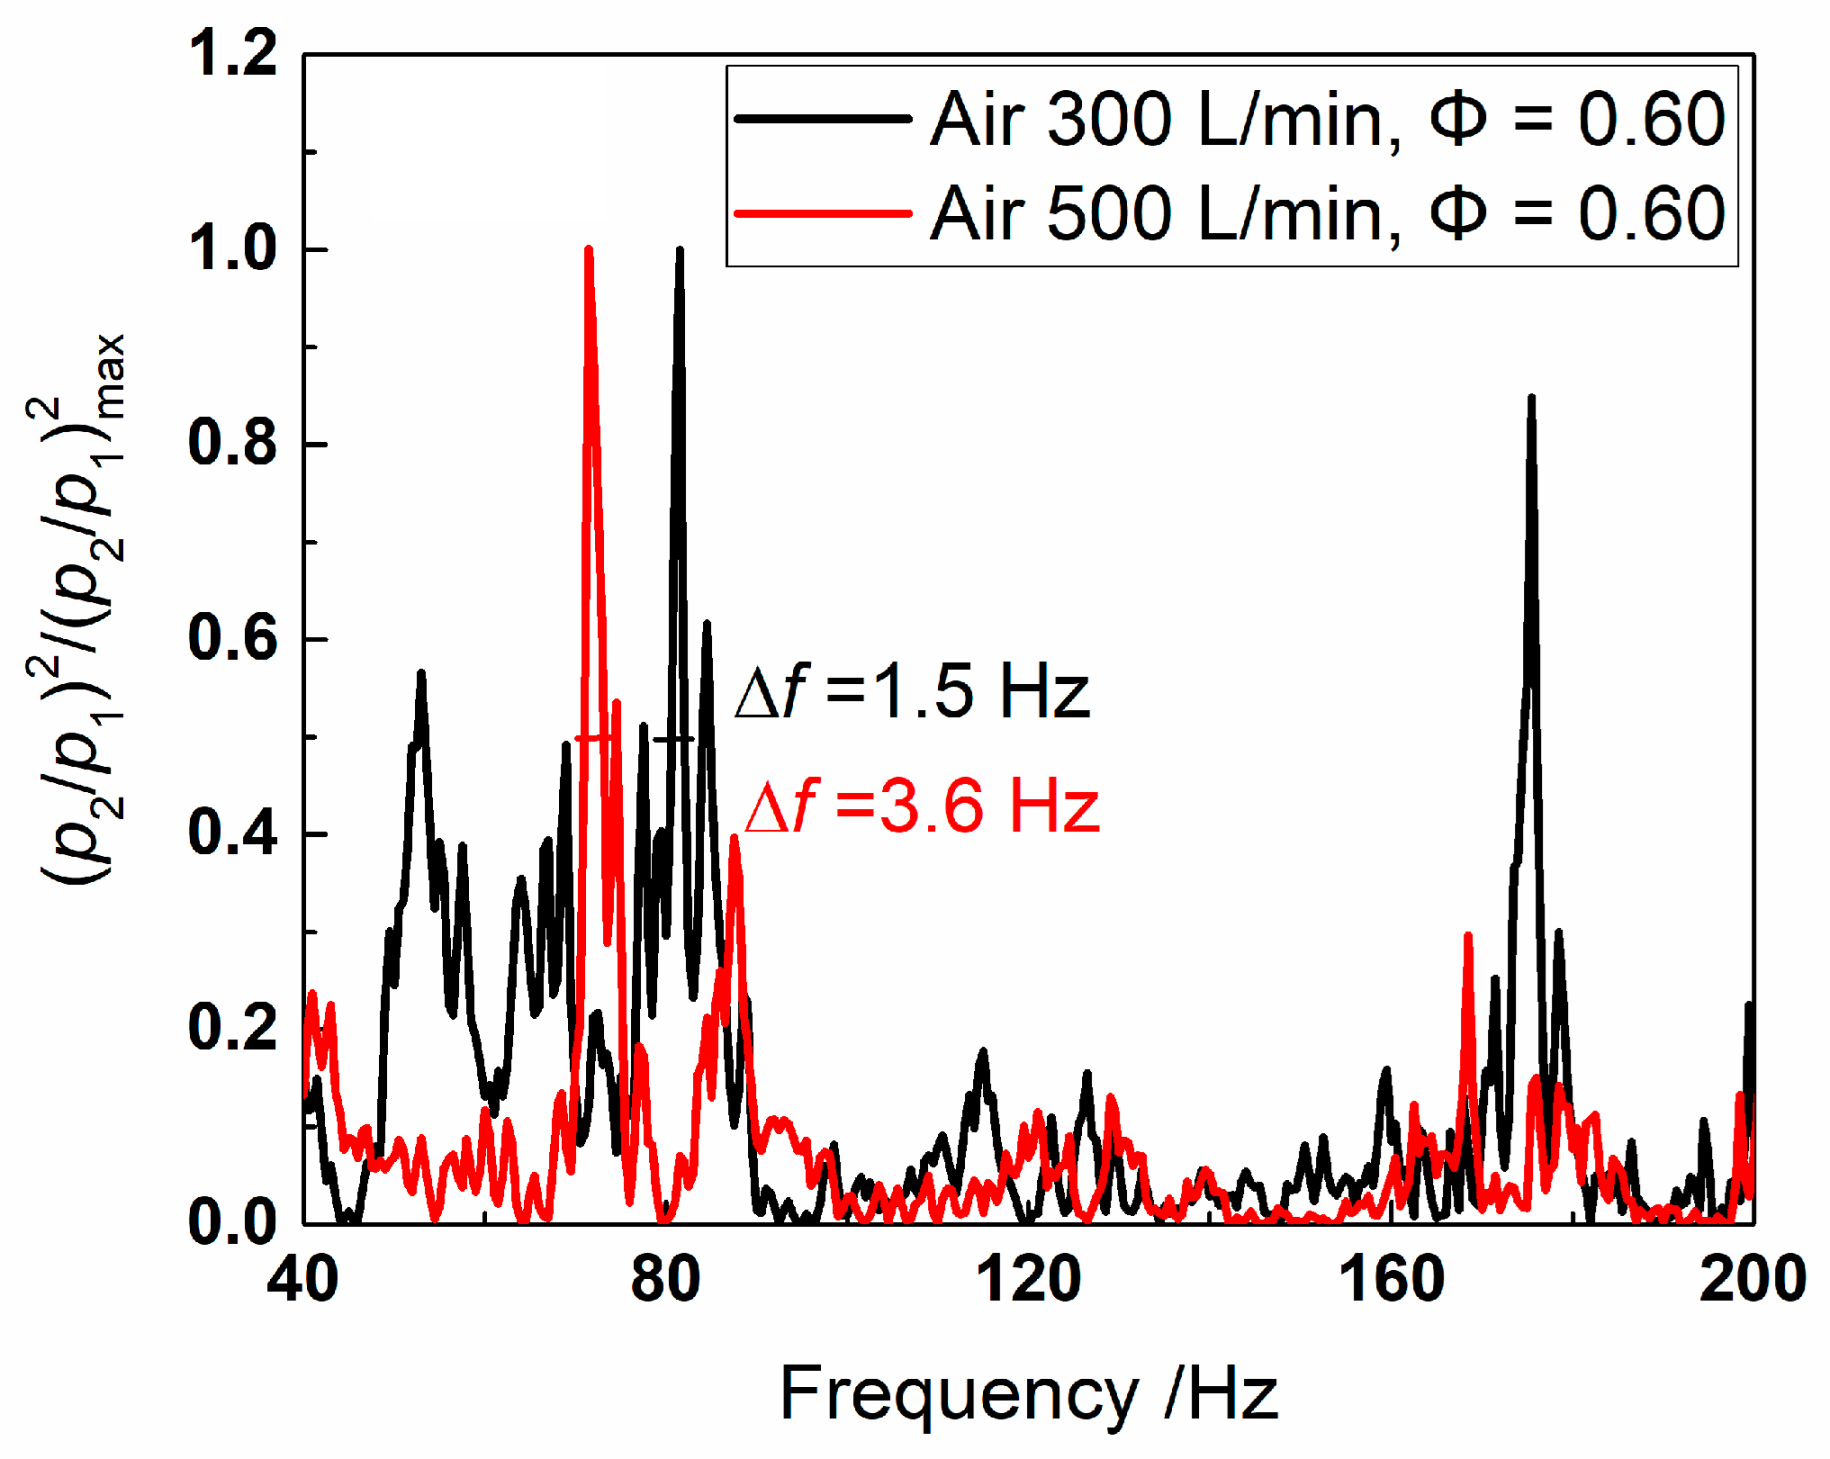
Figure 5 presents a comparison of the measured damping rates under the hot firing condition for different operating conditions. The response frequency peak is located at approximately 80 Hz under the hot condition. This frequency equals the first-order eigenfrequency of the combustion system in the hot state. The frequency response curve has additional noise caused by combustion, while the primary peak can still be distinctly identified. The measured damping rate for each condition ranges from 4.7 to 11.3 rad/s under the hot condition. The measured damping rate increases with an increase in the air flow rates. This is likely due to the higher thermal power and temperature in the combustion chamber at a higher air flow rate, which increases the dynamic viscosity and leads to a greater damping dissipation.
4.2. Interpolated Flame Describing Functions
The Helmholtz method for predicting thermoacoustic instabilities requires continuous flame describing function data, while the experimentally measured results are discrete points. Therefore, the gains and phases of the measured flame describing functions are first interpolated before being imported into the Helmholtz solver. Spline interpolations are used for data in the velocity fluctuation range of 0.059~0.59. Then, the measured data at other velocity fluctuation amplitudes are derived using linear interpolations and extrapolations. The phase results are all interpolated using a linear method.
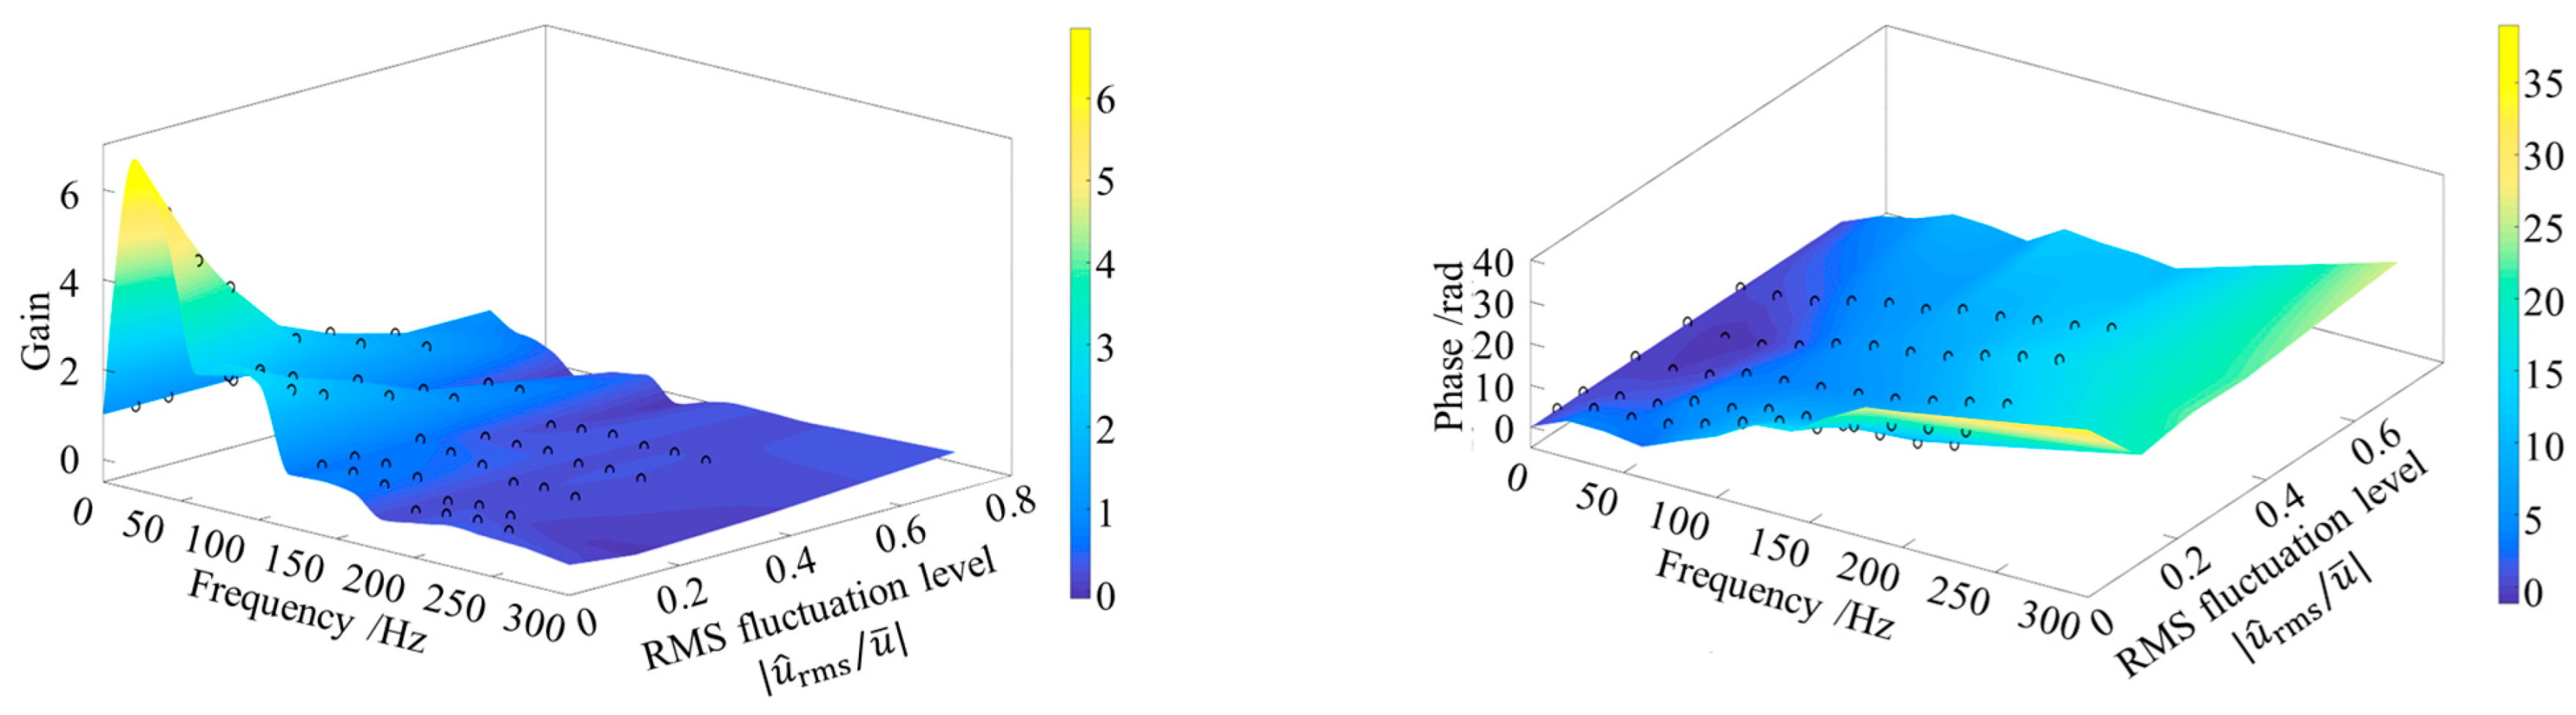
Figure 6 displays the interpolated flame describing functions of typical cases for numerical simulations, and black dots represent the experimentally measured results. As shown in
Figure 6, the gains of the flame describing functions display a bimodal distribution, whose peak frequencies are located between 50–100 Hz and 100–200 Hz, respectively. The peak values of the gains decline with an increase in the velocity fluctuation levels, indicating the nonlinear saturation of swirling flames [
34]. The phase curves are basically proportional to the frequency, which means a constant time delay between the velocity fluctuations and heat release rate fluctuations. Singularities and misplaced values are not observed in the interpolated results. The interpolated flame describing functions can be efficiently used for the Helmholtz method.
4.3. Effect of Equivalence Ratios
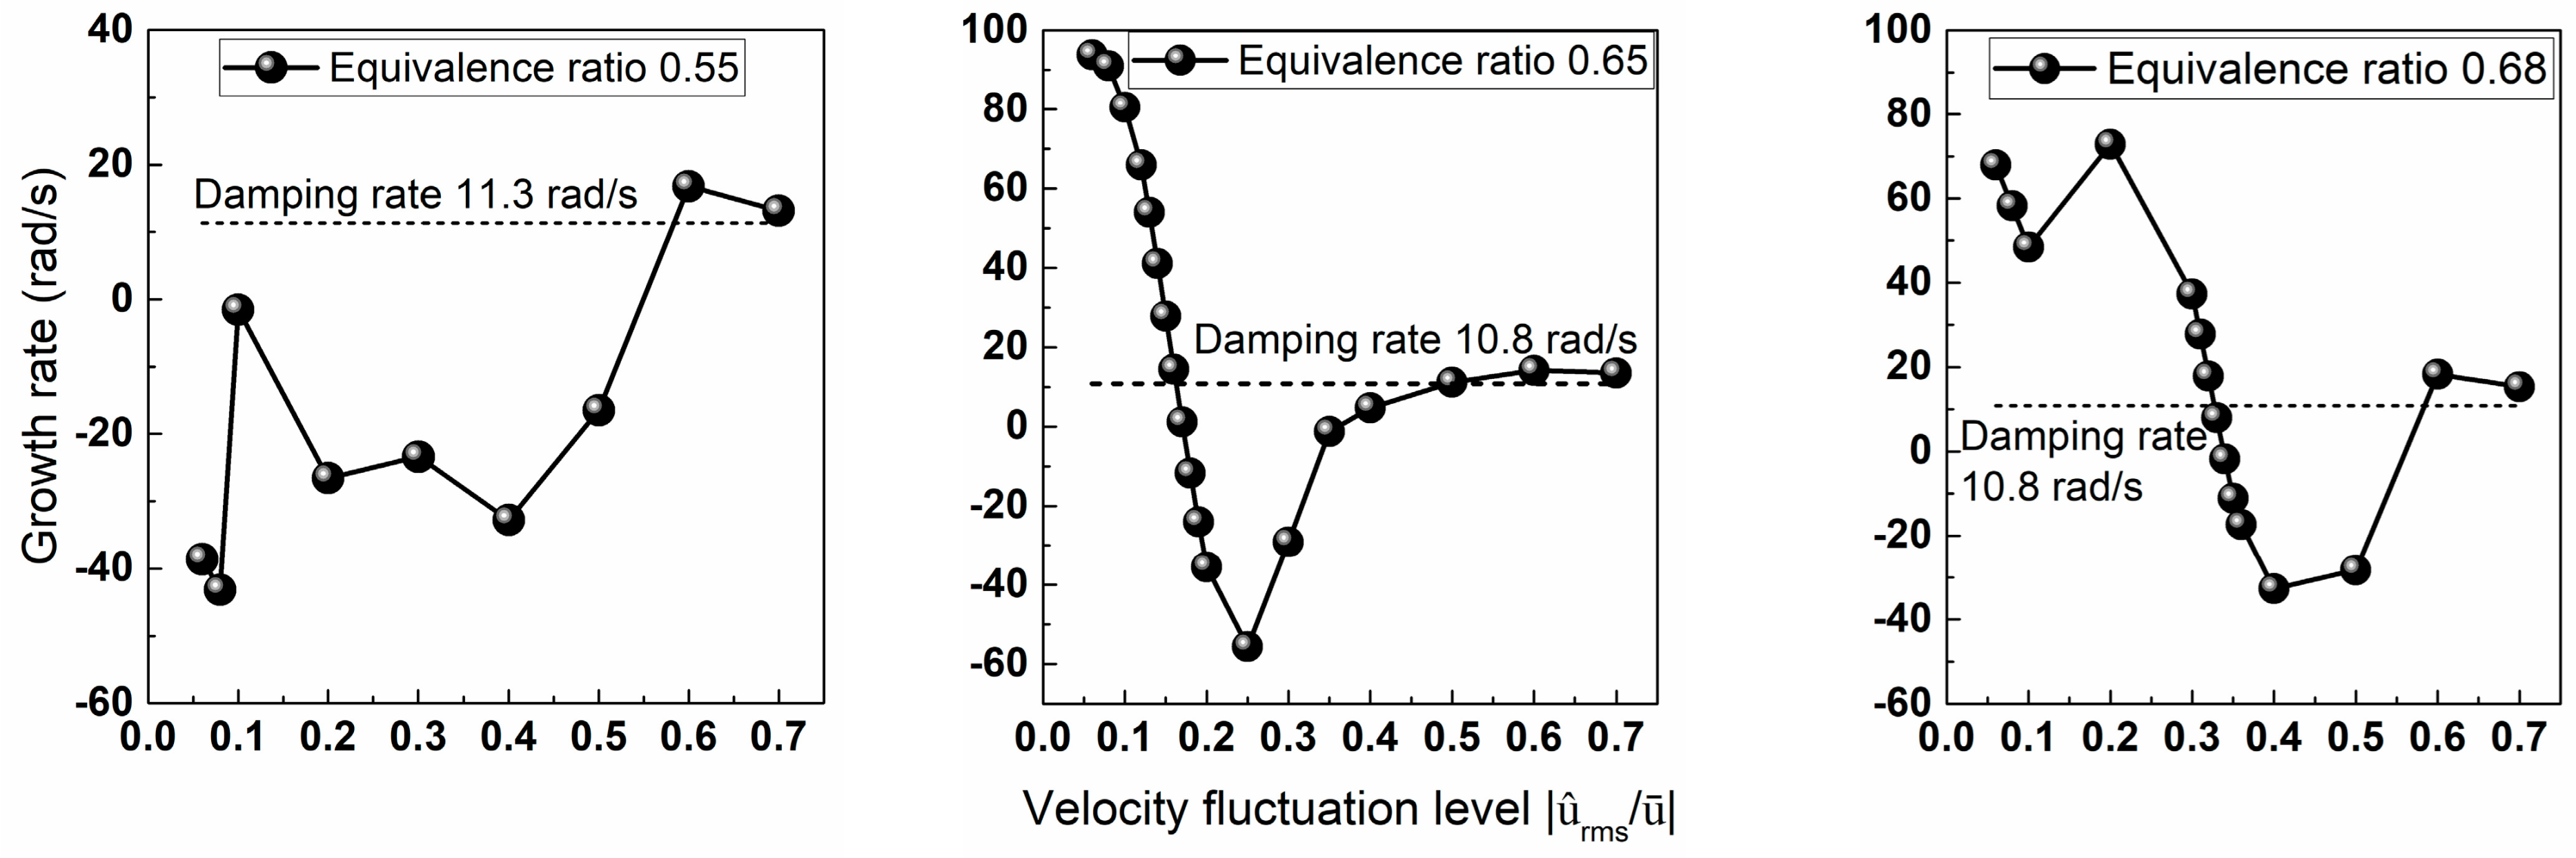
The numerically predicted eigenfrequencies, velocity fluctuation levels, and mode shapes at the limit cycle of the thermoacoustic instabilities for different equivalence ratios are compared with the experimentally measured ones. The air volume flow rate is 500 L/min in this section, and the respective equivalence ratios are 0.55, 0.65, and 0.68. When the equivalence ratio is 0.55, thermoacoustic instabilities are not observed at this air flow rate. The measured damping rates under the firing condition are 11.3, 10.8, and 10.8 rad/s for the above equivalence ratios, respectively.
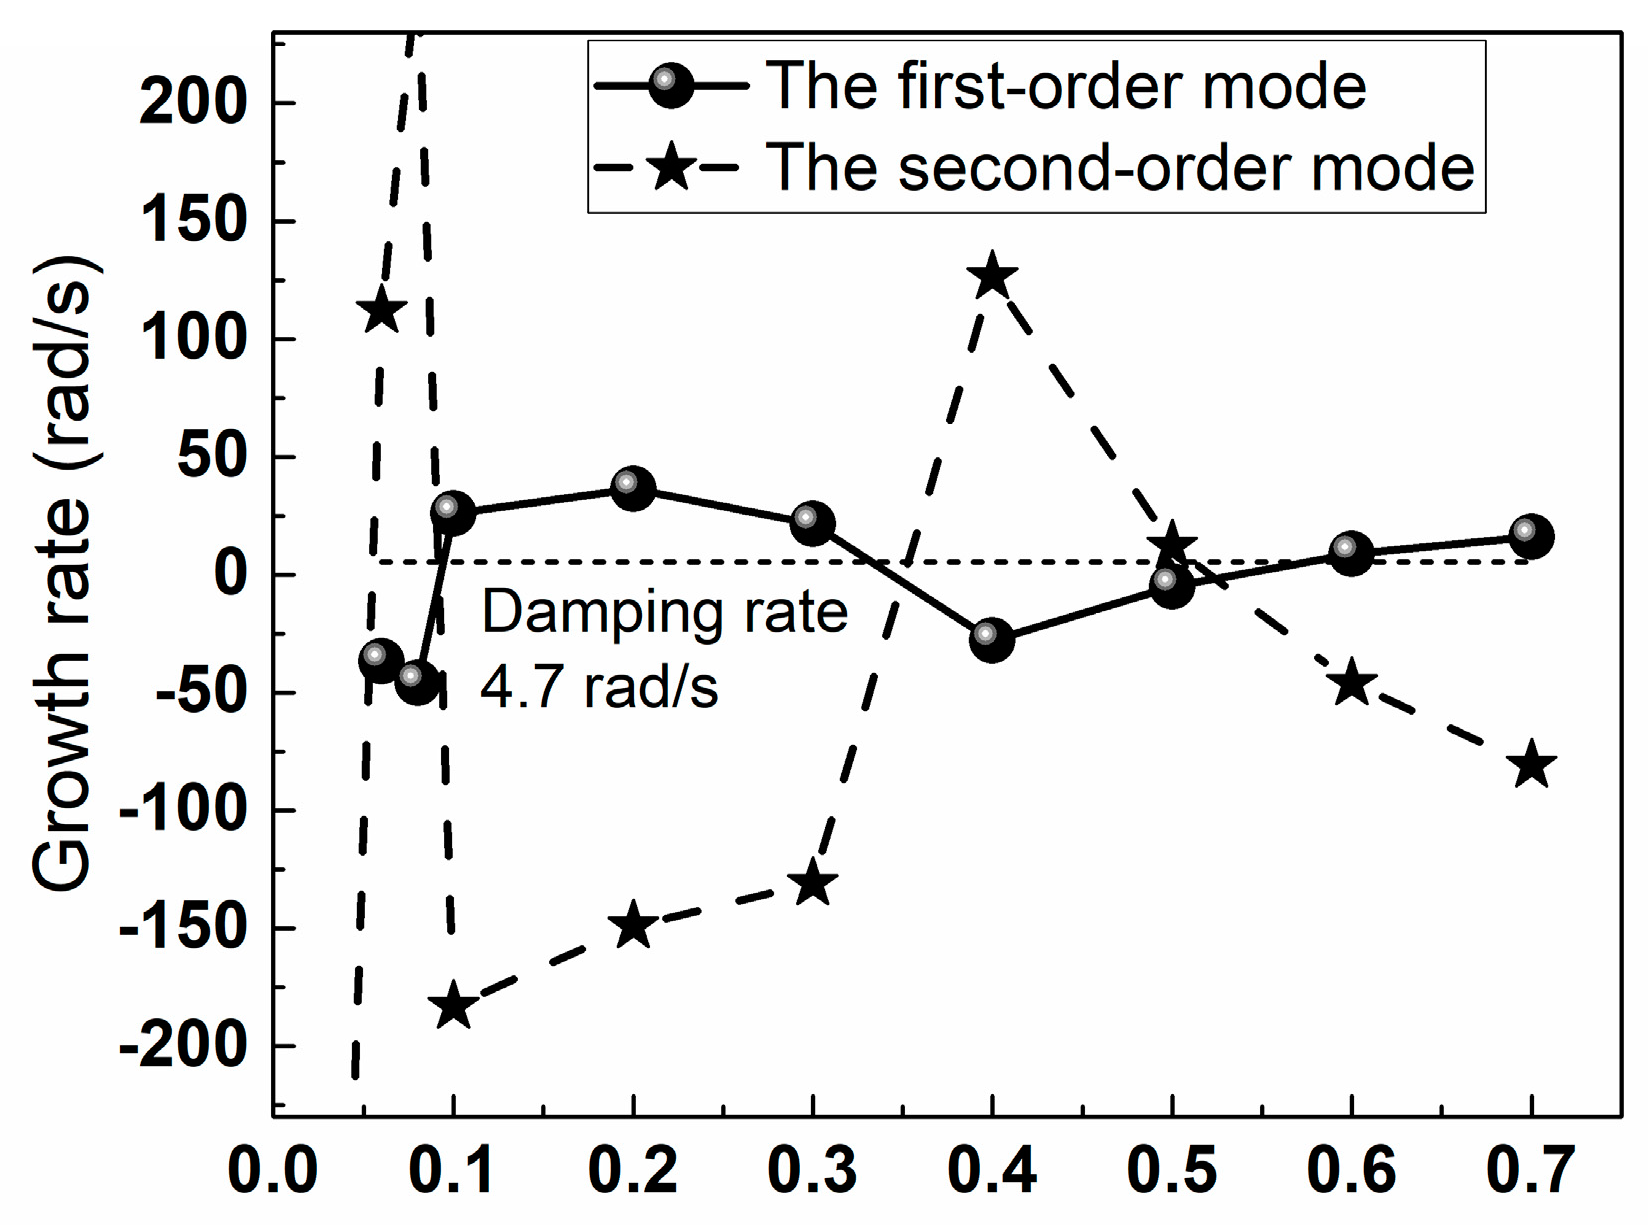
The trajectories of the numerically calculated growth rates of the first-order mode, along with the velocity fluctuation levels for different equivalence ratios, are shown in
Figure 7. The calculated growth rates are all smaller than the measured damping rates when the velocity fluctuation level is beyond 0.6 at an equivalence ratio of 0.55. The thermoacoustic oscillations in the combustor will be dissipated so that the limit cycle state is not approached, which is consistent with the fact that thermoacoustic instabilities are not observed during the experiment under this operation condition. When the equivalence ratios are 0.65 and 0.68, the numerically calculated growth rates decline from positive values across the damping rate band to negative ones and rebound after reaching the lowest values. The calculated growth rates tend to be constant at higher velocity fluctuation levels. The limit cycle state is reached when the growth rate is equal to the damping rate. Specifically, when the velocity fluctuation is greater than a certain value, the growth rate increases, which is different from the previous trend. This is due to the fact that there are two adjacent gain peaks. With an increase in the velocity fluctuation levels, the calculated frequency reduces, and the frequency points shift from the band-pass peak to the low-pass one, causing a raising growth rate. Finally, the frequency moves to the valley of the gain curves, reaching an equilibrium state.
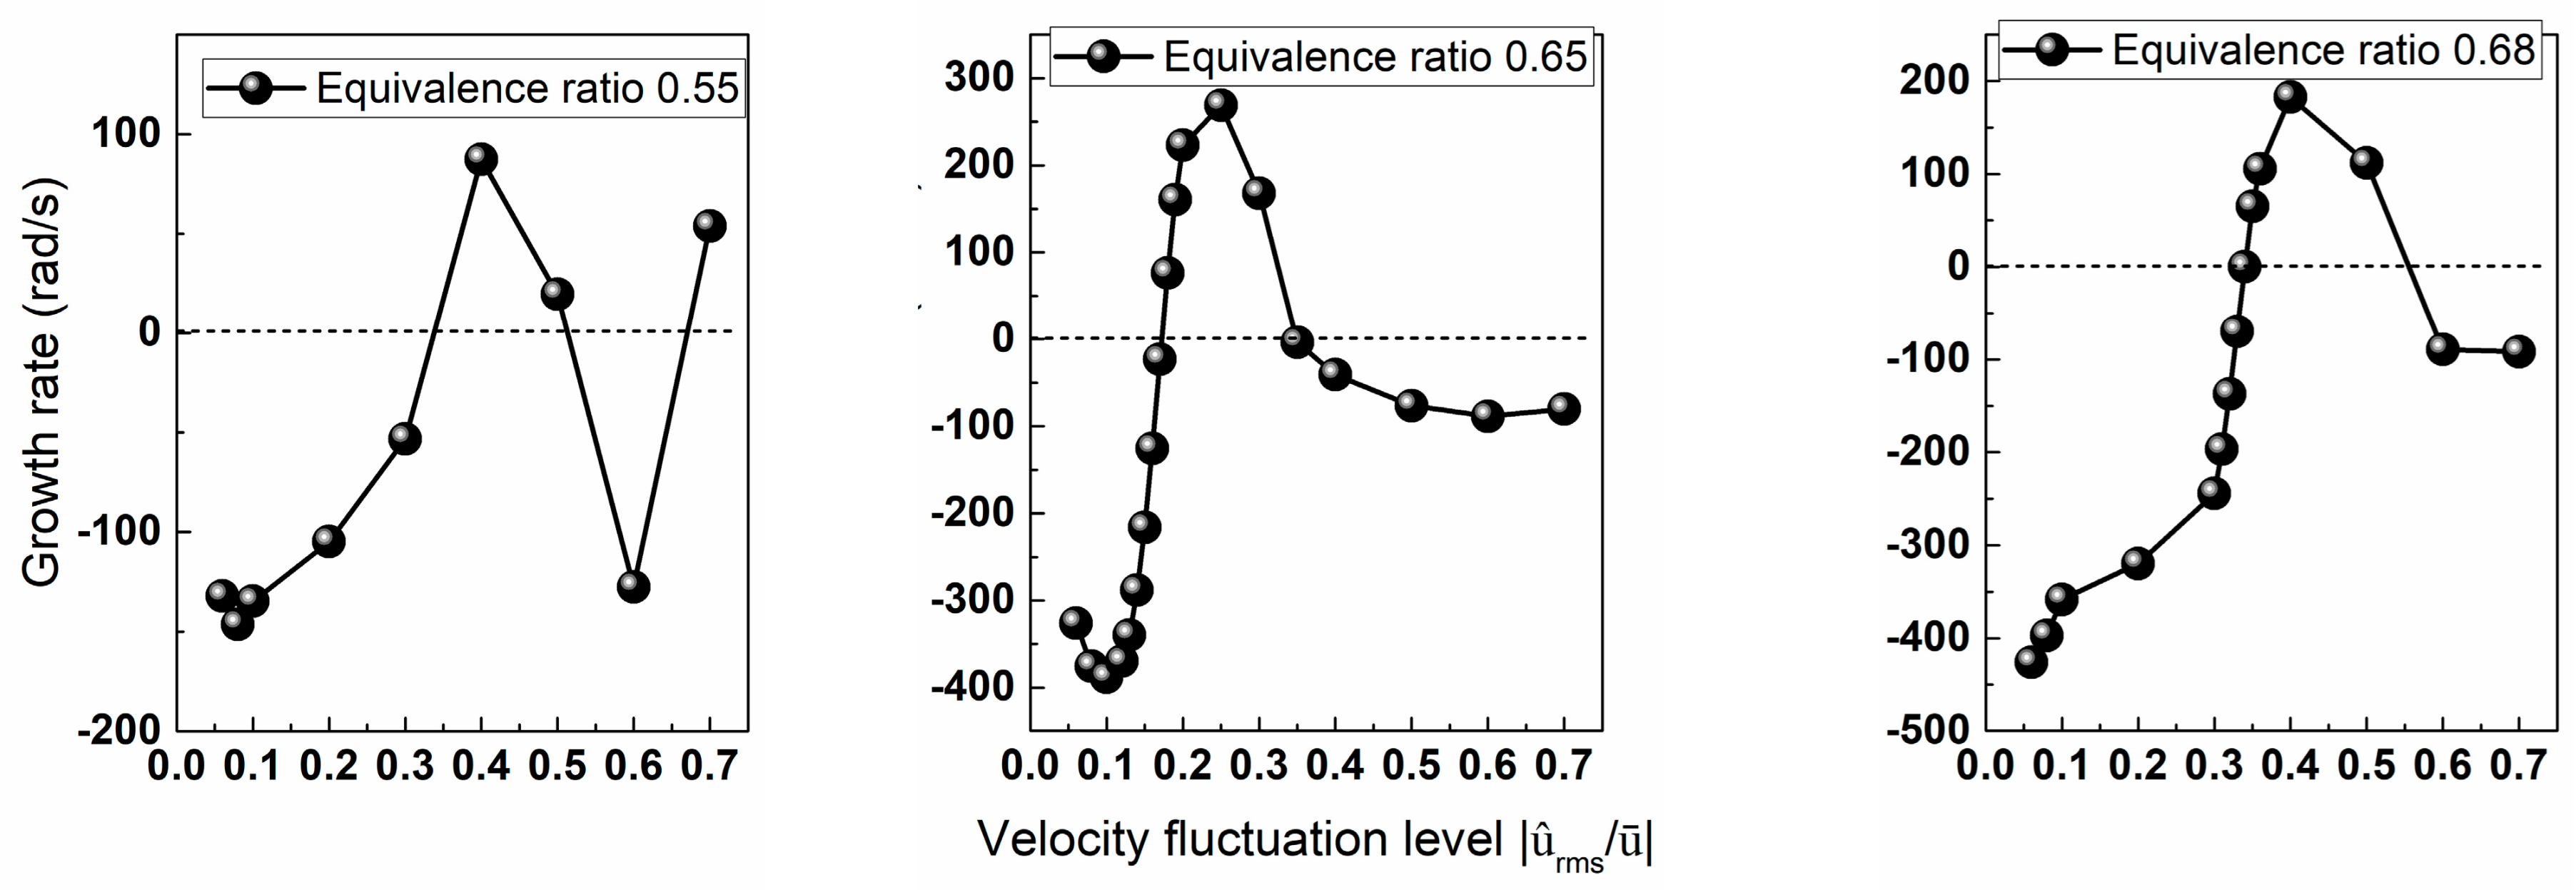
The trajectories of the simulated growth rates of the second-order mode, along with the velocity fluctuation levels for different equivalence ratios, are shown in
Figure 8. For the above equivalence ratios, with an increase in the velocity fluctuation levels, the numerically calculated growth rates increase from negative values across the damping rate band to positive ones and decline to negative values after reaching the maximum. Notably, instability is triggered by initial tiny external perturbations. These perturbations are at a low level in the initial phase. Thus, the growth rate is negative, as presented in
Figure 8, which indicates the initial oscillation will be dissipated and the limit cycle cannot be reached. Therefore, the second-order mode is attenuated by dissipations, which is consistent with the result that second-order pressure oscillations are not observed during the experiments.
Table 1 displays a comparison of the eigenfrequencies and RMS velocity fluctuation levels at the limit cycle for the experimentally measured data and numerically predicted results under different equivalence ratios. Each case is performed three times to eliminate accidental errors. When the equivalence ratio is 0.55, the numerically calculated growth rate trajectories demonstrate that self-excited instabilities cannot be formed, in accordance with the experimental results. At an equivalence ratio of 0.65, the experimentally measured and numerically predicted eigenfrequencies are 81.7 Hz and 73.4 Hz, respectively, obtaining an absolute error of 8.3 Hz. The corresponding experimentally measured and numerically predicted velocity fluctuation levels are 0.19 and 0.16, and the absolute error is 0.03. At an equivalence ratio of 0.68, the absolute errors of the predicted eigenfrequency and velocity fluctuation level are 7.4 Hz and 0.10. The minimum relative errors of the predicted frequencies are all within 10%, and the absolute errors of the predicted velocity fluctuation levels are in the range of 0.007–0.08, which indicates this prediction method has a satisfactory precision. Meanwhile, the trend in the variation in the predicted results, along with the equivalence ratio, is consistent with that of the experimental ones. While previous literature works [
18] have mostly used the linear method, which can only predict eigenfrequencies, this paper successfully predicts both the eigenfrequencies and amplitudes of self-excited oscillations. Compared with research works [
19,
22], using the non-linear model, the prediction errors for the eigenfrequencies and amplitudes have been reduced from 20% to around 10% in this work.
As the predicted results are in good agreement with the experimental ones, the mode shape of the pressure fluctuation in the combustor can be further analyzed based on the numerical results.
Figure 9 presents the axial pressure distributions of the first-order modes for two equivalence ratios. The pressure amplitude decreases in the axial direction. With respect to the first-order mode, the pressure shape maintains the highest value on the plenum side and the lowest value at the exit of the combustion chamber, indicating that the pressure shape is dominated by the cold section. For the second-order mode, the pressure pulsation maintains the highest value in the flame region and decreases at the two ends, indicating that the mode shape is dominated by the flames. The pressure amplitude distribution in the combustor is a superposition of all the order modes. As the growth rate of the second-order mode is negative, the first-order mode shape can be regarded as the actual pressure fluctuation distribution in the combustor. The numerical results indicate the pressure amplitude has the highest value on the plenum side. The experimentally measured results show that the pressure fluctuation amplitude on the plenum side is almost 300 Pa and that on the combustion chamber side it is around 100 Pa. This pressure mode distribution from the experiments is consistent with the numerically predicted one.
In the plenum, the pressure amplitude rapidly declines, while it decreases more gradually in the combustion chamber. This is due to the small diameter of the premixing tube, which suddenly expands to a larger cross-section of the flame tube. The pressure pulsation at the exit of the combustion chamber is not zero because of the radiation impedance, which causes the node of the pressure fluctuations to shift. It is observed that the pressure amplitude at the antinode is elevated at a higher equivalence ratio. This is due to the larger thermal power at a higher equivalence ratio, which leads to more significant pressure pulsations than the combustion system can maintain. As a result, the pressure amplitude is elevated at the antinode. The phase of the pressure fluctuations differs between the flame tube side and the plenum side. This means that when the pressure fluctuation increases on the flame tube side, it decreases on the plenum side.
4.4. Effects of Air Flow Rates
From the preliminary experiments, thermoacoustic instabilities only occur when the Reynolds number reaches a certain value. Therefore, it is necessary to further investigate whether the numerical method can efficiently predict the thermoacoustic instability properties at different air flow rates. A comparison of the numerically calculated and experimentally measured results is carried out at air flow rates of 300 L/min and 400 L/min with an equivalent ratio of 0.7, respectively. The experimental results indicate that thermoacoustic oscillations are not observed for all the equivalence ratios at an air flow rate of 300 L/min. When the air flow rate is 400 L/min, the oscillations present a limit cycle feature at an equivalence ratio of 0.70.
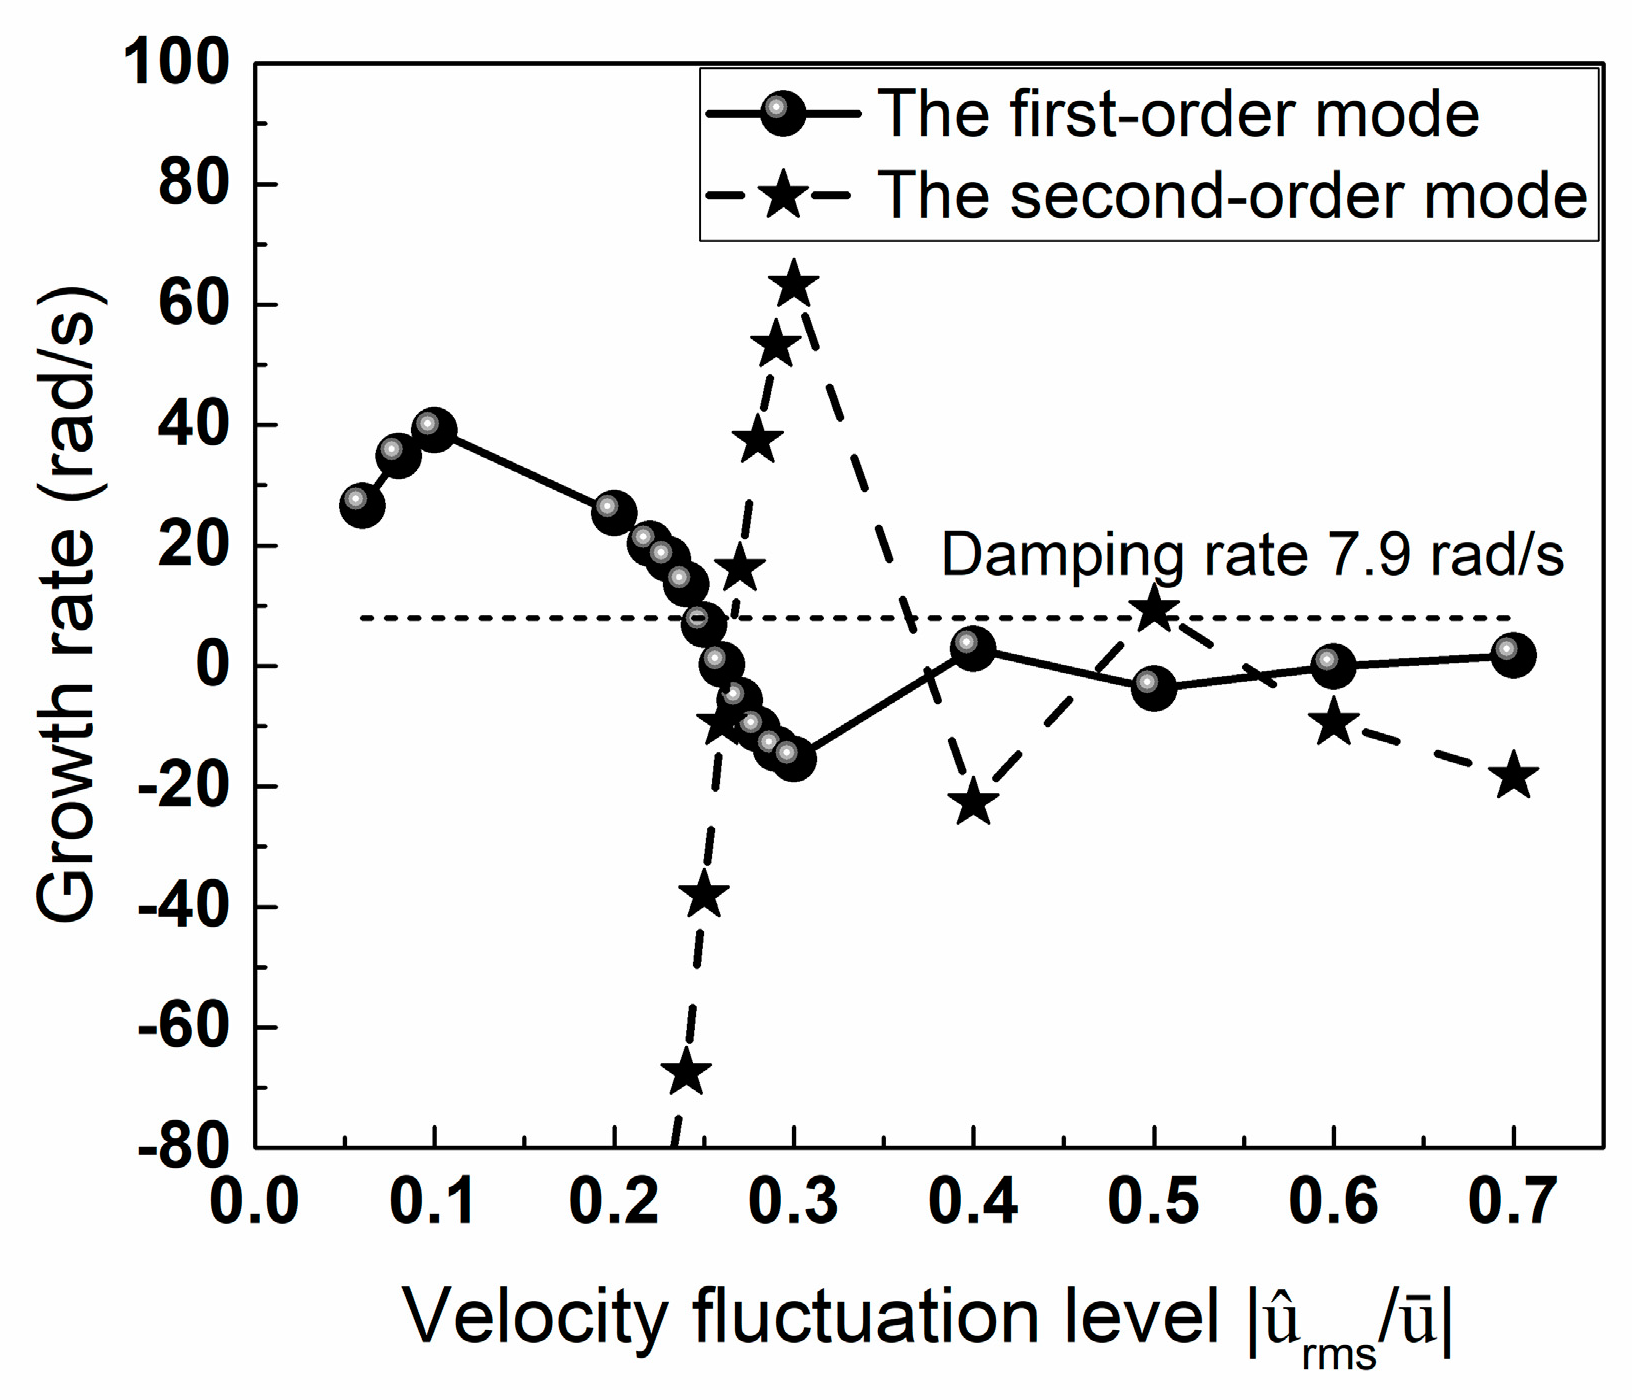
Figure 9 and
Figure 10 depict the trajectories of the calculated growth rates and eigenfrequencies of the first- and second-order modes, along with the velocity fluctuation levels, at air volume flow rates of 300 and 400 L/min and an equivalence ratio of 0.7. At an air flow rate of 300 L/min and an equivalence ratio of 0.7, the growth rates of the first- and second-order modes increase from negative values to positive ones and subsequently oscillate around the damping rate. At the initial stage, the amplitude of the fluctuations is, weak and the growth rate is less than the damping rate, which indicates the initial external perturbation will be dissipated and cannot further develop into the limit cycle. This result is consistent with the experimental phenomenon that no thermoacoustic oscillations are observed at this air flow rate.
At an air flow rate of 400 L/min and an equivalence ratio of 0.7, with an increase in the velocity fluctuation level, the numerically calculated growth rate declines from a positive value to a negative one and gradually increases after reaching the critical position, remaining at a value below the damping rate. At this equivalence ratio, pressure fluctuations can develop from the initial tiny perturbations in the limit cycle oscillation, which were detected during the self-excited experiment. Under this operating condition, the growth rate of the second-order mode changes from a negative value to a positive one, which means the second-order mode is difficult to trigger. (See
Figure 11).
Table 2 presents a comparison of the eigenfrequencies and RMS velocity fluctuation levels at the limit cycle for the experimentally measured data and numerically predicted results under different air flow rates. The numerical method can successfully predict whether thermoacoustic instabilities could occur. In the self-excited case, the absolute errors of the predicted eigenfrequencies and velocity fluctuation levels are 8.8 Hz and 0.03, respectively. Combining the flame describing functions, the measured damping rates under the firing condition, and the non-uniform distributions of the physical parameters and flames, whether self-excited thermo-acoustic instabilities occur and the corresponding parameters can be well predicted using the Helmholtz method.
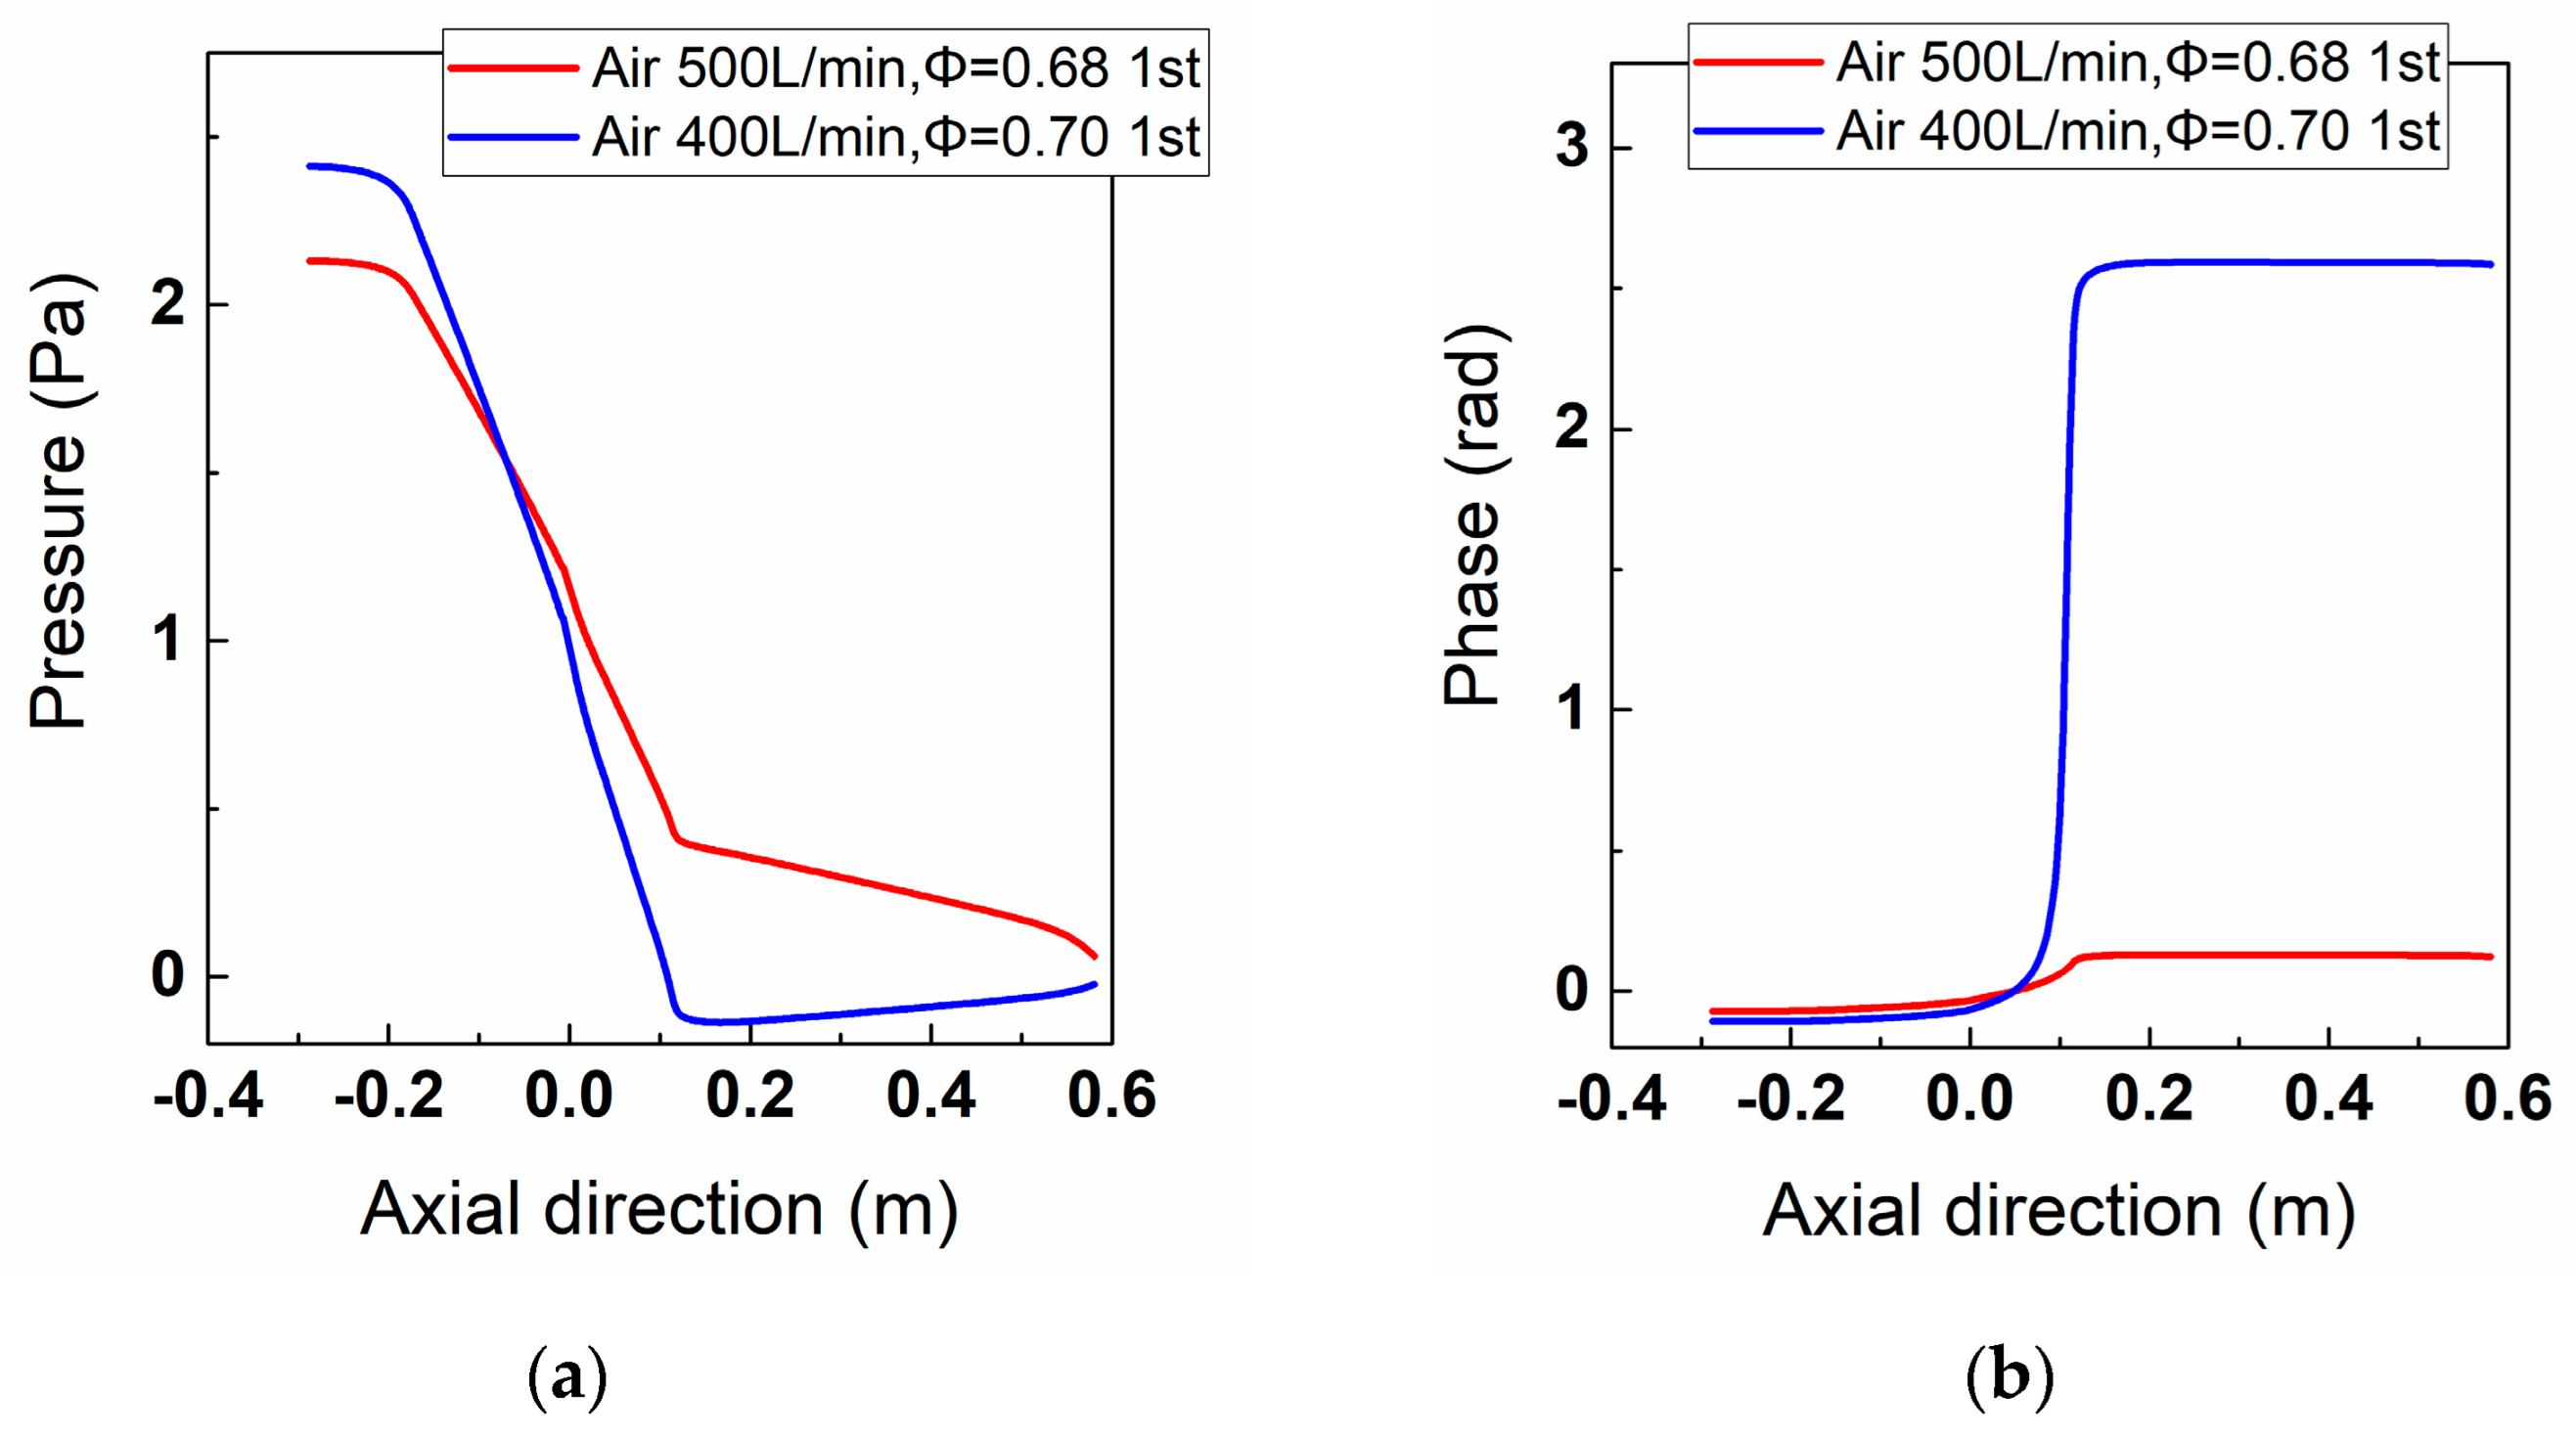
Figure 12 displays the pressure shape of the first-order mode in the axial direction for different air flow rates. It can be observed that the pressure amplitude of the first-order mode on the plenum side is larger than that on the combustion chamber side. The pressure shape distinctly shows a 1/4-wavelength mode. On the plenum side, the pressure pulsation at an air flow rate of 400 L/min is higher than that at 500 L/min. On the combustion chamber side, the pressure pulsation is lower at 400 L/min. The thermal power maintains a lower value at a lower relative air flow rate, resulting in a decreasing pressure pulsation energy. The axial distribution of the phase in the plenum is similar under these two conditions. However, the phase value on the combustion chamber side at an air flow rate of 400 L/min is significantly larger than that at 500 L/min. This discrepancy may be caused by the varying levels of flame–acoustic interactions between the two conditions. The pressure pulsation on the combustion chamber side varies more significant than that on the plenum side. The proposed numerical prediction method can efficiently capture the changes in the mode shapes at various air flow rates and with different flame morphologies.
4.5. Effect of the Length of the Combustor
If the length of the combustor is sufficient for a combustion reaction, there is a minimal impact of the length on the flame morphology. However, the thermoacoustic instability characteristics are affected by the flame pattern, which may be altered by the flame tube length. In this work, the shortest flame tube length was selected to be larger than 200 mm in order to avoid the impact of the flame tube length on the flame morphology.
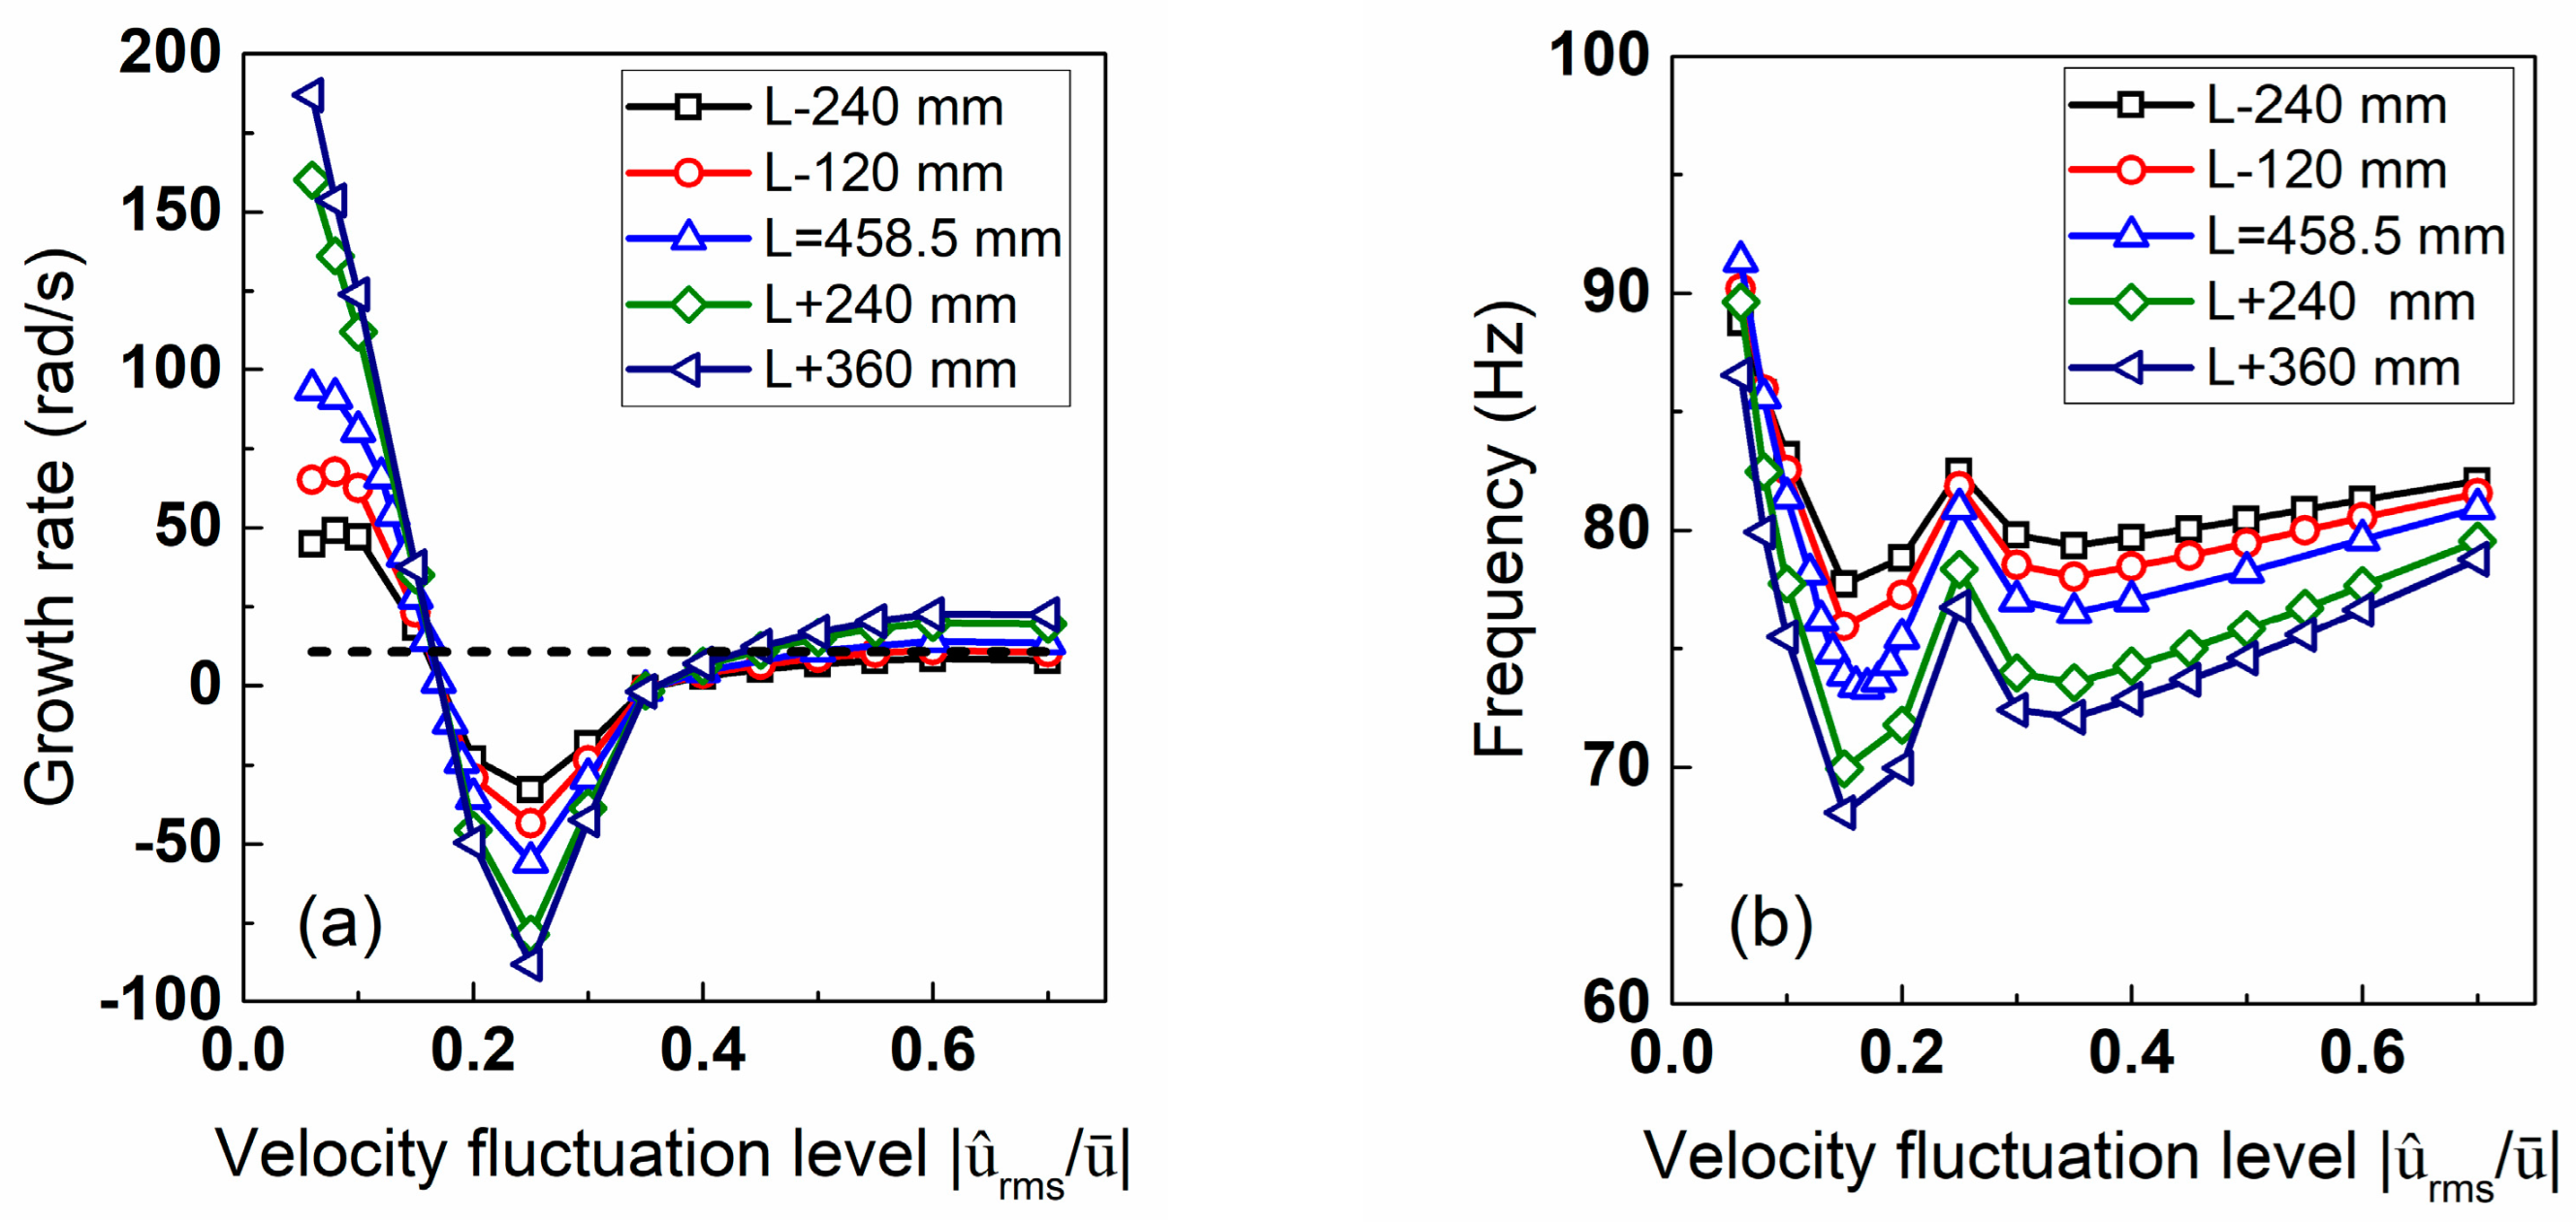
Figure 13 displays the evolution of the calculated growth rates and frequencies of the first-order modes, along with the velocity fluctuation levels, for different flame tube lengths. For the first-order mode, the growth rate maintains a higher initial value at a larger flame tube length. Additionally, the growth rate decreases more rapidly with an increase in the velocity fluctuation level. Conversely, for a shorter flame tube, the initial value of the growth rate is smaller, and the growth rate gradually declines as the velocity fluctuation level increases. The effect of the flames, serving as a sound source, on the thermoacoustic instabilities becomes more profound at a larger flame tube length since the flame is far away from the exit.
Figure 13 also shows that the frequency of the first-order mode shifts downwards as the length of the flame tube increases. The acoustic wavelength in the combustor increases with an increase in the flame tube length, resulting in a lower eigenfrequency value when the speed of sound is constant.
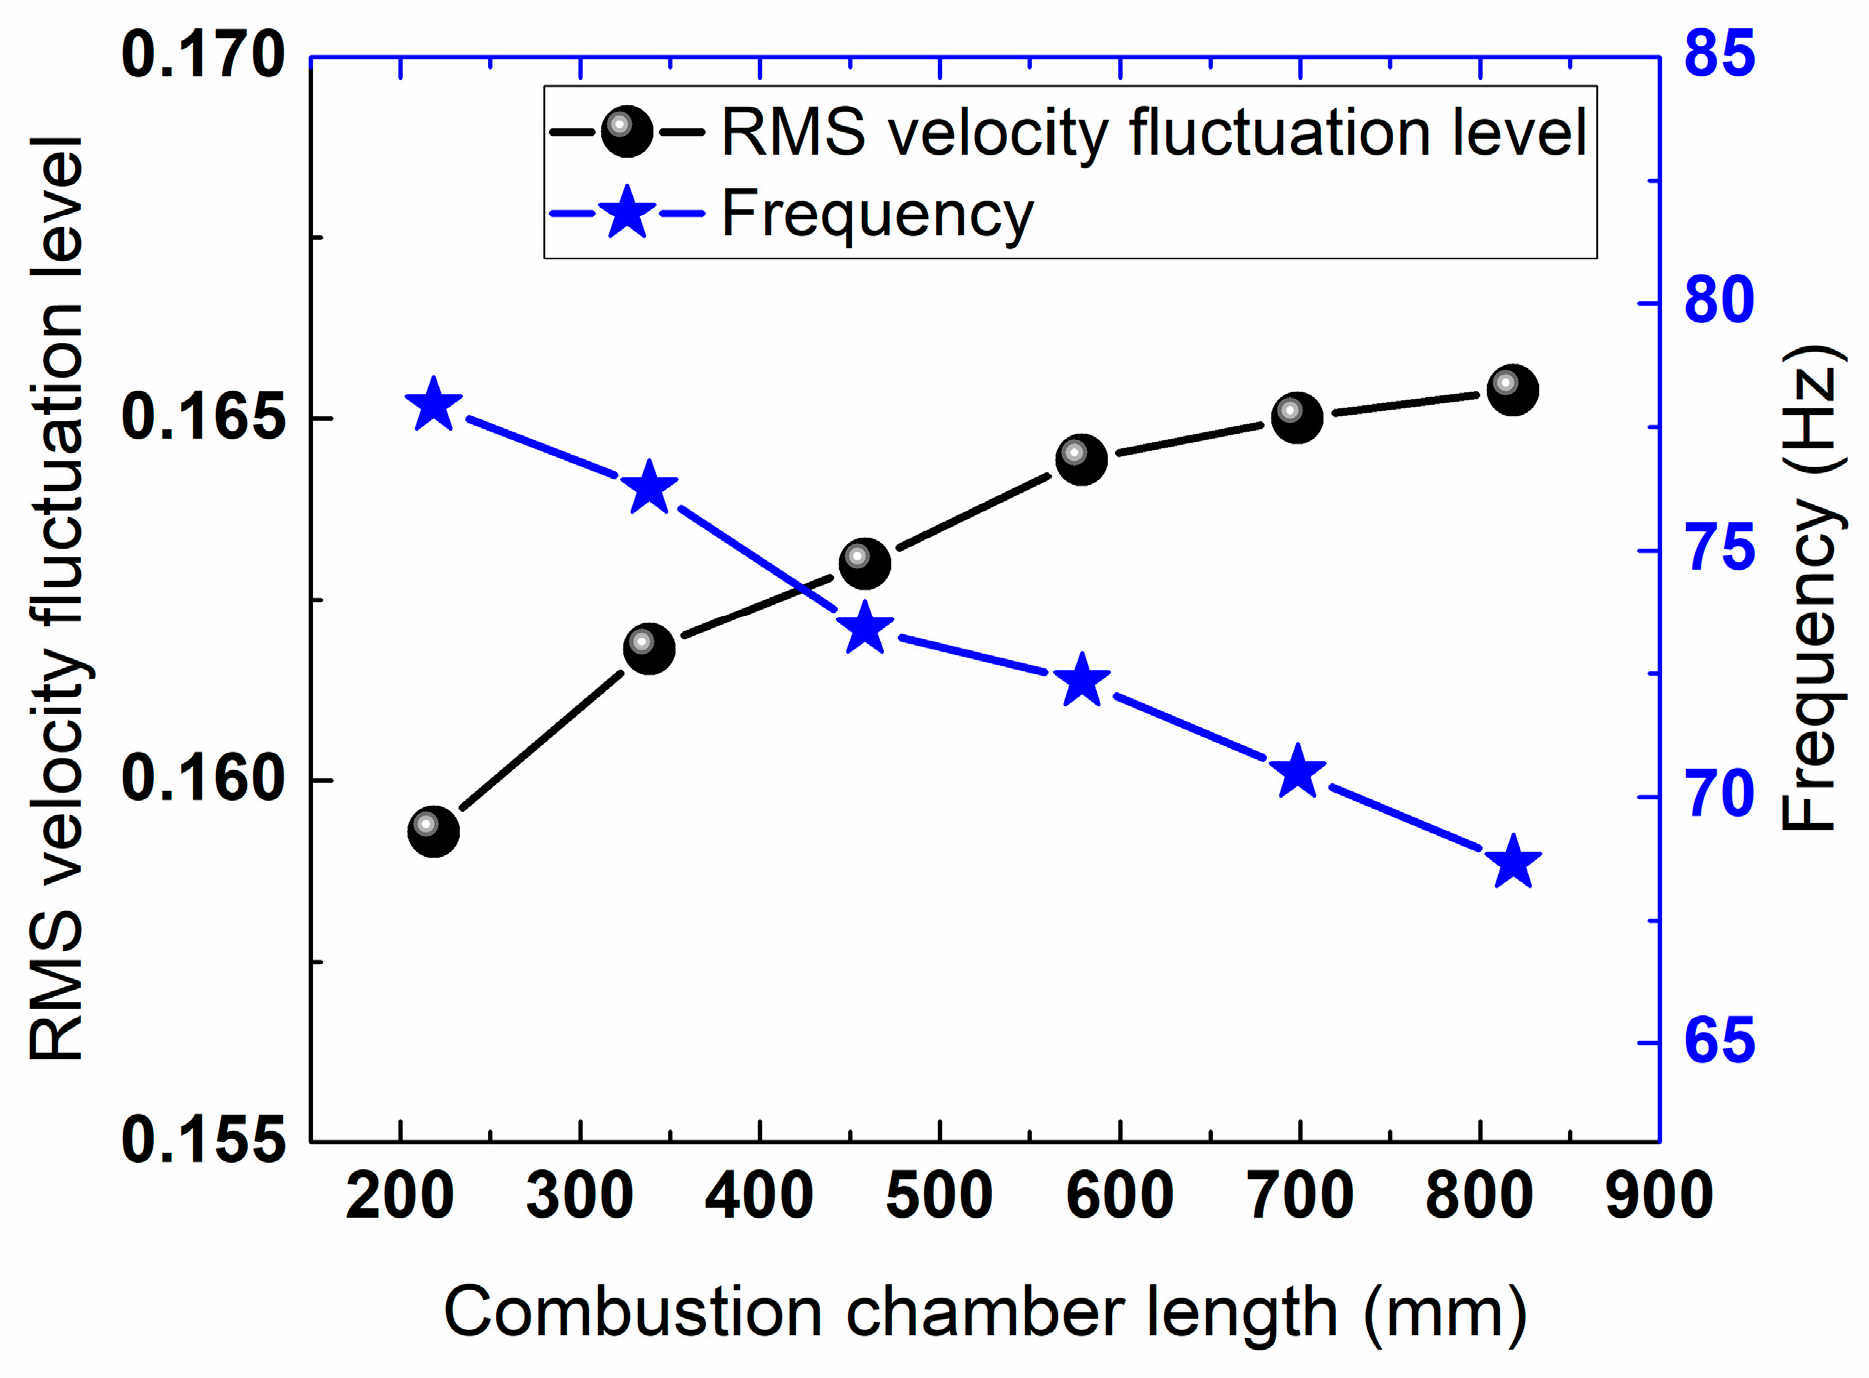
Assuming that the effect of the flame tube length on the damping rates can be neglected, the numerically calculated velocity fluctuation levels and the eigenfrequencies for different flame tube lengths are shown in
Figure 14. As the flame tube length increases, the velocity fluctuation level at the limit cycle increases due to the fact that the reference point is further away from the exit of the combustion chamber, which is the node of the acoustic wave. The flame serving as an acoustic source is more favorable for the pulsation when it is further away from the wave node. However, in a real situation, the longer the flame tube length, the greater the acoustic damping rate of the combustion system; thus, the velocity fluctuation level decreases. It can be asserted that thermoacoustic instabilities are unlikely to occur when the combustion chamber length is short since the growth rate is not large enough at a short flame tube length. Under a real condition, the fluctuation level of the thermoacoustic instabilities will first increase and then decrease with an increase in the flame tube length because of the increasing damping rate caused by the longer flame tube. Eventually, the thermoacoustic instabilities will be suppressed when the flame tube reaches a certain length.
Previous studies [
21] have reported that thermoacoustic instabilities can only occur within a specific flame tube length range. Both excessively long and short flame tubes are unlikely to trigger thermoacoustic instabilities. The numerically predicted results are consistent with the experimental ones. The numerical results indicate that the eigenfrequencies decline as the length of the flame tube increases. In this combustor, which shows a 1/4-wavelength pressure mode, the acoustic wavelength increases as the flame tube length increases. According to the frequency formula, at the constant speed of sound, a longer flame tube may cause higher-eigenfrequency pressure fluctuations.
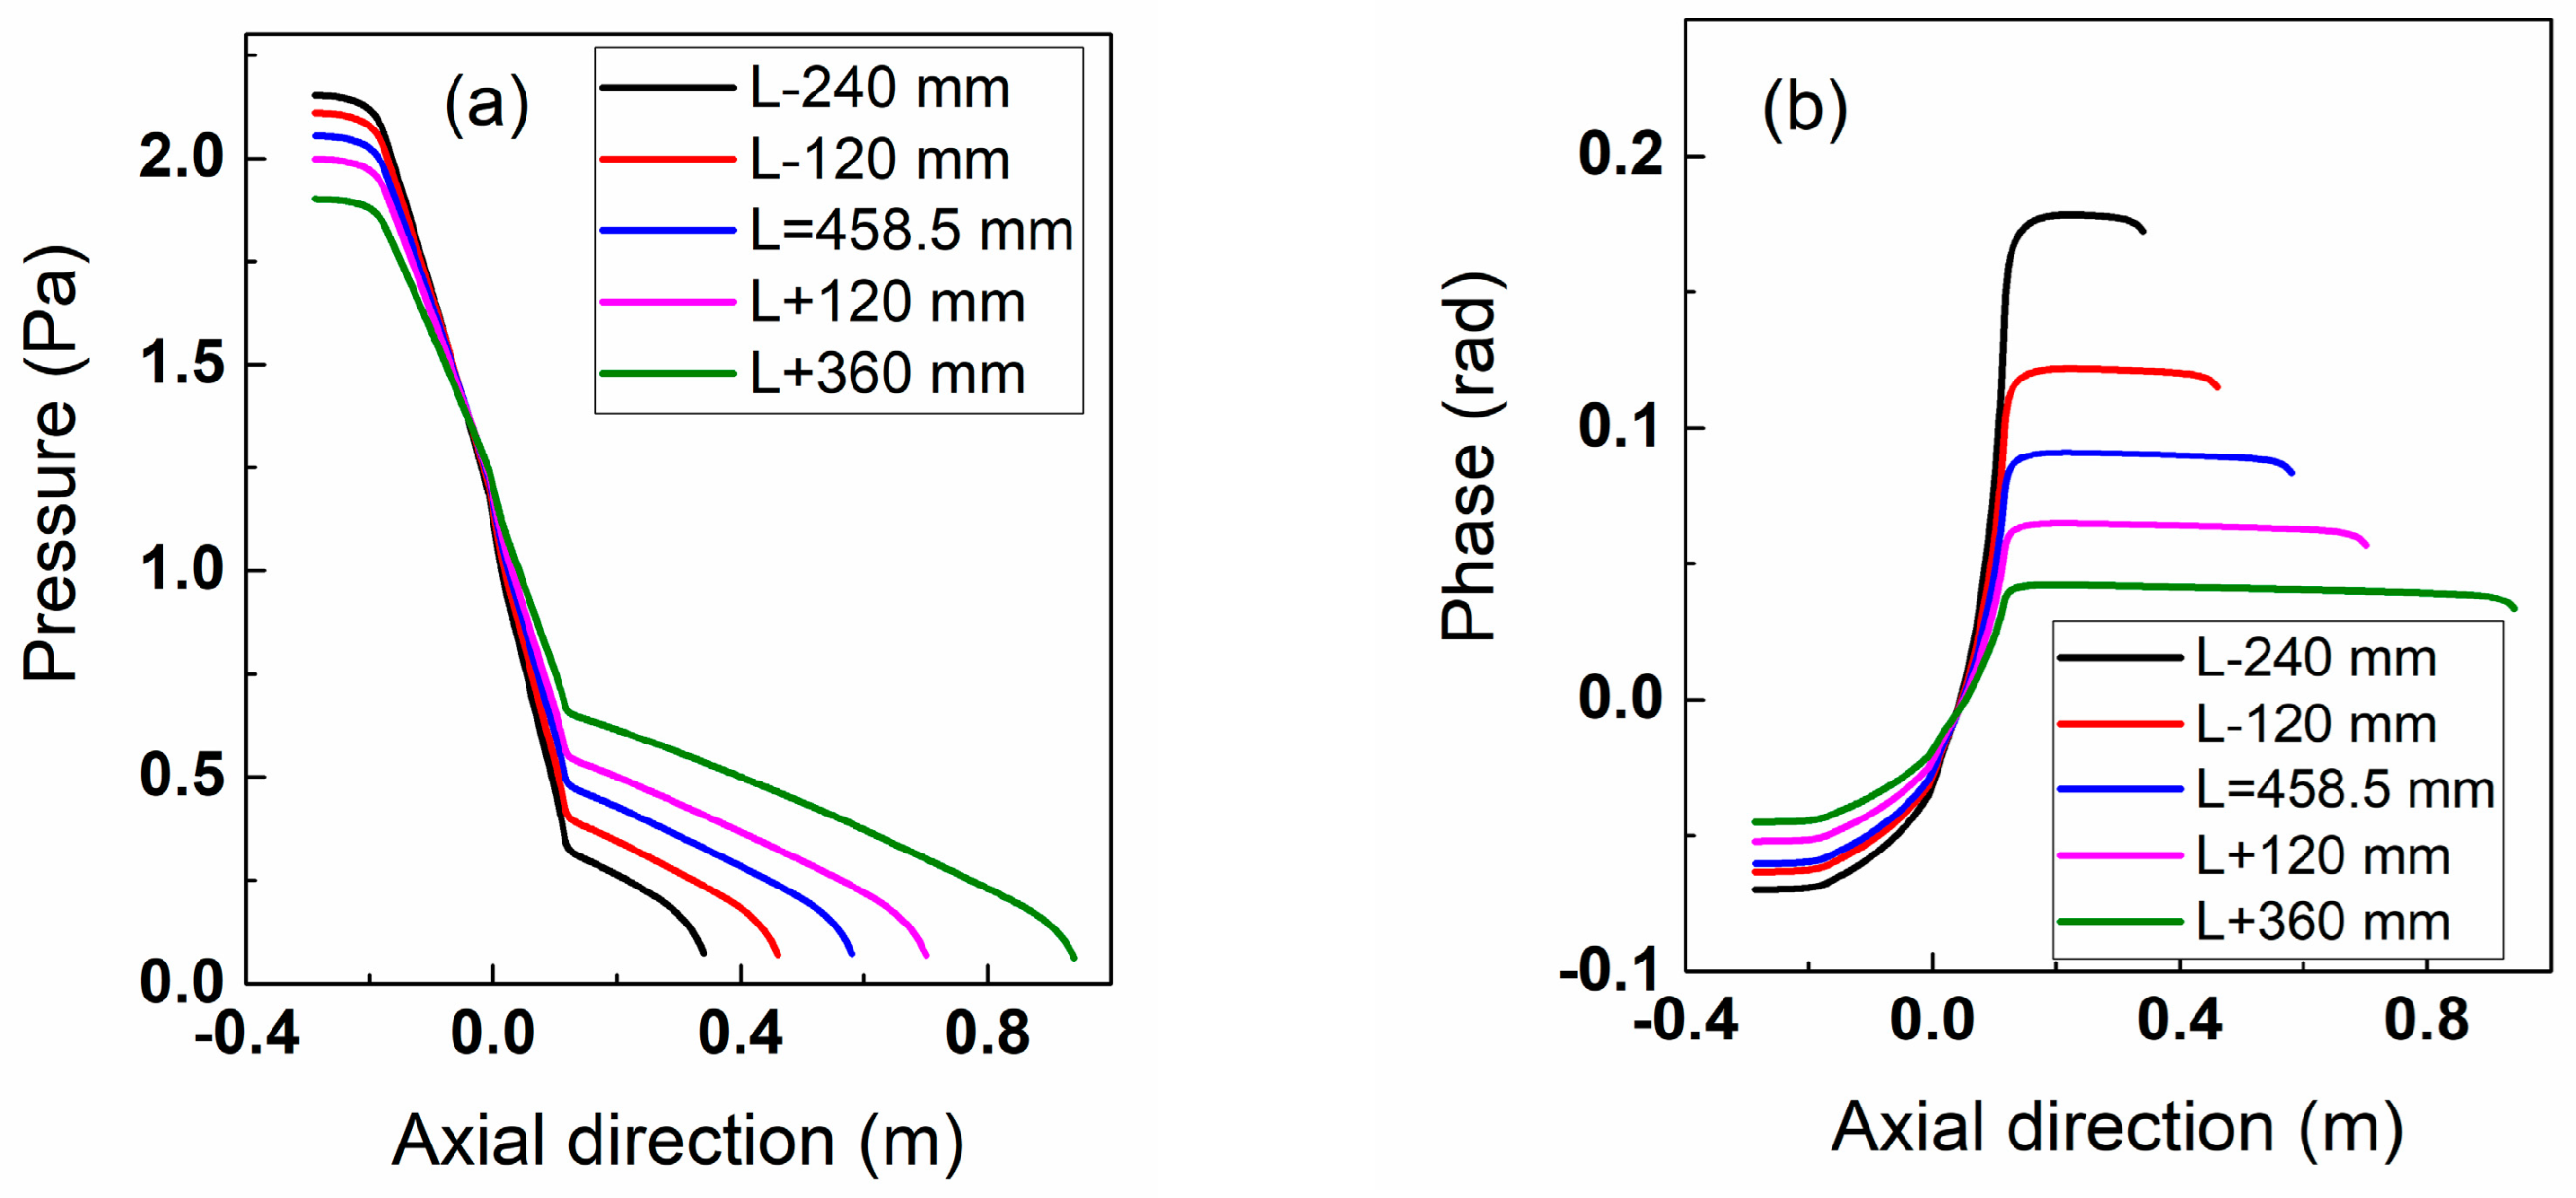
The impact of the flame tube length on the mode distributions of the first-order modes is further analyzed.
Figure 15 shows the corresponding impact on the axial pressure distribution of the first-order modes. It is evident that a shorter flame tube results in a shorter 1/4-wavelength distribution, leading to a higher amplitude at the pressure antinode. Conversely, a longer flame tube results in a more gradual 1/4-wavelength distribution.
As the length of the flame tube increases, the flame, serving as a sound source, is necessary to drive more fluid particles. Therefore, each fluid particle is allocated less kinetic energy, resulting in weaker pressure fluctuations. Additionally, as the flame tube length increases, the value of the phases in the flame tube decreases. The results indicate that the difference between the pressure on the flame tube side and that on the plenum side is reduced.
5. Conclusions
The Helmholtz method, combining the measured flame describing functions, the measured damping rates under the hot condition, and the non-uniform spatial distribution of the physical parameters, is developed to predict the self-excited thermoacoustic oscillation in a swirled premixed gas turbine combustor. The predicted results are compared in detail with the experimental ones. The acoustic damping rates under the hot condition are compared with those in the cold state. The effect of the equivalence ratios, air flow rates, and flame tube lengths on the thermoacoustic instabilities is investigated.
The response curve of the damping rate exhibits a peak frequency near 455 Hz under the cold condition, while the peak frequency shifts to around 80 Hz under the firing condition. The damping rates decline in thermal states due to the flames’ amplification of the propagation of the acoustic waves.
The eigenfrequencies, fluctuation levels, and pressure mode shapes of the self-excited thermoacoustic instabilities at various equivalence ratios and air flow rates can be accurately calculated using the developed Helmholtz method. The predicted eigenfrequencies and fluctuation levels have relative errors of less than 10%. The predicted results indicate that the pressure amplitude decreases in the axial direction. At a higher equivalence ratio, the mode shape in the axial direction becomes steeper due to the increased pulsation energy after enhancing the thermal power. The pressure fluctuation level at the antinode is accordingly enhanced. Regarding the phase, as the air flow rate increases, the axial distribution of the phase on the plenum side remains unchanged, while that on the combustion chamber side decreases, caused by the acoustic transmission characteristics across flames.
The velocity fluctuation level increases as the length of the flame tube increases at a constant damping rate. In fact, when the length of the flame tube increases, the damping rates accordingly increase, resulting in the fact that the fluctuation levels first increase and then decrease. Additionally, the eigenfrequency decreases as the flame tube length increases. The axial pressure shape becomes smoother for a longer flame tube because more fluid particles need to be mobilized. As the flame tube length increases, the difference between the pressure on the flame tube side and that on the plenum side is reduced.
The proposed prediction scheme for thermoacoustic instabilities can be effectively utilized to evaluate the stability of combustors in the design stage, resulting in decreased experimental costs. The corresponding geometrical parameters can be optimized based on a numerical prediction method. Additionally, the predicted results can be employed to determine the optimal parameters and installation locations for external thermoacoustic suppression devices.


