Article

Numerical Study of the Thermal and Hydraulic Characteristics of Plate-Fin Heat Sinks

by
Olga V. Soloveva
1,*,
Sergei A. Solovev
2 and
Rozalina Z. Shakurova
1
1
Institute of Heat Power Engineering, Kazan State Power Engineering University, 420066 Kazan, Russia
2
Institute of Digital Technologies and Economics, Kazan State Power Engineering University, 420066 Kazan, Russia
*
Author to whom correspondence should be addressed.
Processes 2024, 12(4), 744; https://doi.org/10.3390/pr12040744
Submission received: 7 March 2024 / Revised: 3 April 2024 / Accepted: 3 April 2024 / Published: 6 April 2024
(This article belongs to the Section Manufacturing Processes and Systems)

Abstract

:
One of the main trends in the development of the modern electronics industry is the miniaturization of electronic devices and components. Miniature electronic devices require compact cooling systems that can dissipate large amounts of heat in a small space. Researchers are exploring ways to improve the design of the heat sink of the cooling system in such a way that it increases the heat flow while at the same time reducing the size of the heat sink. Researchers have previously proposed different designs for heat sinks with altered fin shapes, perforations, and configurations. However, this approach to optimizing the design of the heat sink results in an increase in the labor intensity of its production. Our goal is to optimize the heat sink design to reduce its size, reduce metal consumption, and increase heat flow. This goal is achieved by changing the number of fins and the distance between them. In this case, there is no significant difference in the geometry of a conventional plate-fin heat sink, and a low labor intensity of production is ensured. A numerical investigation of heat flow and pressure drop in models of plate-fin heat sinks of various sizes and metal volumes was conducted using the ANSYS Fluent software package (v. 19.2) and computational fluid dynamics employing the control volume method. We used the SST k-ω turbulence model for the calculations. The research results showed that by changing the number of fins and the distance between them, it is possible to increase the heat flow from the heat sink to 24.44%, reduce its metal consumption to 6.95%, and reduce its size to 30%. The results of this study may be useful to manufacturers of cooling systems who seek to achieve a balance between the compactness of the heat sink and its ability to remove large amounts of heat.

1. Introduction

Cooling systems are an integral component of electronic devices and systems, ensuring protection against overheating and malfunction. Traditional cooling methods include natural convection [1], air cooling with a fan, microjet cooling [2], and liquid cooling using refrigerants and nanofluids [3]. Air cooling is a common solution due to its simplicity and reliability, which ensures the fast, uninterrupted, and safe operation of microelectronics [4,5,6]. One of the primary components of a cooling system is the heat sink, whose design has a significant impact on the cooling rate [7,8]. The heat sink traditionally has a plate or needle design [9,10]. Heat sinks that possess a lattice [11], two-layer [12], cone-column [13], and microchannel [14,15] structure are less prevalent. Porous materials [16] have great potential and, due to their developed surface area and tortuous current paths, have high thermal characteristics. They are already used in various industries as catalysts [17,18], filters [19], and thermal insulation [20,21]. The main limitation of the use of porous media in electronic cooling systems today is their high cost. The most common type is the plate-fin heat sink design. Such heat sinks are widely used, for example, in cooling systems for personal computer components. However, as electronic technology advances, the size of electronic devices is decreasing, and heat generation is increasing. Experts in the field are conducting research to improve the design of heat sinks in order to reduce their size and increase heat transfer. Researchers have conducted studies on changing the geometry of the fins, positioning them at an angle, perforating them, and changing their configuration. These studies will be discussed in more detail below.
Changing the fin geometry is one of the main directions in improving the design of the heat sink: it is known to use round fins, serrated pin fins [22], spiral fins [23], and corrugated herringbone fins [24]. In [25], the authors proposed a heat sink design with conical fins. The authors conducted an investigation into the impact of the taper angle (1°, 2°, or 3°) on the heat transfer coefficient. The highest values of the heat transfer coefficient (5.38–12.96 W/(m2K)) were observed in a heat sink with a fin cone angle of 2°, while the lowest values (2–7 W/(m2K)) were observed in a heat sink with a cone angle of 3°, which is caused by the stagnation of the fin’s base. Yan et al. [26] proposed a novel pin fin design, consisting of a cylindrical structure with two ribs located on its sides. The numerical analysis of the heat sink characteristics has demonstrated that pin fins equipped with ribs exhibit a higher average Nusselt number value (Nu = 42.5 at Re = 1200) in comparison to pin fins without ribs (Nu = 32.5 at Re = 1200). Nonetheless, fins with ribs also demonstrate higher pressure drop values because the ribs change the flow separation point, the flow velocity between the cylinders, and the size of the vortices behind the cylinders. Sun et al. [27] conducted a study on the thermal characteristics of heat sinks with a fixed surface area and varying fin geometries, including arc-shaped, diamond-shaped, and rectangular fins. The research results showed that heat sinks with arcuate and diamond-shaped fins provide 111.2% and 94.8% higher Nusselt numbers (at Re = 800) than heat sinks with rectangular fins. The Darcy friction coefficient is also higher for fins with arcuate and diamond-shaped geometries than for fins with rectangular geometry, by 171% and 142%, respectively. Consequently, the heat sink with arcuate fins demonstrated the highest values of the performance evaluation criteria (PEC). According to the results of a number of studies, the geometry of the fin has a significant impact on the thermal and hydraulic characteristics of the heat sink [28]. As evidenced by the results of the study [29], changing the geometry of the fins—for example, their corrugation—can result in a sharp increase in the pressure drop.
Another direction of research for optimizing heat sink design is the arrangement of fins with a slope [30]. Zhang et al. [31] proposed a heat sink design with W-type plate fins and studied the influence of the angle of inclination of the plates (30–120°), their height (35–55 mm), and the distance between them (6–14 mm) on the surface temperature of the plates. The research results indicated that there were optimal parameters for the plates at which the lowest temperature was achieved, such as the angle of inclination of the plates (45–90°) and the distance between them (8.8 and 10 mm). The rise in the fin’s height resulted in a decrease in the surface temperature.
Perforating heat sink fins improves heat transfer, which is why researchers are actively studying the influence of the number of perforations and their cross-section on the characteristics of the heat sink. Sahel et al. [32] proposed a heat sink design with perforated hemispherical fins. The authors investigated the effect of fin size and number of perforations on the values of pressure drop and Nusselt number. The ratio of fin diameter to height (d/H) was used to regulate the fin’s dimensions. The increase in the size of the fins from d/H = 0.167 to d/H = 0.833 contributed to the increase in the Nusselt number values from 200 to 550 at Re = 21367. The pressure drop increased from 50 to 400 Pa. Additionally, the perforation of the fins contributed to an increase in the Nusselt number values. Fins with six holes showed a higher value of Nusselt number (Nu = 510) in comparison to fins with five holes (Nu = 460), four holes (Nu = 450), three holes (Nu = 400), two holes (Nu = 375), and one hole (Nu = 365) at Re = 21367. Ibrahim et al. [33] redesigned a plate heat sink by adding different numbers (from 4 to 15) of square and circular perforations. The authors conducted experimental investigations into the impact of the number of perforations and their cross-section geometry on the thermal and hydraulic properties of heat sinks. The research findings have demonstrated that an increase in the number of perforations aids in enhancing the heat transfer. The perforations with a square cross-section provided a reduction in the Nusselt number by 4.6% and a reduction in the friction coefficient by 5.9% compared to perforations with a circular cross-section.
Another well-known technique for optimizing the design of a heat sink involves bending the fins at different angles and altering the number of fins and their arrangement [34,35]. Ghadhban and Jaffal [36] investigated the properties of a multi-minichannel heat sink with straight, arc-shaped, S-shaped, and wave-shaped channels. According to the results of the research, the increase in Nusselt number reached 30.5% for wavy channels, 18.7% for S-shaped channels, and 10.8% for arcuate channels, compared with straight channels. S-shaped channels create the greatest hydraulic resistance to flow, which is expressed as high pressure drop values. The pressure drop of arc-shaped channels was reduced by 16% compared to traditional straight channels. After conducting a comprehensive evaluation of the thermal and hydraulic characteristics, the authors concluded that among the studied configurations, wavy channels are most efficient. El Ghandouri et al. [37] proposed a new curved heat sink fin design and investigated thermal performance under natural convection conditions. Curved fins made it possible to increase the heat transfer coefficient by 12.52% and reduce the weight of the heat sink by 59%. Chiu et al. [38] investigated the influence of the number of pin fins in a heat sink and their diameter on temperature uniformity. The number of fins varied from 72 to 75, with diameters ranging from 400 to 600 μm. The fins were arranged in a checkerboard, convergent, and convergent-divergent order. A heat sink with a convergent arrangement and a pin fin diameter of 600 μm provided the smallest temperature difference along the length of 1.34 K/mm. However, the same model also showed the highest thermal resistance value of 0.268 K/W. A heat sink with convergent-divergent arrangement of fins provided lower thermal resistance than one with a staggered arrangement, which is associated with a more intense mixing of flows. Hithaish et al. [39] investigated the performance of a heat sink with triangular cross-section pin fins of varying heights. The authors found that increasing the height of the fin promoted better mixing of the flow but also produced greater hydraulic resistance. Ranjbar et al. [40] investigated the effect of pin fin configuration geometry on the thermal and hydraulic properties of a heat sink. Depending on the height of the fins, their configurations were rectangular (all fins of the same height), increasing (the height of the fins increased in the flow direction), decreasing (the height of the fins decreased in the flow direction), V-shaped, and wedge-shaped. The PEC evaluation revealed that the configuration wherein the fin height decreased in the direction of flow possessed the highest performance criterion value.
According to the renowned scientific literature, the optimization of the heat sink design is achieved by altering the geometry of the fins and their configuration, or by incorporating perforations to enhance thermal characteristics (heat transfer or heat flow) and reduce the dimensions of the heat sink [41]. However, such changes in the design of the heat sink entail an increase in the labor intensity of the production process, and the use of high-precision equipment may be required to obtain designs with perforated fins. From the point of view of a simple manufacturing process, the use of standard plate-fin heat sinks is more appropriate. The existing literature lacks studies that demonstrate the feasibility of reducing the size of the heat sink, reducing its metal consumption, and simultaneously enhancing heat flow without significantly altering the design of the heat sink. The aim of this work is to reduce the size of a plate-fin heat sink, reduce its metal consumption, and increase heat flow by changing the number of fins and the distance between them. In order to achieve this goal, a numerical study of heat flow and pressure drop in models of plate-fin heat sinks with different numbers of fins and the distance between them was carried out. The findings of the research will enable manufacturers of cooling systems to reduce the size and metal consumption of heat sinks while simultaneously enhancing heat flow, thereby achieving economic advantages. Considering the fact that the geometry of the heat sink changes slightly, there will be no need to significantly re-equip the workshops to produce heat sinks of new designs.

2. Materials and Methods

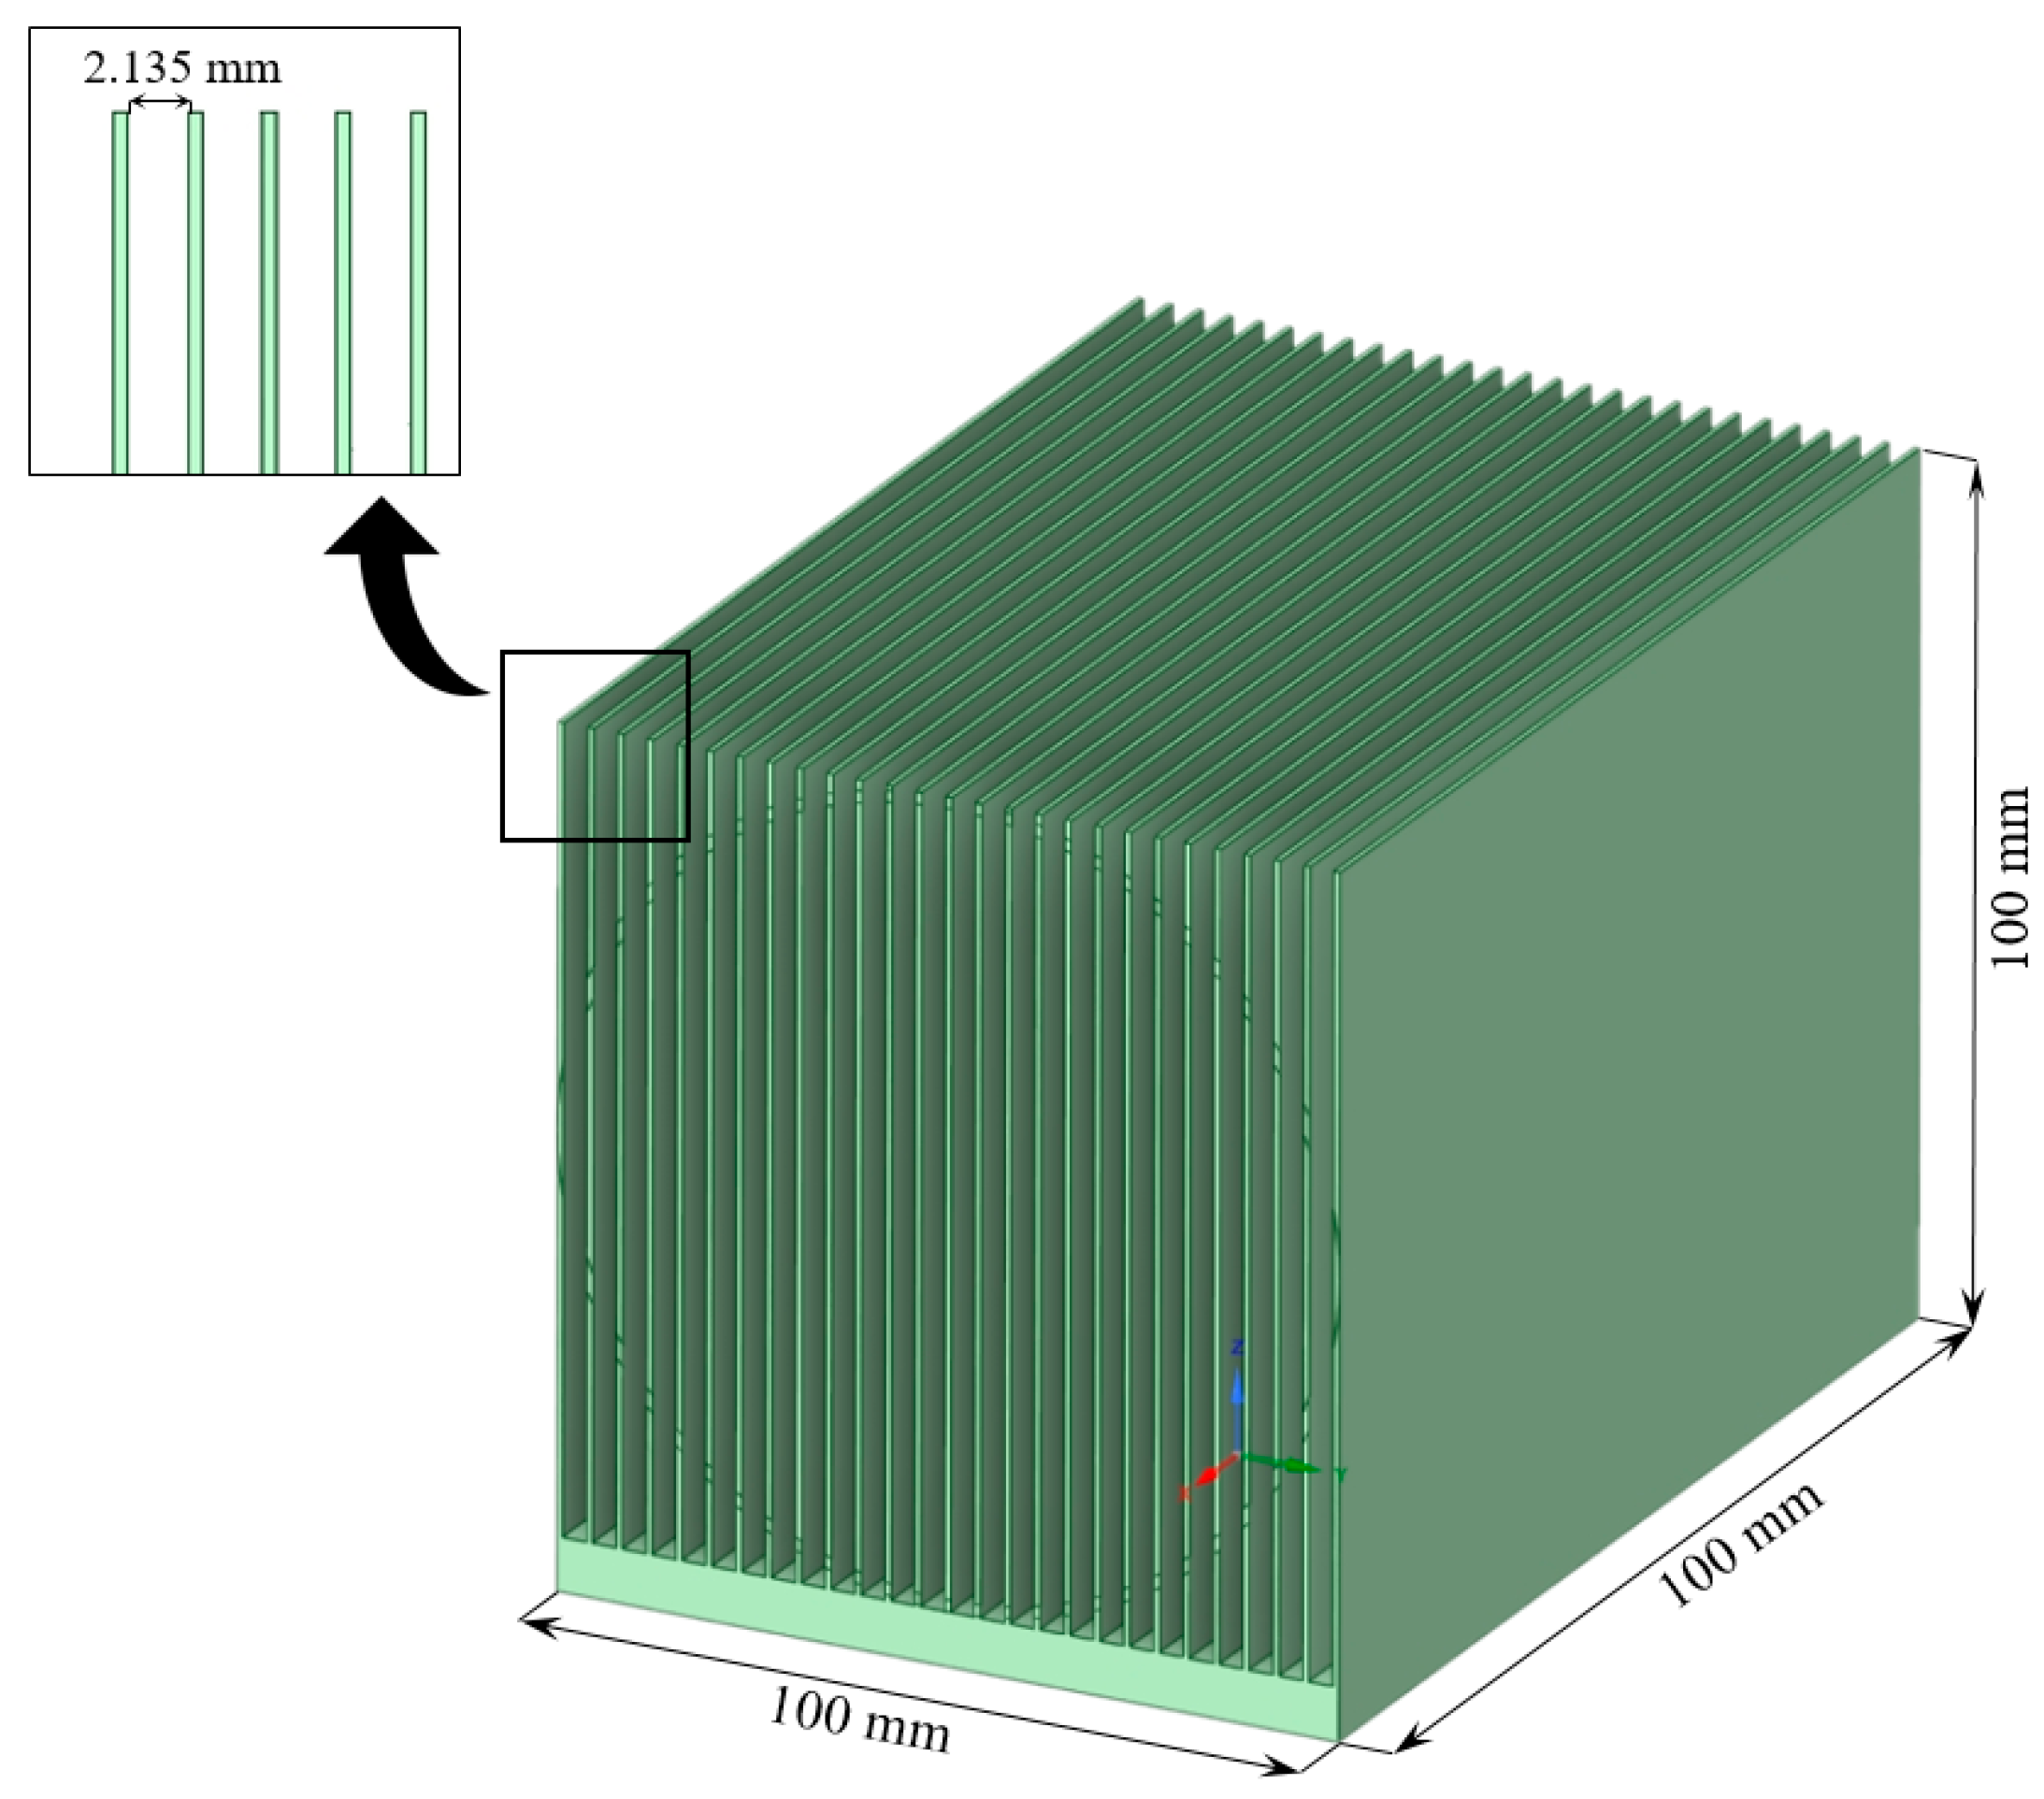
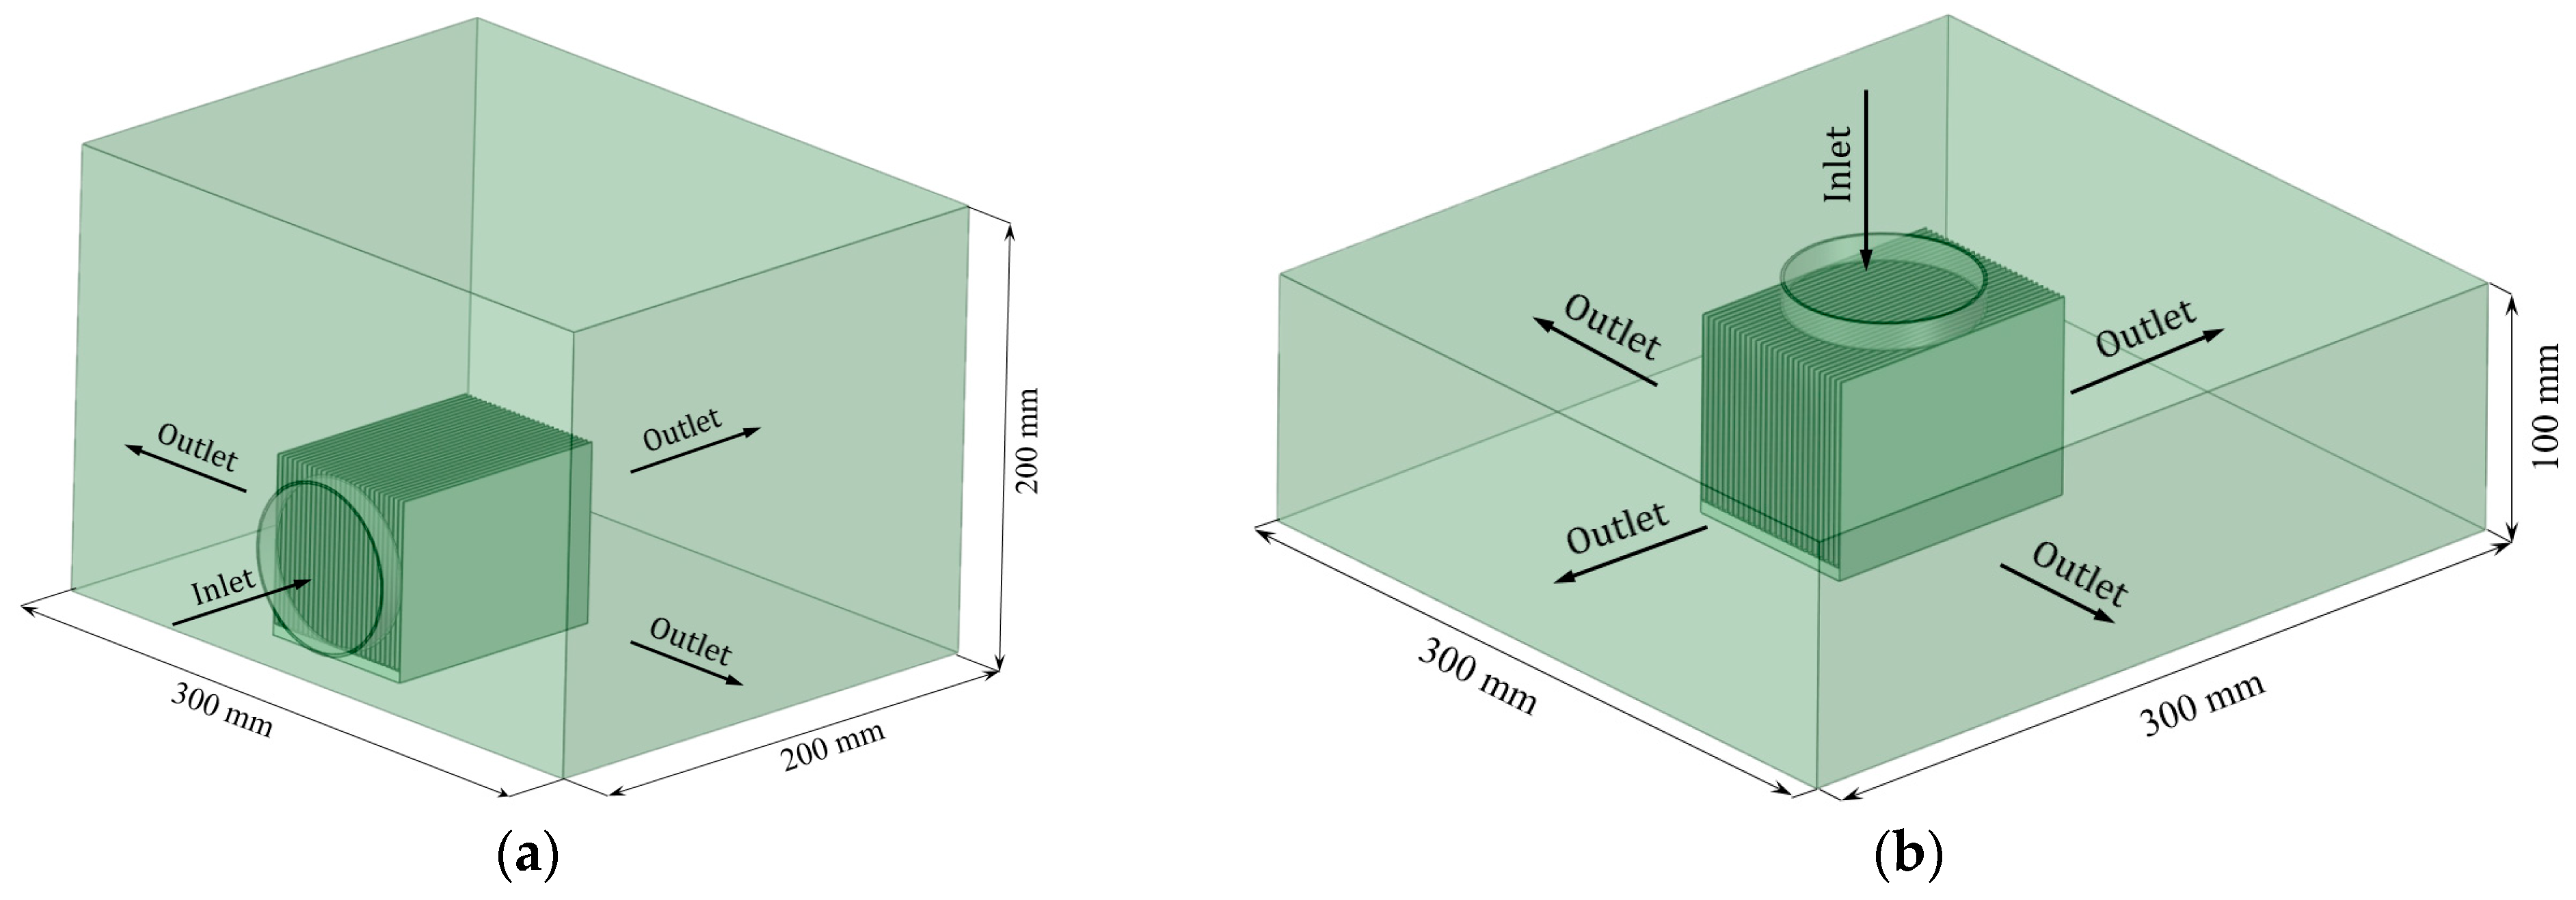
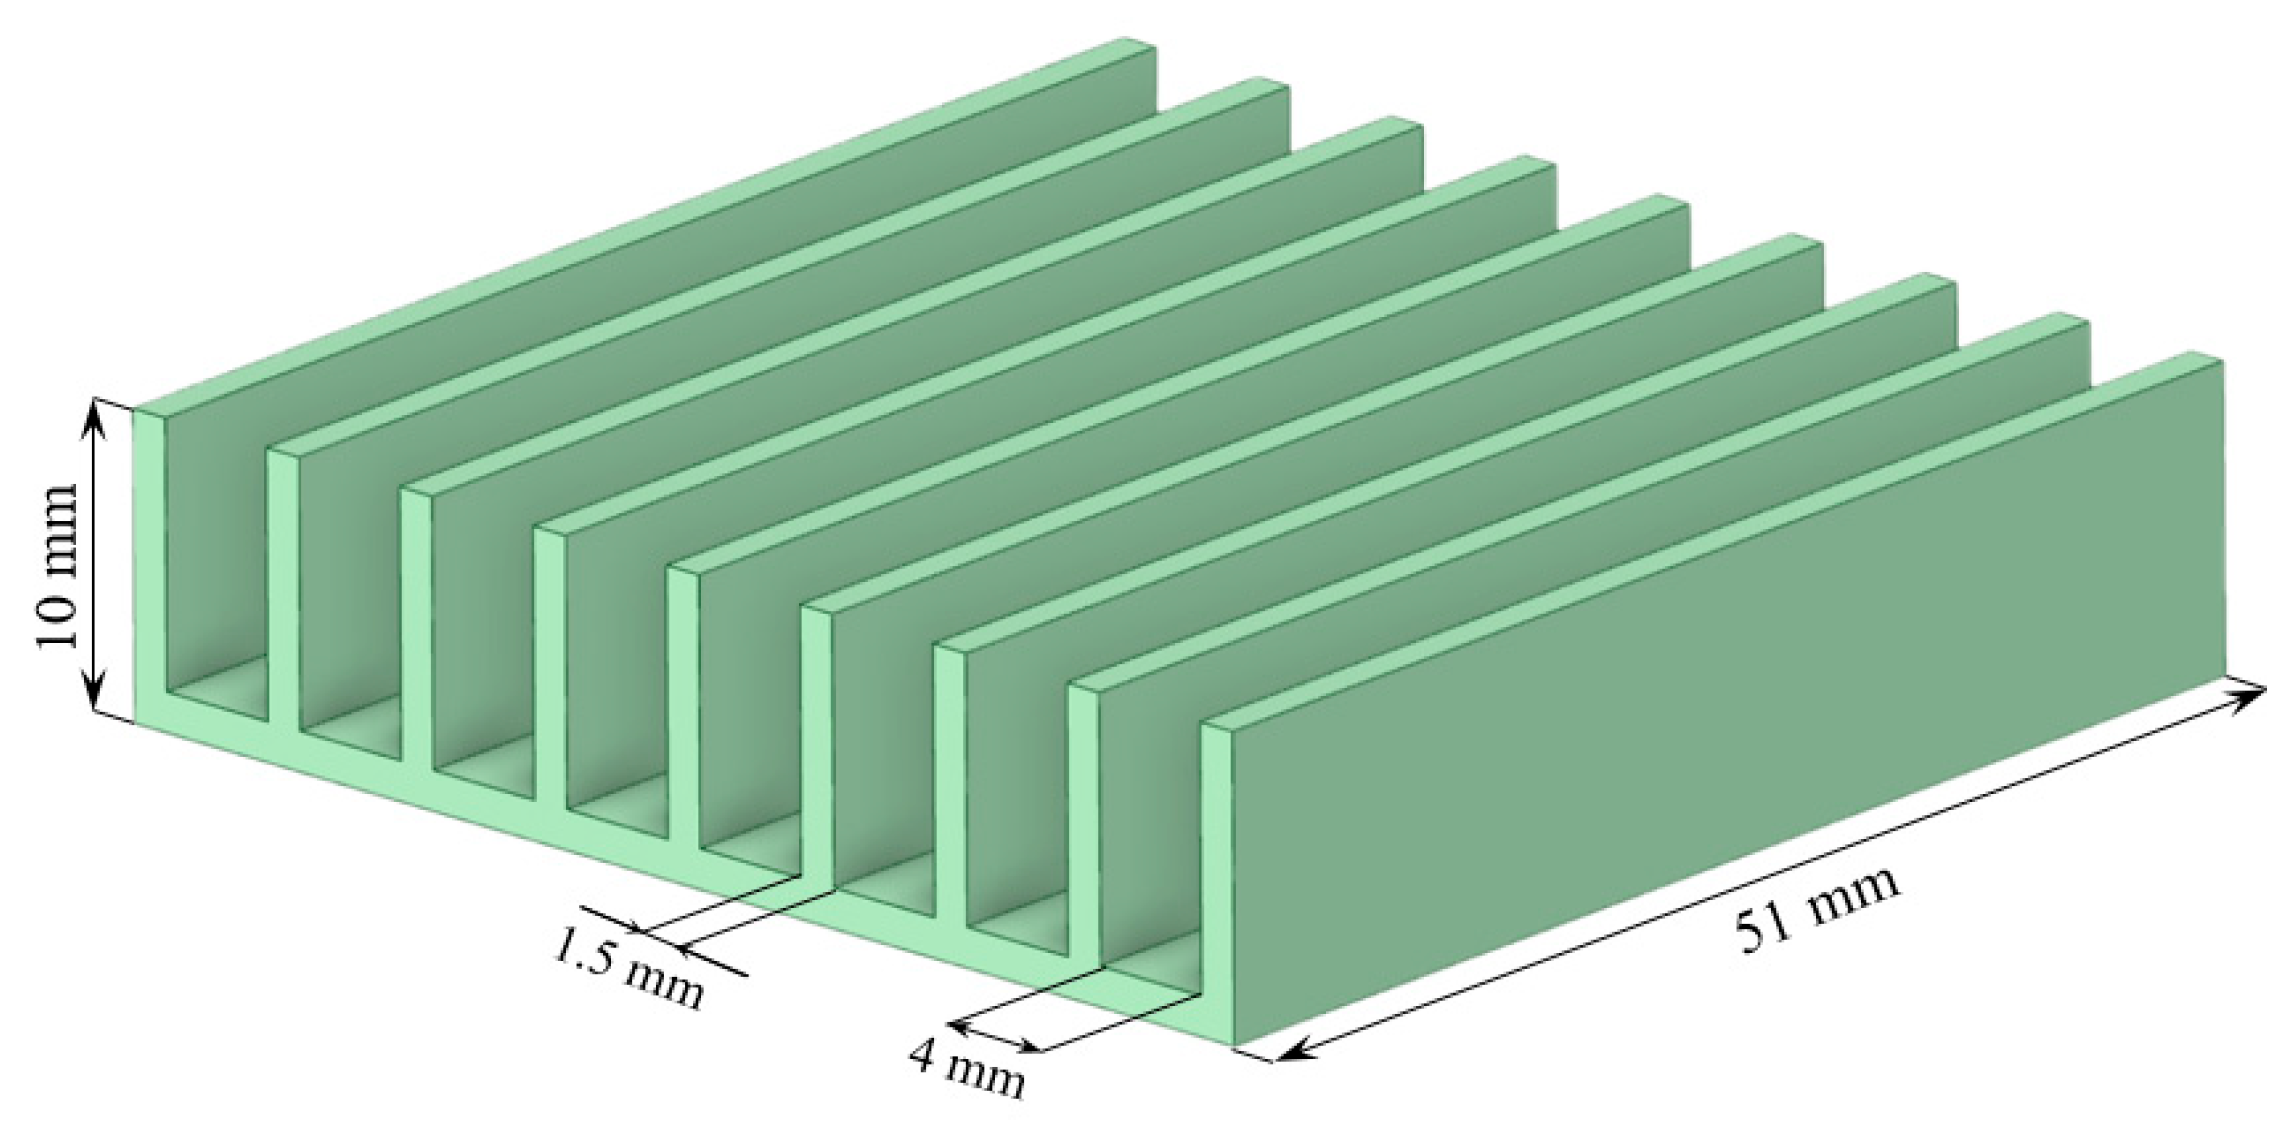
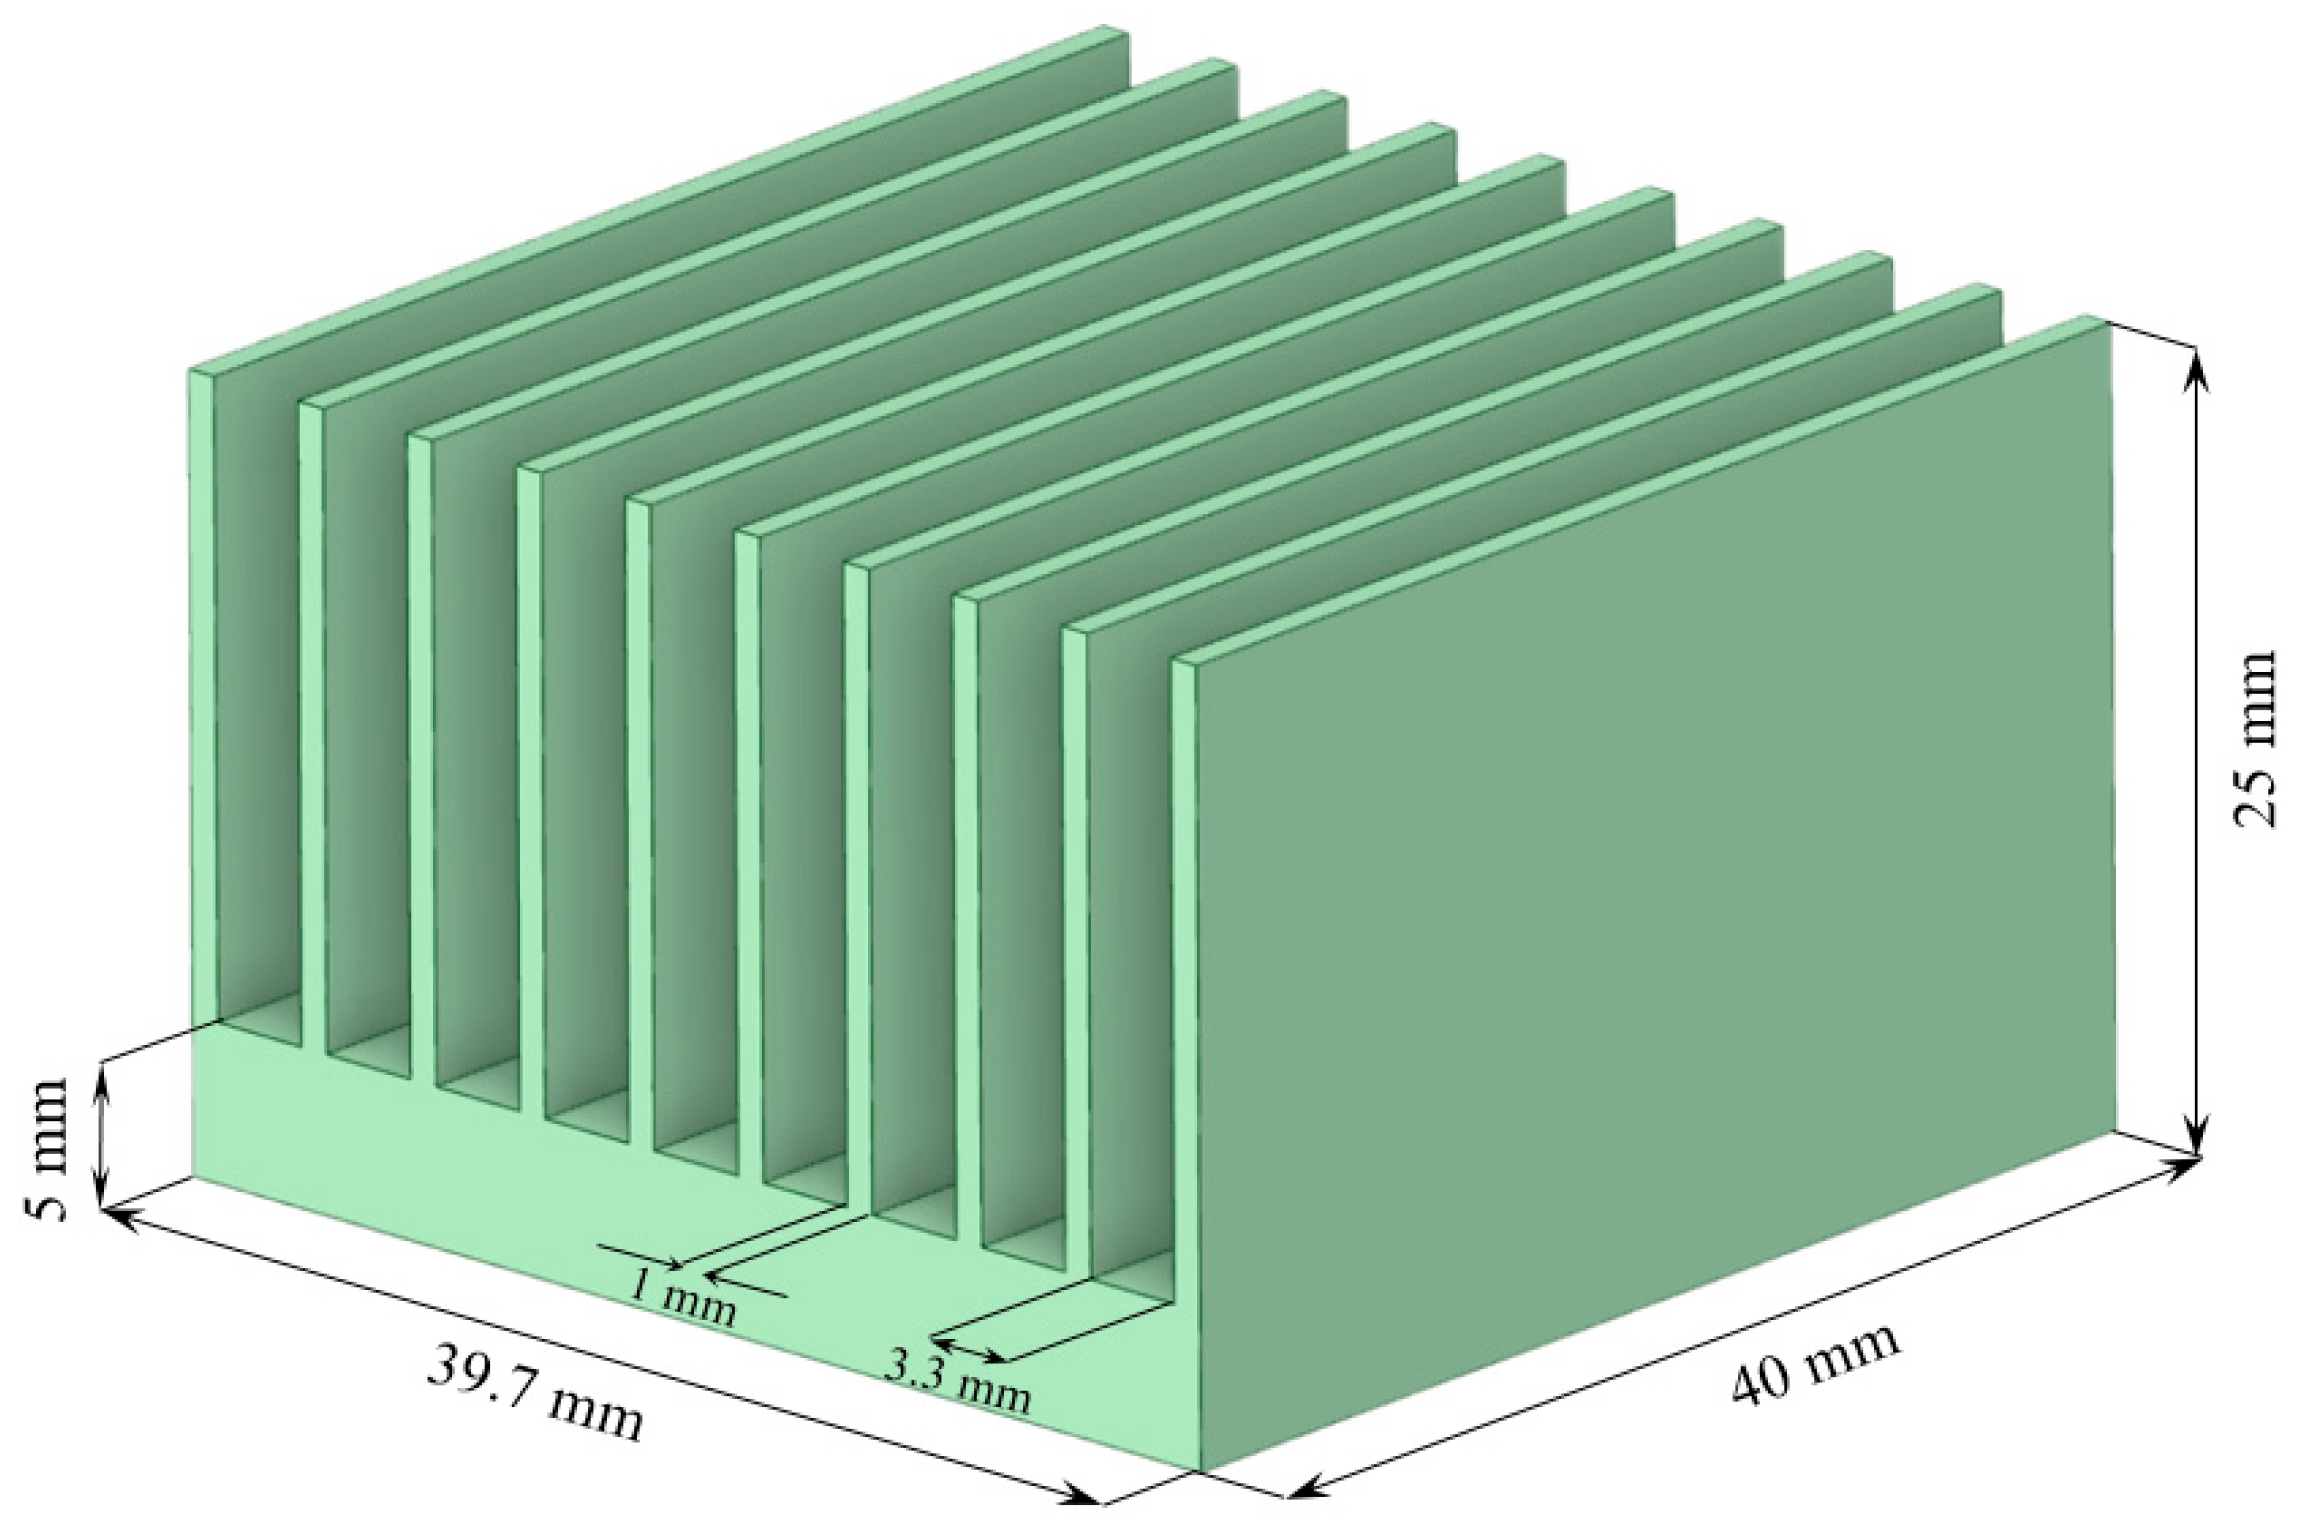
2.1. Formulation of the Problem

The problem of air flow around a heated plate-fin heat sink has been resolved. We built 3D models of square-section heat sinks with different numbers of plate fins (27, 39, and 43). Figure 1 shows a 3D model of a heat sink with 27 fins (model N27). Figure 2 presents pictures of the calculation areas using the example of the N27 heat sink for two variants of the fan position: from the side (a) and from the top (b). Depending on the position of the fan, either horizontal (fan on the side) or vertical (fan on the top) airflow of the heat sink was carried out. The dimensions of the N27 model are 100 × 100 × 100 mm, and the dimensions of the calculation area for this model with horizontal airflow are 300 × 200 × 200 mm, while with vertical airflow they are 300 × 300 × 100 mm. The dimensions of the N39 heat sink model with 39 fins are 69.9 × 69.9 × 69.9 mm, and the dimensions of the calculation area for this model with horizontal airflow are 269.9 × 169.9 × 169.9 mm, while with vertical airflow they are 269.9 × 269.9 × 69.9 mm. The dimensions of the N43 heat sink model with 43 fins are 69.4 × 69.4 × 69.4 mm, and the dimensions of the calculation area for this model with horizontal airflow are 269.4 × 169.4 × 169.4 mm, while with vertical airflow they are 269.4 × 269.4 × 69.4 mm. Further detailed characteristics of heat sink models are shown in Table 1.
The N27 model is the basic one; it has 27 fins with a distance of 2.135 mm between them. By increasing the number of fins to 39 and 43, respectively, and decreasing the distance between them to 1.3 and 1.13 mm, models N39 and N43 were obtained. Furthermore, these models are smaller in size than the base model N27.
The surface area of models N27 and N39 is identical, i.e., fixed, and equals F = 0.3898 m2. In this case, the volume of metal in model N39 is VN39 = 1.165 × 10⁻⁴ m3, while the volume of metal in model N27 is VN27 = 1.252 × 10⁻⁴ m3. N39 has a smaller metal volume than N27, but the surface area is the same.
The models N27 and N43 possess a fixed, identical volume of metal, namely V = 1.25210−4 m3. In this case, the surface area of model N43 is FN43 = 0.4256 m2, and the surface area of model N27 is FN27 = 0.3898 m2. Therefore, the N43 heat sink model has smaller dimensions and a larger surface area than the N27 model, but it contains the same volume of metal.

2.2. Gas Flow Model

The ANSYS Fluent (v. 19.2) software package was used to perform parametric calculations of the heat flow and pressure drop in three heat sink models using stationary flow approximation. The problem was solved using the control volume method. The SST k-ω turbulence model was used with standard model coefficients embedded in ANSYS Fluent (v. 19.2). The SST model considers the transfer of turbulent shear stress when determining turbulent viscosity, which makes this model quite accurate and reliable for a wide class of flows [42,43].
The air parameters used for calculations are as follows: density ρ = 1.225 kg/m3, dynamic viscosity μ = 1.7894 × 10⁻⁵ kg/(m⸳s), and temperature Tair = 293 K. Calculations were carried out at the following air velocities ν: 1; 2; 3; 4; 5; 6; 7 m/s, which corresponded to the following values of volume flow rate GV: 3.5257 × 10⁻³ m3/s; 7.0513 × 10⁻³ m3/s; 10.5770 × 10⁻³ m3/s; 14.1026 × 10⁻³ m3/s; 17.6283 × 10⁻³ m3/s; 21.1539 × 10⁻³ m3/s; 24.6796 × 10⁻³ m3/s. Temperature of the heater simulating the operation of a microelectronic device T: 323; 328; 333; 338; 343; 348; 353 K. Two fan positions were investigated: from the side (horizontal airflow) and from the top (vertical airflow).
Mass conservation equation:
( ρ υ ) = 0 ,
where ρ is the density and υ is the velocity.
The momentum conservation equation:
( ρ υ υ ) = p + τ ¯ ¯ + ρ g ,
where p is the pressure and τ ¯ ¯ is the stress tensor. In Equation (2), the stress tensor is
τ ¯ ¯ = μ ( υ + υ T ) + 2 3 μ υ I ¯ ¯ ,
where μ is the viscosity and I ¯ ¯ is the unit tensor.
Energy conservation equation:
( ρ υ h ) + ( λ T ) = p t + τ ¯ ¯ : υ ,
where h is the enthalpy, and λ is the thermal conductivity of the gas.

2.3. Evaluation of the Energy Efficiency Indicator
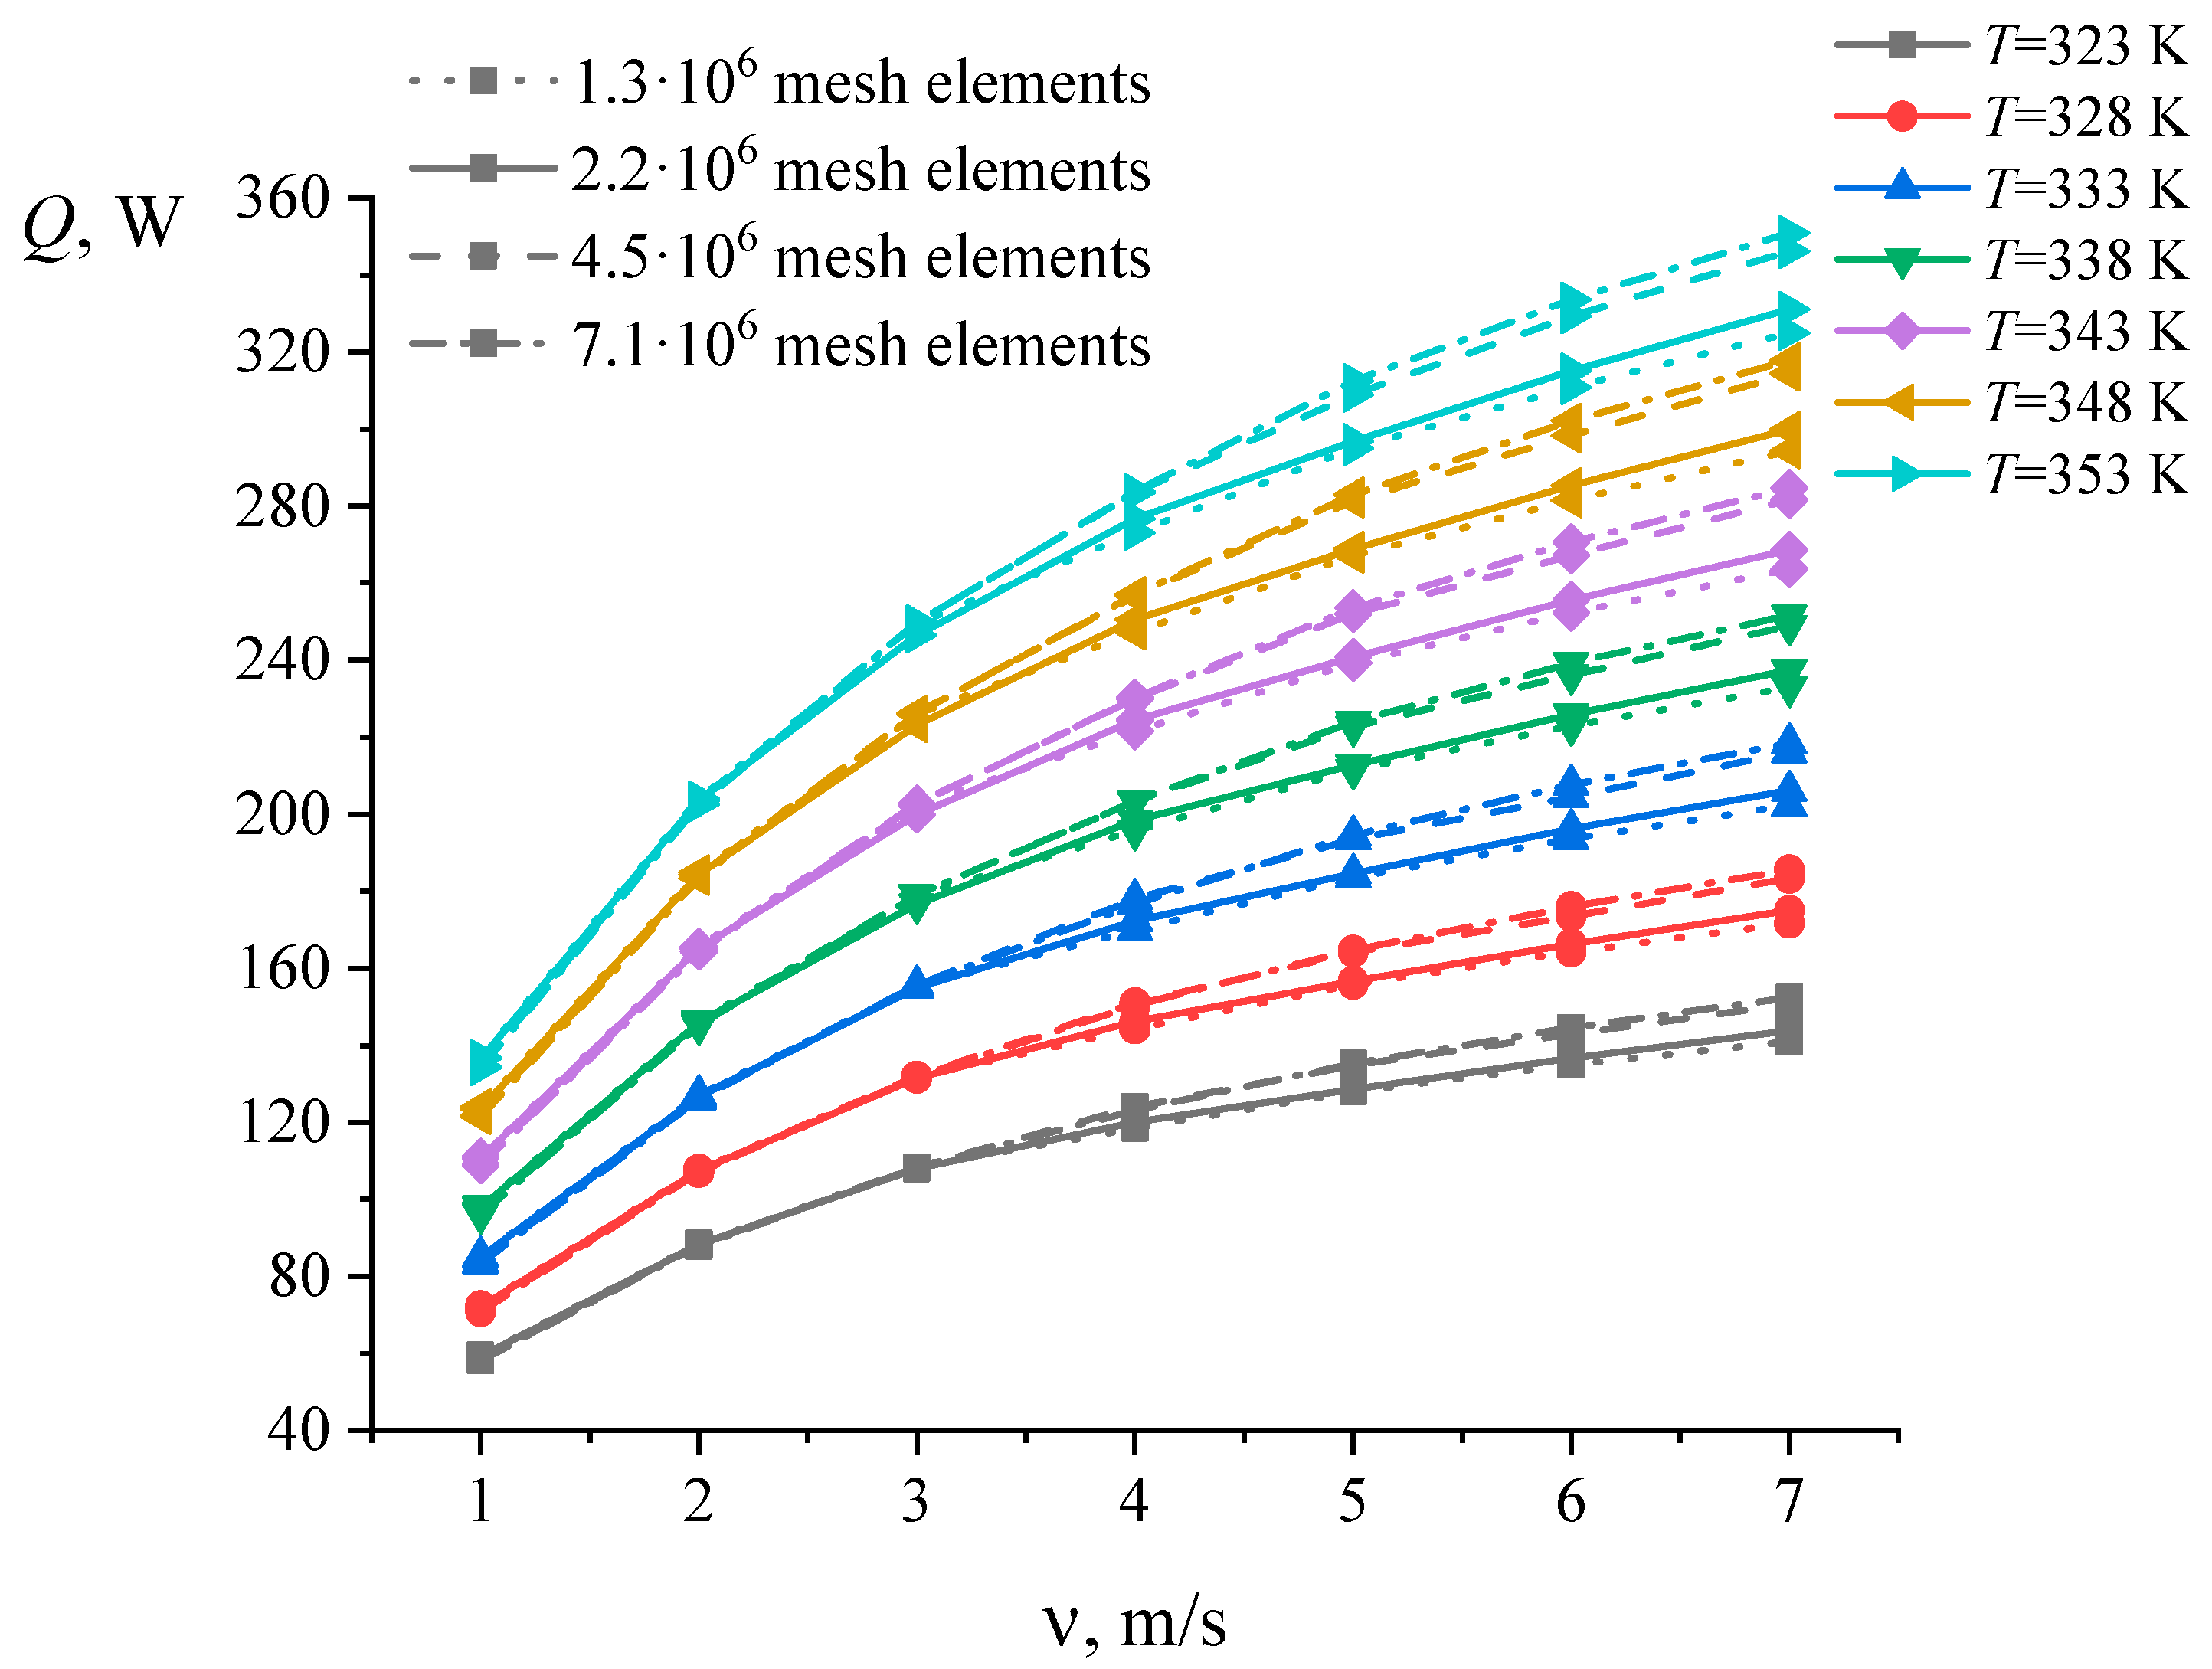
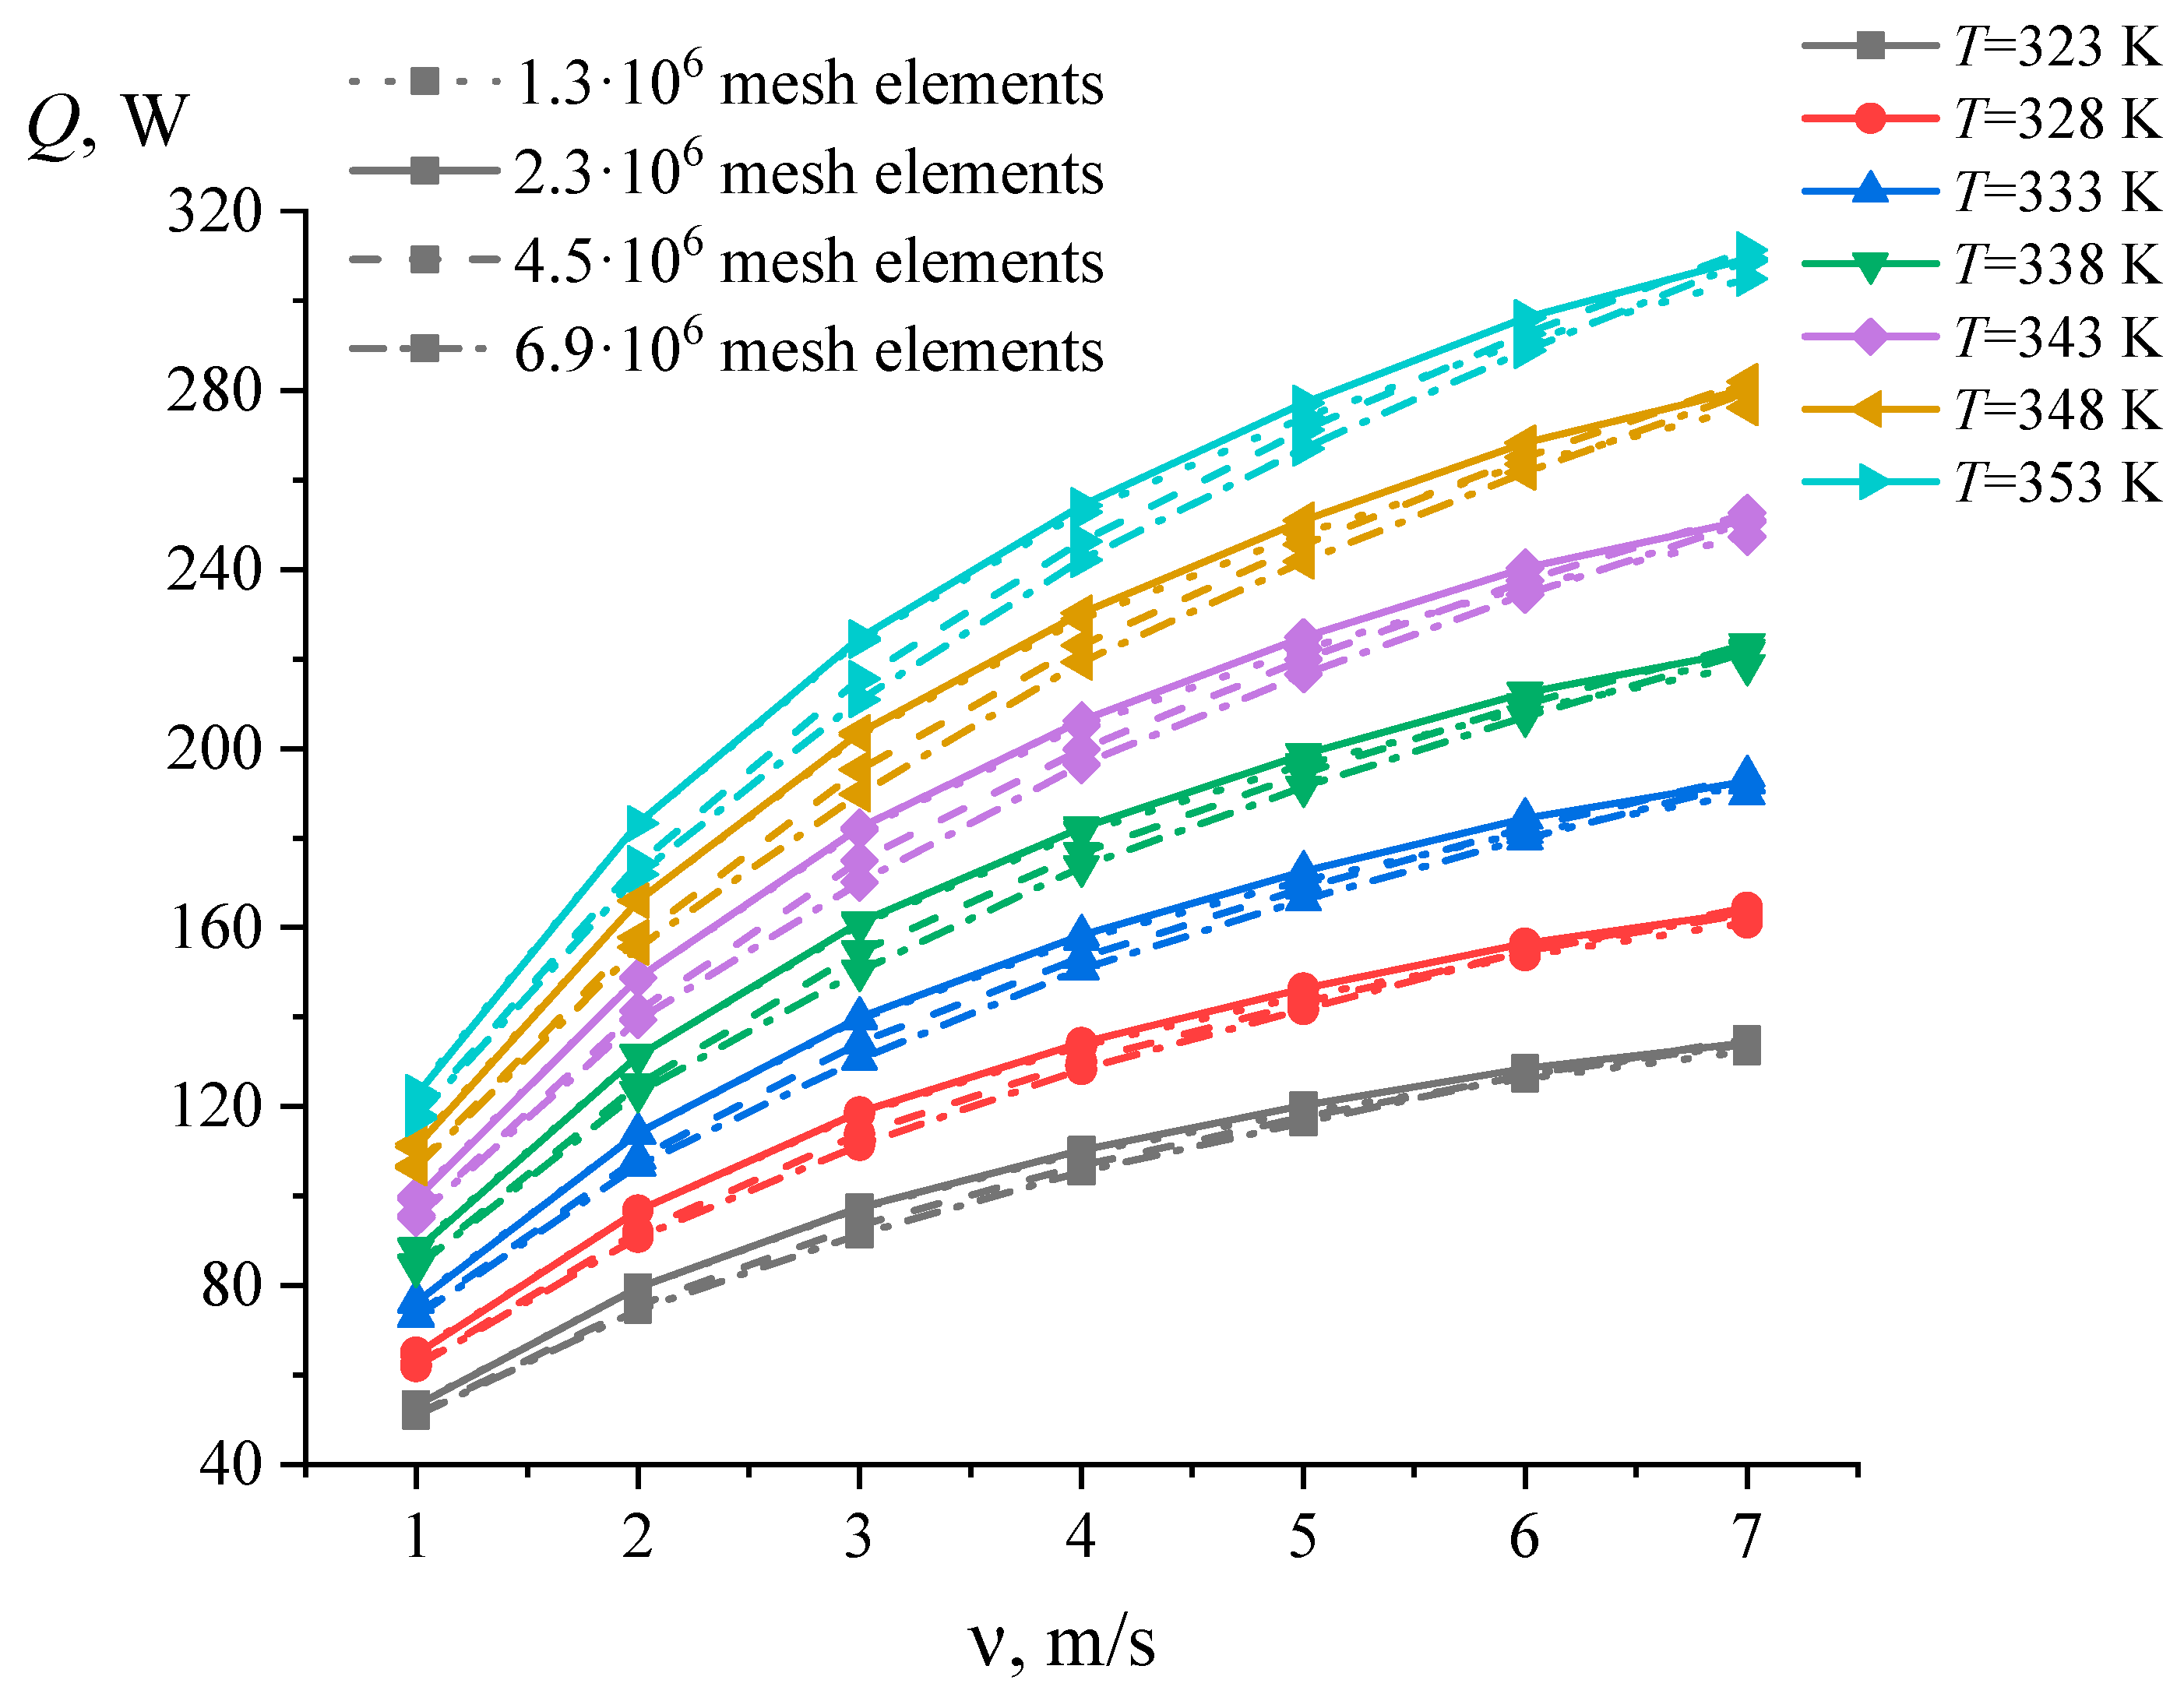
For a comparative analysis of the effectiveness of the studied heat, the energy efficiency indicator was calculated [44]:
E F = Q / δ P ,
where Q is the heat flow from the surface of the heat sink, W; and δ P is the power spent on pumping air, W [44]:
δ P = G V Δ p = G / ρ Δ p ,
where G V is the volume air flow rate, m3/s; Δ p the pressure drop, Pa; G the mass air flow rate, kg/s; and ρ the air density, kg/m3.

2.4. Mesh Check

The mesh division is checked by refining the computational mesh, during which there is no further change in the calculated parameters, or they change with minimal error. We present the results of a mesh division check on the N39 heat sink. The results of heat flow calculation for the N39 heat sink are shown in Figure 3, which shows meshes with 1.3 million, 2.2 million, 4.5 million, and 7.1 million elements with horizontal airflow. The results of calculating the heat flow for N39 with vertical airflow are presented in Figure 4. In this case, we studied the meshes with the following number of elements: 1.3 million, 2.3 million, 4.5 million, and 6.9 million. In the graphs, the solid lines indicate the results for meshes with 1.3 million elements for the cases of horizontal and vertical airflow; the dotted lines represent the results for meshes with 2.2 million elements for horizontal airflow, and 2.3 million elements for vertical airflow; the dots indicate results for meshes with 4.5 million elements for the cases of horizontal and vertical airflow; and the dashed-dotted lines show the results for meshes with 7.1 million elements for horizontal airflow, and 6.9 million elements for vertical airflow.
Table 2 presents the results of testing the mesh division for model N39 at T = 353 K and ν = 7 m/s for the cases of horizontal and vertical airflow. As we can see from the table data, a mesh with 4.5 million elements is the most optimal for both cases of blowing direction, since with further refinement of the mesh to 6.9 and 7.1 million elements, the difference in heat flow values is less than 2%.

2.5. Verification of the Calculations

Yu et al. [45] conducted parametric calculations of pressure drop and thermal resistance in a plate-fin heat sink using the following parameters: length L = 51 mm, height H = 10 mm, and number of edges N = 9. The calculations were performed with horizontal airflow from the heat sink at velocities of 5 to 12.2 m/s. Figure 5 shows a graph of the pressure drop in the heat sinks studied in our study and in the study by Yu et al. Our research findings are presented in the case of horizontal airflow. The calculated pressure drop results obtained by N27 are comparable to those obtained by Yu et al. in the range of air velocities ranging from 5 to 7 m/s. The disparities observed in the findings of the studies can be attributed to variations in the number of fins and their spacing. The heat sink studied by Yu et al. had fewer fins and a larger spacing compared to the heat sinks studied in our research. As a result, the pressure drop across the heat sink studied by Yu et al. was lower.
Figure 6 shows graphs of changes in thermal resistance depending on air velocity. Yu et al. [45] conducted studies of thermal resistance at an air temperature of 294 K, a heat sink base temperature of 333 K, and an air velocity of 5 to 12.2 m/s. The results of our research are presented for the case of horizontal blowing at an air temperature of 293 K, a heater temperature of 333 K, and air velocities from 1 to 7 m/s. Thus, thermal resistance studies were carried out by us and Yu et al. at close values of air and heater temperatures and air velocity. It is necessary to note the similarity between the thermal resistance curves obtained in our work and that of Yu et al. [45]. As we can see, the heat sink models we studied have lower thermal resistance values than the heat sink models studied in [45]. The heat sink in [45] has a thermal resistance of 1.5 K/W at a 5 m/s air velocity. The thermal resistance of heat sinks N27, N39, and N43 is 0.25, 0.22, and 0.02 K/W, respectively. The thermal resistance of the heat sink in [45] exceeds that of heat sink N27 by 6 times, heat sink N39 by 6.8 times, and heat sink N43 by 7.5 times. These differences are explained by the fact that the heat sinks N27, N39, and N43 have a significantly higher number of fins (27, 39, and 43) than the heat sink in [45], which has 9 fins. Furthermore, the heat sink in [45] has smaller dimensions than our heat sinks N27, N39, and N43. Accordingly, the surface area of the heat sink in [45] is significantly smaller, which explains the high thermal resistance values.

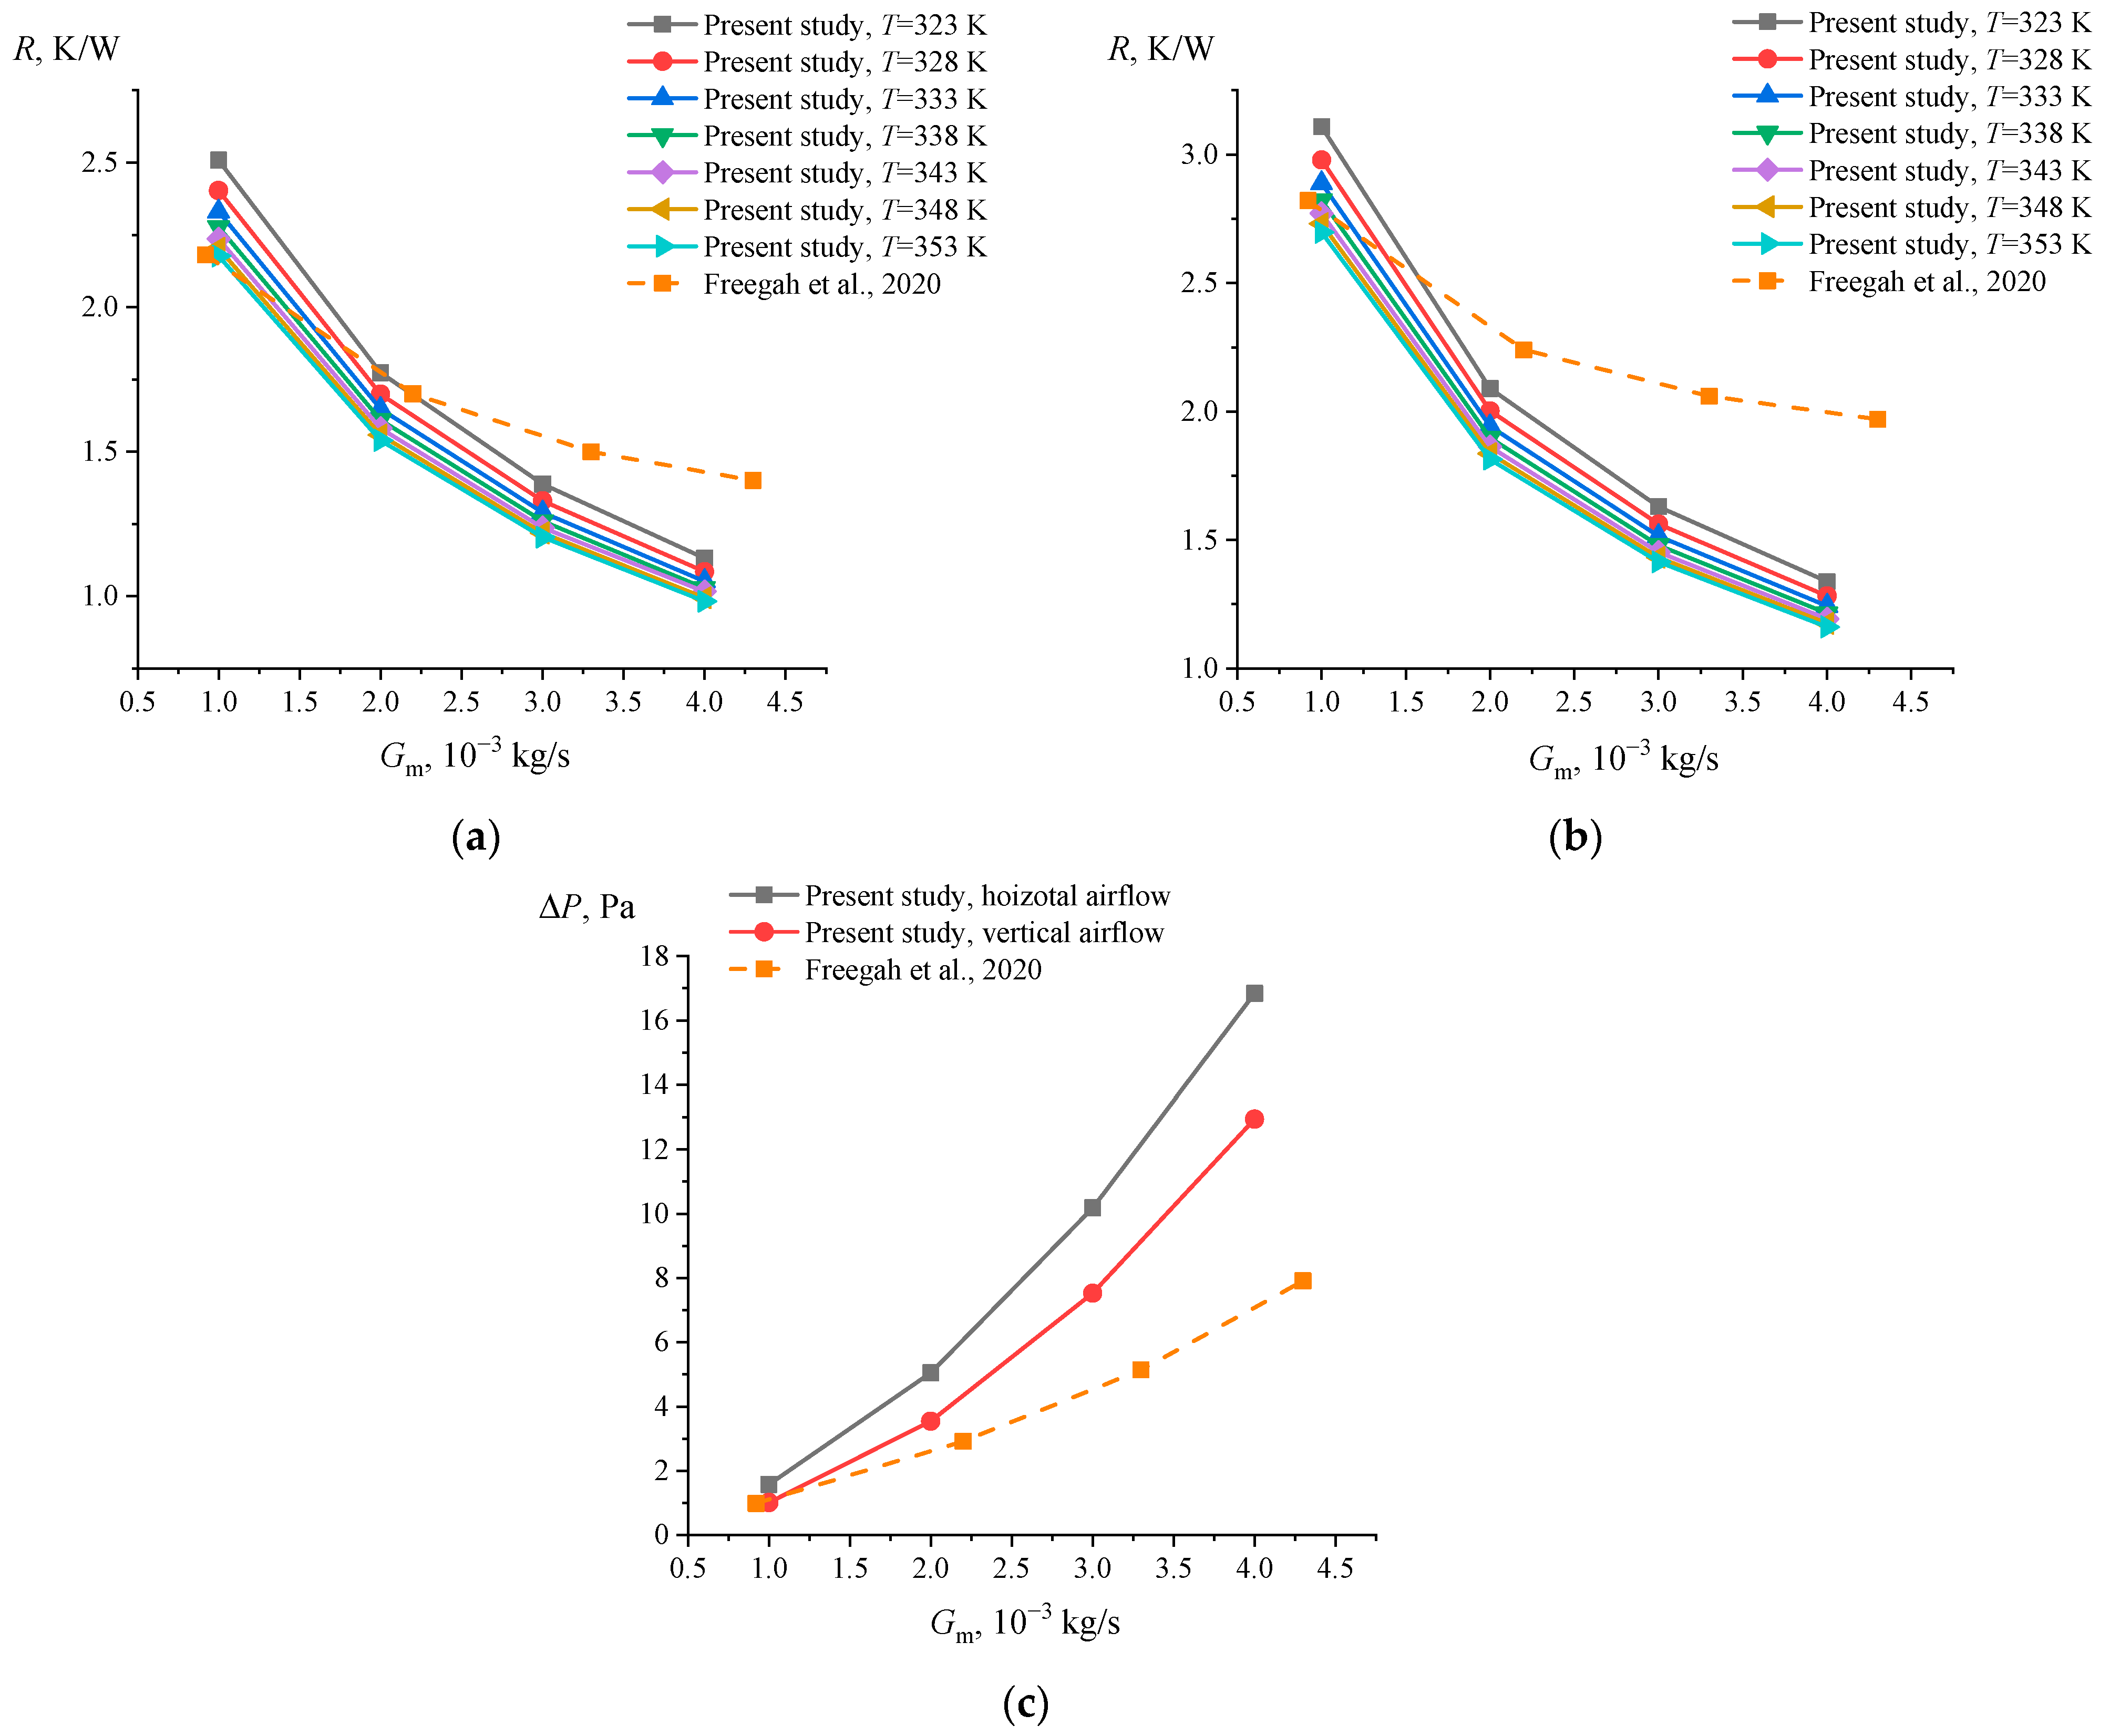
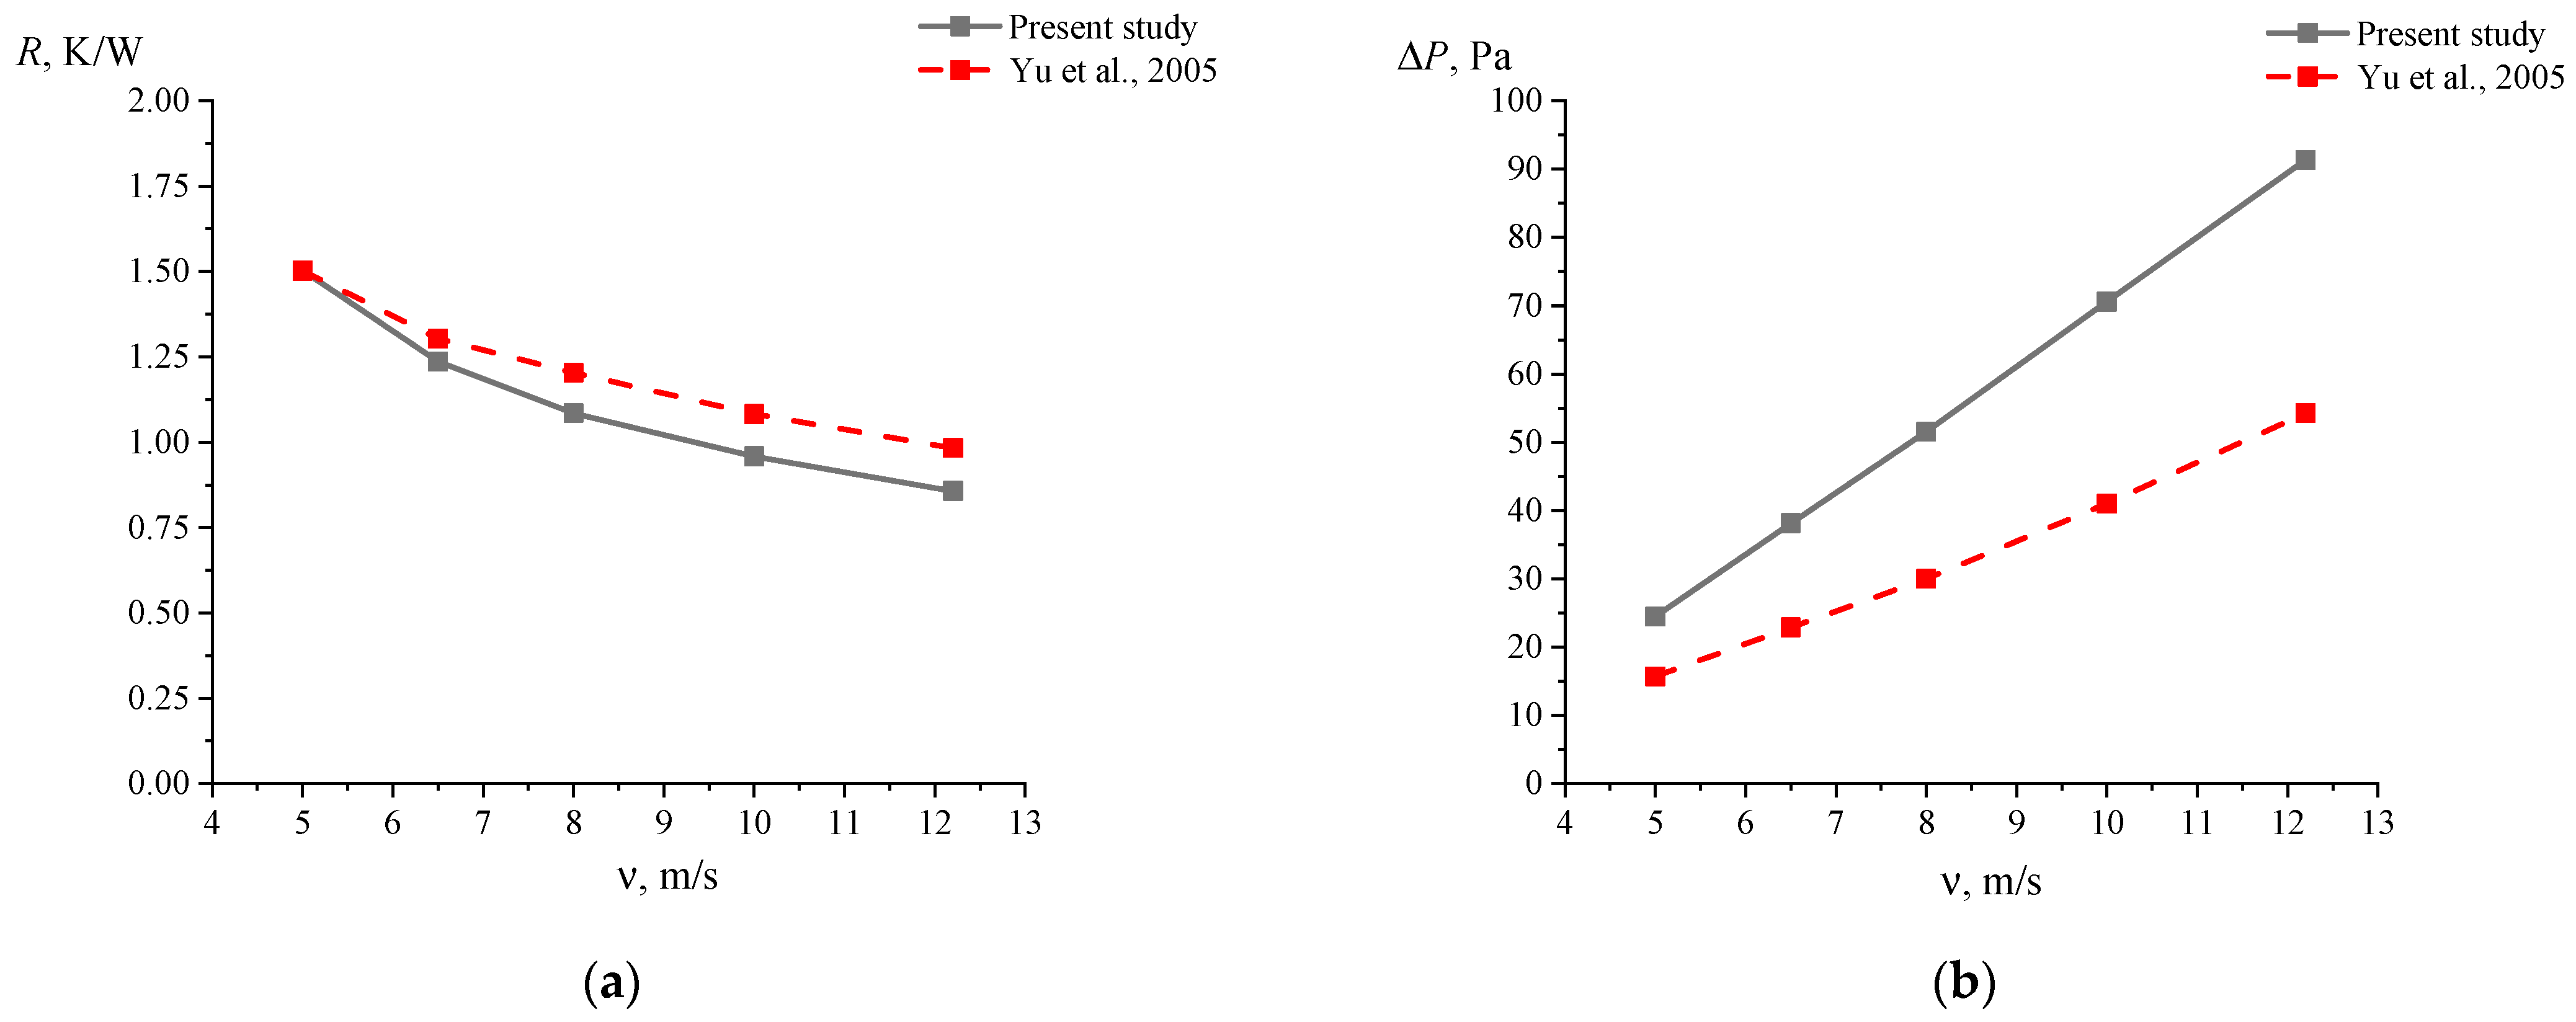
2.6. Validation of Numerical Calculations

To verify the numerical calculations, comparisons were made with the results of Yu et al. [45] and Freegah et al. [46], who carried out numerical studies of thermal resistance and pressure drop in models of plate-fin heat exchangers.
For validation with [45], we built a 3D model of the heat sink described in [45], and then calculated the thermal resistance and pressure drop using our calculation model. The dimensions of the heat sink were set to the same dimensions as in [45]. At the same time, we retained our parameters of the computational domain described in Figure 2a. This is done in order to demonstrate how the calculation results are affected by the computational domain size. Figure 7 shows an image of the 3D model of the heat sink we built, as described in [45].
The calculation was conducted for the case of horizontal airflow, and the same values of air temperature (294 K), air velocity (5, 6.5, 8, 10, and 12.2 m/s), and heater temperature (333 K) were specified within the boundaries of the calculation area, as per the work [45]. Our findings regarding the calculation of thermal resistance and pressure drop were compared with the findings obtained in [45]. Figure 8 shows graphs of thermal resistance (a) and pressure drop (b) depending on air velocity. We can see from the graphs that the thermal resistance curves are similar in nature, and the differences in values range from 0.035% to 12.86% depending on the air velocity. The differences in the values are explained by the differences in the computational domains used in our work and in [45]. In [45], gas flow is considered only in the region limited by the heat sink. In our study, there is also an external problem, as a result of which the hydrodynamics change, which affects the change in pressure drop and heat transfer.
Furthermore, the numerical calculations were verified by comparing the results with the work of Freegah et al. [46]. For this purpose, a 3D model of a plate-fin heat sink was built (Figure 9), maintaining the dimensions specified in [46]: length 40 mm, width 39.7 mm, height 25 mm, number of fins N = 10, fin thickness 1 mm, and distance between fins 3.3 mm. We also retained the computational domain parameters described in Figure 2a. The heater temperature (323–353 K), air mass flow rate (from 1 × 10⁻³ to 4 × 10⁻³ kg/s), and air temperature (293 K) were set at the boundary of the computational domain. The range of the air mass flow rate was established based on the findings of the study [46]. The temperature range investigated in our study (323–353 K) and that of Freegah et al. (328–355 K) share similar values. Thus, we retained our temperature range (323–353 K) in the calculations.
As in [46], thermal resistance and pressure drop were calculated for two cases of airflow blowing directions: horizontal and vertical. Figure 10 presents the results of the thermal resistance and pressure drop calculations. The graphs show that we obtained values of thermal resistance and pressure drop close to those obtained by [46] for both horizontal and vertical airflow.

3. Results and Discussion

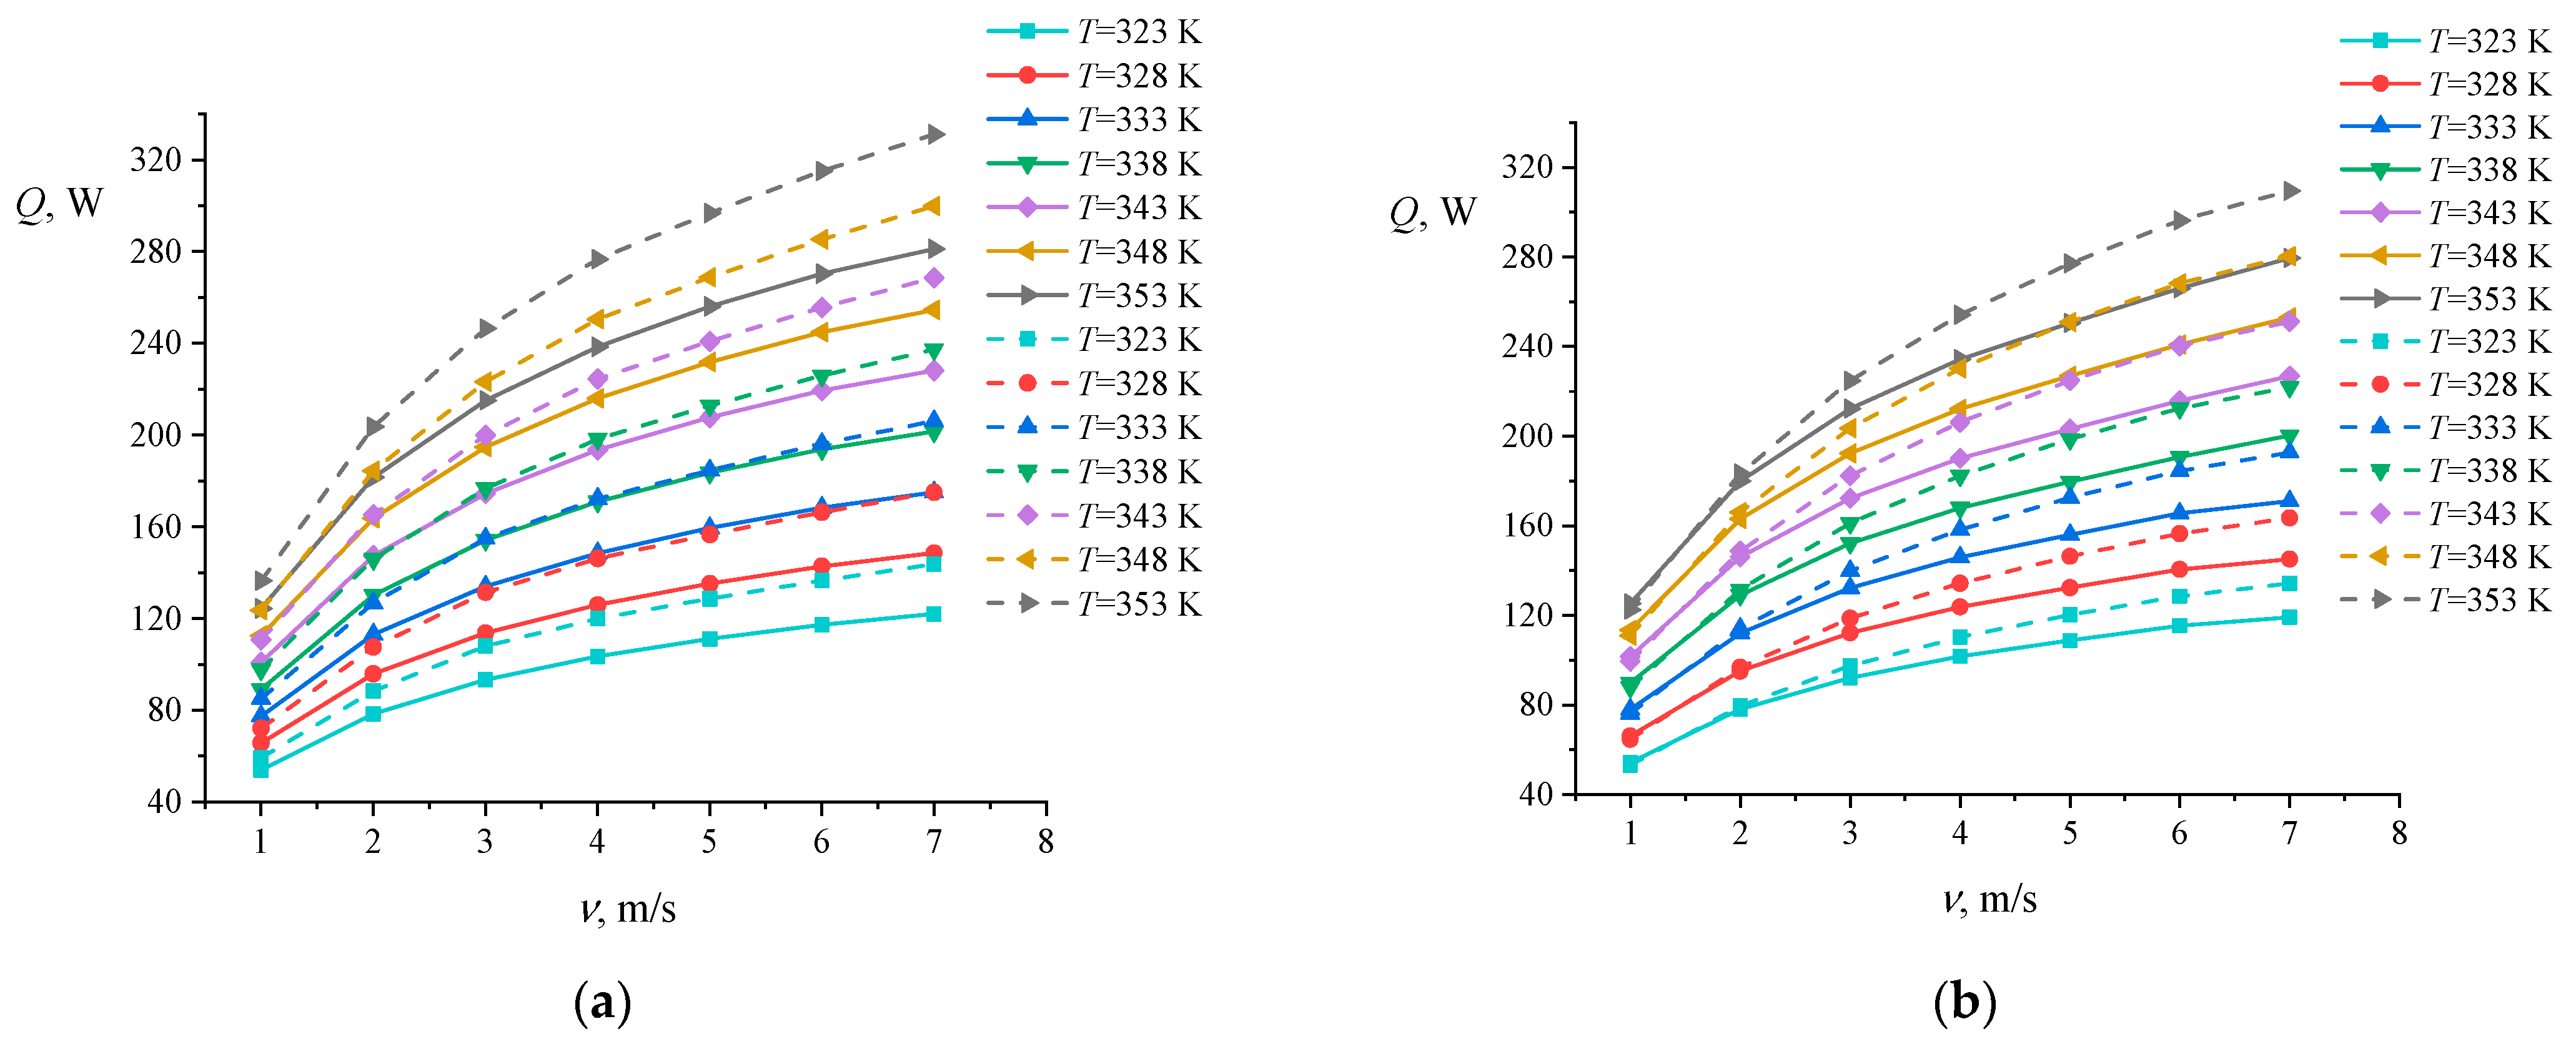
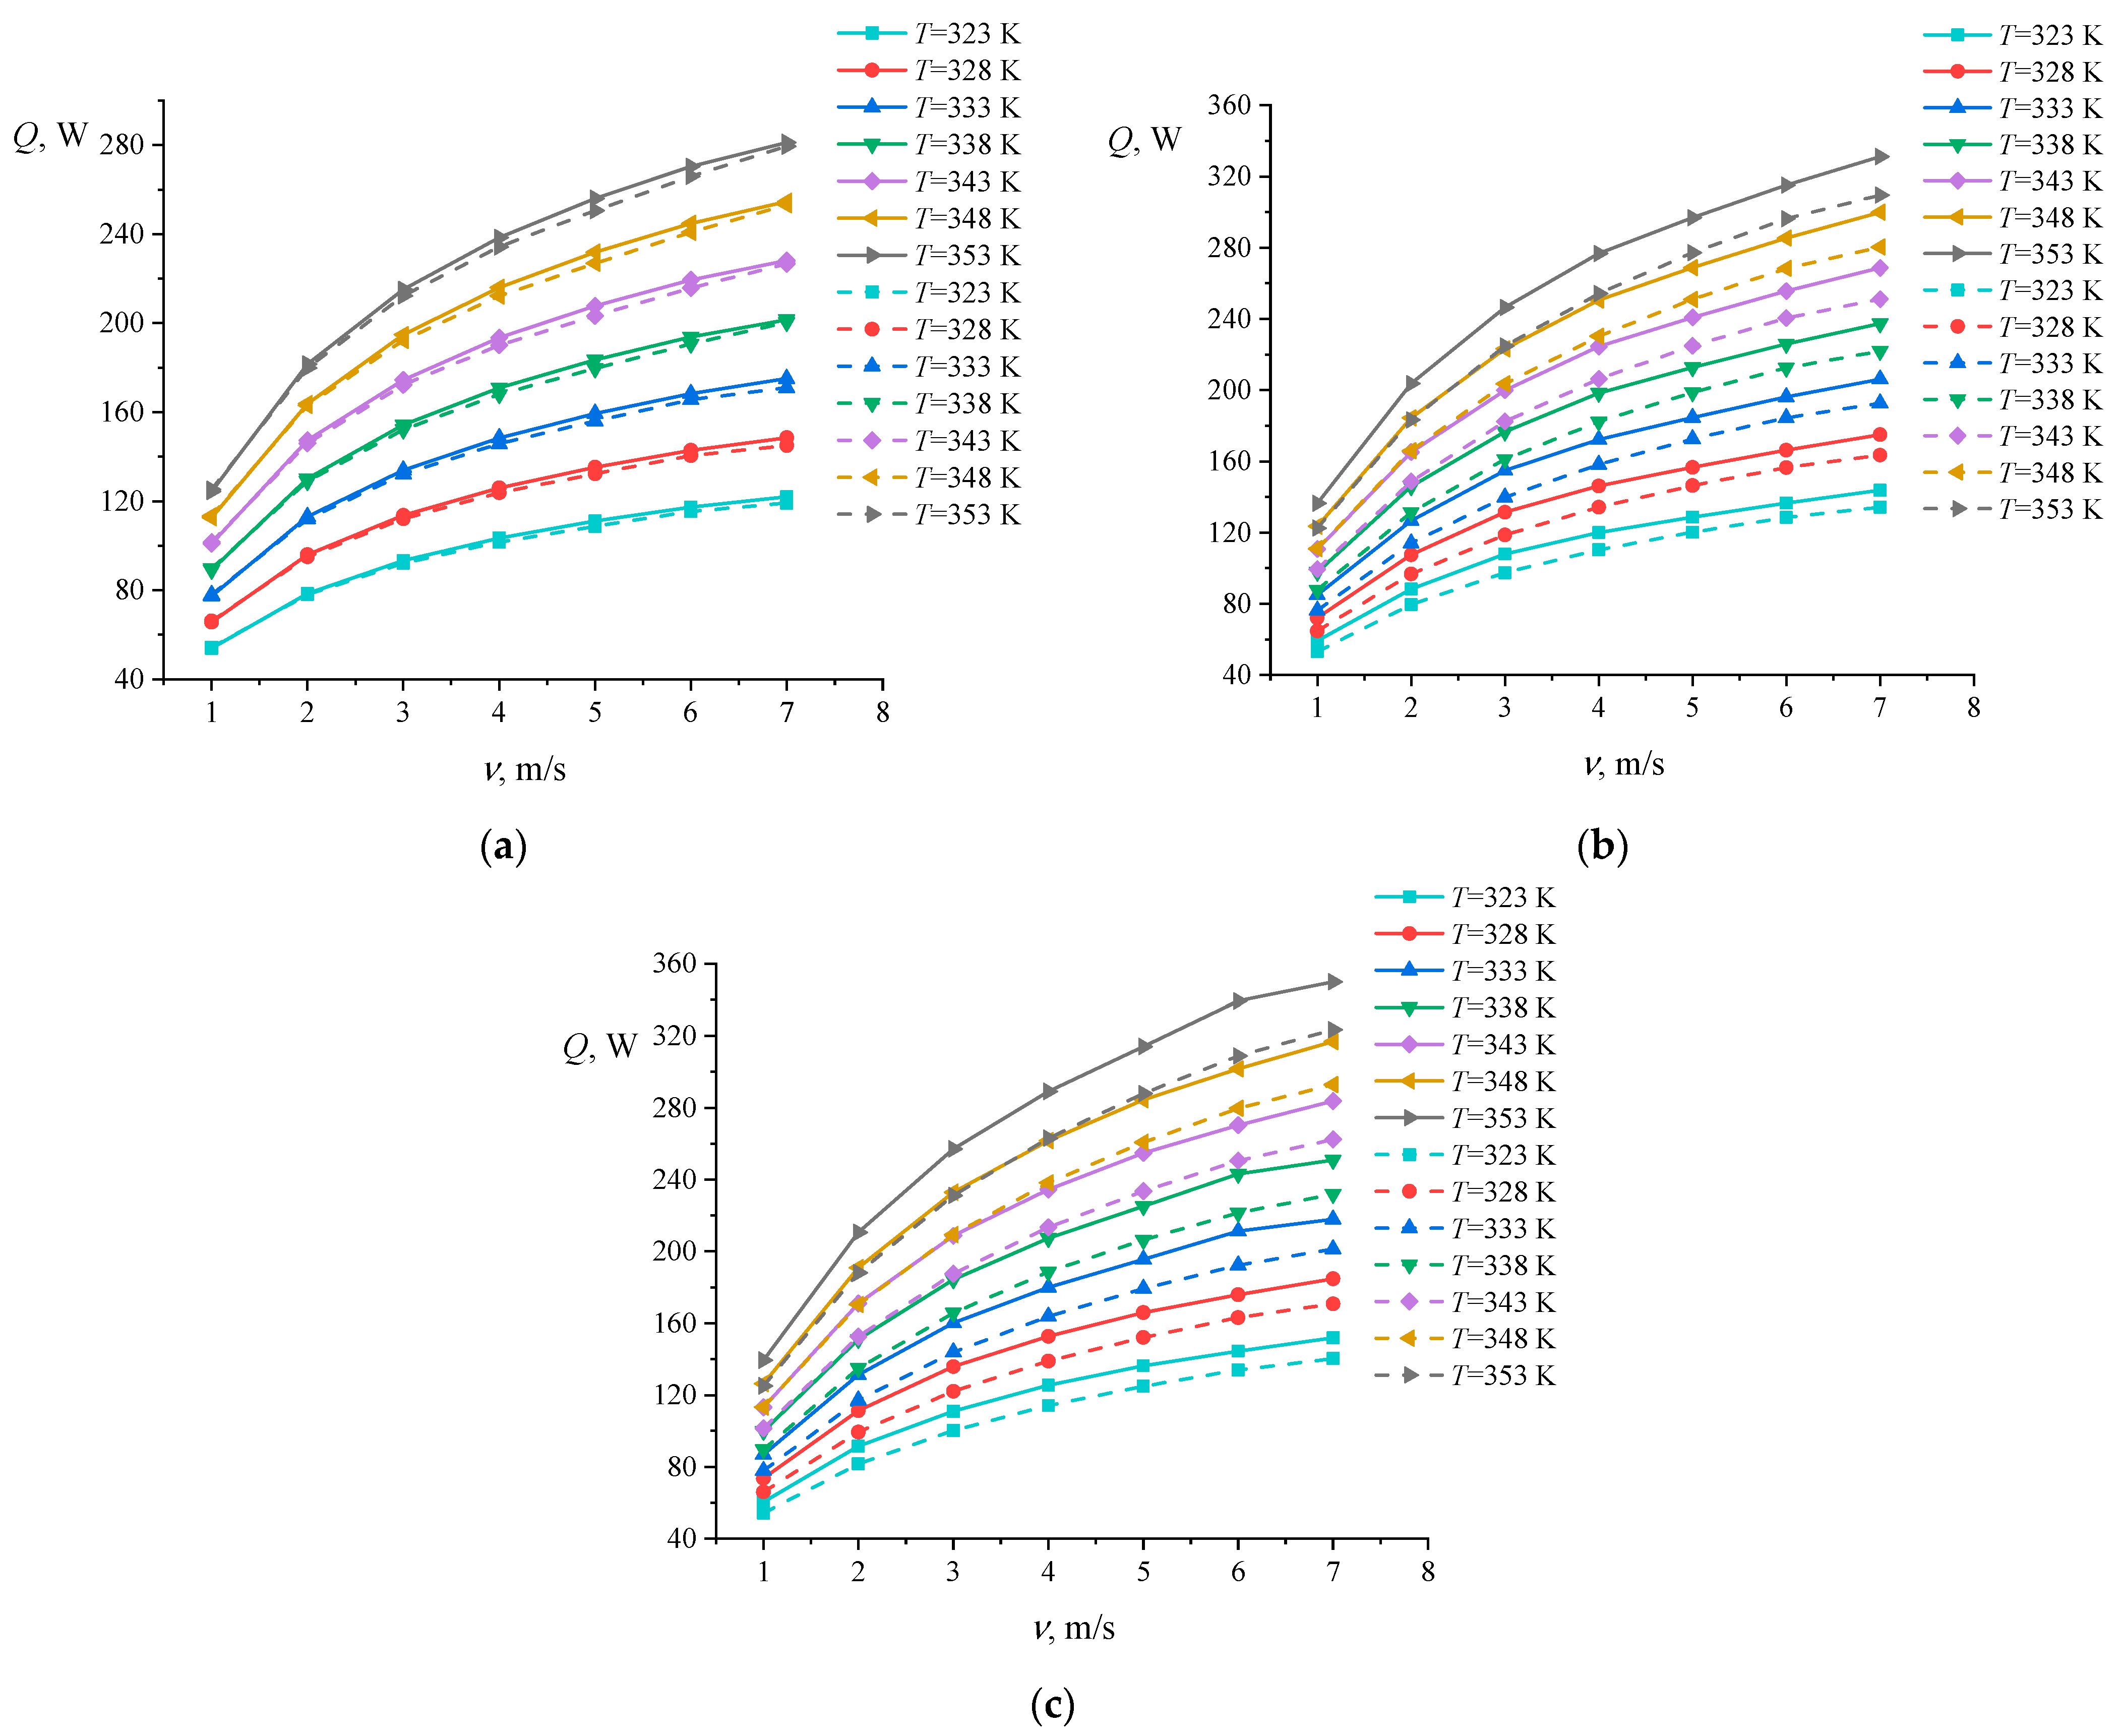
3.1. Effect of Fan Position on Heat Flow

The results of the parametric calculations are presented in the graphs in Figure 11. The solid lines show the calculation results for the case of horizontal airflow, and the dashed lines for vertical airflow. We can see from the graphs that horizontal airflow is preferable, since the heat flow from the heat sink in this case is higher. This statement holds true for all the heat sink models studied. As the heater temperature and the velocity of air flow increase, the difference in heat flow values also increases. Depending on the geometry of the heat sink, the differences between the heat flow values for horizontal and vertical airflows may vary. The smallest effect is observed in model N27, wherein at a heater temperature of 353 K and an air flow velocity of 7 m/s, the difference in heat flow values is only 0.6% (2 W). In contrast to N27, the heat flow observed in the N39 model is 6.98% (22 W) higher with horizontal airflow compared to vertical airflow (at T = 353 K, ν = 7 m/s). In the N43 heat sink, the heat flow value is 8.16% (26 W) higher with horizontal airflow compared to vertical airflow (at T = 353 K, ν = 7 m/s). Therefore, the position of the fan affects the thermal performance of the heat sink.

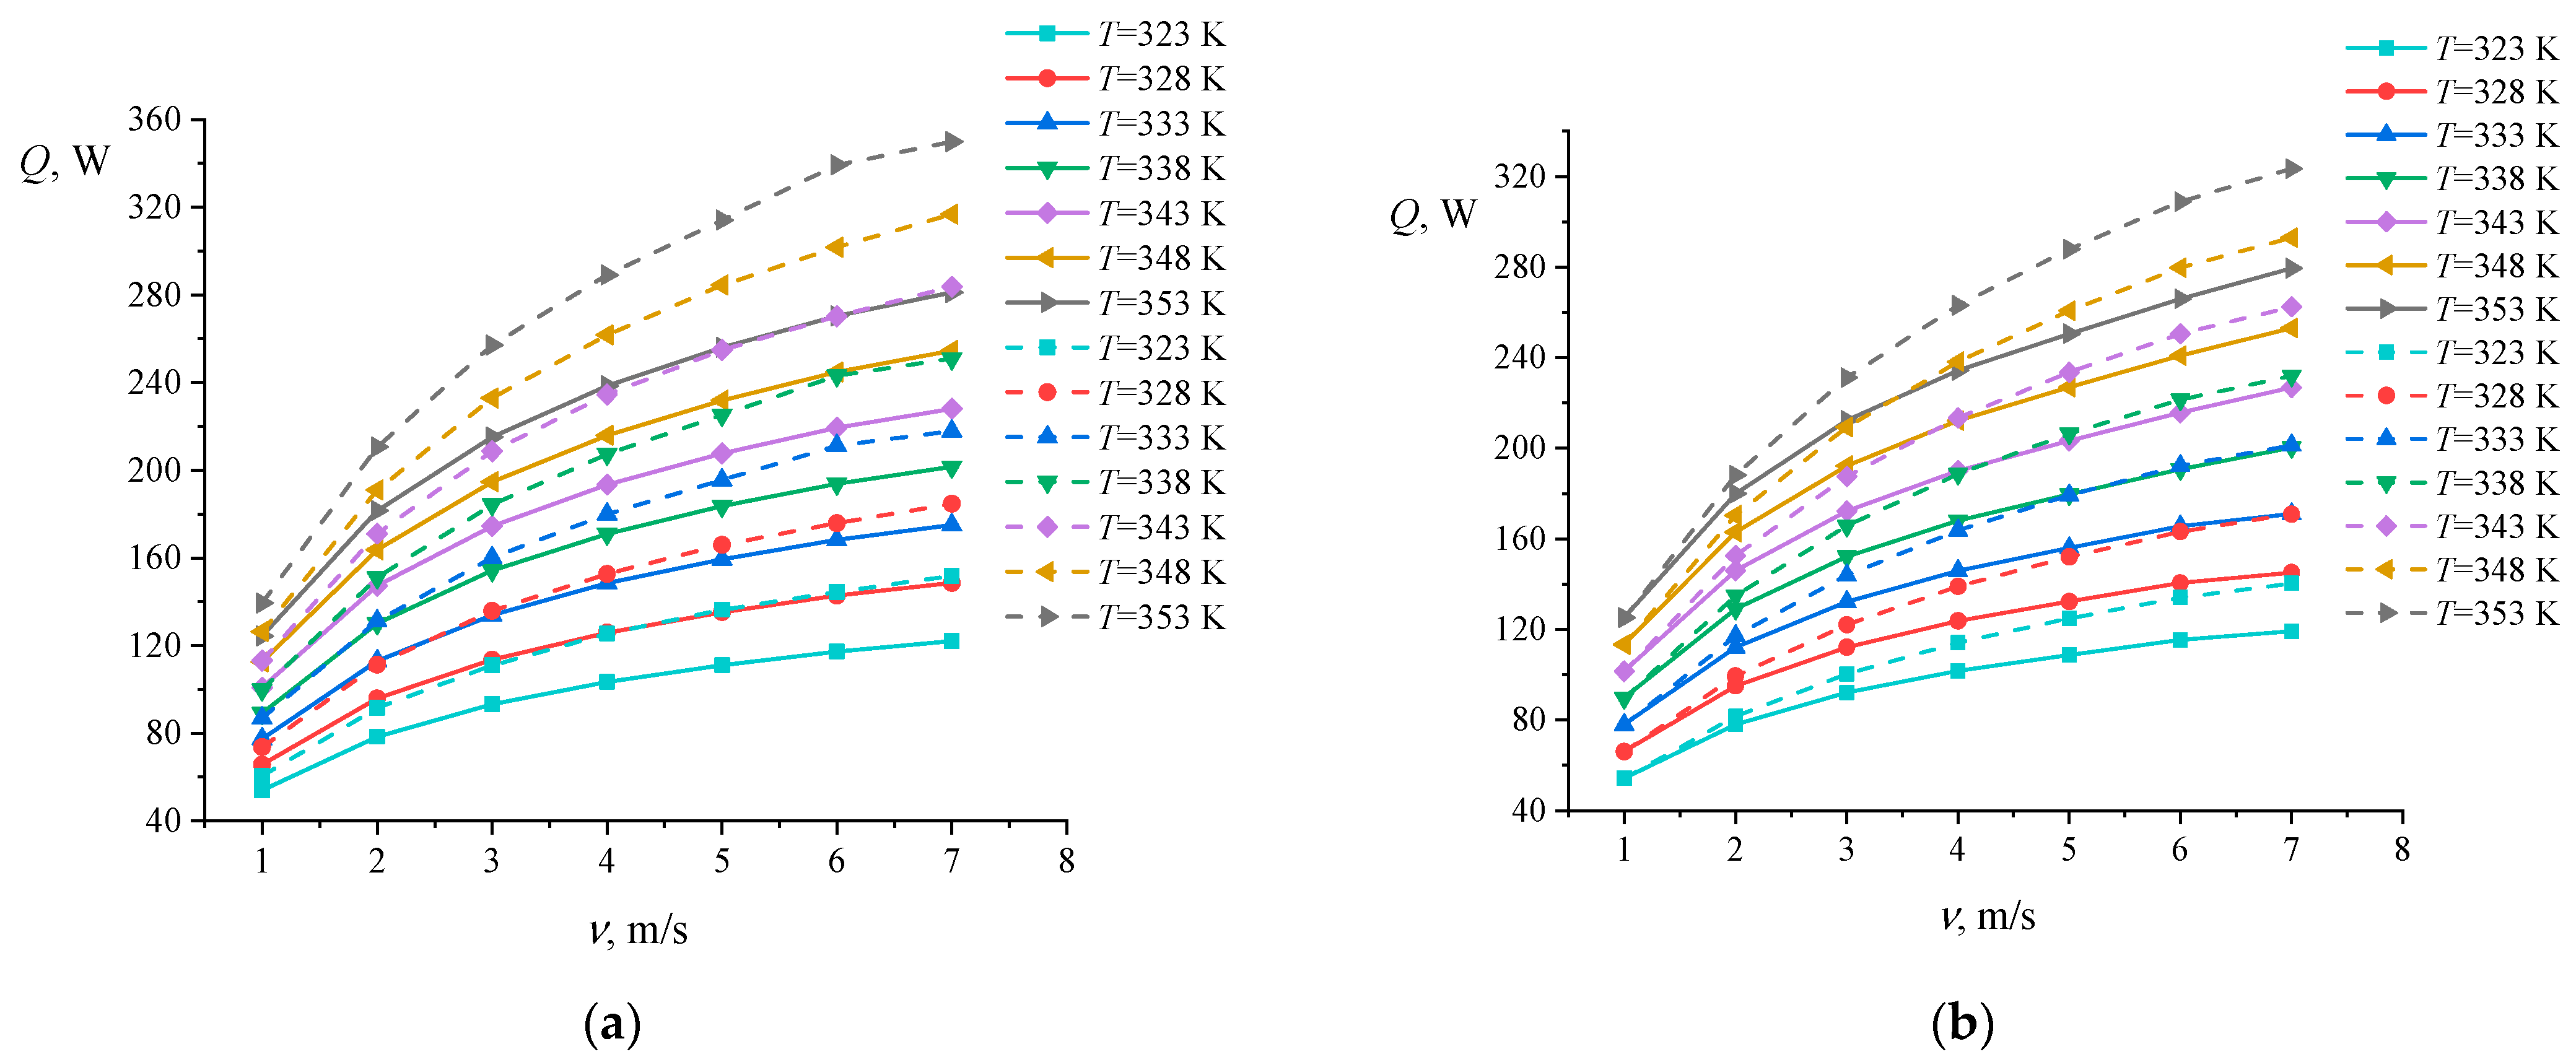
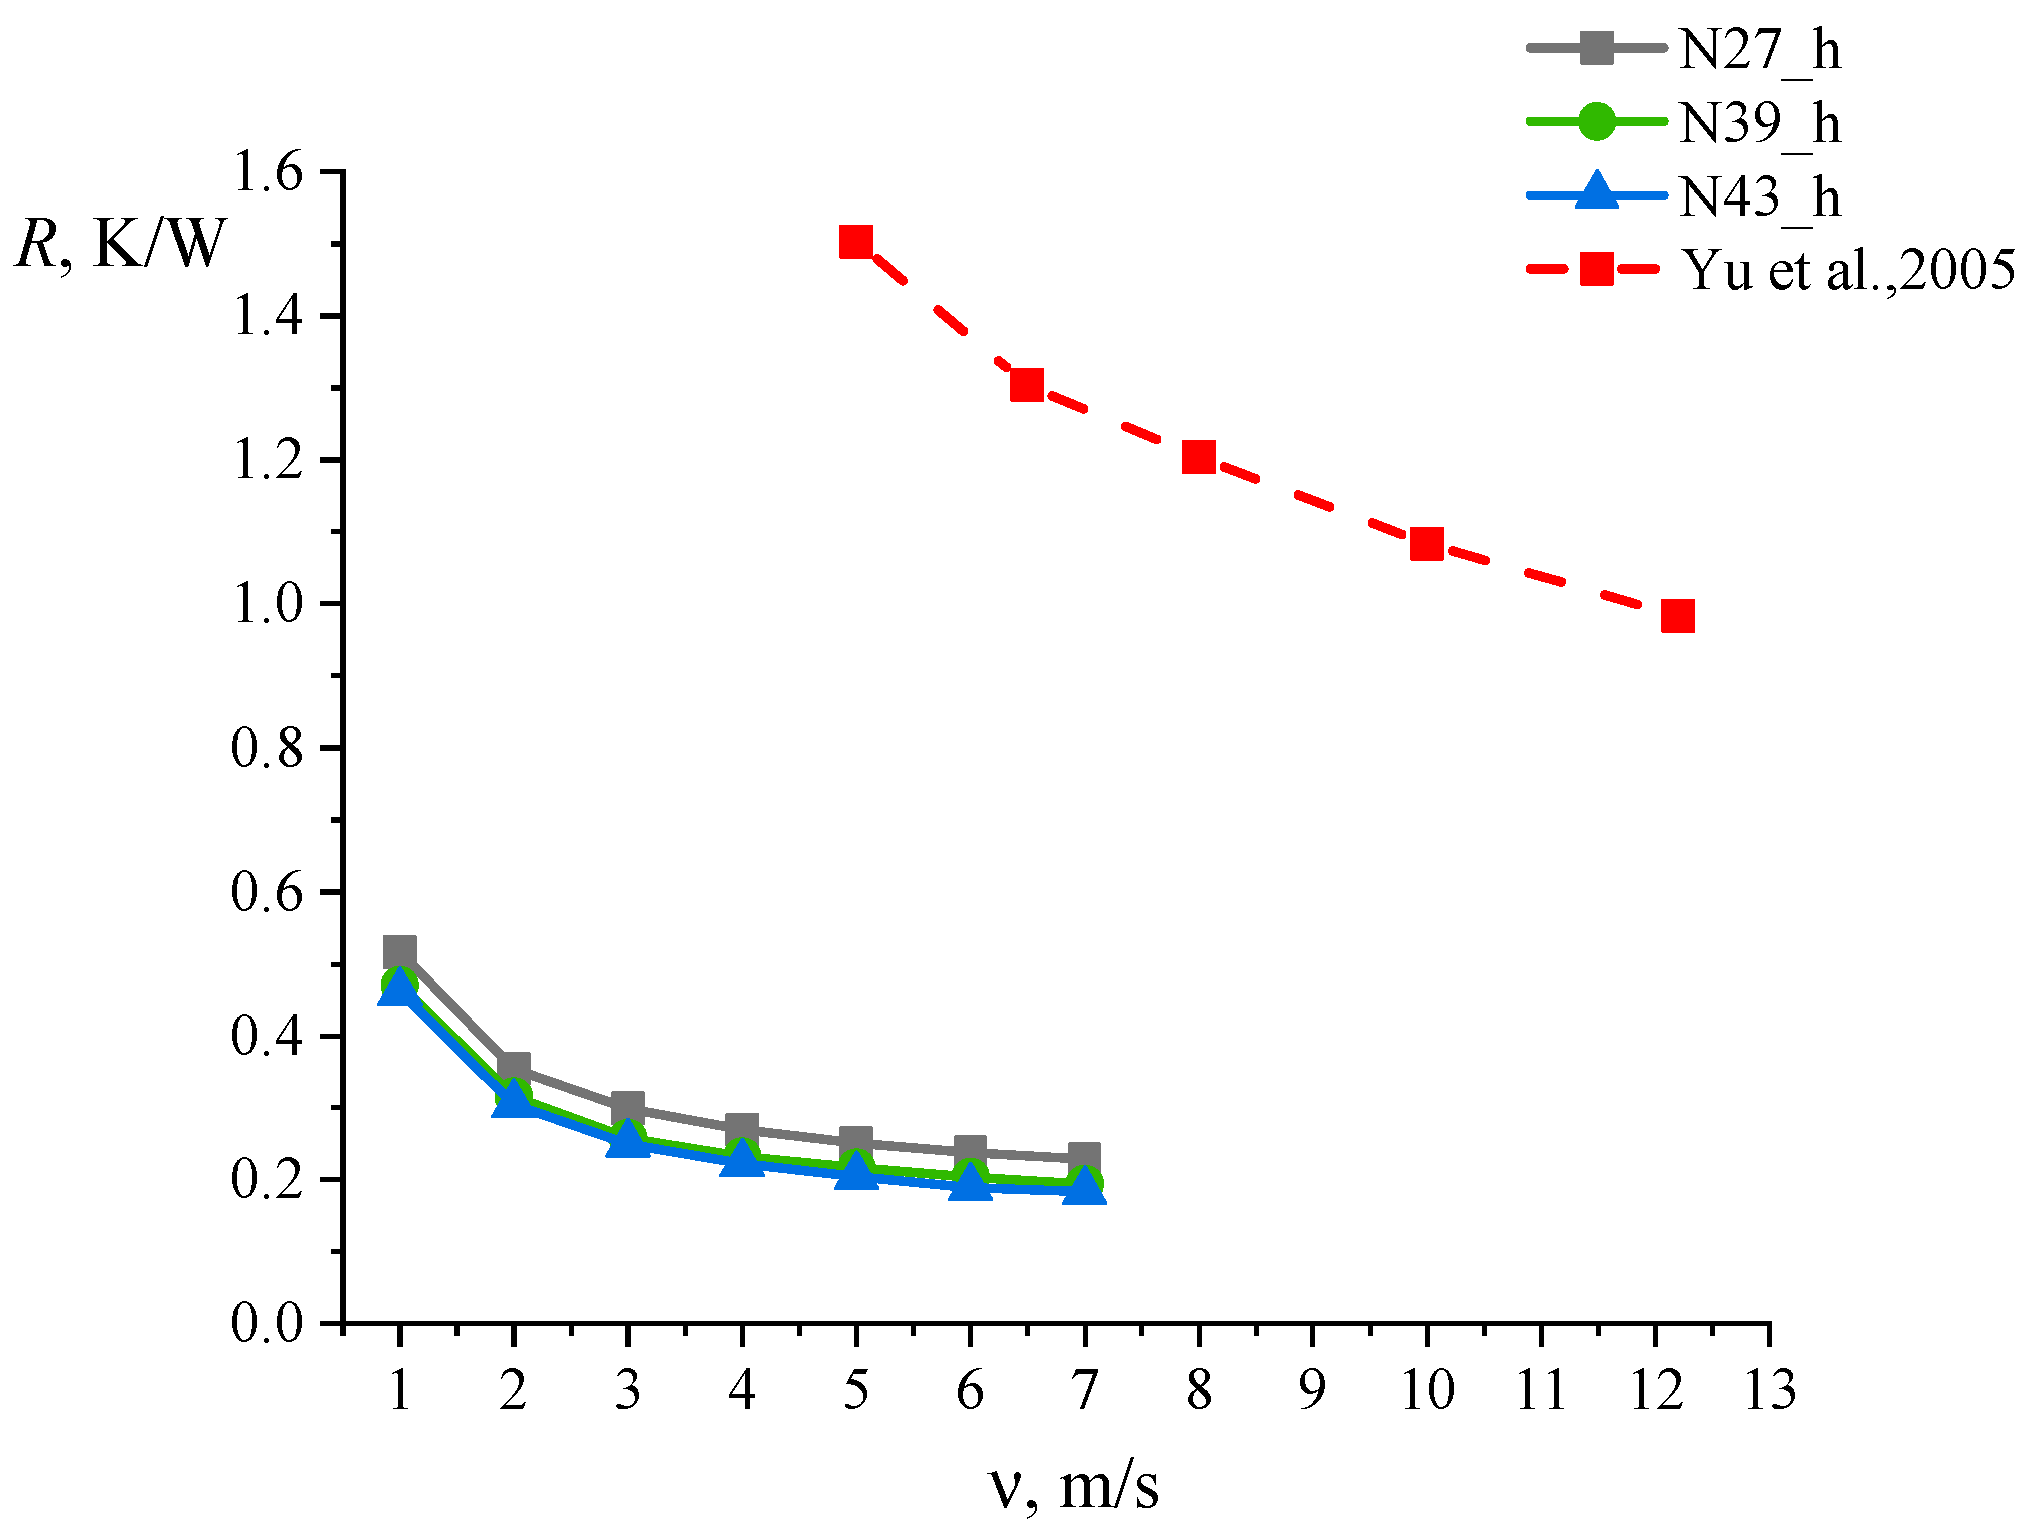
3.2. Effect of Heat Sink Geometry on Heat Flow

We conducted a comparative analysis of the heat flow for the N27 and N39 heat sink models (Figure 12), which have different sizes and metal volumes but a fixed surface area. In all investigated cases, the heat flow from N39 is higher than that from N27. With increasing heater temperature and air velocity, differences in heat flow values increase, reaching maximum values at T = 353 K and ν = 7 m/s. In this case, the heat flow from the N39 heat sink exceeds the heat flow from N27 by 17.76% (49.94 W) with horizontal airflow and by 10.74% (30.02 W) with vertical airflow.
We also conducted a comparative analysis of the heat flow for the N27 and N43 heat sinks (Figure 13), which have different surface areas and sizes, but a fixed volume of metal. In all the cases studied, the heat flow from the N43 heat sink exceeds the heat flow from N27; the increase reaches 24.44% (68.72 W) with horizontal airflow and 15.74% (44 W) with vertical airflow (T = 353 K, ν = 7 m/s).

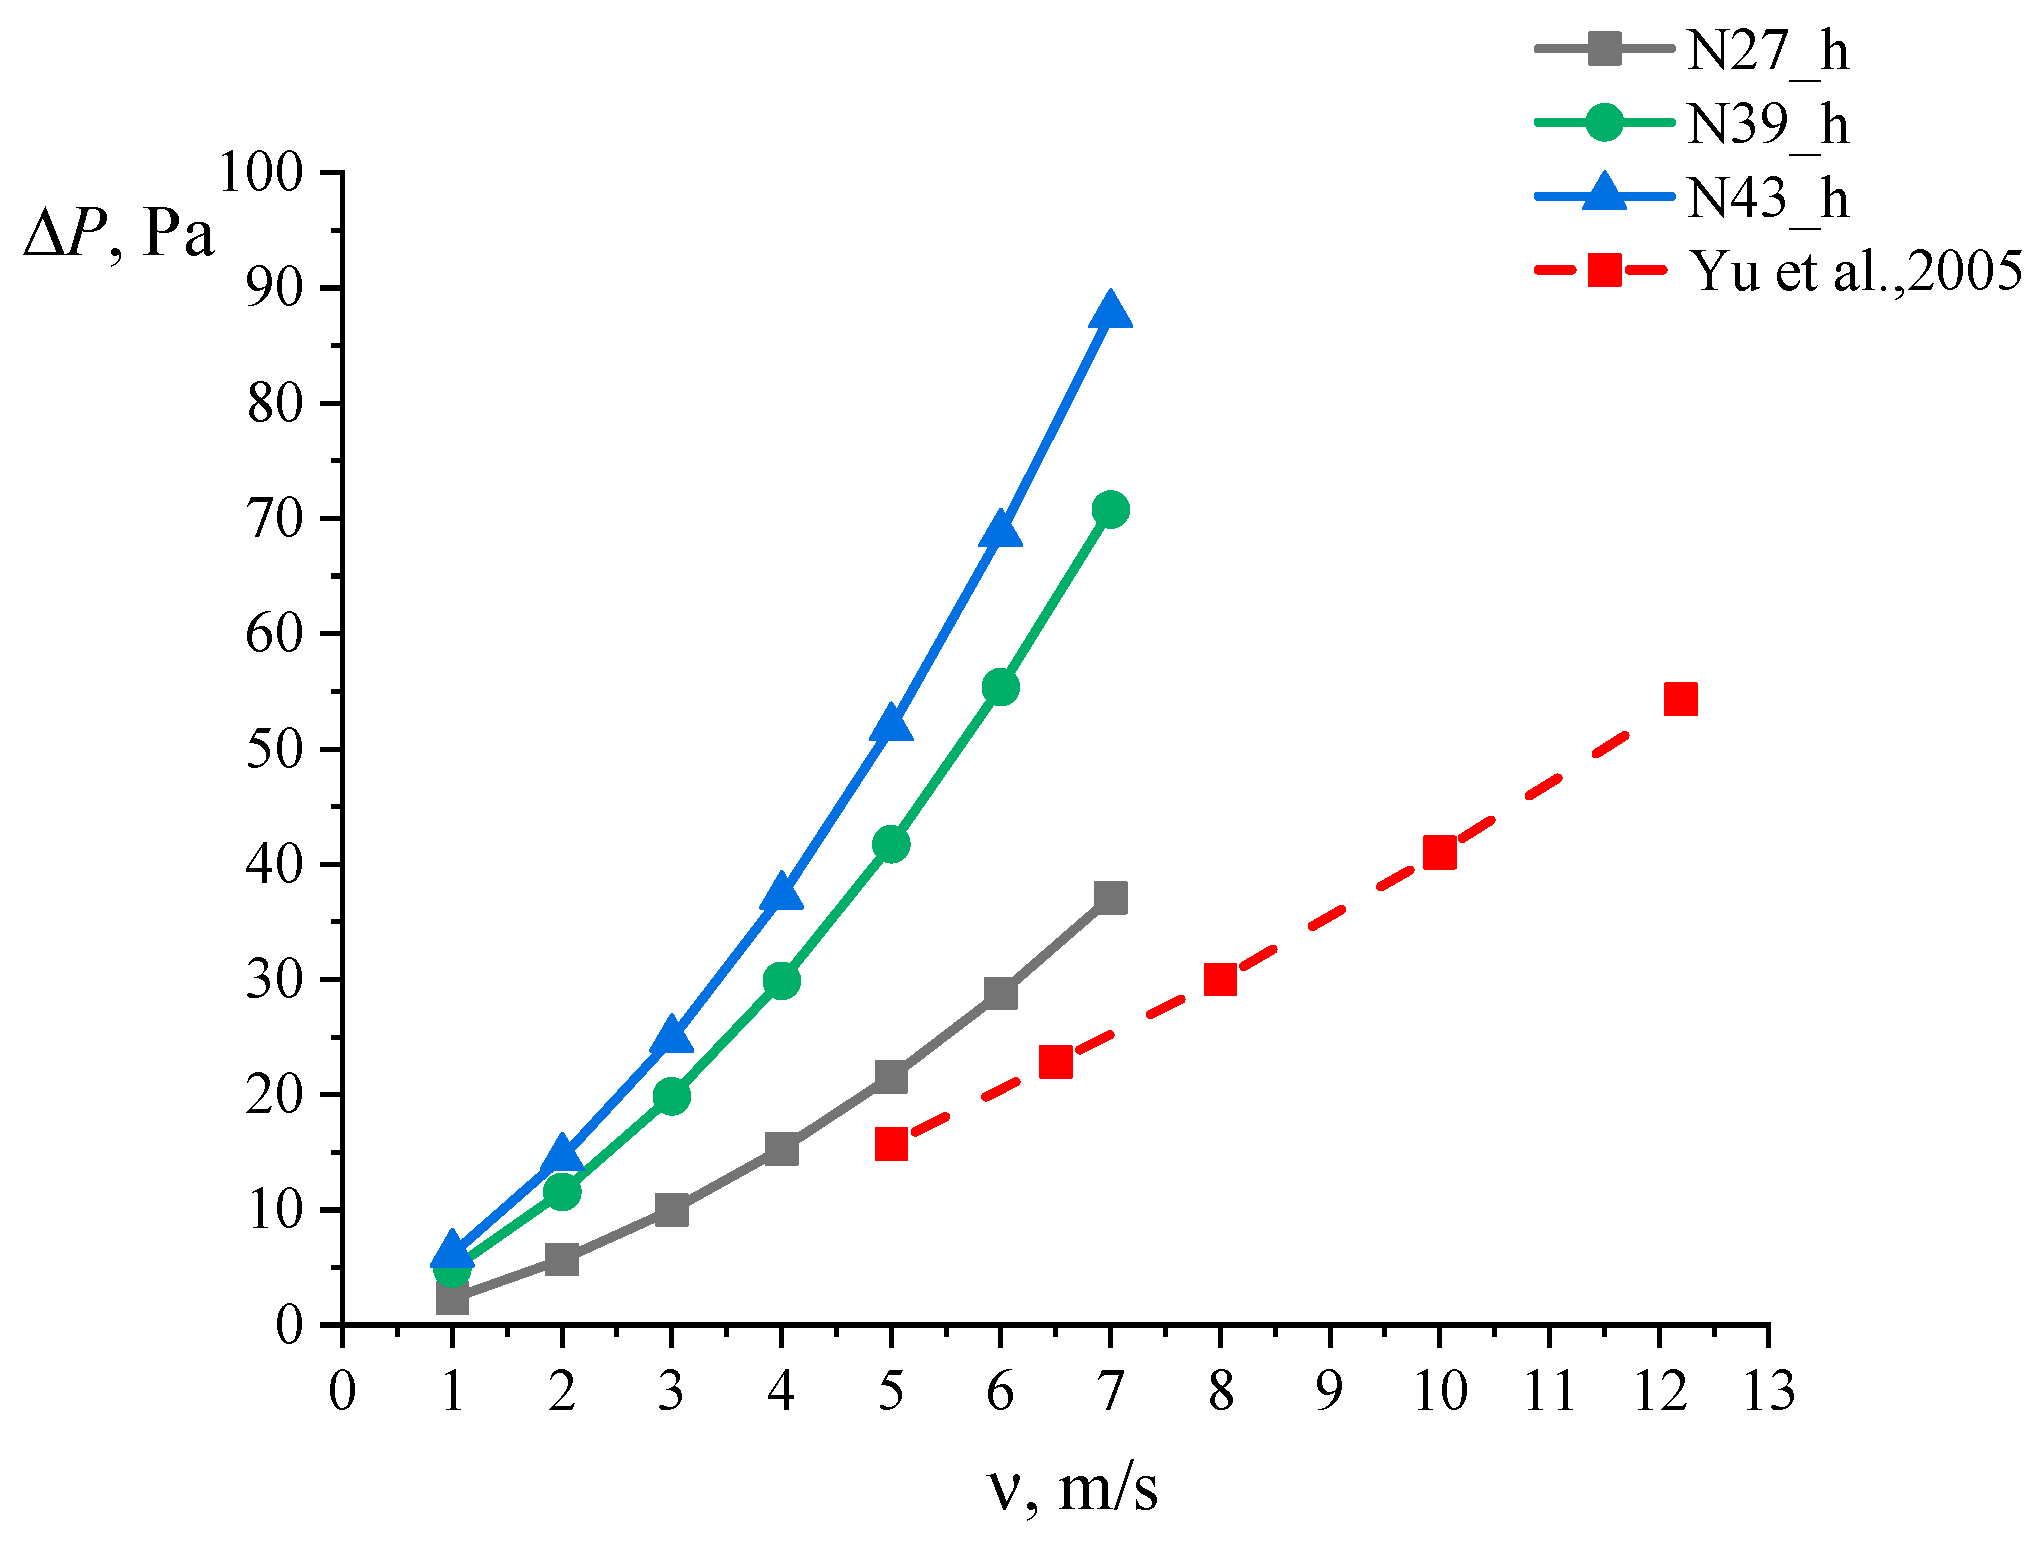
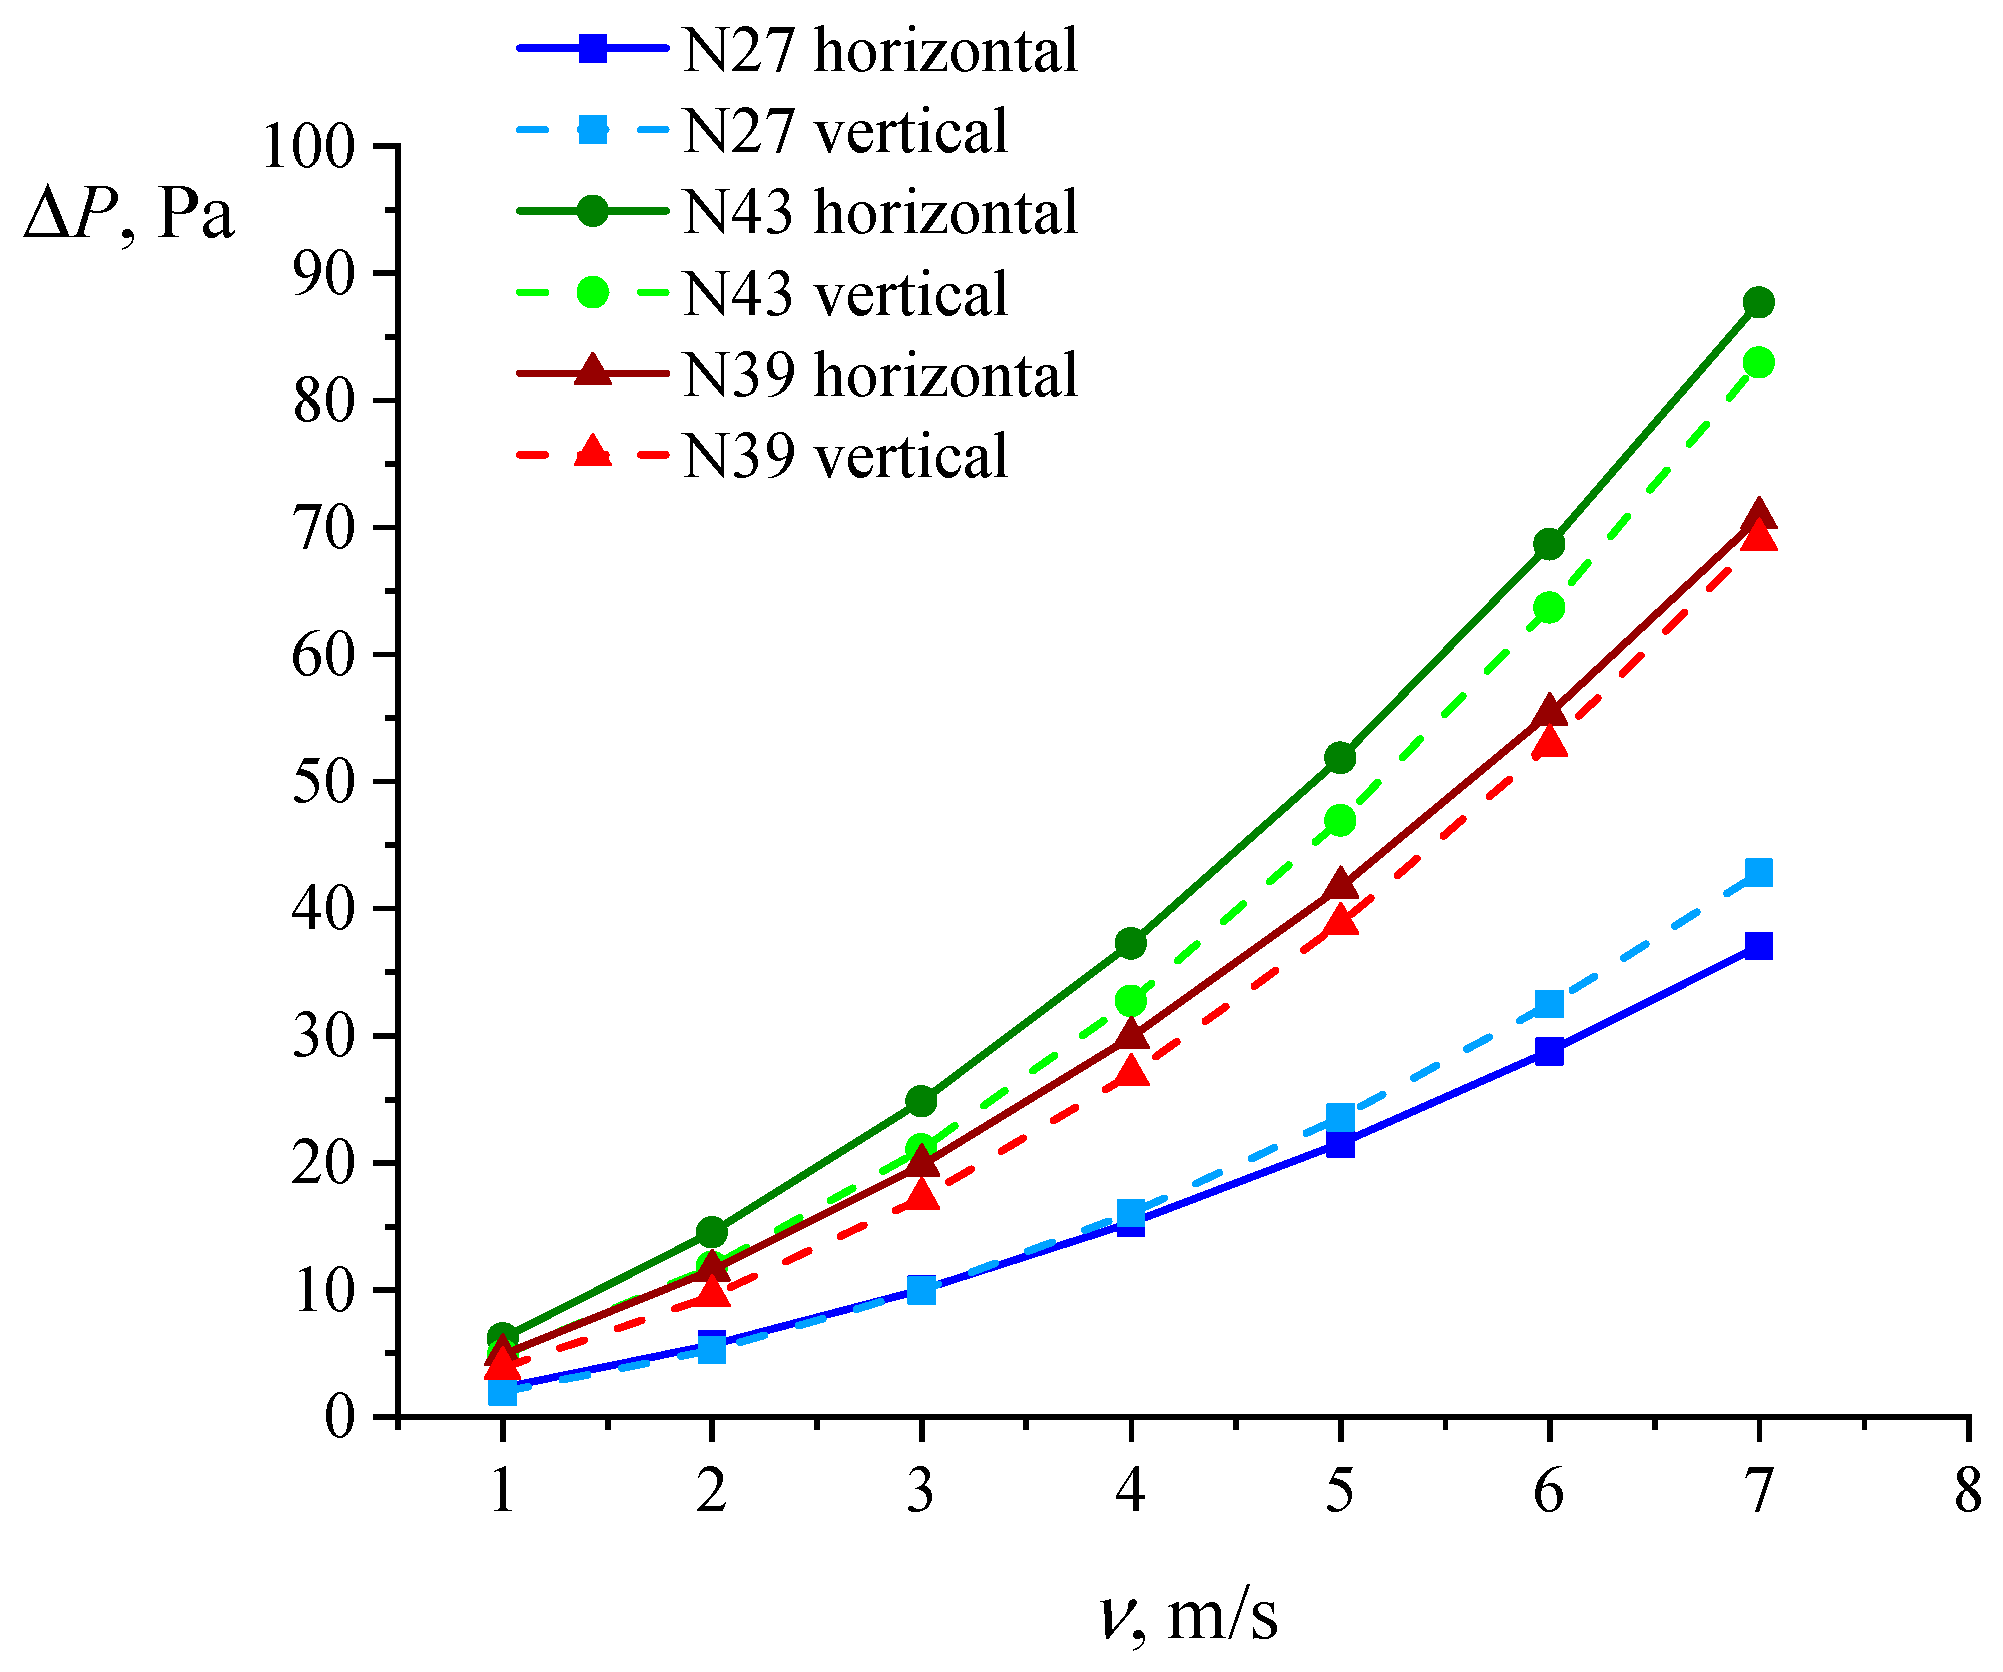
3.3. Effect of Heat Sink Geometry and Fan Position on Pressure Drop

In order to assess the influence of the blowing direction and heat sink geometry on hydrodynamics, we carried out pressure drop calculations. The results are presented in Figure 14. From the graphs, we can see that at air velocities from 1 to 3 m/s, a lower pressure drop occurs with vertical airflow. This is true for all the heat sink models studied. At higher air velocity values in models N39 and N43, a lower pressure drop is still observed with vertical airflow, and in model N27, a lower pressure drop is observed with horizontal airflow. The highest pressure drop is observed in the N43 heat sink and is 87.71 Pa with vertical airflow at an air velocity of 7 m/s. N27 has the lowest pressure drop of 37.07 Pa at ν = 7 m/s. With a fixed volume of metal (models N27 and N43), the pressure drop is higher in N43 by 136.61% with horizontal airflow and by 93.80% with vertical airflow (ν = 7 m/s). With a fixed surface area (models N27 and N39), the pressure drop is higher in N39 by 90.94% with horizontal airflow and by 61.29% with vertical airflow (ν = 7 m/s). Models N39 and N43 have a smaller distance between the fins and, accordingly, have greater resistance to air flow. This explains why the pressure drop in these models is higher than in the basic model N27.

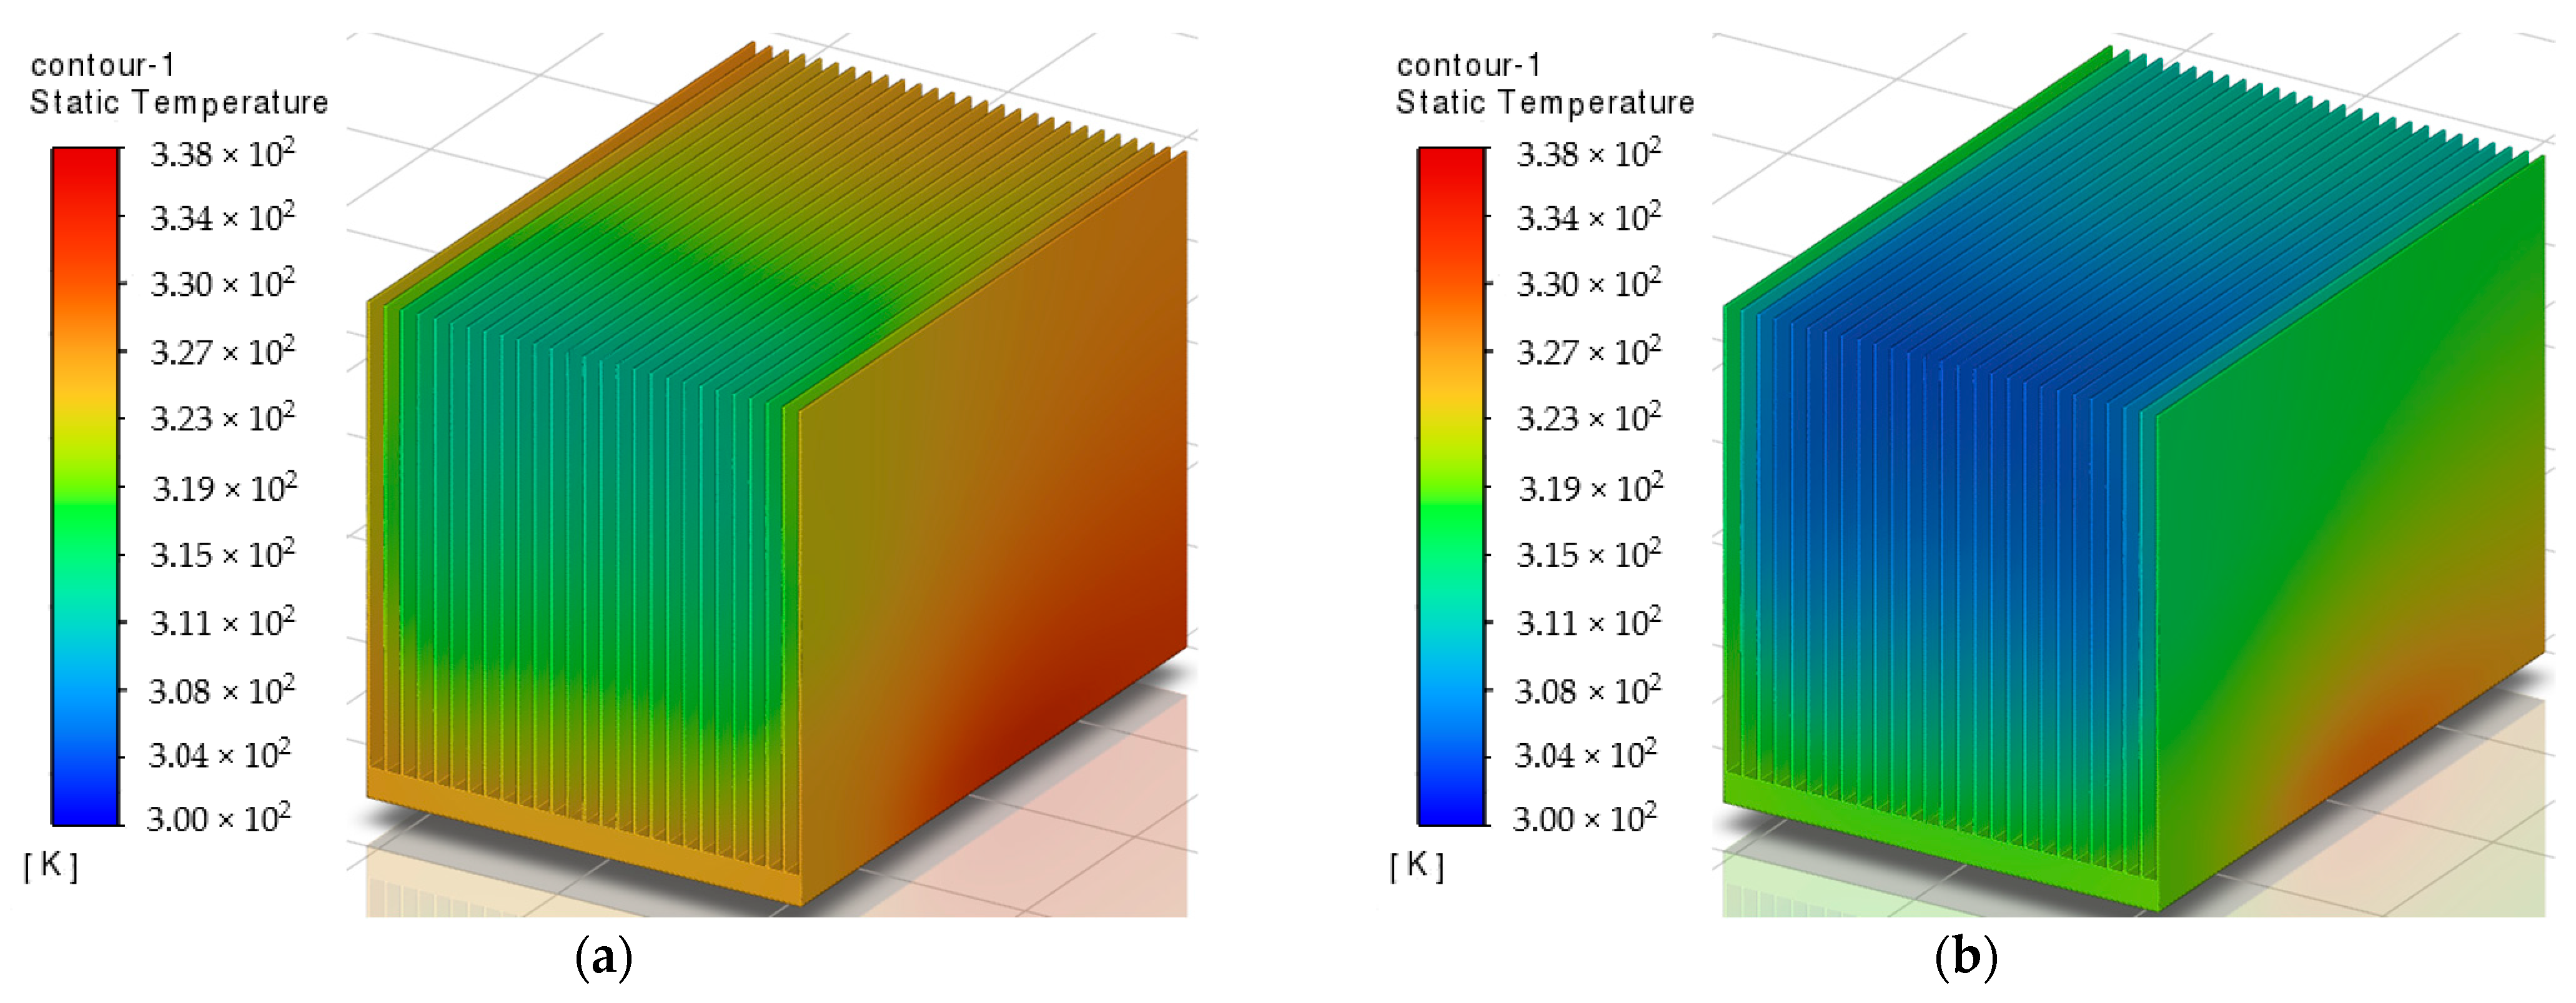
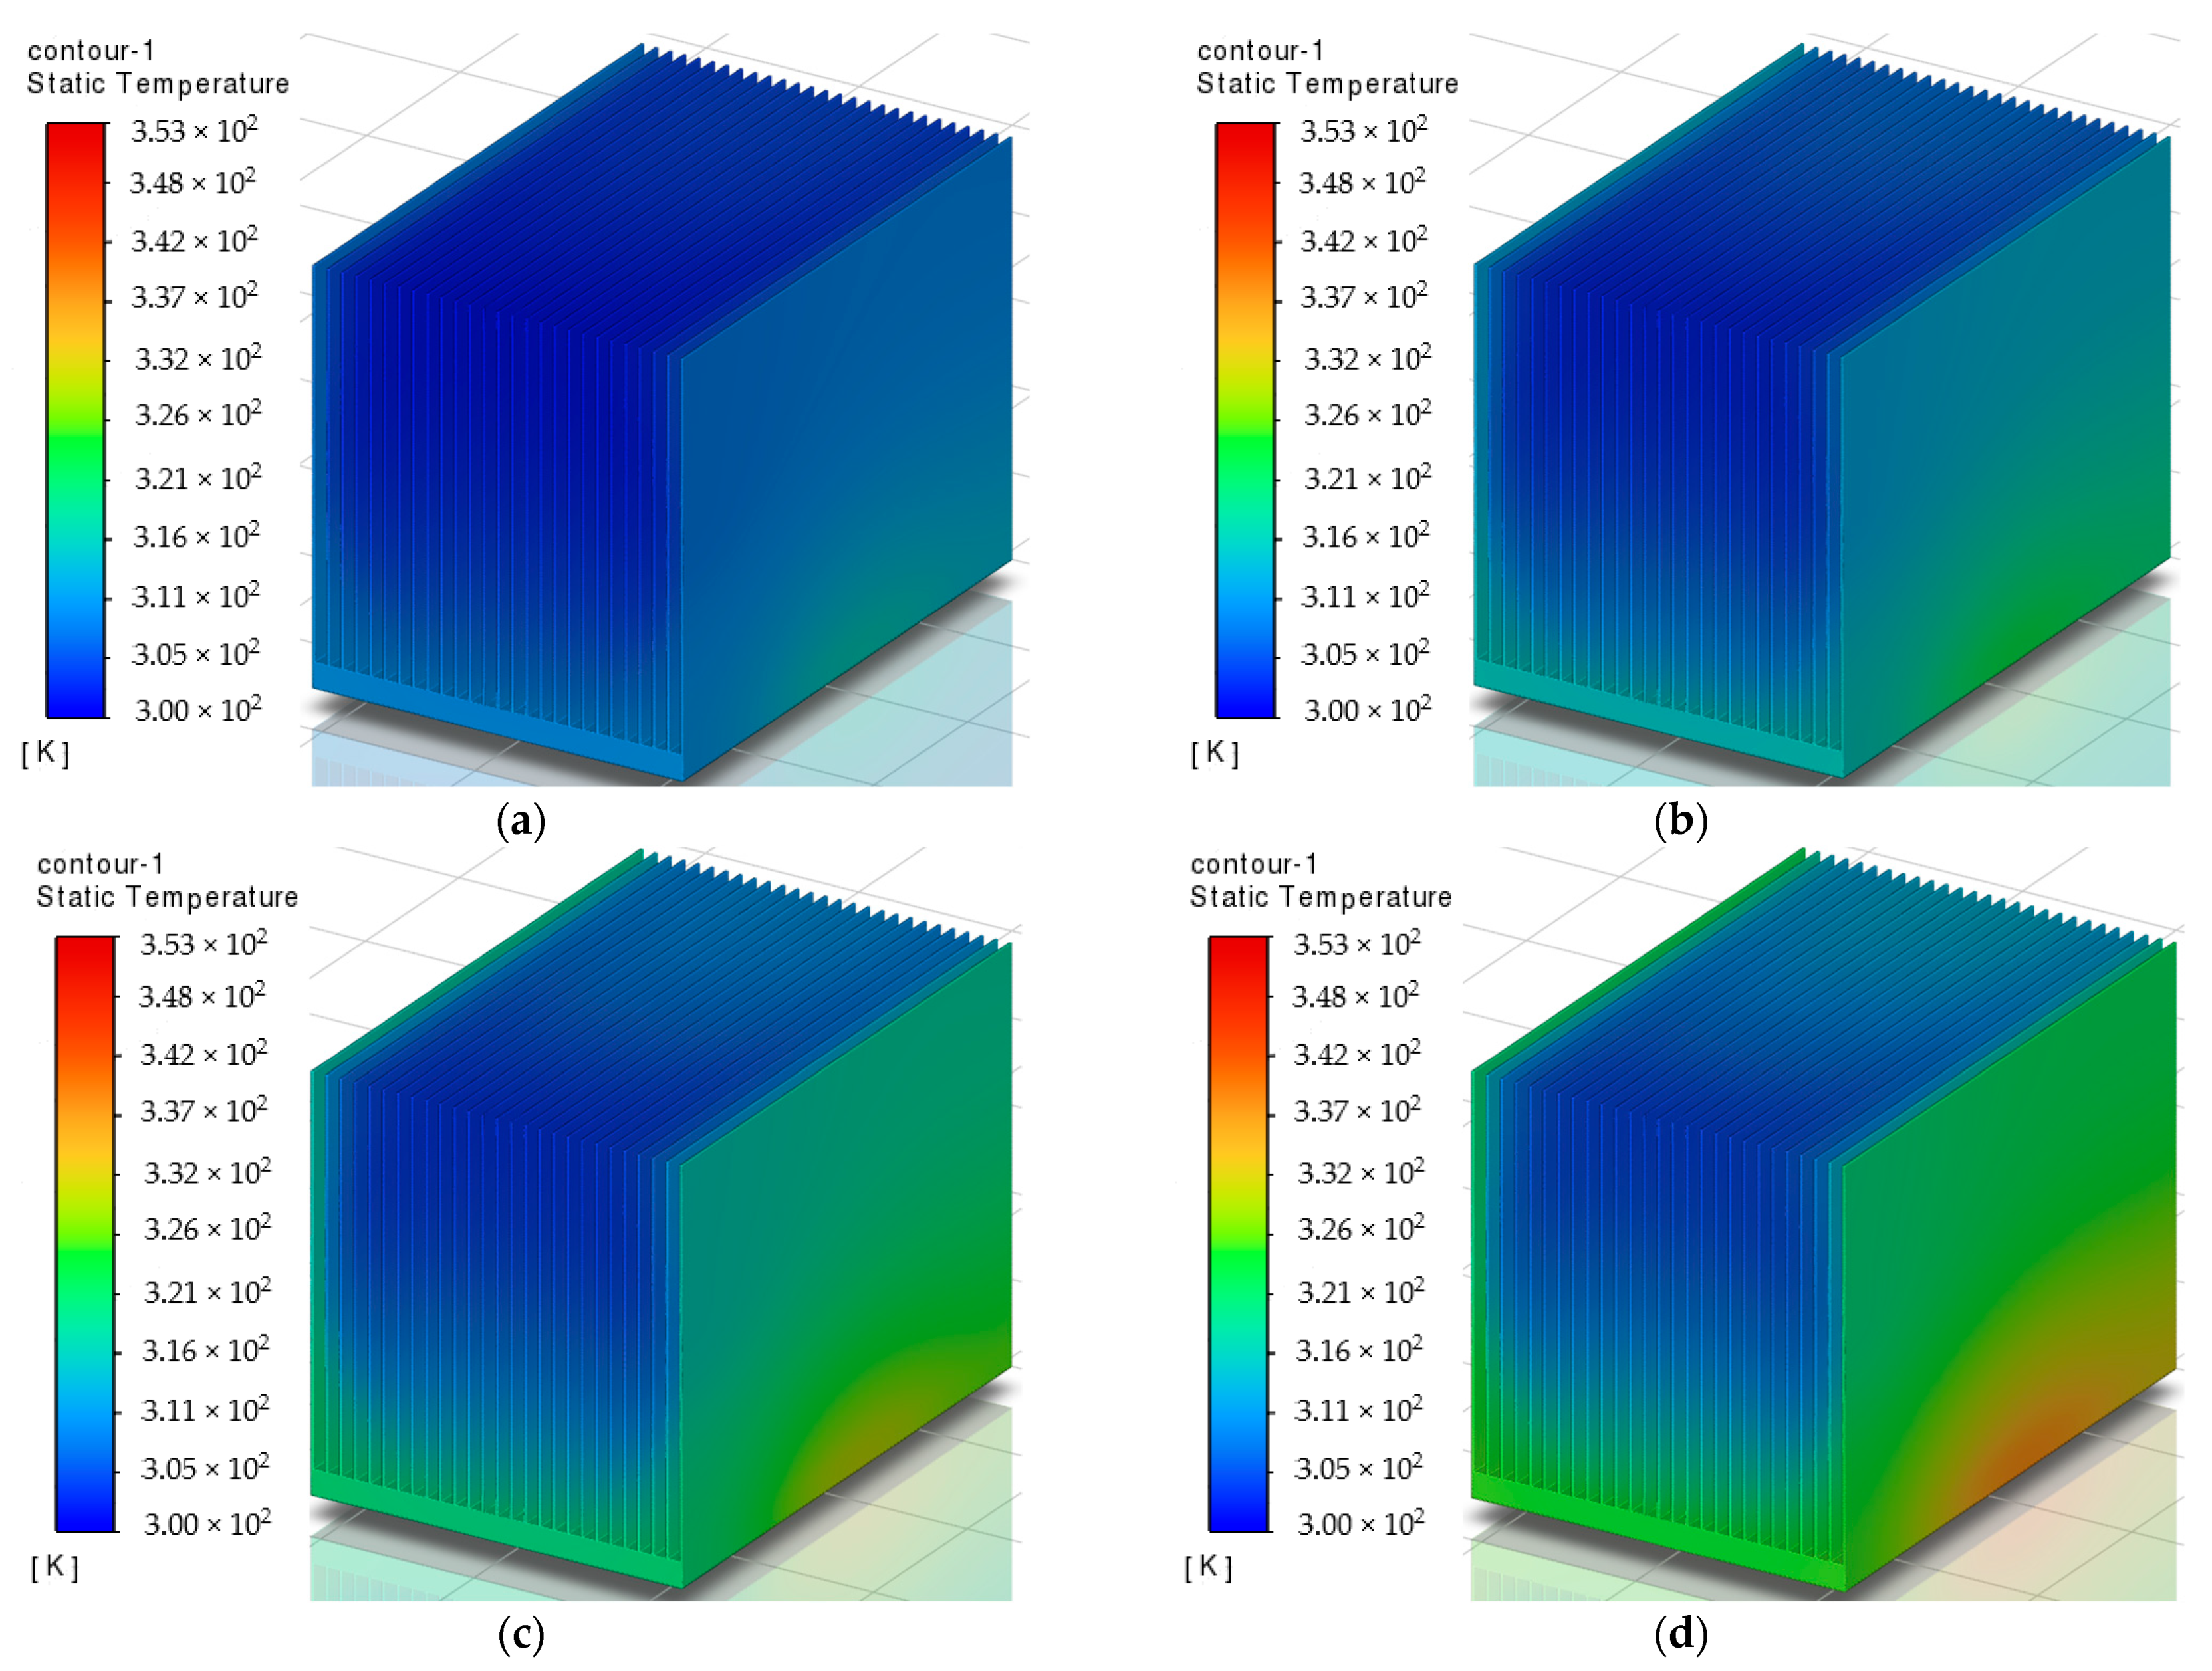
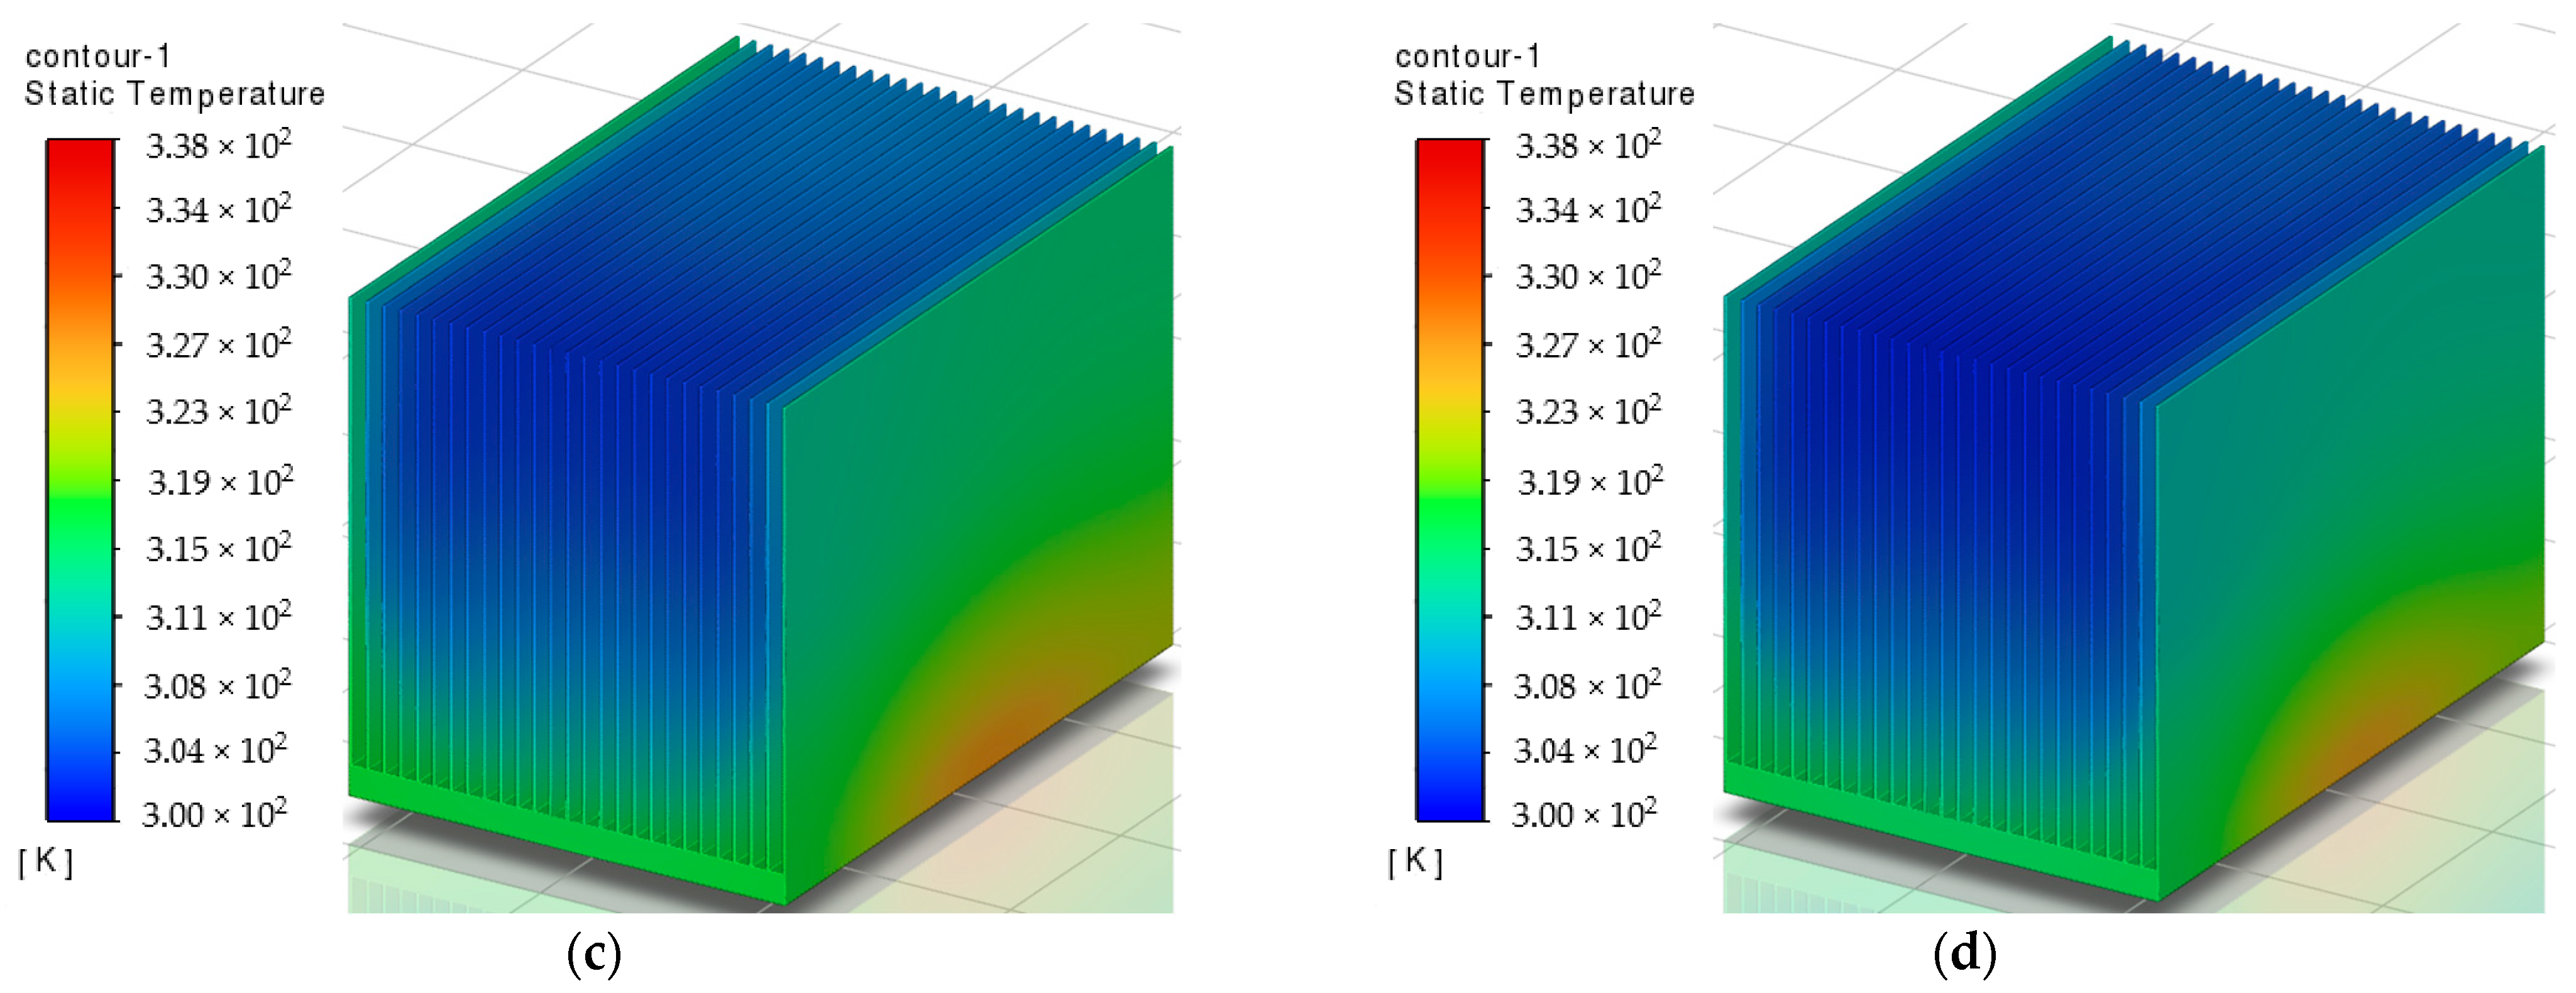
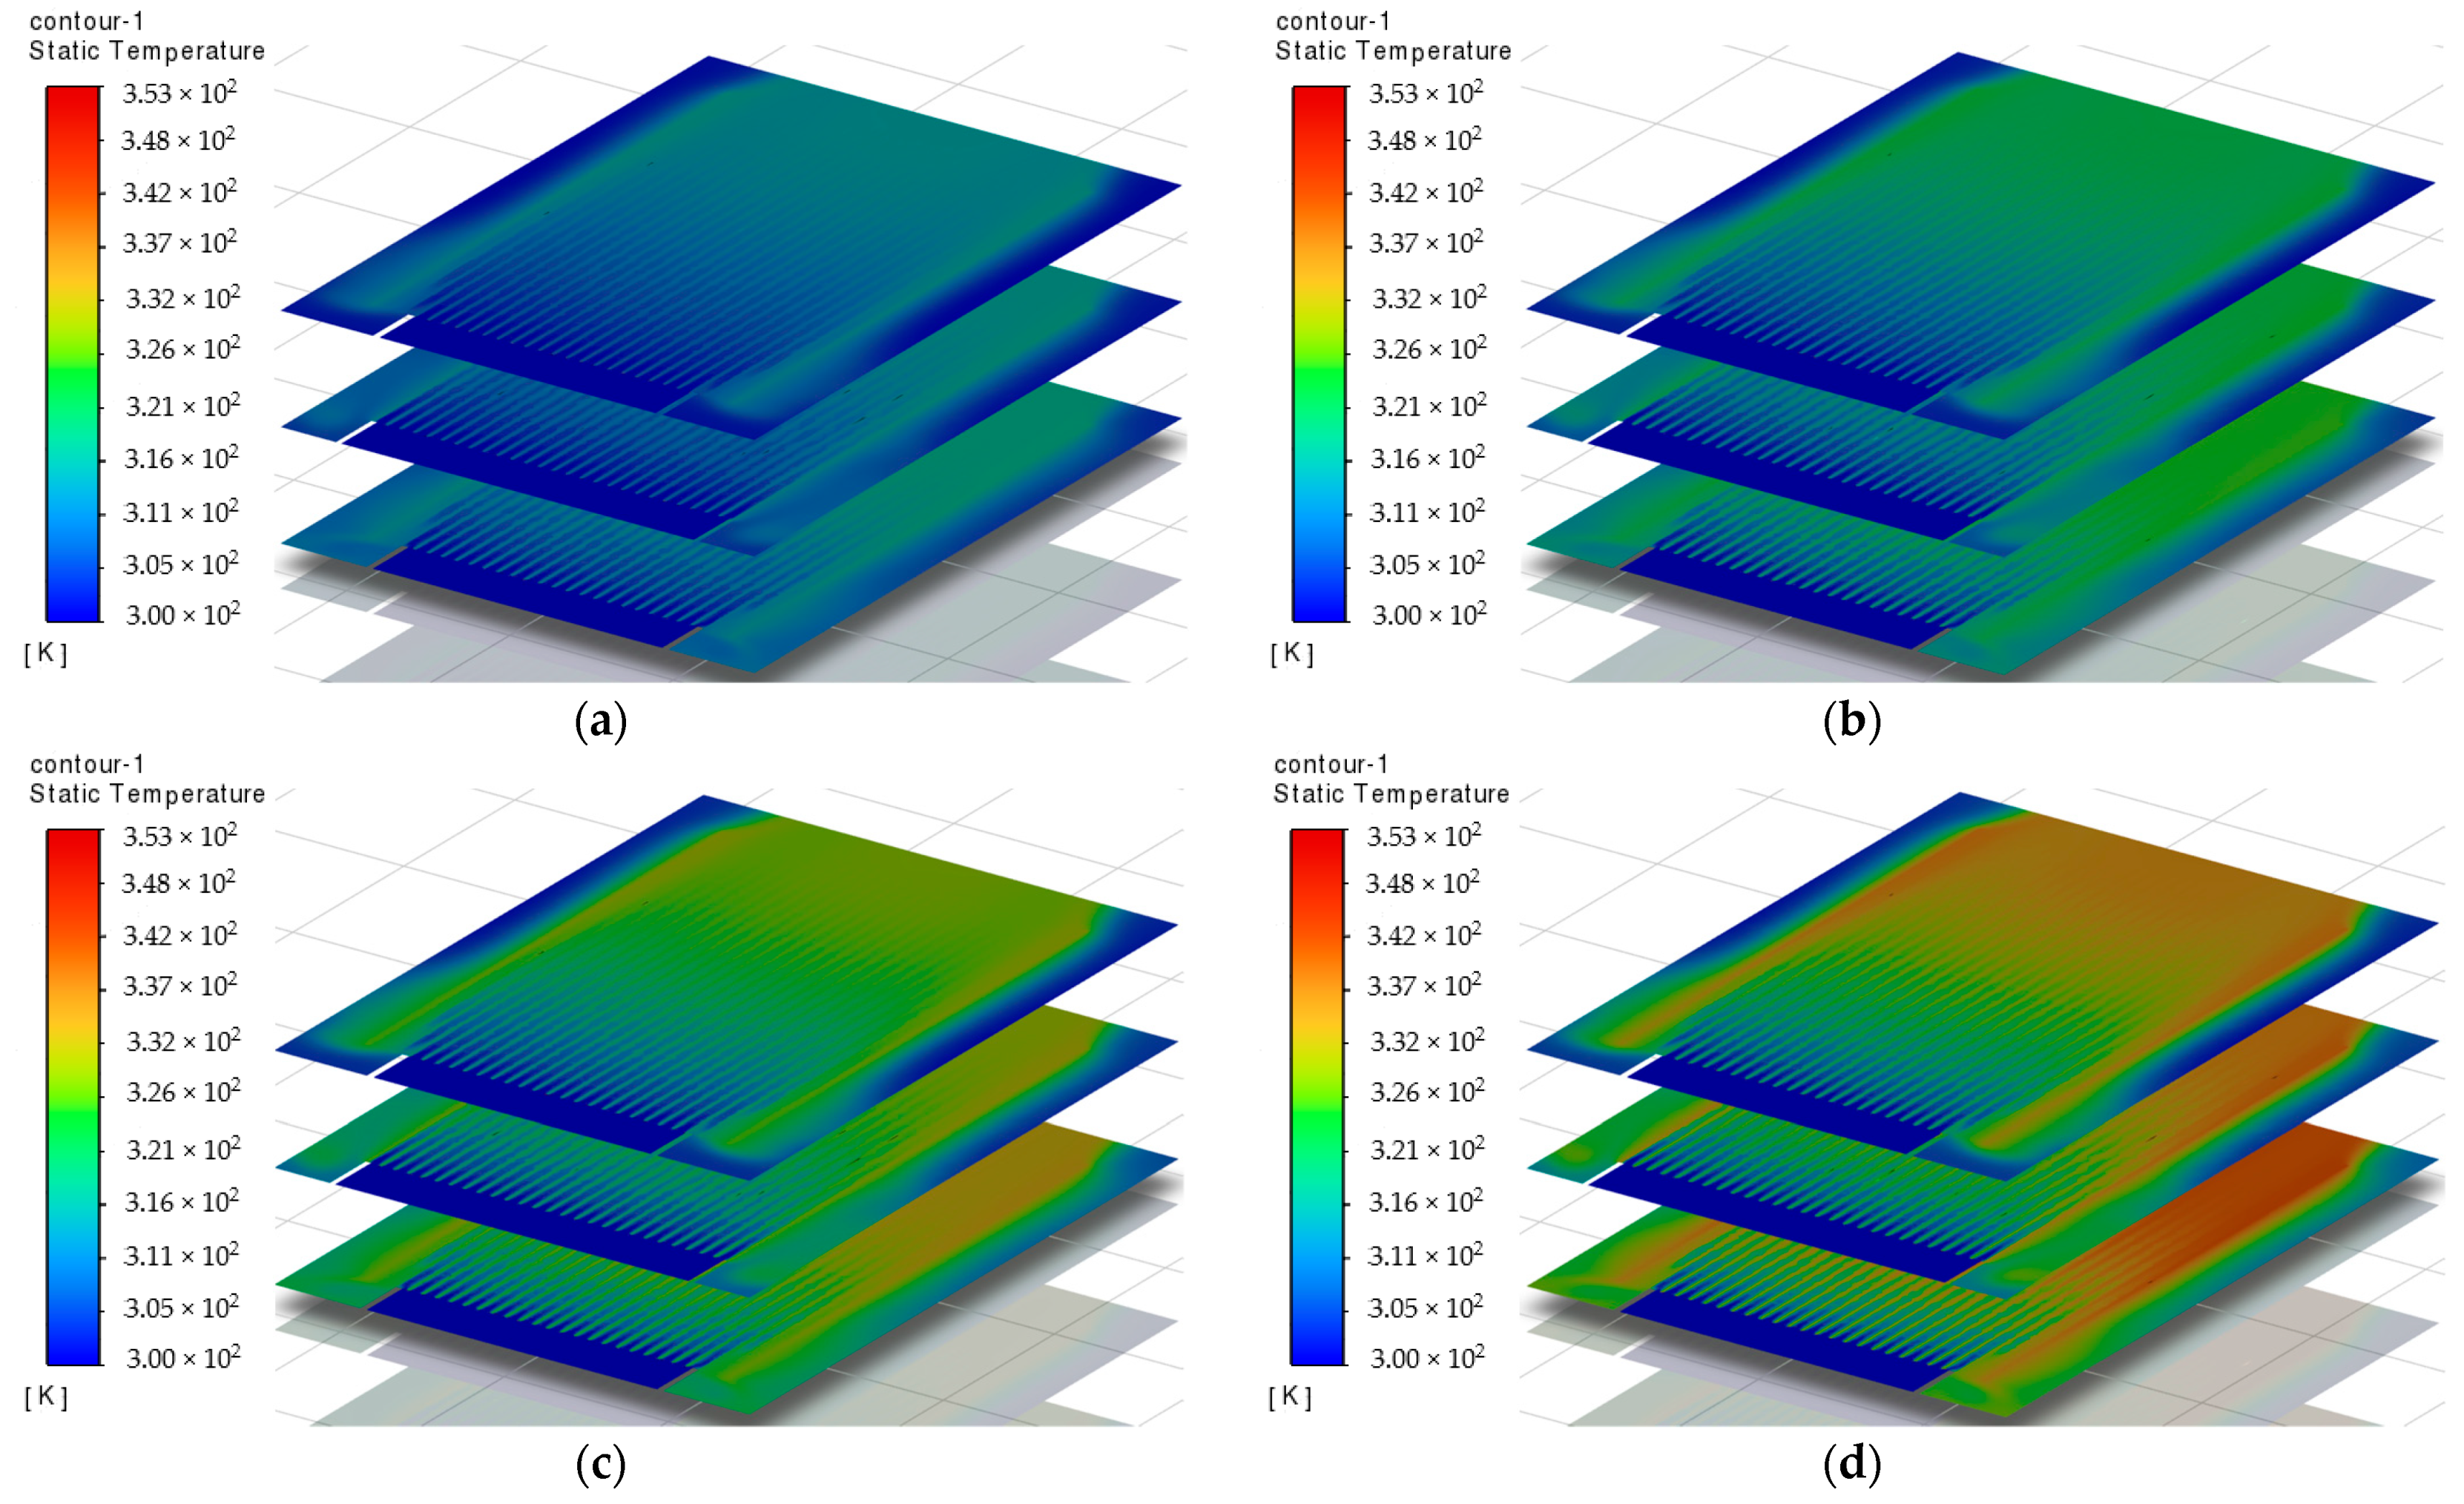
3.4. Temperature Fields

Figure 15 shows the temperature fields of heat sink N27 in the case of horizontal airflow. The fields are shown for a fixed air velocity of 4 m/s and heater temperatures of 323, 333, 343, and 353 K. As we can see, an increase in the heater temperature results in a noticeable increase in the temperature of the base of the heat sink and its side fins. The central part of the heat sink maintains a temperature close to the temperature of the air flow.
Figure 16 shows the temperature fields of heat sink model N27 for horizontal airflow with a fixed heater temperature of 338 K and air velocity of 1, 3, 5, and 7 m/s. The temperature field of the heat sink changes significantly, and as the air velocity increases, the heat sink cools more efficiently.
Figure 17 shows the temperature distribution in several cross-sections of the N27 heat sink for the case of horizontal airflow at a fixed air velocity of 1 m/s and heater temperatures of 323, 333, 343, and 353 K. We notice that the average heat sink temperature is lower at the air inlet flow, and as we move away from the inlet, the average temperature gradually increases. The temperature of the heat sink also changes with height: closer to the base of the heat sink, its temperature is higher.

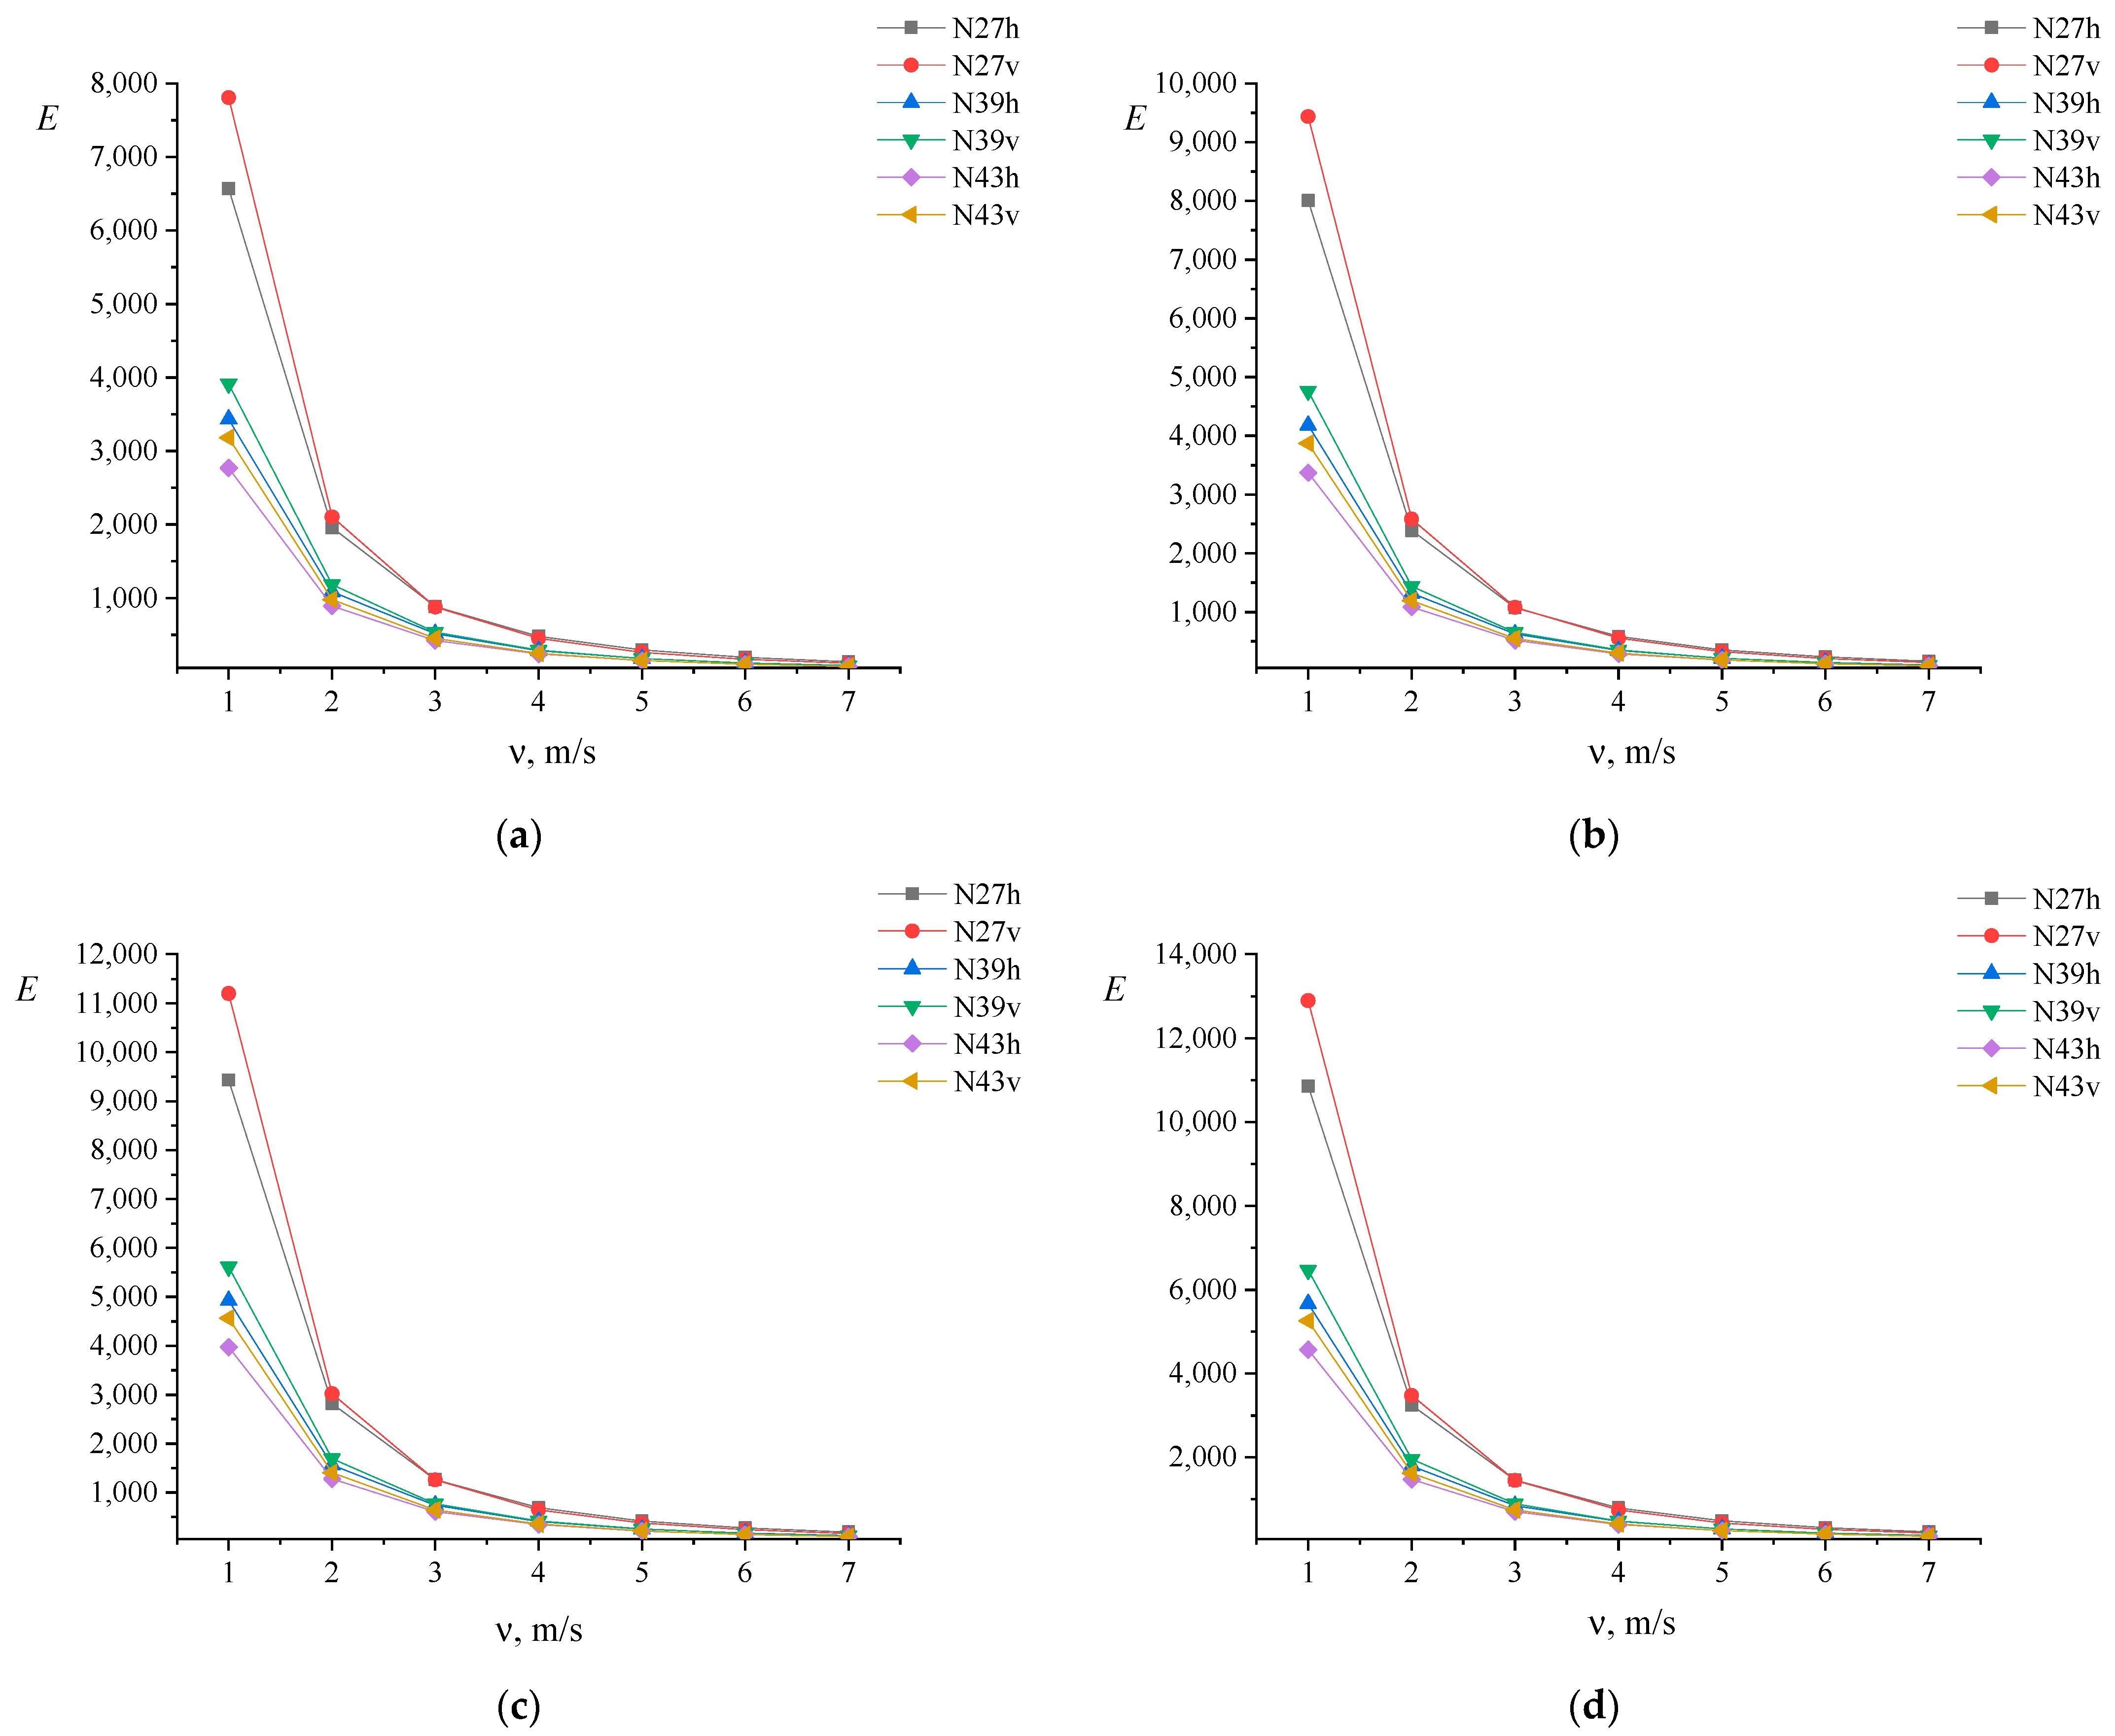
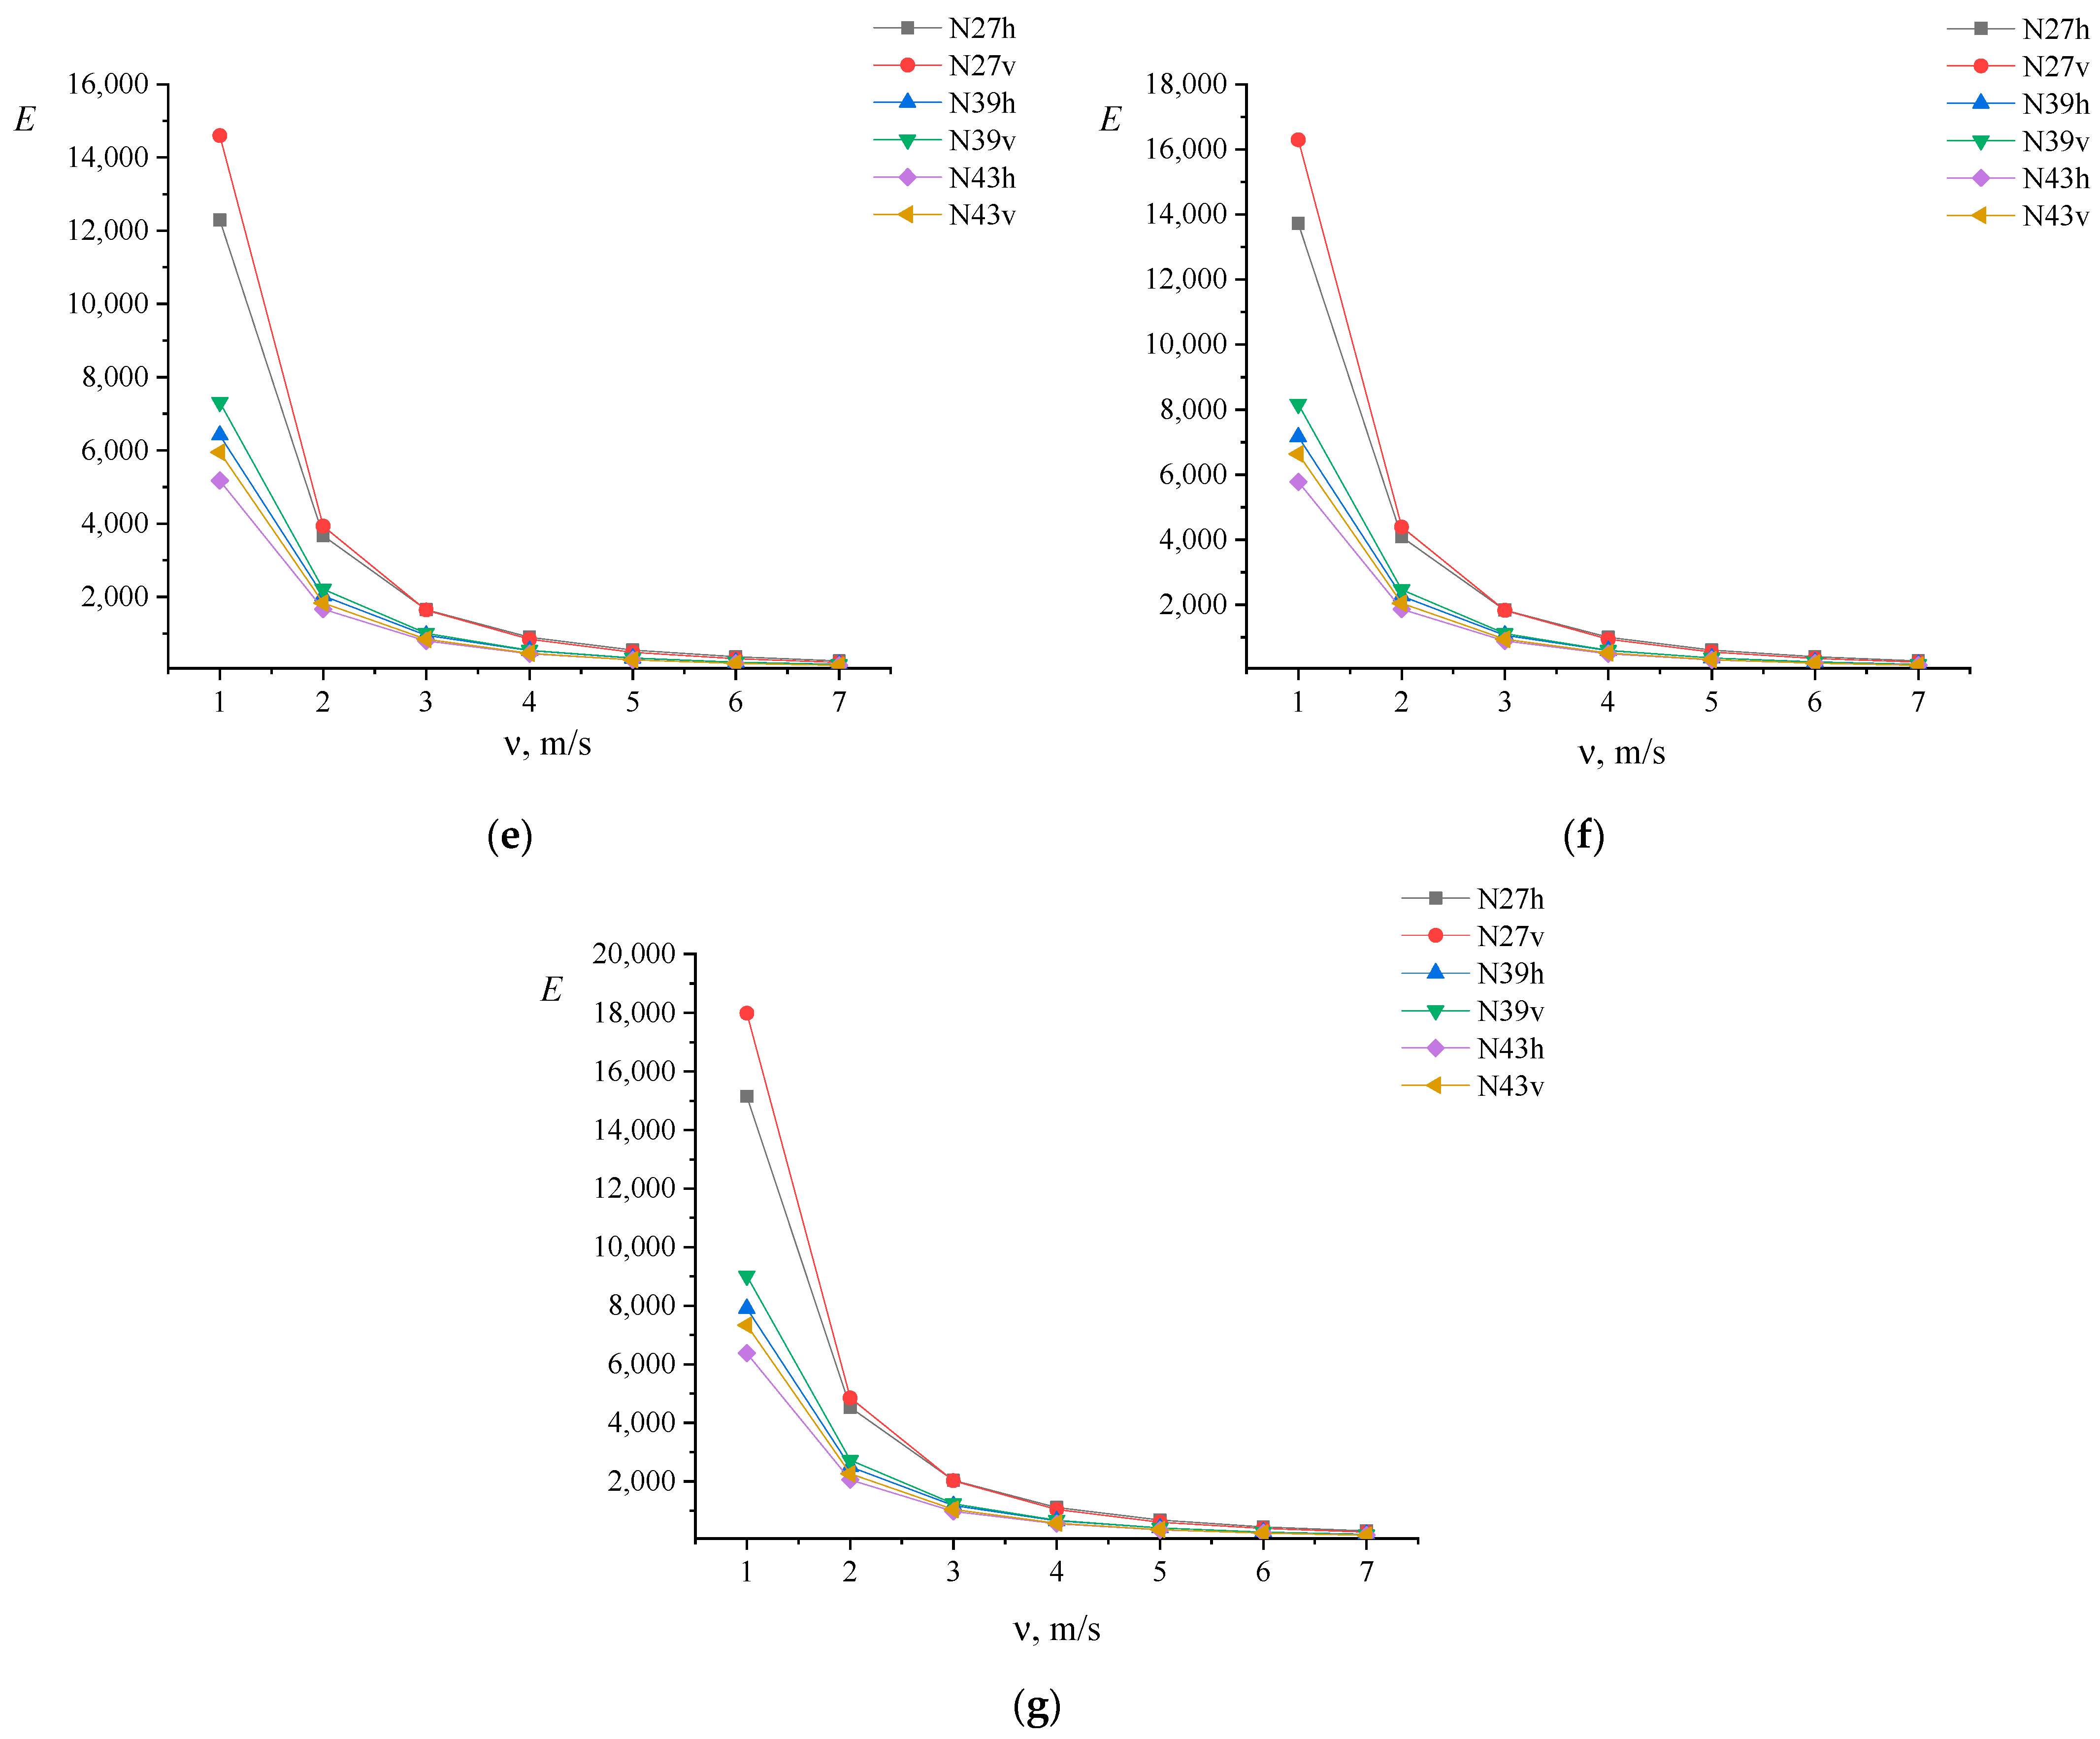
3.5. Energy Efficiency Indicator

The results of calculating the energy efficiency indicator E are presented in Figure 18. Calculations were made for the following heater temperatures: 323 K, 328 K, 333 K, 338 K, 343 K, 348 K, and 353 K. As we can see from the graphs, the base model N27 showed the highest energy efficiency in all the cases studied, while model N43 showed the lowest efficiency. Despite the lower values of heat flow observed in N27 compared to N39 and N43, it also showed a lower pressure drop, which explains the high E values of the N27 heat sink. The maximum increase in heat flow from the N39 and N43 heat sinks in comparison to N27 was 17.76% and 24.44%, respectively, while the increase in pressure drop was 90.94% and 136.61%. As we can see, the increase in pressure drop is much higher than the increase in heat flow. This explains why the N39 and N43 heat sinks are less efficient than N27. The maximum energy efficiency indicator values are achieved at a velocity of 1 m/s. In this case, the E value of the N27 heat sink exceeds the E value of N39 by 91.66%, and N43 by 137.63% (horizontal airflow, T = 353 K). For vertical airflow, the E value of N27 exceeds the E value of N39 by 99.53%, and N43 by 145.36% at T = 353 K. The smallest differences in the energy efficiency indicator values are achieved at a velocity of 7 m/s. In this case, the energy efficiency of the N27 heat sink exceeds the energy efficiency of N39 and N43 by 62.04% and 90.18% with horizontal airflow, respectively, and by 43.11% and 64.53% with vertical airflow (at T = 323 K).
It should be noted that at air velocities of 1 and 2 m/s, the N27 heat sink demonstrates greater efficiency values with vertical airflow. The difference is 18.74% and 7.12%, respectively, at T = 353 K. At high air velocities (from 3 to 7 m/s), horizontal airflow is 0.73–16.21% more effective at T = 353 K. For N39 and N43 heat sinks, vertical airflow is more effective in the range of air velocities from 1 to 5 m/s. At T = 353 K, the values of E with vertical blowing of heat sinks N39 and N43 are 14.04–0.27% and 14.98–1.24% higher, respectively, than with horizontal blowing. These values decrease with increasing air velocity. At higher air velocities (6 and 7 m/s), the E values are higher with horizontal airflow by 1.61% and 4.39%, respectively, for the N39 heat sink, and by 1.87% and 2.43% for the N43 heat sink, at T = 353 K.

4. Conclusions

We carried out numerical studies of heat transfer and hydrodynamics in models of plate-fin heat sinks used in microelectronic cooling systems. We built 3D models of heat sinks: the basic model N27; model N39, which has the same surface area as N27 but a smaller size and metal volume; and model N43, which has a larger surface area than N27 but a smaller size, while keeping the volume of metal unchanged. Parametric calculations of heat flow and pressure drop were carried out for the cases of vertical and horizontal blowing. Based on the research results, we reached the following conclusions:
  • Horizontal airflow provides higher heat flow values for all the heat sink models studied over the entire range of air velocities (1–7 m/s) and heater temperatures (323–353 K);
  • The N39 heat sink provides a higher heat flow compared to N27; the increase reaches 17.76%. At the same time, N39 has a smaller size and volume of metal; therefore, N39 is less metal-intensive;
  • Due to its larger surface area, N43 provides a higher heat flow than N27; the increase reaches 24.44%. At the same time, the volume of metal in N43 is the same as that of N27, and the dimensions are smaller; therefore, N43 also meets modern trends towards reducing the size of cooling systems;
  • The pressure drop in the N39 and N43 heat sinks is 61–136% higher than in N27. This is explained by the greater number of fins and the smaller distance between them in N39 and N43;
  • The base heat sink model N27 has the highest values of the energy efficiency indicator, which is explained by the low pressure drop relative to other heat sink models studied. Hence, N27 is recommended for applications where a high level of system energy efficiency is imperative, and where heat dissipation rate and heat sink size are not crucial parameters. In other cases, where it is imperative to provide high heat flow from the heat sink while simultaneously reducing the size of both heat sinks and cooling systems, it is recommended to use the N39 and N47 heat sink models.
In general, we can conclude that cooling system manufacturers who seek a balance between the thermal characteristics of the heat sink, its size, and metal consumption may, in designing a heat sink, reduce its size, reduce metal consumption, and enhance heat flow by altering the number of fins and the distance between them. In one case, when we fixed the surface area of the heat sink, we were able to increase the heat flow and, at the same time, reduce the size and metal consumption of the heat sink. In another case, when the volume of metal in the heat sink remained fixed, we were able to reduce the size of the heat sink and increase the heat flow. In both instances, by reducing the size of the heat sink and enhancing the heat flow, we attain economic benefits.
Our further research aims to determine an effective model of a modified plate-fin heat sink (corrugated plates, rounded chamfers), as well as to determine the optimal model in terms of energy efficiency in combined systems (for example, a plate-fin heat sink with heat pipes, a plate-fin heat sink with inserts of highly porous cellular material, and others).

Author Contributions

Conceptualization, O.V.S.; methodology, O.V.S. and S.A.S.; software, O.V.S. and S.A.S.; validation, O.V.S., S.A.S. and R.Z.S.; formal analysis, O.V.S. and R.Z.S.; investigation, O.V.S. and S.A.S.; data curation, S.A.S.; writing—original draft preparation, O.V.S. and R.Z.S.; writing—review and editing, O.V.S. and S.A.S.; visualization, O.V.S. and R.Z.S.; supervision, O.V.S.; project administration, O.V.S.; funding acquisition, O.V.S. All authors have read and agreed to the published version of the manuscript.

Funding

The research was funded by the Russian Science Foundation, grant number 21-79-10406, https://rscf.ru/en/project/21-79-10406/ (accessed on 7 March 2024).

Data Availability Statement

The raw data supporting the conclusions of this article will be made available by the authors on request.

Conflicts of Interest

The authors declare no conflict of interest.

References

  1. Rashid, F.L.; Al-Gaheeshi, A.M.R.; Mohammed, H.I.; Ameen, A. Heat Convection in a Channel-Opened Cavity with Two Heated Sources and Baffle. Energies 2024, 17, 1209. [Google Scholar] [CrossRef]
  2. Du, X.; Yang, Z.; Jin, Z.; Xia, C.; Bao, D. A comparative study of passive control on flow structure evolution and convective heat transfer enhancement for impinging jet. Int. J. Heat Mass Transf. 2018, 126, 256–280. [Google Scholar] [CrossRef]
  3. Abood, F.A.; Yaseen, S.J.; Mohammed, I.G.; Homod, R.Z.; Mohammed, H.I. Enhancing Thermal Performance in a Magnetized Square Cavity: Novel Insights from Mixed Convection of Ag-MgO Nanofluid around a Rotating Cylinder. Int. J. Thermofluids 2024, 22, 100630. [Google Scholar] [CrossRef]
  4. Septiadi, W.N.; Prasetia, K.W.T.; Murti, M.R.; Sukadana, I.G.K.; Rahman, F.; Putra, G.J.P.; Marianti, K.M. Investigated on Thermal Design of Computer Cooling System with the Effective Length of Cascade Heat Pipe. Int. J. Technol. 2020, 11, 1388–1396. [Google Scholar] [CrossRef]
  5. Septiadi, W.N.; Wulandari, I.G.A.A.D.; Murti, M.R.; Ula, W.A.W.; Widiantara, I.K.O.; Widyantara, I.W.G.; Febraldo, D. Cascade straight heat pipe for computer cooling system with nanofluid. Int. J. Technol. 2019, 10, 1635–1642. [Google Scholar] [CrossRef]
  6. Kesavan, D.; Senthil Kumar, R.; Marimuthu, P. Heat transfer performance of air-cooled pin–fin heatsinks: A review. J. Therm. Anal. Calorim. 2023, 148, 623–649. [Google Scholar] [CrossRef]
  7. Huang, L.; Yeom, T.; Simon, T.; Cui, T. An experimental and numerical study on heat transfer enhancement of a heat sink fin by synthetic jet impingement. Heat Mass Transf. 2021, 57, 583–593. [Google Scholar] [CrossRef]
  8. Adhikari, R.C.; Wood, D.H.; Pahlevani, M. An experimental and numerical study of forced convection heat transfer from rectangular fins at low Reynolds numbers. Int. J. Heat Mass Transf. 2020, 163, 120418. [Google Scholar] [CrossRef]
  9. Izadi, A.; Siavashi, M.; Rasam, H.; Xiong, Q. MHD enhanced nanofluid mediated heat transfer in porous metal for CPU cooling. Appl. Therm. Eng. 2020, 168, 114843. [Google Scholar] [CrossRef]
  10. Hempijid, T.; Kittichaikarn, C. Effect of heat sink inlet and outlet flow direction on heat transfer performance. Appl. Therm. Eng. 2020, 164, 114375. [Google Scholar] [CrossRef]
  11. Wang, X.; Chen, M.; Tate, D.; Rahimi, H.; Zhang, S. Numerical investigation on hydraulic and thermal characteristics of micro latticed pin fin in the heat sink. Int. J. Heat Mass Transf. 2020, 149, 119157. [Google Scholar] [CrossRef]
  12. Zhang, Y.D.; Chen, M.R.; Wu, J.H.; Hung, K.S.; Wang, C.C. Performance improvement of a double-layer microchannel heat sink via novel fin geometry—A numerical study. Energies 2021, 14, 3585. [Google Scholar] [CrossRef]
  13. Zheng, W.; Sun, J.; Ma, C.; Yu, Q.; Zhang, Y.; Niu, T. Numerical study of fluid flow and heat transfer characteristics in a cone-column combined heat sink. Energies 2021, 14, 1605. [Google Scholar] [CrossRef]
  14. Zhang, F.; Wu, B.; Du, B. Heat transfer optimization based on finned microchannel heat sink. Int. J. Therm. Sci. 2022, 172, 107357. [Google Scholar] [CrossRef]
  15. Upalkar, S.A.; Kumar, S.; Krishnan, S. Analysis of fluid flow and heat transfer in corrugated porous fin heat sinks. Heat Transf. Eng. 2021, 42, 1539–1556. [Google Scholar] [CrossRef]
  16. Fang, Y.; Yang, Z.; Ma, Y.; Li, Q.; Du, X. Study of unsteady flow through and around an array of isolated square cylinders. J. Fluids Eng. 2021, 143, 031303. [Google Scholar] [CrossRef]
  17. Solovev, S.A.; Soloveva, O.V.; Akhmetova, I.G.; Vankov, Y.V.; Paluku, D.L. Numerical simulation of heat and mass transfer in an open-cell foam catalyst on example of the acetylene hydrogenation reaction. ChemEngineering 2022, 6, 11. [Google Scholar] [CrossRef]
  18. Solovev, S.A.; Soloveva, O.V.; Paluku, D.L.; Lamberov, A.A. CFD simulation of the ethylbenzene dehydrogenation reaction in the fixed bed reactor with a cylindrical catalyst of various sizes. Chem. Prod. Process Model. 2022, 17, 583–602. [Google Scholar] [CrossRef]
  19. Soloveva, O.V.; Solovev, S.A.; Yafizov, R.R. Numerical Simulation of the Aerosol Particle Motion in Granular Filters with Solid and Porous Granules. Processes 2021, 9, 268. [Google Scholar] [CrossRef]
  20. Soloveva, O.V.; Solovev, S.A.; Vankov, Y.V.; Shakurova, R.Z. Experimental studies of the effective thermal conductivity of polyurethane foams with different morphologies. Processes 2022, 10, 2257. [Google Scholar] [CrossRef]
  21. Fedyukhin, A.V.; Strogonov, K.V.; Soloveva, O.V.; Solovev, S.A.; Akhmetova, I.G.; Berardi, U.; Zaitsev, M.D.; Grigorev, D.V. Aerogel Product Applications for High-Temperature Thermal Insulation. Energies 2022, 15, 7792. [Google Scholar] [CrossRef]
  22. Unger, S.; Beyer, M.; Gruber, S.; Willner, R.; Hampel, U. Experimental study on the air-side thermal-flow performance of additively manufactured heat exchangers with novel fin designs. Int. J. Therm. Sci. 2019, 146, 106074. [Google Scholar] [CrossRef]
  23. Jha, V.K.; Bhaumik, S.K. Enhanced heat dissipation in helically finned heat sink through swirl effects in free convection. Int. J. Heat Mass Transf. 2019, 138, 889–902. [Google Scholar] [CrossRef]
  24. Kumar, R.; Chand, P. Performance enhancement of solar air heater using herringbone corrugated fins. Energy 2017, 127, 271–279. [Google Scholar] [CrossRef]
  25. Rao, A.K.; Somkuwar, V. Heat transfer of a tapered fin heat sink under natural convection. Mater. Today Proc. 2021, 46, 7886–7891. [Google Scholar] [CrossRef]
  26. Yan, Y.; Zhao, T.; He, Z.; Yang, Z.; Zhang, L. Numerical investigation on the characteristics of flow and heat transfer enhancement by micro pin-fin array heat sink with fin-shaped strips. Chem. Eng. Process. Process Intensif. 2021, 160, 108273. [Google Scholar] [CrossRef]
  27. Sun, L.; Li, J.; Xu, H.; Ma, J.; Peng, H. Numerical study on heat transfer and flow characteristics of novel microchannel heat sinks. Int. J. Therm. Sci. 2022, 176, 107535. [Google Scholar] [CrossRef]
  28. Hussein, M.A.; Hameed, V.M.; Dhaiban, H.T. An implementation study on a heat sink with different fin configurations under natural convective conditions. Case Stud. Therm. Eng. 2022, 30, 101774. [Google Scholar] [CrossRef]
  29. Du, X.; Wei, A.; Fang, Y.; Yang, Z.; Wei, D.; Lin, C.H.; Jin, Z. The effect of bend angle on pressure drop and flow behavior in a corrugated duct. Acta Mech. 2020, 231, 3755–3777. [Google Scholar] [CrossRef]
  30. Alfellag, M.A.; Ahmed, H.E.; Kherbeet, A.S. Numerical simulation of hydrothermal performance of minichannel heat sink using inclined slotted plate-fins and triangular pins. Appl. Therm. Eng. 2020, 164, 114509. [Google Scholar] [CrossRef]
  31. Zhang, K.; Li, M.J.; Wang, F.L.; He, Y.L. Experimental and numerical investigation of natural convection heat transfer of W-type fin arrays. Int. J. Heat Mass Transf. 2020, 152, 119315. [Google Scholar] [CrossRef]
  32. Sahel, D.; Bellahcene, L.; Yousfi, A.; Subasi, A. Numerical investigation and optimization of a heat sink having hemispherical pin fins. Int. Commun. Heat Mass Transf. 2021, 122, 105133. [Google Scholar] [CrossRef]
  33. Ibrahim, T.K.; Al-Sammarraie, A.T.; Al-Jethelah, M.S.; Al-Doori, W.H.; Salimpour, M.R.; Tao, H. The impact of square shape perforations on the enhanced heat transfer from fins: Experimental and numerical study. Int. J. Therm. Sci. 2020, 149, 106144. [Google Scholar] [CrossRef]
  34. Meng, X.; Zhu, J.; Wei, X.; Yan, Y. Natural convection heat transfer of a straight-fin heat sink. Int. J. Heat Mass Transf. 2018, 123, 561–568. [Google Scholar] [CrossRef]
  35. Rezaee, M.; Khoshvaght-Aliabadi, M.; Arani, A.A.; Mazloumi, S.H. Heat transfer intensification in pin-fin heat sink by changing pin-length/longitudinal-pitch. Chem. Eng. Process. Process Intensif. 2019, 141, 107544. [Google Scholar] [CrossRef]
  36. Ghadhban, F.N.; Jaffal, H.M. Numerical investigation on heat transfer and fluid flow in a multi-minichannel heat sink: Effect of channel configurations. Results Eng. 2023, 17, 100839. [Google Scholar] [CrossRef]
  37. El Ghandouri, I.; El Maakoul, A.; Saadeddine, S.; Meziane, M. Thermal performance of a corrugated heat dissipation fin design: A natural convection numerical analysis. Int. J. Heat Mass Transf. 2021, 180, 121763. [Google Scholar] [CrossRef]
  38. Chiu, H.C.; Youh, M.J.; Hsieh, R.H.; Jang, J.H.; Kumar, B. Numerical investigation on the temperature uniformity of micro-pin-fin heat sinks with variable density arrangement. Case Stud. Therm. Eng. 2023, 44, 102853. [Google Scholar] [CrossRef]
  39. Hithaish, D.; Saravanan, V.; Umesh, C.K.; Seetharamu, K.N. Thermal management of Electronics: Numerical investigation of triangular finned heat sink. Therm. Sci. Eng. Prog. 2022, 30, 101246. [Google Scholar] [CrossRef]
  40. Ranjbar, A.M.; Pouransari, Z.; Siavashi, M. Improved design of heat sink including porous pin fins with different arrangements: A numerical turbulent flow and heat transfer study. Appl. Therm. Eng. 2021, 198, 117519. [Google Scholar] [CrossRef]
  41. Şevik, S.; Özdilli, Ö. Experimental and numerical analysis of the splay impact on the performance of splayed cross-cut fin heat sink. Int. J. Therm. Sci. 2021, 170, 107101. [Google Scholar] [CrossRef]
  42. Babaei-Mahani, R.; Sardari, P.T.; Soltani, S.M.; Mohammed, H.I.; Kuncewicz, Z.; Starr, C. CFD simulation of a shell and multiple tubes condensing heat exchanger in a modified microwave plant applied for reprocessing End of Life Tires (ELTs). Environ. Qual. Manag. 2023, 1–11. [Google Scholar] [CrossRef]
  43. Du, X.; Yang, Z.; Zhou, H.; Li, Q.; Jin, Z. Numerical Investigation of Geometry Effects on flow, Heat Transfer and Defrosting Characteristics of a Simplified Automobile Windshield with a Single Row of Impinging Jets; Technical Papers; SAE International: Warrendale, PA, USA, 2016. [Google Scholar]
  44. Bazhan, P.I.; Kanevets, G.E.; Seliverstov, V.M. Handbook of Heat Exchangers; Mashinostroenie: Moscow, Russia, 1989.
  45. Yu, X.; Feng, J.; Feng, Q.; Wang, Q. Development of a plate-pin fin heat sink and its performance comparisons with a plate fin heat sink. Appl. Therm. Eng. 2005, 25, 173–182. [Google Scholar] [CrossRef]
  46. Freegah, B.; Hussain, A.A.; Falih, A.H.; Towsyfyan, H. CFD analysis of heat transfer enhancement in plate-fin heat sinks with fillet profile: Investigation of new designs. Therm. Sci. Eng. Prog. 2020, 17, 100458. [Google Scholar] [CrossRef]
Figure 1. Picture of the heat sink model with 27 plates (model N27) indicating the distance between the fins and the dimensions of the heat sink along the axes.
Processes 12 00744 g001
Figure 2. Pictures of the computational areas of air movement through a plate-fin heat sink in the case of horizontal (a) and vertical (b) airflow. The inlet and outlet of air flows are indicated by arrows.
Processes 12 00744 g002
Figure 3. Mesh quality check calculations: graphs of heat flow changes depending on air velocity for different temperature values (323–353 K) with horizontal airflow through model N39. The type of line depends on the number of elements.
Processes 12 00744 g003
Figure 4. Mesh quality check calculations: graphs of heat flow changes depending on air velocity for different temperature values (323–353 K) with vertical airflow through model N39. The type of line depends on the number of elements.
Processes 12 00744 g004
Figure 5. Verification of calculations with the study of Yu et al. [45]: graphs of changes in pressure drop depending on air velocity. Solid lines indicate the results of our calculations; dotted lines indicate the results of Yu et al.
Processes 12 00744 g005
Figure 6. Verification of our calculations with the study of Yu et al. [45]: graphs of thermal resistance depending on air velocity. Solid lines indicate the results of our calculations, while dotted lines indicate the results of Yu et al.
Processes 12 00744 g006
Figure 7. Picture of the heat sink model with 9 fins, described in [45], indicating the distance between the fins and the dimensions of the heat sink along the axes.
Processes 12 00744 g007
Figure 8. Graphs of changes in thermal resistance (a) and pressure drop (b) depending on air velocity for the heat sink described in Yu et al. [45]. Comparing the calculations obtained in our calculation model (represented by solid lines) with the calculations obtained in the calculation model [45] (represented by dashed lines).
Processes 12 00744 g008
Figure 9. Picture of the heat sink model with 10 fins, described in [46], indicating the distance between the fins, the thickness of the fins, and the dimensions of the heat sink along the axes.
Processes 12 00744 g009
Figure 10. Graphs of changes in thermal resistance (a,b) and pressure drop (c) depending on the air mass flow. The results obtained in our calculations are represented by solid lines; the results of Freegah et al. [46] are represented by dotted lines. Figure (a) presents the results for the case of horizontal airflow, and the results for the case of vertical airflow are presented in Figure (b).
Processes 12 00744 g010
Figure 11. Graphs of changes in heat flow depending on air velocity for different temperature values (323–353 K) for the heat sink models studied: (a) N27; (b) N39; (c) N43. Solid lines show the results for the case of horizontal airflow, and dotted lines show the results for the case of vertical airflow.
Processes 12 00744 g011
Figure 12. Graphs of changes in heat flow depending on air velocity for different temperature values (323–353 K) for models N27 (solid lines) and N39 (dashed lines) with (a) horizontal and (b) vertical airflow.
Processes 12 00744 g012
Figure 13. Graphs of changes in heat flow depending on air velocity for different temperature values (323–353 K) for models N27 (solid lines) and N43 (dashed lines) with (a) horizontal and (b) vertical airflow.
Processes 12 00744 g013
Figure 14. Graphs of changes in pressure drop depending on air velocity for two blowing directions: horizontal (solid lines) and vertical (dashed lines) for the heat sink models studied.
Processes 12 00744 g014
Figure 15. The temperature fields of the heat sink model N27 for the case of horizontal airflow at a fixed air velocity of 4 m/s and varying heater temperatures T are as follows: (a) 323 K, (b) 333 K, (c) 343 K, and (d) 353 K.
Processes 12 00744 g015
Figure 16. The temperature fields of the heat sink model N27 for the case of horizontal airflow at a fixed heater temperature of 338 K and varying air velocities ν are as follows: (a) 1 m/s, (b) 3 m/s, (c) 5 m/s, and (d) 7 m/s.
Processes 12 00744 g016aProcesses 12 00744 g016b
Figure 17. The temperature distribution in several cross-sections of heat sink model N27 for the case of horizontal airflow at a fixed velocity of 1 m/s and different heater temperatures is as follows: (a) 323 K, (b) 333 K, (c) 343 K, and (d) 353 K.
Processes 12 00744 g017
Figure 18. Graphs of changes in the energy efficiency indicator depending on the air velocity for the heat sink models studied in the cases of horizontal (N27h, N39h, N43h) and vertical (N27v, N39v, N43v) blowing at the following heater temperature values: (a) 323 K; (b) 328 K; (c) 333 K; (d) 338 K; (e) 343 K; (f) 348 K; (g) 353 K.
Processes 12 00744 g018aProcesses 12 00744 g018b
Table 1. Characteristics of 3D models of fin-plate heat sink for three geometries: N27, N39, and N43.
NameNumber of FinsHeat Sink Length, mmFin Spacing, mmSurface Area, m2Volume of Metal, m3
N27271002.1350.38981.252 × 10−4
N393969.91.30.38981.165 × 10−4
N434369.41.130.42561.252 × 10−4
Table 2. Mesh division check.
Heat Sink
Model
Airflow DirectionNumber of Mesh ElementsHeat Flow,
W
Heat Flow
Difference, %
N39Horizontal1.3 × 106324.9135-
2.2 × 106331.09041.8656
4.5 × 106346.19064.3617
7.1 × 106350.87441.3351
Vertical1.3 × 106304.9077-
2.3 × 106309.48811.4800
4.5 × 106311.35290.5989
6.9 × 106308.83960.8138
Disclaimer/Publisher’s Note: The statements, opinions and data contained in all publications are solely those of the individual author(s) and contributor(s) and not of MDPI and/or the editor(s). MDPI and/or the editor(s) disclaim responsibility for any injury to people or property resulting from any ideas, methods, instructions or products referred to in the content.

