Abstract
In this study, a falling weight impact test was conducted on EH690 steel specimens with V-notches using Digital Imaging Correlation (DIC). In conjunction with scanning electron microscopy (SEM), the plastic deformation and crack initiation processes were examined at the notch of the specimen under different impact energies (90 J, 120 J, 135 J and 150 J). ABAQUS was used to simulate the plastic deformation of an EH690 specimen. The results show that the strain at the notch tip experienced some elasticity and yielding as the load increased under different impact energies. The load remains unchanged or decreases slightly when a plastic hinge forms at the tip of the notch. According to the microscopic images, there are three areas on the fracture surface: a fiber area, a radiation area, and a shear lip area. With increasing deformation, a crack source forms in the middle of the V-shaped notch and propagates to the inside and outside surfaces of the sample. Cracks are primarily caused by ductile tears. The use of DIC to analyze the surface strain of EH690 steel specimens was verified by comparing DIC with finite element analysis. Both curves have the same trend and the maximum error in the load-time curve is 9.42%, the maximum error in the displacement–time curve is 5.61%, and the maximum error in the strain-time curve is 10.68%.
1. Introduction
With the development of marine oil and gas resources in China, the demand for steel is increasing for offshore platforms and other marine engineering equipment. The long service life and harsh environment of offshore engineering equipment require metal materials with high strength, high toughness, fatigue resistance, good weldability, and corrosion resistance against seawater [1,2,3,4].
As a high-strength low-alloy steel with high strength, good high-temperature plasticity, corrosion and fatigue resistance, EH690 steel is widely used in important structural components of offshore engineering equipment. During operation, in addition to bearing static and quasi-static loads [5,6], these components also need to cope with medium and low-speed impact loads such as seawater slamming and floating object impact. Offshore platforms typically have a service life of 20–40 years, are far from land, and are difficult to maintain. As a result, should they malfunction, huge losses will occur. Therefore, the study of EH690’s dynamic mechanical properties and plastic deformation under low-velocity impact loads is crucial for the safety of offshore equipment [7].
At present, research on EH690 steel focuses on corrosion fatigue [8,9,10,11,12], welding performance [13,14], and quasi-static mechanical properties [15,16]. All of these studies were conducted under quasi-static conditions. Few studies have been conducted on the mechanical response characteristics and failure mechanisms of EH690 steel under impact loads. The deformation characteristics of materials under impact loads are different from those under quasi-static loads due to their proneness to local plastic deformations and fractures.
As one of the most widely used methods for evaluating the ability of a material to absorb energy during elastic-plastic deformation and fracture, the Charpy impact test is widely applied in dynamic mechanical testing of steels for offshore engineering. Madhusudhan D et al. [17] performed a finite element simulation of the Charpy impact test on maraging steel 300 using ABAQUS. Upon measuring the load-time curve and impact absorbed energy of maraging steel 300, it was found that the maximum load and impact absorbed energy decreased as the impact speed increased. Cao Yuguang et al. [18] conducted Charpy impact tests on X80 pipeline steel at varying impact speeds. X80 pipeline steel was tested at impact speeds of 5 m/s, 5.234 m/s, 6 m/s, and 7 m/s to determine impact load and impact absorbed energy. As the impact speed increased, the maximum impact load and impact absorbed energy increased slightly. Kim H et al. [19] conducted Charpy impact tests at room temperature and −50 °C on three types of martensitic steels. The impact load and impact absorbed energy of steel were measured under a one-time impact fracture. Under different impact temperatures, the impact load of the material increased and then decreased as the tempering temperature increased, and the impact absorbed energy increased. These tests were all conducted under the condition of one-time impact fracture, and the plastic deformation of the sample during the impact process was not detailed. Due to the limitations of contact strain measurement methods in Charpy impact testing and the inconvenience of installing non-contact strain measurement methods on the Charpy impact tester, the falling weight impact test is a method for testing the impact resistance of an object by free-falling the weight upon it. During the impact process, the specimen can be observed to undergo complete plastic deformation and crack growth. In this study, the falling weight impact tester [20,21,22] was used instead of the Charpy impact tester. Utilizing a high-speed camera and the DIC method [23,24,25], the strain change variation and fracture process of the specimen were examined.
Due to its simple equipment, high measurement accuracy, and low vibration isolation requirements [26,27,28], the DIC method plays an important role in the dynamic mechanical property testing of materials [29,30,31,32]. Benoit Jordan et al. [33] measured the full-field strain information of four bi-directional sheets of steel such as DP590 and four aluminum alloys such as AA2024 in uniaxial tensile tests using the DIC method. It also performed uniaxial tensile simulations using the finite element method for these eight materials. The stress-strain curves were extracted using five different methods, compared with those measured during the tests, and showed a 3.5% error. Sun Fei-Fei et al. [34] conducted 44 tensile tests on S690Q high-strength steel transverse fillet welded joints at a loading rate of 0.5 mm/min, and also measured the displacement and strain distribution using DIC and electrical measurement methods. The electrical measurement method was found to be inadequate for recording strain information as the sensor used in the electrical measurement method slipped seriously during the test. S.C. Ren et al. [35] investigated the plastic properties of A42 steel specimens in unilateral notched tensile tests at the notched tip before fracture using the DIC method, and found that the DIC-measured stress-displacement curves are in close agreement with the finite element solution, and that the strain clouds are similar. Rahmatabadi Davood et al. [36] employed the DIC method to measure the strain field of uniaxial tensile specimens and track crack growth in multi-layered Al/MgLZ91 composite CT specimens to improve strain measurement accuracy and quality.
In this study, the impact resistance of EH690 steel was investigated using the falling weight impact tester under low and medium strain rate impact loads, in particular the plastic deformation at the V-notch. Through the use of a high-speed camera, the whole process of plastic deformation and crack initiation was observed, and the plastic deformation at the V-notch of the specimen was analyzed using the DIC method. Under impact loading conditions, the data provided in this study can be used to support structural design, prediction, and prevention of potential material failures in EH690 steel.
2. Experimental Materials and Methods
2.1. Experimental Materials
EH690 high-strength steel is produced by quenching and tempering (QT) process at Wuyang Steel in China, and the corresponding chemical composition is given in Table 1. The basic mechanical properties of the material obtained from the tensile test of the standard material are presented in Table 2

Table 1.
Chemical composition of EH690 steel.
Table 2.
Basic mechanical properties of EH690 steel.
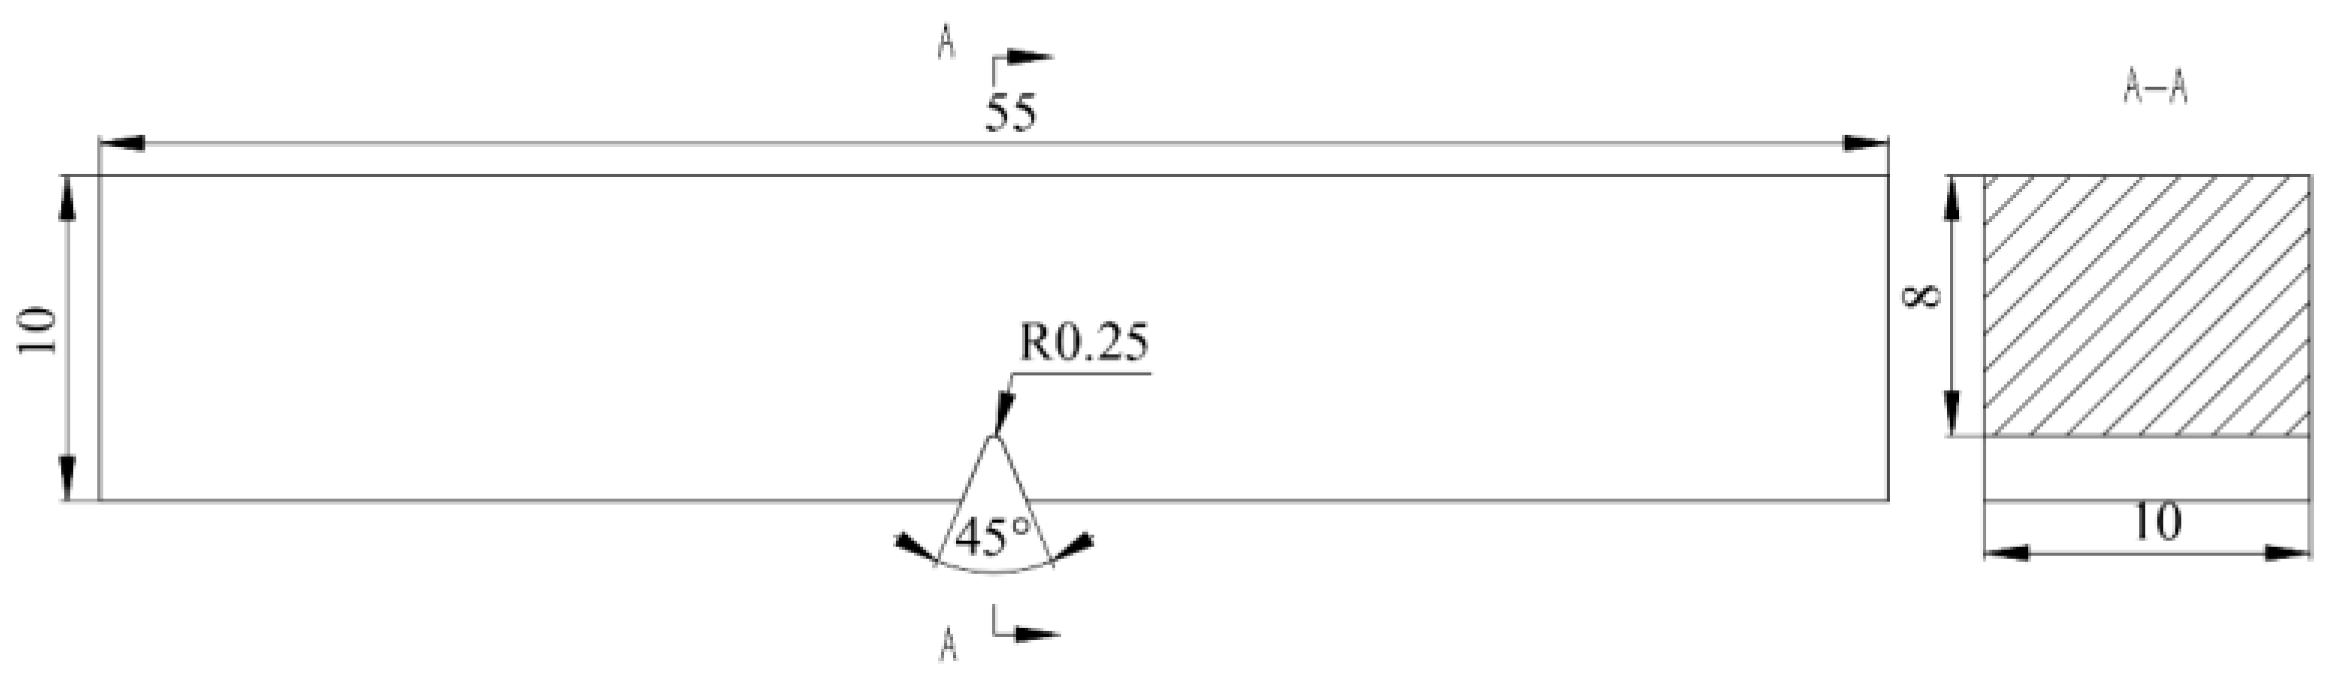
According to the Charpy impact test method [37], a 55 × 10 × 10 V-notch specimen was machined by electro discharge machining (EDM) [38], as shown in Figure 1. The hammer mass was 16.1 kg, and the impact energy was 90 J, 120 J, 135 J, and 150 J, each in 3 groups.

Figure 1.
Charpy V-Notch Specimen and Dimensional Diagram.
2.2. Experimental Methods
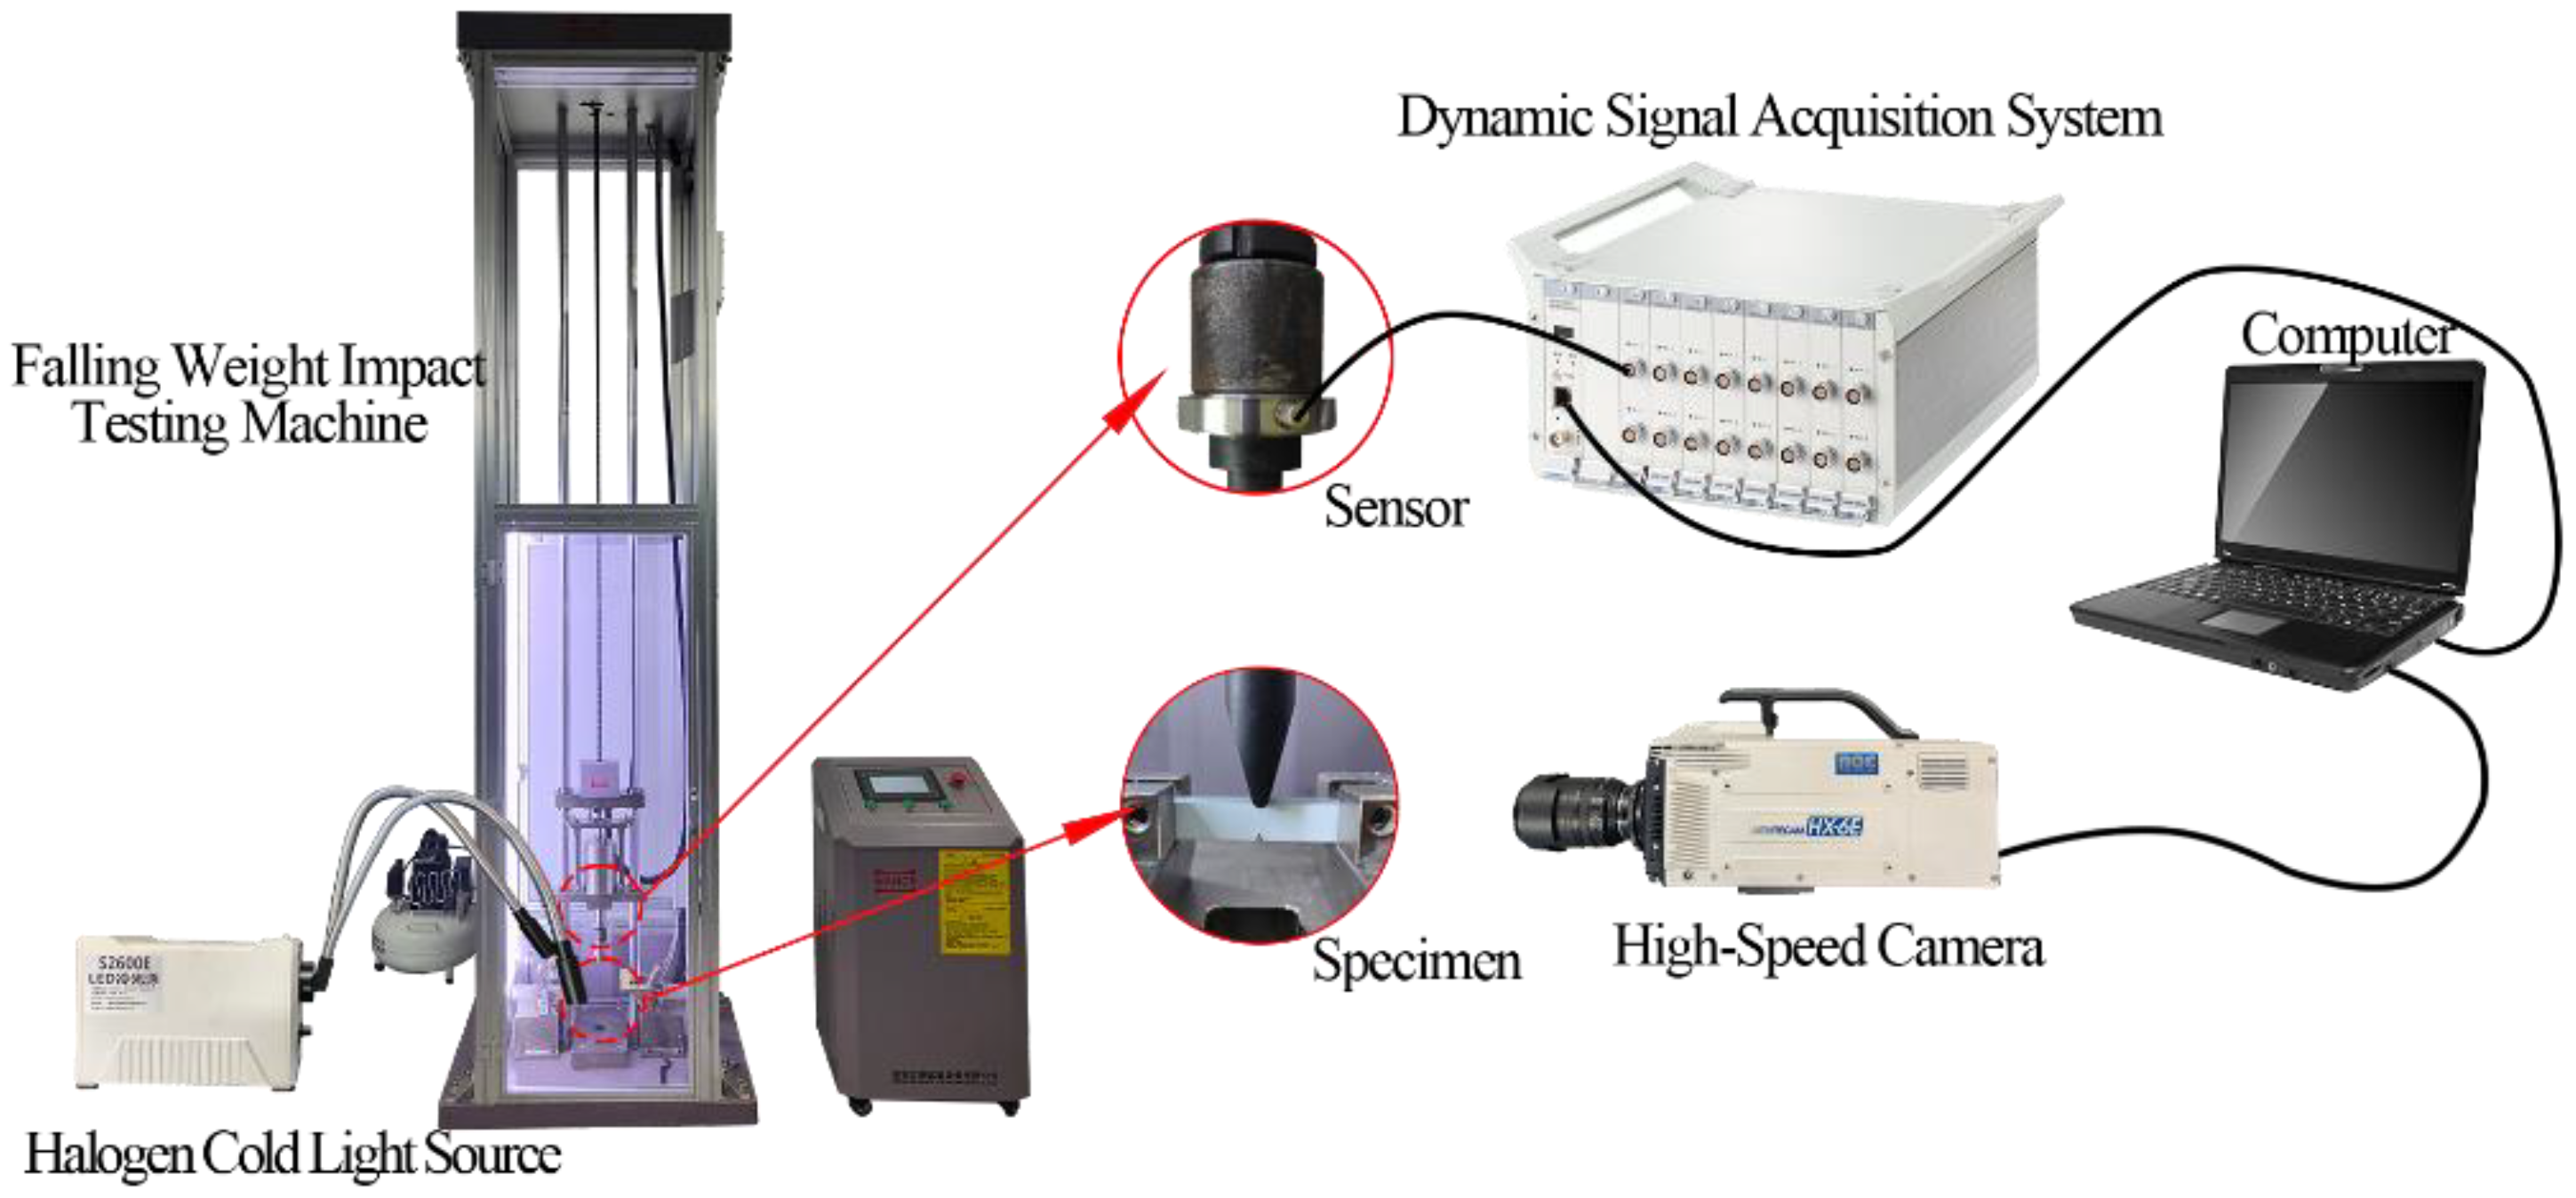
As shown in Figure 2, the test device consists of a falling weight impact tester, an ultra-dynamic signal test and analysis system, and a high-speed camera. The testing machine used is a Wance DIT falling weight impact testing machine with a maximum impact energy of 300 J. The specimen is supported by a simple supported beam with a span of 40 mm. Dynamic acquisition is performed with the Donghua DH5960 ultra-dynamic signal test and analysis system. The test and analysis system uses a sampling frequency of 20 MHz. A signal conversion is performed using the acquisition and control software in order to determine the relationship between the impact load and the time. The high-speed camera used in this experiment is a NAC HX-6 with a frame rate of 50,000 FPS. For light intensity compensation, the specimen surface was irradiated with a halogen lamp cold light source. Before the test, the surface of the specimen was subjected to speckle spraying and calibrated. To obtain displacement and strain information from the speckle image, Ncorr [39] analysis software was used.
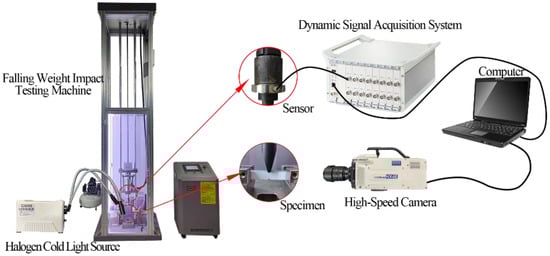
Figure 2.
Digital Image Correlation (DIC) Testing System.
3. Experiment Results and Analysis
3.1. Experimental Results
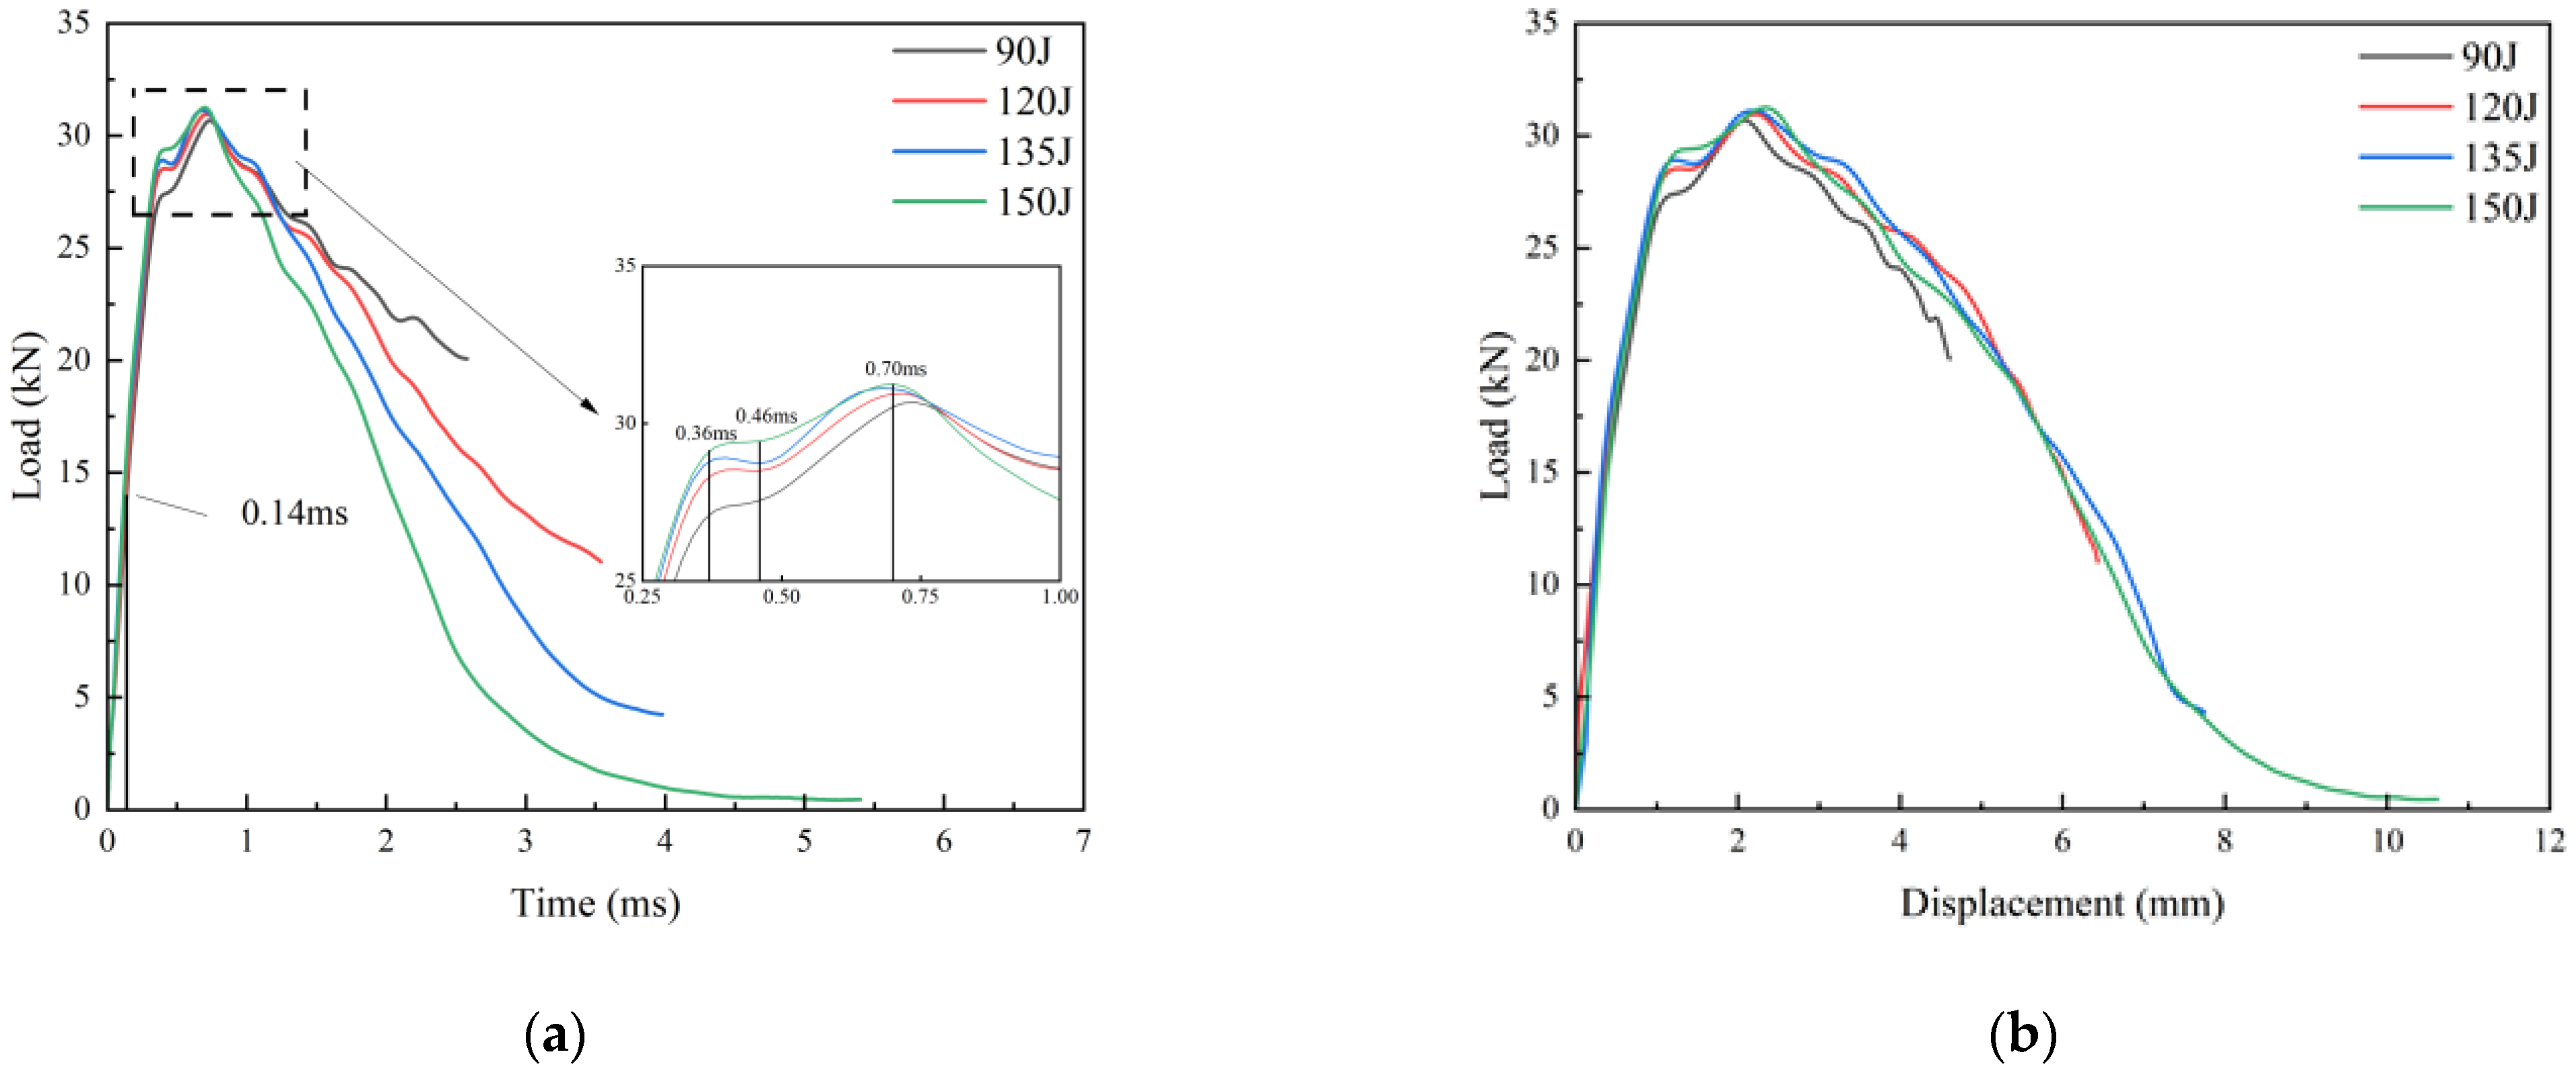
Figure 3 shows the load-time and load-displacement curves under different impact energies. Figure 3a shows that the trend of load-time curves of specimens under different impact energies is basically the same. As impact energy increases, the peak load increases slightly, the time to reach the peak load shortens, and the average peak load under different impact energies is 31 kN. Figure 3b shows that the crack arresting displacement of specimens increases with increasing impact energy. The impact process can be divided into five stages based on the load-time change trend. Stage 1, the load and displacement have an approximate linear relationship, from 0 to 0.14 ms. Stage 2, the load and displacement, from 0.14 ms to 0.36 ms are still in an approximately linear relationship, but the growth rate is slightly slower than the previous stage, and the specimen displays a small range of plastic deformation. Stage 3, the load remains essentially unchanged while the displacement increases from 0.36 ms to 0.46 ms. The specimen produces a wide range of plastic deformations. Stage 4, the load again increases with displacement increasing, from 0.46 ms to 0.70 ms, indicating that the material is undergoing a transient strengthening process. Stage 5, the load decreases slowly as displacement increases, from 0.70 ms to crack arrest. All the potential energy of the hammer head is converted into the internal energy of the specimen.
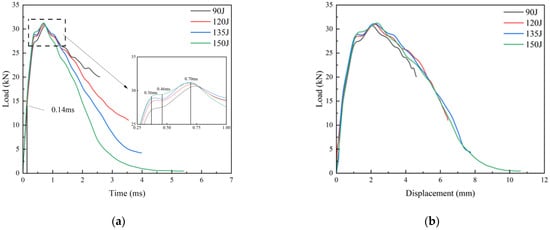
Figure 3.
Load, Displacement, and Time Relationship Curves for Different Impact Energies Obtained through Load and DIC Measurements: (a) Load-Time Curve; (b) Load-Displacement Curve.
3.2. Results of DIC Analyses
The strain distribution of the specimen surface under different impact energies, as obtained by DIC is shown in Figure 4. The results show that the contact position of the hammer head is dominated by compression strain with the impact load gradually increasing during the impact process. Both the strain field and the tensile strain increased at the tip of the V-notch.
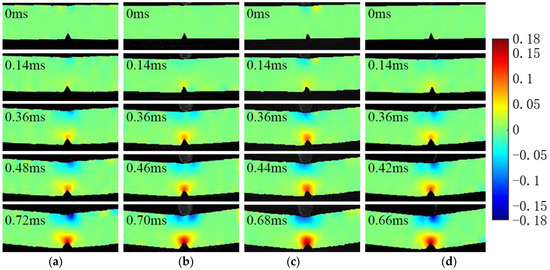
Figure 4.
Surface Strain Maps of EH690 Specimens under Different Impact Energies: (a) 90 J; (b) 120 J; (c) 135 J; (d) 150 J.
According to the strain distribution area in Figure 4, the strain field is primarily concentrated near the V-notch tip area during the impact process. The largest strain distribution region is located 1.5 mm above the V-notch tip. To study the strain change process when the specimen is subjected to impact loads, the strain values in the 1-1 and y directions of the line segment are extracted as shown in Figure 5
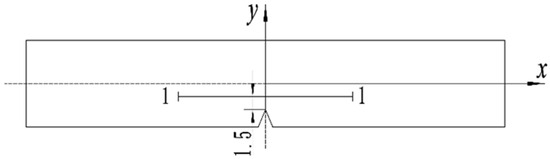
Figure 5.
Schematic Diagram of Line Segment Selection.
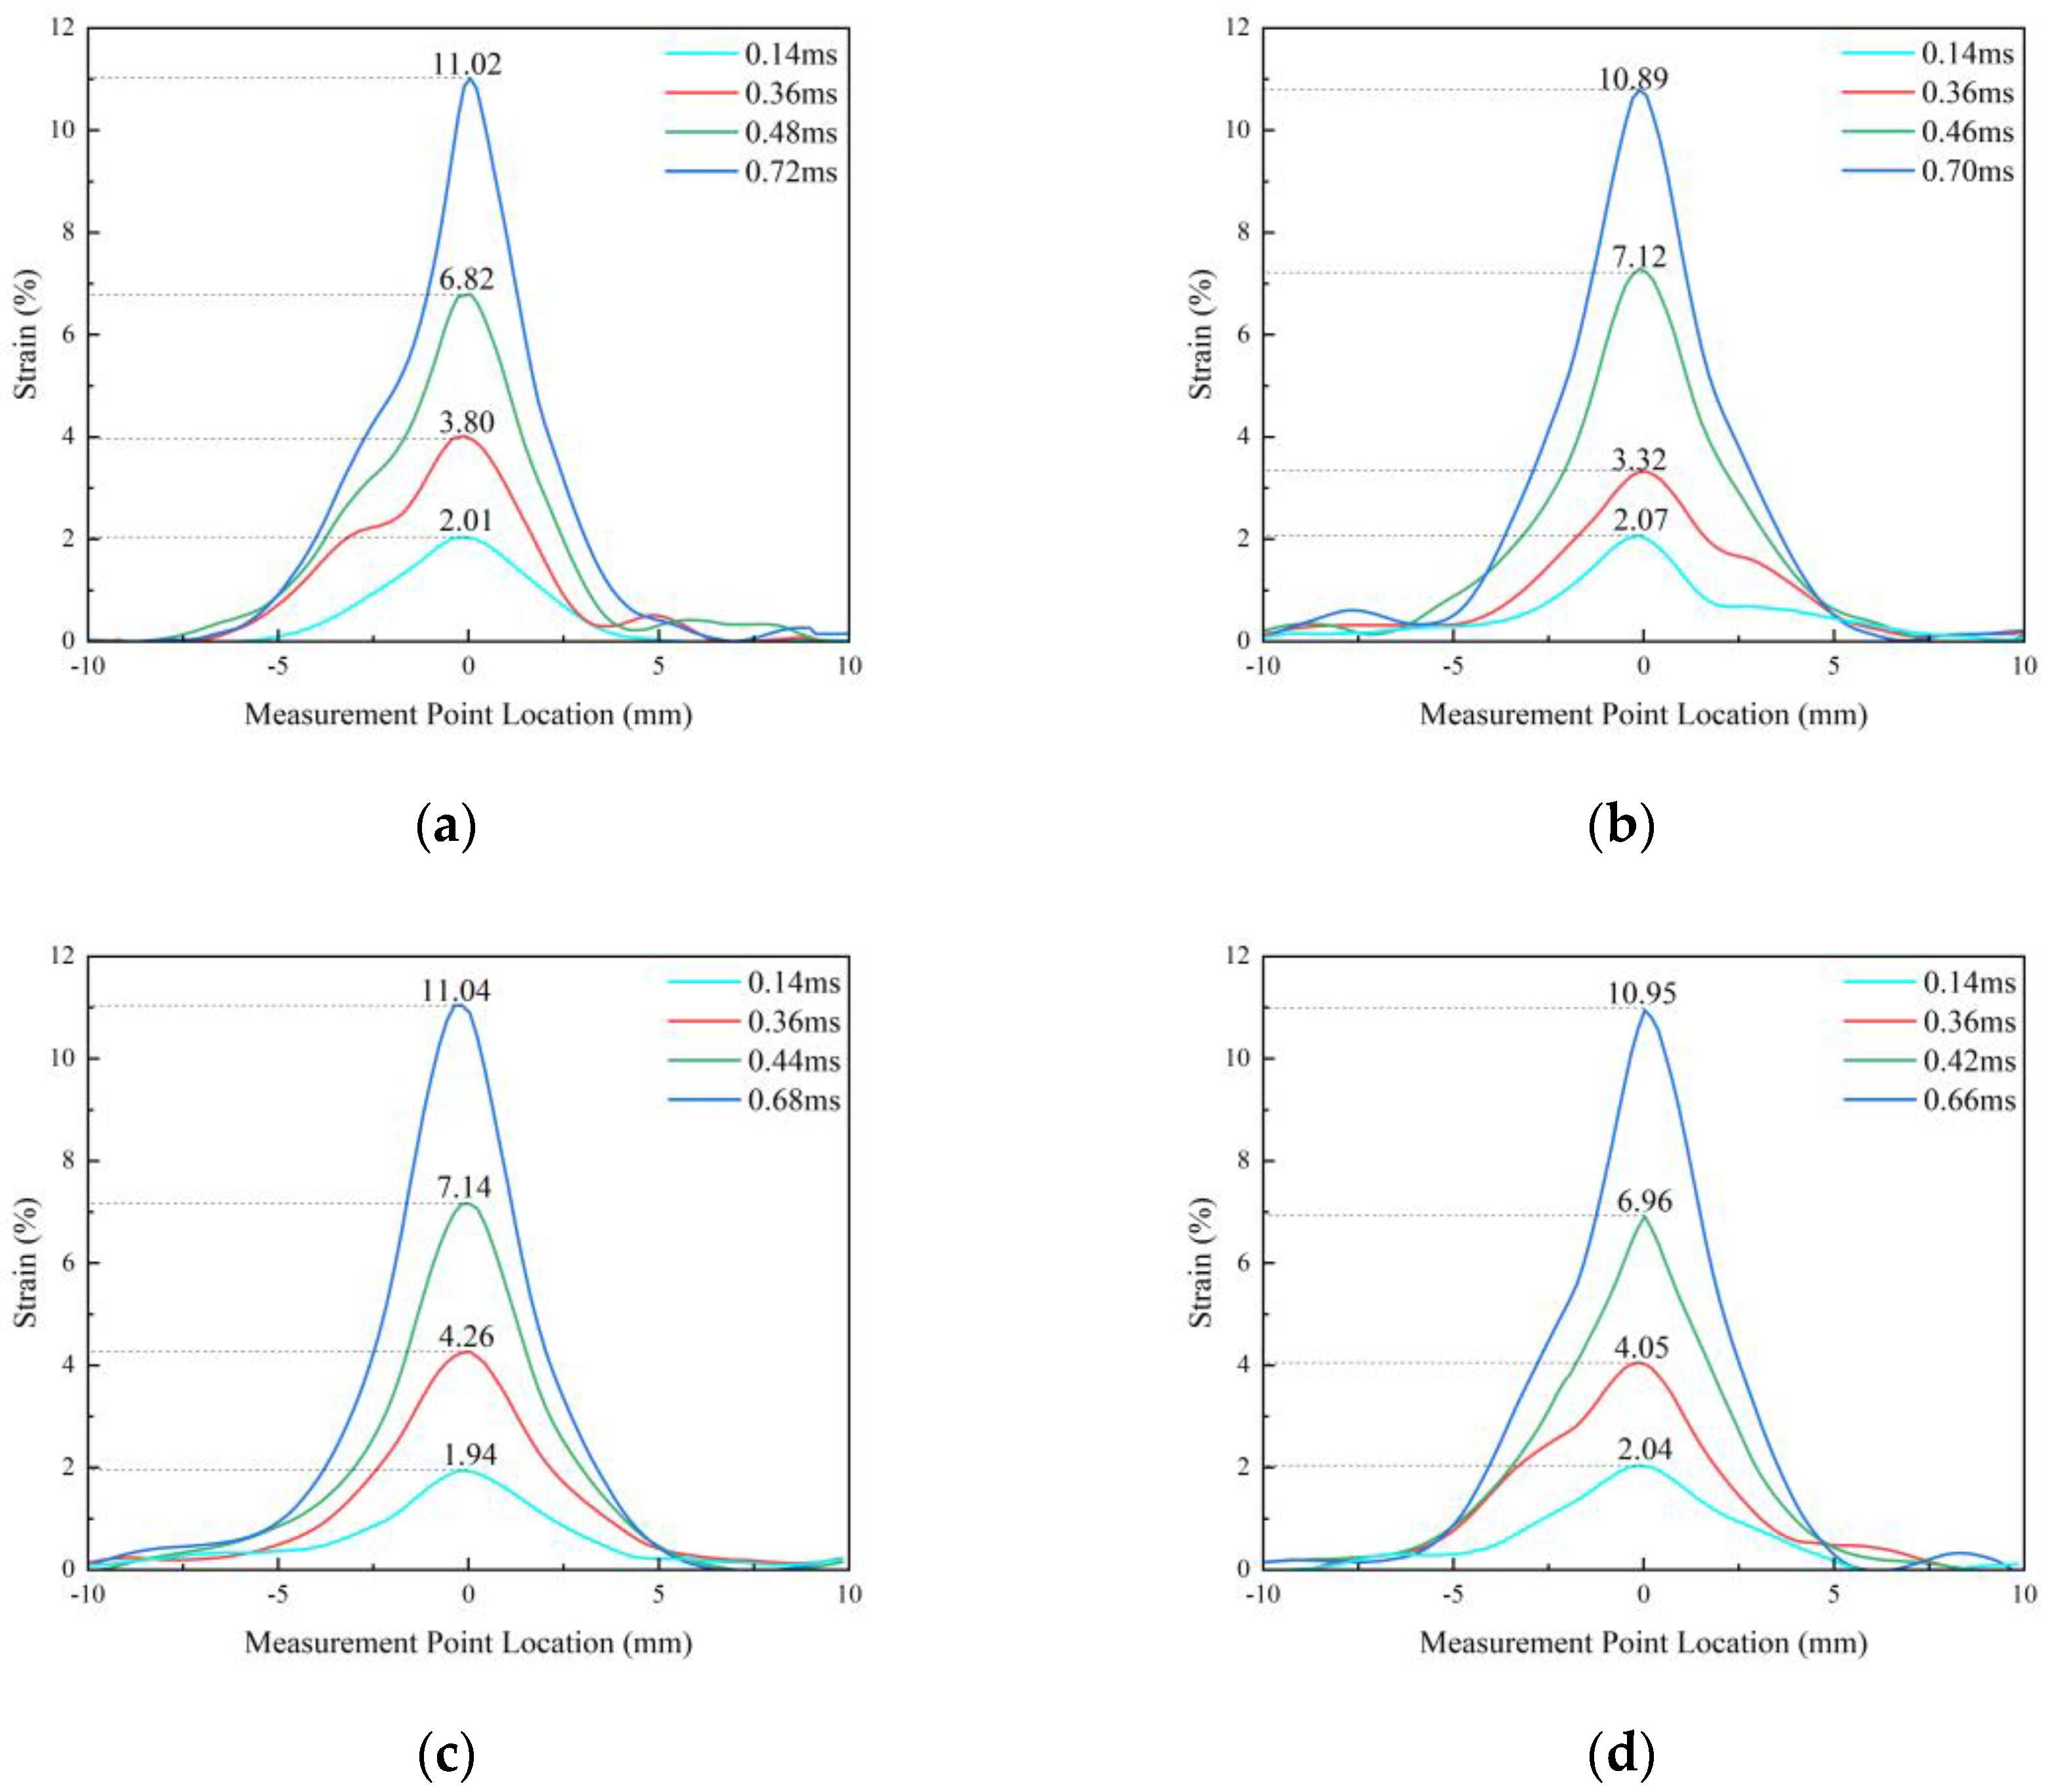
Figure 6 shows the strain change curve in the 1-1 direction. The results show that the strain distribution region and strain value at the same stage are basically the same under different impact energies. A decrease in strain value occurs as the distance from the y-axis increases. When the measurement point is located 5 mm from the y-axis, the strain value tends to be close to 0. The maximum strain is located at the tip of the notch tip. According to the strain distribution under the impact energy of 150 J, the maximum strain value is 2.04% at 0.14 ms, 4.05% at 0.36 ms, 6.96% at 0.42 ms, and 10.96% at 0.66 ms. The strain values of the corresponding stages under the rest of the impact energy are similar to 150 J.
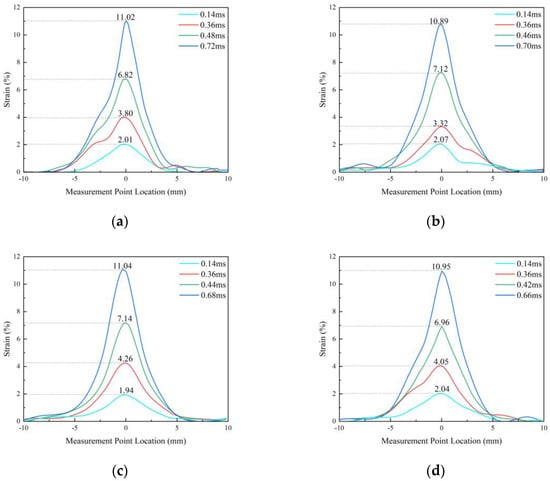
Figure 6.
Strain Variation Curves along 1-1 under Different Impact Energies: (a) 90 J; (b) 120 J; (c) 135 J; (d) 150 J.
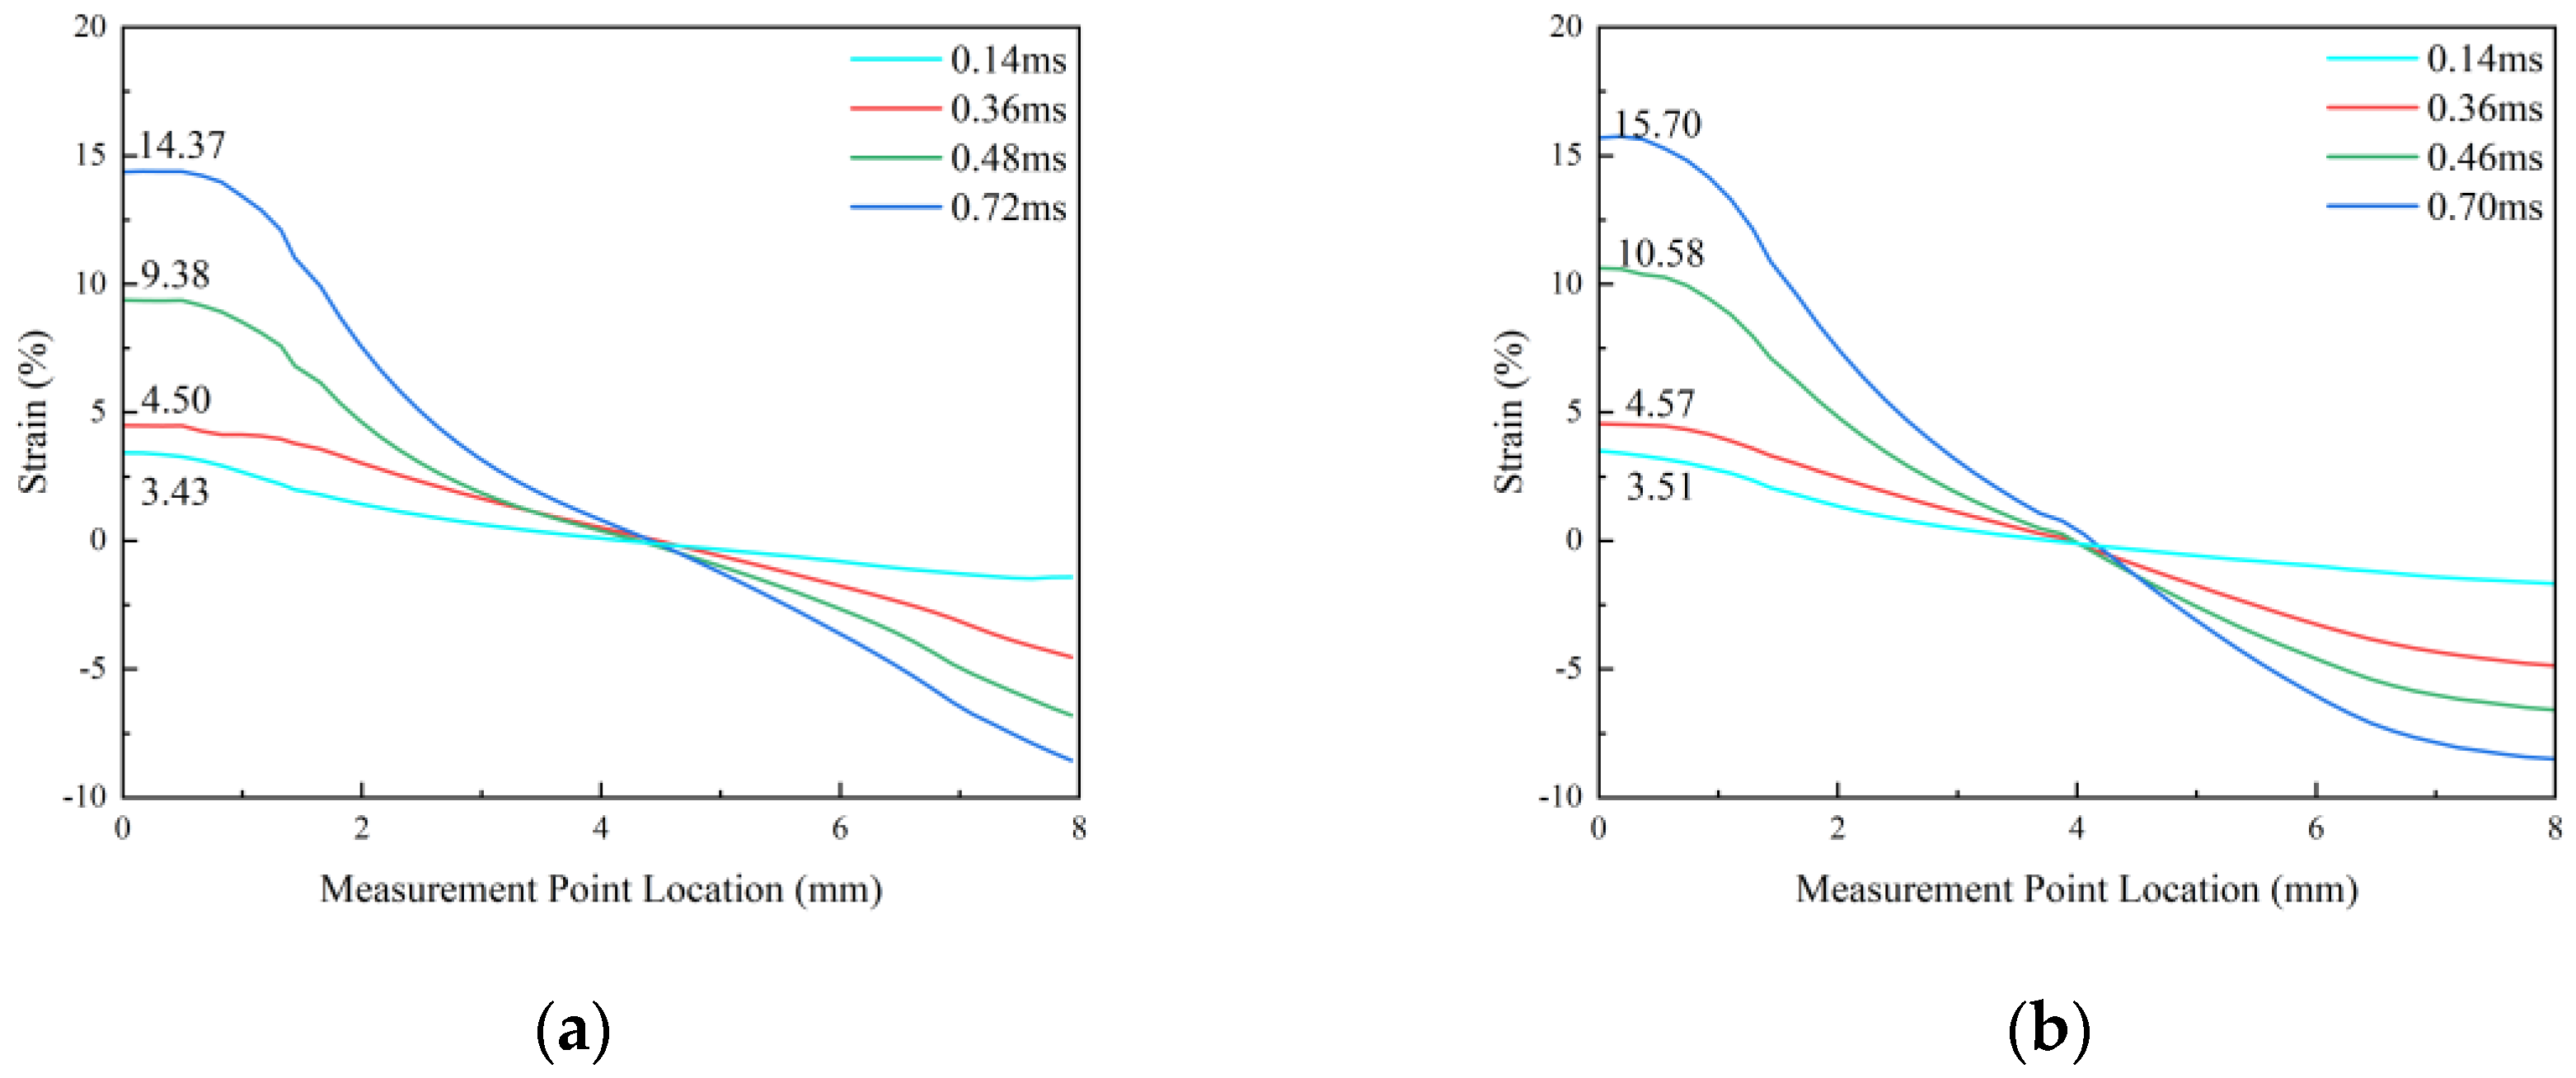
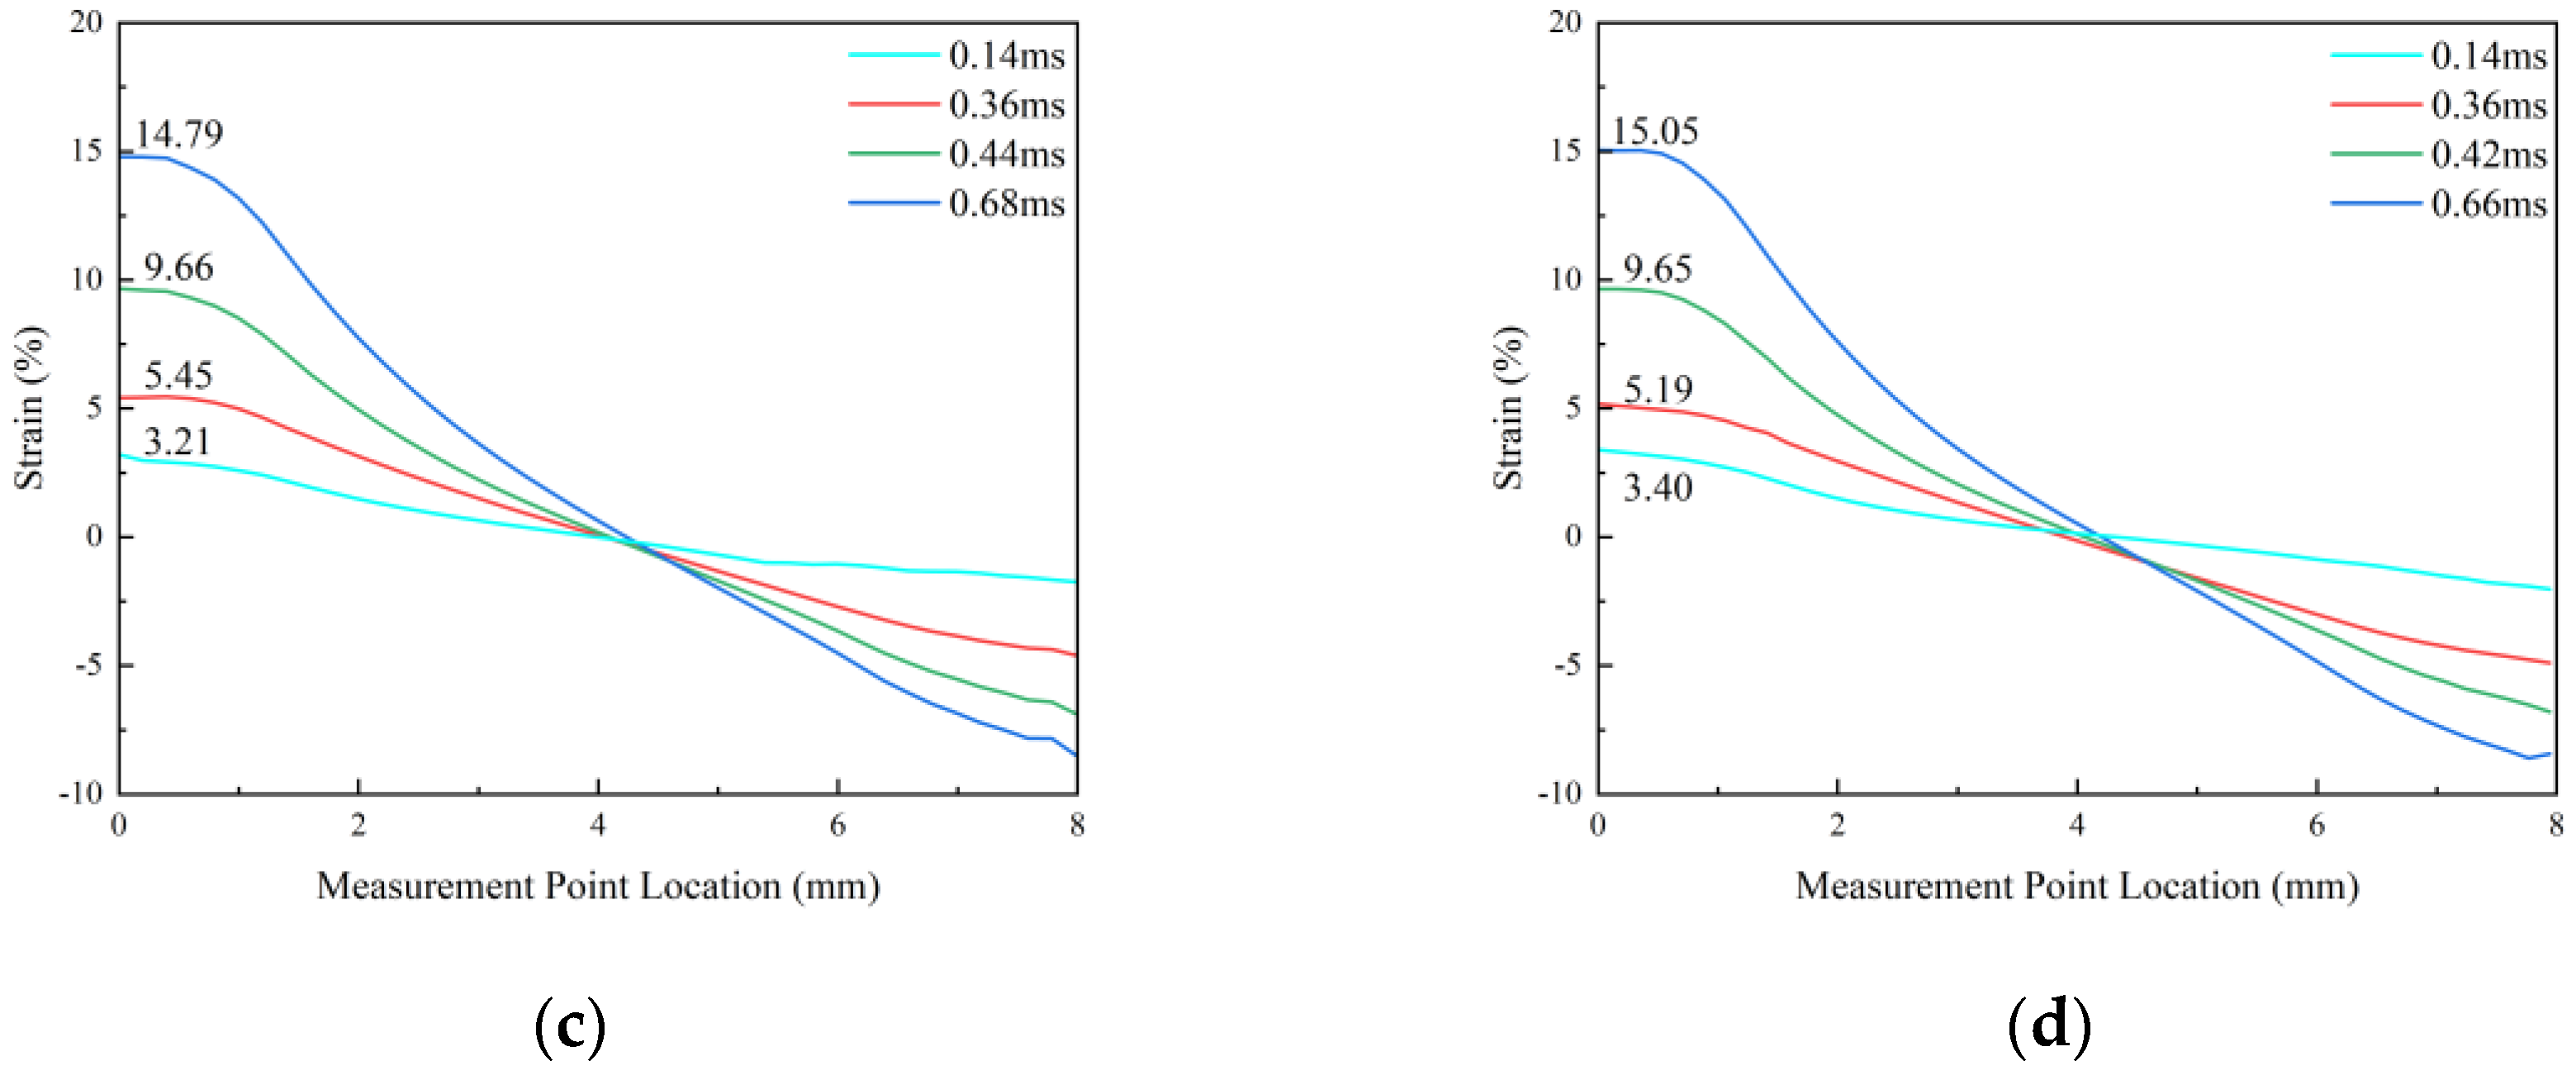
Figure 7 shows the strain change curve in the y-axis direction. It is shown that the strain distribution region and strain value at the same stage are basically the same under differing impact energies. At 3.6 mm from the hammer head, the strain approaches 0. The maximum strain occurs at the point of contact between the hammer and the specimen and at the tip of the V-notch. According to the strain distribution under the impact energy of 150 J, the maximum strain values are 3.00% at 0.14 ms, 5.19% at 0.36 ms, 9.65% at 0.42 ms, and 15.05% at 0.66 ms.

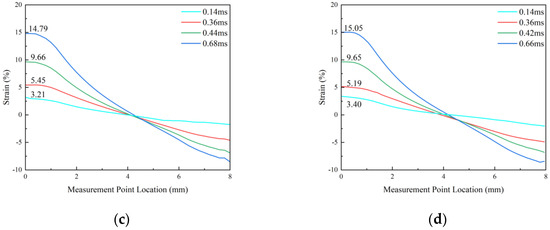
Figure 7.
Strain Variation Curves along the Y-axis under Different Impact Energies: (a) 90 J; (b) 120 J; (c) 135 J; (d) 150 J.
3.3. Conclusions Macroscopic Fracture Analysis of Specimen
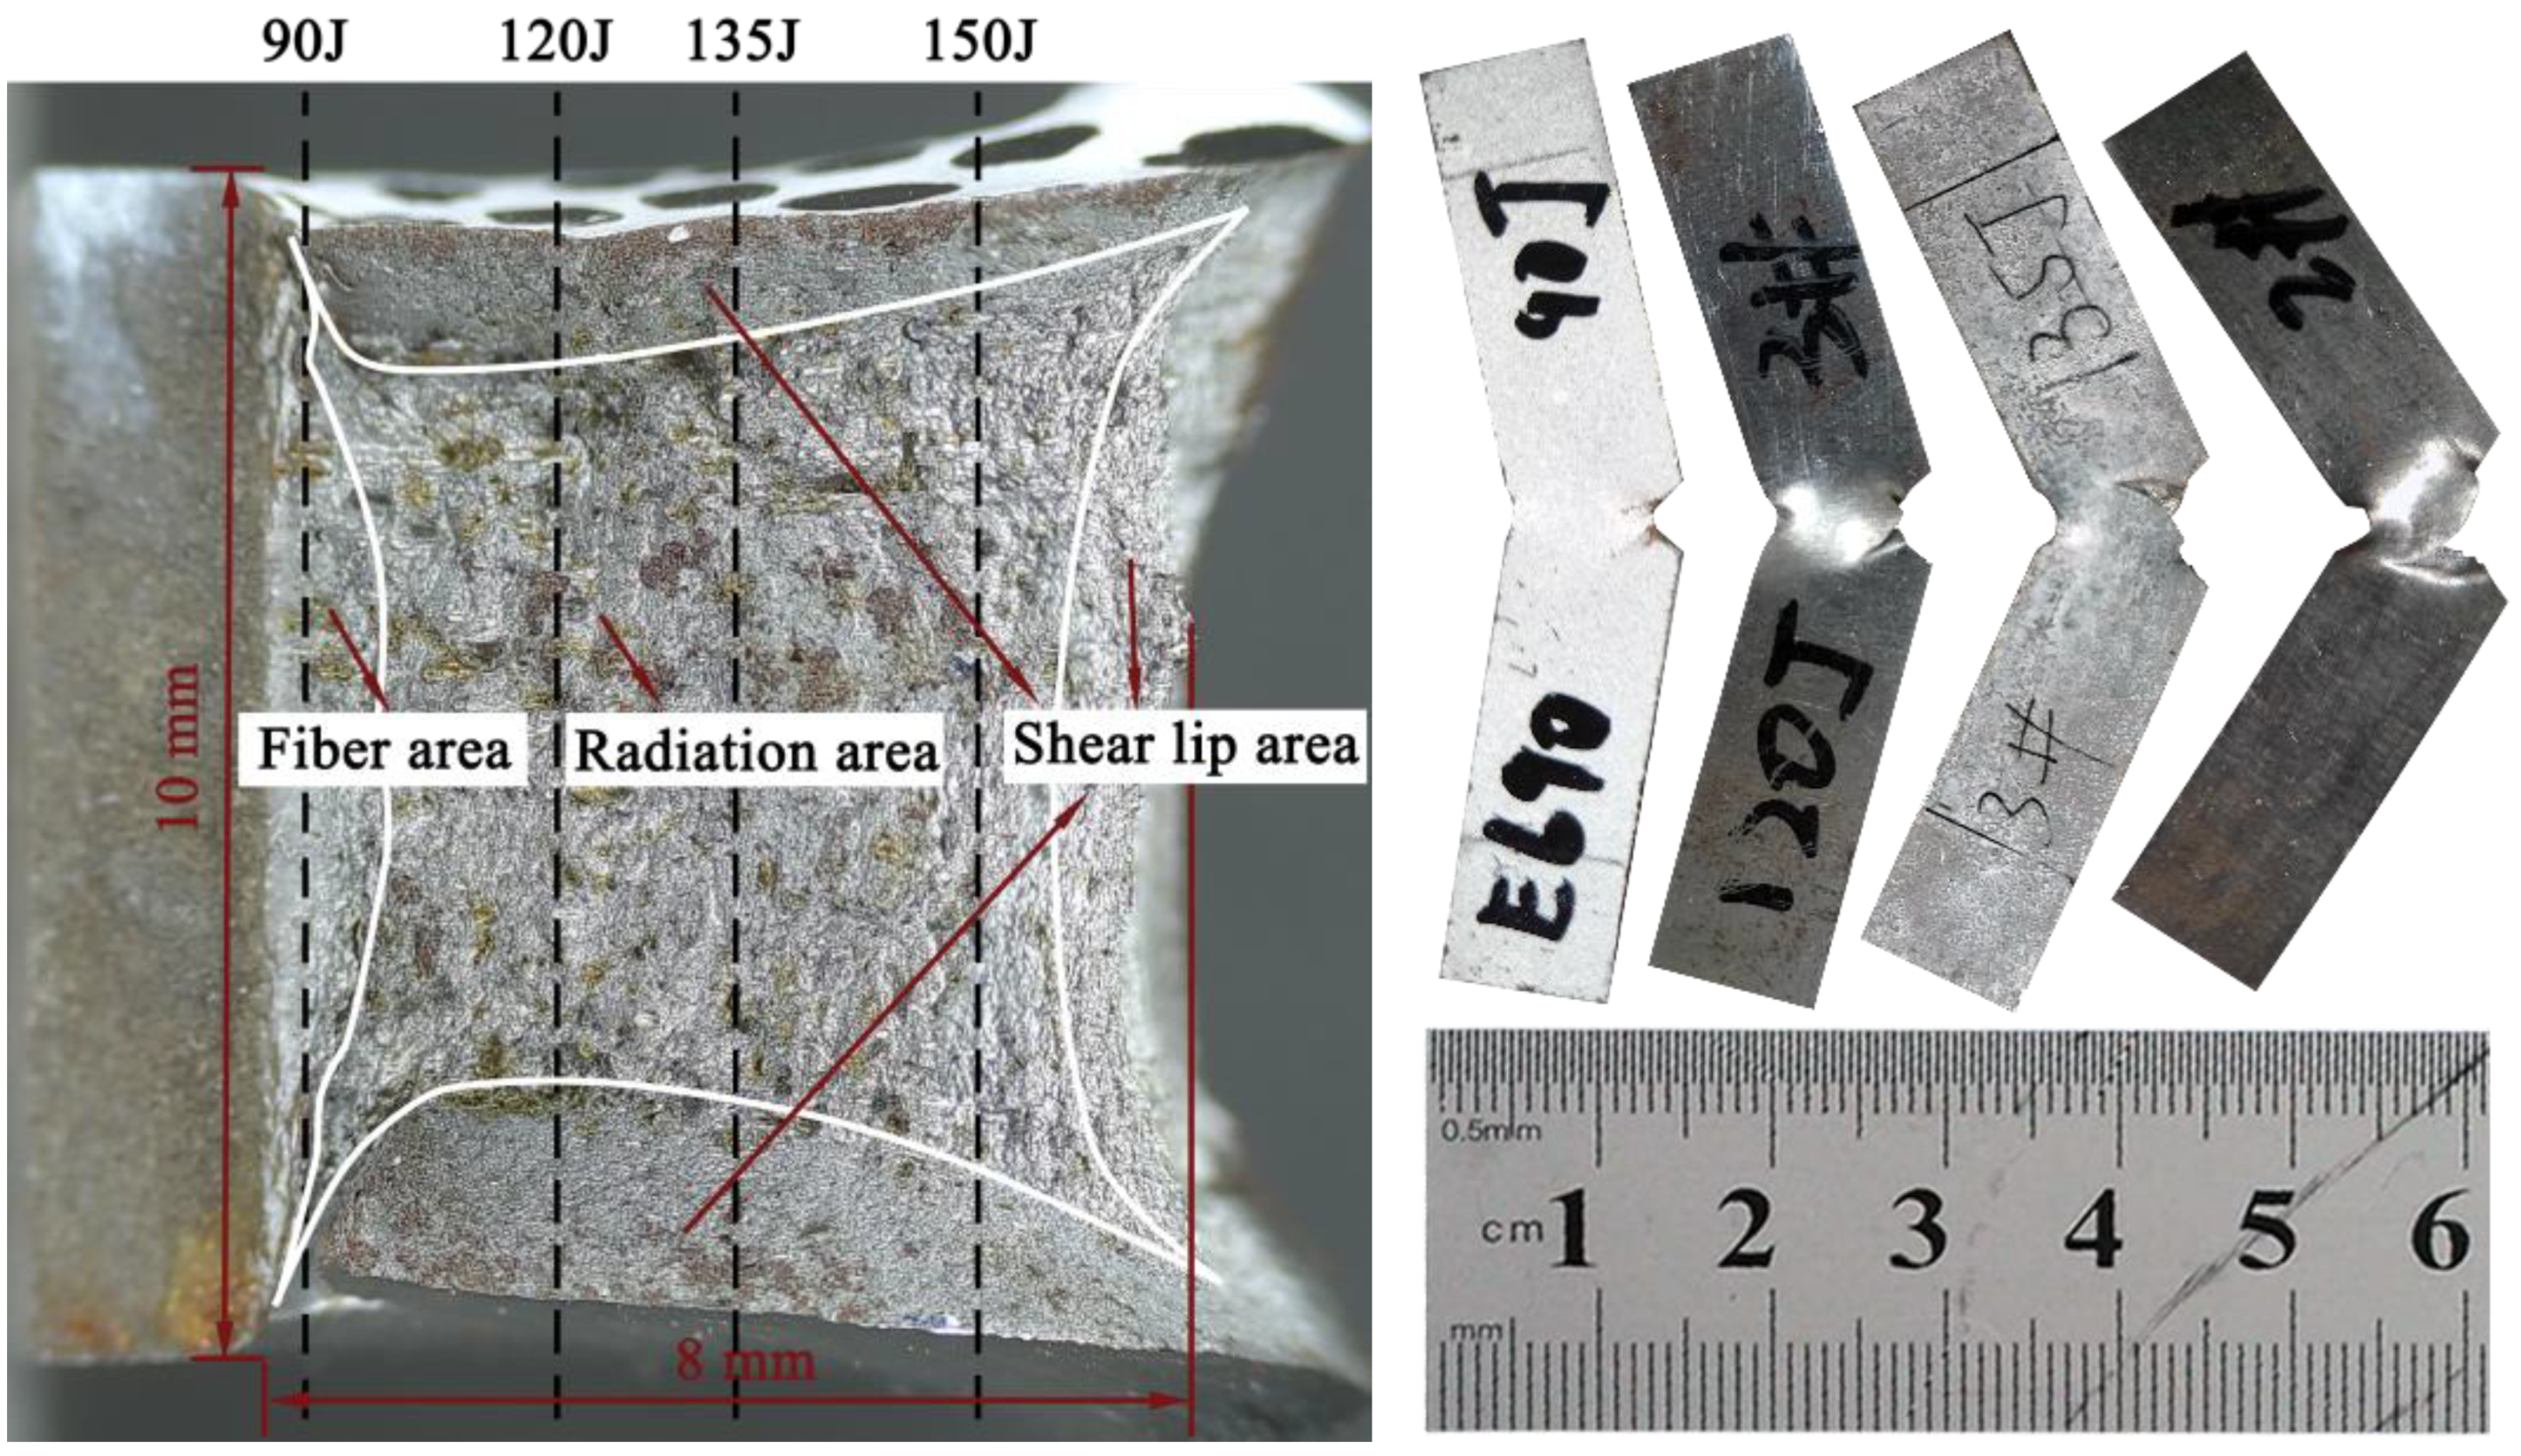
The macroscopic morphology of EH690 specimen under 150 J impact energy is shown in Figure 8. The black vertical lines indicate the crack arrest positions on the surface of the specimen under each impact energy.

Figure 8.
Macroscopic Appearance of EH690 Specimen under 150 J Impact Energy.
Figure 8 shows that there is fiber area, radiation area, and shear lip area on the surface of the fracture specimen. Radiation and fiber zones are essentially in the same plane. The junction between the two regions is curved. The radiation zone exhibits parallel lamellar tearing and plastic deformation characteristics.
The results indicate that fracture initiation occurs at a central crack source in the V-notch. Subsequently, this crack source propagates towards both the inner and outer surfaces of the specimen, leading to the formation of a fiber zone. Upon establishing the fiber zone, crack propagation proceeds towards the outer surface until failure of the specimen occurs, characterized by sudden fracture and development of a shear lip.
3.4. Analysis of Micro-Morphology of Specimens
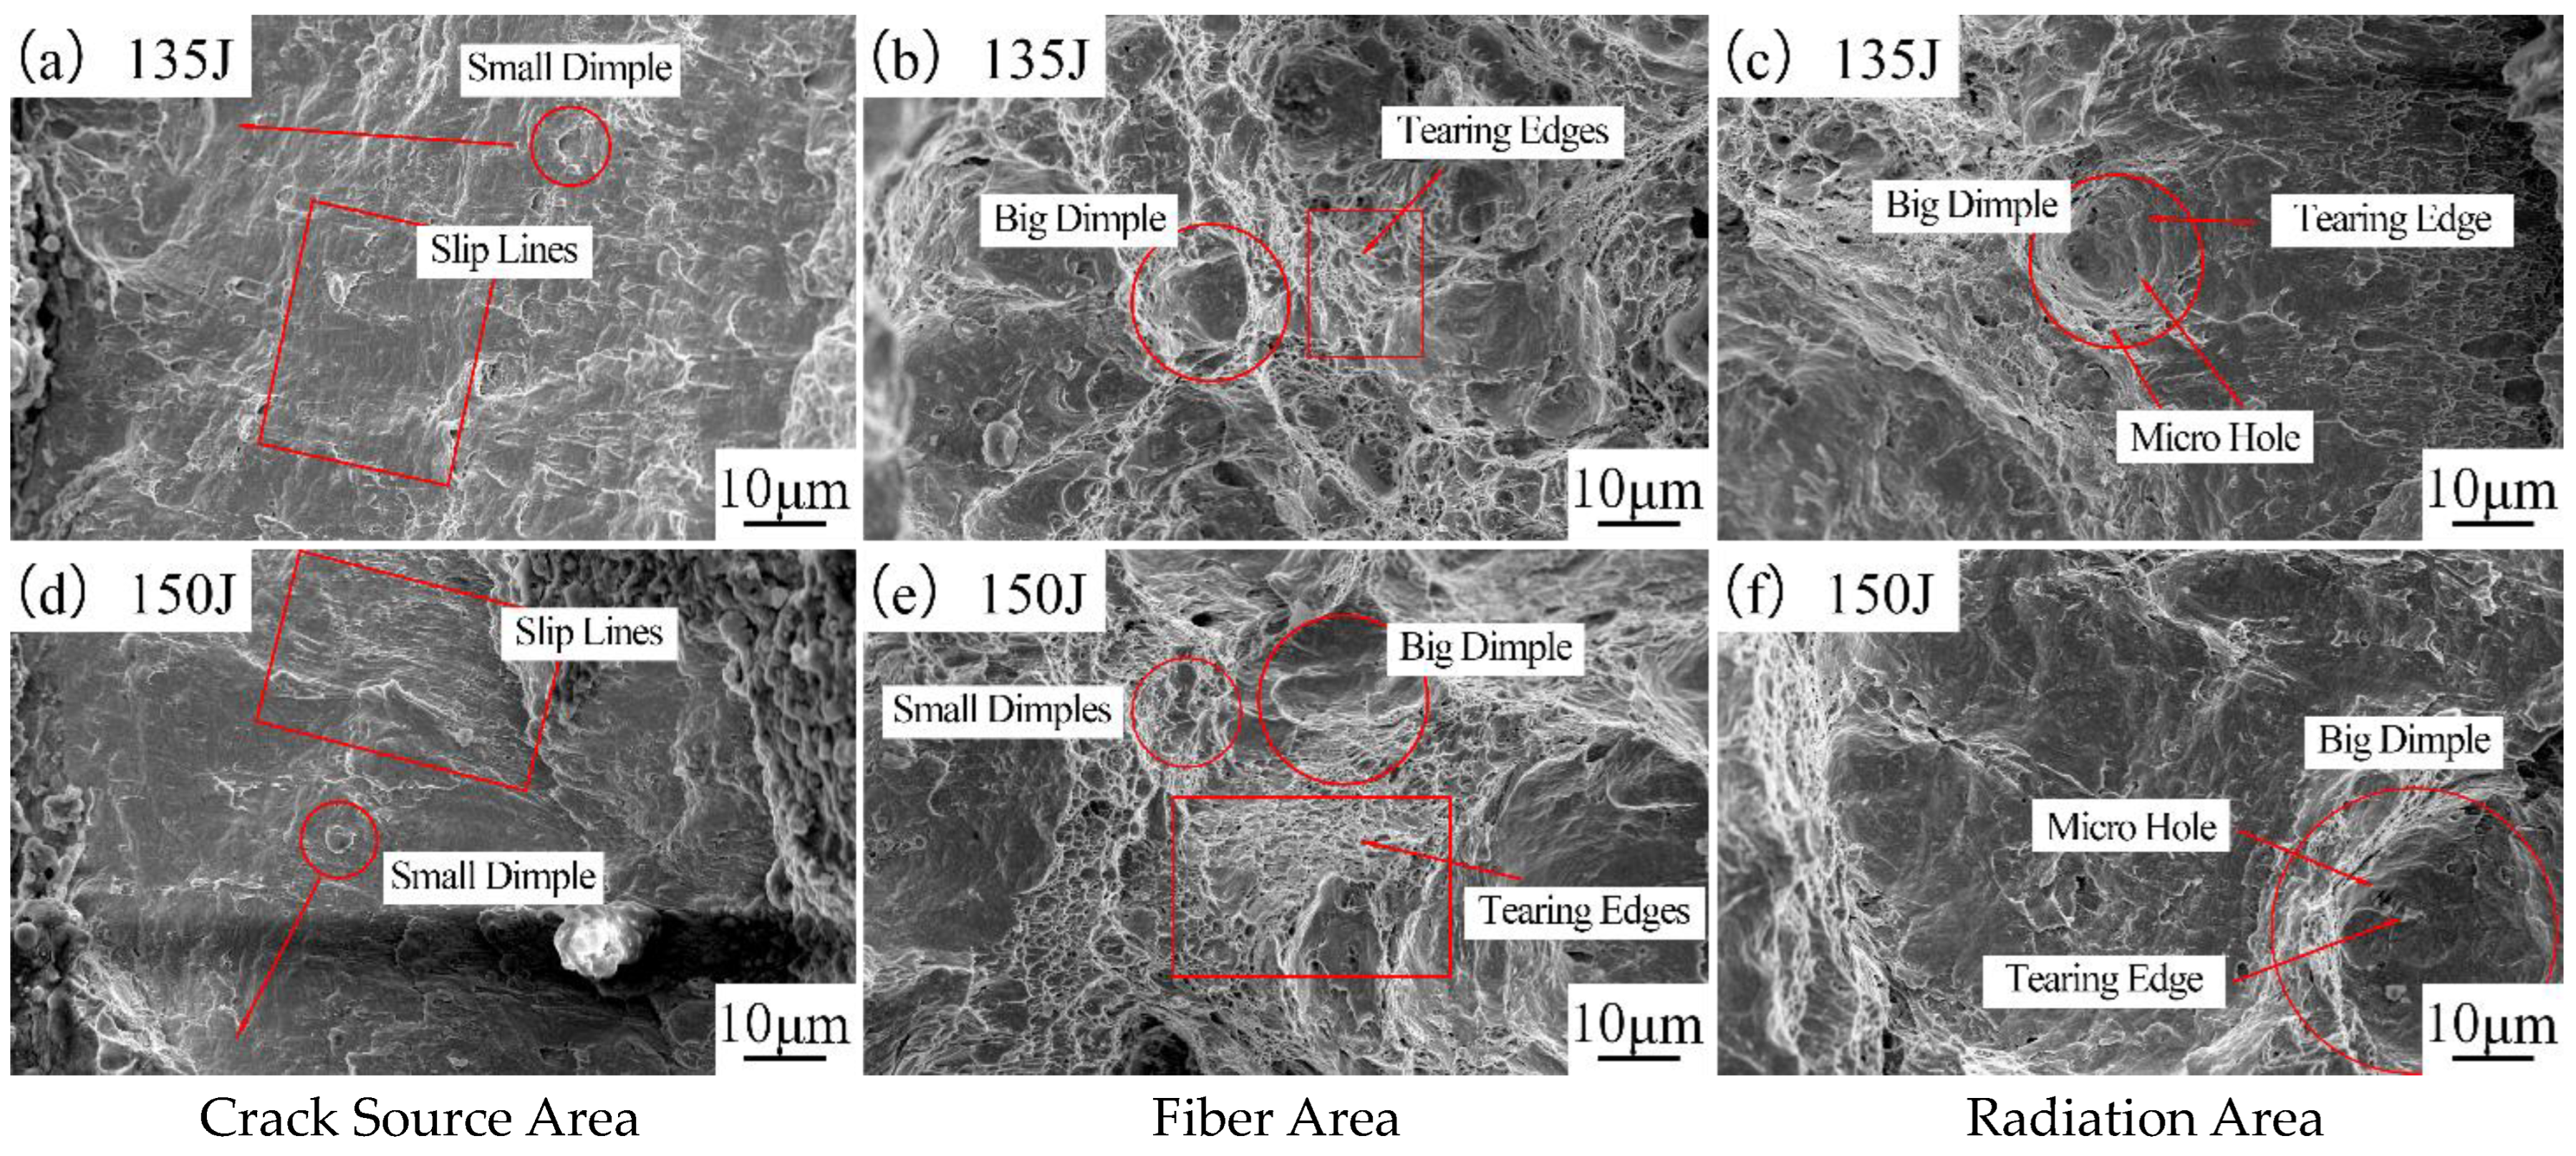
The fracture morphology under impact energies of 135 J and 150 J is depicted in Figure 9. Figure 9a,d show the micromorphological characteristics of the crack source area of EH690 specimens at 135 J and 150 J. There are a few shallow tearing dimples and slip lines visible in the figure. The dimple indicates the source of the crack, and the slip line is oriented perpendicular to the direction of the dimple, pointing towards the upper region of the fiber area. The results indicate that the crack initiation occurs within the central region of the V-notch during the deformation process, subsequently expanding rapidly in both lateral and internal directions. Therefore, shallow parabolic tearing dimples oriented perpendicularly to the V-notch are generated within the interior region. During the slip deformation process, a limited number of tearing dimples are specifically directed towards these newly formed crack sources, concomitant with the development of new crack initiation sites. The slip line is directed towards the uppermost portion of the fiber.

Figure 9.
Microscopic Fracture Morphology Features near the Pre-existing Crack Location of EH690 Specimens under Different Impact Energies.
Figure 9b,e show the microscopic morphology characteristics of the fiber zone of the EH690 specimen under 135 J and 150 J. The results indicate that there are a small number of large and deep tear dimples, and dense small dimples and tear edges surrounding the large dimples. Dimples point toward a V-shaped notch.
The micromorphology characteristics of the radiation area of EH690 specimens at 135 J and 150 J are shown in Figure 9c,f. Compared with the fiber area, the larger dimples caused by tearing display a more prominent prominence. The dimples contain holes and short, curved, discontinuous tear ridges. Upon crack initiation, the crack propagated rapidly, and subsequent specimen propagation occurred without complete plastic deformation, demonstrating both brittle fracture and ductile fracture characteristics.
Combining the load-displacement curve and strain distribution measured by DIC, a comprehensive description of the plastic deformation process can be provided:
(1) As the hammer comes into contact with the specimen, the load, displacement, and strain are linearly increasing over time.
(2) At the V-shaped notch, plastic deformation occurs within a narrow range, with a slower rate of load increase and a faster rate of displacement increase.
(3) The V-shaped notch exhibits a wide range of plastic deformation, leading to the initiation of a plastic hinge in the specimen. As a result of this stage, the applied load remains constant or even decreases slightly, while displacement increases at a maximum rate.
(4) As the deformation increases, the material enters the strengthening stage, resulting in an increase in bearing capacity and a slowdown in displacement growth. A crack source is formed at the tip of the V-notch inside the specimen, and it extends to both the inner and outer surfaces of the specimen, forming a fiber zone.
(5) As the crack propagates to the surface of the specimen, complete fiber formation occurs, with a peak strain value occurring as a result. The initiation of cracks is then apparent, resulting in a reduction in the applied load. Upon reaching a critical length, instant fracture occurs within the crack, resulting in the development of a shear lip.
3.5. Finite Element Simulation Results and Analysis
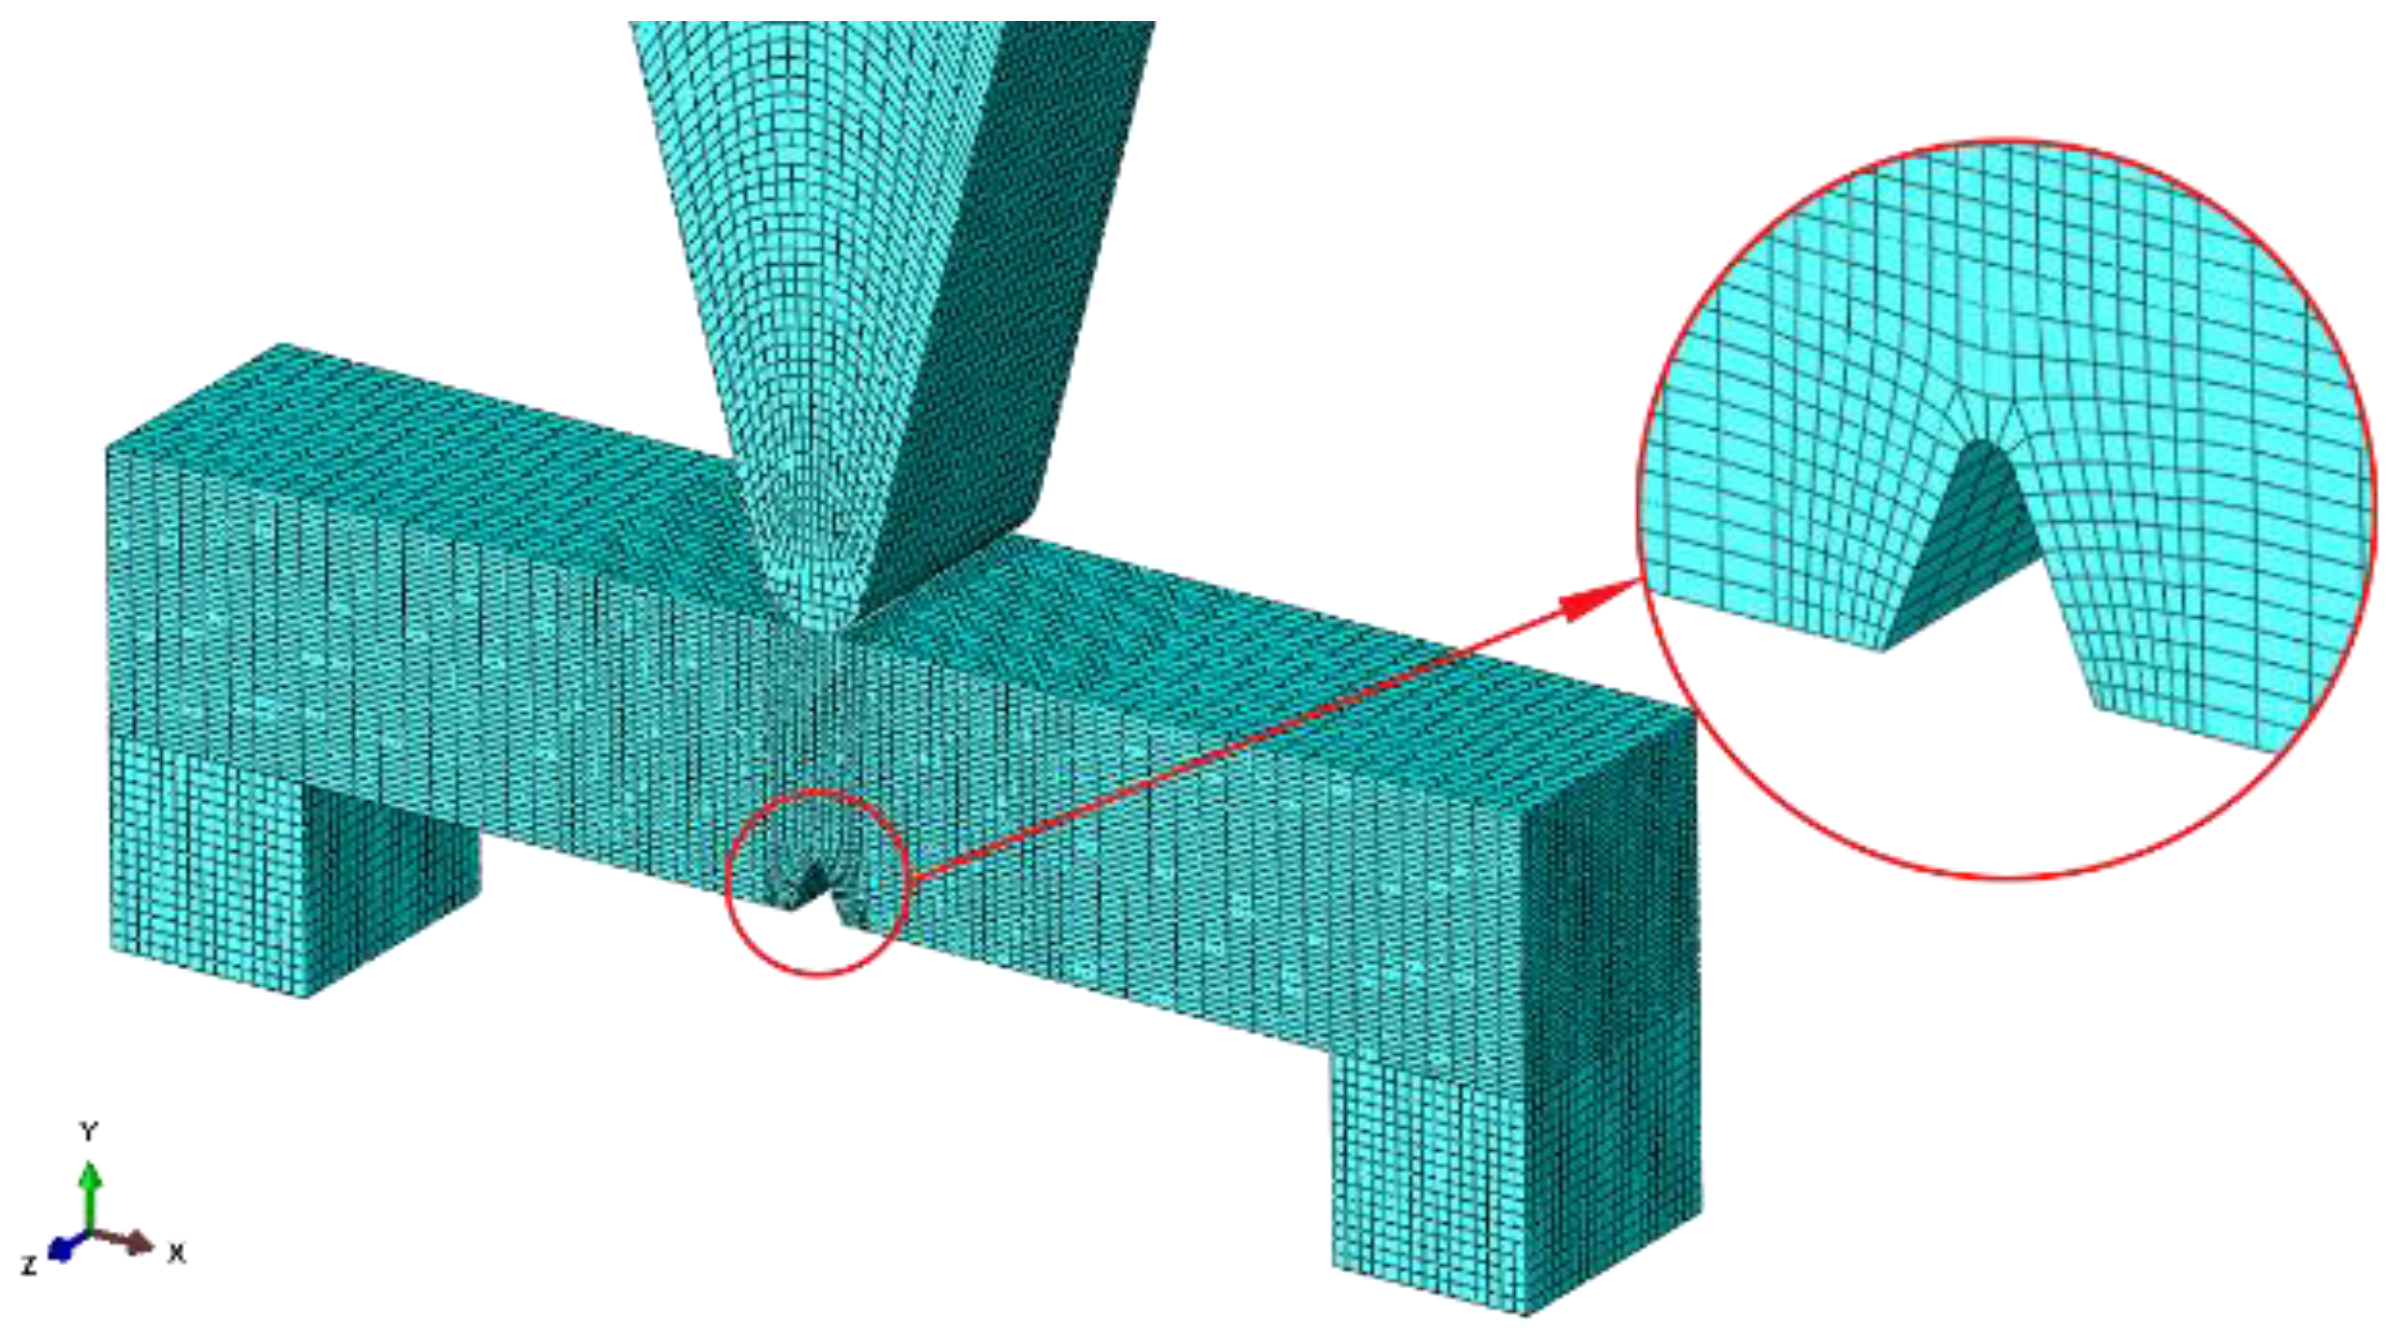
A finite element model was developed using ABAQUS finite element analysis software, as shown in Figure 10. The geometric parameters of the model are shown in Figure 1. The hammer head and support are modeled as rigid bodies, with a mass of 16.1 kg for the hammer head. There are 73,479 model nodes and 67,240 elements in the specimen mesh of type C3D8R. Analysis step is set to Dynamic, Explicit, and analysis frequency is set to 0.003 s. Two fulcrums are fully constrained, which enables only the hammer head to move in the y direction, while allowing free movement in both the x and y directions and facilitating rotation in the z direction for the specimen. Considering the global gravitational field exerts a constant acceleration of 9.8 m/s2, the corresponding impact velocities for 90 J, 120 J, 135 J, and 150 J are imparted to the mass point of the hammer. The impact velocities measured were 3344 mm/s, 3861 mm/s, 4095 mm/s, and 4317 mm/s, respectively.

Figure 10.
Finite Element Model of the Falling Hammer Impact.
The Johnson-Cook constitutive model is used to describe the material, and the drop-hammer impact process exhibits negligible temperature variations. Thus, the empirical formula can be simplified:
where, σ is stress. ε is the plastic strain, ε* is the dimensionless plastic strain rate, and its value is ε/ε0. A is the initial dynamic yield strength, B is the strain hardening index, and C is the strain hardening factor. The model parameters involved in the simulation are shown in Table 3 [40].
Table 3.
Physical and Mechanical Properties of EH690 Steel.
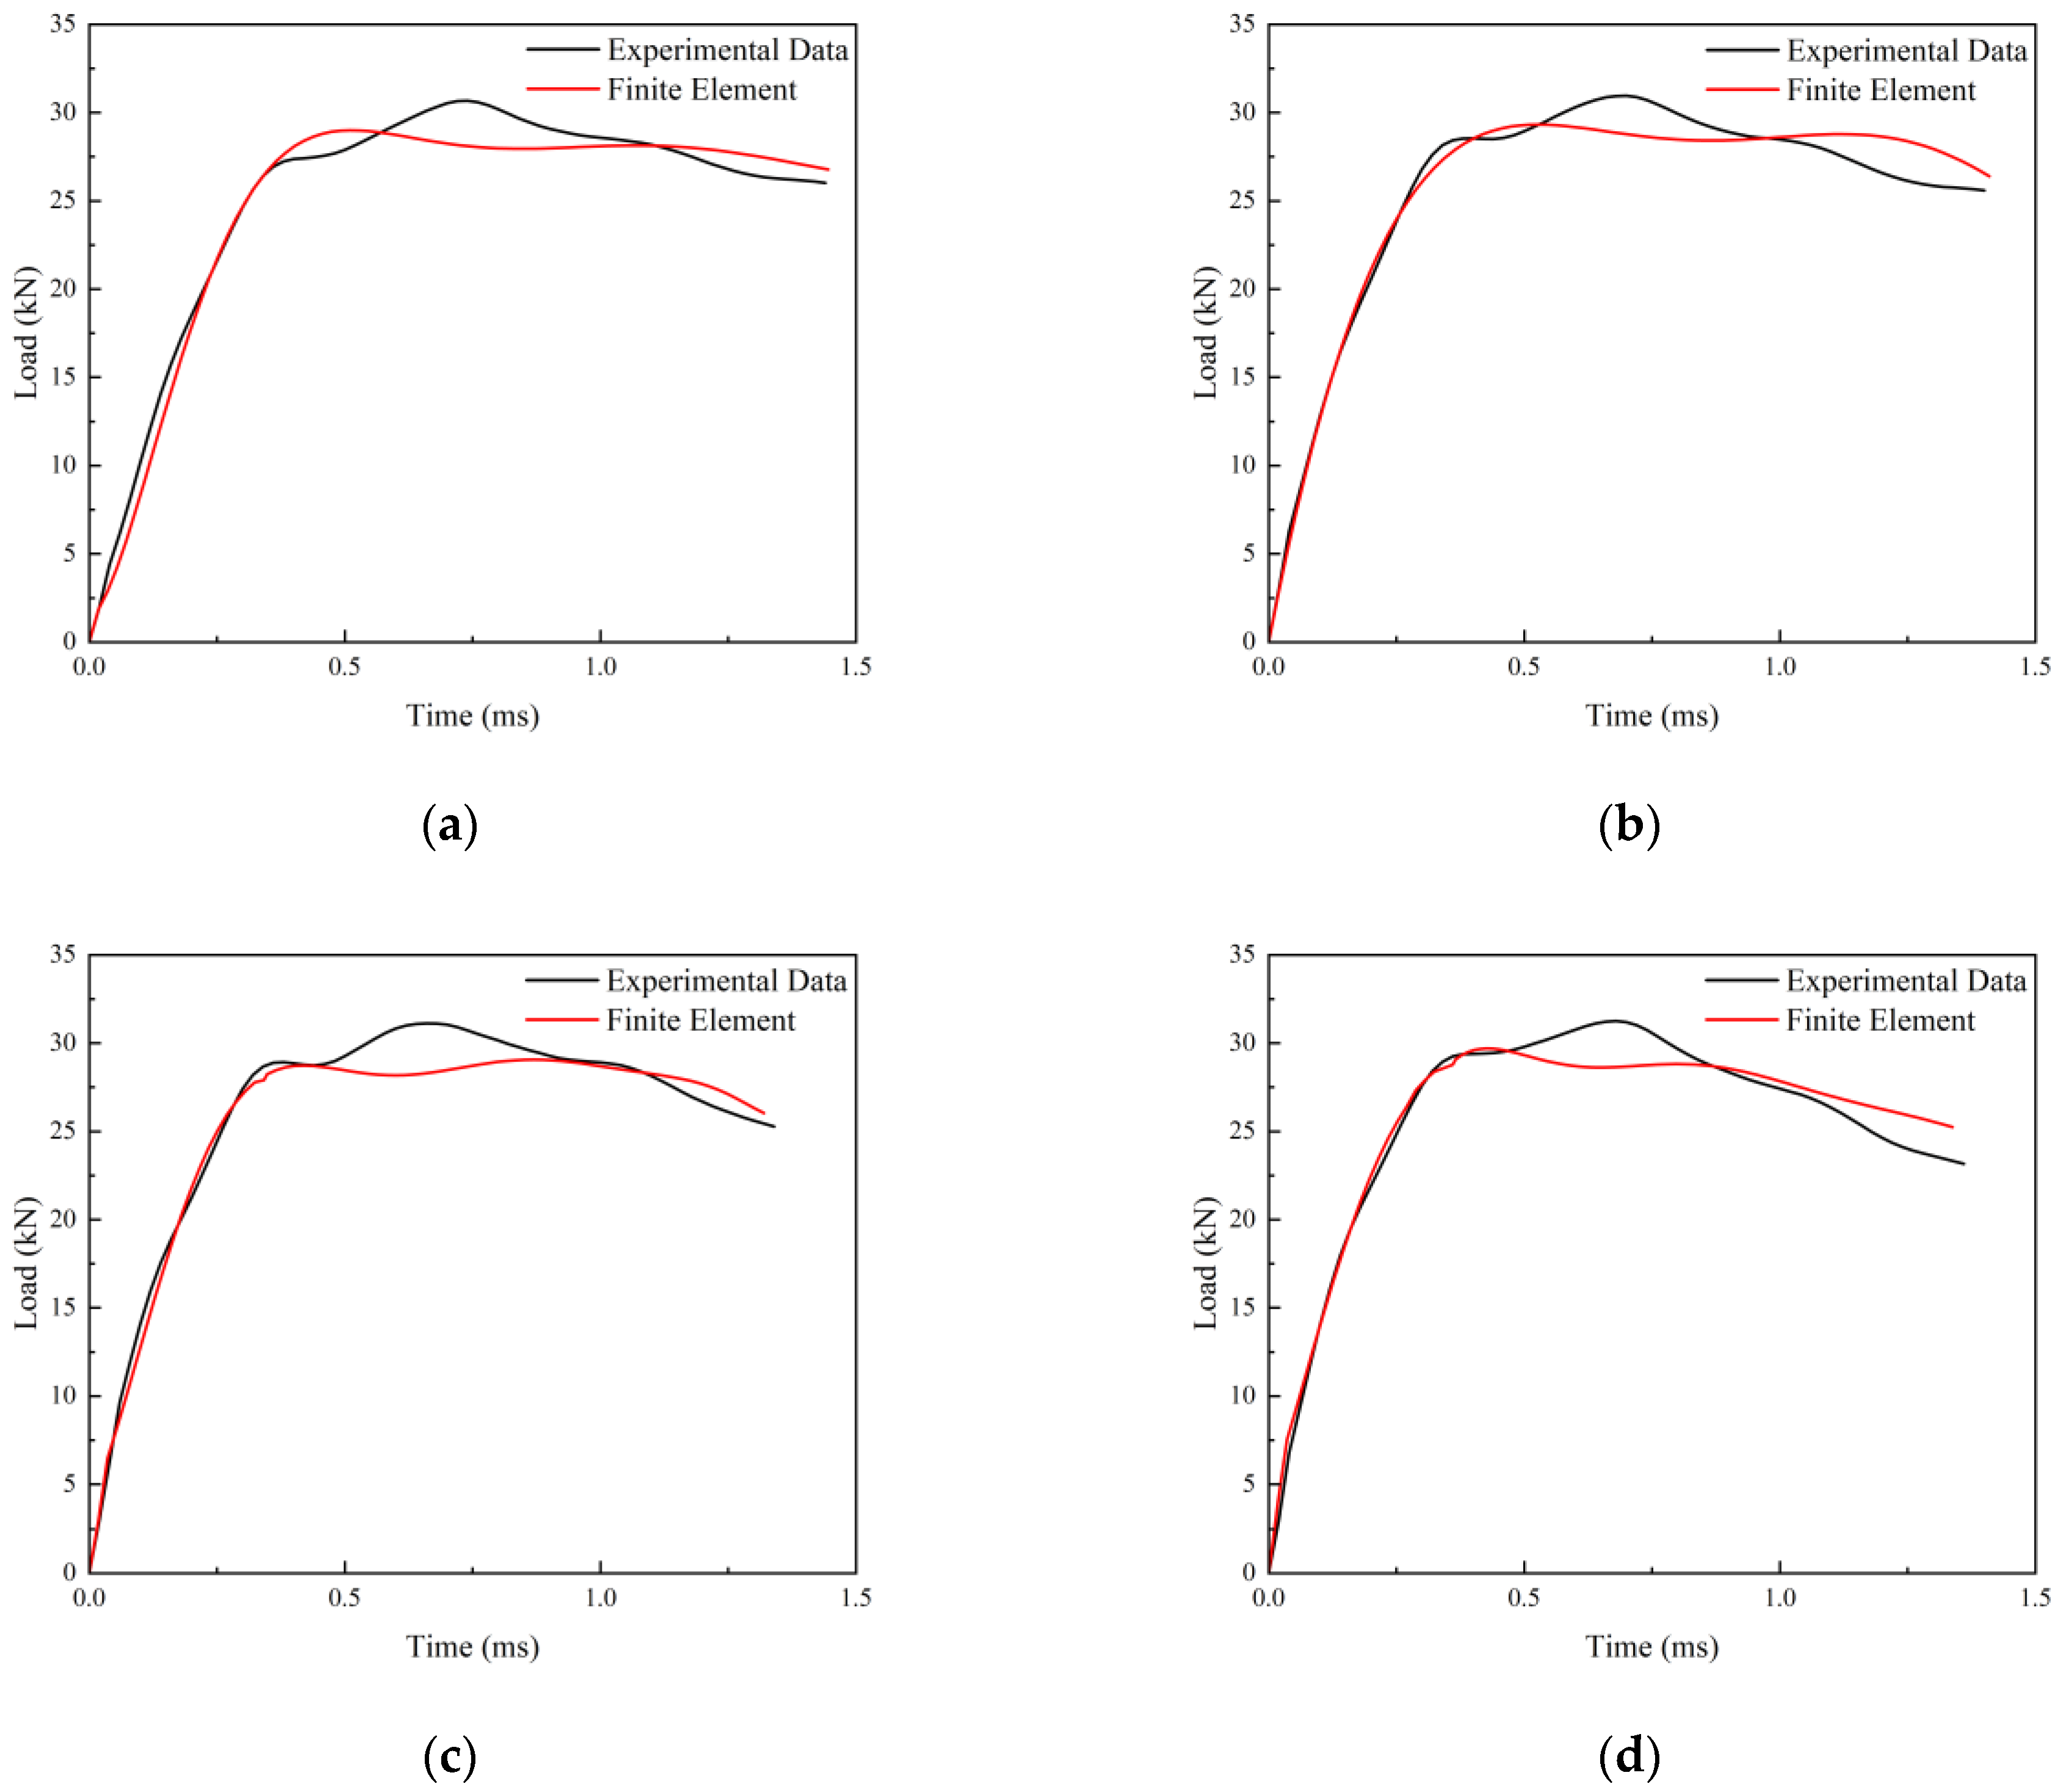
Figure 11 shows the comparison between the test results and the finite element simulation results under different impact energies. The results show that the finite element simulation results exhibit a similar trend to the test results. However, the peak load error of 9.42% is likely due to a reduction in bearing capacity resulting from crack initiation during specimen simulation.
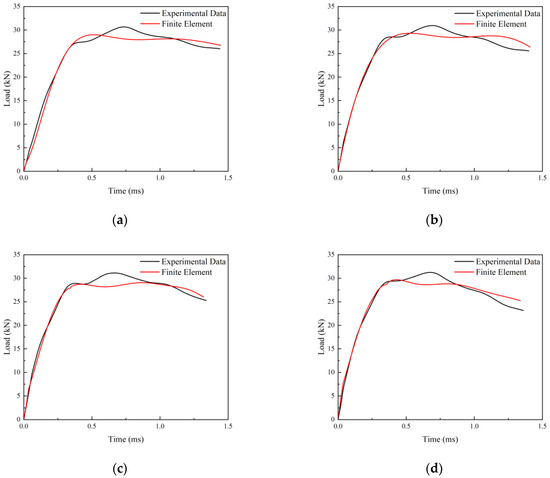
Figure 11.
Comparison between Experimental Data and Finite Element Load-Time Curves for EH690 Specimens under Different Impact Energies: (a) 90 J; (b) 120 J; (c) 135 J; (d) 150 J.
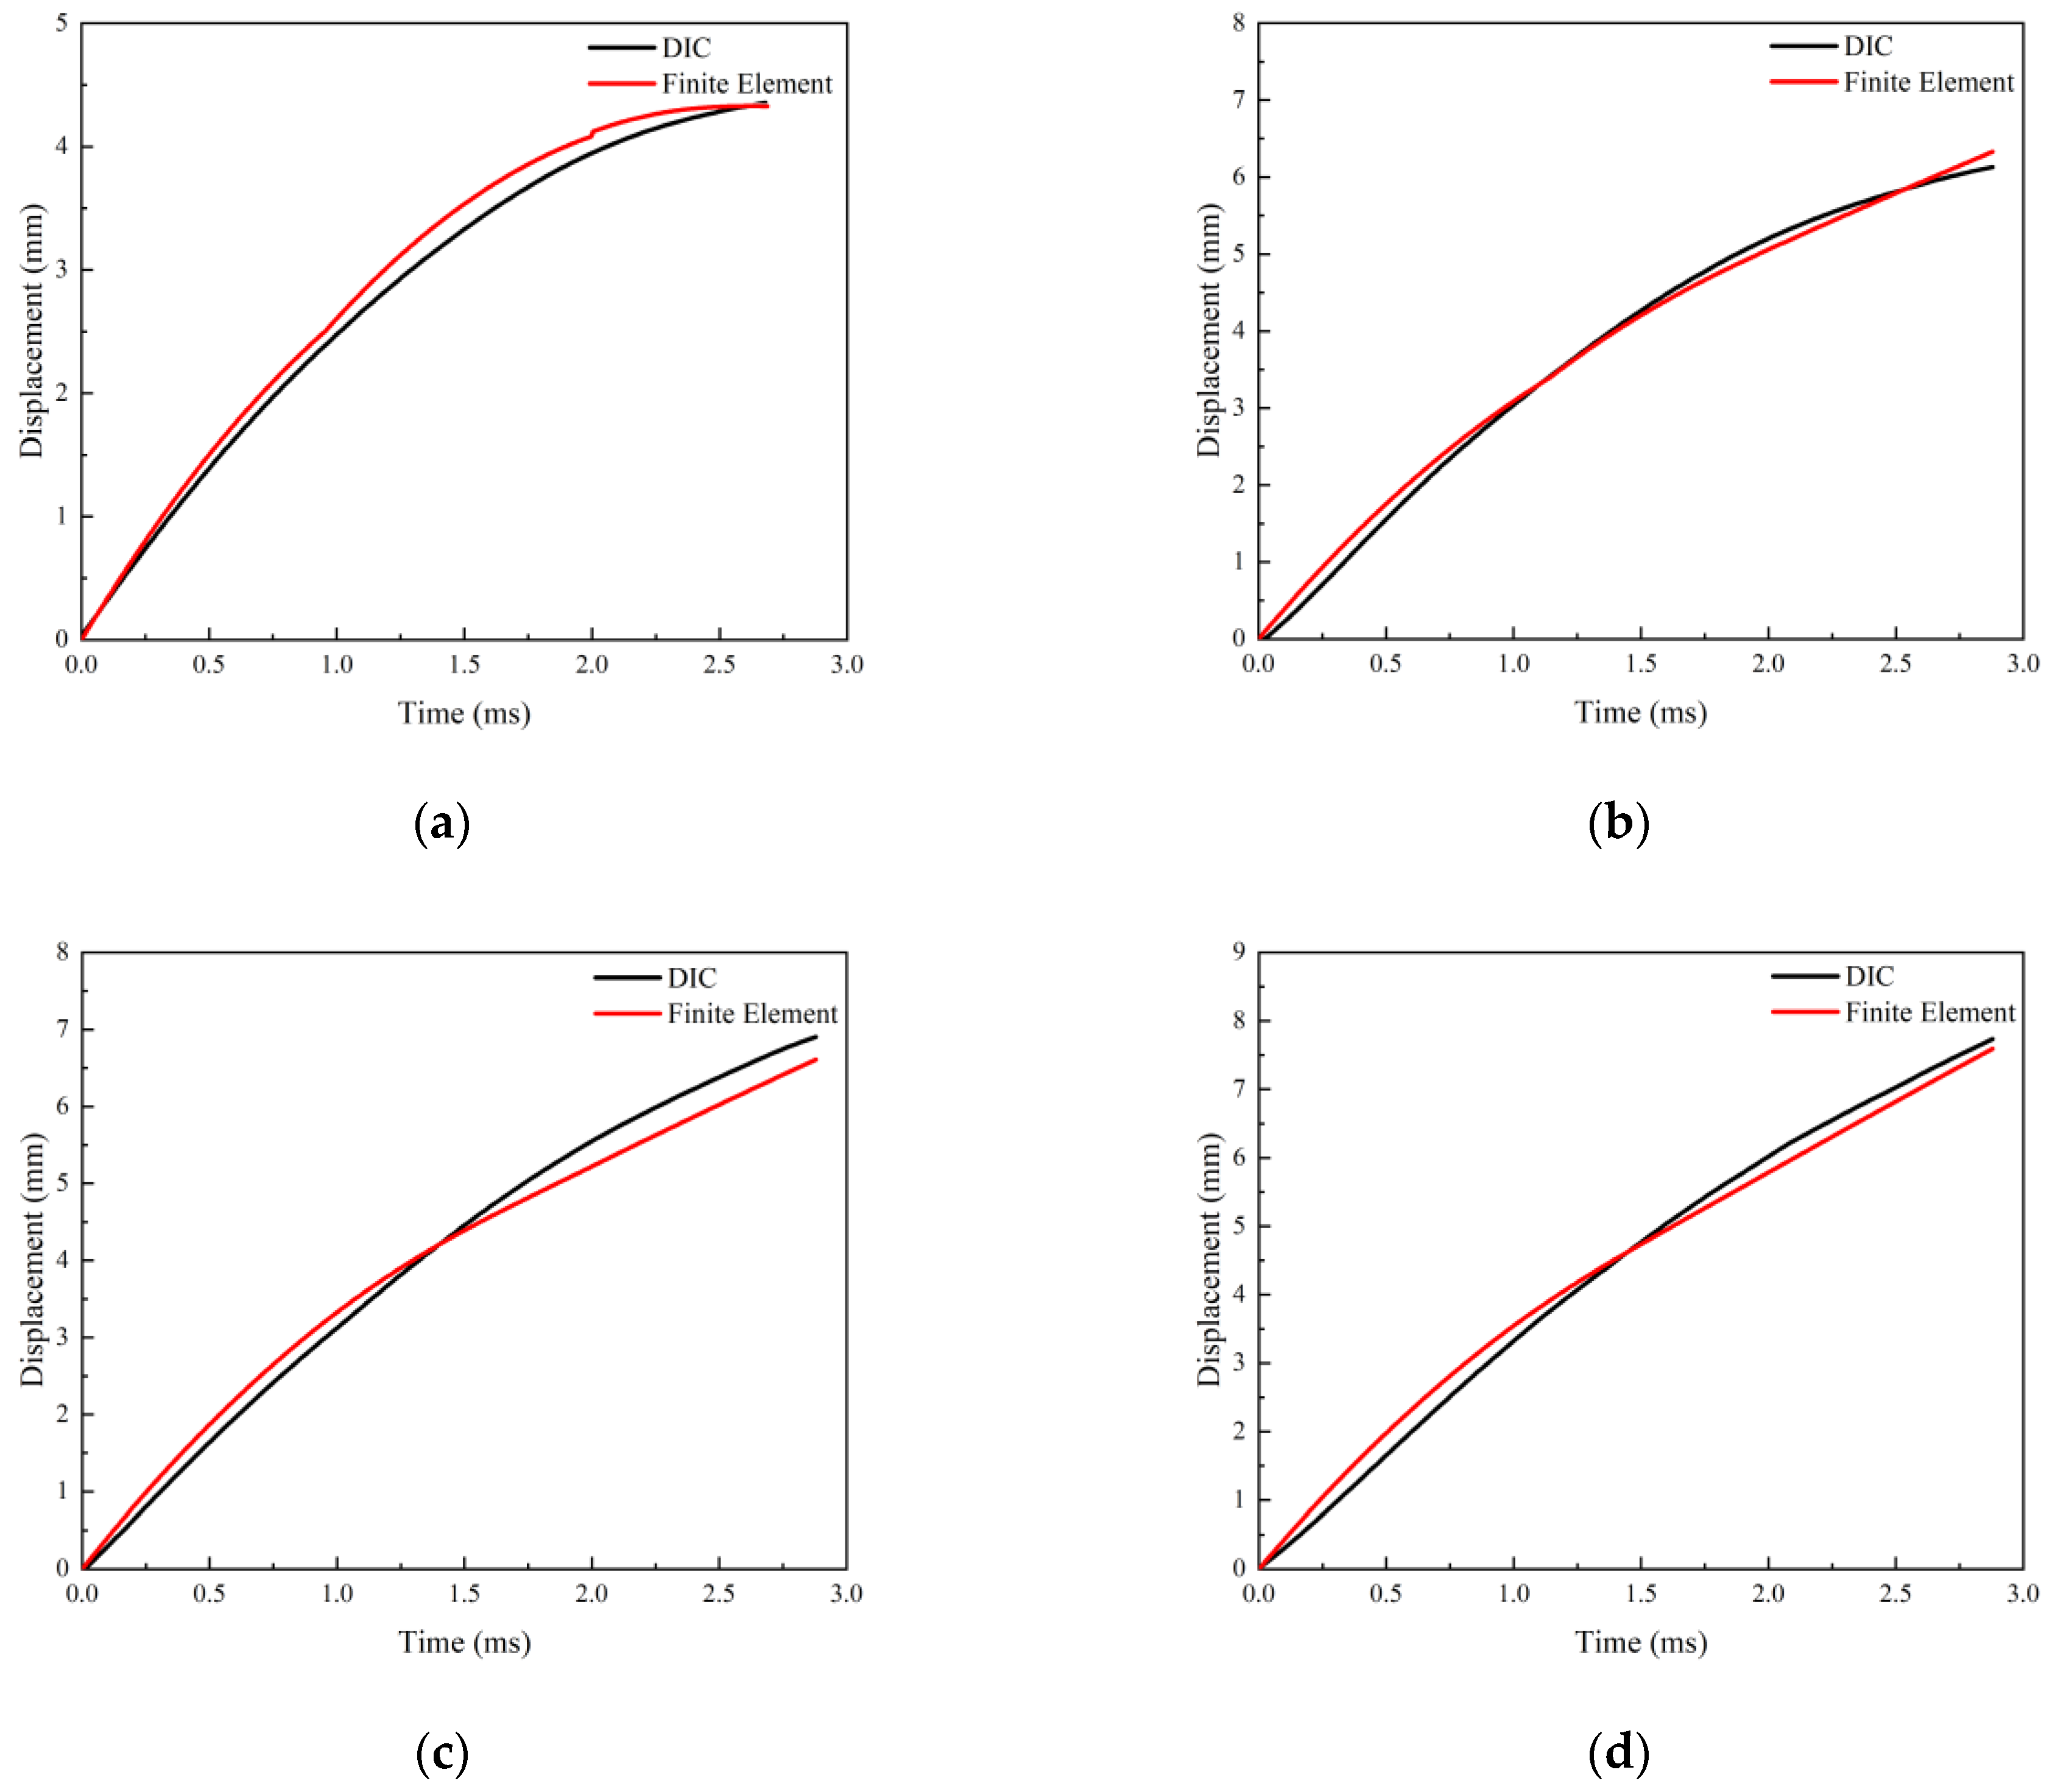
Figure 12 illustrates the comparison between the DIC displacement-time curve and the finite element results under different impact energies. The results show that the displacement-time curve obtained from the finite element calculation is in agreement with the DIC result, and the maximum error between the finite element and DIC is 5.61%.
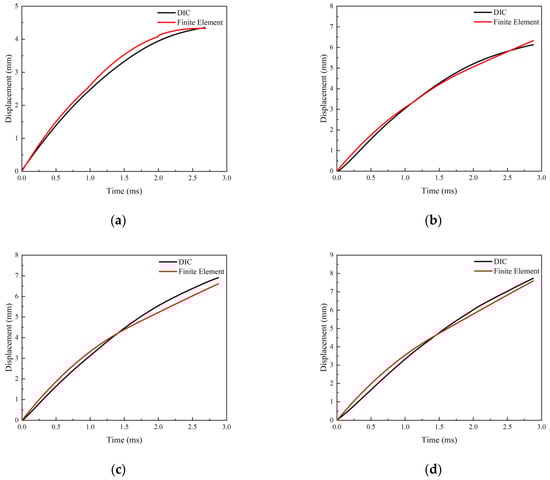
Figure 12.
Comparison between DIC Analysis and Finite Element Displacement-Time Curves for EH690 Specimens under Different Impact Energies: (a) 90 J; (b) 120 J; (c) 135 J; (d) 150 J.
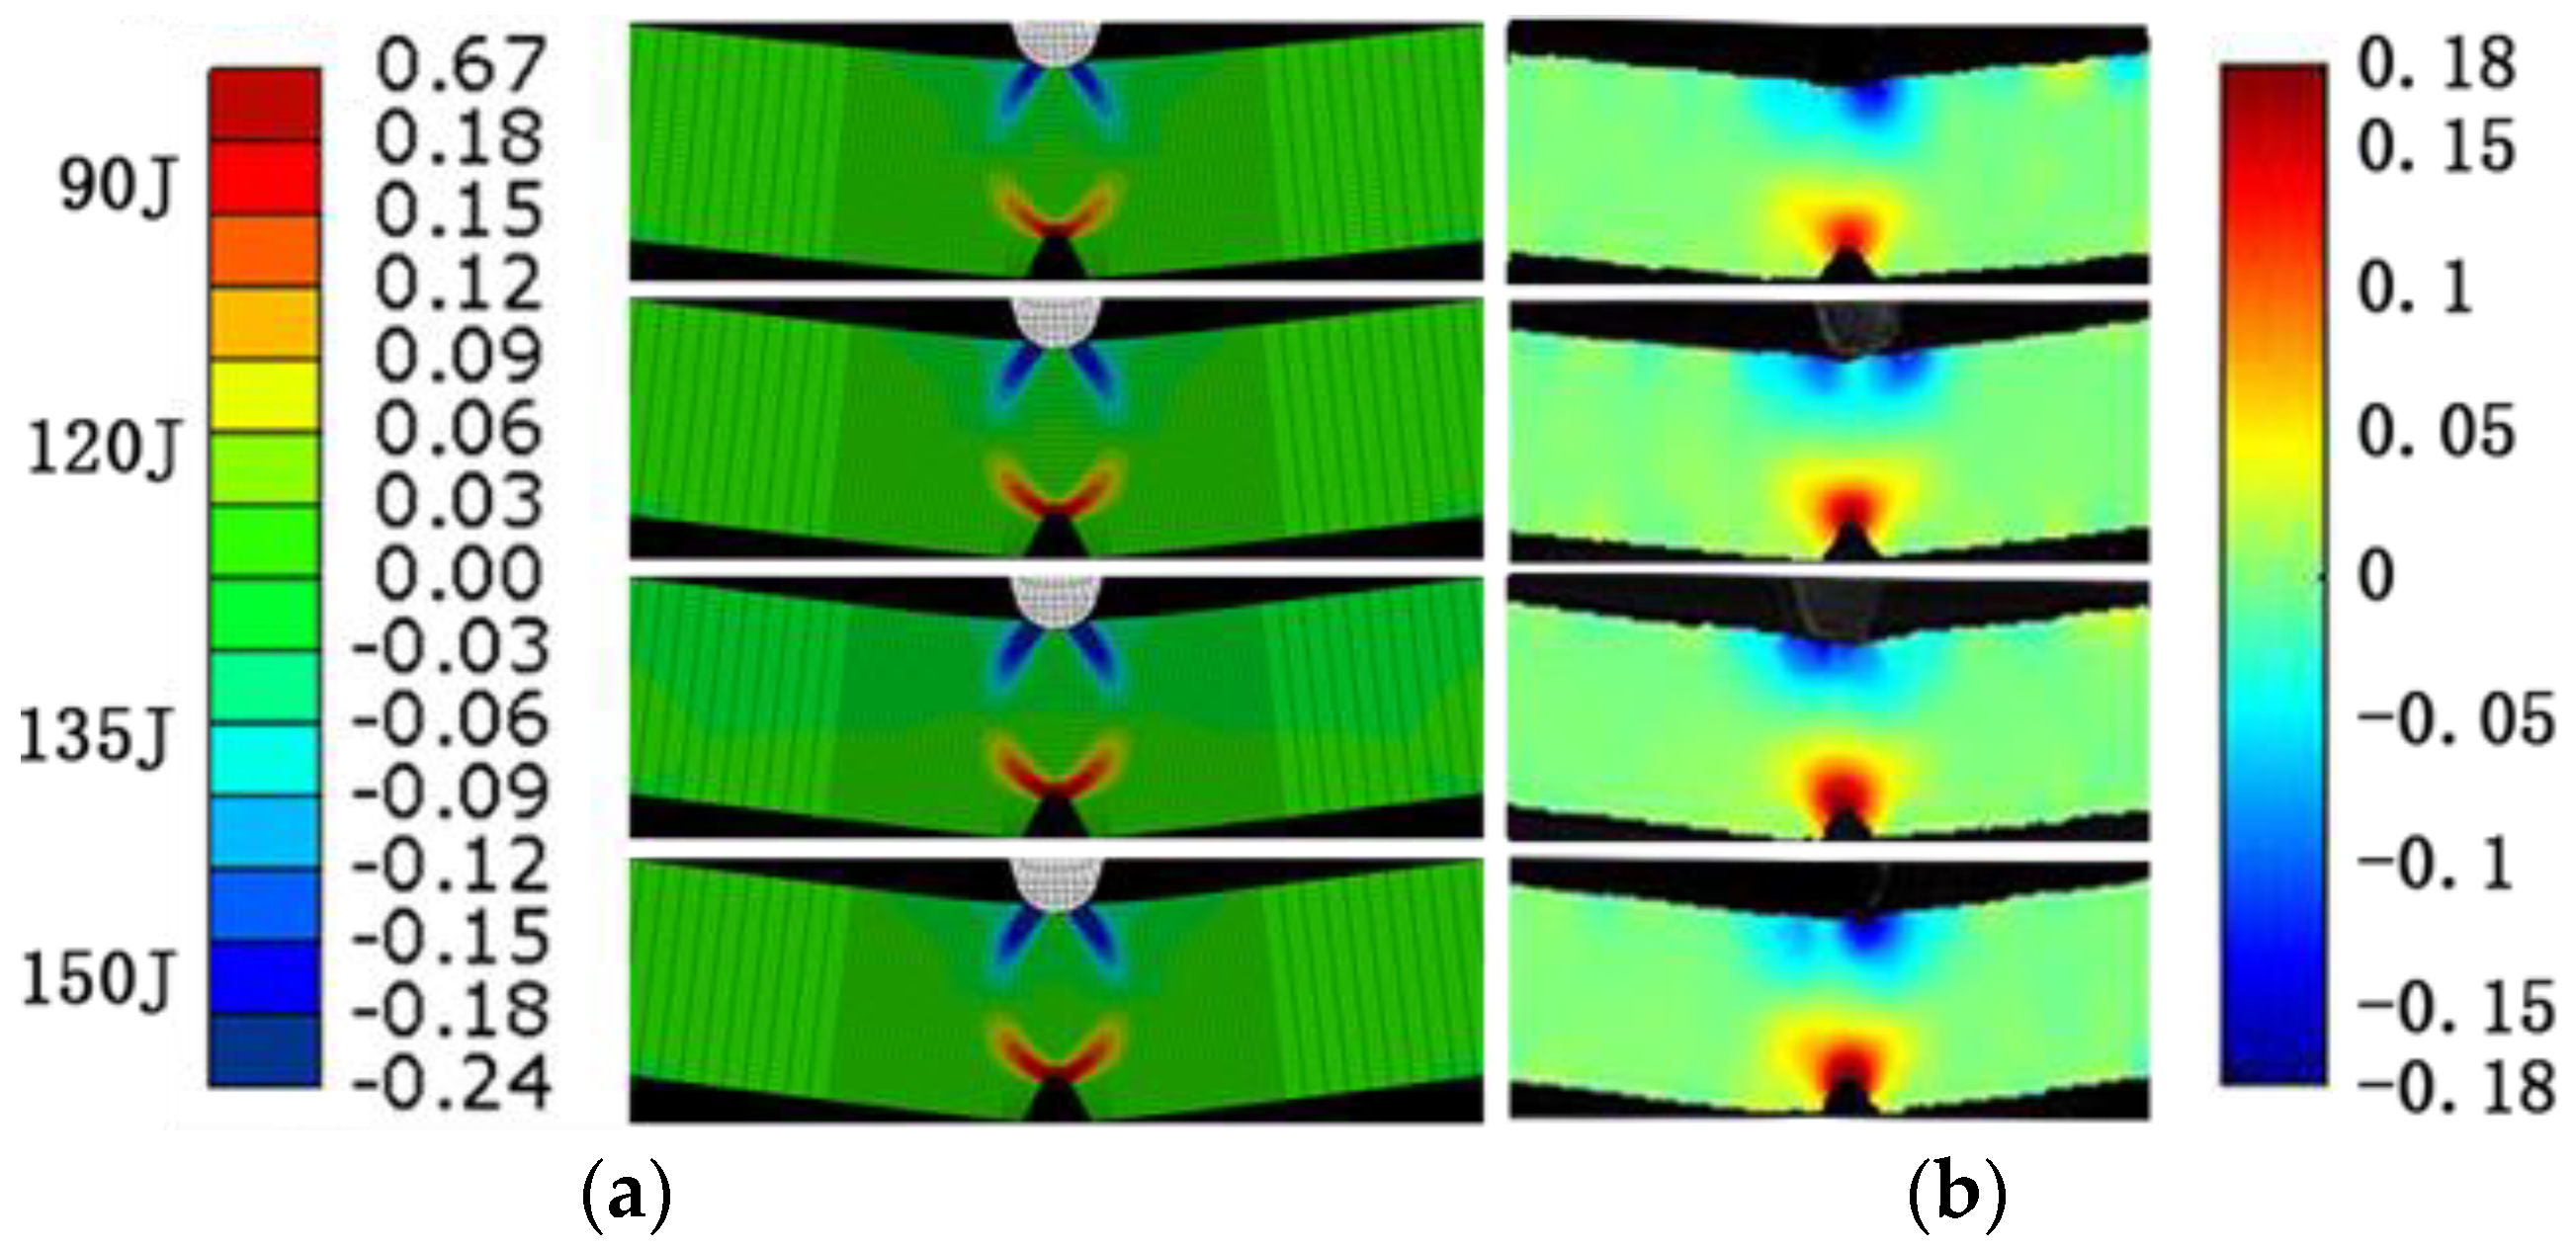
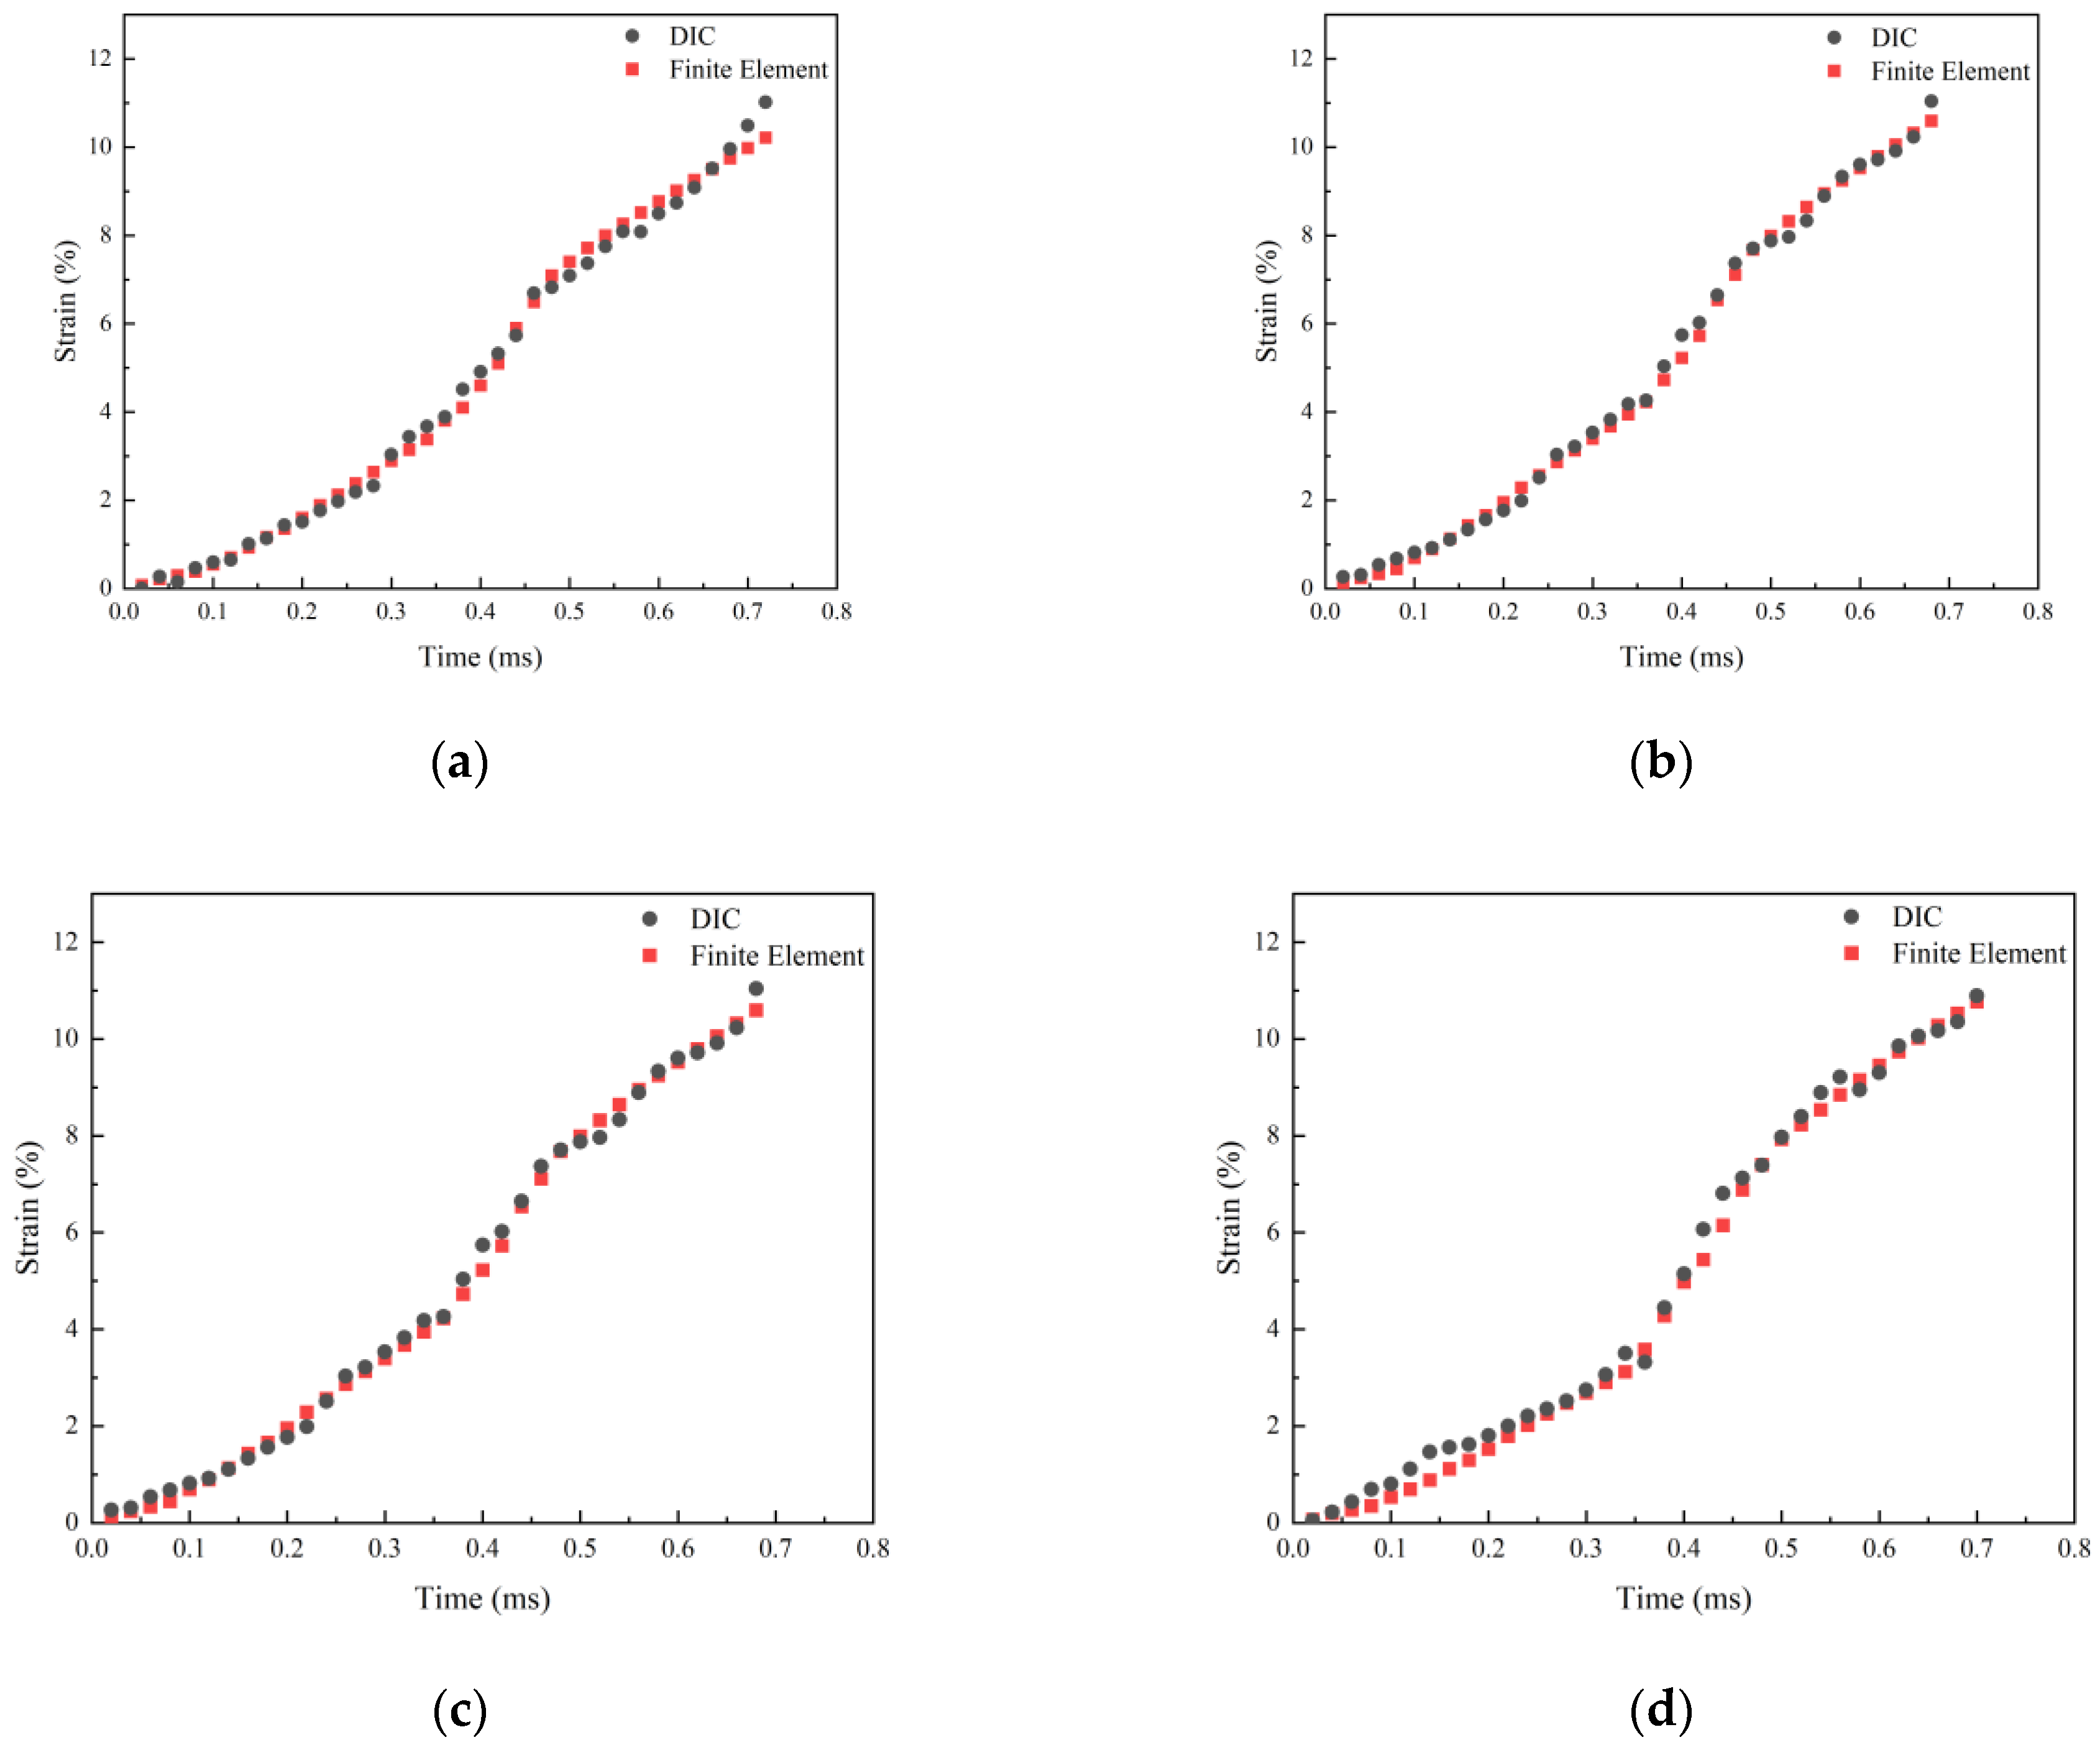
Figure 13 illustrates the comparison between the strain distribution of the EH690 specimen before cracking and the strain cloud diagram obtained from finite element analysis under different impact energies. The results indicate that the finite element results are essentially identical to the DIC strain distribution area and size. The compression and tension areas exhibit a saddle-shaped pattern, although the degree of concavity varies. The finite element results and DIC strain-time curves of EH690 specimens under different impact energies are shown in Figure 14. According to the results, it is possible to divide the strain-time curve into 3 stages, which is consistent with the load-time division shown in Figure 3. Finite element calculations generally match DIC test results. The error between the DIC and the finite element analysis remains below 10.68%.
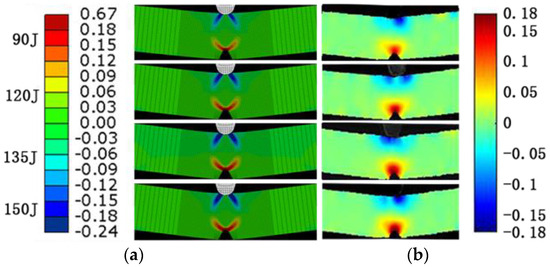
Figure 13.
Comparison of DIC and Finite Element Strain Maps Before Crack Initiation for EH690 Specimens under Different Impact Energies: (a) Finite Element; (b) DIC.
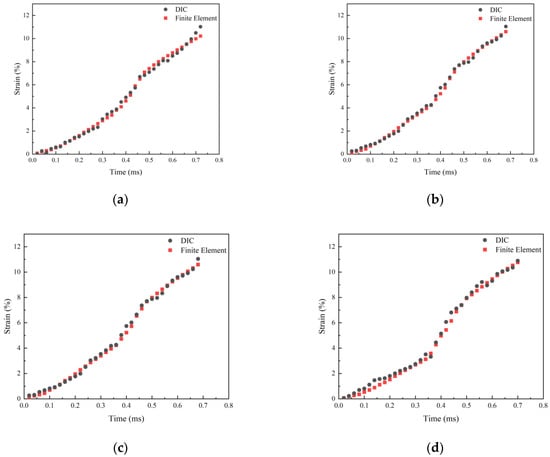
Figure 14.
Comparison of DIC and Finite Element Strain-Time Relationships for EH690 Specimens under Various Impact Energies: (a) 90 J; (b) 120 J; (c) 135 J; (d) 150 J.
Table 4.
Discrepancy between DIC and Finite Element Analysis for EH690 Specimens under Different Impact Energies.
4. Conclusions
In this study, the impact test of EH690 steel specimens with a V-notch was carried out using a drop hammer impact tester, high-speed camera, and DIC method. The load-displacement relationships of the specimen under various impact energies and the strain distribution on their surfaces were acquired. By integrating the results from DIC tests and fracture scanning electron microscope micro-morphology analysis, the plastic deformation of the notch upon impact was studied. The following conclusions were derived:
(1) The strain at the notch tip undergoes a brief elastic stage followed by a yield stage as the applied load increases. The load remains constant when a plastic hinge is formed at the notch tip. The formation of a crack source subsequently occurs at the tip of the V-notch in the specimen, which then propagates towards both the internal and external surfaces, resulting in the development of a fiber zone. Upon the propagation of the crack source to the surface of the specimen, the complete formation of a fiber zone occurs, resulting in maximum strain and initiation of cracking at the crack tip.
(2) The fracture of the specimen can be observed through scanning electron microscopy, revealing three distinct zones: the fiber zone, radiation zone, and shear lip zone. The fiber zone is predominantly characterized by a limited number of shallow tear dimples, and conspicuous slip marks are observed on the fracture surface. The radiation zone exhibits prominent and deep tearing dimples, as well as numerous edges with tearing characteristics. Cleavage features are also observed in the shear lip region.
(3) The ABAQUS software was employed to establish the finite element model of the EH690 V-notch specimen subjected to impact, enabling analysis of the plastic deformation, stress, and deformation characteristics at the tip of the V-notch under identical impact energy as in the experimental test. The findings demonstrate a load-time curve trend consistent within an error margin below 5%, while the maximum error for displacement–time curve is less than 8.83%.
Author Contributions
X.X.: Experiment, Calculation and data analysis, draft, Writing—review & editing. J.S.: Conceptualization, Methodology, Experiment, Review & editing. Y.Z.: Experiment, Calculation and data analysis, Writing—review. All authors have read and agreed to the published version of the manuscript.
Funding
This work was financially supported by the Ministry of Education Key Laboratory for Oil and Gas Equipment of China (Grant Nos. OGE201402-03), and such supports are appreciated greatly by the authors. The authors acknowledge the Ministry of Education Key Laboratory for Oil and Gas Equipment for the use of their facilities and for scientific and technical assistance.
Data Availability Statement
Data available on request from the authors.
Conflicts of Interest
The authors declare no conflict of interest.
References
- Jiang, J.; Wu, M.; Xu, T.T.; Bao, W.; Li, Z.H. Study on impact toughness of TMCP and quenched and tempered high strength steels. Case Stud. Constr. Mater. 2024, 20, e02795. [Google Scholar] [CrossRef]
- Dong, W.C.; Wen, M.Y.; Pang, H.Y.; Lu, S.P. Effect of Post-weld Tempering on the Microstructure and Mechanical Properties in the Simulated HAZs of a High-Strength-High-Toughness Combination Marine Engineering Steel. Acta Metall. Sin. (Engl. Lett.) 2020, 33, 391–402. [Google Scholar] [CrossRef]
- Hu, J.; Lan, W.; Deng, P.; Wu, J.; Zeng, J. Corrosion Behavior of E690 Steel in Tropical Marine Atmosphere. J. Chin. Soc. Corros. Prot. 2023, 43, 1140–1144. [Google Scholar]
- Gao, X.; Shao, Y.; Xie, L.; Wang, Y.; Yang, D. Prediction of Corrosive Fatigue Life of Submarine Pipelines of API 5L X56 Steel Materials. Materials 2019, 12, 10. [Google Scholar] [CrossRef] [PubMed]
- Kazem Reza, K.; Chizari, M. Influence of Conventional Shot Peening Treatment on the Service Life Improvement of Bridge Steel Piles Subjected to Sea Wave Impact. J. Mar. Sci. Eng. 2023, 11, 1570. [Google Scholar] [CrossRef]
- Li, Q.; Jia, H.; Qiu, Q.; Lu, Y.; Zhang, J.; Mao, J.; Fan, W.; Huang, M. Typhoon-Induced Fragility Analysis of Transmission Tower in Ningbo Area Considering the Effect of Long-Term Corrosion. Appl. Sci. 2022, 12, 4774. [Google Scholar] [CrossRef]
- Lee, S.; Rasoolian, B.; Silva, D.F.; Pegues, J.W.; Shamsaei, N. Surface roughness parameter and modeling for fatigue behavior of additive manufactured parts: A non-destructive data-driven approach. Addit. Manuf. 2021, 46, 102094. [Google Scholar] [CrossRef]
- Guo, Y.; Shao, Y.; Gao, X.; Li, T.; Zhong, Y.; Luo, X. Corrosion fatigue crack growth of serviced API 5L X56 submarine pipeline. Ocean. Eng. 2022, 256, 111502. [Google Scholar] [CrossRef]
- Luo, X.; Shi, J.; Shao, Y. Study on corrosion fatigue crack growth of high strength steel under the seawater corrosive environment. China Offshore Oil Gas 2023, 35, 181–188. [Google Scholar]
- Zhao, T.; Liu, Z.; Du, C.; Dai, C.; Li, X.; Zhang, B. Corrosion fatigue crack initiation and initial propagation mechanism of E690 steel in simulated seawater. Mater. Sci. Eng. A 2017, 708, 181–192. [Google Scholar] [CrossRef]
- Li, Y.; Liu, Z.; Wu, W.; Li, X.; Zhao, J. Crack growth behaviour of E690 steel in artificial seawater with various pH values. Corros. Sci. 2020, 164, 108336. [Google Scholar] [CrossRef]
- Che, M.J.; Du, X.J.; Yi, S.; Ma, H.Y.; He, Y.Z. Superior Pitting Corrosion Resistance of Ultra-high Strength Low Alloy Steel Via Co-alloying Al and Cu. JOM 2023, 75, 4287–4299. [Google Scholar] [CrossRef]
- Gao, X.; Shao, Y.; Chen, C.; Zhu, H. Investigation on residual stress of EQ56 high strength steel butt weld. Ocean. Eng. 2023, 279, 114405. [Google Scholar] [CrossRef]
- Chen, Z.; Yu, B.; Wang, P.; Qian, H. Fatigue properties evaluation of fillet weld joints in full-scale steel marine structures. Ocean. Eng. 2023, 270, 113651. [Google Scholar] [CrossRef]
- Xiong, C.N.; Shao, Y.B.; Tong, L.W.; Dai, K.S.; Luo, Y.X. Static strength of CFRP-strengthened preloaded circular concrete-filled steel tube stub columns, Part I: Experimental test. Thin-Walled Struct. 2023, 184, 110546. [Google Scholar] [CrossRef]
- Fu, W.; Li, C.; Di, X.; Jin, Y.; Fu, K.; Gao, H.; Fang, C.; Lou, S.; Ding, T.; Wang, D. Strengthening and toughening mechanism of coarse-grained heat-affected zone for the Cr-/Mo-free Cu-bearing HSLA steel under high heat input welding conditions. J. Mater. Sci. 2022, 57, 16471–16489. [Google Scholar] [CrossRef]
- Madhusudhan, D.; Chand, S.; Ganesh, S.; Saibhargavi, U. Modeling and simulation of Charpy impact test of maraging steel 300 using Abaqus. IOP Conf. Ser. Mater. Sci. Eng. 2018, 330, 012013. [Google Scholar] [CrossRef]
- Cao, Y.; Zhen, Y.; Song, M.; Yi, H.; Li, F.; Li, X. Determination of Johnson–Cook parameters and evaluation of Charpy impact test performance for X80 pipeline steel. Int. J. Mech. Sci. 2020, 179, 105627. [Google Scholar] [CrossRef]
- Kim, H.; Park, J.; Kang, M.; Lee, S. Interpretation of Charpy impact energy characteristics by microstructural evolution of dynamically compressed specimens in three tempered martensitic steels. Mater. Sci. Eng. A 2016, 649, 57–67. [Google Scholar] [CrossRef]
- Winkler, S.; Thompson, A.; Salisbury, C.; Worswick, M.; Van Riemsdijk, I.; Mayer, R. Strain Rate and Temperature Effects on the Formability and Damage of Advanced High-Strength Steels. Metall. Mater. Trans. Part A 2008, 38, 1350–1358. [Google Scholar] [CrossRef]
- Fathi, E.; Hashemi, S.H. Analysis of fracture energy in drop weight tear testing of API X65 gas pipeline steel. J. Pipeline Sci. Eng. 2021, 1, 225–232. [Google Scholar] [CrossRef]
- Zhou, L.; Zhu, Z.; Liu, R.; Fan, Y.; Dong, Y.; Ying, P. Investigation on Fracture Properties of Single-Flawed Tunnel Model Under Medium-to-Low-Speed Impacts. Acta Mech. Solida Sin. 2019, 33, 205–225. [Google Scholar] [CrossRef]
- Kang, M.; Park, J.; Sohn, S.S.; Kim, H.S.; Kim, N.J.; Lee, S. Interpretation of quasi-static and dynamic tensile behavior by digital image correlation technique in TWinning Induced Plasticity (TWIP) and low-carbon steel sheets. Mater. Sci. Eng. A 2017, 693, 170–177. [Google Scholar] [CrossRef]
- Ghimire, A.; Wald, F. Deformation behaviour of high-strength steel welds using DIC. ce/papers 2023, 6, 557–561. [Google Scholar] [CrossRef]
- Rahmatabadi, D.; Shahmirzaloo, A.; Hashemi, R.; Farahani, M. Using digital image correlation for characterizing the elastic and plastic parameters of ultrafine-grained Al 1050 strips fabricated via accumulative roll bonding process. Mater. Res. Express 2019, 6, 086542. [Google Scholar] [CrossRef]
- Pan, B.; Li, K.; Tong, W. Fast, Robust and Accurate Digital Image Correlation Calculation Without Redundant Computations. Exp. Mech. 2013, 53, 1277–1289. [Google Scholar] [CrossRef]
- Schreier, H.W.; Braasch, J.R.; Sutton, M.A. Systematic errors in digital image correlation caused by intensity interpolation. Opt. Eng. 2000, 39, 2915–2921. [Google Scholar] [CrossRef]
- Gao, Z.; Xu, X.; Su, Y.; Zhang, Q. Experimental analysis of image noise and interpolation bias in digital image correlation. Opt. Lasers Eng. 2016, 81, 46–53. [Google Scholar] [CrossRef]
- Sutton, M.A. Image Correlation for Shape, Motion and Deformation Measurements: Basic Concepts, Theory and Applications; Springer: London, UK, 2009. [Google Scholar]
- Sutton, M.A.; Tiwari, V.; Pierron, F. Ultra High Speed DIC and Virtual Fields Method Analysis of a Three Point Bending Impact Test on an Aluminium Bar. Exp. Mech. 2011, 51, 537–563. [Google Scholar]
- Liu, J.; Saletti, D.; Pattofatto, S.; Zhao, H. Impact testing of polymeric foam using Hopkinson bars and digital image analysis. Polym. Test. 2014, 36, 101–109. [Google Scholar] [CrossRef]
- Pan, K.; Rena, C.Y.; Ruiz, G.; Zhang, X.; Wu, Z.; De La Rosa, Á. The propagation speed of multiple dynamic cracks in fiber-reinforced cement-based composites measured using DIC. Cem. Concr. Compos. 2021, 122, 104140. [Google Scholar] [CrossRef]
- Jordan, B.; Grolleau, V.; Mohr, D. Using surround DIC to extract true stress–strain curve from uniaxial tension experiments. Int. J. Solids Struct. 2023, 268, 112171. [Google Scholar] [CrossRef]
- Sun, F.F.; Ran, M.M.; Li, G.Q.; Wang, Y.B. Mechanical behavior of transverse fillet welded joints of high strength steel using digital image correlation techniques. J. Constr. Steel Res. 2019, 162, 105710. [Google Scholar] [CrossRef]
- Ren, S.C.; Morgeneyer, T.F.; Mazière, M.; Forest, S.; Rousselier, G. Effect of Lüders and Portevin-Le Chatelier localization bands on plasticity and fracture of notched steel specimens studied by DIC and FE simulations. Int. J. Plast. 2021, 136, 102880. [Google Scholar] [CrossRef]
- Rahmatabadi, D.; Ahmadi, M.; Pahlavani, M.; Hashemi, R. DIC-based experimental study of fracture toughness through R-curve tests in a multi-layered Al-Mg (LZ91) composite fabricated by ARB. J. Alloys Compd. 2021, 883, 160843. [Google Scholar] [CrossRef]
- NS-EN ISO 14556:2023; Metallic Materials—Charpy V-Notch Pendulum Impact Test. Instrumented Test Method (ISO 14556:2023). ISO: Geneva, Switzerland, 2023.
- Lucon, E. Effect of electrical discharge machining (EDM) on Charpy test results from miniaturized steel specimens. J. Test. Eval. 2013, 41, 1–9. [Google Scholar] [CrossRef]
- Blaber, J.; Adair, B.; Antoniou, A. Ncorr: Open-Source 2D Digital Image Correlation Matlab Software. Exp. Mech. 2015, 55, 1105–1122. [Google Scholar] [CrossRef]
- Zhao, B.; Zhang, L.C.; Xu, L.; Peng, J. Dynamic Mechanical Properties and Material Constitutive Relationship of Marine EH690 Steel. Ship Eng. 2022, 44, 117–120. [Google Scholar]


Disclaimer/Publisher’s Note: The statements, opinions and data contained in all publications are solely those of the individual author(s) and contributor(s) and not of MDPI and/or the editor(s). MDPI and/or the editor(s) disclaim responsibility for any injury to people or property resulting from any ideas, methods, instructions or products referred to in the content. |
© 2024 by the authors. Licensee MDPI, Basel, Switzerland. This article is an open access article distributed under the terms and conditions of the Creative Commons Attribution (CC BY) license (https://creativecommons.org/licenses/by/4.0/).