1. Introduction
Lithium carbonate (Li
2CO
3) is an essential compound for obtaining inorganic and organic lithium-based compounds due to its crystalline stability [
1,
2]. Li
2CO
3 is widely used in industrial sectors, including pharmaceuticals, optical glass, ceramics, alloy, and lithium-ion batteries [
3,
4,
5,
6,
7]. Among these industries, lithium-ion batteries require more than half of the lithium consumed commercially. As a result of the promotion of the usage of lithium-ion batteries in new energy vehicles, it is projected that the demand for lithium will have a twofold increase by 2025 [
8]. Consequently, a substantial increase in mining and ore processing would be unsustainable and exacerbate environmental pollution. In addition to utilizing primary resources, reusing and recycling secondary materials are also crucial for attaining a circular economy and environmental safety and ensuring stable supply chain security. Thus, enhancing the efficiency of lithium recovery and recycling from various sources is crucial to avert shortages of this critical metal.
Spent lithium-ion batteries undeniably constitute an encouraging source of lithium and have garnered significant attention [
9,
10]. At present, the prevalent method employed for the recovery of lithium from the cathode materials of discarded lithium-ion batteries is hydrometallurgy [
11,
12,
13], which involves acid leaching and impurity removal steps. Subsequently, lithium carbonate products can be obtained from leachate through extraction and precipitation methods [
14,
15]. In industry, the reaction between sodium carbonate (Na
2CO
3) and lithium to generate Li
2CO
3 has emerged as a common step in fabricating lithium carbonate crystals [
16,
17]. In energy storage applications, such as lithium-ion batteries, the purity of Li
2CO
3 directly influences the battery’s performance and stability. Impurities can reduce the capacitance of batteries and shorten battery life. Therefore, high-purity lithium carbonate is the key to ensuring battery performance [
18,
19].
As the precursor of lithium-ion battery cathode materials, the crystalline morphology of Li
2CO
3 can impact the structural and morphological properties of the cathode and determine the electrochemical performance of the battery. Studies show that the crystalline products’ particle size distribution (PSD) can be influenced by numerous process parameters, including the temperature, feed rate, and additives [
20,
21,
22]. Sun et al. investigated the PSD and morphological characteristics of Li
2CO
3 generated via the gas–liquid reaction of LiOH with carbon dioxide [
23]. Tian, Guo, and others explored the influence of temperature on the particle size distribution and particle growth rate [
24]. Han et al. examined the impact of varying feed rates on the particle size distribution of lithium carbonate [
16].
It is well known that the presence of impurities in a solution can influence the growth of crystals. In the recycling process of lithium-ion batteries, trace amounts of impurities, such as Ni
2+ and Co
2+, may remain after treatment. Previous studies on Li
2CO
3 crystallization have generally focused on investigating the impacts of Ca
2+, Mg
2+, and SO
42−, on the growth of Li
2CO
3 crystals. Ma et al. explored the influence of Na
2+ and Mg
2+ on Li
2CO
3 crystallization, revealing that Na
+ inhibited the nucleation and growth rates of crystals, while Mg
2+ accelerated both processes [
25]. Through simulations of the Li
2CO
3 crystallization process, Helen et al. reported that Na
+ can form ion pairs with CO
32− in a solution, slowing down the nucleation rate of Li
2CO
3. Additionally, while K
+ and Cl
− interact with the growth of crystals, the nucleation and growth times are not impacted [
26]. To date, few papers have reported the influence of nickel and cobalt ions on Li
2CO
3 crystallization.
An analysis of the composition of lithium battery leachate obtained at the laboratory scale revealed the presence of metal ion impurities in the solution, as depicted in
Table S1.
In this study, a Li2CO3 solution was employed as a simulated solution for leaching waste ternary lithium-ion batteries, which reacts with a Na2CO3 solution to obtain the crystallized Li2CO3. The influence of different process parameters on the lithium carbonate’s yield, purity, and crystallization process was investigated to gain a deeper understanding of the crystal growth mechanism during the precipitation process. Furthermore, the PSD and morphology of lithium carbonate crystals in the presence of different impurity ions were explored. These insights provide a reference for optimizing lithium carbonate crystallization processes.
2. Materials and Methods
2.1. Materials
The primary reactants, lithium chloride (99%) and sodium carbonate (98%), were purchased from Heowns Biochem Technology Co., Ltd. (Tianjin, China). Nickel chloride (99%) and cobalt chloride (99%) were obtained from Chemart Chemical Technology Co., Ltd. (Tianjin, China). The nitric acid (AR) was purchased from Jiangtian Chemical Technology Co., Ltd. (Tianjin, China).
2.2. Setup and Procedure
Deionized water was used to prepare lithium chloride (LiCl) solutions (with and without added impurities) and sodium carbonate (Na2CO3) solutions. Filtration was performed using a 2.5-micrometer filter membrane to remove any potential impurities or pre-existing nuclei in the solutions. The experiments were conducted under atmospheric pressure.
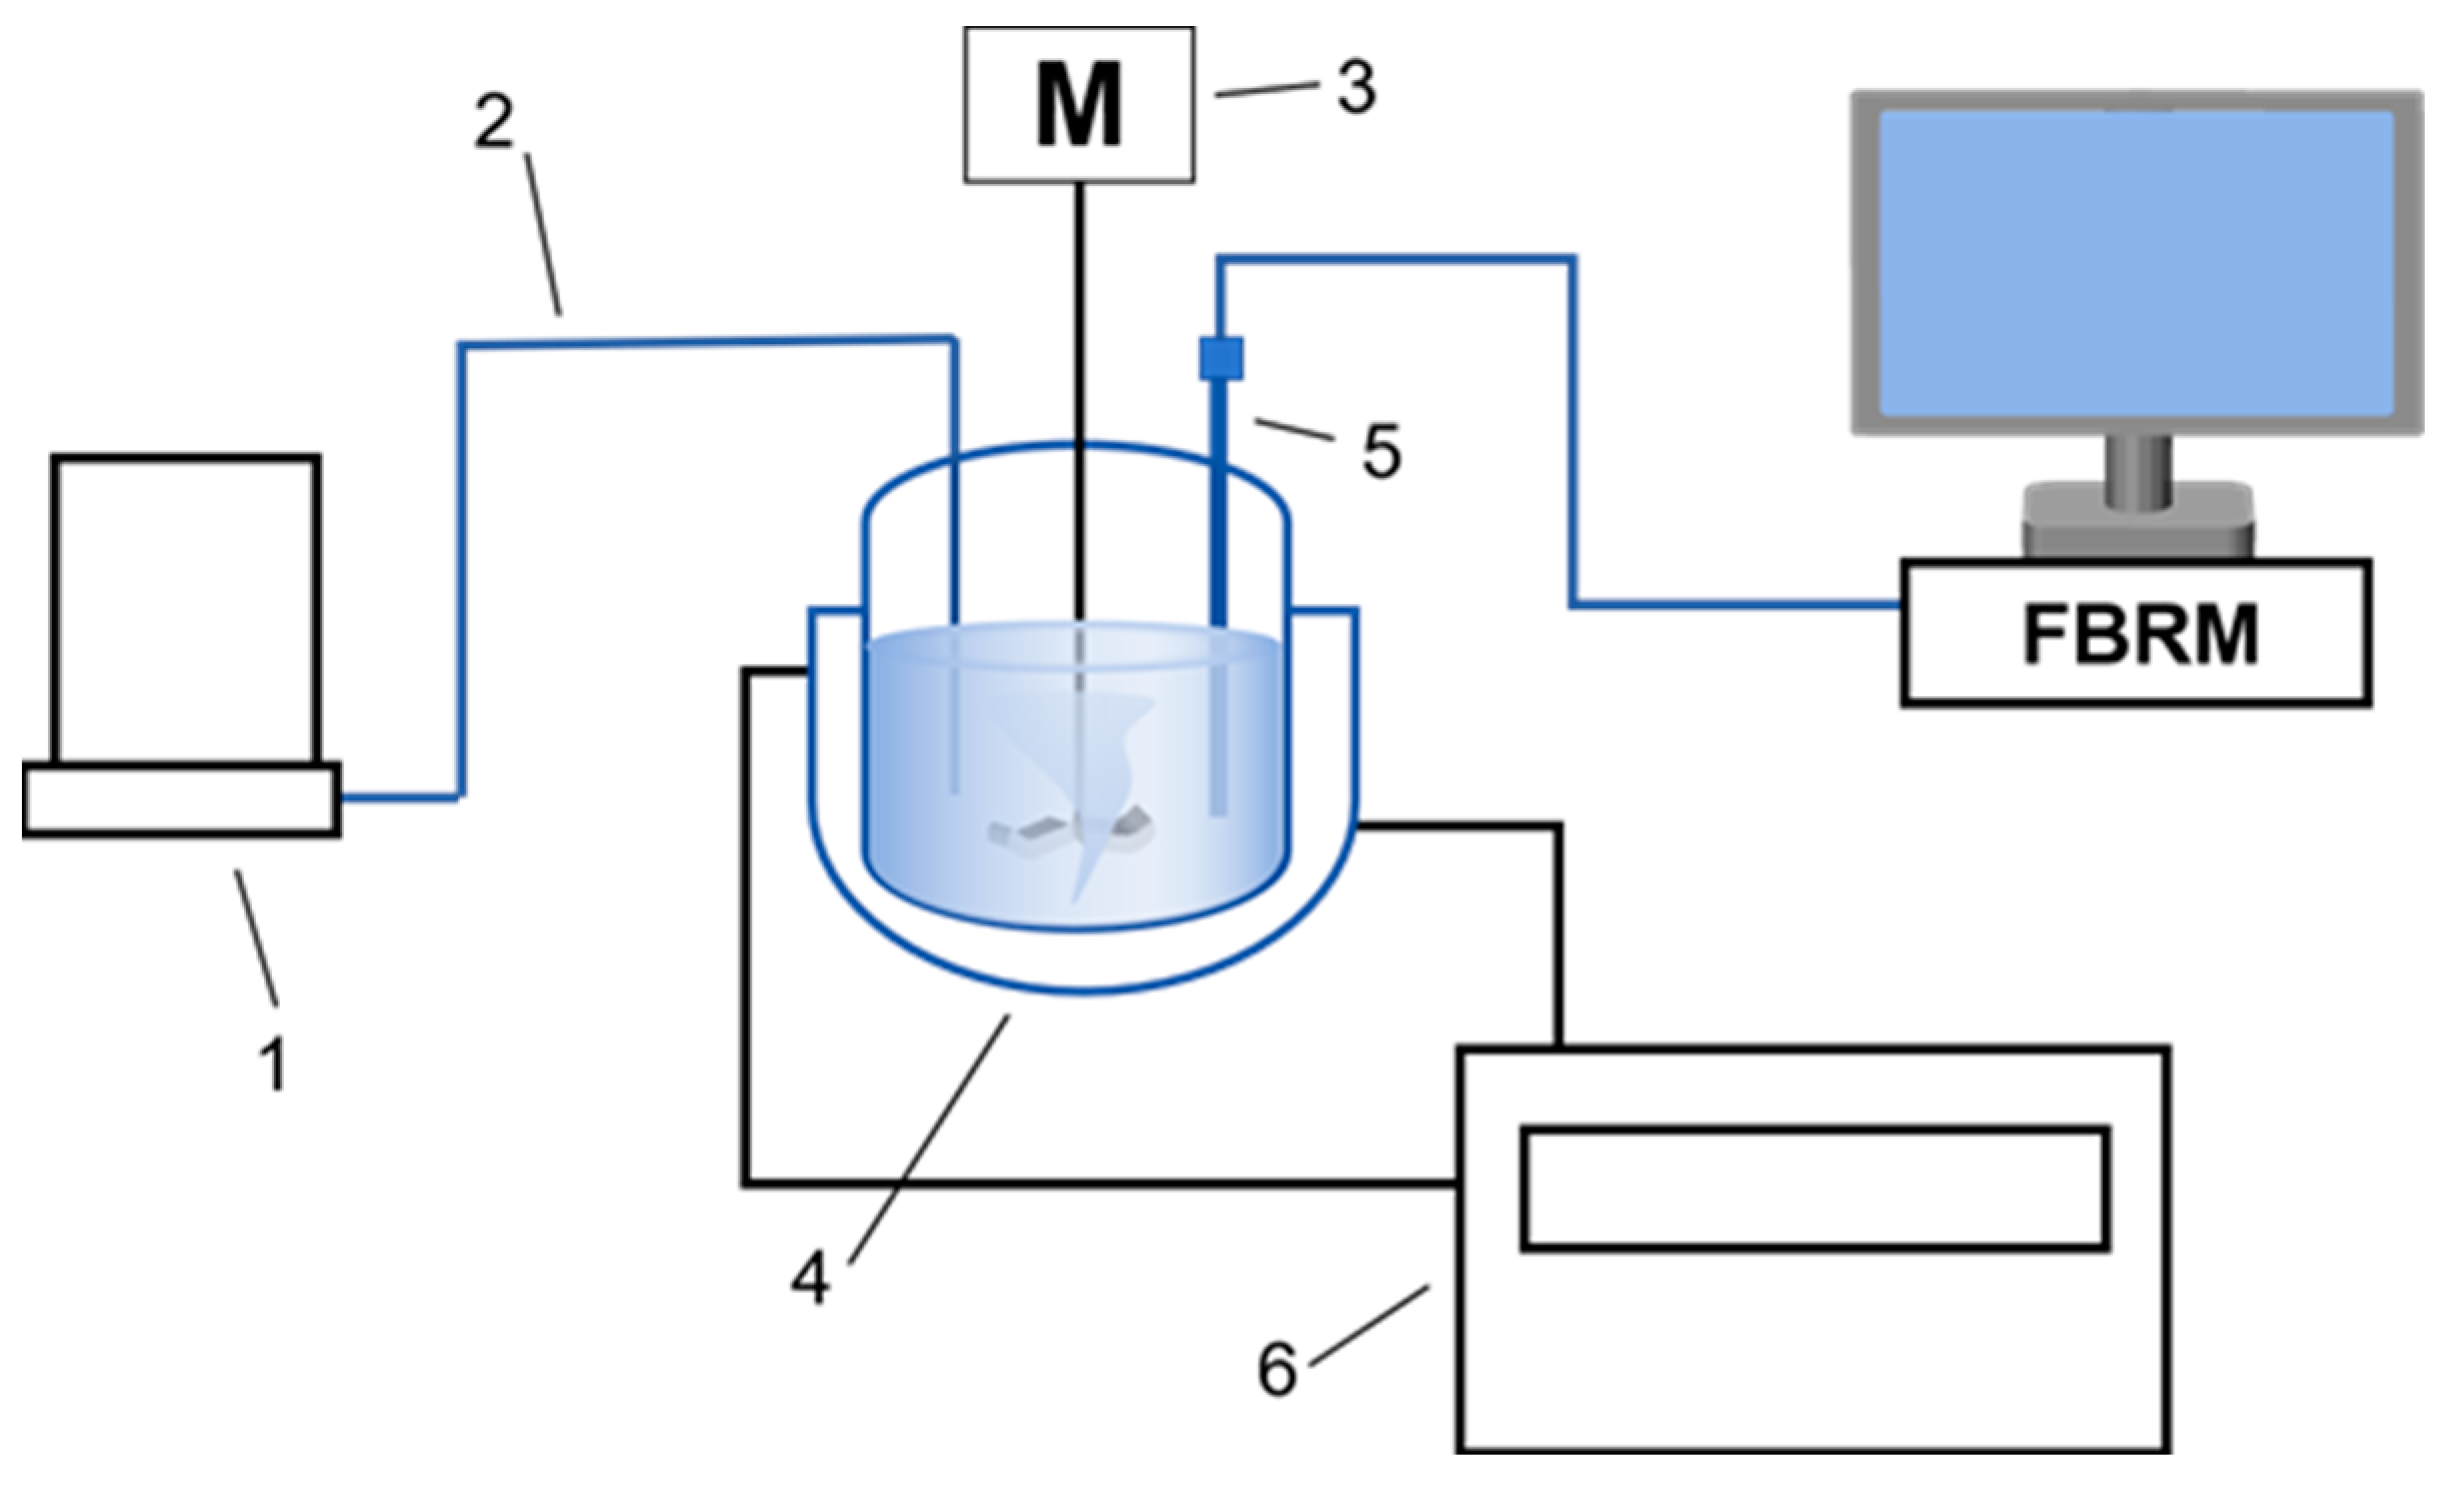
The experimental setup, illustrated in
Figure 1, comprised a 300 mL three-neck jacketed reaction crystallizer, a peristaltic pump, and a stirrer. The analytical processing system employed was the Focused Beam Reflection Measurement (FBRM) for online monitoring of the particle count in the solution and to determine the PSD of dispersed systems under in situ conditions. Its measurement principle involves the reflection of a laser beam as it passes through the particles at the probe. The instrument records the reflection time of the beam, multiplied by a known scanning speed, to obtain chord length data of the particles.
A 120 mL LiCl solution was introduced into the jacketed reaction vessel, and the temperature was controlled through a circulating water bath. After the temperature stabilized, stirring was initiated, and the FBRM probe was inserted into the solution for measurement. Simultaneously, the peristaltic pump was activated to gradually drip the Na
2CO
3 solution into the jacketed reaction vessel at a predetermined rate for crystallization. During the entire crystallization process, it was ensured that the jacketed reaction vessel remained sealed. Different process parameters were changed to explore their effects on crystallization. The parameter range is shown in
Table 1.
2.3. Sample Preparation and Characterization
To investigate the morphology of lithium carbonate, the obtained lithium carbonate powder was mixed with ethanol. The resulting suspension was dripped onto silicon wafers and allowed to dry. After that, the samples were subjected to gold sputtering using a Quorum SC7640 high-resolution sputter coater (Quorum, Lewes, UK). Then, imaging was conducted using an Apreo S scanning electron microscope (FEI Company, Brno, Czech Republic) equipped with a field emission source, operating at an acceleration voltage of 3 kV. Elemental distribution and content in the lithium carbonate sample were subsequently analyzed using an energy dispersion spectrometer (EDS). The particle number within the reaction system was monitored using a Particle Track G400 particle analyzer (Mettler Toledo, Columbus, OH, USA) employing FBRM technology. The PSD of the lithium carbonate crystals and reaction products, at different time points, was determined using a Malvern Mastersizer 3000 particle size analyzer (Malvern Panalytical Ltd., Malvern, UK) via the wet method particle sizing technique. The measurements were conducted three times, with three sets of measurements taken each time, and the average of the final set was recorded.
2.4. Yield and Purity
After adding the sodium carbonate solution, the solution was allowed to age for 1 h. Subsequently, the solution was vacuum-filtered and washed with anhydrous ethanol. The obtained product was dried in a vacuum oven at 70 °C for 24 h. The weight of the product was measured to calculate the yield according to Equation (1):
where
Y is the lithium carbonate yield,
m0 (g) is the total weight of the product,
cLi (mol/L) is the concentration of lithium chloride solution,
VLi (L) is the volume of the lithium chloride solution, and
M is the molar mass of lithium carbonate.
The purity determination of lithium carbonate was conducted using ICP-MS: 0.2 g of lithium carbonate product was weighed, dissolved with 1% nitric acid, and diluted with deionized water. The concentration of lithium ions in the solution was measured by ICP-MS. Simultaneously, the impurity level of the lithium carbonate product was measured and is presented in the
Supplementary File (Figures S1–S7).
2.5. Defining the Average Growth Rate of Li2CO3
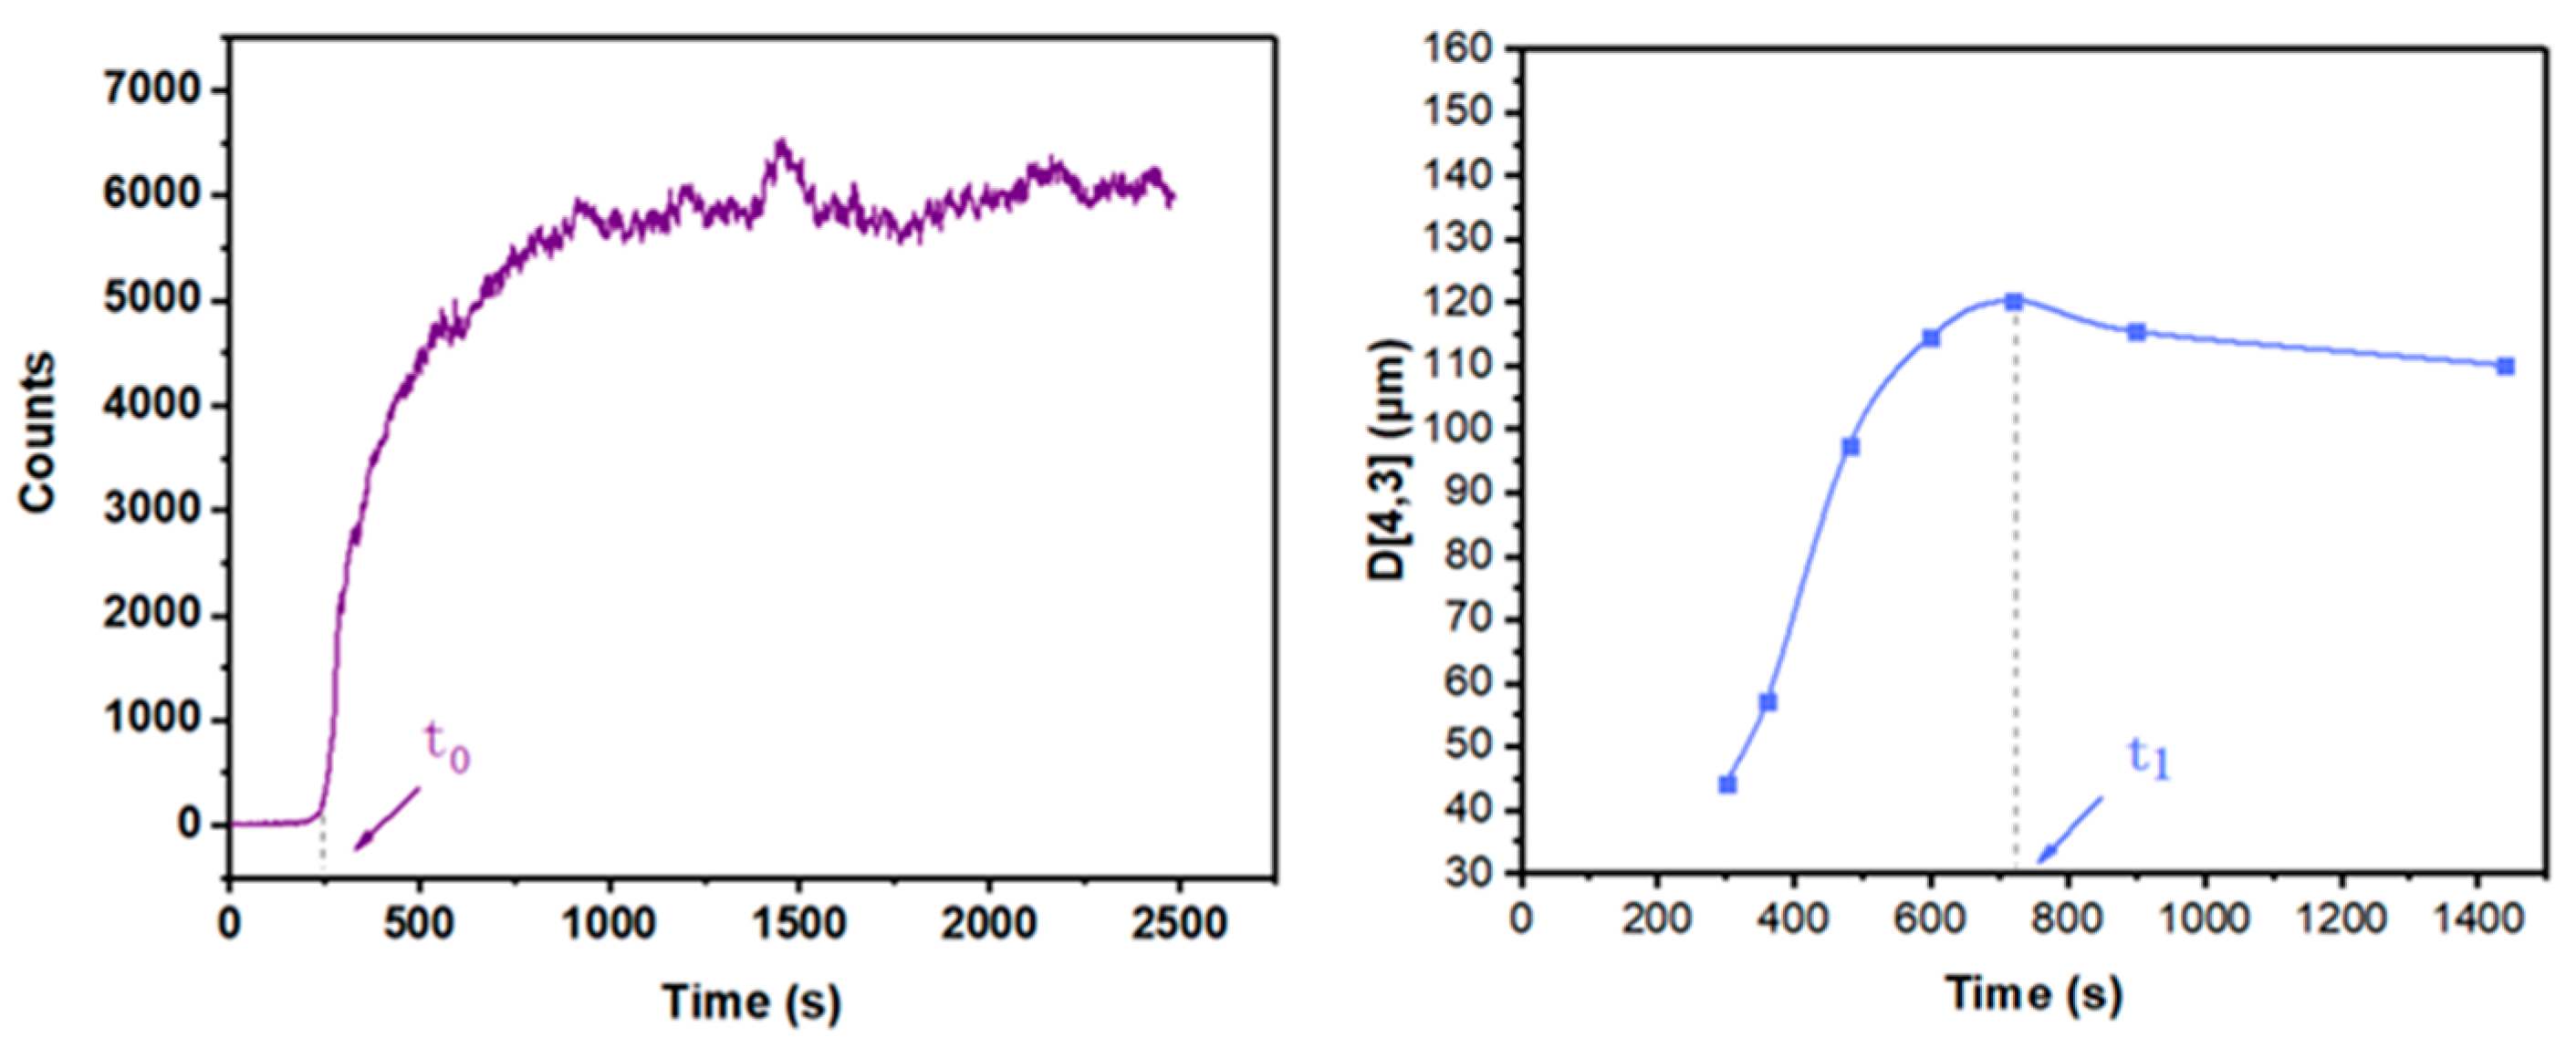
The samples were collected at different times during the reaction process. Then, the volume-weighted mean size (D[4, 3]) of the Li2CO3 particles during the crystallization process was measured using a Malvern Mastersizer 3000 particle size analyzer.
Figure 2 shows that the average size of the Li
2CO
3 particles nearly reached its maximum value at
t1, which is when the growth process was considered to be complete. The average growth rate of Li
2CO
3 was obtained through a simplified calculation method. Assuming that the growth process of Li
2CO
3 occurred at the initial nucleation and that the growth rate was constant, the average growth rate was calculated, as shown in Equation (2):
where
R (m/s) is the average growth rate of Li
2CO
3,
D[4, 3]
max (μm) is the volume-weighted mean size of Li
2CO
3 at time
t1, and
t0 (s) is the time when nucleation starts.
Calculating the average growth rate of lithium carbonate particles can provide a reference for the growth pattern of the lithium carbonate crystals.
3. Results and Discussion
3.1. Effect of Reaction Temperature
The yield, purity, particle size, and crystal morphology of lithium carbonate at 60–90 °C were studied. The concentrations of the lithium chloride and sodium carbonate solutions were both 1.5 mol/L. The sodium carbonate solution was added at a rate of 2.5 mL/min, with the stirring rate set at 400 rpm.
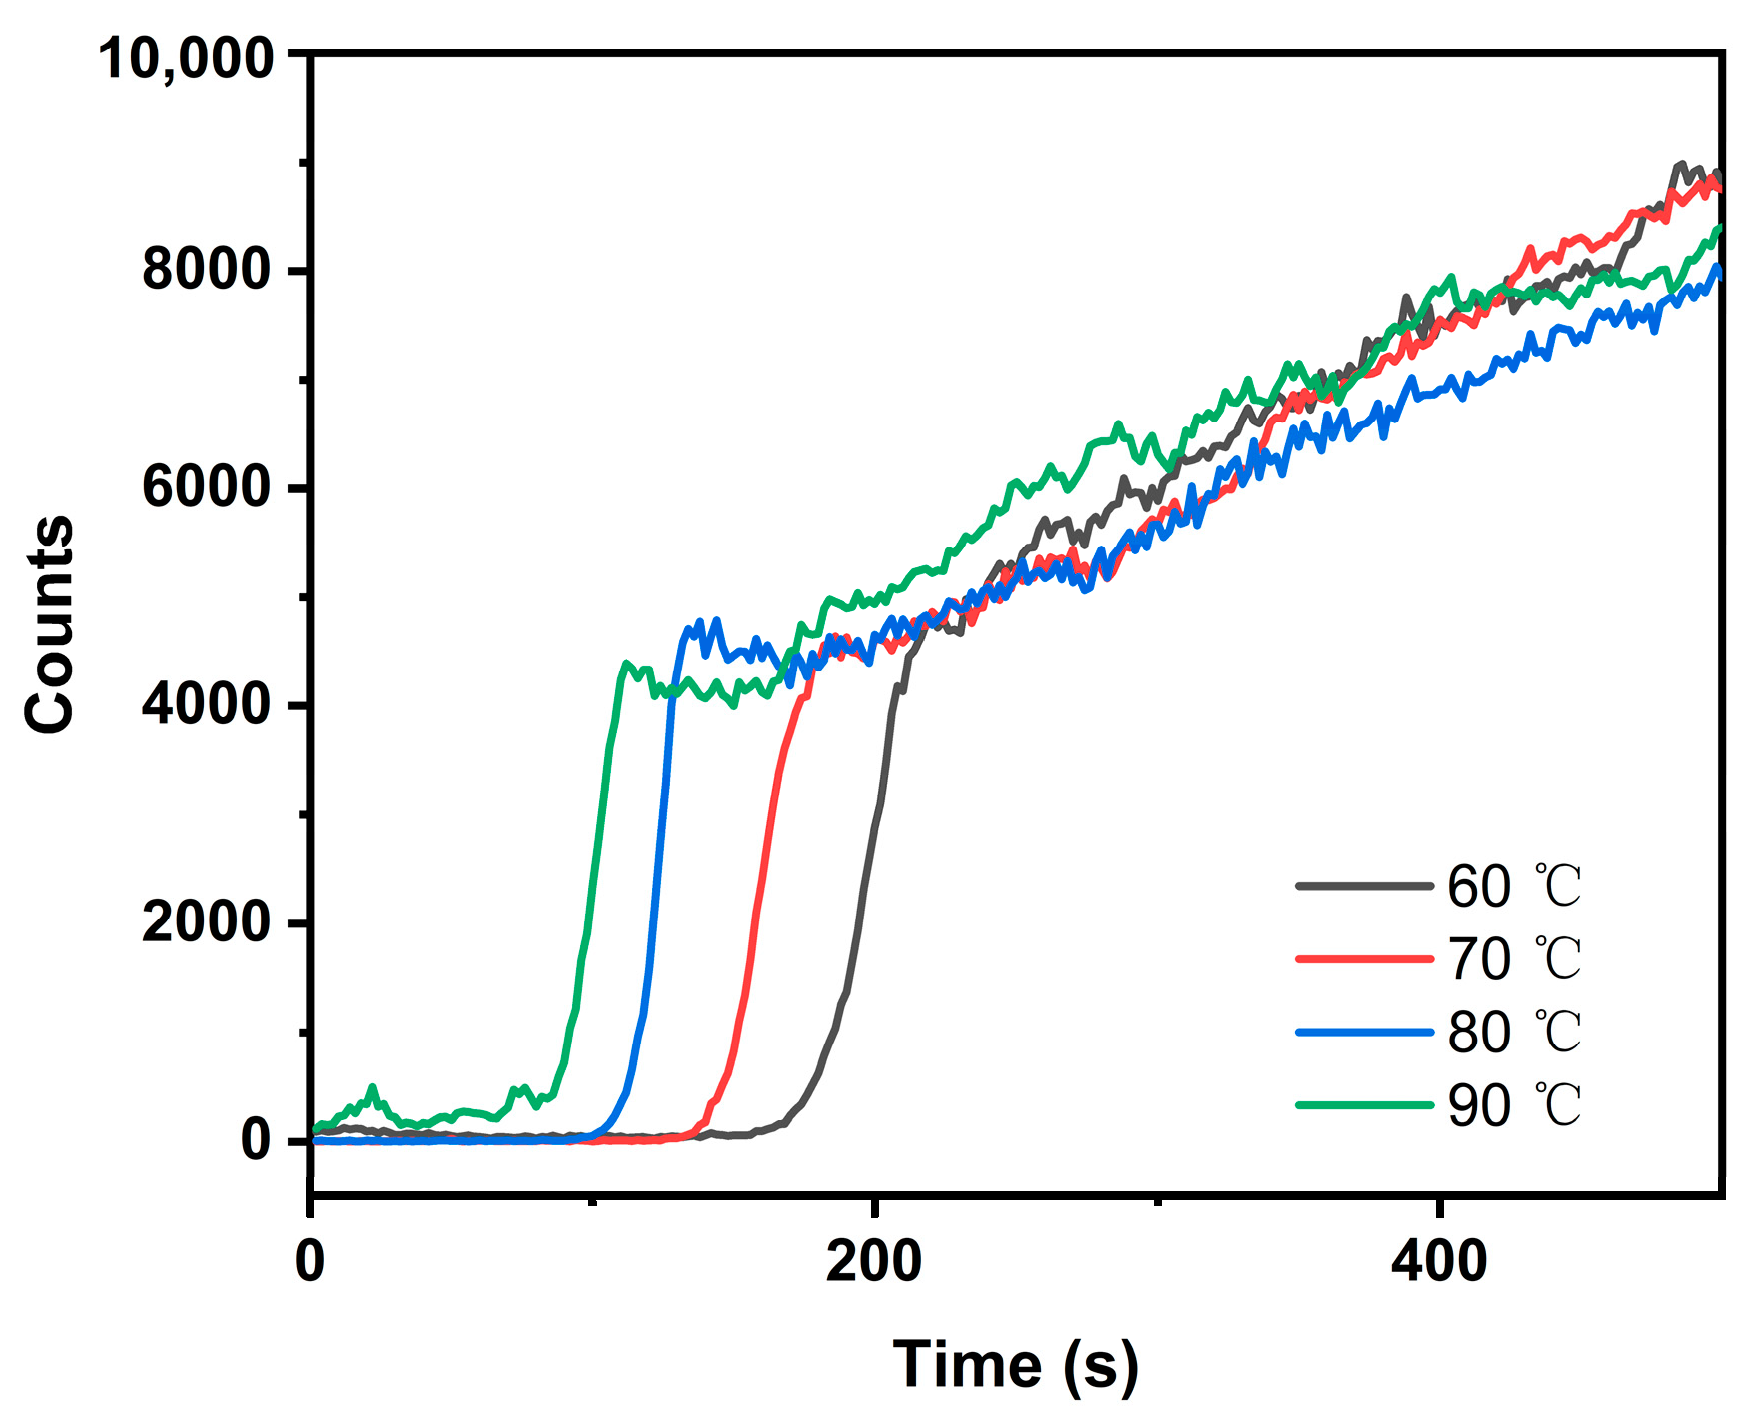
Figure 3 provides the variation in the particle count over time in the solution at different temperatures, indicating that at higher temperatures, nucleation occurs earlier.
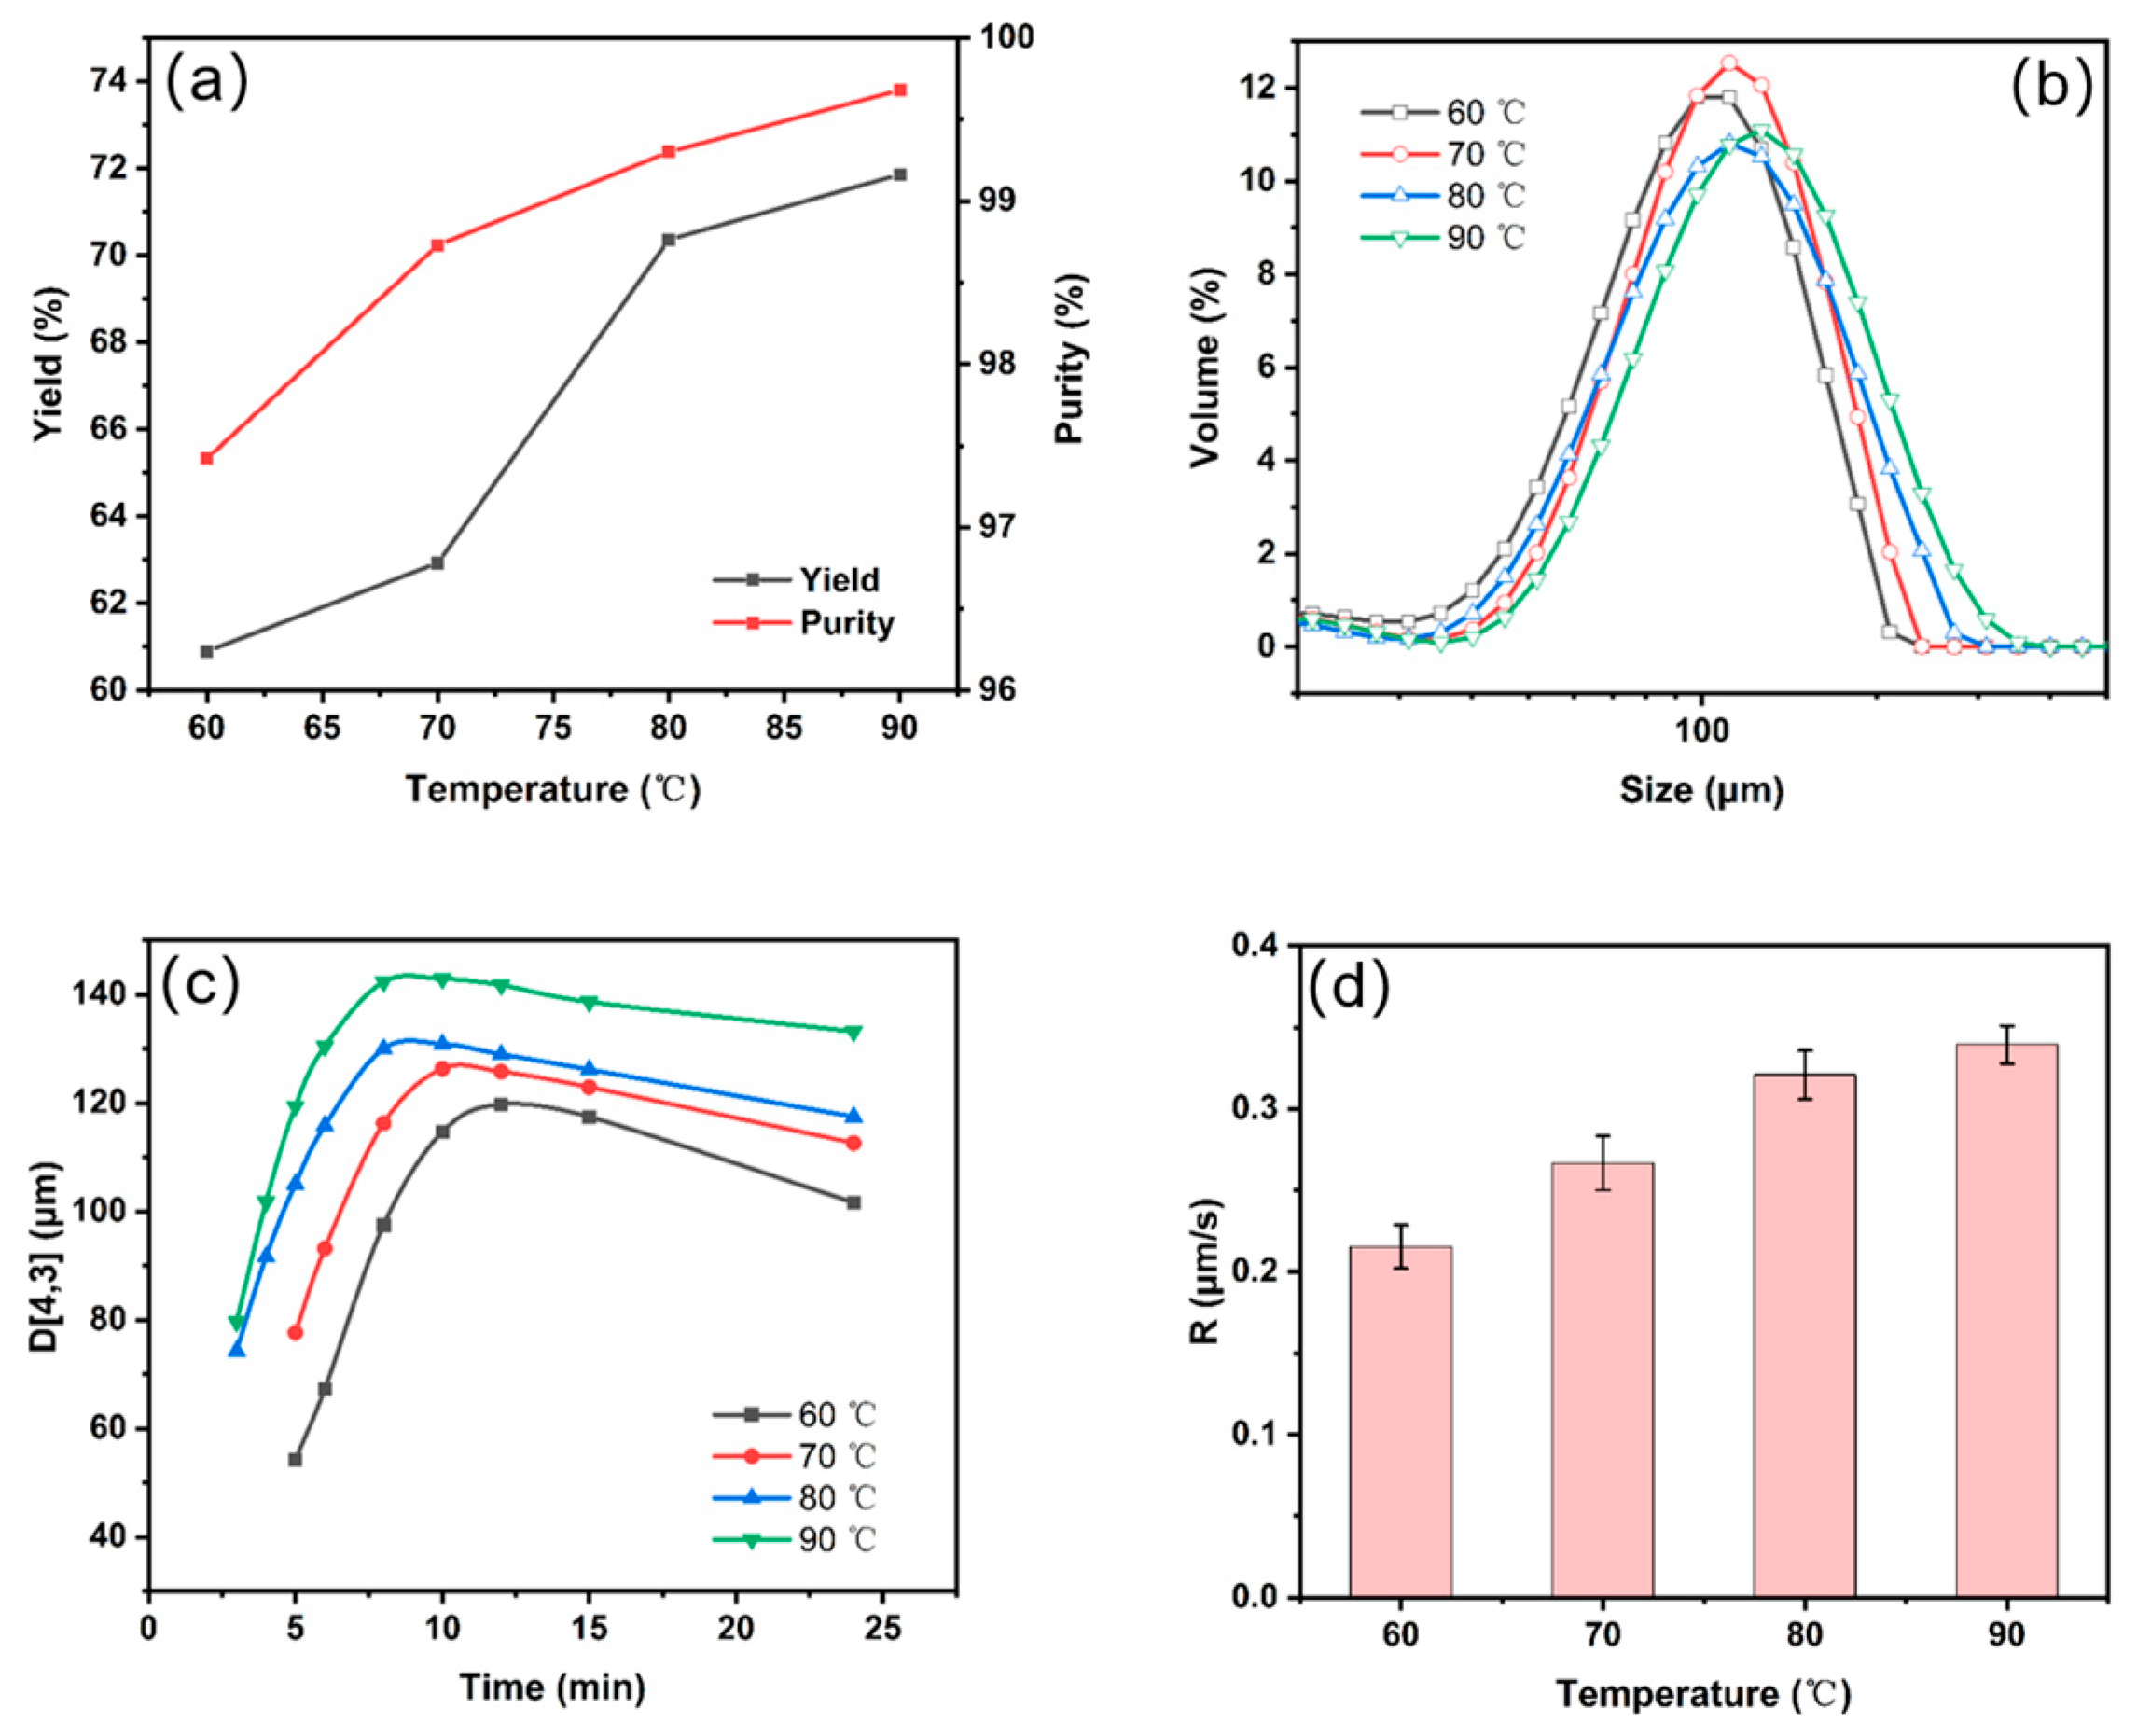
Figure 4a illustrates the influence of the temperature on the yield and purity of lithium carbonate. As the temperature increases, the yield of lithium carbonate products increases, which is attributed to the decrease in the solubility of lithium carbonate. Additionally, higher temperatures increase the solubility of impurities (Cl
−, Na
+) in the solution, consequently reducing impurity adhesion and increasing the purity of lithium carbonate.
A particle size analysis of the lithium carbonate products obtained from crystallization at different temperatures revealed the PSD.
Figure 5 shows that the lithium carbonate products formed aggregates of primary particles. This resulted from the aggregation of amorphous precursors generated during the early nucleation of lithium carbonate [
27].
Figure 4b shows that, as the temperature increases, the surface energy of lithium carbonate also increases, facilitating the aggregation of lithium carbonate. This finding is consistent with the results reported by Tian et al. [
24].
A particle size analysis of lithium carbonate at different time intervals was conducted. The growth rate of the agglomerate, under varying temperatures, was studied.
Figure 4c illustrates the trend of the volume-weighted average particle size of lithium carbonate at different temperatures over time. During the initial stages of adding the sodium carbonate solution, the particle size of lithium carbonate agglomerates exhibited rapid growth, which can be attributed to the higher ion concentration in the early stages. However, in the later stages of feed addition, a slight decrease in the particle size of lithium carbonate was observed. Simultaneously, stirring induced secondary nucleation, leading to a reduction in the average particle size. Moreover, as the temperature increased, the growth and aggregation of lithium carbonate crystals were more pronounced, resulting in larger average particle sizes.
Figure 4d depicts the average growth rate of lithium carbonate agglomerate sizes, showcasing an increasing trend with rising temperatures. It can also be observed that with the increase in temperature, there is no longer a significant increase in the average growth rate of lithium carbonate aggregates.
The lithium carbonate product was characterized by SEM. The primary particles of lithium carbonate were measured and statistically analyzed using Image J version 1.54, as shown in
Figure 5. With the increase in temperature, the size of the lithium carbonate primary particles slightly increases, and crystal aggregation becomes more pronounced.
3.2. Effect of Feed Concentration
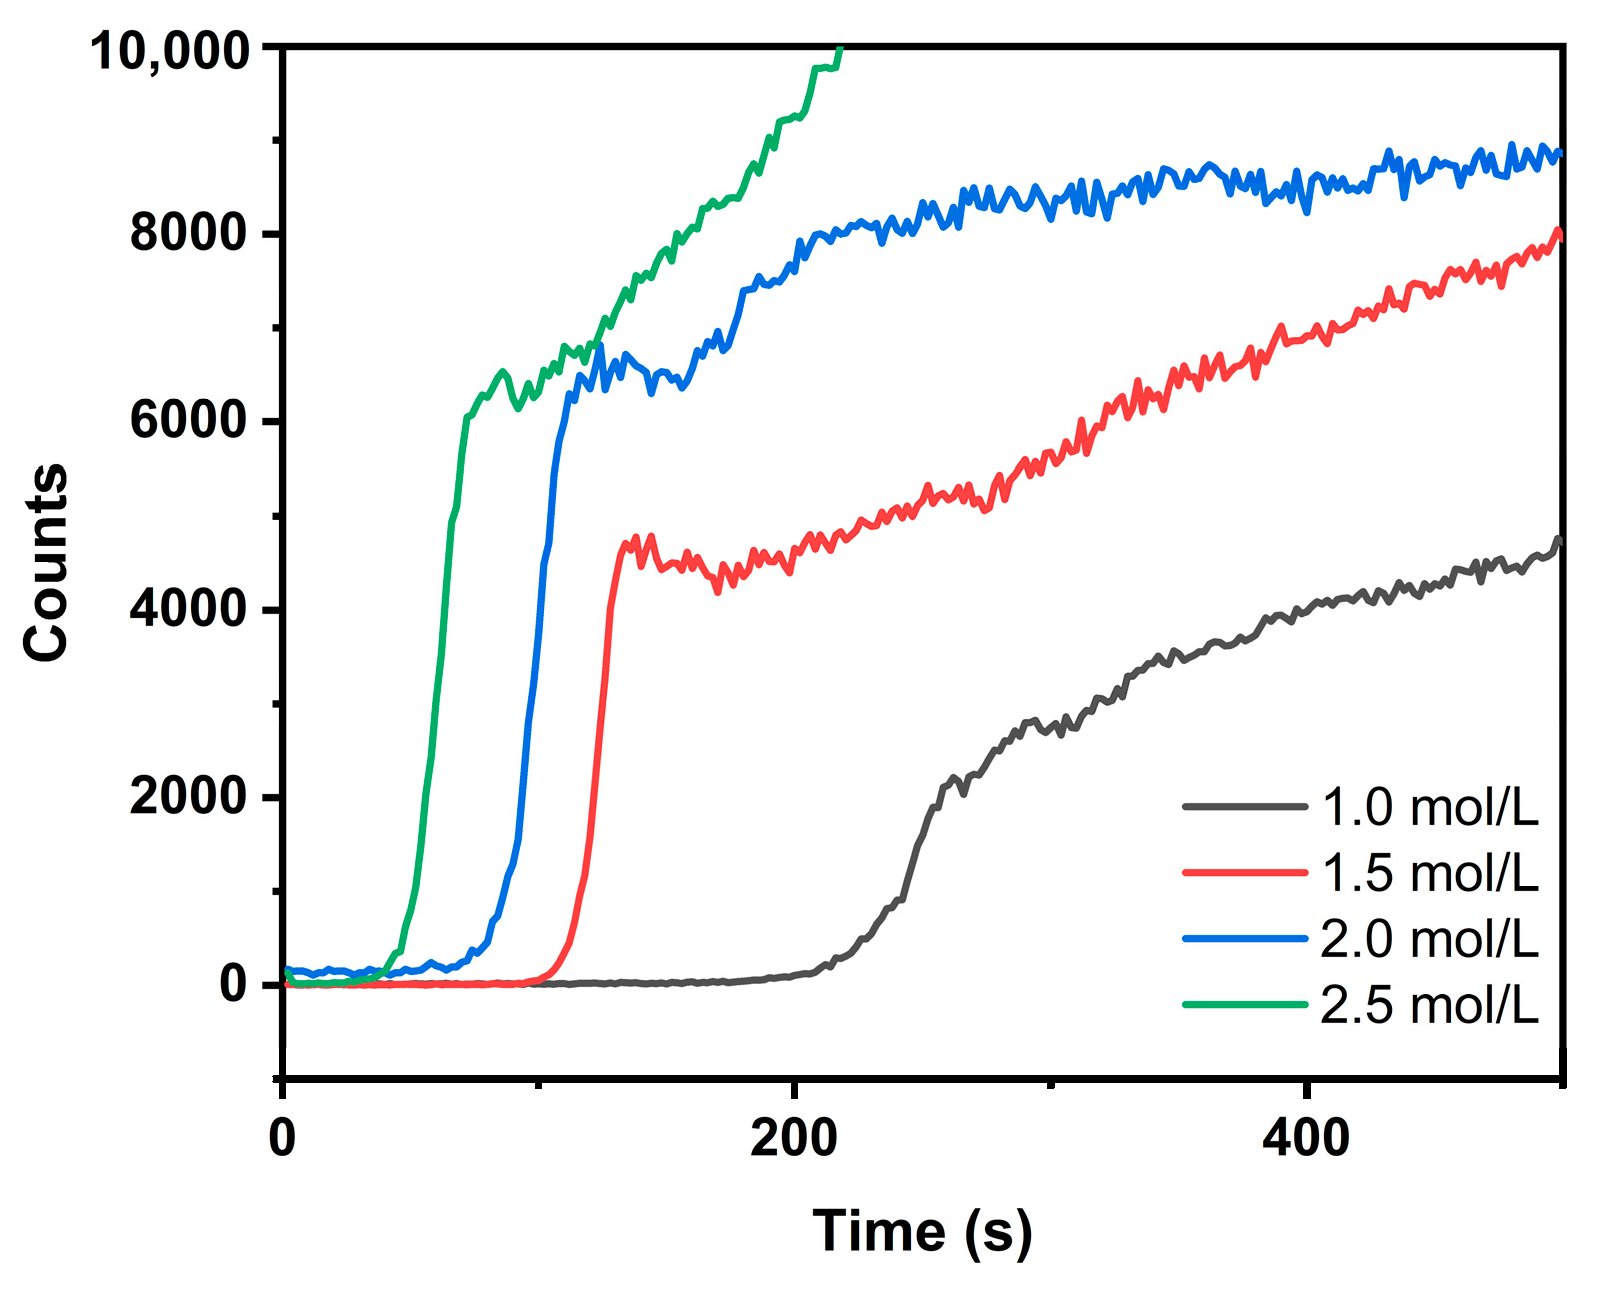
The lithium carbonate product was analyzed using a peristaltic pump with feed rates set at 1.0 mol/L, 1.5 mol/L, 2.0 mol/L, and 2.5 mol/L. The concentration of lithium chloride was 1.5 mol/L. A constant feed rate of 2.5 mL/min was maintained at a reaction temperature of 80 °C and a stirring speed of 400 rpm.
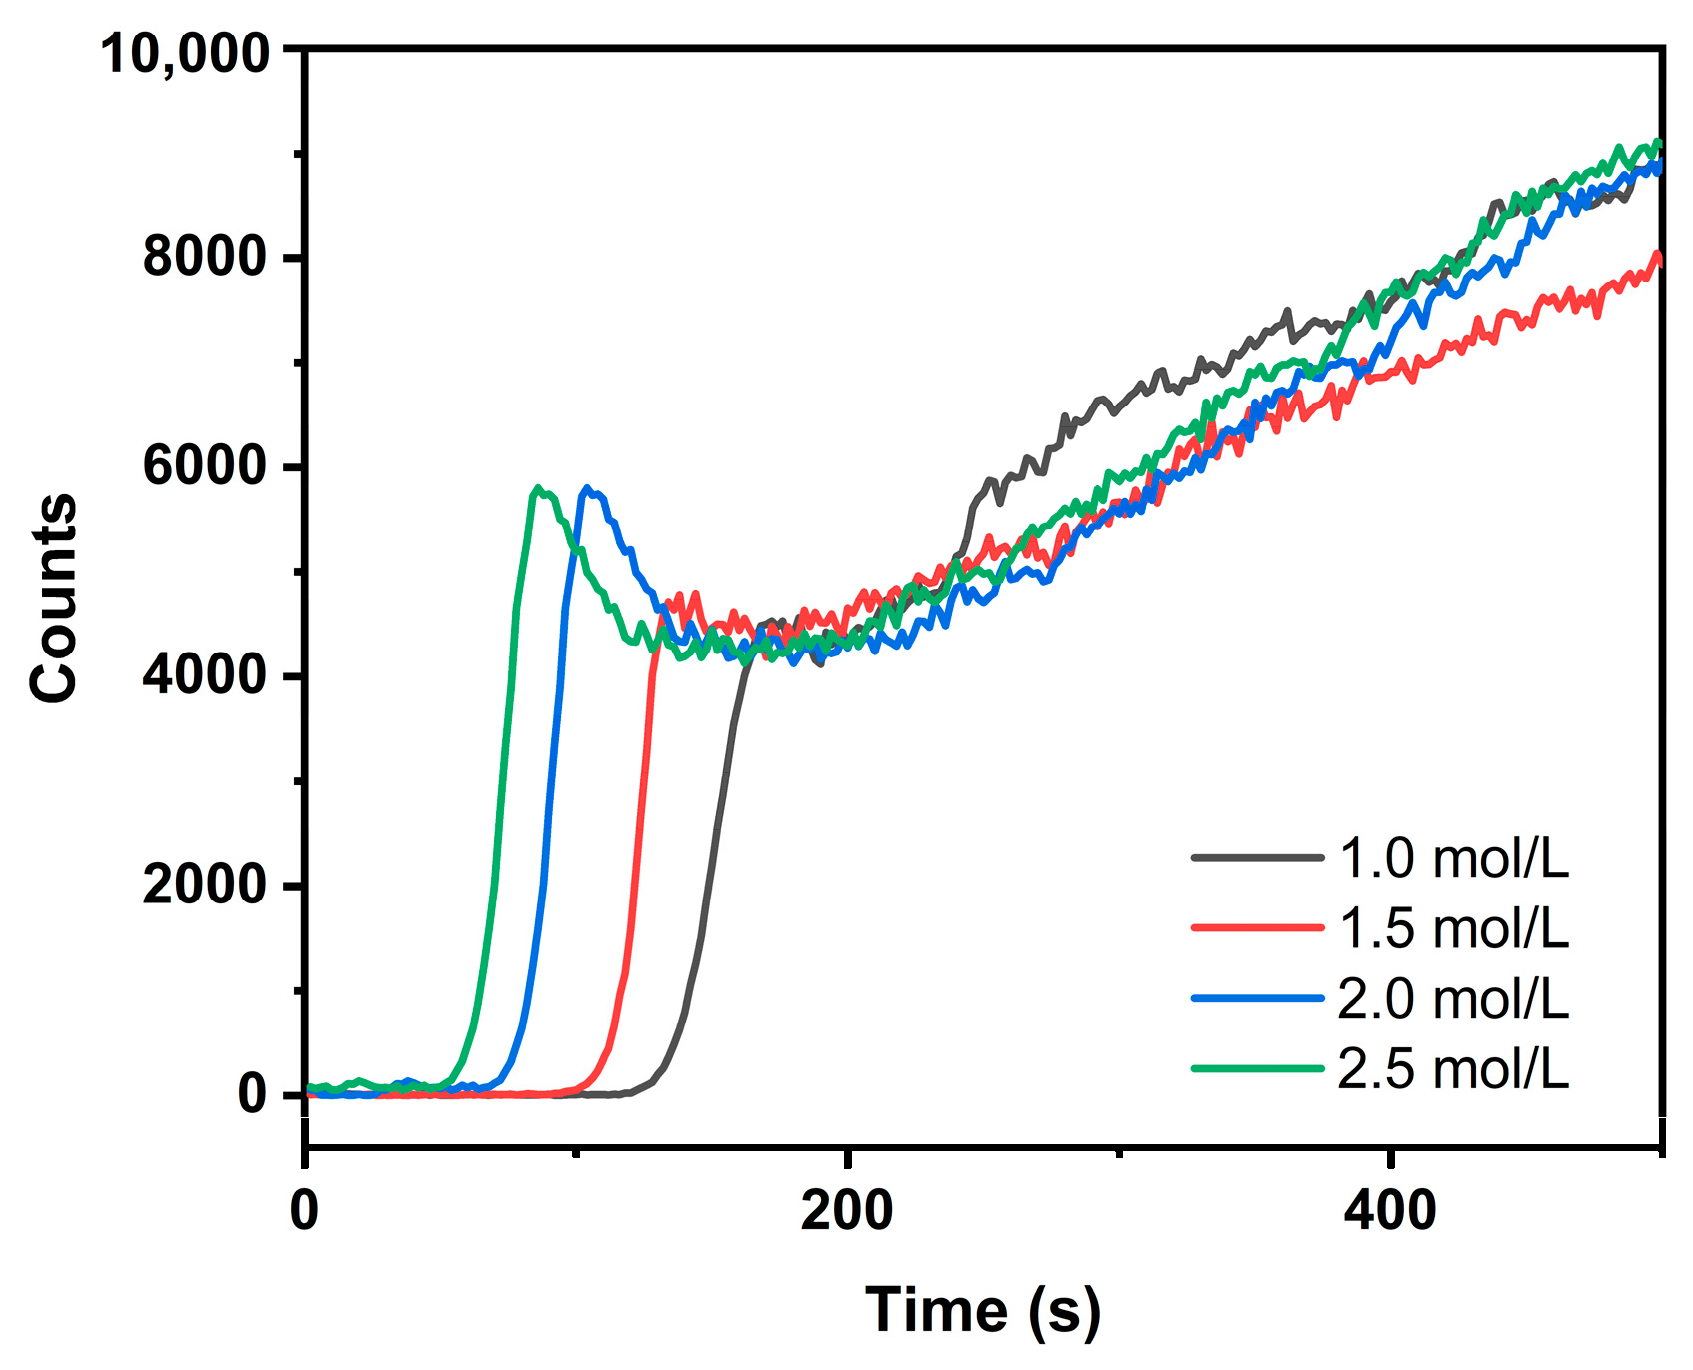
The variation in FBRM signals at different feed concentrations, as depicted in
Figure 6, reveals that higher feed concentrations lead to earlier nucleation, which is attributed to the increased supersaturation resulting from higher feed concentrations.
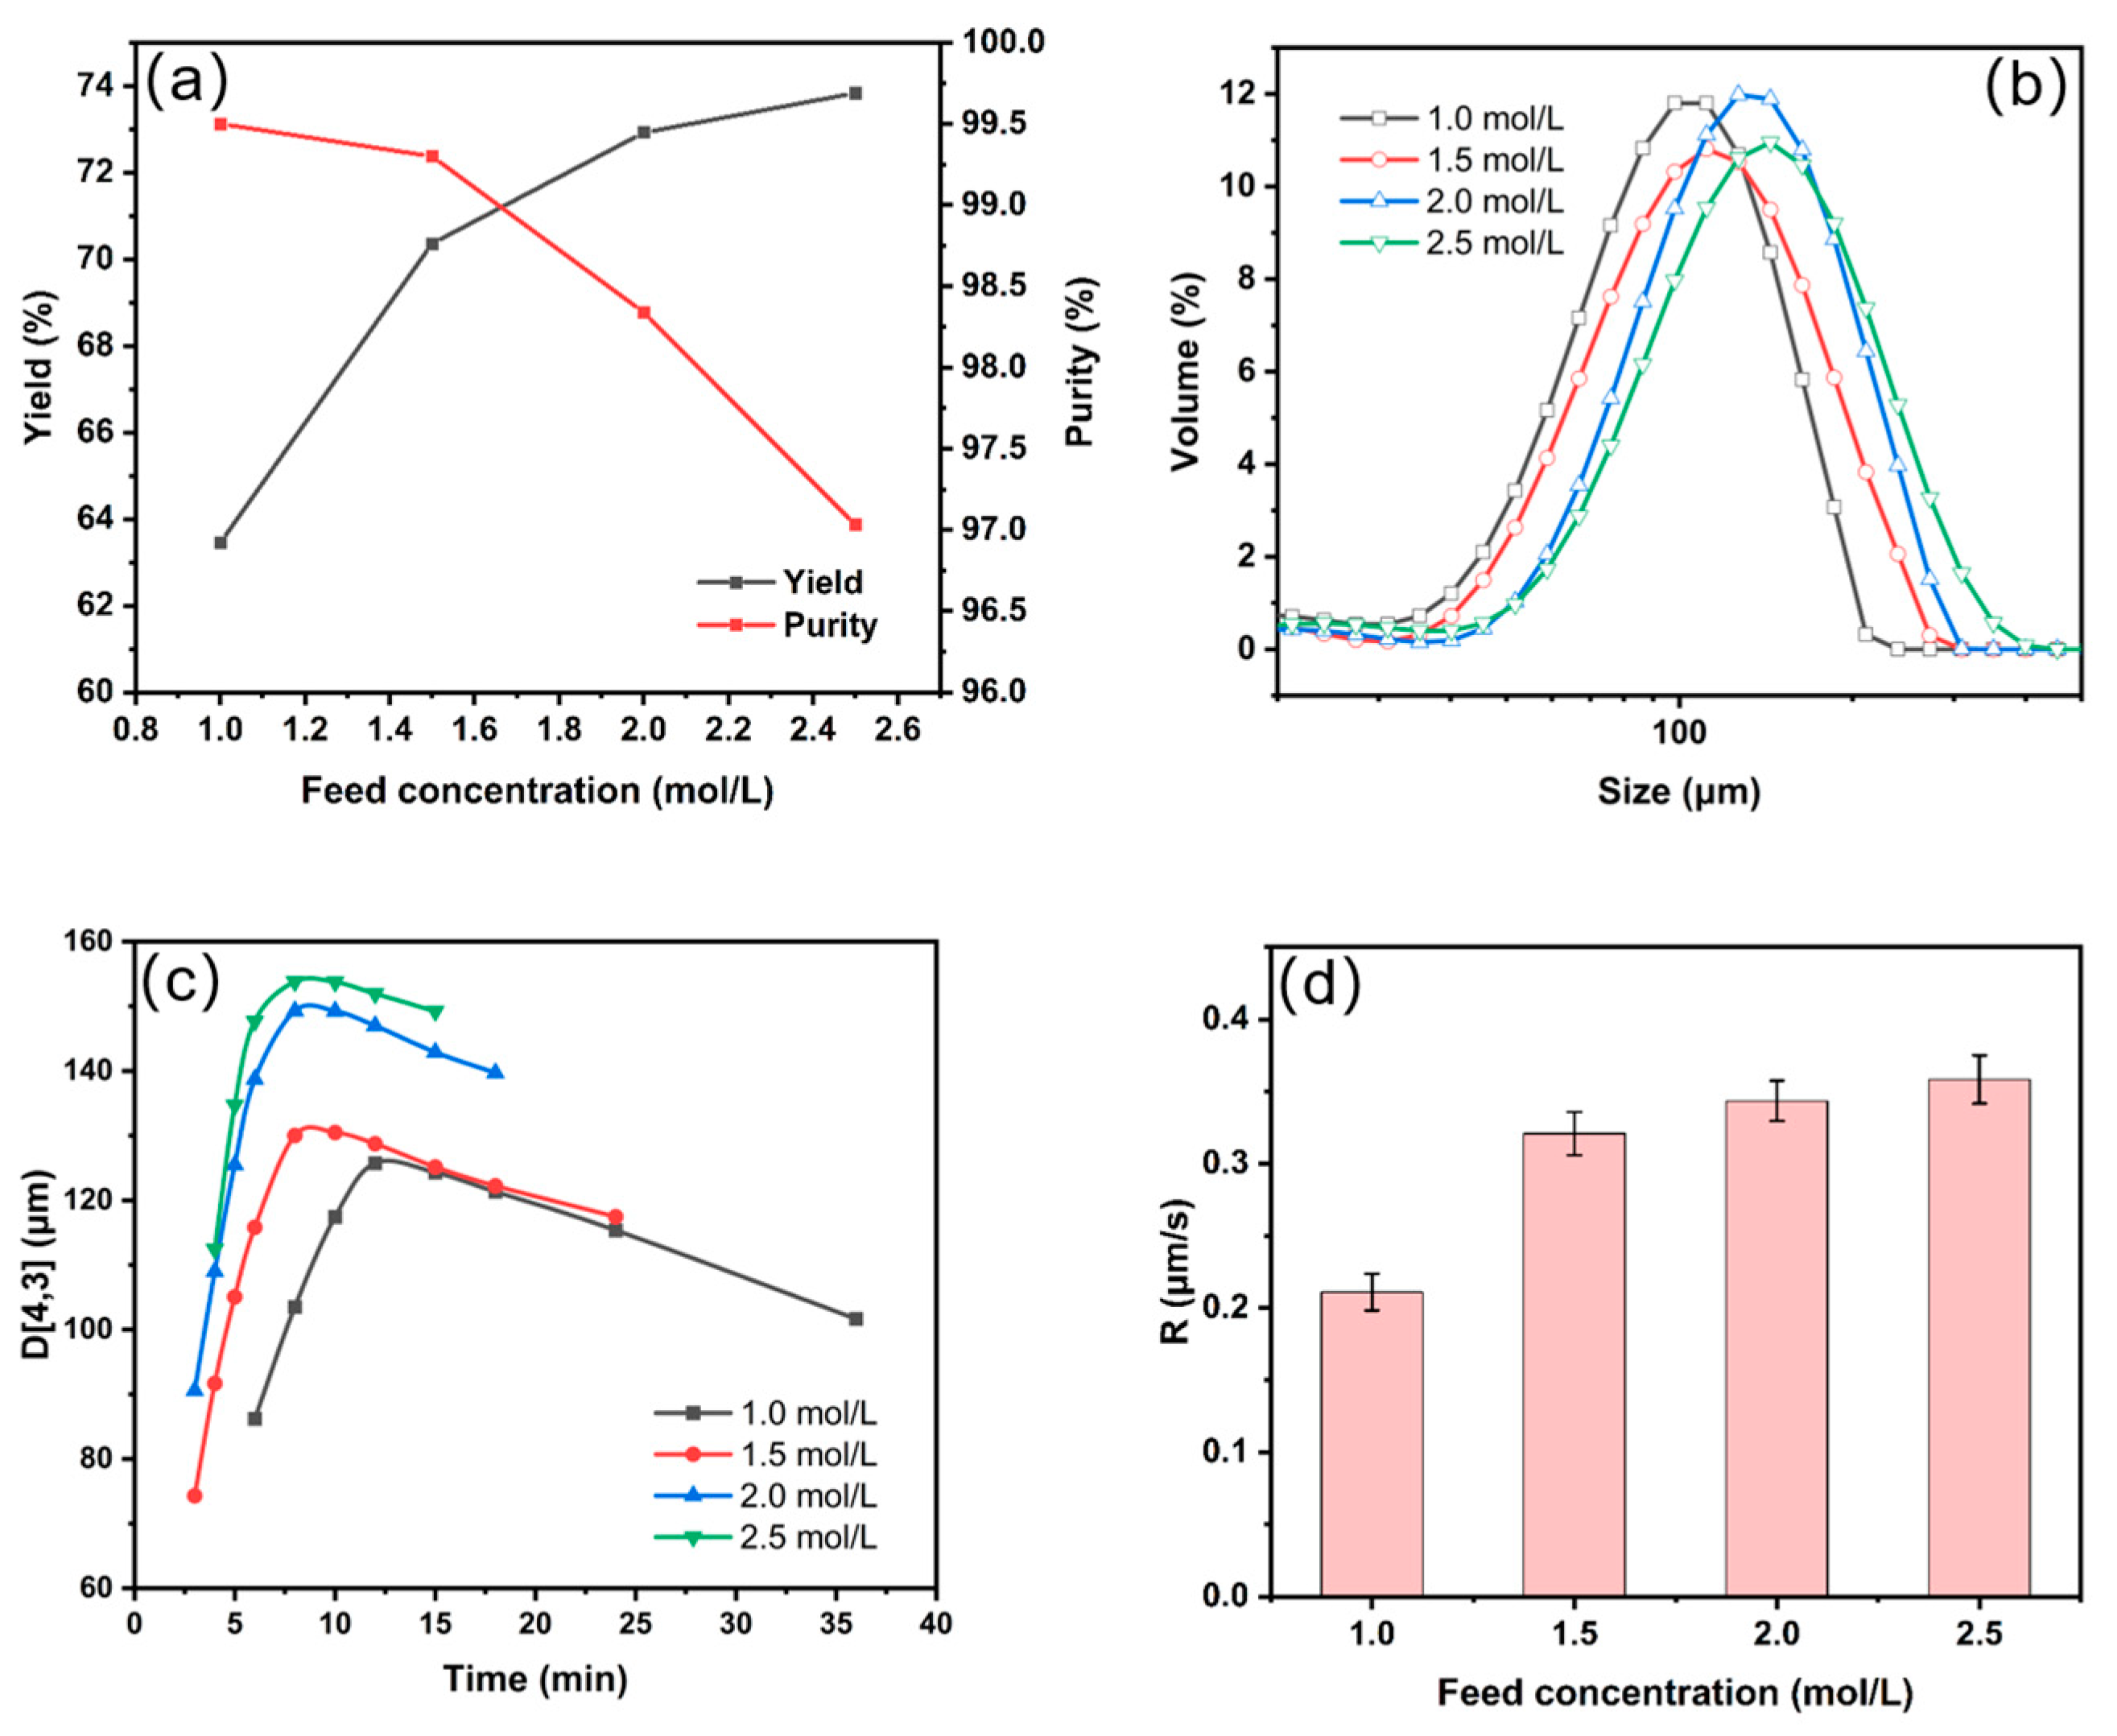
The yield and purity of lithium carbonate under different feed concentrations are presented in
Figure 7a. The product yield increases with a higher feed concentration, while the purity decreases with an increasing concentration. The concentration of impurities in the solution increases with a higher feed concentration, consequently reducing the purity of lithium carbonate. Additionally, an increase in the feed concentration accelerates the aggregation rate of crystals, leading to more impurities being encapsulated, thus reducing the purity of lithium carbonate [
28].
Figure 7b illustrates the particle size analysis of the lithium carbonate products obtained under different conditions. Higher feed concentrations were found to promote the aggregation of primary particles.
Figure 7c,d show the particle size growth curves and average growth rates of lithium carbonate under different feed concentrations. Higher feed concentrations result in larger particle sizes and faster growth rates in lithium carbonate products.
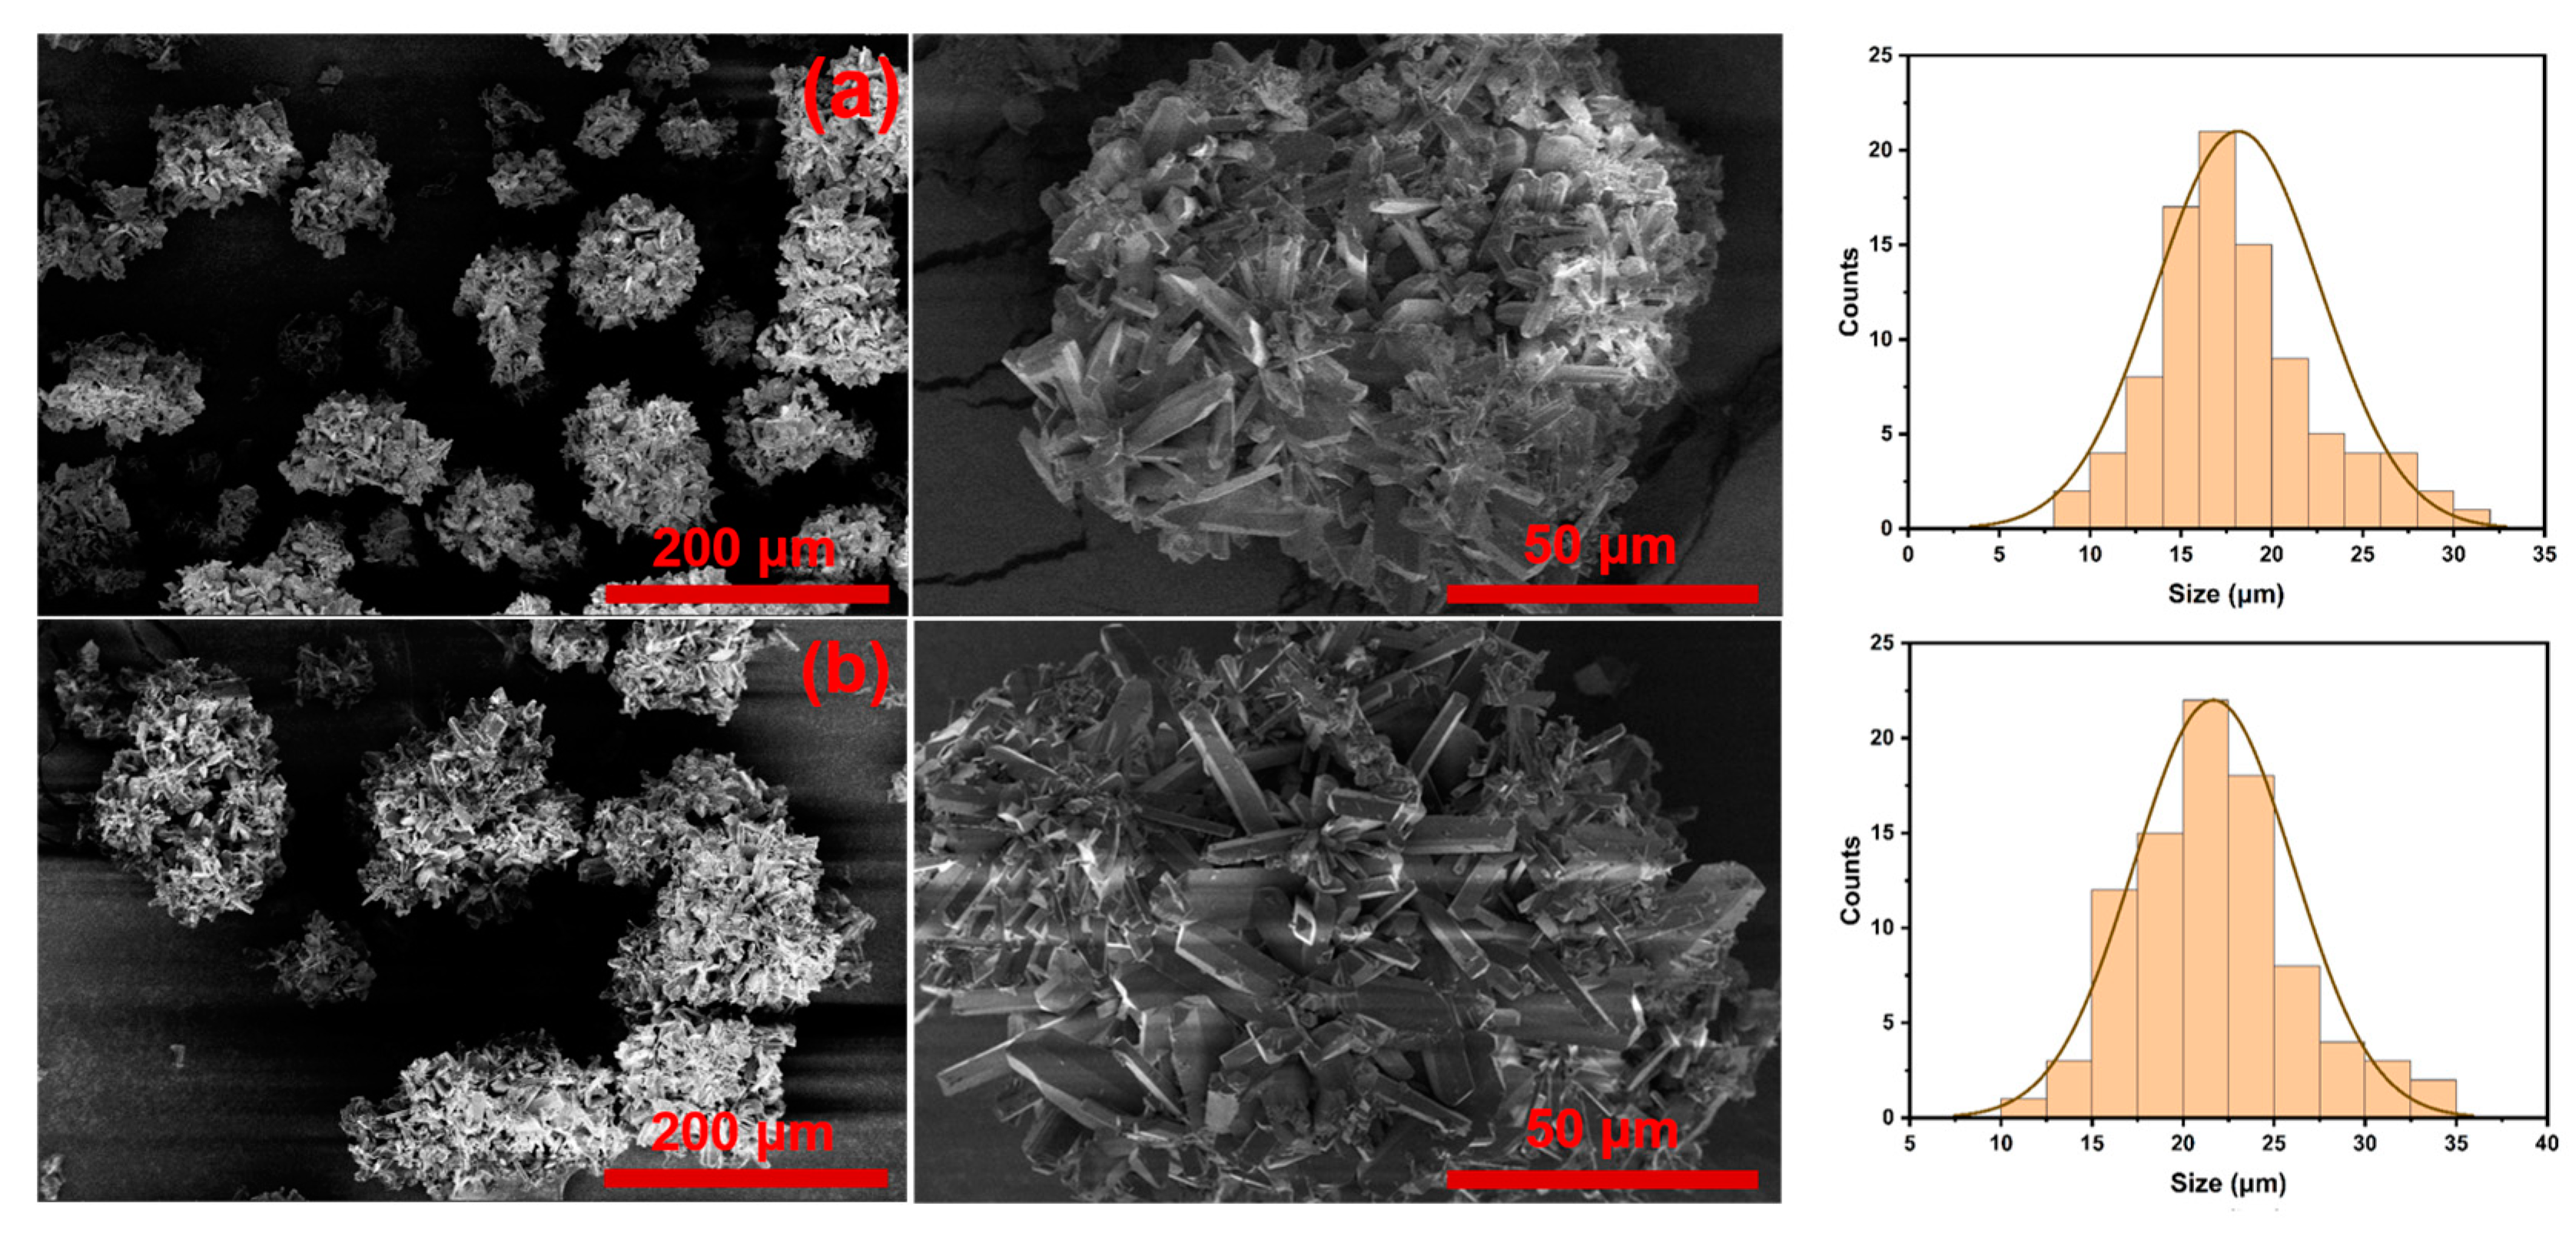
The SEM images and the comparison of primary particle sizes, shown in
Figure 8, indicate that as the feed concentration increases, the primary particle size decreases, and crystal aggregation becomes more pronounced.
3.3. Effect of Feed Rate
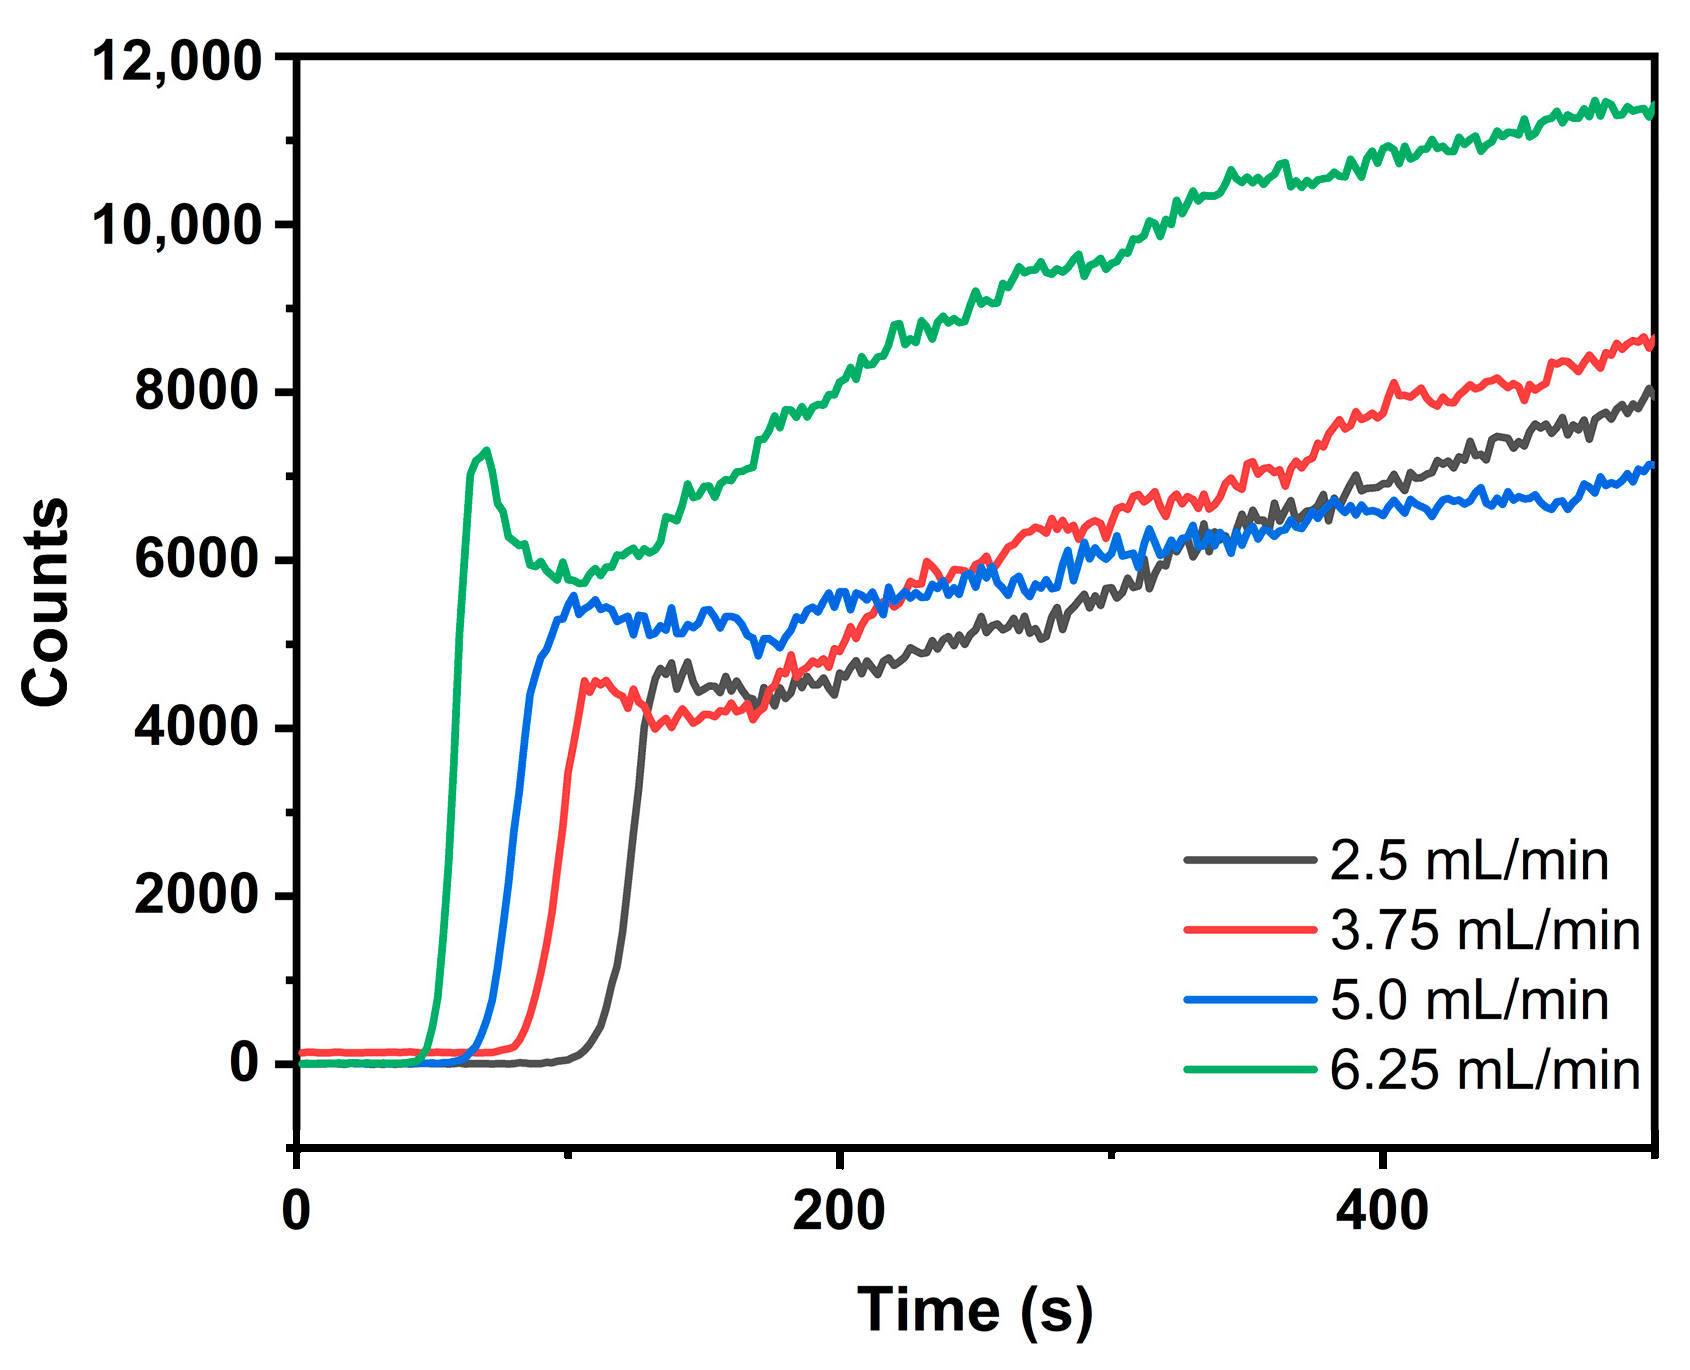
To study the impact of the feed rate, the peristaltic pump feed rates were set at 2.50 mL/min, 3.75 mL/min, 5.0 mL/min, and 6.25 mL/min; the reaction temperature was 80 °C, with the feed concentration and LiCl solution concentration both at 1.5 mol/L.
The variation curves of the particle count within the reaction solution under different feed rates, as depicted in
Figure 9, indicate that nucleation occurs earlier with higher feed rates.
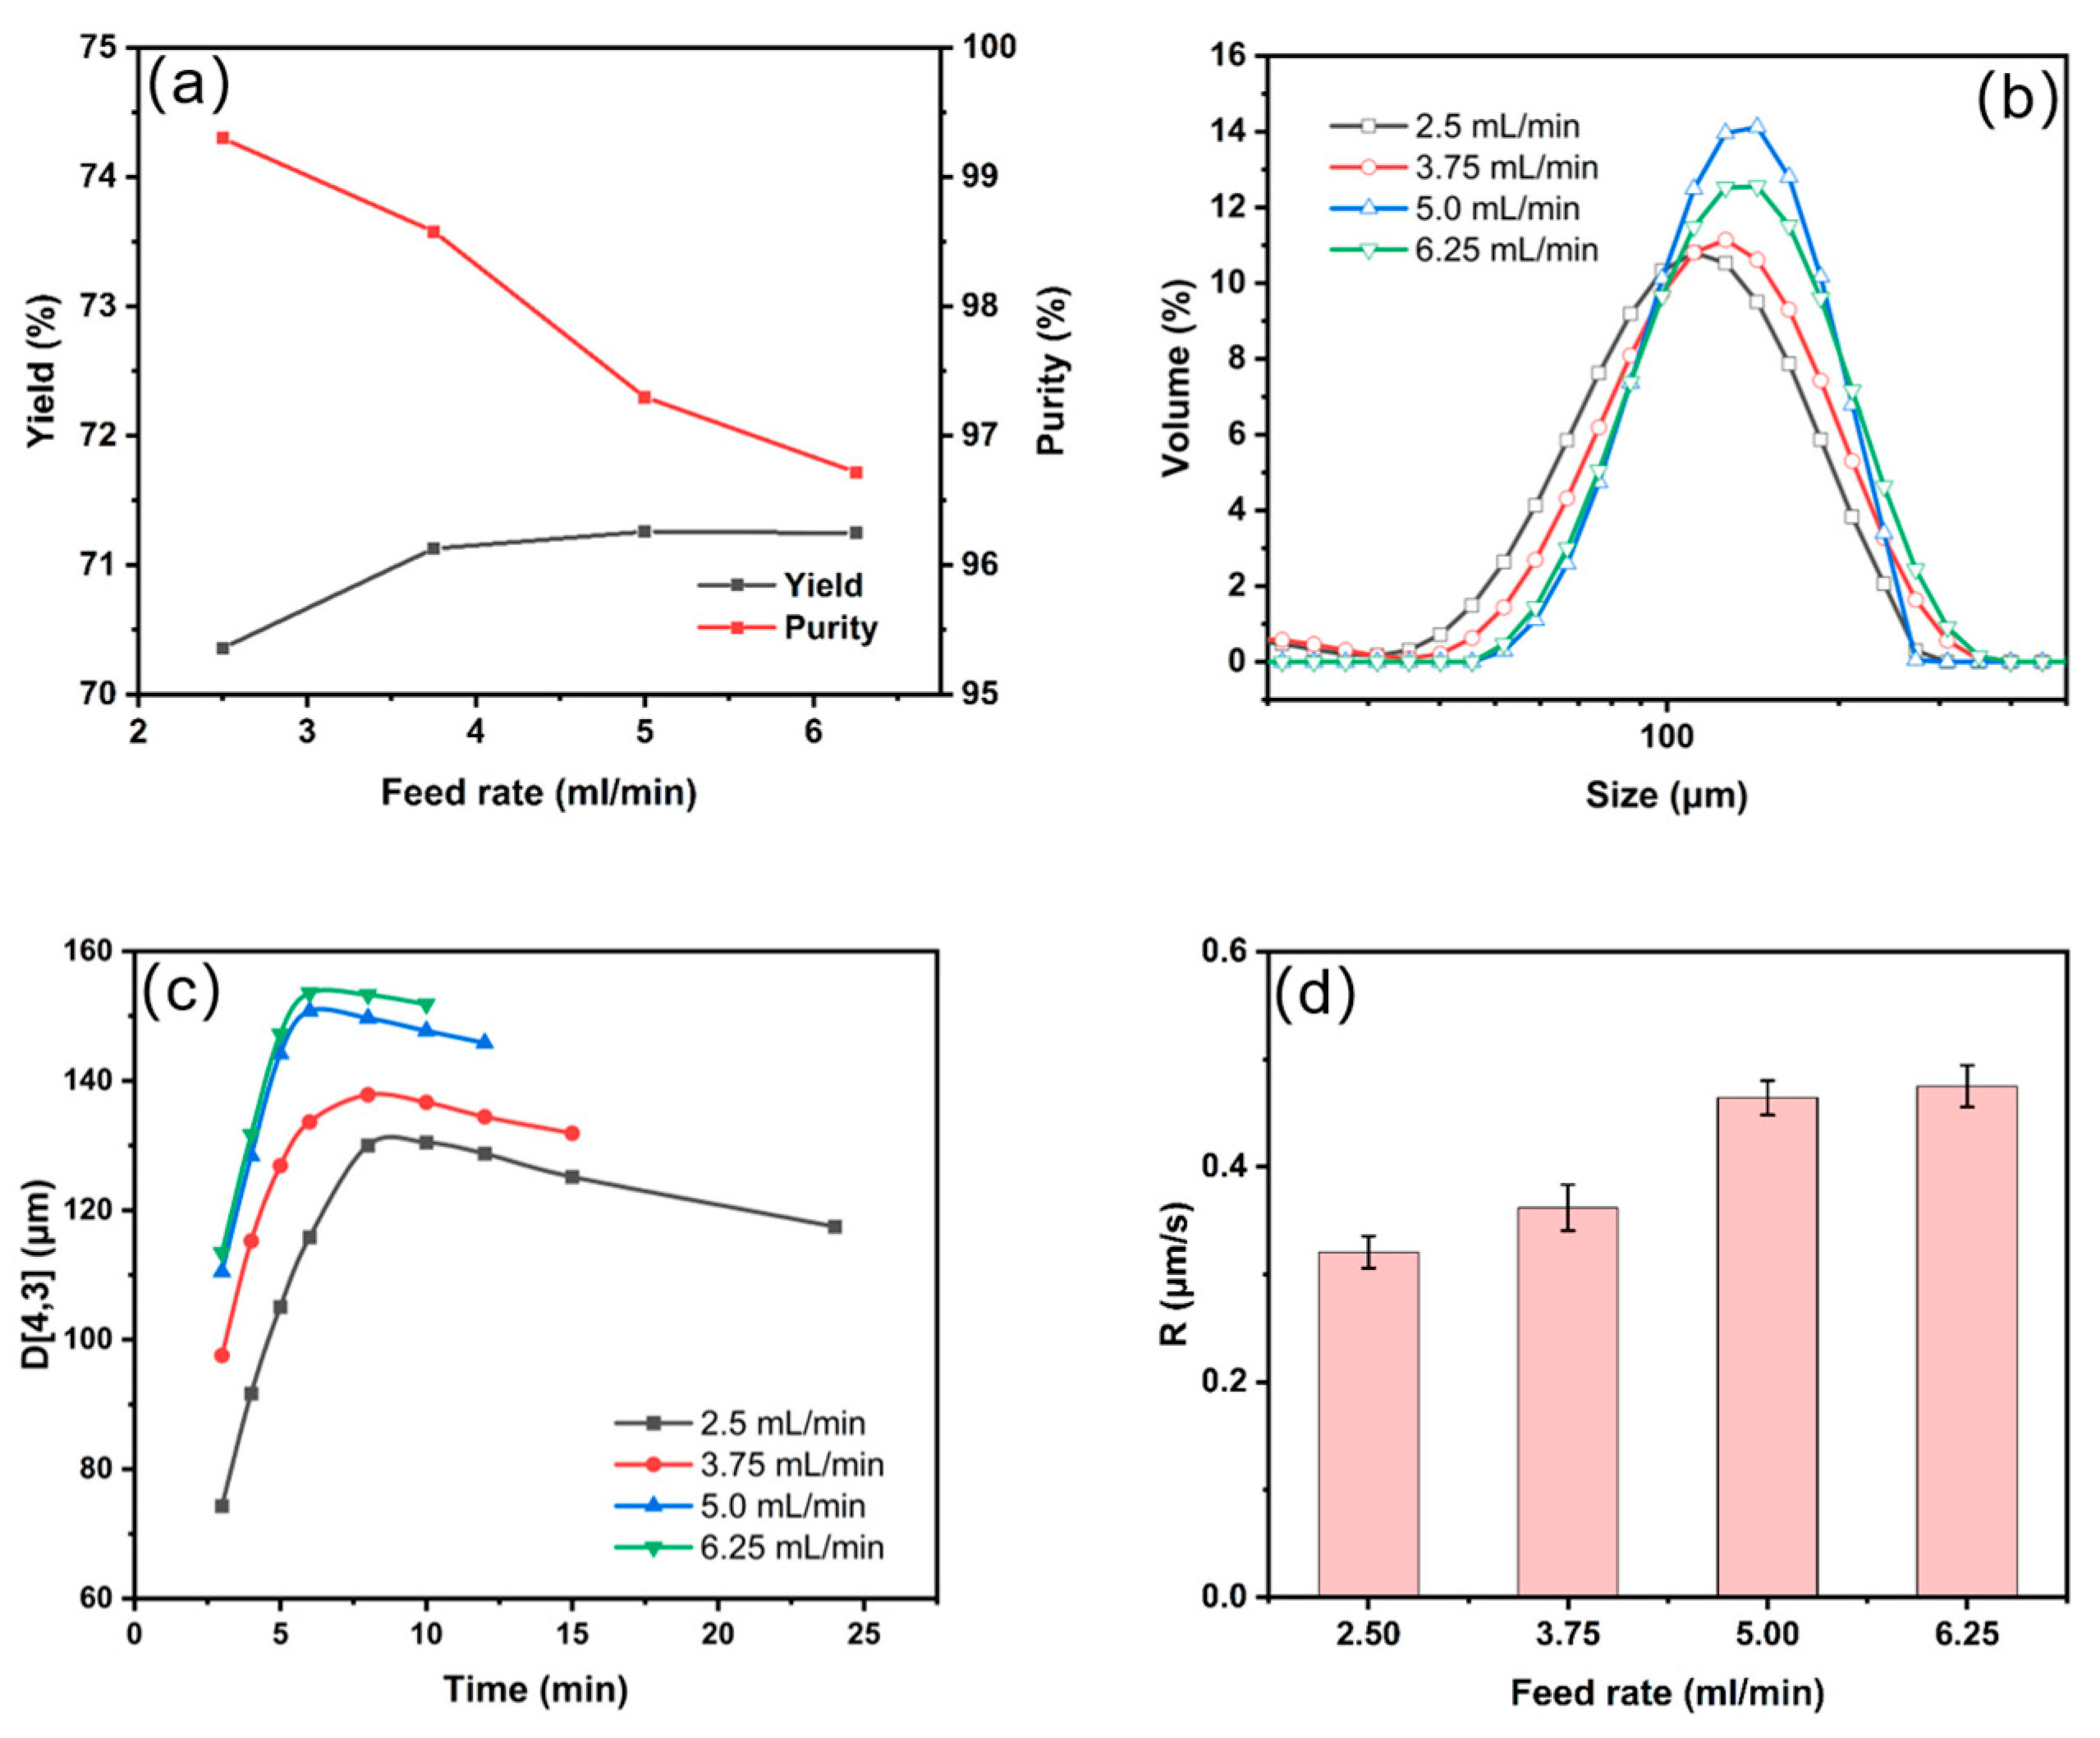
Figure 10a shows that as the feed rate increases, the change in yield is not very significant, while the purity decreases. This can be attributed to the increasing feed fate, which elevates the local concentration of ions in the solution and accelerates the growth rate of lithium carbonate crystals. Faster crystal growth leads to the formation of more lattice defects, which allows more impurities to enter the lattice, resulting in decreased purity.
Figure 10b shows the PSD of the products obtained at different feed rates. As the feed rate increases, the resulting product particle size also increases. Fine fragments from the crystal surface are peeled off during agitation, allowing for secondary nucleation. Therefore, there is a minor peak between 10 μm and 50 μm at slower feed rates.
Figure 10c illustrates the growth curves of lithium carbonate agglomerates at different feed rates. A faster feed rate corresponds to a steeper curve slope, and the maximum volume average particle size is reached earlier.
Figure 10d displays the average growth rate of lithium carbonate agglomerates at different feed rates. A higher feed rate accelerates the increase in ion concentration in the solution, facilitating the progress of the reaction—the high concentration results in the generation of fine crystals. The enhanced inter-particle binding forces between the aggregated particles lead to an increase in the size of the lithium carbonate crystals obtained.
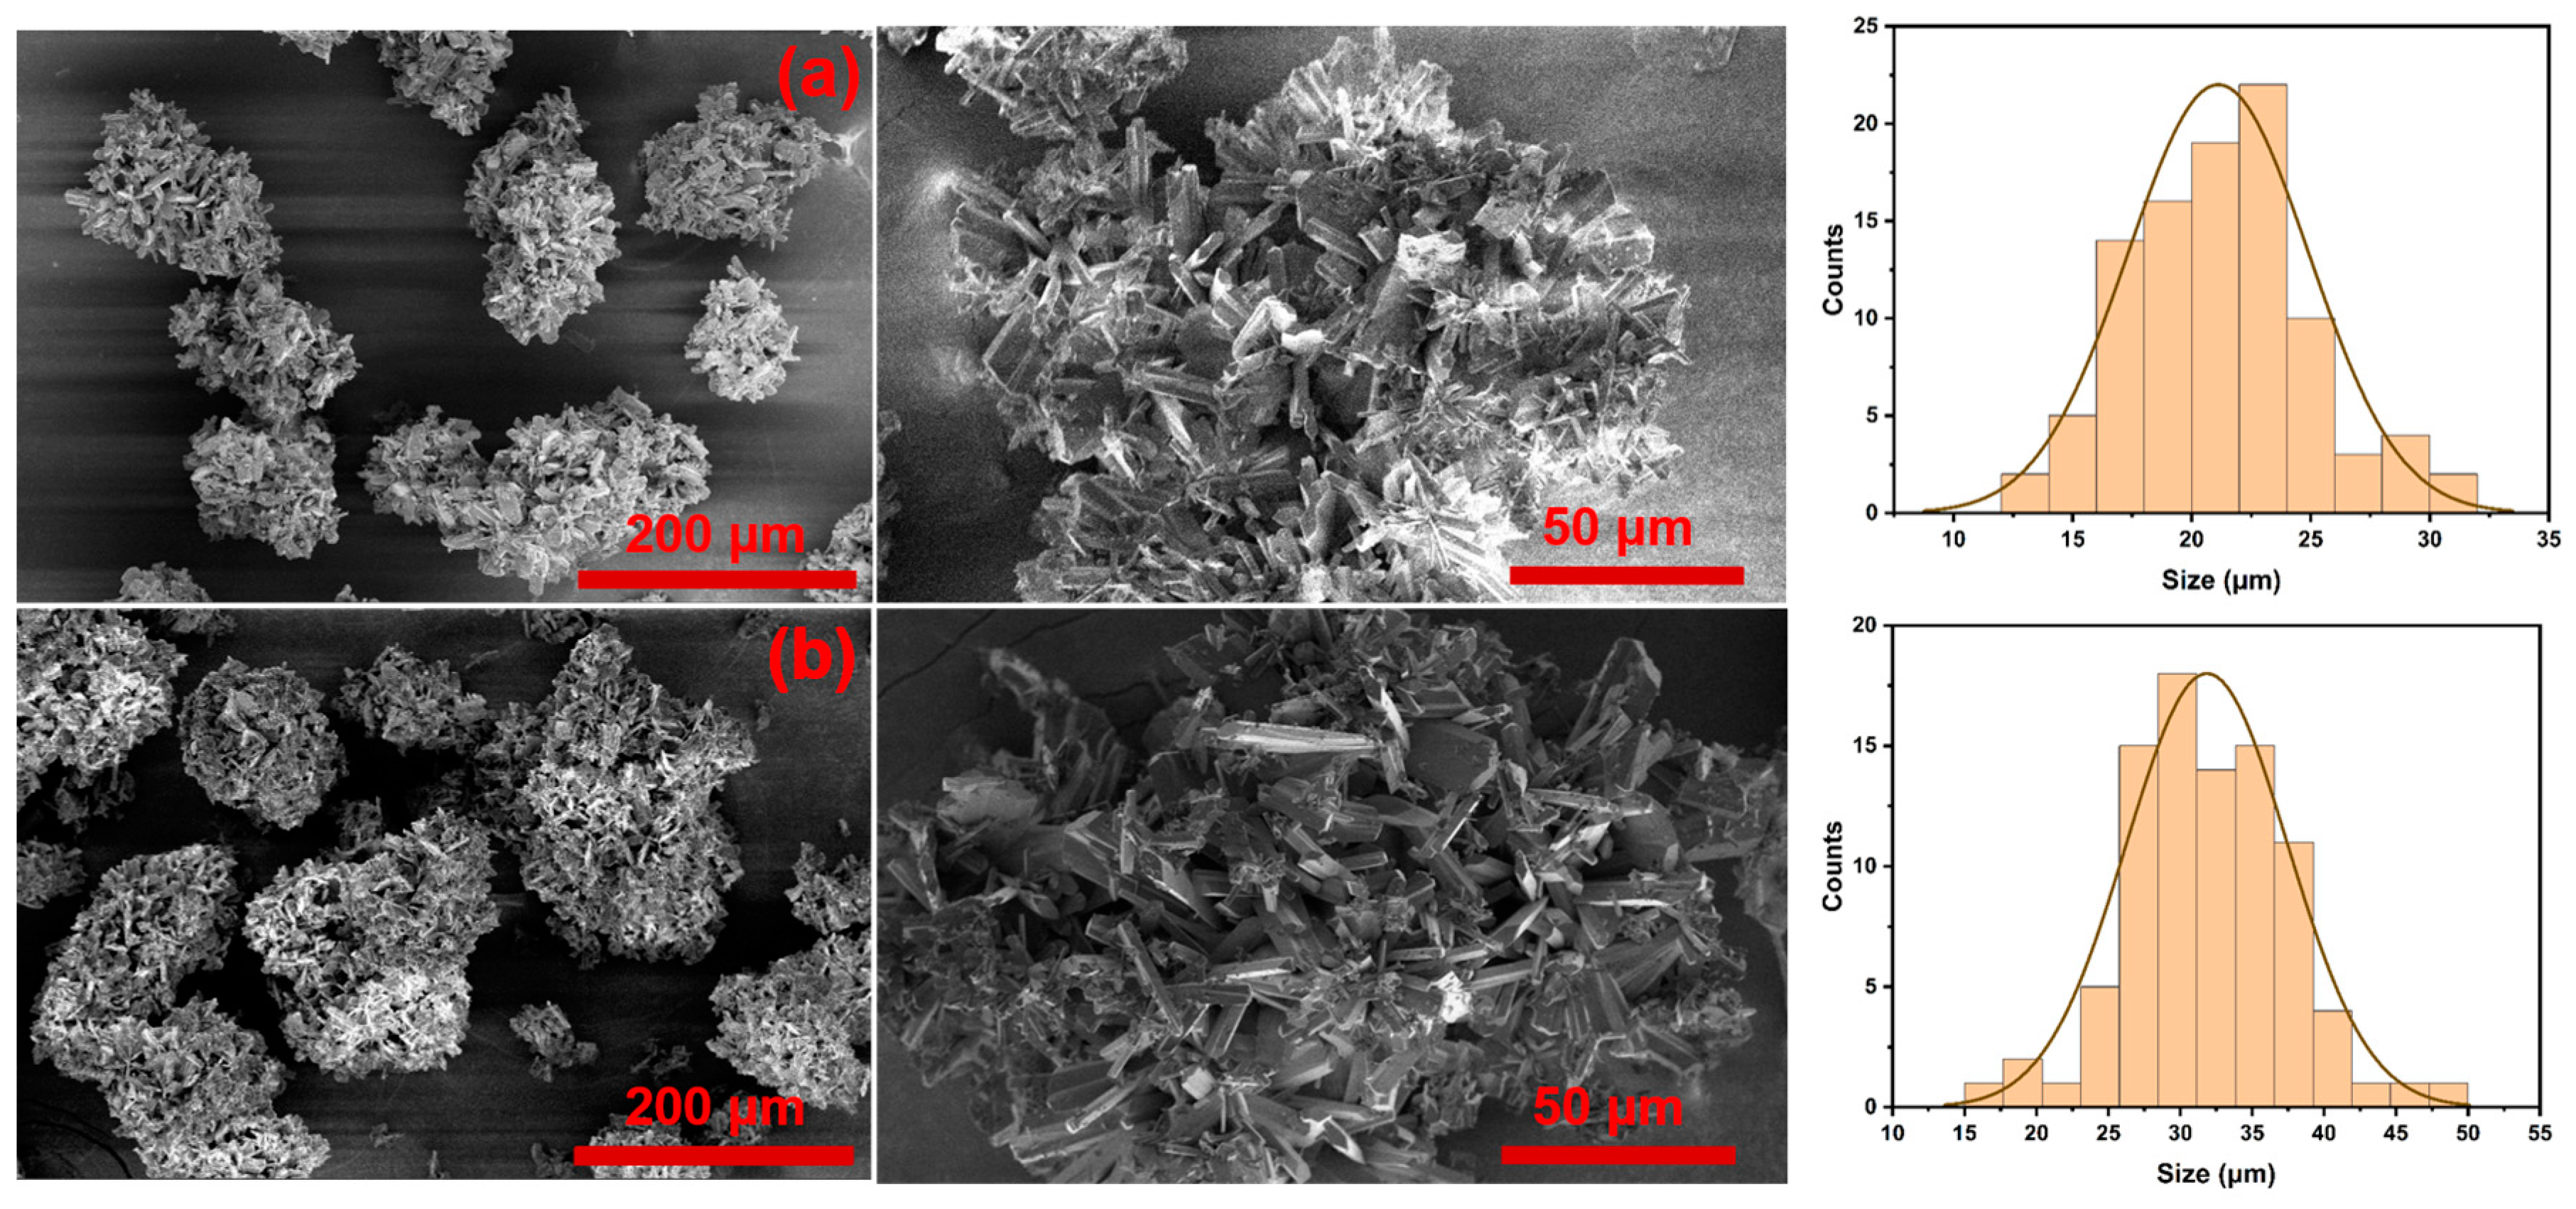
The SEM images and primary particle size data in
Figure 11 show that the increase in the feed rate leads to an increase in the primary particle size, and crystal aggregation becomes more pronounced.
3.4. Effect of LiCl Solution Concentration
Lithium chloride solutions with varying concentrations but equal volumes were prepared to investigate the influence of the precursor concentration on lithium carbonate crystallization, maintaining the reaction temperature of 80 °C, with a feed concentration of 1.5 mol/L and a feed rate of 2.5 mL/min. The agitation rate was set to 400 rpm.
Figure 12 illustrates the nucleation time at different concentrations. It is evident that with higher solute concentrations, nucleation occurs earlier. This phenomenon arises from the higher concentration, increasing solution supersaturation and facilitating faster nucleation.
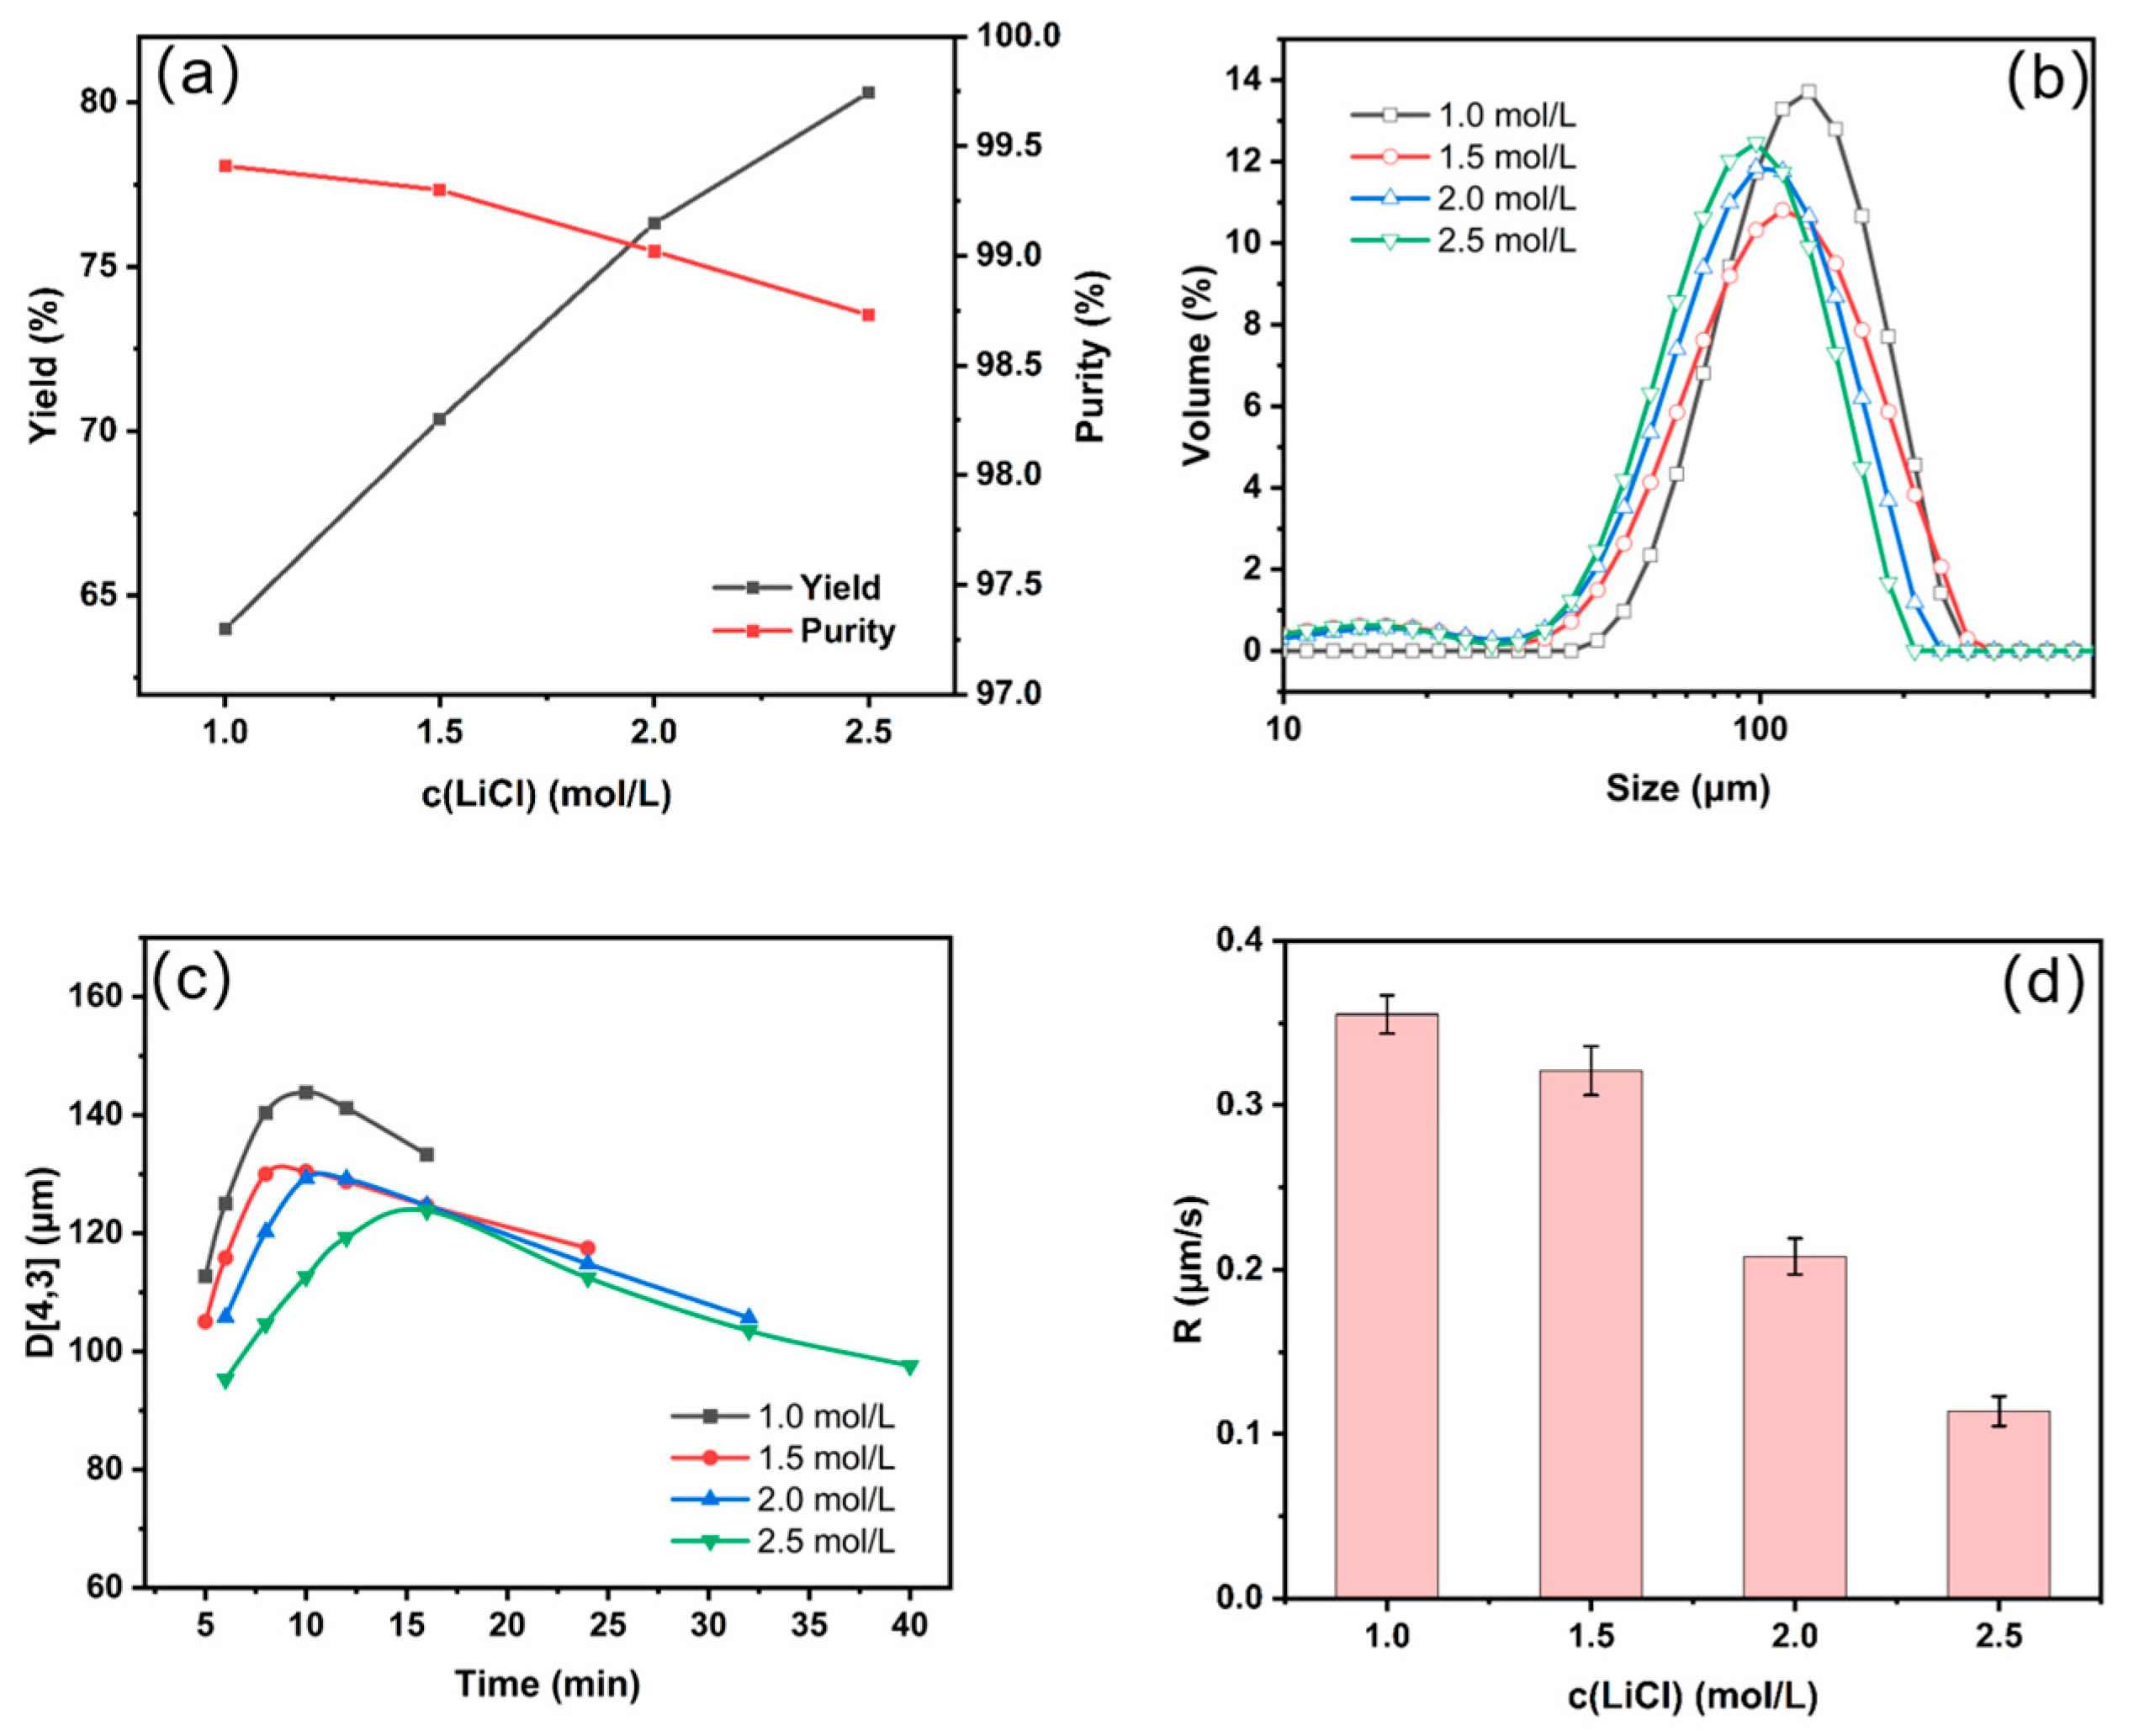
Figure 13a demonstrates the yield and purity of lithium carbonate at various concentrations. It is observed that the solute concentration significantly influences the yield of lithium carbonate; higher concentrations result in increased lithium carbonate production, leading to a gradual increase in yield. However, as the concentration increases, there is a slight decrease in the purity of lithium carbonate.
The particle size distribution of lithium carbonate aggregates at different concentrations is also presented in
Figure 13b. Contrary to our expectations, the particle size decreases as the lithium chloride concentration increases. We hypothesize that this discrepancy arises from significant differences in the solute concentrations, leading to variations in supersaturation. When the supersaturation is low, the nucleation driving force is insufficient, allowing for sufficient crystal growth and aggregation time. Similar phenomena and explanations have been reported in previous studies in the literature [
24,
29].
Figure 13c,d depict the particle size growth curves and average growth rates of lithium carbonate aggregates at different LiCl solution concentrations. Lower concentrations result in a faster particle size growth in lithium carbonate.
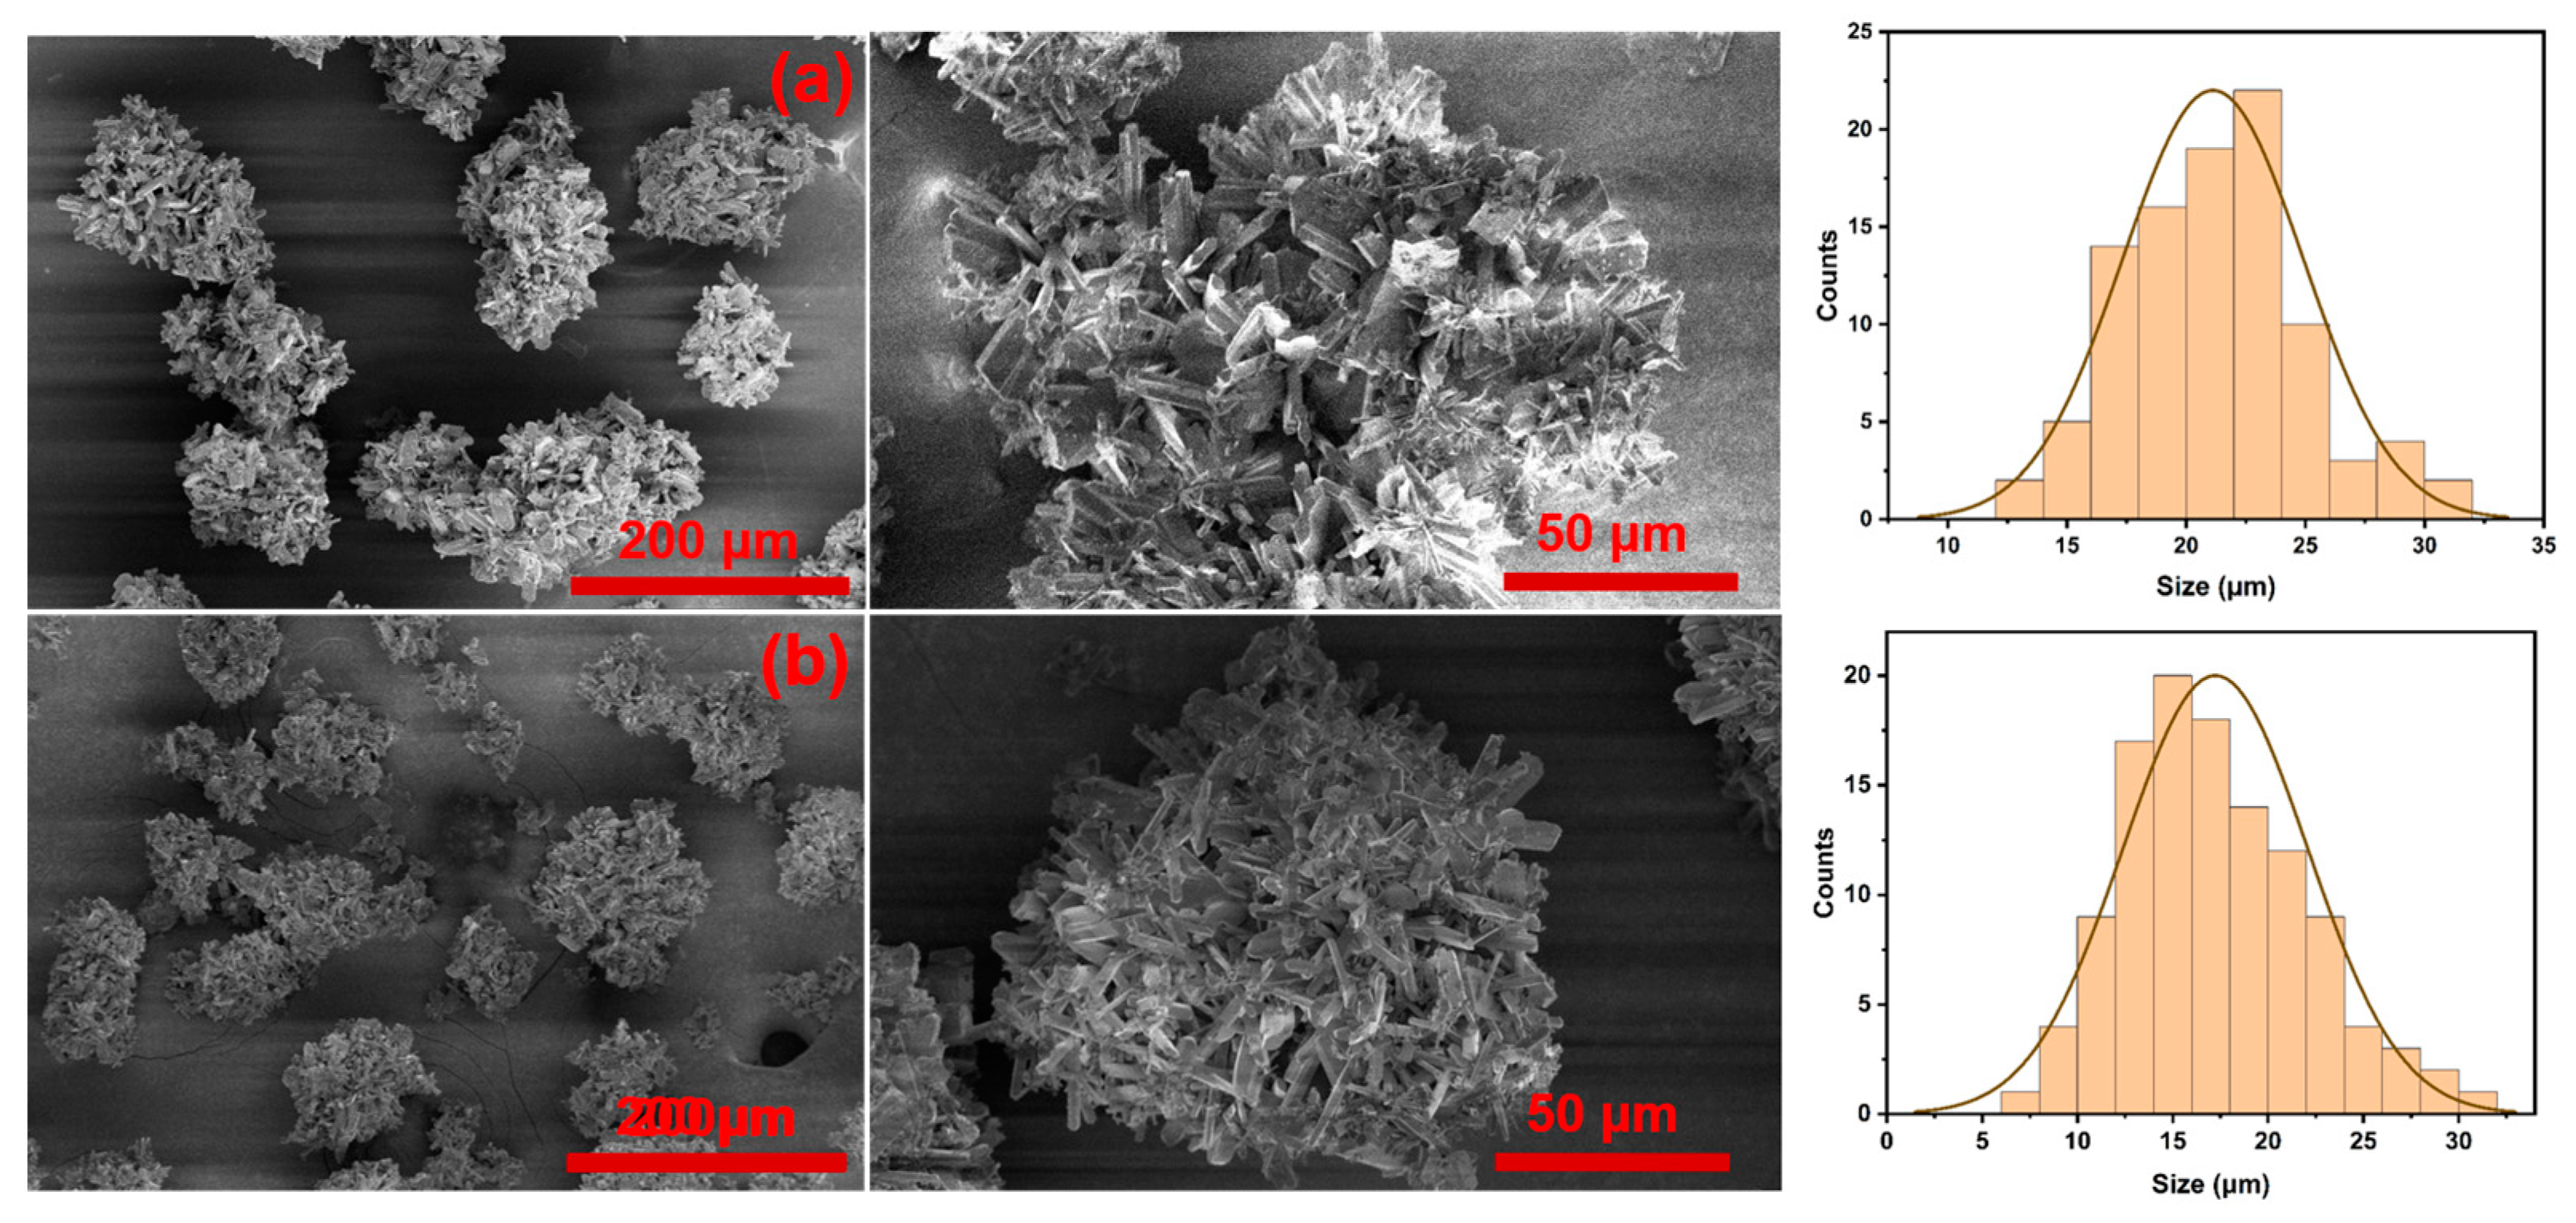
A morphological analysis of lithium carbonate under different conditions was conducted, yielding
Figure 14. It is evident that lithium carbonate obtained at lower LiCl solution concentrations exhibits larger particle sizes than that obtained at higher concentrations. Additionally, primary particles are larger under lower supersaturation conditions, indicating enhanced crystal growth and aggregation. Conversely, a greater abundance of fine particles is generated under high supersaturation conditions.
3.5. Effect of Agitation
The influence of different agitation rates on crystallization was studied by setting the agitation rate range from 200 rpm to 800 rpm. The reaction temperature was maintained at 80 °C, with the feed concentration and LiCl solution concentration both at 1.5 mol/L, and a feed rate of 2.5 mL/min.
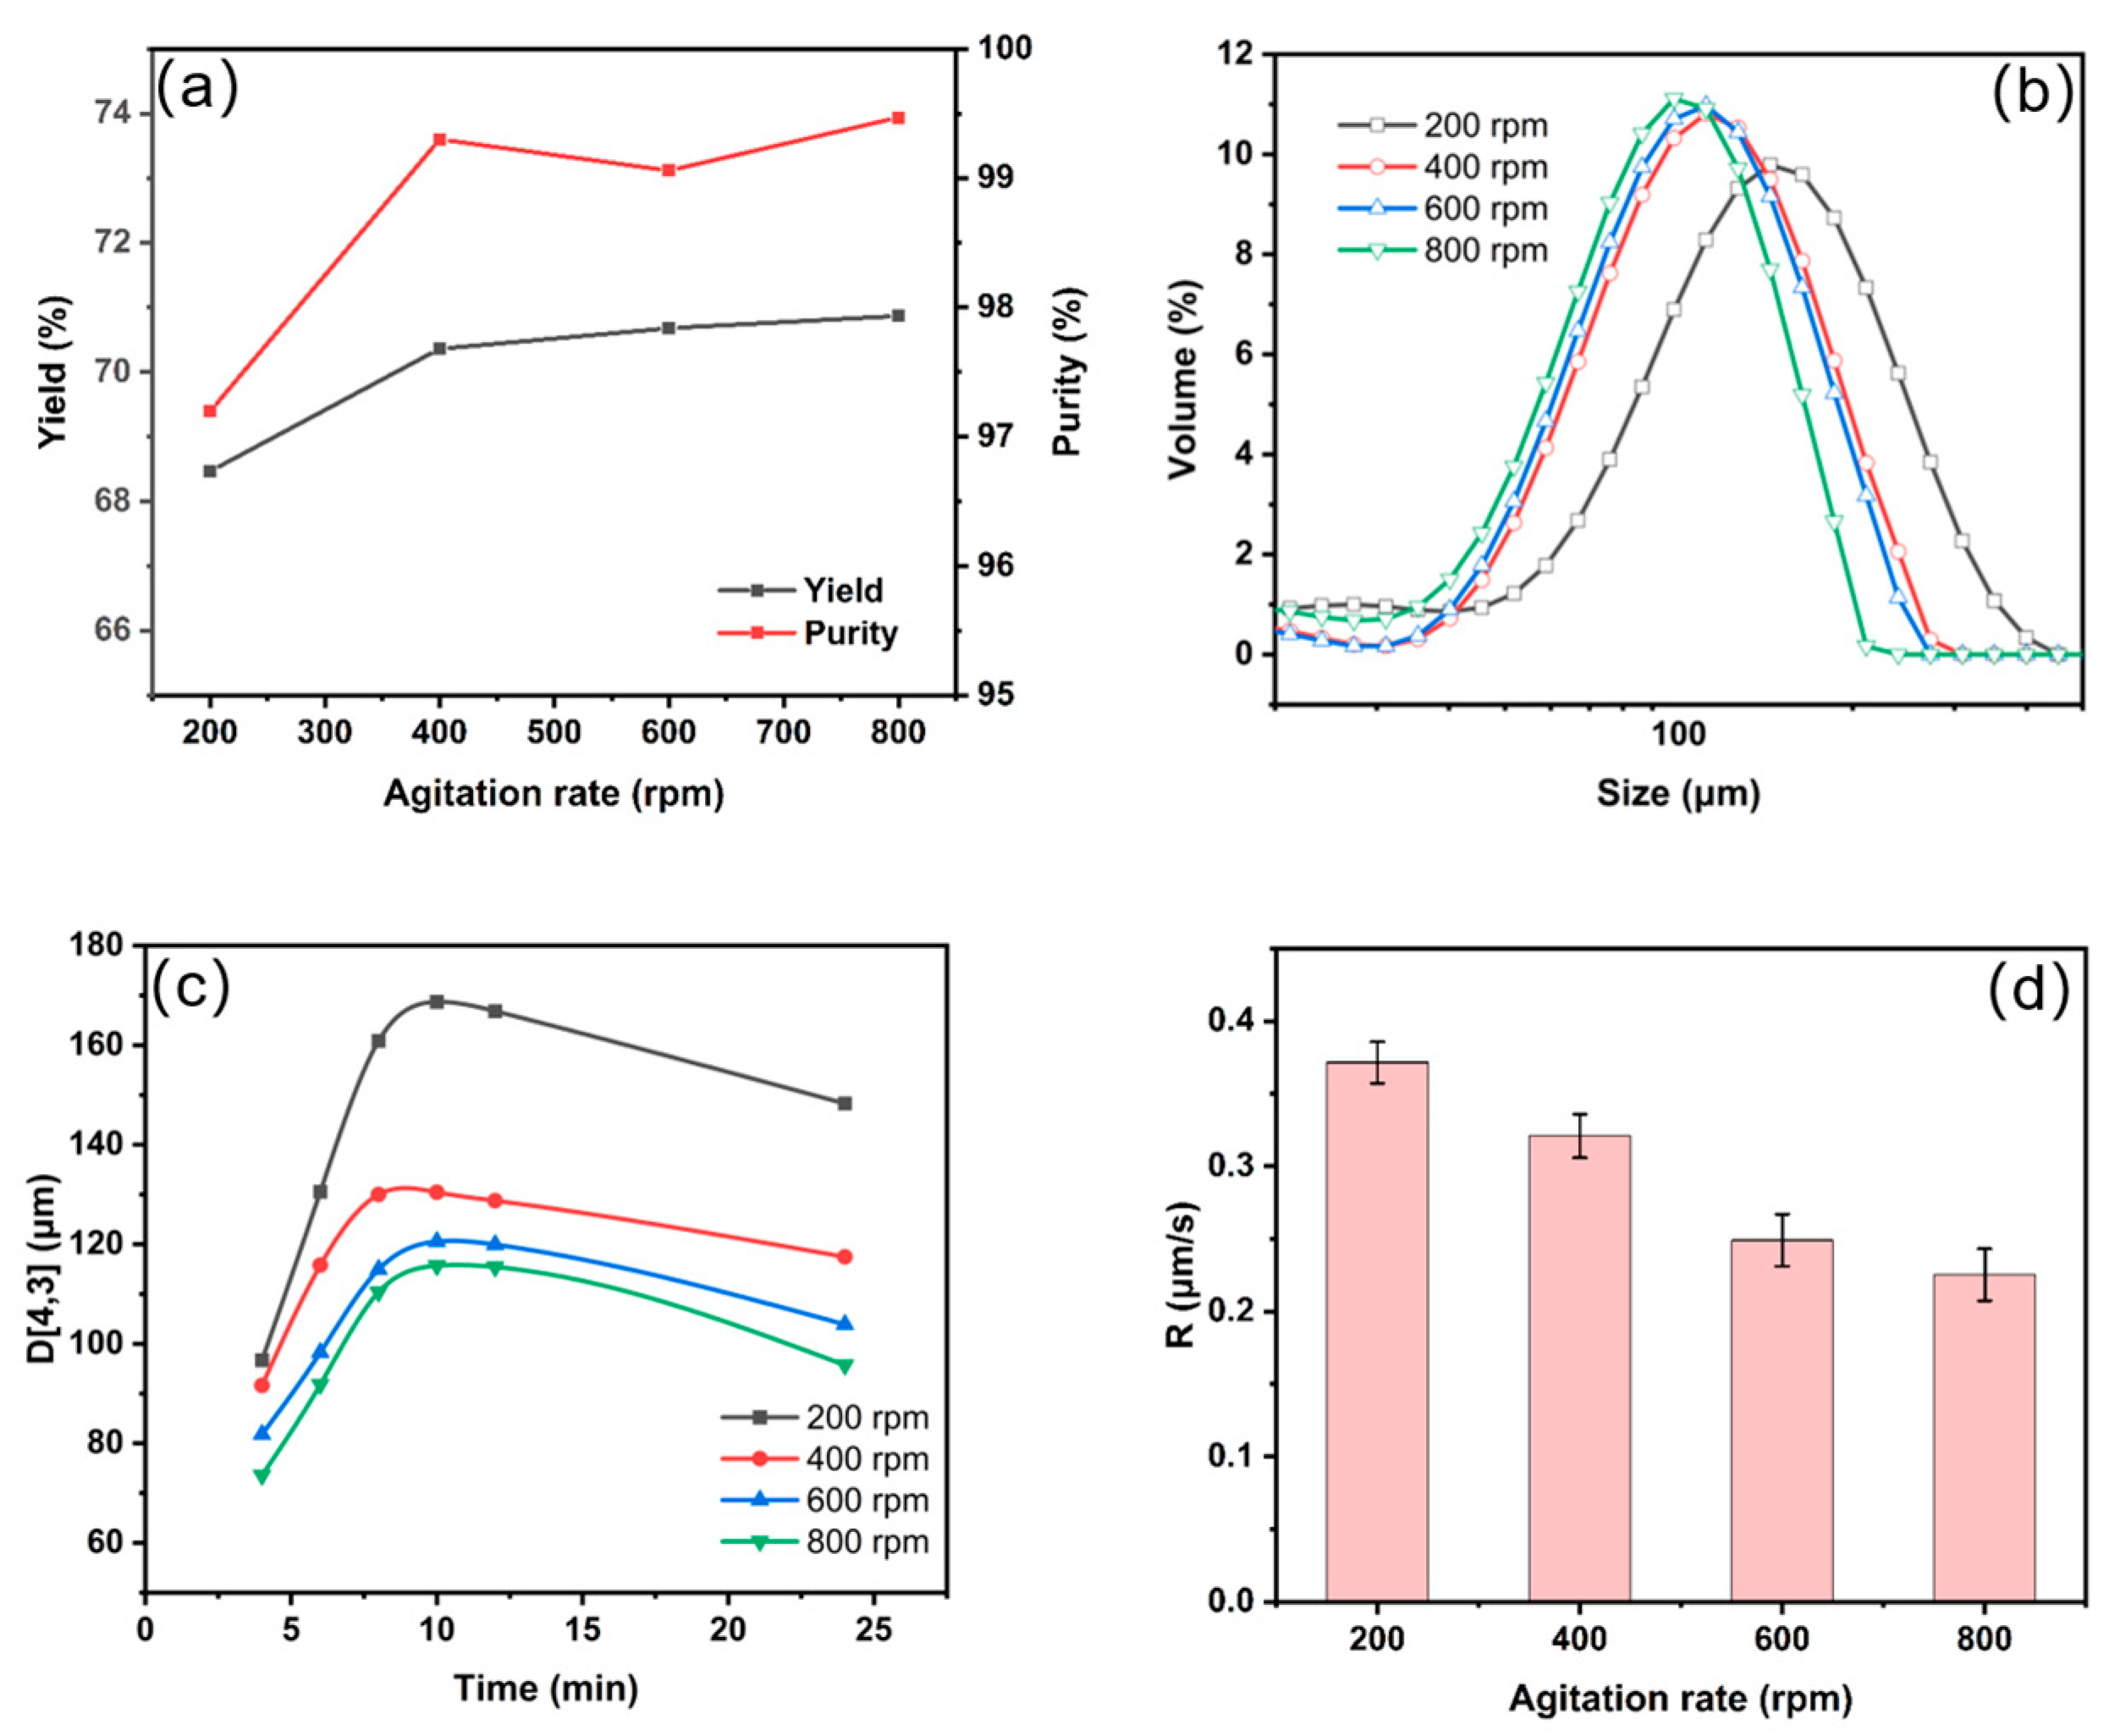
Figure 15a illustrates the purity and yield at different agitation rates. At an agitation rate of 200 rpm, the yield of lithium carbonate was only 68.47%, with a purity of merely 97.2%. However, as the agitation rate increased from 400 rpm to 800 rpm, there was no significant change in the product yield and purity. This trend can be attributed to the increase in mass transfer rates, thereby affecting product formation and yield [
30].
Figure 15b illustrates the particle size at different agitation rates, indicating that as the agitation rate increases, the particle size of the product decreases. This is attributed to the increased collision frequency between the crystals at higher agitation rates. Simultaneously, at lower agitation rates, the shear force exerted by the liquid on the crystal particles is minimal, leaving the crystal aggregation process unaffected. However, the increase in the agitation rate increases the shear force, thereby reducing the particle size of the product [
8].
Figure 15c,d depict the growth conditions of the lithium carbonate agglomerates at different agitation rates. At an agitation rate of 200 rpm, the growth rate of the lithium carbonate agglomerates is notably faster compared to other conditions. However, with the increase in the agitation rate, the particle size and growth rate of lithium carbonate gradually decrease and tend to stabilize.
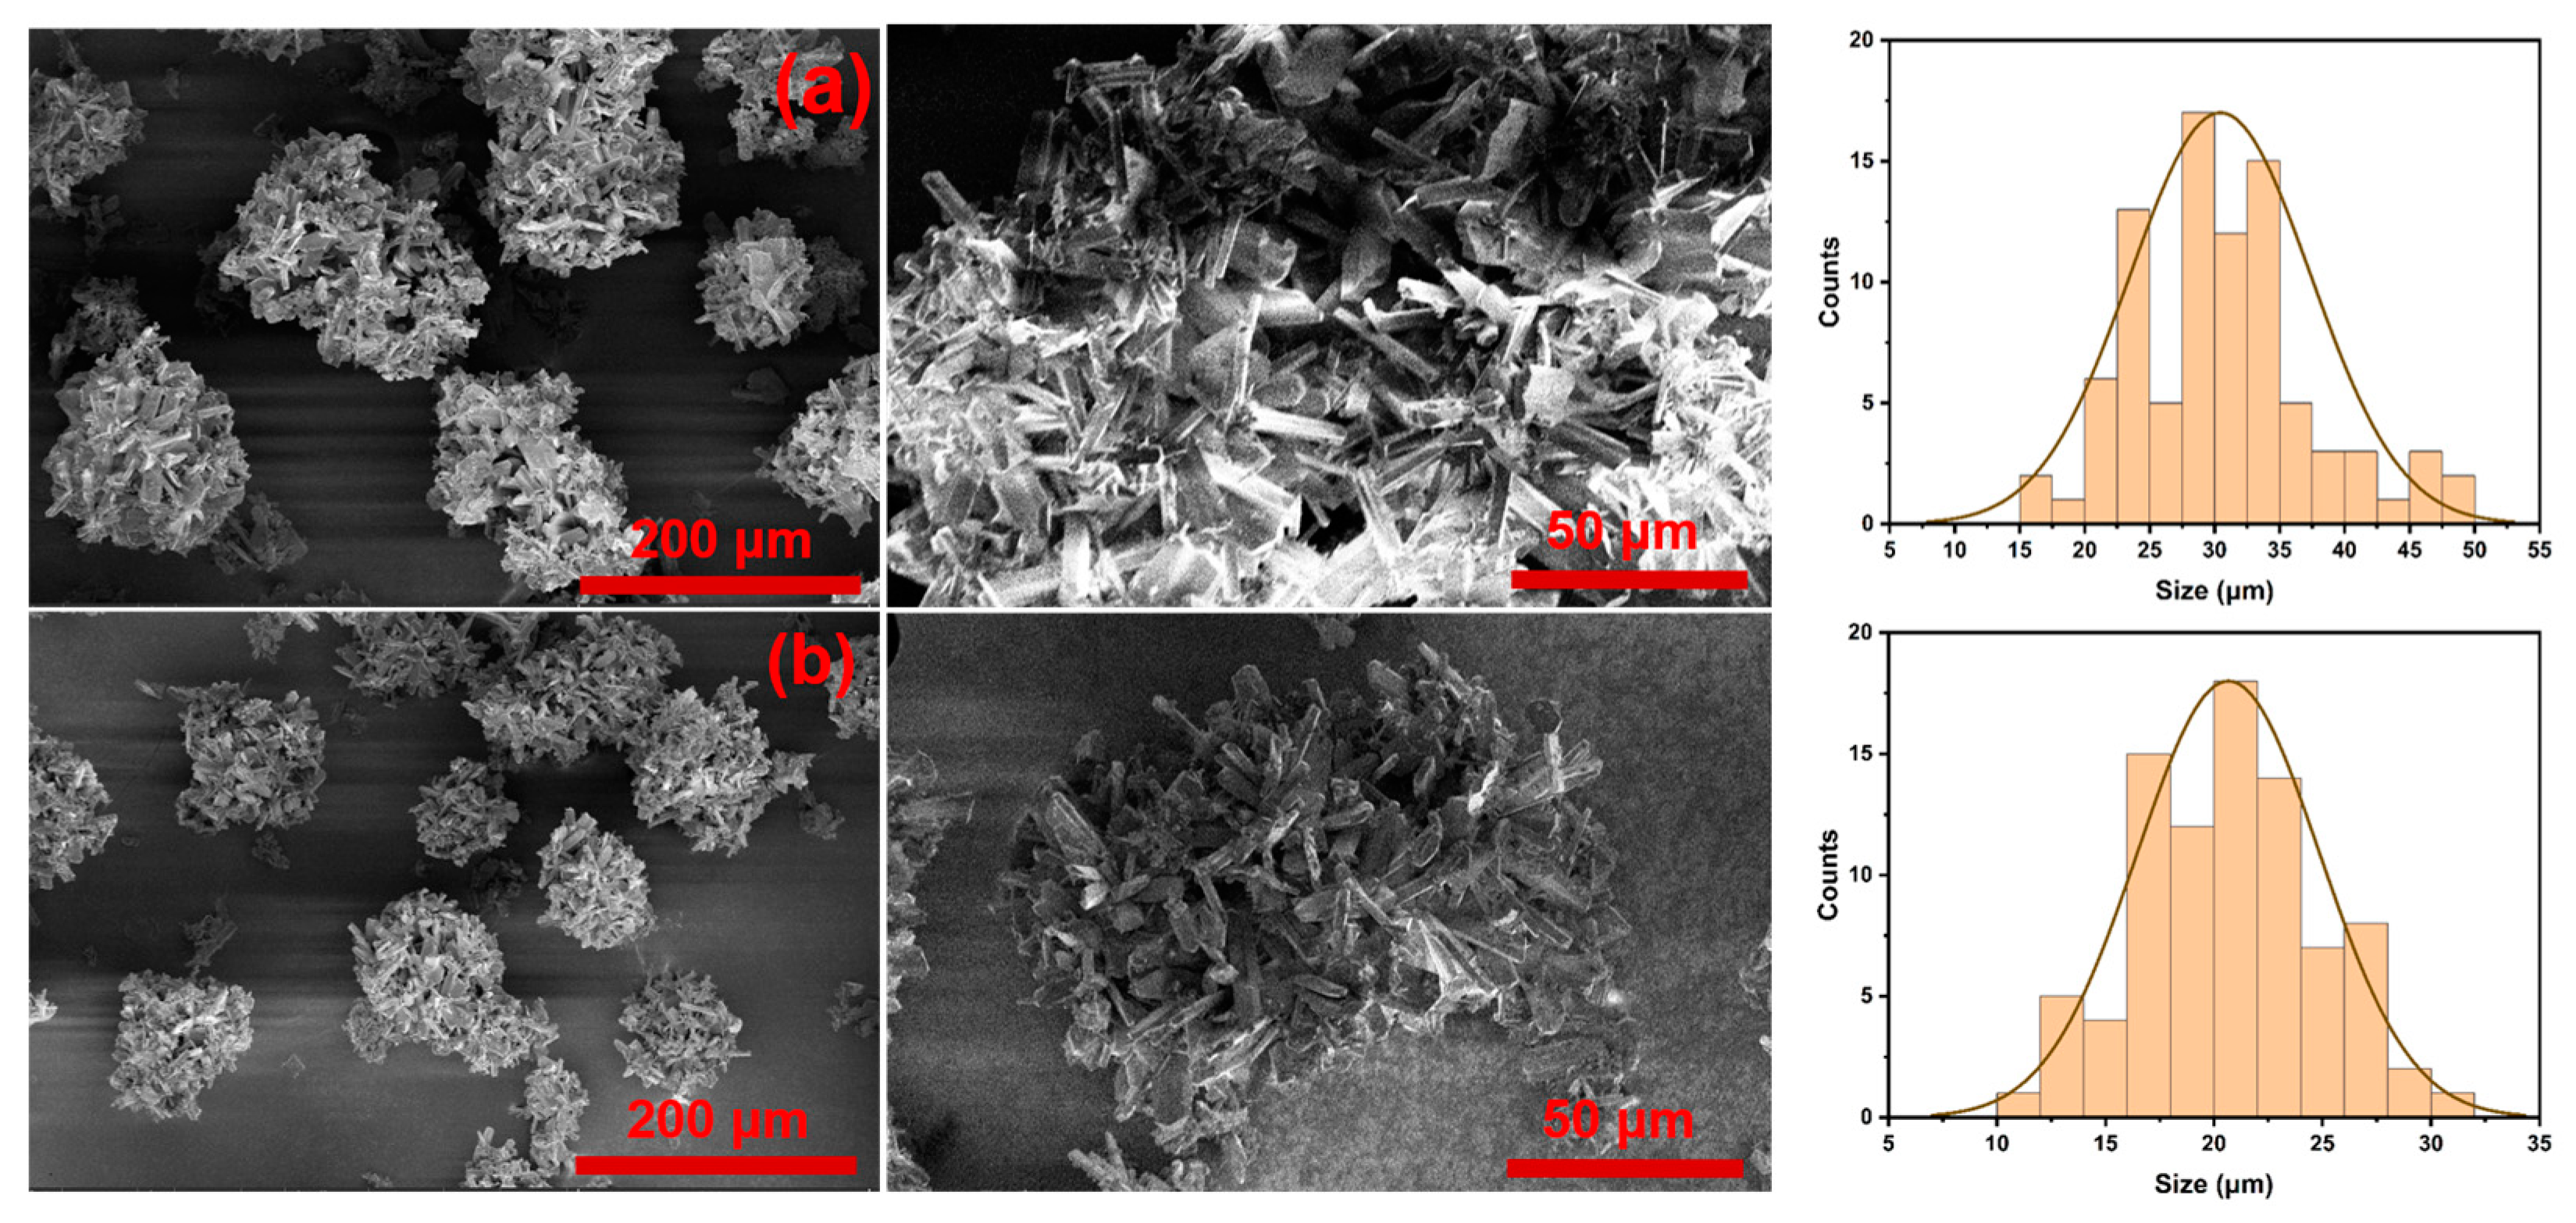
The SEM characterization of the lithium carbonate products and statistical analysis of primary particle sizes are shown in
Figure 16. At lower agitation rates, the sizes of the primary particles and aggregates are larger. This is attributed to the reduced shear forces generated by agitation at lower rates, facilitating more manageable particle growth and aggregation.
3.6. Effect of Impurities
From the content of components in the lithium-ion battery leachate (
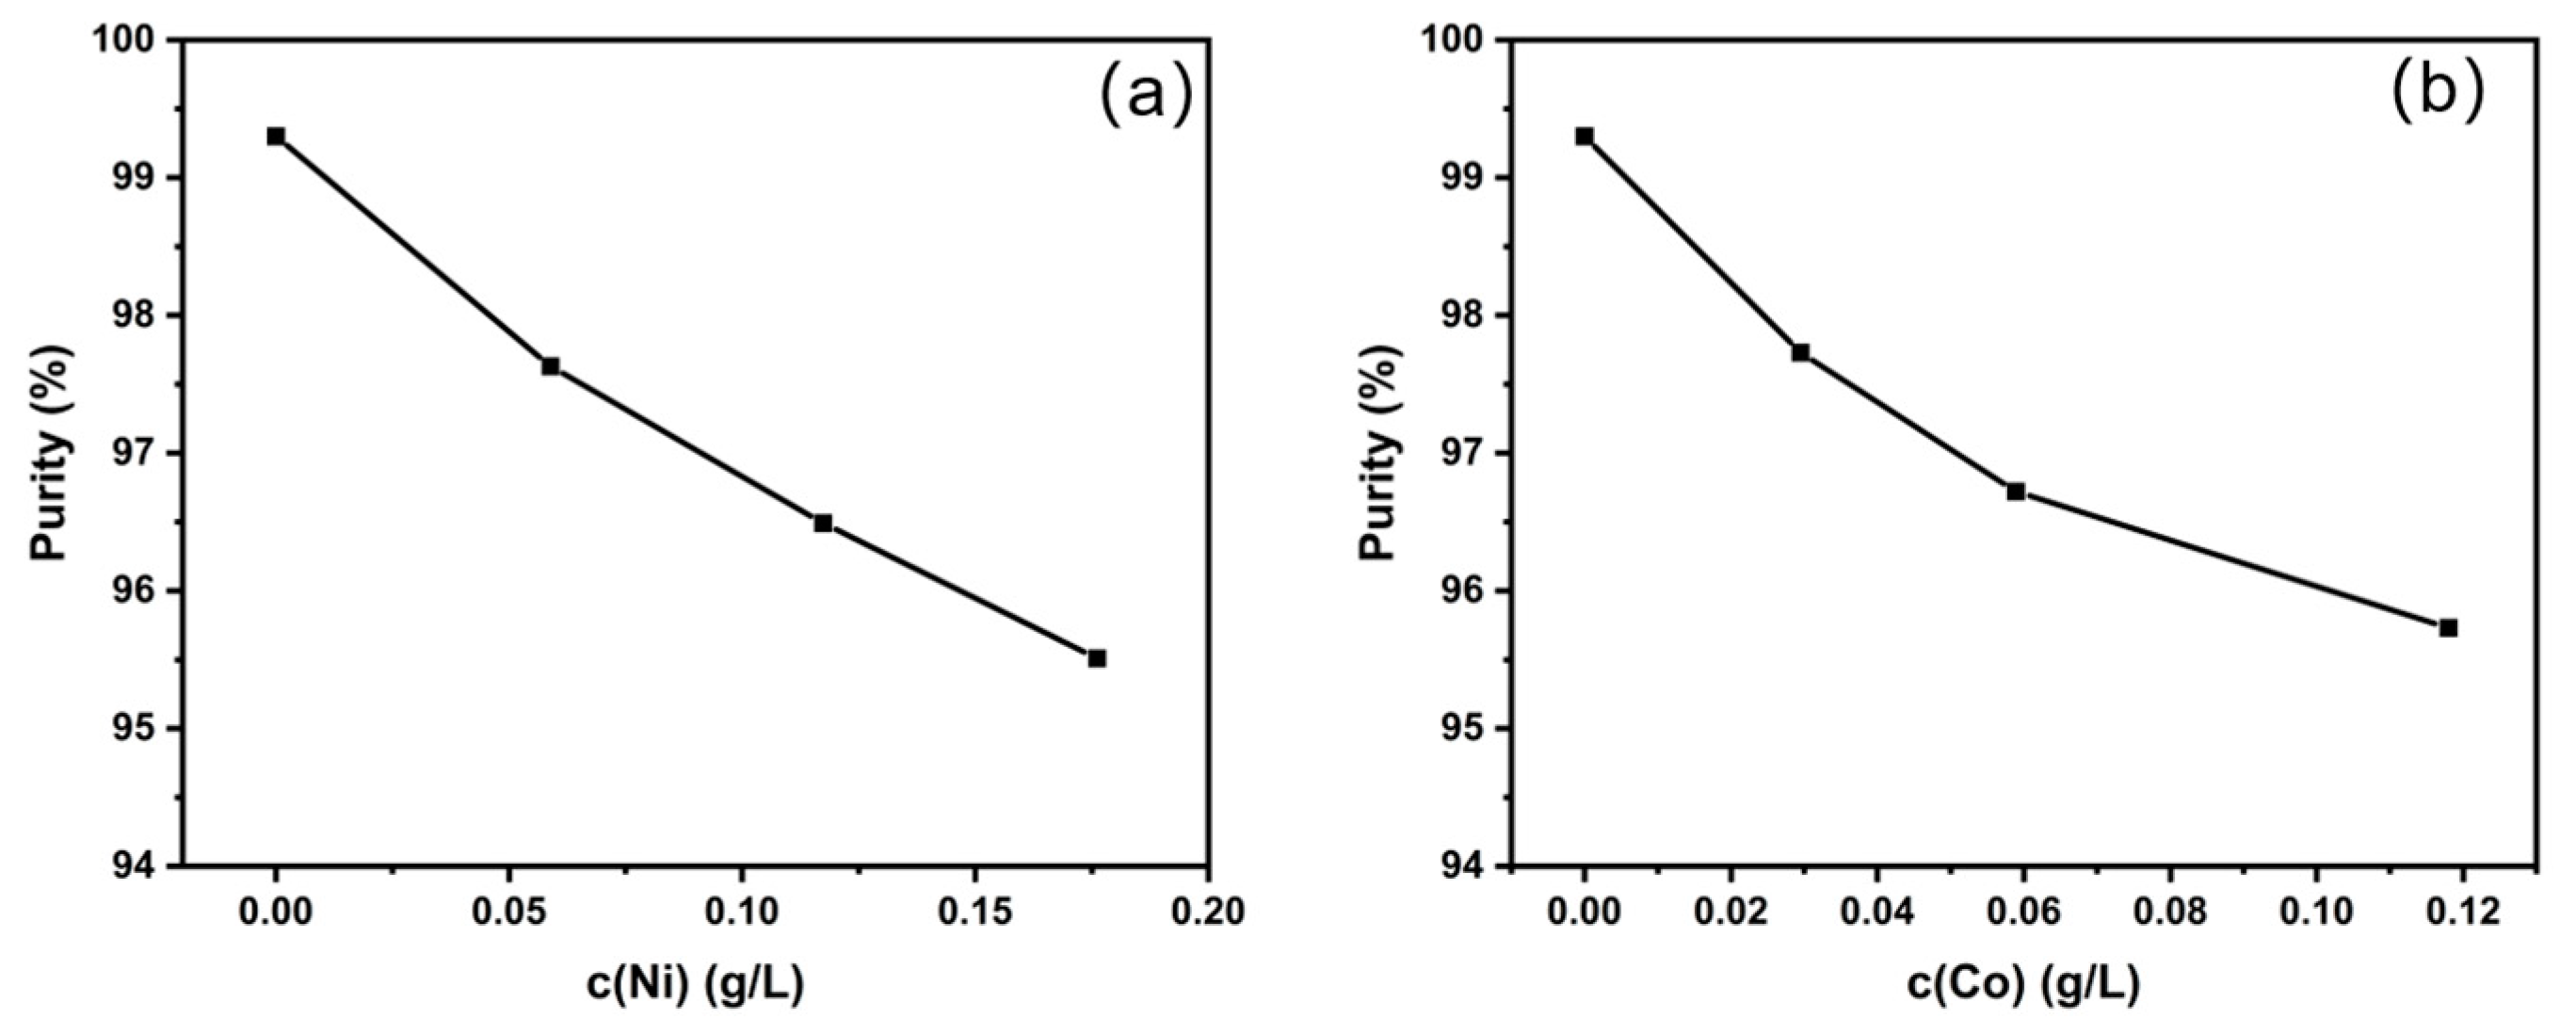
Table S1), it is evident that nickel and cobalt are relatively high impurities. Therefore, it is necessary to explore the influence of nickel and cobalt ions on crystallization. Keeping all other conditions constant (a reaction temperature of 80 °C, a feed rate of 2.5 mL/min, and a feed concentration and bottom liquid concentration of 1.5 mol/L), nickel chloride and cobalt chloride were introduced to investigate the influence of impurities on lithium carbonate crystallization.
Figure 17a,b illustrate that the purity of the lithium carbonate product decreased with the increase in the concentration of impurities. Higher impurity concentrations hinder the reaction of lithium ions with carbonate ions, resulting in a decline in product purity.
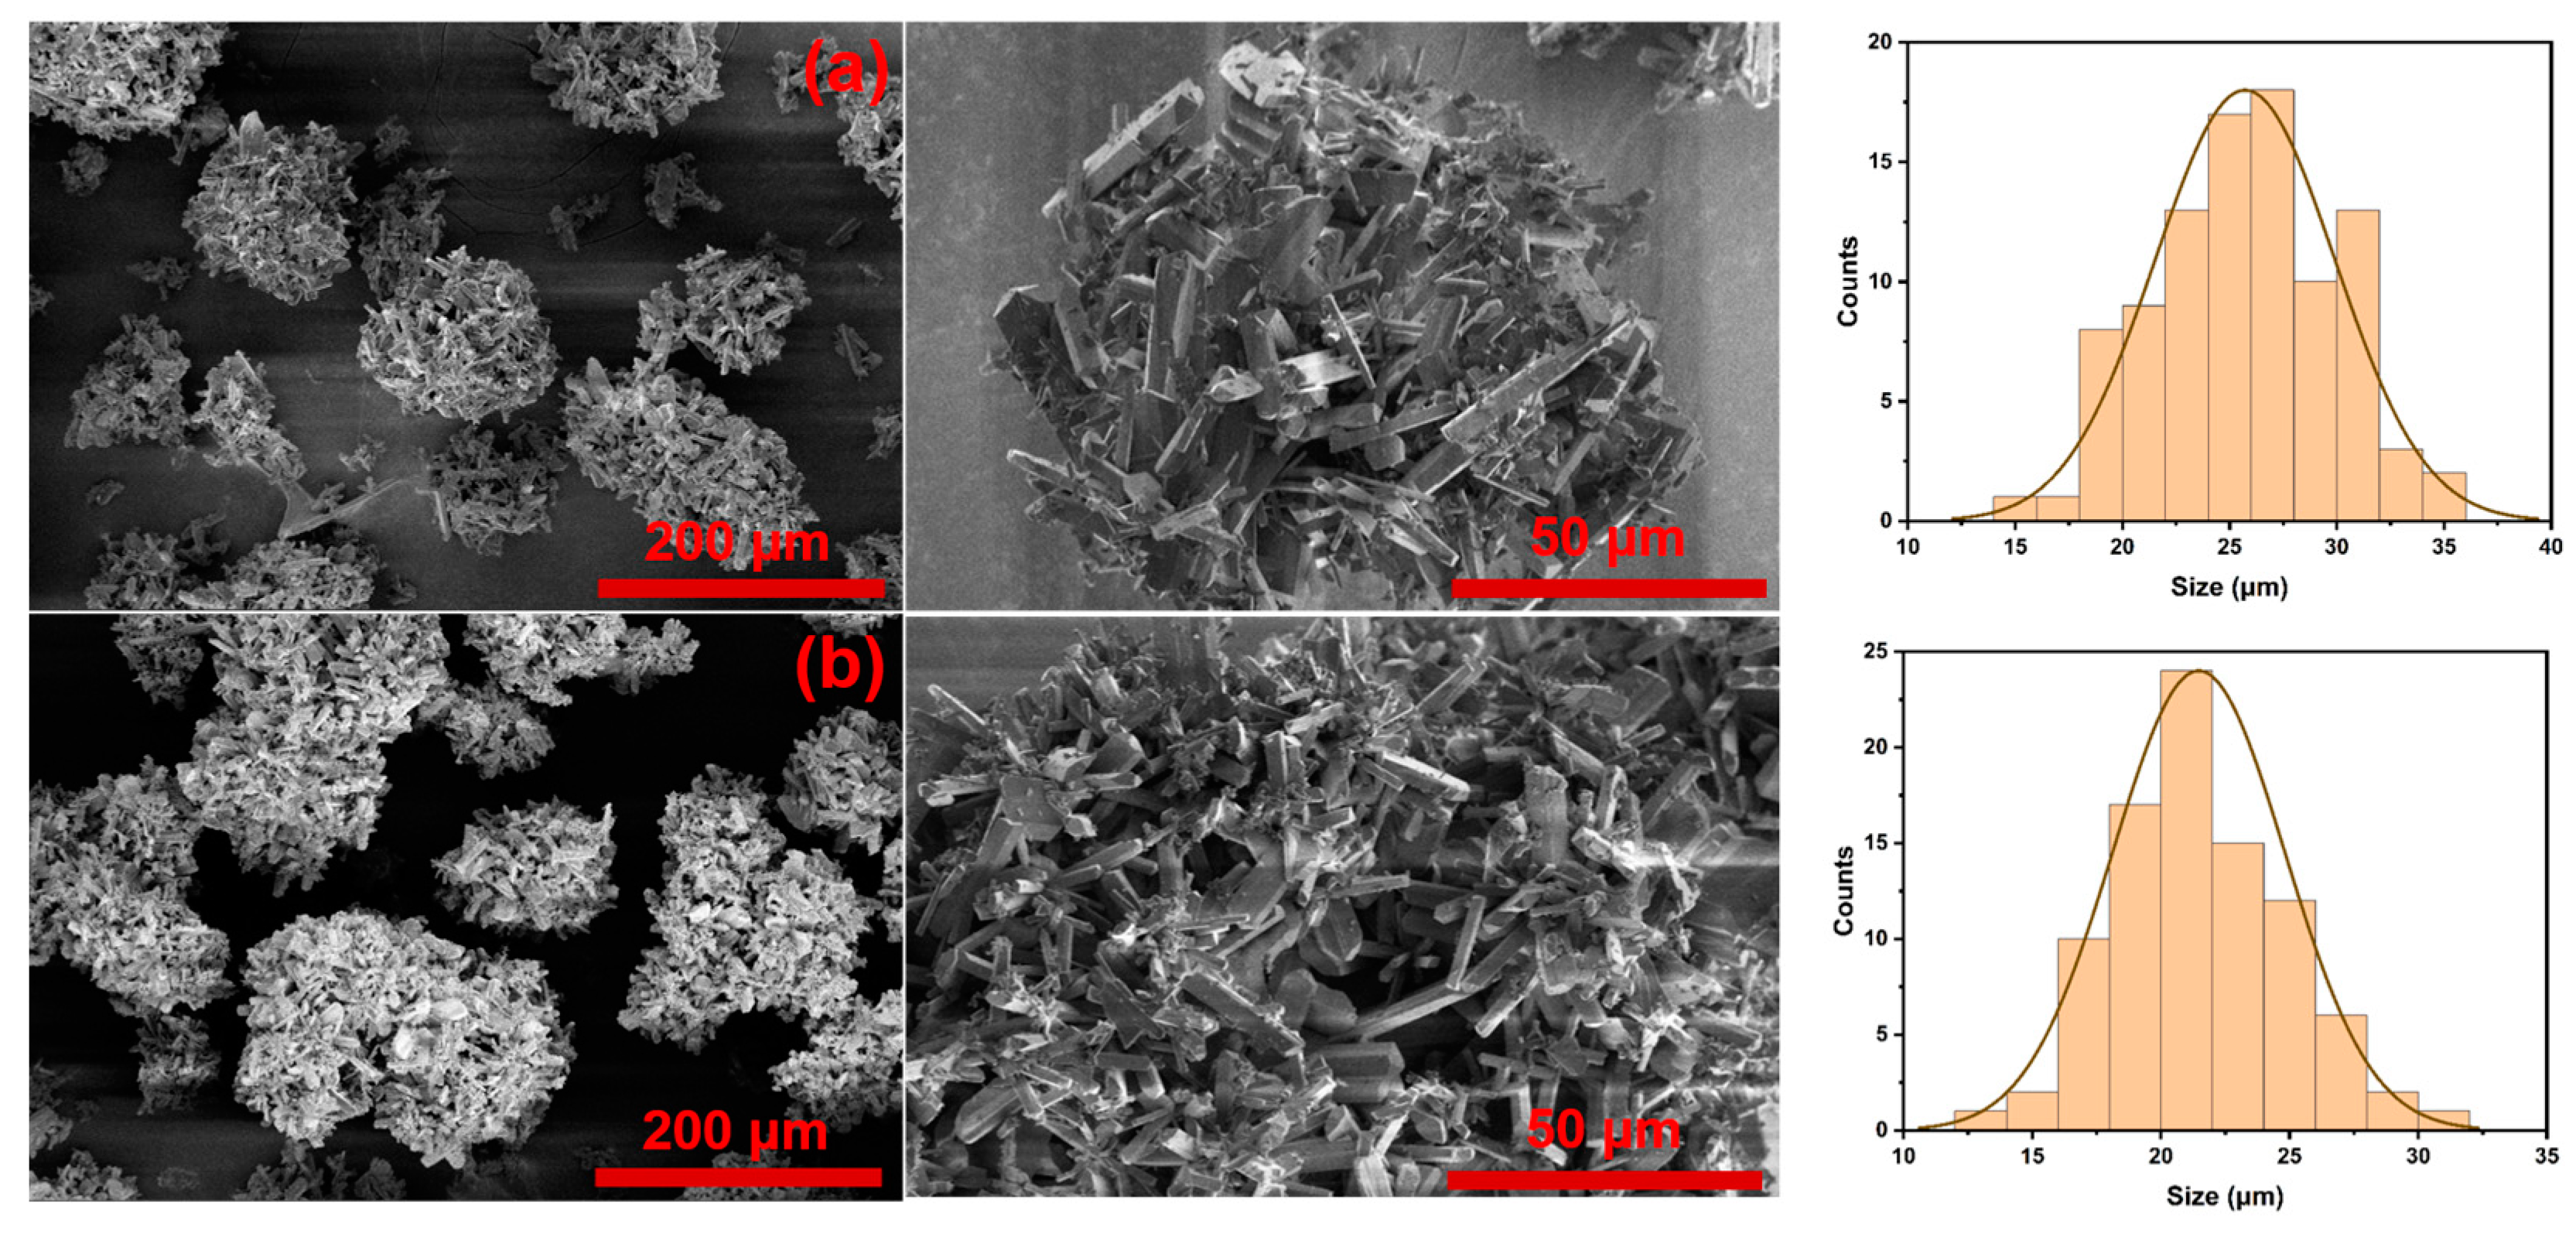
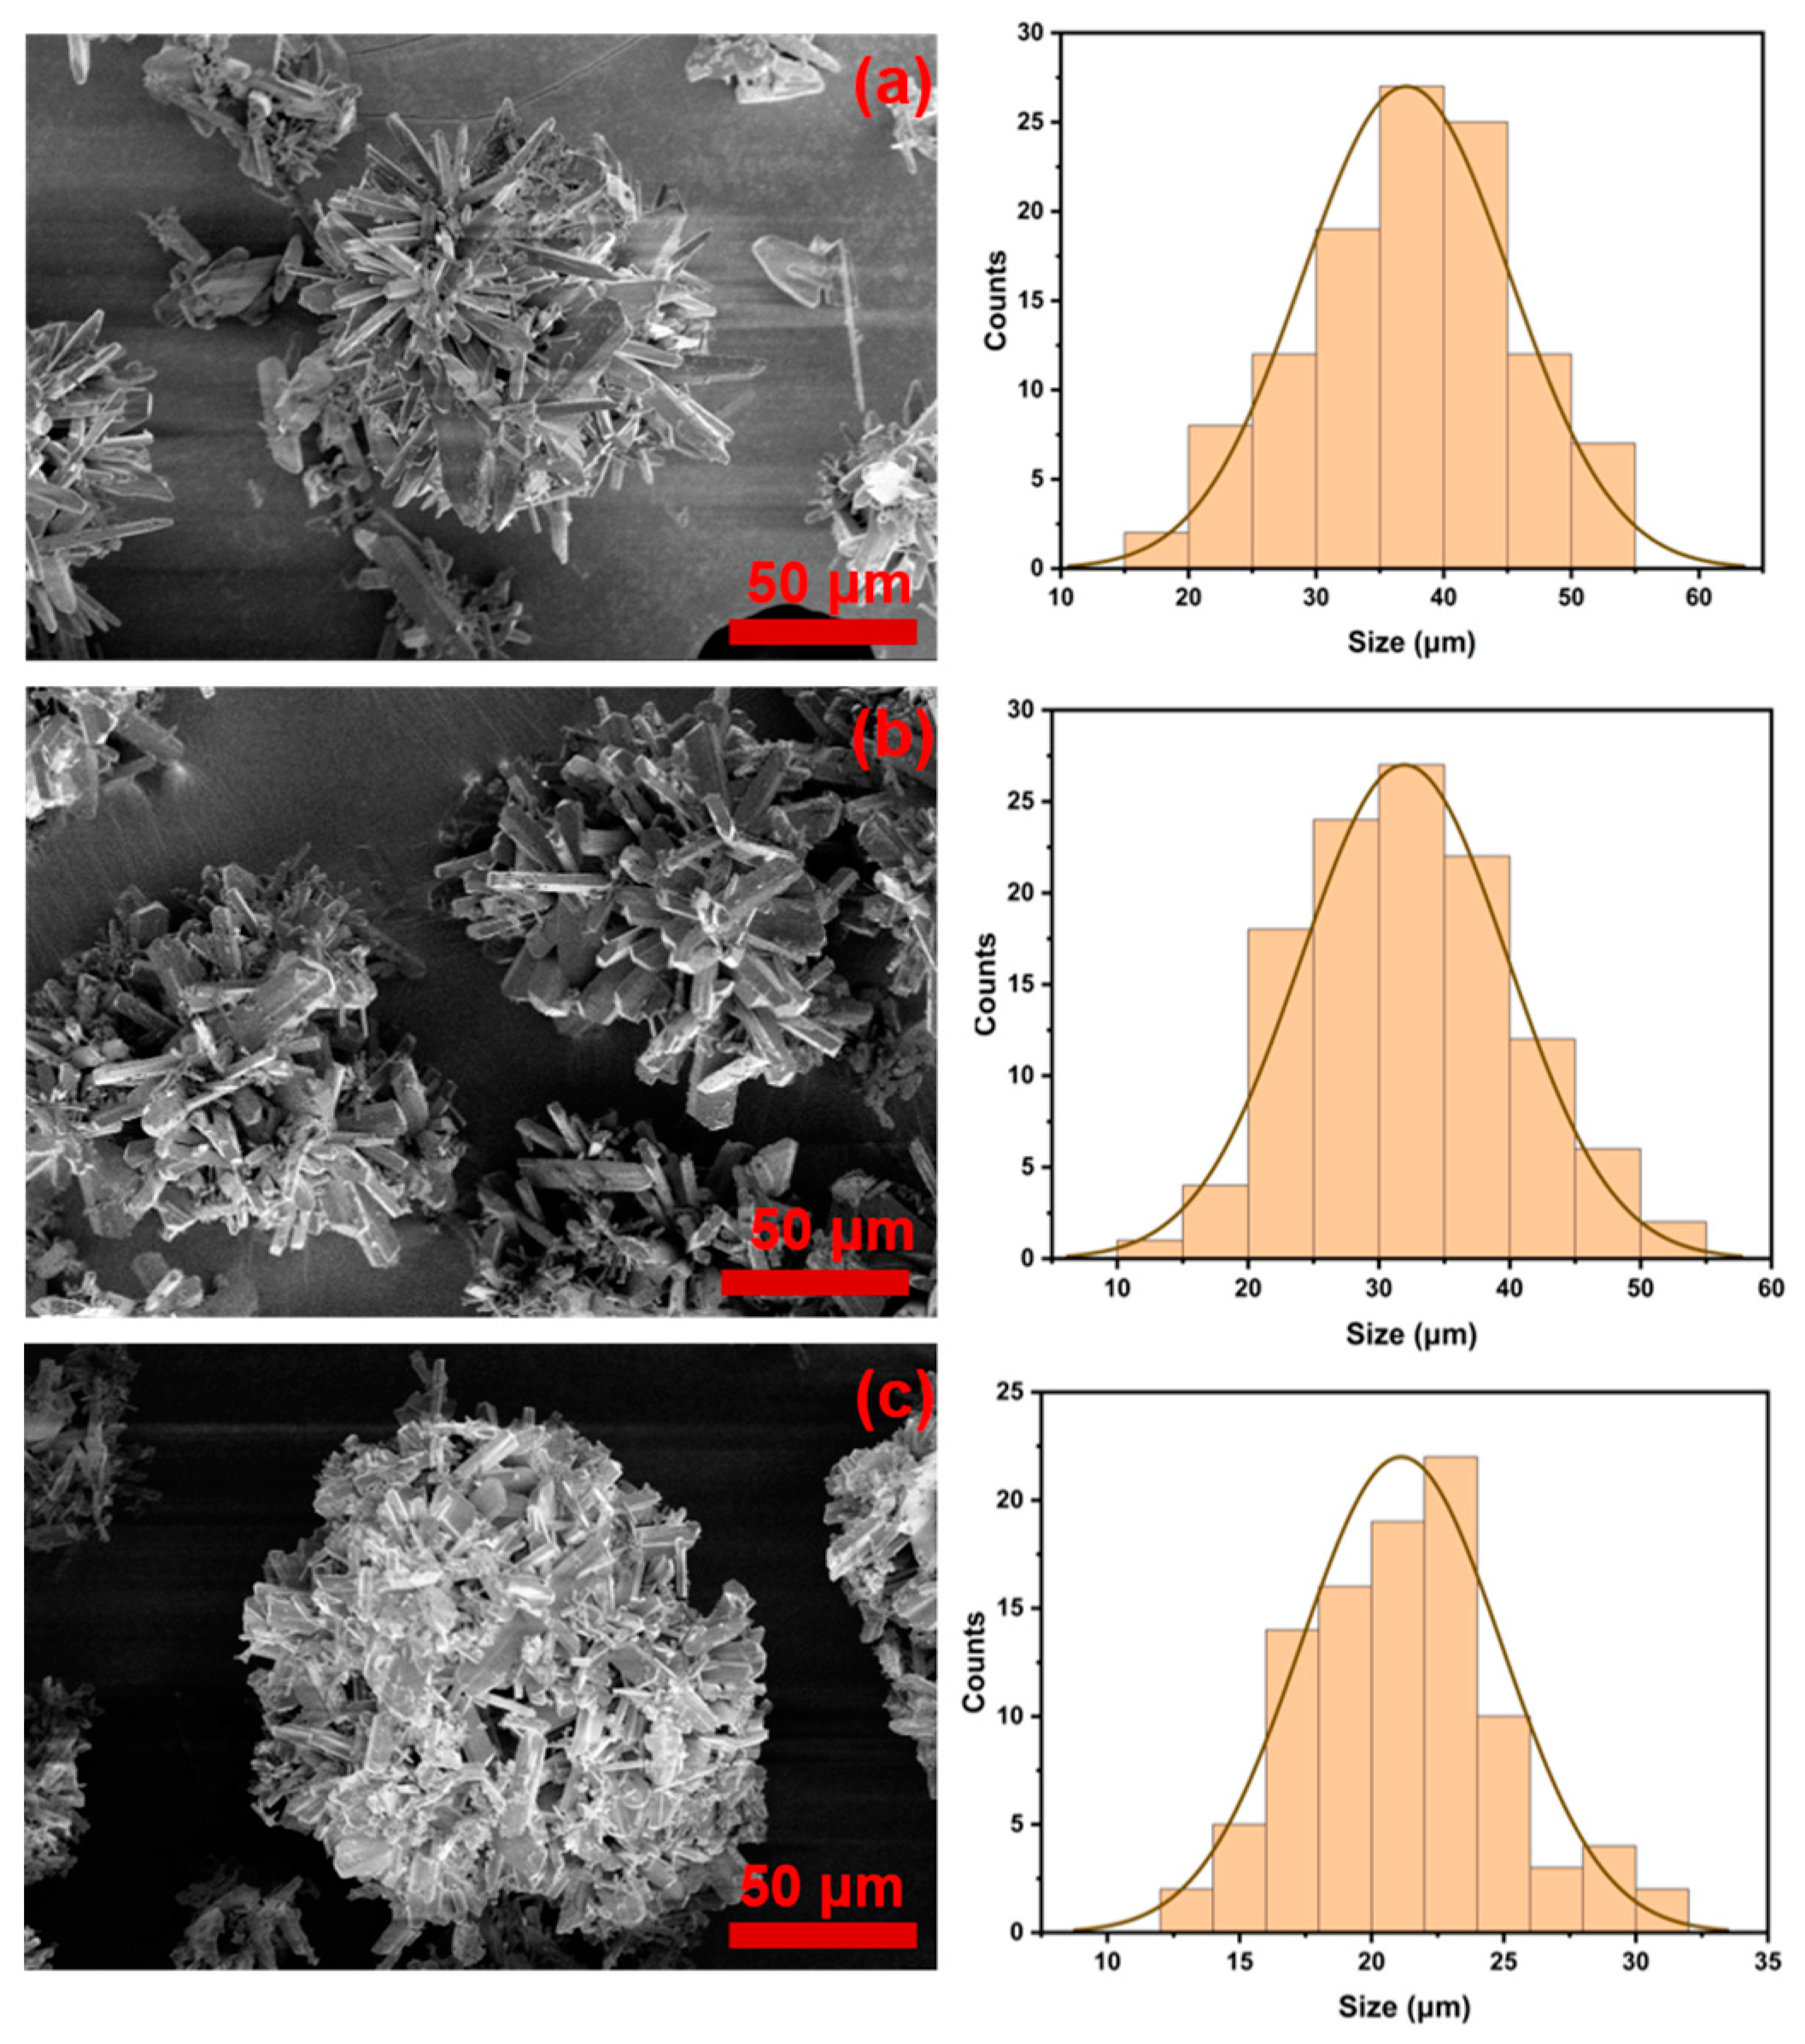
Figure 18 illustrates the SEM images of lithium carbonate under different impurity concentrations, along with the statistical analysis of primary particle sizes. Lithium carbonate crystals obtained after introducing impurities exhibit increased defects and larger primary particle sizes with fewer crystal aggregations. This indicates that impurities promote the primary growth of crystals, resulting in larger primary particles and reduced crystal aggregation, thereby decreasing the particle size of lithium carbonate.
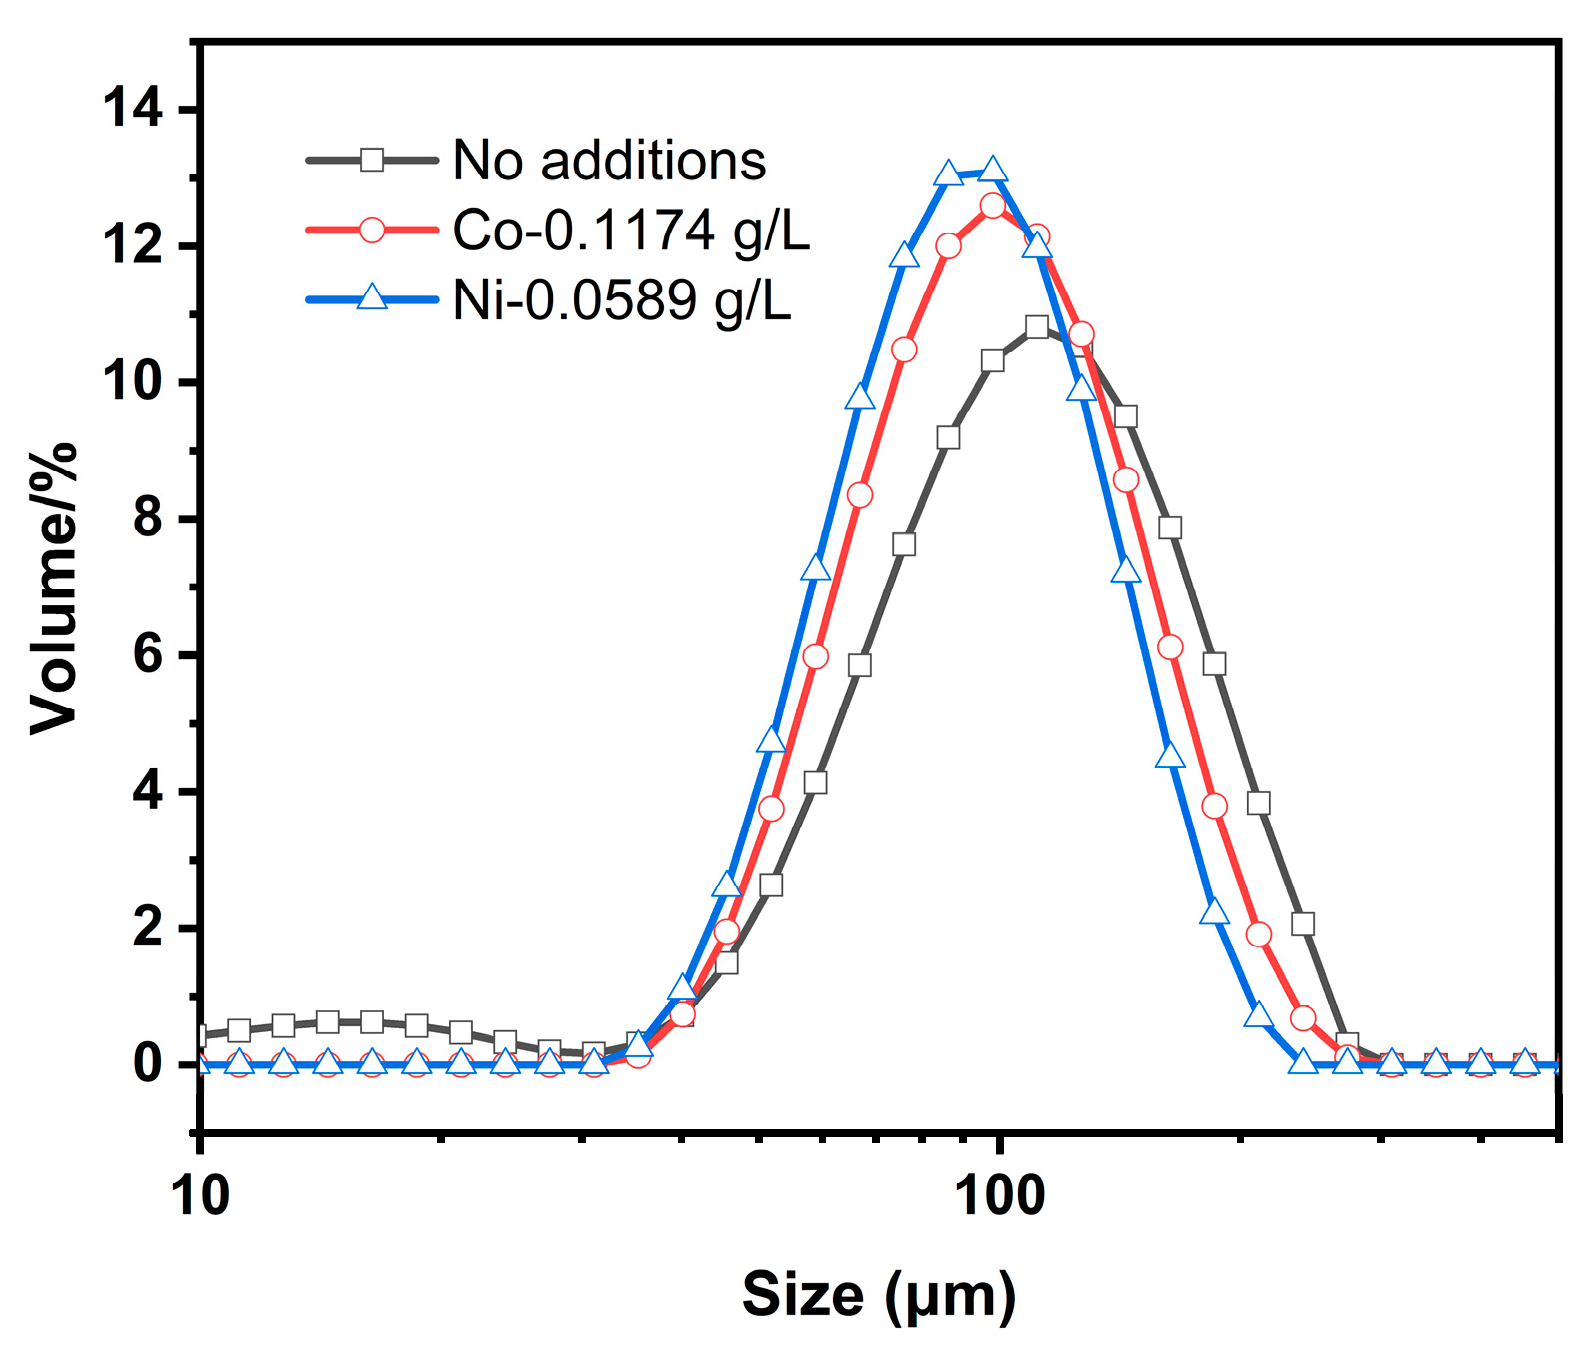
A particle size analysis was conducted using a particle size analyzer, as shown in
Figure 19. The product’s particle size is lower in the presence of impurities, confirming the abovementioned findings.
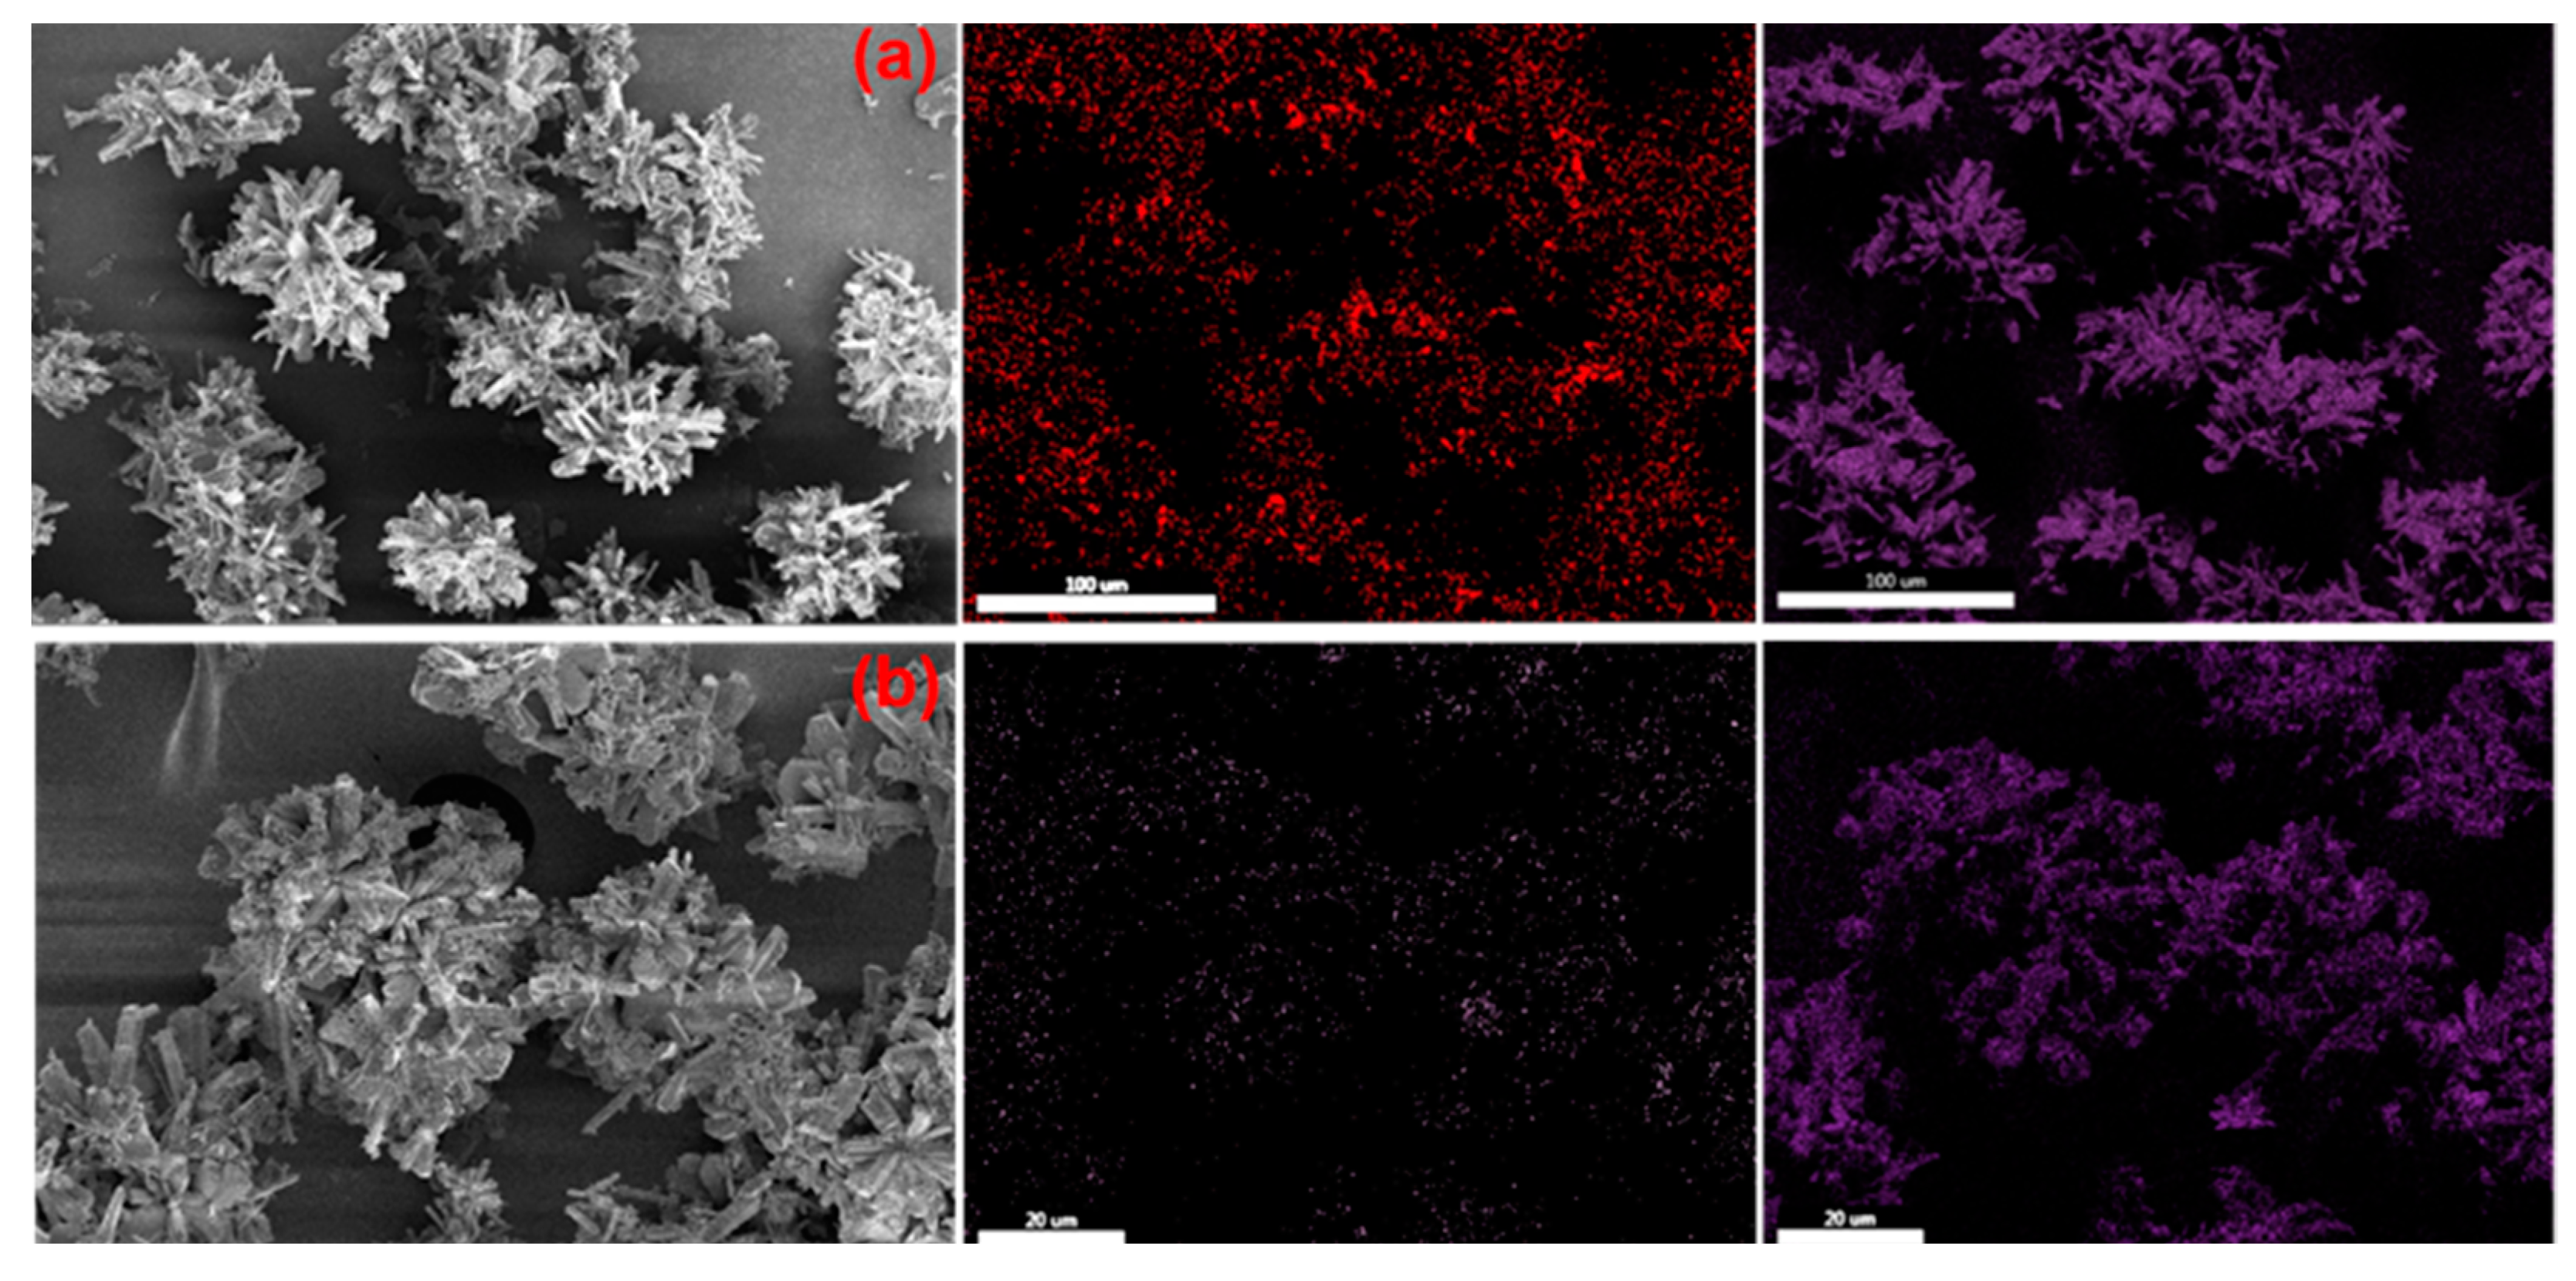
Figure 20 shows the EDS spectrum analysis of relevant elements and depicts the distribution of impurities. The impurities are distributed relatively evenly, confirming the presence of impurities and their incorporation into the crystal lattice [
31,
32]. This suggests that the impurities gradually replace the inherent lattice points of the crystals as lithium carbonate grows, occupying the positions of the original lattice points, thus influencing crystal growth and aggregation.
3.7. Best Process Parameters
By combining the effects of various process parameters on the purity and yield of lithium carbonate, a reaction temperature of 90 °C, a feed liquid concentration of 2.0 mol/L, a feed rate of 2.5 mL/min, a LiCl solution concentration of 2.5 mol/L, and an agitation rate of 400 rpm were set. Ultimately, under these conditions, the lithium carbonate yield obtained can reach 85.72% with a purity of 98.19%.
4. Conclusions
The crystallization of the lithium carbonate product was carried out via the lithium chloride–sodium carbonate reaction method. The effects of different process parameters and impurities on lithium carbonate precipitation were investigated. The results indicate that the obtained lithium carbonate consisted of aggregates of primary particles.
The reaction temperature, feed concentration, and LiCl solution concentration significantly impact the yield and purity of lithium carbonate. Under the conditions of a reaction temperature of 90 °C, a feed concentration of 2.0 mol/L, a LiCl solution concentration of 2.5 mol/L, a feed rate of 2.5 mL/min, and a stirring speed of 400 rpm, lithium carbonate was synthesized with a yield of 85.72% and a purity of 98.19%. The particle size analysis revealed that rising temperature, feed concentration, and feed rate promote the aggregation of primary particles and increase the particle size. The influence of the agitation rate and LiCl solution concentration on the particle size of lithium carbonate, however, showed an opposite trend. At the agitation rate of 200 rpm, the particle size of lithium carbonate reached 168.694 μm. This was attributed to the weak shear force generated by slow stirring. When the LiCl solution concentration increased to 2.5 mol/L, the particle size of lithium carbonate was only 97.535 μm, which was associated with supersaturation.
The effects of nickel and cobalt ion impurities on the lithium carbonate morphology were explored. Even low concentrations of nickel and cobalt ions could influence the formation of lithium carbonate and crystal aggregation. In the presence of nickel and cobalt, the primary particle size of lithium carbonate increased, while the aggregation particle size decreased. The EDS analysis showed that impurities entering the lattice impacted the morphology of lithium carbonate and crystal growth. Therefore, while recycling spent lithium-ion batteries, it is crucial to thoroughly separate various metallic elements and remove as many impurities as possible.


