Article

Characterization and Quantitative Assessment of Shale Fracture Characteristics and Fracability Based on a Three-Dimensional Digital Core

1
School of Petroleum Engineering, Xi’an Shiyou University, Xi’an 710065, China
2
Xi’an Key Laboratory of Tight Oil (Shale Oil) Development, Xi’an Shiyou University, Xi’an 710065, China
3
School of Earth Science and Engineering, Xi’an Shiyou University, Xi’an 710065, China
4
Exploration Department of PetroChina Changqing Oilfield Company, Xi’an 710018, China
5
No. 8 Oil Recovery Plant of PetroChina Changqing Oilfield Company, Xi’an 710201, China
6
Department of Chemical and Petroleum Engineering, University of Calgary, Calgary, AB T2N 1N4, Canada
*
Author to whom correspondence should be addressed.
Processes 2024, 12(4), 755; https://doi.org/10.3390/pr12040755
Submission received: 5 March 2024 / Revised: 29 March 2024 / Accepted: 2 April 2024 / Published: 9 April 2024
(This article belongs to the Section Energy Systems)

Abstract

:
At present, assessment techniques for the fracability of shale reservoirs, which rely on the formation of an effective fracture network, are scarce. Hence, in order to assess the fracability, it is critical to establish a quantitative correlation between the pattern of fracture distribution after fracture and fracability. The present investigation utilizes three-dimensional digital core technology and triaxial compression experiments to simulate the fracturing process in typical domestic shale reservoir cores. In addition to utilizing the maximum ball algorithm to extract fracture images, a number of other techniques are employed to compute the spatial quantitative parameters of the fractures, including least squares fitting, image tracking algorithms, and three-dimensional image topology algorithms. The introduction of the notion of three-dimensional fracture complexity serves to delineate the degree of successful fracture network formation subsequent to fracturing. A quantitative fracability characterization model is developed by integrating the constraints of fracture network formation potential and fragmentation potential. The results of this study show that the quantitative characterization of the characteristic parameters of cracks can be achieved by establishing a method for extracting crack information as well as parameters after core compression and completing the construction of a three-dimensional complexity characterization model. Meanwhile, the three-dimensional post-compression fracture image validation shows that the core fracturability index can better reflect the actual fracturing situation, which is in line with the microseismic monitoring results, and significantly improves the accuracy of fracturability characterization, which is an important guideline for the fracturing design of shale gas reservoirs.

1. Introduction

As a result of China’s progressive development and exploration of unconventional gas and oil, shale reservoirs have emerged as a significant domain in the global energy landscape [1,2]. In addition to their tightness, permeability, and porosity, these reservoirs feature intricate enrichment and structural conditions. Traditional extraction techniques fail to attain the desired rates of recovery, thus justifying the adoption of volumetric hydraulic fracturing to establish a vast interconnected system of fractures that facilitates efficient gas and oil flow channels [3,4].
Prior research related to the fracability of shale gas and oil reservoirs primarily utilized brittleness assessment methods. Rick Rickman introduced a technique for computing the brittleness index by employing rock mechanics parameters, whereas Han Wenzhong and Dou Yu developed mineral composition-based models and evaluation formulas for shale brittleness. Nevertheless, the theoretical underpinnings and modes of expression of these approaches vary, which introduces imprecisions into the assessment of fracability exclusively through brittleness. In addition, evaluation of fracture development in reservoirs is difficult and frequently restricted to qualitative descriptions via imaging well logging and thin section casting. Huang Yuyue et al. implemented a comprehensive identification method for shale fractures based on conventional, imaging, and core well logging, while Chen Hongzhu et al. combined seismic, well logging, drilling, and core data to identify fractures. Xuan et al. only considered the variability of the internal texture of the rock to study the effect of different stress states and temperature factors on the brittleness of the rock when investigating the fracture properties. These methods, however, are incapable of functioning as quantitative parameters or establishing a correlation between the distribution patterns of post-fracturing fractures and fracability; they can only function as verification indicators for fracability evaluation [5,6,7,8].
Fragability in relation to three-dimensional digital cores has been the subject of some investigation. Before and after fracturing, Fan Yiren et al. characterized changes in reservoir fractures using the primary fracture development index (F1) and mechanical characteristic index (F2). Nevertheless, this approach solely takes into consideration the proliferation of fractures subsequent to the fracture and fails to incorporate the spatial distribution properties of fractures in three-dimensional space. Furthermore, a comprehensive elucidation of the mechanisms that influence fracability is absent. In order to tackle these concerns, the present study employed triaxial compression fracturing experiments to simulate the process of core fracturing using representative domestic shale reservoir cores. The fractures within the core are extracted using CT-scanned three-dimensional digital core images. A comparative analysis of fracture distribution characteristics is then performed, comparing the conditions before and after fracturing. Parameters including fracture count, fracture surface geometry, and fracture porosity are computed quantitatively through the utilization of image tracking algorithms, three-dimensional image topology algorithms, and least squares fitting. In summary, this study introduces the notion of three-dimensional fracture complexity as a means of quantitatively assessing the degree of successful fracture network development subsequent to fracture. The fracability is quantitatively characterized using the potential for fracture network formation and rock fragmentation [9].

2. Extraction of Fractures Based on Three-Dimensional Digital Core of Shale

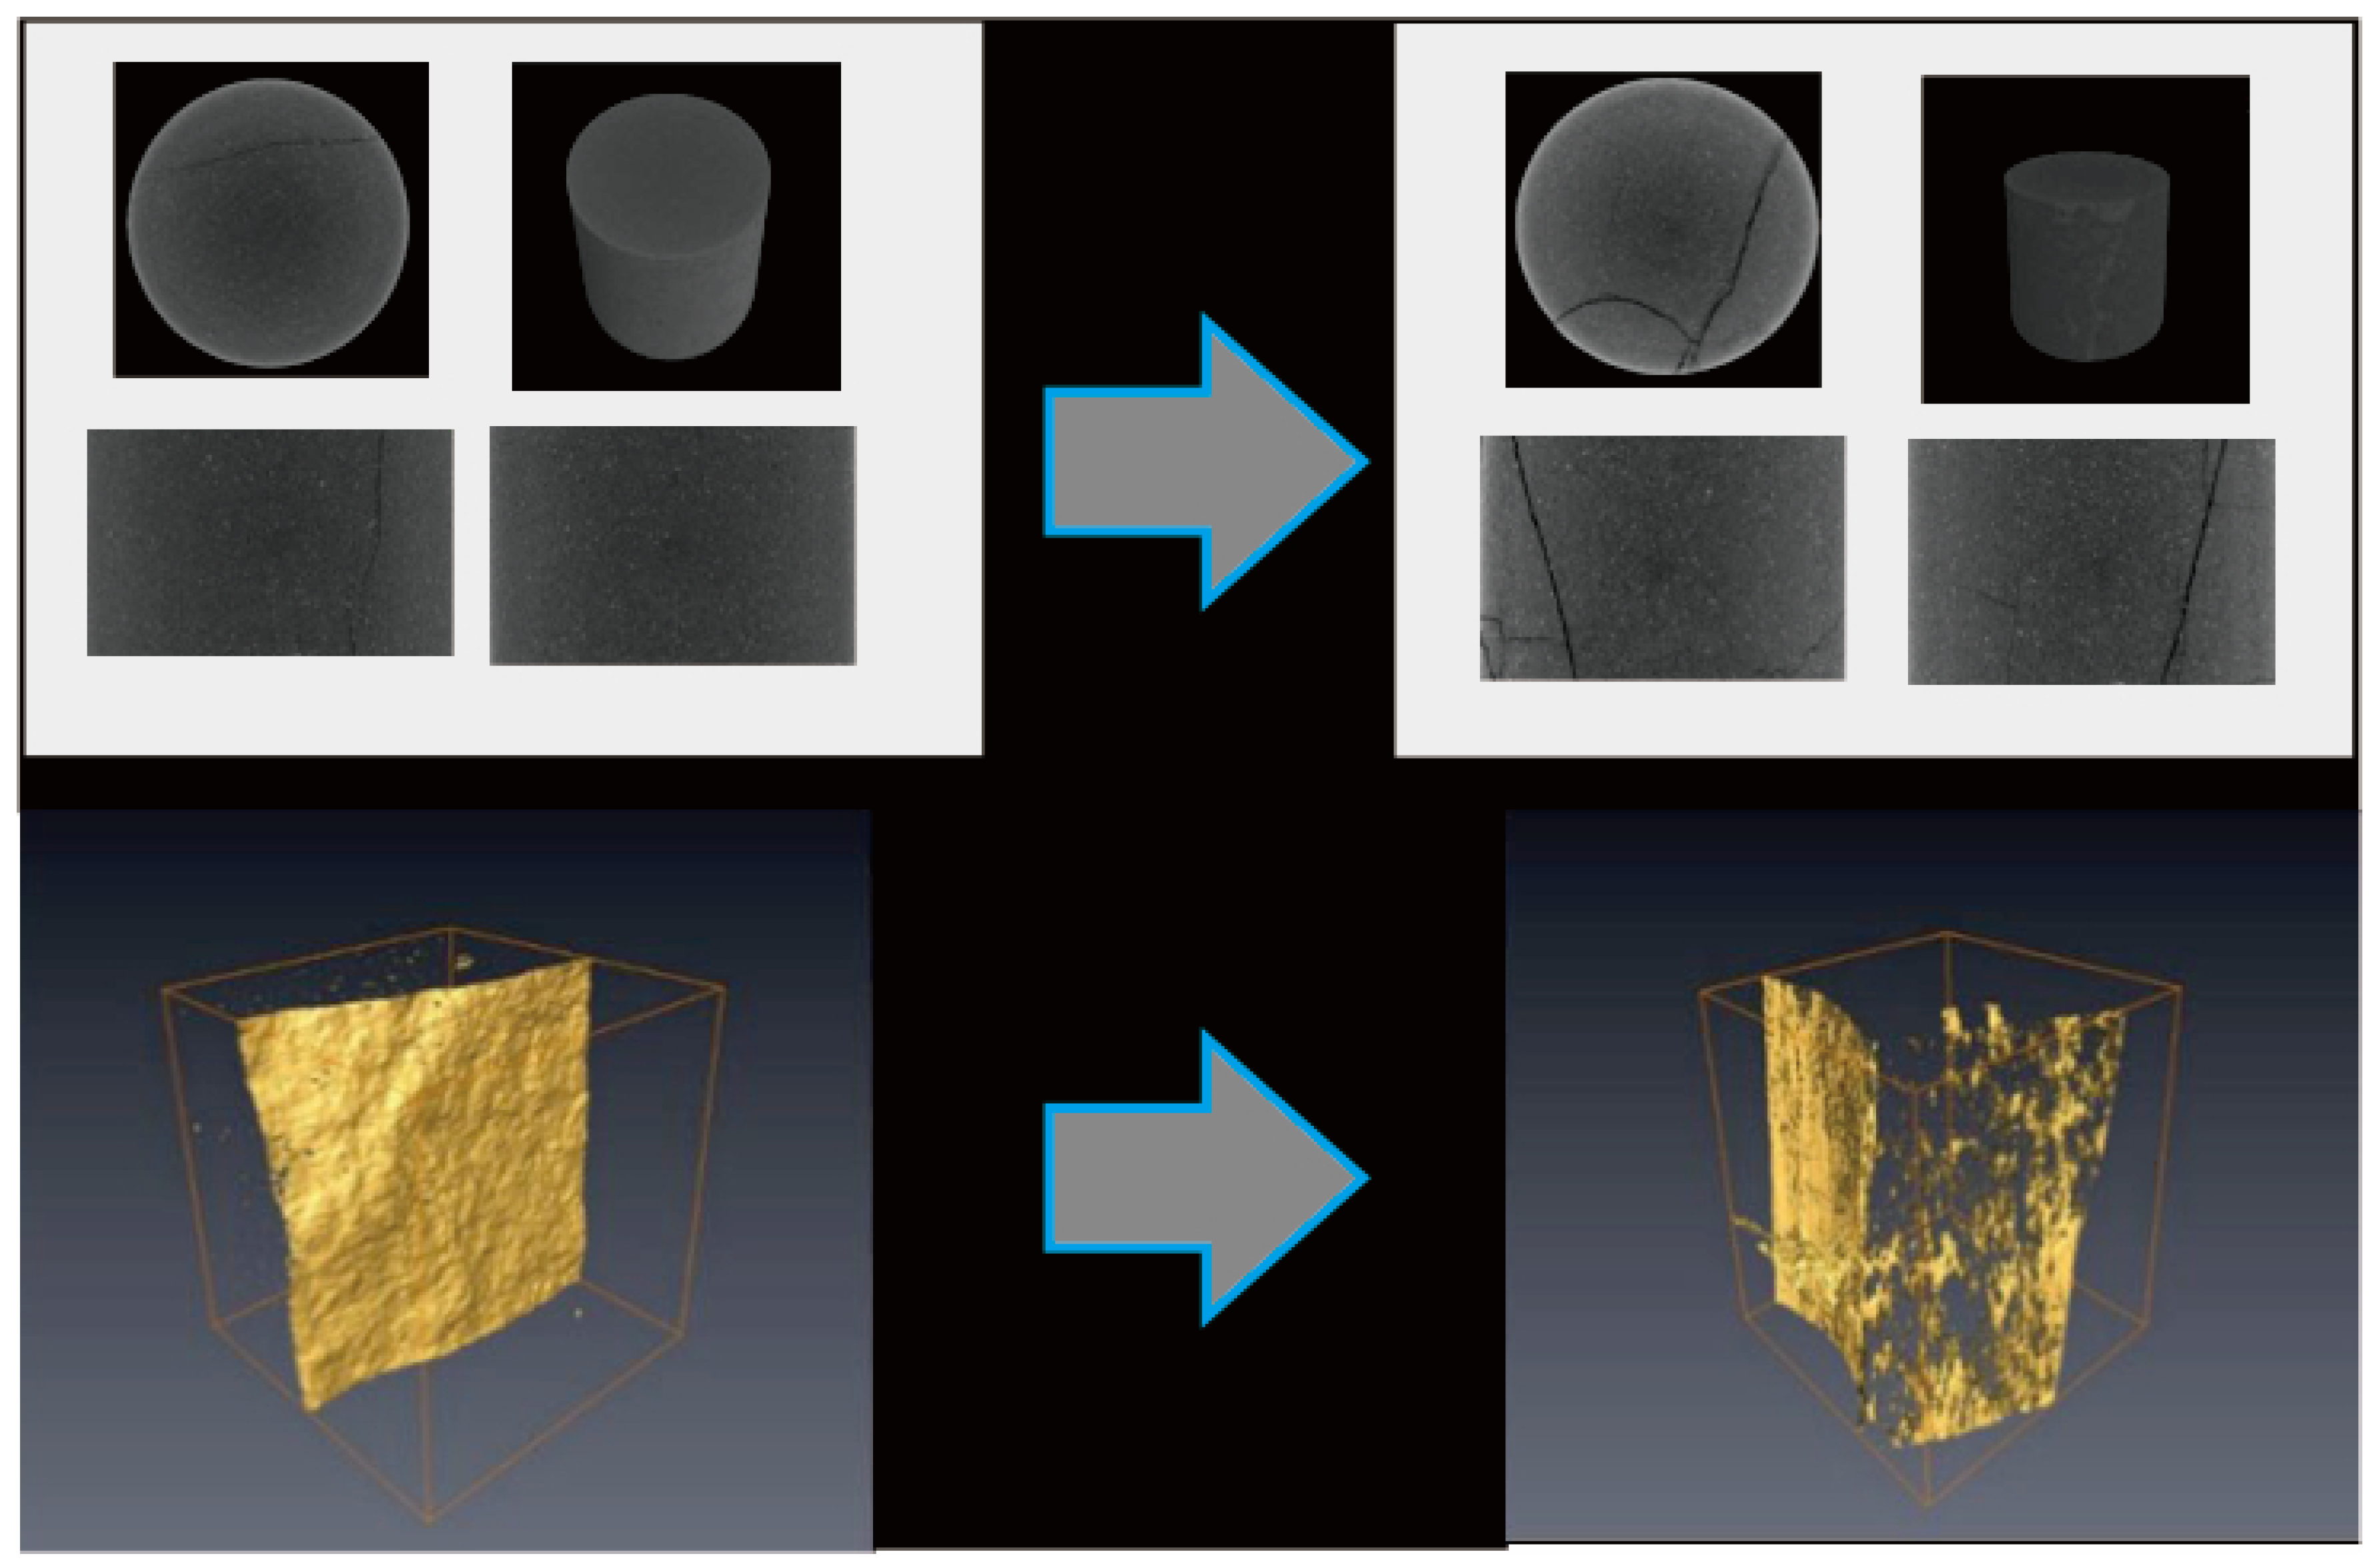
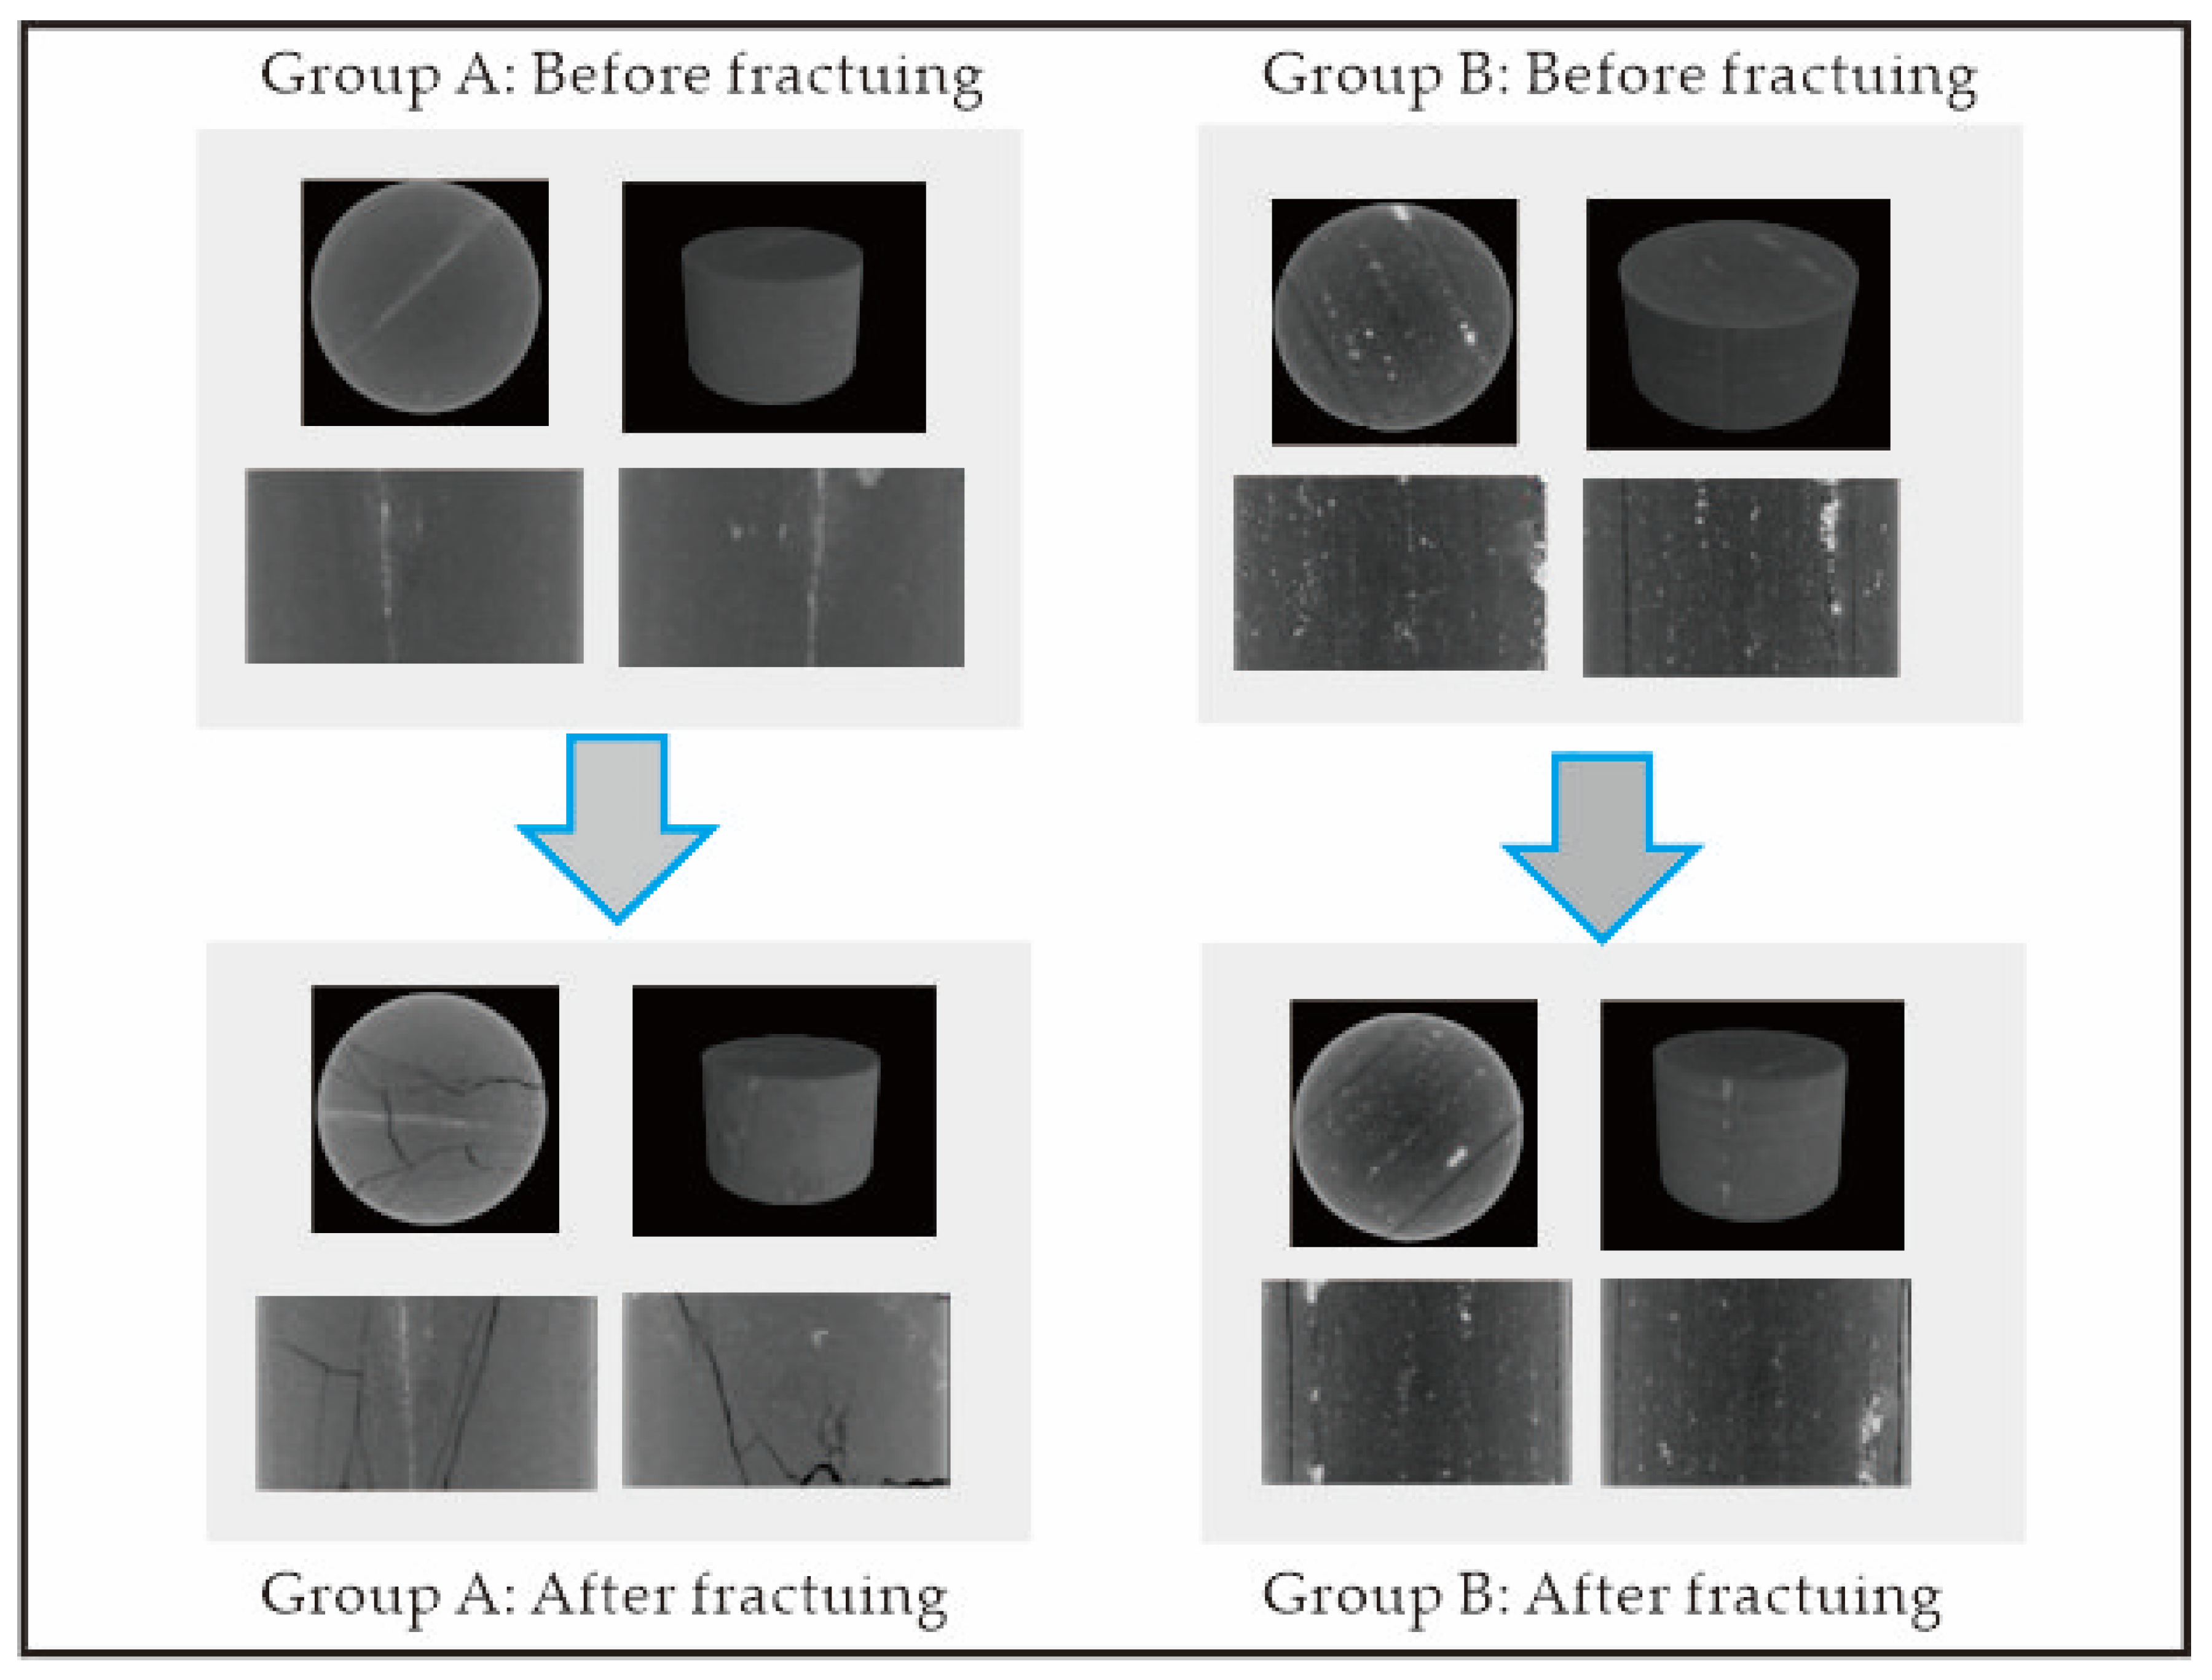
2.1. Construction of Pre- and Post-Fracturing Three-Dimensional Digital Cores Using CT Scanning

An exhaustive assortment of representative reservoir cores from domestic shale formations is examined, taking into account their various sources, origins, structural attributes, and compositions. For example, (i) different orogeny, including the Ordos Basin Chang 7 terrestrial phase and the Sichuan Basin Longmaxi Formation marine phase; (ii) different tectonic features, including homogeneous massive stratification, horizontal stratification, and the development of microfractures; (iii) different compositional features, including compositional monotypes and complexes; and (iv) different source features, including natural cores and human-made cores. Initial steps involve the utilization of wire cutting techniques to procure diverse core samples. Subsequently, these samples undergo oil and salt washing procedures in order to eliminate salt present in the core pore spaces. Suitable scanning resolutions are chosen based on research requirements. Subsequently, the shale cores in cylindrical plug form are scanned using X-ray CT technique [10,11,12,13] (scanning resolutions ranging from 1 to 50 μm/voxel, determined based on specific core dimensions).
By superimposing the two-dimensional images with the reconstructed algorithm, three-dimensional grayscale images are generated; these are subsequently segmented into three-dimensional arrays. Subsequently, triaxial compression fracturing experiments are conducted using the AutoLab 1500 system (New England Research, Inc., Hartford, VT, USA). The maximum confining pressure is set at 68 MPa (10,000 psi), the maximum pore pressure at 68 MPa (10,000 psi), and the maximum temperature at 150 °C, simulating the reservoir temperature and confining pressure conditions. Shale core samples undergo uniform fracturing at a constant rate of deformation. Following the simulated fracturing experiments, CT scan images of the shale core samples are obtained using the identical method and scanning resolutions [14,15,16,17]. The method flowchart is as follows (Figure 1):

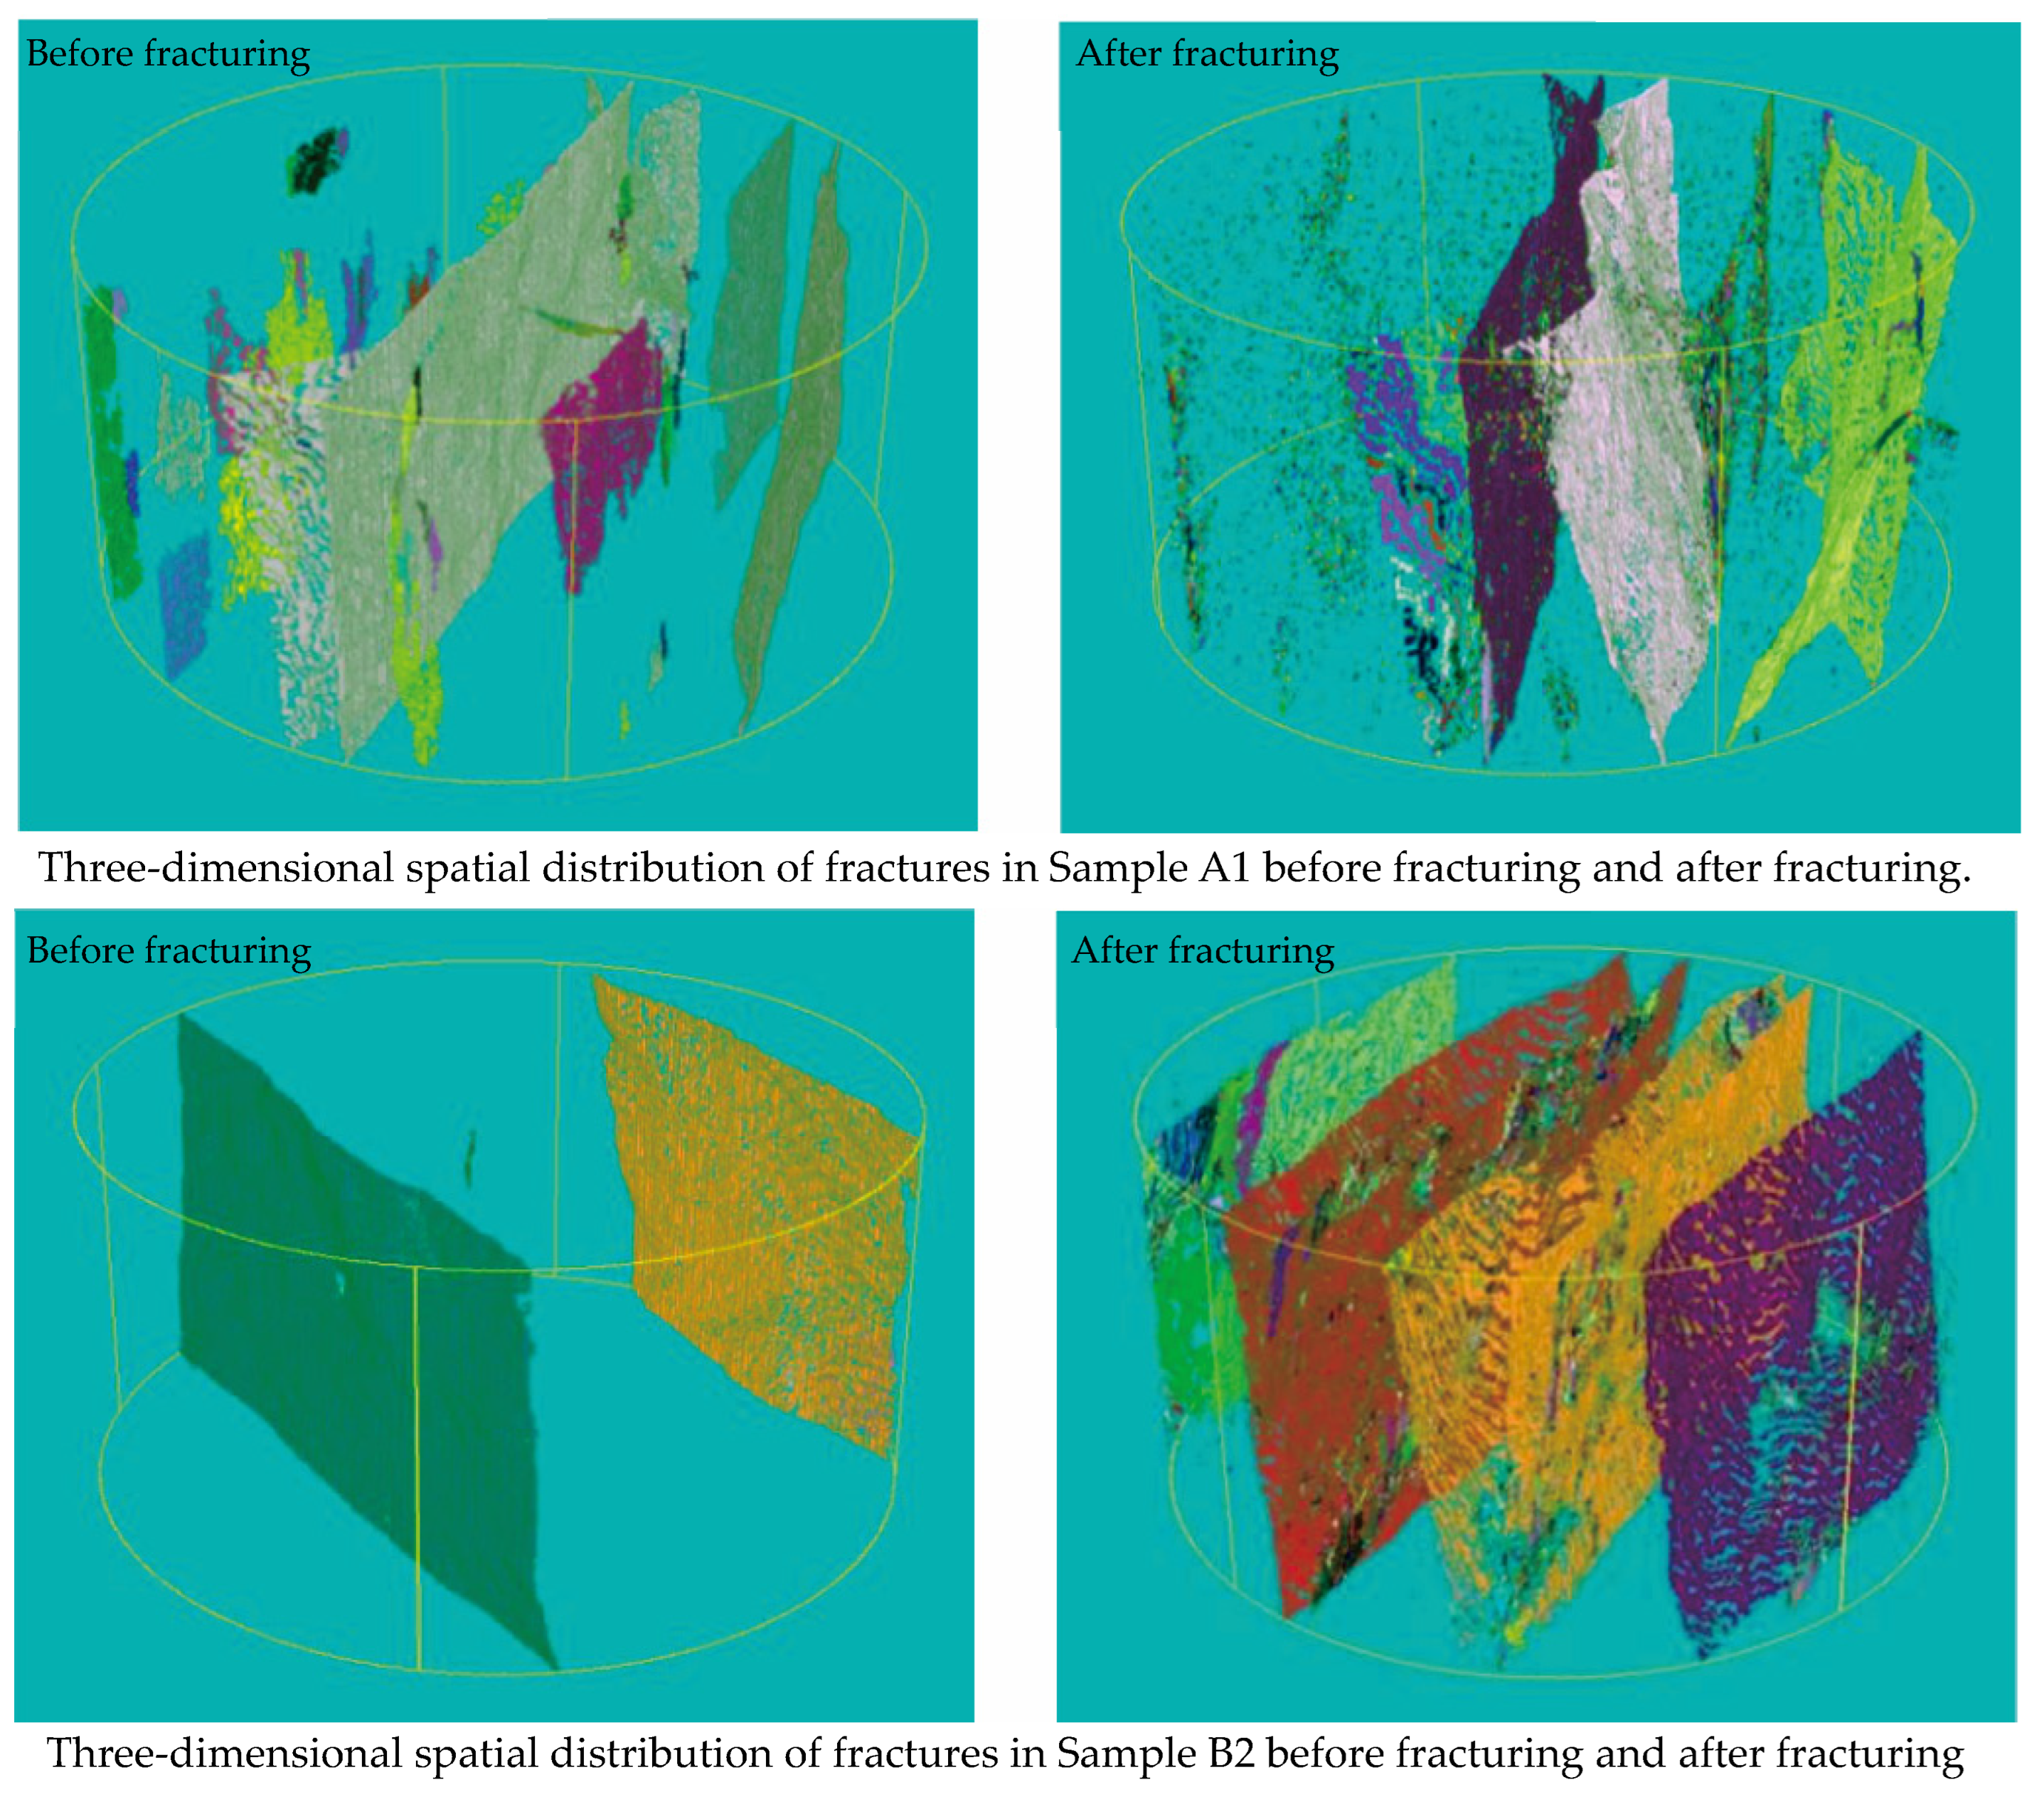
2.2. Quantitative Characterization of Three-Dimensional Fracture Distribution in Space

The acquired three-dimensional grayscale images comprise rock, pores, fractures, and a substantial quantity of stochastic noise. The utilization of a median filter to eliminate noise while maintaining image details is the objective of this research involving three-dimensional grayscale images of the cores. Furthermore, fracture extraction is accomplished by considering three parameters following the three-dimensional image reconstruction of the CT sequences of the cores: the shape factor, the ratio of the longest and shortest sides of the approximately minimum circumscribed cub, and the ratio of the minimum circumscribed sphere radius to the equivalent sphere radius, which are attributed to the notable morphological distinctions between pores and fractures in the three-dimensional data field [18,19,20,21,22].
Based on the above principle, the parametric formulas involved in implementing crack extraction will be expanded to describe:
(1)
Three-dimensional shape factor
F = 36 π V p 2 S p 3
where Vp represents the target volume, and Sp represents the target surface area. When the value of F approaches 1, the target becomes closer to a sphere. Therefore, targets that satisfy F < 0.05 have planar characteristics, possibly indicating fractures, which should be retained.
(2)
Equivalent sphere radius and minimum circumscribed sphere radius
When the ratio of the minimum circumscribed sphere radius (Rmin) to the equivalent sphere radius (Req) satisfies the condition R m i n R e q > 3 , it indicates that the target exhibits extension in a specific direction within the three-dimensional data field, which is consistent with the characteristics of fractures and should be retained.
(3)
Ratio of the longest and shortest sides of the approximately minimum circumscribed cuboid:
(1)
Calculation of the fitting plane:
The least squares method is utilized in order to compute the target’s fitting plane [23,24,25,26]. Finding a plane that minimizes the sum of the distances between each point on the target and the plane is the objective. Following is the equation representing the fitting plane:
A x + B y + C z + D = 0
Based on the principle of least squares, the formula for the least squares plane fitting is:
i = 1 n e i 2 = i = 1 n A x i + B y i + C z i + D 2
where (xi, yi, zi) represents any point on the target, ei denotes the error between the point and the plane. We obtain the following equations by taking partial derivatives with respect to A, B, and C while assuming D = 1:
A i = 1 n A x i + B y i + C z i + 1 2 = 2 i = 1 n A x i + B y i + C z i + 1 x i = 2 i = 1 n A x i 2 + B y i x i + C z i x i + x i = 0
B i = 1 n A x i + B y i + C z i + 1 2 = 2 i = 1 n A x i + B y i + C z i + 1 y i = 2 i = 1 n A x i y i + B y i 2 + C z i y i + y i = 0
C i = 1 n A x i + B y i + C z i + 1 2 = 2 i = 1 n A x i + B y i + C z i + 1 Z i = 2 i = 1 n A x i z i + B y i z i + C z i 2 + z i = 0
  •  
    (2)
    Approximate height of the minimum circumscribed cuboid:
Computed are the distances between each point on the porous target’s opposite side and its projection onto the fitting plane. The maximum projection distances, dmax1 and dmax2, on each side are identified. The product of these distances provides an approximation of the height (H) of the minimum circumscribed cuboid of the target.
H = d m a x 1 + d m a x 2
  •  
    (3)
    Approximate length of the minimum circumscribed cuboid
The projection point set P on the fitting plane for the target is calculated. This set is considered as a convex hull, and the rotating calipers algorithm [27] is adopted to find the maximum distance between two points, P1 and P2, on the convex hull. This distance corresponds to the approximate length (L) of the target’s minimum circumscribed cuboid.
  •  
    (4)
    Approximate width of the minimum circumscribed cuboid
In order to determine the distances between each point on both sides and its corresponding projected point on the line, one must determine the upper and lower portions of the projection point set that the line defined by P1 and P2 divides. The sum of the maximum distances on each side, dmax3 and dmax4, represents the approximate width (W) of the target’s minimum circumscribed cuboid.
W = d m a x 3 + d m a x 4
After the aforementioned calculations, by comparing the three parameters H, L, and W pairwise, we can obtain their maximum value Dmax and minimum value Dmin. When the condition D m a x D m i n > 3 is satisfied, it indicates the presence of narrow and elongated fractures, which should be retained.
By employing the calculations and comparisons mentioned earlier, and taking into account whether the target satisfies the extension in a particular direction within the three-dimensional data field and displays a thin planar distribution that is indicative of fractures, all targets that satisfy these criteria are classified as core fractures.

3. Quantitative Study on the Formation Potential of Effective Fracture Network Based on Post-Fracturing Three-Dimensional Fracture Complexity

In addition to generating fractures and crushing the rock, volumetric fracturing aims to maximize the contact area between the fractures and the formation, thereby establishing a network of interconnected fractures [28]. In assessing the efficacy of hydraulic fracturing, the formation of a three-dimensional distributed effective fracture network is thus a crucial criterion. Nevertheless, determining the exact extent to which an effective fracture network develops presents a formidable task. Through a comparative analysis of fracture data obtained prior to and subsequent to fracturing, one can effectively quantify the quantity, orientation, and aperture dimensions of both newly formed and pre-existing fractures. Finally, the concept of post-fracturing “three-dimensional fracture complexity” will be introduced to quantitatively evaluate the degree of formation of the effective fracture network, which reflects changes in the volume of fractures and the degree of interconnection and spatial positioning of fractures.
Figure 2 illustrates CT original images of a shale sample from top view, side view, and three-dimensional reconstruction perspectives, both prior to and subsequent to fracturing. Figure 3 shows the extraction results of fractures before and after fracturing in shale samples.
By means of digital core reconstruction and fracture extraction prior to and subsequent to sample fracturing, it is possible to precisely illustrate the attributes of the pre-existing fracture extension as well as the development of novel fractures. An examination of statistical data pertaining to the pre-fracturing and post-fracturing states of sixteen shale samples reveals a correlation between the complexity of the three-dimensional fracture distribution and the fracability of shale.

3.1. Factors Affecting Three-Dimensional Fracture Complexity

The principal determinants of the three-dimensional complexity of fractures subsequent to hydraulic fracturing are the number of fractures induced and the properties of their three-dimensional distribution. The fracture increment comprises two components: the augmentation in fracture count (ΔR) and the augmentation in fracture porosity ( f ). The characteristics of the three-dimensional distribution of fractures are represented by the angular dispersion of fractures ( Q f ) and the distribution of fracture center points. The specific calculation methods are as follows:
R = R a R b
where ΔR represents the increase in the number of fractures, Ra is the number of fractures in the post-fracturing core, and Rb is the original number of fractures in the pre-fracturing core.
f = i = 1 n V i V t × 100 %
where Δφf is the increment of fracture porosity (dimensionless), ΔVi is the increment of the number of pixels occupied by the ith fracture in the three-dimensional image, and Vt is the total number of pixels in the reconstructed three-dimensional region of the core.
Q f = i = 1 n A i A ¯ 2 n × 100 %
where Qf is the angular dispersion of fractures in degrees, A is the average angle of fractures, Ai is the angle of the ith fracture (all angles are measured in degrees). The angular dispersion of fractures represents the variance of all fracture angles.
Distribution of fracture center points: The fractal dimension Dc of two-dimensional fracture center points is calculated from the observed or measured distribution image of the digital core, and then Dc3D, the fractal dimension of three-dimensional fracture center points, is obtained by adding 1. Dc is calculated using the point-pair correlation function:
C 2 r = 2 N r N N 1 = c · r D c
where C2(r) is the point-pair correlation function, N(r) is the number of points in the region with a distance less than r, r is the distance between two points in the region, N is the total number of points in the region, and c is a proportionality coefficient.
Fracture complexity subsequent to fracture: The quantity and distribution of fractures constitute the fracture complexity subsequent to fracture. An increase in both the number of fractures and the dispersion of angular values results in heightened complexity. The analysis involves the comparison of image features of post-fracturing cores in order to determine the impact weights of fracture increment and their distribution on complexity. The calculation method for fracture complexity is defined as:
C f = R × φ f + Q f 2
where Cf represents the complexity of fractures after fracturing.

3.2. Quantitative Characterization Method for Three-Dimensional Fracture Complexity

For assessing the degree of three-dimensional fracture network formation, the three-dimensional complexity of fractures in post-fracturing cores serves as a benchmark. Wu et al. quantitatively evaluated the frackability of shale by combining weighting methods. Nevertheless, the aforementioned parameters pertain to the rock’s state prior to fracturing and have not undergone a comparative analysis with its state later on [29].
Comparing the fracture characteristics of rocks prior to and subsequent to fracturing, this study ascertains the weights of each influencing factor via a combination weighting method in order to conduct a comprehensive evaluation of the impact of diverse influencing factors on the three-dimensional complexity and frackability of rocks [29,30,31]. Thus, a mathematical model for the three-dimensional complexity of fractures after fracturing is established. The combination weighting method significantly improves the accuracy of frackability characterization by combining the objective weights determined by the entropy method with the subjective weights computed by the Analytic Hierarchy Process [32,33,34]. The following are the precise procedures:
Normalization
By converting numerous parameters into numeric values for calculation purposes and normalizing the three-dimensional complexity of fractures subsequent to fracturing, the range transformation method effectively eliminates the dimensional influence among indicators [29]. The processing methods are as follows:
b i j = a i j m i n a i j max a i j m i n a i j
where aij is a positive indicator,
b i j = max a i j a i j max a i j m i n a i j
where aij is a negative indicator, where bij is the parameter standardization value of the jth indicator for the ith sample; aij is the initial value; max(aij) and min(aij) are the maximum and minimum values of the indicators in the sample, respectively.
Entropy method [31,35,36] for evaluating factor weights:
K i j = b i j i = 0 n b i j ,     i [ 1 , m ] ;     j [ 1 , m ]
The entropy of indicator j is calculated as:
h j = ln m 1 i = 1 m K i j ln K i j ,     j [ 1 , n ]
Setting kij = 0, kijln(kij) = 0, such that the weight (qj) of the jth indicator is:
q j = 1 h j j = 1 n 1 h j
By employing the aforementioned equation to objectively weight the experimental data, one can derive the weights that correspond to the increase in fracture number, fracture porosity, and angular dispersion of fractures in shale.
Combination weighting: Assuming Wi as the subjective weight and Ki as the objective weight, the distance function between them is defined as:
d W i , K i = 1 2 i = 1 n W i K i 2 1 2
The combined weight Wz is obtained by linearly combining the subjective and objective weights, expressed as: Wz = αWi + βKi (α and β are corresponding allocation coefficients). The allocation coefficients and distance function are both set to equal values in order to achieve consistency between the variances in allocation coefficients and variances in weights. This ensures that the variances in allocation coefficients and differences in weights are consistent. Following is the precise expression:
d W i , K i 2 = α β 2   α + β = 1
By solving the above equations simultaneously, the allocation coefficients for the increment of fracture number, increment of fracture porosity, and angular dispersion of fractures can be obtained.
Simple linear weighting method for determining the coefficient of three-dimensional fracture complexity is formulated in the following function:
C f = i = 0 n P i Z i
Here, Pi is the normalized value of the ith frackability influencing factor after processing, Zi is the weight of Pi, and n is the number of influencing factors of three-dimensional fracture complexity.
It is possible to ascertain the effects of fracture number increment, fracture porosity increment, and fracture angular dispersion on the three-dimensional complexity of fractures subsequent to fracturing by employing the aforementioned methodology. A final step is the development of a characterization model for three-dimensional fracture complexity.

3.3. Study on Quantitative Characterization of Shale Fracability

The effectiveness and difficulty of fracturing are indicators of the fracability of shale. The effectiveness of fracturing is directly equivalent to the complexity of post-fracturing fractures; The correlation between the two variables is positive. A positive correlation exists between the two variables and the peak pressure utilized in fracture pressure experiments to characterize the fracturing difficulty, which represents the compressive strength of the shale core. The proposed quantitative characterization model of fracability must include factors related to fracture potential ( D f ) and network potential ( N f ). The fracture potential is characterized by the mineral brittleness and fracture pressure, while the network potential is characterized by the three-dimensional complexity of fractures in the fractured shale core, as follows:
D f = B P f = Q Q + C + C l P f
N f = f b · C f
The calculation method for fracability parameters is obtained as follows:
F c = f D f , N f
where Df represents the fracture potential of the rock, B is the brittleness index, Pf is the rock fracture pressure (MPa), Q is the content of silica minerals (quartz, feldspar), C is the content of carbonate minerals (calcite, dolomite, siderite), Cl is the content of clay minerals, Nf is the network potential of the rock, b is the three-dimensional fracture complexity coefficient of the core, Cf is the post-fracturing fracture complexity of the core, and Fc is the fracability of the rock.
Likewise, by employing the combined weighting method, one can derive the quantitative characterization model of fracability. An additional approach to enhance the model’s precision for distinct blocks is to incorporate auxiliary parameters, including kerogen content and fracture toughness.

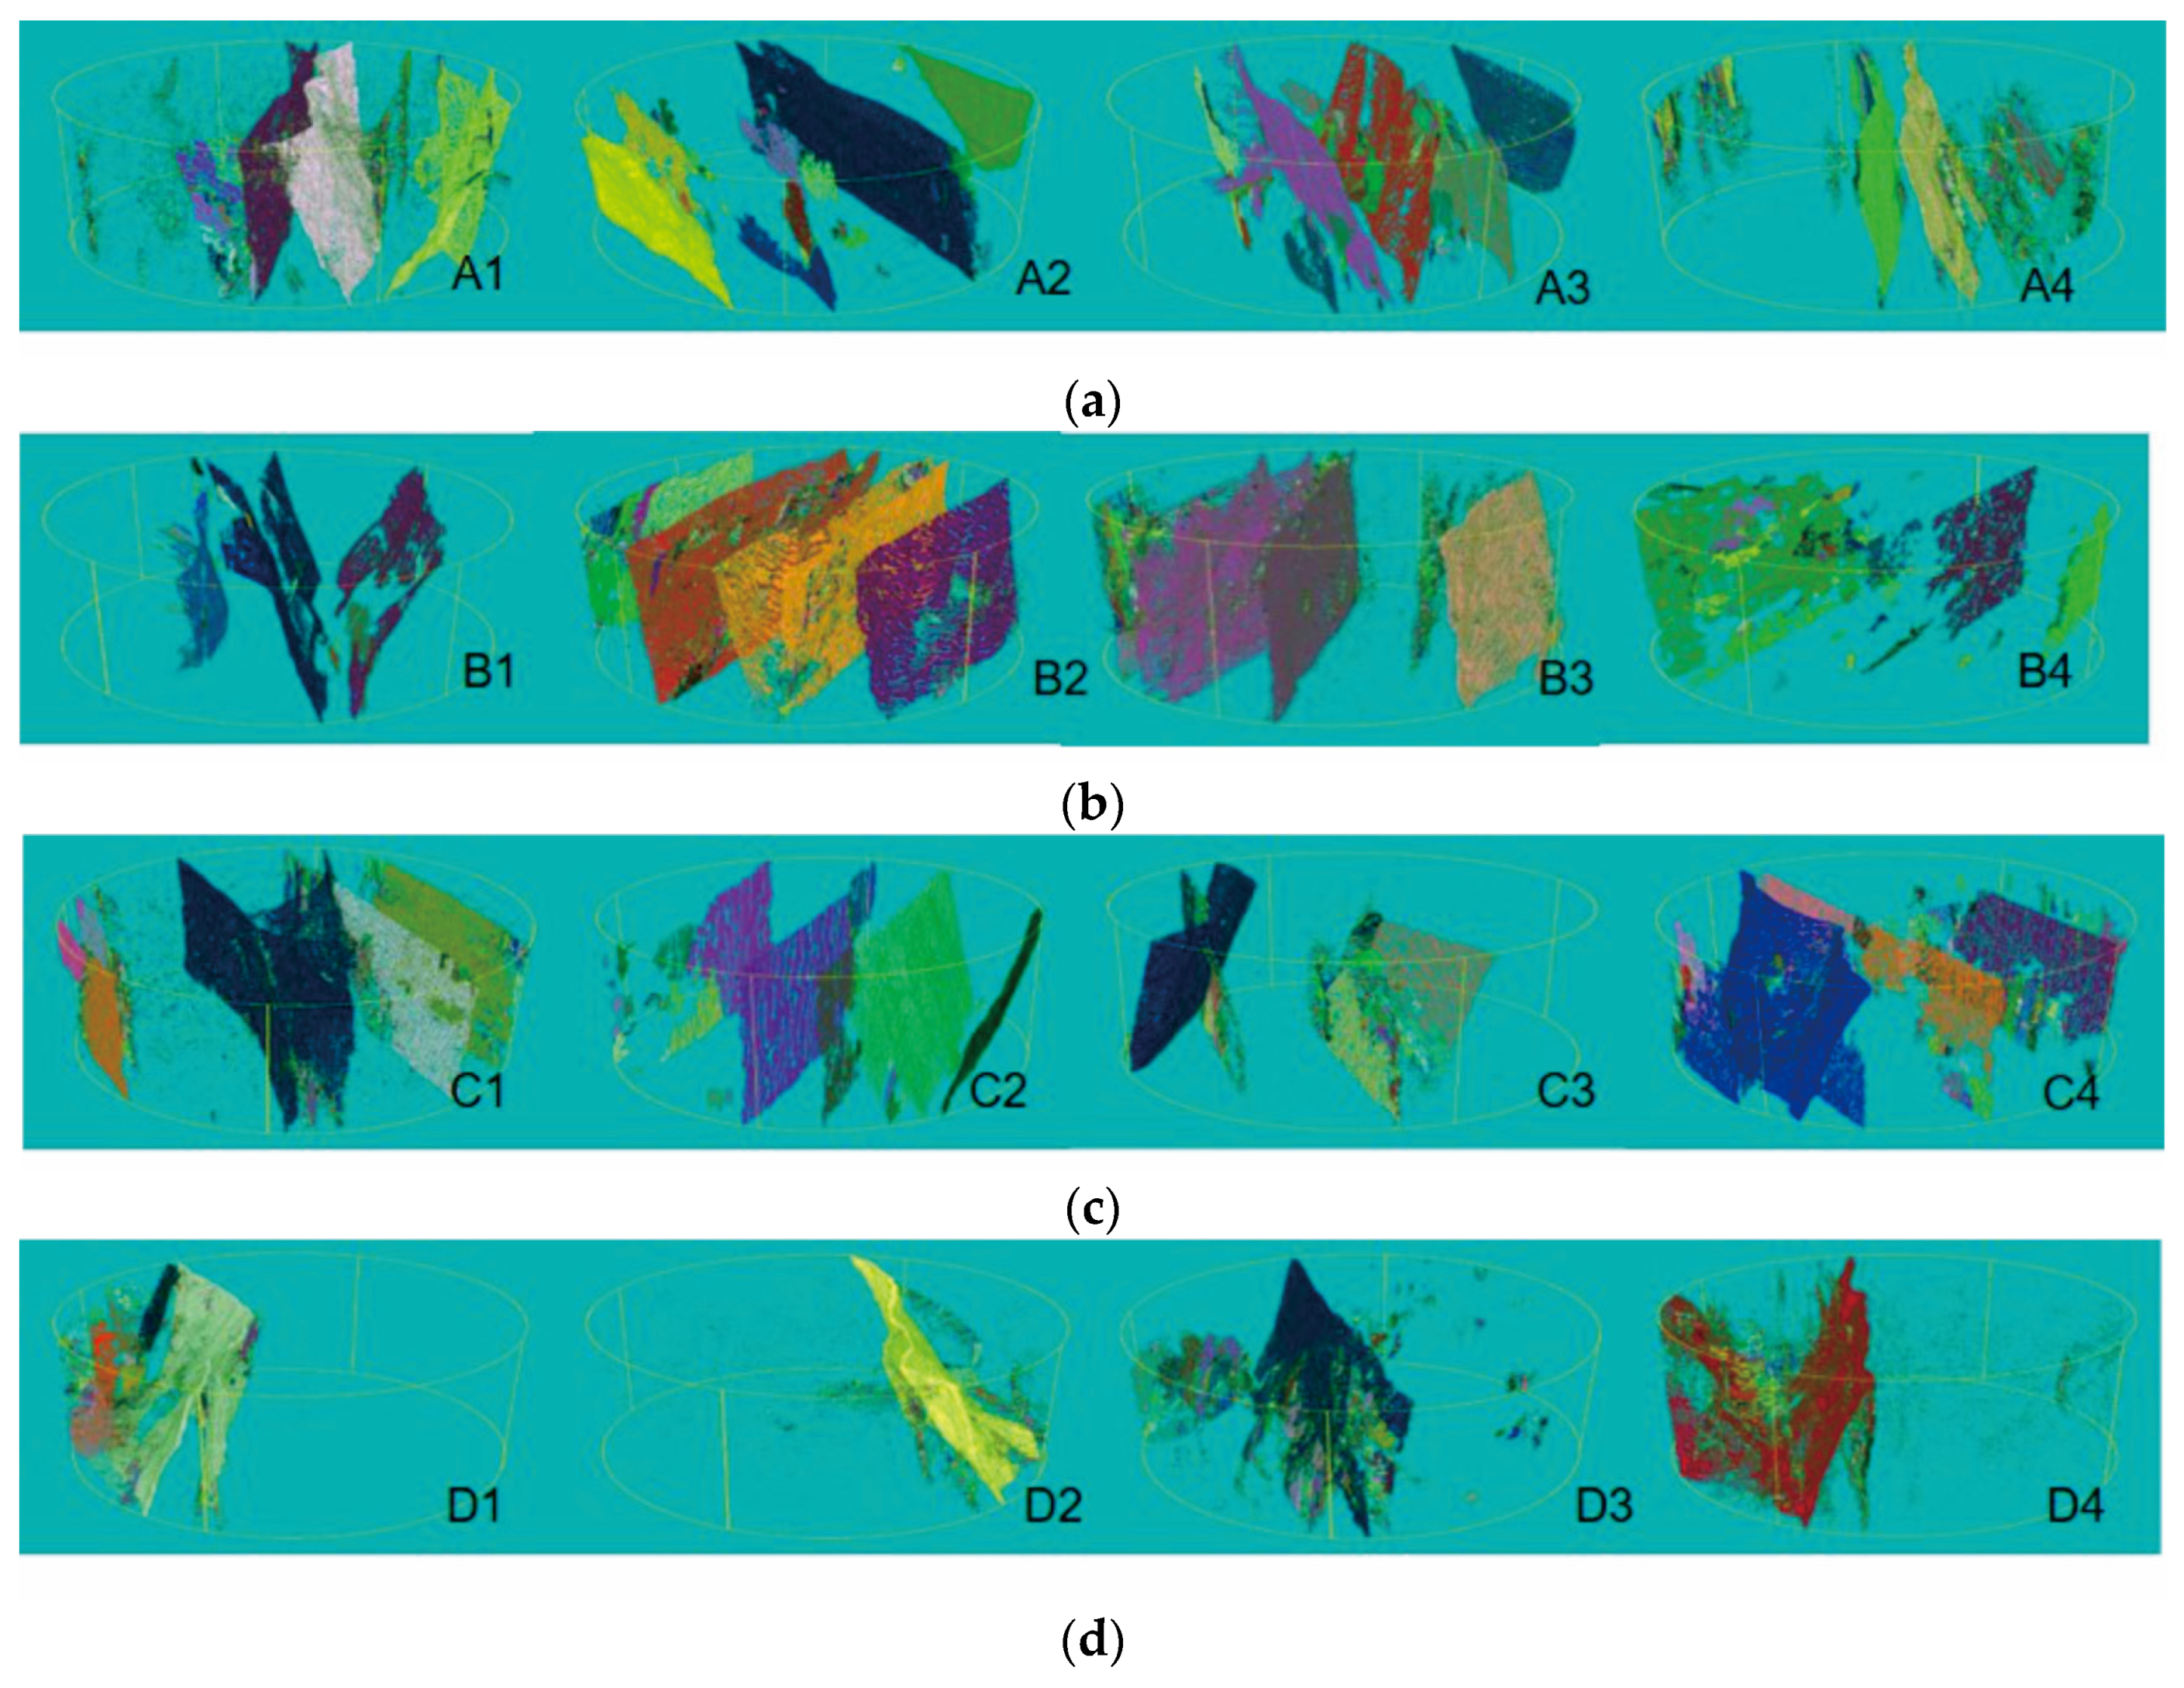
4. Application and Verification of Shale Fracability Characterization

Typically, the brittleness of rocks is measured by the content of brittle minerals and elastic parameters [37,38,39]. Previous scholars usually use the mineral method and the Po-Yang method to calculate the brittleness index of the rock. They concluded that the mineral brittleness index is a direct response to fracability, and that the better the brittleness index, the better the fracability.
However, from Table 1 and Figure 4, it can be found that the results of the brittleness parameter through the mineral brittleness calculation method and the Po-Yang method based on the mineral parameter, the actual results show that the difference of fracturing fracability is not big, and it cannot reflect the goodness of fracability. However, through the calculation model proposed in this thesis, the difference in fracture morphology after fracturing can be clearly seen in the table and the latter figure, so the brittleness calculation method is inaccurate, and the feasibility of the method proposed in this thesis is also verified.
Therefore, the fracturing index was computed using a novel approach that involved quantitative characterization of the three-dimensional distribution of cracks in space and statistical analysis of diverse fracture characteristics subsequent to fracturing. As illustrated in Figure 5, the calculated results and the fracability exhibited in the images demonstrate a strong correlation.
When compared to the outcomes derived from calculations based on two-dimensional images, both approaches yield comparable evaluations of the fractability of shale. In situations where cracks exist only internally and do not penetrate the core, however, the three-dimensional calculation is more precise. The fracability of 16 shale samples was calculated and classified using the new method, and the samples were ranked based on their fracturing index, resulting in four categories, as shown in Table 2.
As shown in Figure 5, for Group (a), the number of fractures significantly increases after fracturing, forming an interconnected network of fractures, indicating good fracability of the cores. In contrast, the fractures in Group (b) and Group (c) grow and extend exclusively along the pre-existing fracture surfaces, lacking the formation of a fracture network. This characteristic suggests that the cores have limited fractability. Finally, there is almost no increase in cracks in Group (d), so its fractibility is range.
As a result, it is possible to deduce that various techniques for characterizing the brittleness index inherently involve unpredictability and error. It is inadequate to exclusively depend on brittleness indices in order to precisely define the fractability of rocks. Therefore, a novel fracability model that incorporates jointly constrained fracture potential and network potential is more dependable.

5. Conclusions

To quantify the formation potential of fracture networks during the fracturing process, this study utilized a variety of research methodologies, including laboratory rock core fracturing simulation experiments, three-dimensional digital rock core modeling, three-dimensional image analysis, correlation analysis modeling, and reservoir geology theory research. By establishing a quantitative evaluation criterion for fracturing effectiveness predicated on the degree of effective fracture network formation, we introduced the notion of post-fracturing three-dimensional complexity. Moreover, in light of the existing methodological shortcomings in fracability assessment, we have put forth a novel methodology and constructed a quantitative characterization model that incorporates the combined limitations of fracture potential and network potential. In reaching the following conclusions:
Establishment of a quantitative extraction method for gathering and extracting three-dimensional fracture information and parameters from post-fracturing CT scans of rock cores; enhancement of the fracture pressure testing method utilizing constant strain rate. By employing this approach, it becomes possible to quantitatively extract fracture images from three-dimensional digital rock cores and to characterize fracture parameters including fracture number, fracture angle, and fracture porosity. Finally, a three-dimensional complexity characterization model is developed post-fracturing, taking into account the morphology and increment of fractures.
Through the validation of three-dimensional post-fracturing fracture images, the rock fracability index demonstrates that it accurately represents the fracturing conditions of rock cores. Furthermore, it demonstrates a strong correlation with the outcomes of hydraulic fracturing microseismic monitoring. This methodology substantially enhances the precision of fracability characterization. In actual mining, this method is used to quickly derive the preferred fracturing section. This is also the key to the success of the fracturing program design in the actual mining, and therefore can provide more effective technical support for improving the recovery rate.

Author Contributions

Conceptualization, L.Q., J.L., W.Z., Y.L. and J.X.; Methodology, L.Q., P.Z., W.Z., X.Z., Z.N. and K.N.; Software, J.L., Y.L. and J.X.; Investigation, J.L., W.Z., Y.L. and J.X. All authors have read and agreed to the published version of the manuscript.

Funding

The authors appreciate the financial support of the National Natural Science Foundation of China (No. 52004223), the Technology Innovation Leading Program of Shaanxi (No. 2022PT-08), and the Project of Youth Innovation Team of Shaanxi Universities (No. 22JP063).

Data Availability Statement

Data are contained within the article.

Conflicts of Interest

J.L. and Y.L. were employed by the Exploration Department of PetroChina Changqing Oilfield Company. W.Z. was employed by the No.8 Oil Recovery Plant of PetroChina Changqing Oilfield Company. The remaining authors declare that the research was conducted in the absence of any commercial or financial relationships that could be construed as a potential conflict of interest.

References

  1. Wu, X.S.; Sun, Z.T.; Yang, T.T. Global progress in exploration and development of unconventional hydrocarbons and assessment of resources potential. Mar. Geol. Front. 2020, 36, 1–17. [Google Scholar] [CrossRef]
  2. Tian, F.; Fu, Y.; Liu, X.; Li, D.; Jia, Y.; Shao, L.; Yang, L.; Zhao, Y.; Zhao, T.; Yin, Q.; et al. A Comprehensive Evaluation of Shale Oil Reservoir Quality. Processes 2024, 12, 472. [Google Scholar] [CrossRef]
  3. Dou, L.B.; Yang, H.J.; Xiao, Y.J.; Gao, H.; Li, T.T.; Sun, H.B. Probability study of formation brittleness and new quantitative evaluation of fracability for shale reservoirs. Prog. Geophys. 2021, 36, 576–584. [Google Scholar]
  4. Liu, Y.; Chen, Z.; Ji, D.; Peng, Y.; Hou, Y.; Lei, Z. Pore Fluid Movability in Fractured Shale Oil Reservoir Based on Nuclear Magnetic Resonance. Processes 2023, 11, 3365. [Google Scholar] [CrossRef]
  5. Rickman, R.; Mullen, M.; Petre, E.; Grieser, B.; Kundert, D. A Practical Use of Shale Petrophysics for Stimulation Design Optimization: All Shale Plays Are Not Clones of the Barnett Shale. In Proceedings of the SPE Annual Technical Conference & Exhibition, Denver, CO, USA, 21–24 September 2008. [Google Scholar]
  6. Han, W.Z.; Dou, Y.; Li, H.D.; Zhang, W.; Shi, Z.N.; Dong, J.C. Optimization and application of brittleness evaluation methods for continental organic-rich shale: A case study of the 2nd Member of Kongjiadian Formation, Cangdong Sag, Bohai Bay Basin. Oil Drill. Prod. Technol. 2022, 44, 191–198. [Google Scholar] [CrossRef]
  7. Huang, Y.Y.; Wang, G.W.; Song, L.T.; Wang, S.; Zhang, Y.L.; Huang, L.L.; Lai, J. Fracture logging identification and effectiveness analysis of shale reservoir of the Permian Fengcheng Formation in Mahu sag, Junggar Basin. J. Palaeogeogr. (Chin. Ed.) 2022, 24, 540–555. [Google Scholar]
  8. Chen, H.Z. Recognition and Study of Structural Fractures in Shale Reservoirs. Master’s Thesis, China University of Geosciences, Beijing, China, 2021. [Google Scholar]
  9. Fan, Y.R.; Li, X.G.; Yi, K.; Zhu, D.W.; Zhang, Q. Fracability Quantitative Interpretation of Shale Reservoir Based on Digital Core Technology. Well Logging Technol. 2017, 41, 685–690. [Google Scholar] [CrossRef]
  10. Jiang, L.M.; Sun, J.M.; Liu, X.F.; Wang, H.T. Numerical Study of the Effect of Natural Gas Saturation on the Reservoir Rocks’ Elastic Parameters. Well Logging Technol. 2012, 36, 239–243. [Google Scholar] [CrossRef]
  11. Jiang, L.M.; Yu, C.H.; Qi, B.Q.; Zhu, H.B.; Wang, Y.J. A novel saturation model of vuggy carbonate reservoirs and its application. Nat. Gas Geosci. 2017, 28, 1250–1256. [Google Scholar]
  12. Li, X.W.; Jiang, L.M.; Kou, X.P.; Luo, J.L.; Jie, L.B.; Jin, R.G. Determination of Gas-water Distribution in Reservoir Pore Using Lattice Boltzmann Method. J. Xi’an Shiyou Univ. (Nat. Sci. Ed.) 2017, 32, 49–54. [Google Scholar]
  13. Zhao, J.; Zhang, Y.; Zhang, M.; Mao, Z.; Wang, C.; Hu, R.; Yang, L.; Liu, Y. Research on Micro-Pore Structure and 3D Visual Characterization of Inter-Salt Shale Based on X-CT Imaging Digital Core Technology. Processes 2022, 10, 1321. [Google Scholar] [CrossRef]
  14. Xin Yu, X.Y.; John Kemeny, J.K.; Weidong Song, W.S.; Yuye Tan, Y.T. Progressive Fracturing of Rock/Backfill Specimens under Triaxial Compression—Experiments and Modeling. In Proceedings of the 55th U.S. Rock Mechanics/Geomechanics Symposium 2021, Houston, TX, USA, 18–25 June 2021. [Google Scholar]
  15. Zhou, X.; Han, L.; Bi, J.; Shou, Y. Experimental and numerical study on dynamic mechanical behaviors of shale under true triaxial compression at high strain rate. Int. J. Min. Sci. Technol. 2024, 34, 149–165. [Google Scholar] [CrossRef]
  16. Li, B.; Gong, J.; Long, Y.; Hu, H.; Cao, Y.-B. Experimental investigations on mechanical and failure behaviors of transversely isotropic shale containing twin fissures under true triaxial stresses. Arch. Appl. Mech. 2023, 93, 3205–3228. [Google Scholar] [CrossRef]
  17. Zhao, Z.; Zhou, X.-P. 3D Digital Analysis of Cracking Behaviors of Rocks through 3D Reconstruction Model under Triaxial Compression. J. Eng. Mech. 2020, 146, 04020084. [Google Scholar] [CrossRef]
  18. Deng, Z.Q.; Teng, Q.Z. Three-dimensional Image-based Core Crack Automatig Recognition. Comput. Digit. Eng. 2013, 41, 98–100. [Google Scholar]
  19. Mutalipu, M.A.; Li, T.; Gu, W.B.; Cai, W.; Xue, Q.N.; Jing, J.H.; Wang, G.W.; Wang, Q. Seepage characteristic of gas water based on pore network model. J. China Coal Soc. 2023, 48, 2802–2812. [Google Scholar]
  20. Wang, Z.Y. Research of Permeability Model of Reservoirs Based on Digital Core. Ph.D. Thesis, China University of Petroleum, Beijing, China, 2022. [Google Scholar]
  21. Song, X.D. Based on Digital Cores Numerical Simulation of Elastic Properties of Rock. Ph.D. Thesis, China University of Geosciences, Beijing, China, 2017. [Google Scholar]
  22. Yan, G.L. Based on Digital CoresResearch of Permeability Models of Reservoirs. Ph.D. Thesis, China University of Petroleum (East China), Qingdao, China, 2015. [Google Scholar]
  23. Li, X. Rock Physical Experiment and Fracturing Potential Characterization of Shale Gas Reservoir. Ph.D. Thesis, NorthWest University, Xi’an, China, 2017. [Google Scholar]
  24. Wang, Z. Least Square-Total Least Square Method Analysis and Application of Flow Detection Curve Based on hybrid least squares method. Ph.D. Thesis, Shenyang University of Technology, Shenyang, China, 2021. [Google Scholar]
  25. Li, J.; Zheng, B. A New method for fractal characterization of microscopic pores and its application in shale reservoirs. Nat. Gas Ind. 2015, 35, 52–59. [Google Scholar] [CrossRef]
  26. Hu, Y.; Perdomo, M.E.G.; Wu, K.; Chen, Z.; Zhang, K.; Yi, J.; Ren, G.; Yu, Y. New models of brittleness index for shale gas reservoirs: Weights of brittle minerals and rock mechanics parameters. In Proceedings of the SPE Asia Pacific Unconventional Resources Conference and Exhibition, Brisbane, QLD, Australia, 9–11 November 2015. [Google Scholar]
  27. Skogan, D.; Grønmo, R.; Solheim, I. 11th IEEE International Enterprise Distributed Object Computing Conference-Copyright notice. In Proceedings of the 10th IEEE International Enterprise Distributed Object Computing Conference, Annapolis, MD, USA, 15–19 October 2007; IEEE Computer Society: Washington, DC, USA, 2006. [Google Scholar] [CrossRef]
  28. Liu, X.H.; Zhao, Q.S.; Chen, J.G. Experimental study on size effect to the uniaxial compressive strength of slate specimen as to the height diameter ratio. Geotech. Investig. Surv. 2015, 43, 6–11. [Google Scholar]
  29. Wu, J.J.; Zhang, S.H.; Cao, H.; Zheng, M.M.; Sun, P.H.; Luo, X. Fracability evaluation of shale gas reservoir—A case study in the Lower Cambrian Niutitang formation, northwestern Hunan, China—ScienceDirect. J. Pet. Sci. Eng. 2018, 164, 675–684. [Google Scholar] [CrossRef]
  30. Zhang, C.; Wang, Q.; Chen, J.P.; Gu, F.G.; Zhang, W. Evaluation of debris flow risk in Jinsha River based on combined weight process. Rock Soil Mech. 2011, 32, 831–836. [Google Scholar] [CrossRef]
  31. Guo, Q.Q.; Liu, L.L.; Zhang, S.H.; Wang, X.M. Prediction of Rockburst by Combination Weight Method and Cluster Analysis Method. J. Chang. River Sci. Res. Inst. 2013, 30, 54–59. [Google Scholar]
  32. Liang, B.; Dai, Y.-Y.; Chen, T.-Y.; Sun, W.-J.; Qin, B. Grey correlation optimization for shale gas exploration and development areas of complicated geological parameter features. Meitan Xuebao/J. China Coal Soc. 2014, 39, 524–530. [Google Scholar] [CrossRef]
  33. Wan, S.; Yuan, B.; Liu, H.; Meng, S.; Lei, Z.; Wang, W. An Improved Analytic-Hierarchy-Quantitative Pre-Evaluation Method for Post-fracturing Recoverability in Lamellation-Type Shale Oil Reservoir. In Proceedings of the 2023 SPE/AAPG/SEG Unconventional Resources Technology Conference, URTC 2023, Denver, CO, USA, 13–15 June 2023. [Google Scholar]
  34. Wang, J.; Xue, M.; Fan, J.; Bentley, Y.; Wang, X. Does shale gas exploitation contribute to regional sustainable development? Evidence from China. Sustain. Prod. Consum. 2023, 40, 169–181. [Google Scholar] [CrossRef]
  35. Chen, H.B.; Chen, M.X.; Su, D.F.; Li, Z.G. Optimization of mining methods based on least squares combined assignment-TOPSIS method. Ind. Miner. Process. 2023, 52, 10–15. [Google Scholar] [CrossRef]
  36. Guo, Y.; Li, Q.; Zhang, Q.J. Comprehensive evaluation of coal-fired units by integrating TOPSIS-combined assignment method. Mod. Ind. Econ. Inf. 2023, 13, 301–307. [Google Scholar]
  37. Su, X.Z. Evaluation of Shale Reservoir Properties and Brittleness in the Upper Nine Section of the Ludong Depression, Kailu Basin. Master’s Thesis, China University of Geosciences Beijing, Beijing, China, 2022. [Google Scholar]
  38. Wang, R.; Hu, Z.; Lai, F.; Liu, Y.; Wu, Z.; He, J.; Zou, G.g.; Wang, P.; Li, Z. Brittleness features and controlling factors of continental shale from Da’anzhai Member of the Lower Jurassic Ziliujing Formation, northeastern Sichuan Basin. Oil Gas Geol. 2023, 44, 366–378. [Google Scholar] [CrossRef]
  39. Wang, R.; Gong, D.; Ding, W.; Leng, J.; Yin, S.; Wang, X.; Sun, Y. Brittleness evaluation of the Lower Cambrian Niutitang shale in the Upper Yangtze region: A case study in the Cengong block, Guizhou Province. Earth Sci. Front. 2016, 23, 87–95. [Google Scholar] [CrossRef]
Figure 1. Methodology flowchart.
Processes 12 00755 g001
Figure 2. CT original images before and after fracturing in shale.
Processes 12 00755 g002
Figure 3. Extraction results of fractures before and after fracturing in shale.
Processes 12 00755 g003
Figure 4. Comparison of fracturing effectiveness of samples with similar mineral brittleness indices. Group A: The mineral brittleness index is 38.3. Group B: The mineral brittleness index is 38.5.
Processes 12 00755 g004
Figure 5. Post-fracturing fracture patterns in shale cores. (a) Fracturing is optimal (b) Fracturing is good (c) Fracturing is normal (d) Fracturing is range.
Processes 12 00755 g005
Table 1. Parameters of fracturing index and brittleness index.
Simple No.FracabilityMineral Brittleness IndexAcoustic Brittleness Index
A Group27.338.320.5
B Group4.8138.518.2
Table 2. Calculated results for samples.
Core No.FracabilityImage Quality
A137.10961Optimal
A234.8375
A328.59897
A426.8989
B125.35907Good
B224.07041
B321.75481
B418.55319
C117.8772Normal
C217.20469
C313.58753
C413.47243
D110.64513Range
D28.170793
D37.412255
D45.185485
Disclaimer/Publisher’s Note: The statements, opinions and data contained in all publications are solely those of the individual author(s) and contributor(s) and not of MDPI and/or the editor(s). MDPI and/or the editor(s) disclaim responsibility for any injury to people or property resulting from any ideas, methods, instructions or products referred to in the content.

