Article

Structural Behaviour and Charge-Compensation Mechanism in Li2Fe1−xCoxSeO Solid Solutions during Reversible Delithiation

by
Mikhail V. Gorbunov
* and
Daria Mikhailova
Leibniz Institute for Solid State and Materials Research (IFW) Dresden e.V., Helmholtzstraße 20, D-01069 Dresden, Germany
*
Author to whom correspondence should be addressed.
Processes 2024, 12(4), 756; https://doi.org/10.3390/pr12040756
Submission received: 20 February 2024 / Revised: 31 March 2024 / Accepted: 4 April 2024 / Published: 9 April 2024
(This article belongs to the Special Issue Advanced Lithium Battery Electrode Materials)

Abstract

:
The constantly growing demand for renewable electrical energy keeps the continuation of battery-related research imperative. In spite of significant progress made in the development of Na- and K-ion systems, Li-ion batteries (LIBs) still prevail in the fields of portative devices and electric or hybrid vehicles. Since the amount of lithium on our planet is significantly limited, studies dedicated to the search for and development of novel materials, which would make LIBs more efficient in terms of their specific characteristics and life lengths, are necessary. Investigations of less industry-related systems are also important, as they provide general knowledge which helps in understanding directions and strategies for the improvement of applied materials. The current paper represents a comprehensive study of cubic Li2Fe1−xCoxSeO compounds with an anti-perovskite structure. These solid solutions demonstrate both cationic and anionic electrochemical activity in lithium cells while being applied as cathodes. Cobalt cations remain inactive; however, their amount in the structure defines if the Se0/Se2− or Fe3+/Fe2+ redox couple dominates the charge compensation mechanism upon (de)lithiation. Apart from that, cobalt affects the structural stability of the materials during cycling. These effects were evaluated by means of operando XRD and XAS techniques. The outcomes can be useful for both fundamental and practice-relevant research.

1. Introduction

Although known from the first half of the 20th century [1,2], anti-perovskites have started to attract a particularly high scientific interest relatively recently. Since technical progress is advancing, novel materials with various desired properties are required. Due to the enormous variety of possible chemical compositions, anti-perovskites may exhibit a broad range of properties [3]: superconductivity [4], zero thermal expansion [5], colossal magnetoresistance [6], or piezomagnetism [7]. These properties are of specific interest for both theoretical and experimental physicists, and allow us to consider anti-perovskites for a big variety of potential applications. Such features of anti-perovskites as electrocatalytic activity [8] and superior Li- [9] and Na-ion [10] conductivity exceeding the value of 10−3 S/cm at room temperature are valuable for electrochemists and battery researchers. In 2012, Li-rich anti-perovskites with a cubic Pm-3m crystal structure and general formula of Li3OHal (Hal stands for Cl, Br) were proposed as potential solid-state electrolytes for Li-ion batteries [9].
Five years later, non-isovalent substitution resulted in the Li2FeSeO and Li2FeSO compositions, which demonstrated the ability for reversible electrochemical extraction of lithium [11]. Remarkably, iron can be substituted by Co, Mn [12], and potentially by other 3d metals [13]. Theoretical calculations predicted more than 1.2 lithium ions per unit formula to be electrochemically removed without causing a structural collapse, which gives an impressive value of 275 mAh/g of specific capacity [13]. This capacity was also experimentally realized [14]. Since in Li2MChO (M–3d metal, Ch–S, Se), lithium and transition metals share the same crystallographic site (see Figure 1), one can expect a strong influence of M and Ch composition on the resulting electrochemical performance. Not only does it allow us to achieve the best electrochemical characteristics by tuning the chemical formula, it also opens a possibility for a fundamental understanding of how different electrochemically active species behave when combined together, making the cubic anti-perovskites a valuable model for compositional design of other battery-related materials (for example, high-entropy oxides [15]).
Earlier, we listed some experimental relationships while conducting a series of studies dedicated to the composition–performance correlation in Li2MChO [16,17,18,19]. Our results showed that even a slight amount of manganese leads to kinetically unfavourable two-phase reaction mechanism of lithium extraction/insertion and a poor rate capability, whereas a small amount of cobalt significantly improved the electrochemical performance [17]. Worth mentioning, it was possible to synthesize a complete row of Li2Fe1−xMnxSO solid solutions [16], but for the Li2Fe1−xCoxSO series, only a 10% substitution of Fe using Co was achieved. Apart from that, it was demonstrated that the Mn3+/Mn2+ redox couple participates less than Fe3+/Fe2+ in the electrochemical process, while Co remains completely inactive, serving mostly as a structural stabilizer [16,17].
The partial substitution of sulphur by selenium in Li2FeS1−xSexO led to enhanced structural stability during electrochemical cycling and visible gradual changes in the charge compensation mechanism with varying anionic compositions. Operando studies directly confirmed the participation of the Se0/Se2− couple in the electrochemical redox process [18].
Finally, the chemical flexibility of the cubic anti-perovskite system was investigated further. Six materials with a general formula Li2MSeO (M–Fe, Co, Mn or their 1:1 ratio) were comprehensively investigated, using DFT and experimental methods [19]. Theoretical calculations unequivocally confirmed the possibility for selenium to participate in the electrochemical process for all Li2MSeO compounds, which supported our earlier findings [18]. The most important outcome was experimentally confirmed, and a correlation between the cationic composition of anti-perovskites and their anionic electrochemical activity was proposed.
To summarize, we could conclude from the already mentioned series of previous works that all the listed ionic species, except for cobalt, participate in the charge-compensation mechanism. Iron was always anticipated to immediately oxidize upon lithium extraction, whereas manganese starts to oxidize when a significant Li amount is already removed from the crystal structure [16,17]. Selenium oxidizes as well, but it also serves as a structural stabilizer [18]. Cobalt remains inactive, and its role is mainly limited by structural stabilization upon lithium extraction [17,19], which correlates with its highest standard redox potential. However, until now, the impact of cobalt was not sufficiently investigated. In the current paper, we studied the role of cobalt for electrochemical performance more in detail, based on the Li2Fe1−xCoxSeO solid solutions.

2. Materials and Methods

2.1. Synthesis and Preliminary Characterization

Li2Fe1−xCoxSeO compounds were synthesized via a single-step solid-state reaction, in accordance with the procedure from [11,18,19]. The following reagents were used: Li2O (Thermo Fisher Scientific, German branch, 99.5%), Fe, Co, (Sigma Aldrich, German branch, 99%), and Se (Thermo Fisher Scientific, German branch, 99.5%). The obtained samples represented homogeneous dark-grey powders.
To ensure the phase purity, powder X-ray diffraction experiments (XRD) were conducted on a Stoe Stadi P diffractometer, using Co Kα1 radiation, a Ge (111) monochromator, and a Mythen 1K detector (Dectris, Switzerland), in the Debye–Scherrer method. The measurements were performed in sealed glass capillaries (Mark tubes, Glass No. 14, Hilgenberg, Germany) with 0.3 mm inner diameters. Profile fitting by the Le Bail method [20] was performed using Jana2006 [21].

2.2. Electrode Preparation and Electrochemical Studies

The electrode composites were made by mixing the Li2Fe1−xCoxSeO compounds with carbon black (Super P, Imerys, France) conductive additive and polytetrafluoroethylene (PTFE, Sigma Aldrich, German branch) binder in the mass ratio of 8:1:1, using an agate mortar. The mixture was subsequently pressed onto aluminium mesh, applying the pressure of 2.5 tons/cm2. As well as the syntheses, these manipulations were performed in an Ar-filled glovebox (MBraun, Germany) with O2 and H2O concentrations below 0.5 ppm. The assembled electrochemical cells were of the Swagelok® type. The glass fibre (Whatman, GF/D, Cytiva, German branch) served as a separator. The electrolyte was 1M LiPF6/EC:DEC, 3:7 in volume. Metallic lithium (99.9%, G-Materials) was used as a counter and reference electrode.
Galvanostatic cycling with a potential limitation (GCPL) was conducted using a thermostated VMP3 potentiostat (Biologic Instruments, France) at 298 K. A voltage window between 1.2 and 3.0 V vs. Li+/Li was set, as in our previous studies of anti-perovskites [14,16,17,18,19]. The rate capability was evaluated after 10 cycles at 0.2 C, 0.5 C, 1 C, and at 0.1 C. The C value, which is basically a theoretical specific capacity calculated from Faraday’s equation [22], corresponds to the charge transferred via 1 Li ion removed from the chemical formula unit, thus 0.1 C corresponds to a current density required to realize it within 10 h.

2.3. Operando Characterization at Synchrotron Radiation Facilities

Operando X-ray diffraction experiments were performed at beamline P02.1 (DESY, Hamburg, Germany) [23]. The wavelength was 0.20741 Å, and the data was collected using a Perkin Elmer XRD1621 CN3–EHS 2D detector (USA). For the determination of the wavelength, LaB6 reference material was used. Data integration from the 2D detector was performed in DAWN [24].
The preparation of the electrodes was realized in the same manner, but the Al-mesh with a bigger cell was used, so its contribution to the obtained diffraction patterns was minimized. Electrochemical cells were of coin-type 2032, with custom-made glass windows, allowing the beam through. The cells were put into an 8-fold rotating sample holder, connected to a VMP3 potentiostat (Biologic Instruments, France) [25]. Electrochemical cycling was performed at a 0.1 C current density, and one XRD pattern was obtained within 10 min, including all the necessary adjustments. The 2θ range was 0–23 degrees. A Le Bail and Rietveld [26] analysis of the obtained data was performed using Jana2006.
X-ray absorption spectroscopy (XAS) studies on the Se K-edge during the charge of the initially precycled electrochemical cells were carried out at the beamline P64 of DESY [27]. Si (111) was applied as a monochromator and data acquisition was conducted in transmission (using ionization chambers as detectors) and fluorescence yield mode (using a special PIPS detector). For XAS measurements, coin cells with custom-made Kapton windows were used. The recorded data were processed using the Demeter software pack (version 0.9.26) [28].

3. Results and Discussion

3.1. Initial Assessment of Materials Properties

A few basic considerations can be applied to formulate expectations from varying the chemical composition of the Li2MChO system. The first one is the Goldschmidt tolerance factor, which can be used as a simple criterium for structural stability [29]. For an ideal cubic lattice, it should be approaching the value of one, and for cubic anti-perovskites, it is calculated via the following formula:
t = r C h + r L i 2 M 2 ( r O + r L i 2 M )
Taking the corresponding ionic radii from [30], we obtain the values of about 0.90 for Li2FeSeO and 0.85 for Li2FeSO, which points to a generally low stability of both compounds. Indeed, the synthesis of both materials requires quite high temperatures, inert gas, and quenching [11,12]. However, it was shown that Se-containing compounds decompose slower when subjected to air [18], which correlates with the higher Goldschmidt factor. The replacement of iron by manganese or cobalt does not change its value significantly.
The second basic criterium is the standard redox potentials of the corresponding redox couples. We expect the redox couple with lower standard potentials to participate in the charge compensation first. Referring to the handbook [31], one can form the following row: Se (Se0/Se2−, −0.92 V vs. SHE), S (S0/S2−, −0.48 V vs. SHE), Fe (Fe3+/Fe2+, 0.771 V vs. SHE), Mn (Mn3+/Mn2+, 1.509 V vs. SHE), and Co (Co3+/Co2+, 1.808 V vs. SHE). Although the redox potentials of active species in anti-perovskites definitely differ from those in the book, these values allow us to assess the possible changes in the cell operation voltage on the assumption of an ionic model. Further, they enable us to presume which of the ionic species will oxidize first during lithium removal. Note that the comparison between 3D elements and S/Se is not as direct, since the oxidation of the latter might be a multielectron or multi-stage process. As mentioned earlier, the bifunctionality, implying cationic and anionic redox activity, was amply characterized for cubic Pm-3m Li2MSeO anti-perovskites. However, in Na2Fe2Se2O with an anti-Ruddlesden-Popper structure having the same electrochemically active species Fe and Se, the charge compensation is realized mostly through the anionic oxidation [32]. Therefore, despite being simple and generally suitable, the criterium of the standard redox potentials’ comparison is indirect. For the current system, we may expect the following charge-compensation mechanism (based on the Li2FeSeO example):
L i 2 F e 2 + S e O x + y L i + ( x + y ) e L i 2 x + y F e 2 + x S e y 2 O
The extraction of one Li from a formula unit would give a theoretical specific capacity of about 163 mAh∙g−1; however, our previous experiments confirmed the possibility of extracting more lithium, achieving values significantly higher than 200 mAh∙g−1, evidencing the redox bifunctionality of the Li2MSeO system [19]. One more point to note is that lithium deficiency may be observed for as-prepared samples [19]. As a consequence, specific discharge capacities might slightly exceed the values obtained on the charge.
Lastly, changes in the ionic radii of redox-active species are very important for the structural stability. As seen from [30], in the case of significant anionic electrochemical activity, the cubic Pm-3m structure will suffer from a significant distortion: Δr(Co3+/Co2+) = 0.075 Å, Δr(Fe3+/Fe2+) = 0.135 Å, Δr(Mn3+/Mn2+) = 0.185 Å, Δr(Se0cov/Se2−) = 0.78 Å, Δr(S0cov/S2−) = 0.79 Å. One should also note that Mn3+ cations are also expected to cause a lattice distortion due to the Jahn–Teller effect [33].

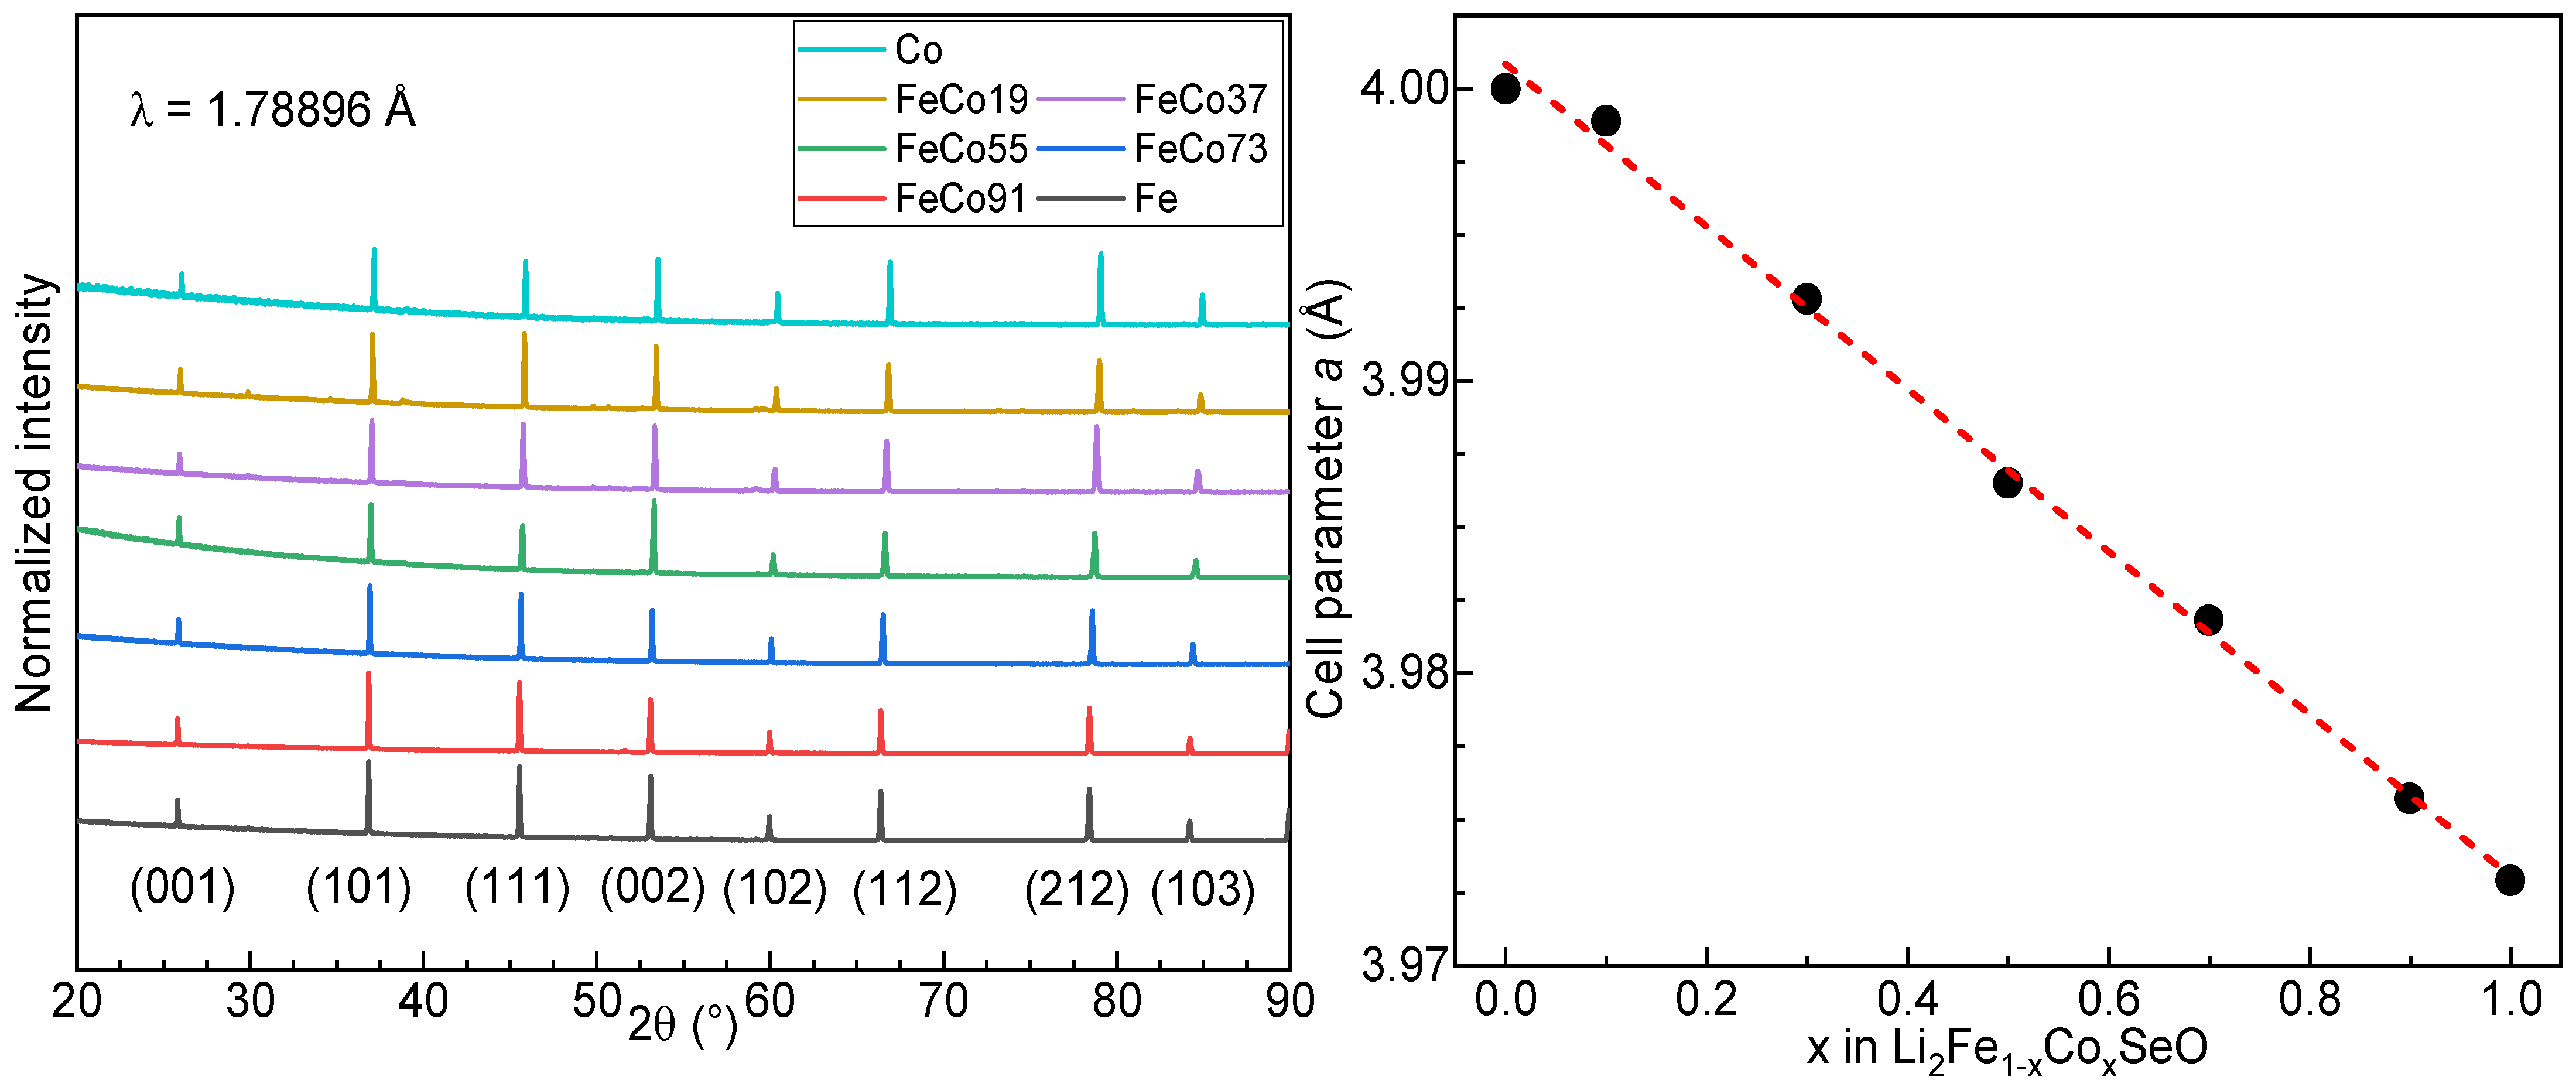
3.2. Powder X-ray Diffraction

The left panel of Figure 2 demonstrates the results of the powder X-ray diffraction experiment. No reflections belonging to any additional phases were detected on the diffractograms, except for Li2Fe0.1Co0.9SeO. However, in the latter, the amount of impurities is negligibly small. As the main focus of our work was put on the redox-reaction mechanism of the materials, no additional syntheses of Li2Fe0.1Co0.9SeO were conducted.
The right panel of Figure 2 shows the variation of the unit cell parameter depending on the amount of cobalt in the crystal structure. A linear decrease with an increasing amount of cobalt is observed since the ionic radius of Co, r(Co2+) = 0.745 Å, is smaller than of Fe, r(Fe2+) = 0.780 Å, for a six-fold coordination [30]). Therefore, corresponding reflections are shifted to higher angles, which correlates with the Vegard’s law [34] and may indirectly confirm the successful synthesis of the target compounds.

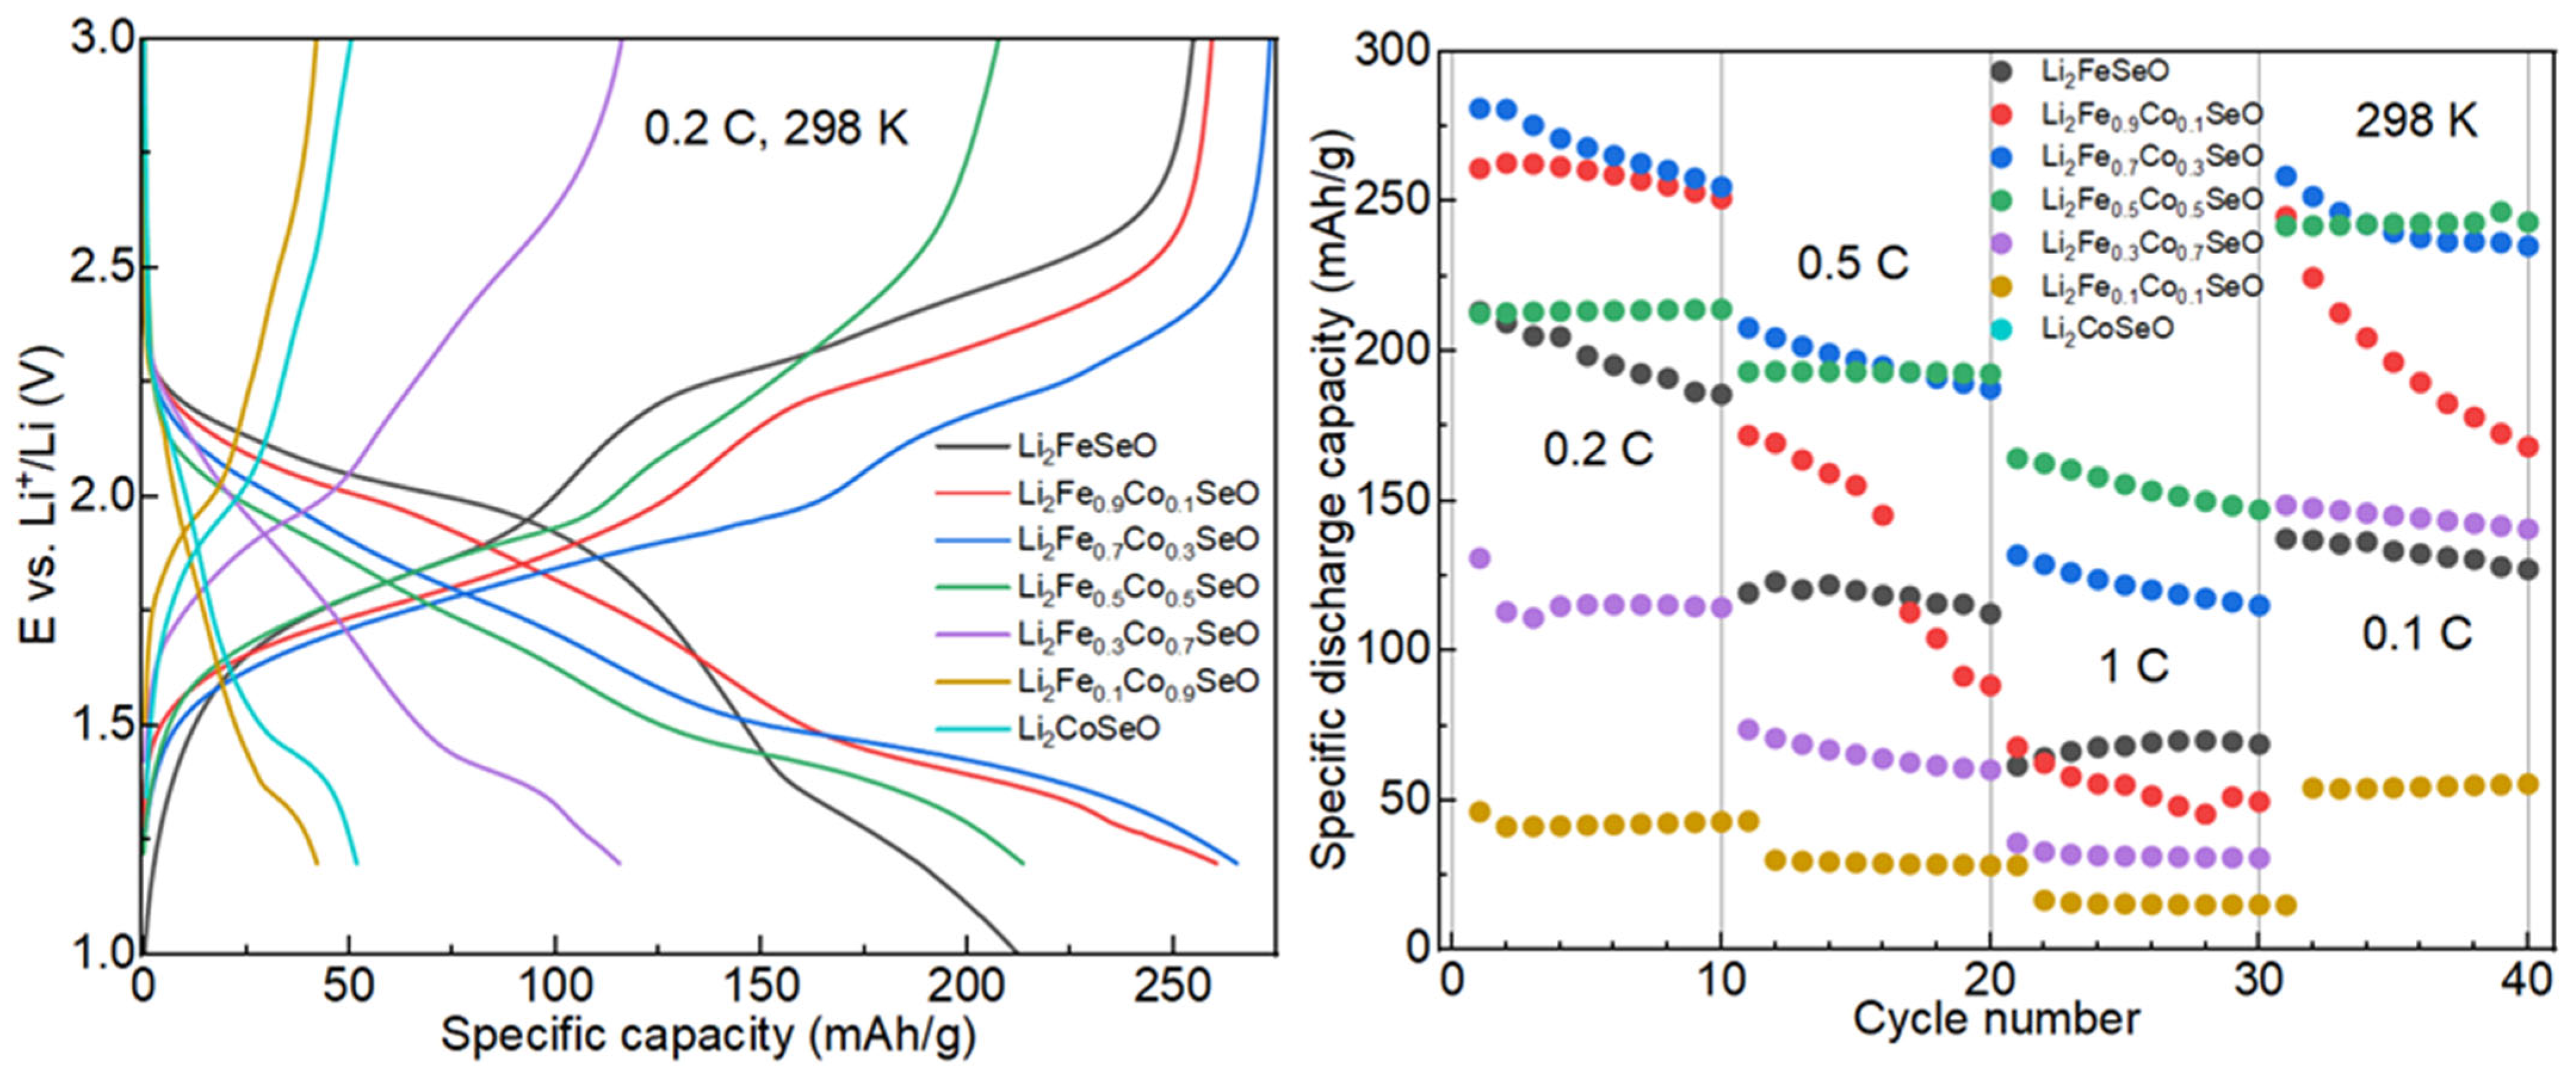
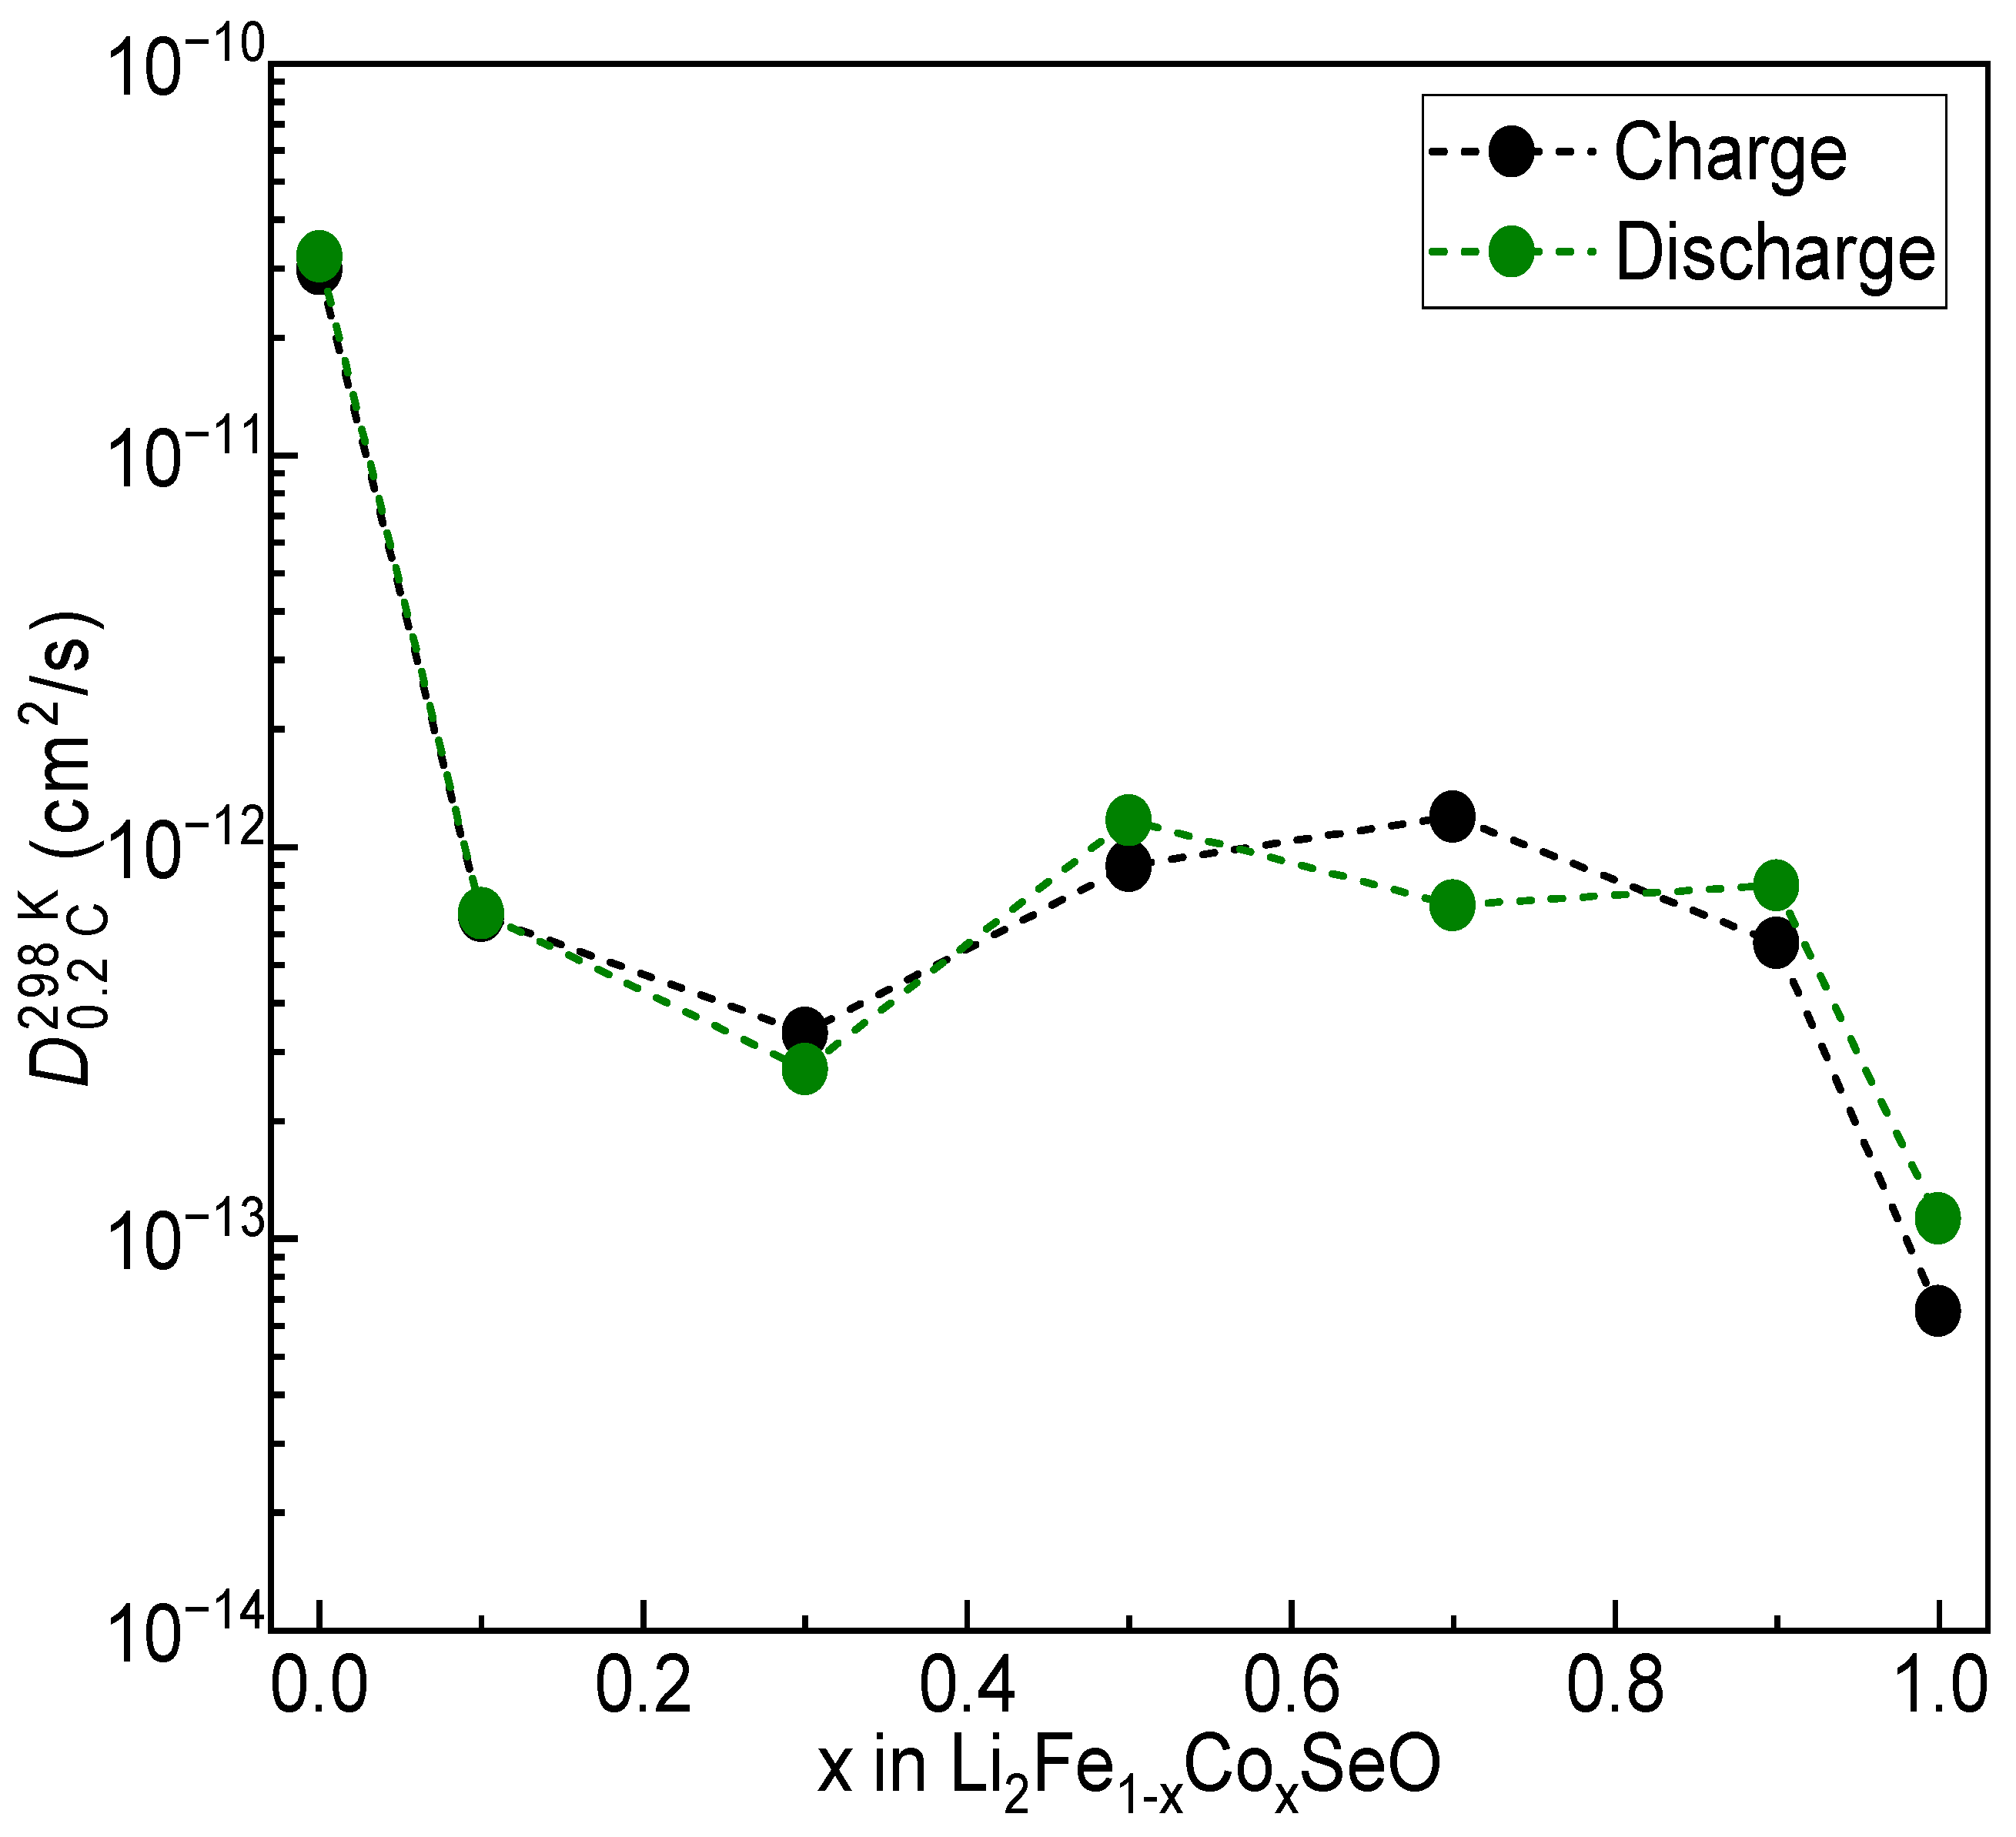
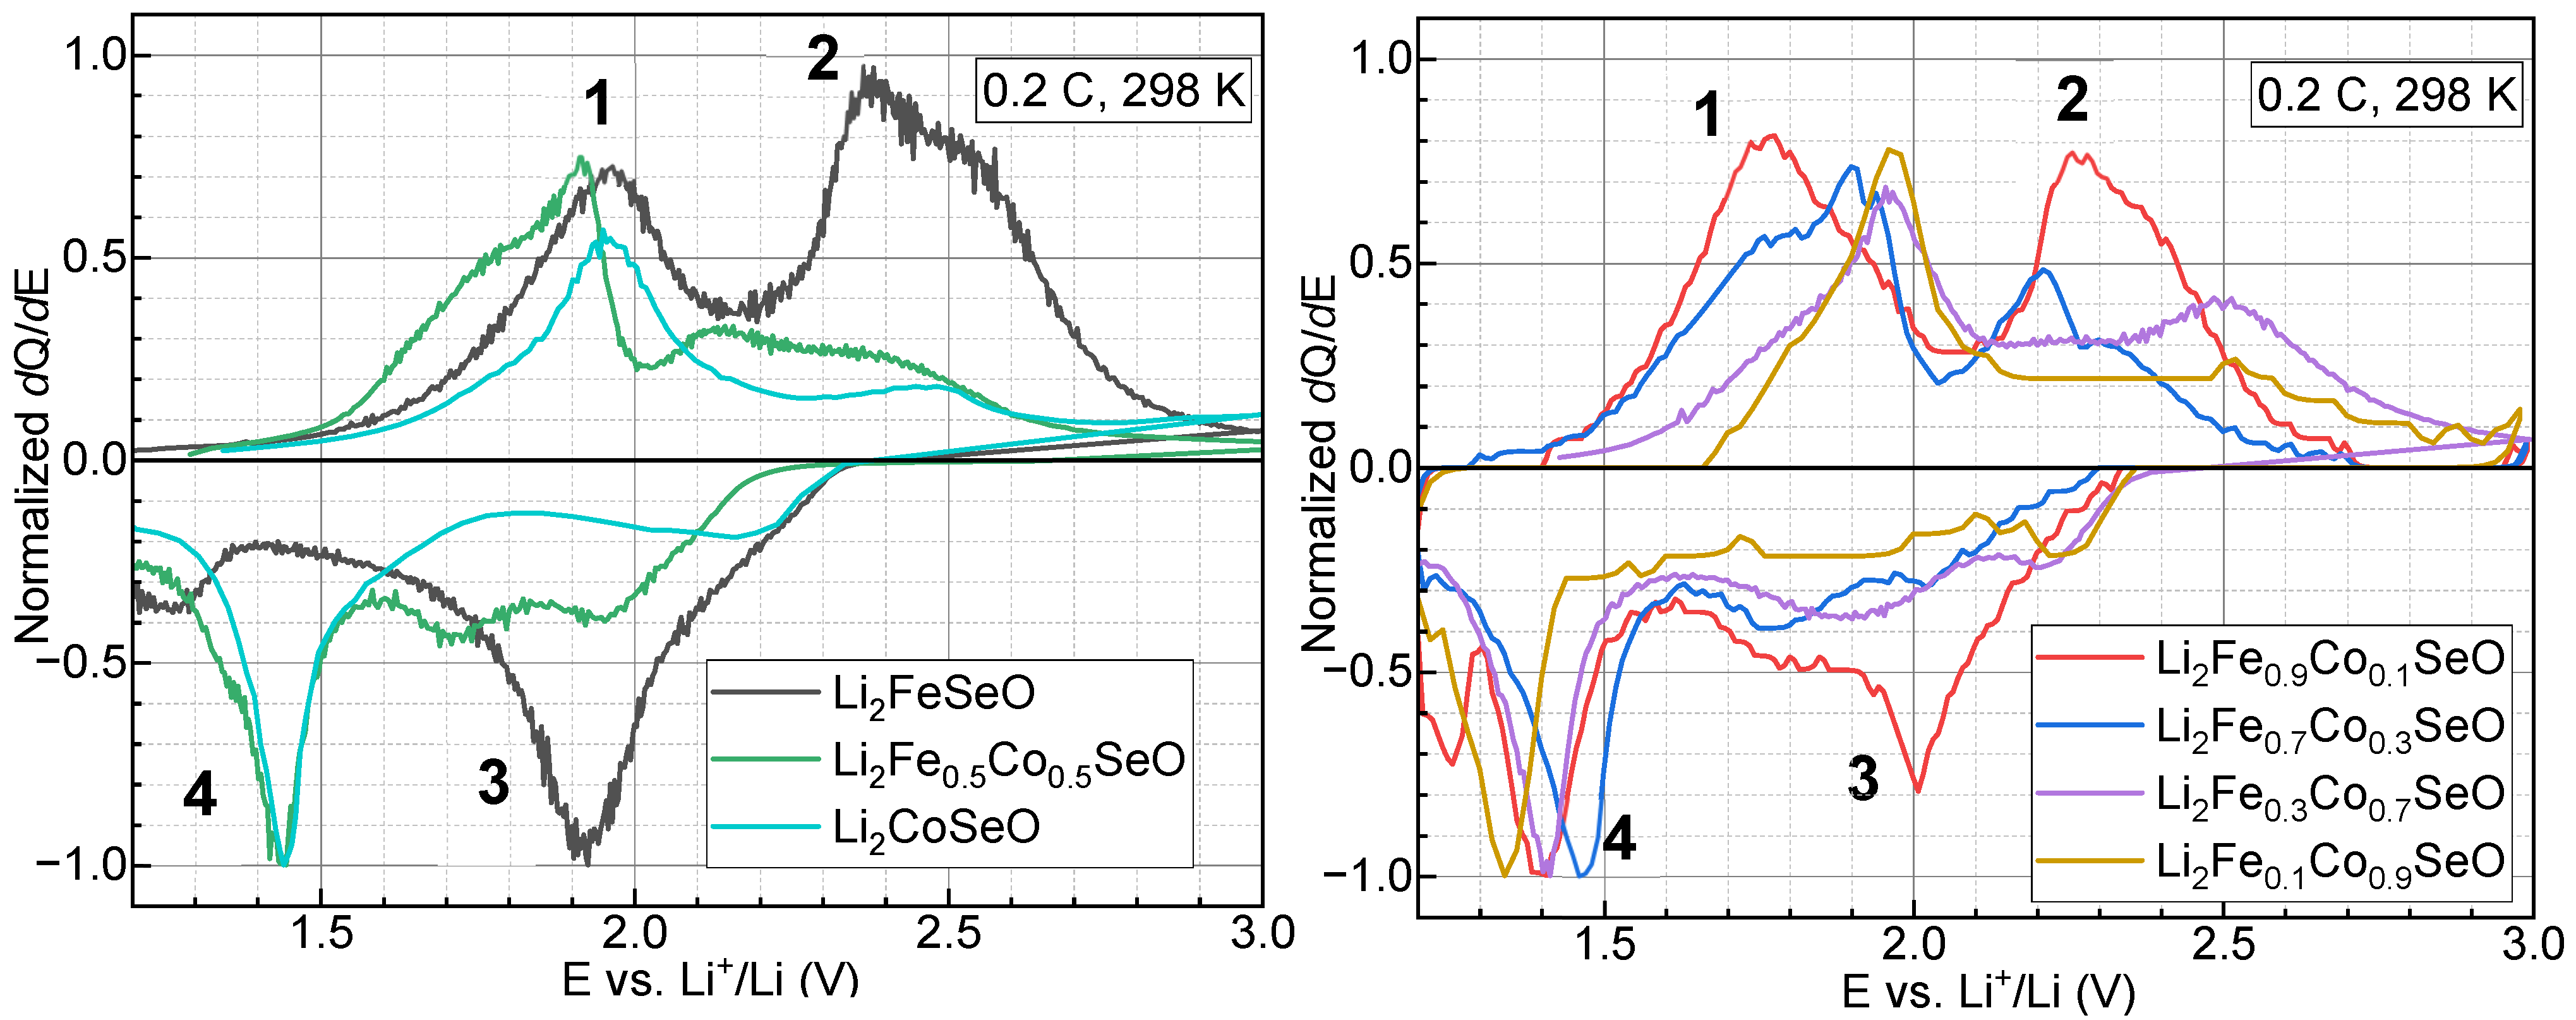
3.3. Electrochemical Properties

Electrochemical behaviour was found to change significantly with the introduction of cobalt into the system, similarly as it was observed earlier for sulphur-based compounds with a small amount of inserted Co [16]. The left-hand side of Figure 3 compares two end members of Li2FeSeO and Li2CoSeO, and the middle member of the solid solution row Li2Fe0.5Co0.5SeO. Differential capacity plots were obtained from the fifth cycle of each material at 0.2 C current density and normalized, considering the maximal value (in mAh/V) as one for each of the materials. One can see four main regions for Li2FeSeO: the first oxidation peak at about 1.9 V, the second oxidation peak (which can be considered a merge of two) laying between 2.3 and 2.6 V, a big reduction peak at 1.9 V, and finally, a small reduction peak at around 1.3 V. A potential hysteresis is present: a noticeable oxidation process occurs well above 2 V, whereas reduction is happening mostly below this value. For convenience, the redox peaks are marked with corresponding numbers, and further they will be addressed through them. Thus, most of the charge/discharge capacity is realized through processes 2 and 3 for Li2FeSeO.
In the case of Li2CoSeO, most of the capacity is delivered below 2.0 V on charge and below 1.5 V on discharge by processes 1 and 4, respectively. Our earlier studies have proved that cobalt remains electrochemically inactive [19]; therefore, the observed peaks might be attributed to a reversible electrochemical oxidation of selenium. If we refer to the values of the standard redox potentials, we would expect the average voltage of the Co-containing cell to decrease compared to the Li2FeSeO-based one. Interestingly, when the ratio between iron and cobalt is 1:1, the charge compensation process still seems to be dominated by selenium; however, processes 2 and 3 seem to be more dominant for Li2Fe0.5Co0.5SeO.
On the right-hand panel of Figure 3, one can see how increasing the amount of cobalt changes the ratio between the already denoted peaks. In total, 10% of cobalt on the 3d metal sites equalizes the contributions of oxidation peaks 1 and 2, and significantly increases the impact of process 4, making the corresponding peak better resolved and prevailing over peak 3. When the amount of cobalt becomes as high as 30%, charge–discharge is dominated by processes 1 and 4 at a lower average cell potential. With further increases in cobalt quantity, the tendency becomes clearer, and peaks 2 and 3 disappear almost completely. One should note that due to expected complications for selenium oxidation (it might represent a multistep process), some capacity is still delivered through stages 2 and 3 on the differential curves. Thus, our assumption is that the regions 2 and 3 represent a mixture of iron and selenium redox activity for Fe-containing compounds, whereas regions 1 and 4 correspond mostly to the redox of selenium. A decrease in the average cell discharge voltage with increasing cobalt amount is also visible from the left-hand panel of Figure 4.
Rate-capability tests (Figure 4, right) have shown a non-linear change in the stability of Li2Fe1−xCoxSeO solid solutions in dependence on the composition. The highest capacity value at a low current density of 0.2 C was measured for Li2Fe0.7Co0.3SeO, followed by Li2Fe0.9Co0.1SeO. At a current density of 1 C, Li2Fe0.5Co0.5SeO demonstrates the highest specific capacity, followed by Li2Fe0.7Co0.3SeO. The Li2Fe0.5Co0.5SeO composition also shows the best recovering property with high and stable capacity values after operation at different currents. Li2CoSeO exhibits the highest stability but the lowest capacities at all current densities. Generally, materials with a cobalt prevalence demonstrate moderate but stable capacity values.
Differential capacity plots without normalization (as illustrated in Figure S1 for Li2CoSeO) were used to calculate the apparent Li diffusion coefficients in the Li2Fe1−xCoxSeO row, applying the Randles–Ševčík equation [35]. The transition to the current I vs. square root of dE/dt dependence from the differential capacity dQ/dE is carried out in the following way: dQ/dE has a dimension of mAh/V. Knowing the current I from the galvanostatic experiment, we divide dQ/dE at the point of interest (namely, the maximal value for each of the compounds) by it. The resulting number has a dimension of h/V, which is reciprocal to the speed of voltage changing at this point. Graphs, showing the linear relationship between square root of voltage-changing rate and applied current for the upper mentioned points (also shown in Figure S1), prove the correctness of such calculations. The same approach was used in one of our earlier works dedicated to anti-perovskites [32]. The estimated diffusion coefficients are shown in Figure 5 for the current density of 0.2 C. Note that for each current density, the fifth cycle was used to consider the system stabilized. Here, we wish to clarify that instead of “true surface area” in the Randles–Ševčík equation, we used “geometrical surface area”, and one may suggest that the values are overestimated. However, since the electrodes were pressed onto mesh instead of coating, the actual geometrical area occupied by the active material would be significantly smaller than πR2. Additionally, the particle size of the studied powders is far from a nanometre scale; therefore, the error should not be high. In the end, we primarily evaluate the difference in the materials compared to each other, and for that purpose, our relatively rough estimation is meaningful.
Li diffusion coefficient values for the end members Li2FeSeO and Li2CoSeO are about 2 × 10⁻¹¹ and 8 × 10⁻¹⁴ cm2/s, respectively, slightly differing in charge and discharge. The obtained values are much lower than that of Li3OCh (Ch–Cl, Br) anti-perovskite superionic conductors [9], since for the latter, lithium diffusion through interstitial dumbbell mechanism [36] is not hindered by 3d metals, occupying the same crystallographic site. Interestingly, when both cobalt and iron are present in the structure, the diffusion coefficients do not change significantly with their ratio. With slight deviations, the values lay within one order of magnitude. Therefore, in addition to non-monotonous changes in specific capacity values, we observe non-monotonous changes in Li diffusivity: as in our previous studies, we show that there is no direct correlation between chemical composition, D value, and the resulting specific characteristics of cubic anti-perovskites [16,18]. More likely, the resulting battery behaviour is defined by the structural behaviour of the studied compositions.
Based on the results of electrochemical tests, we chose Li2Fe0.7Co0.3SeO and Li2Fe0.5Co0.5SeO for comparative operando structural studies. Part of the data obtained beforehand for the end members of the series [19] will also be discussed, to make the comparison more comprehensive.

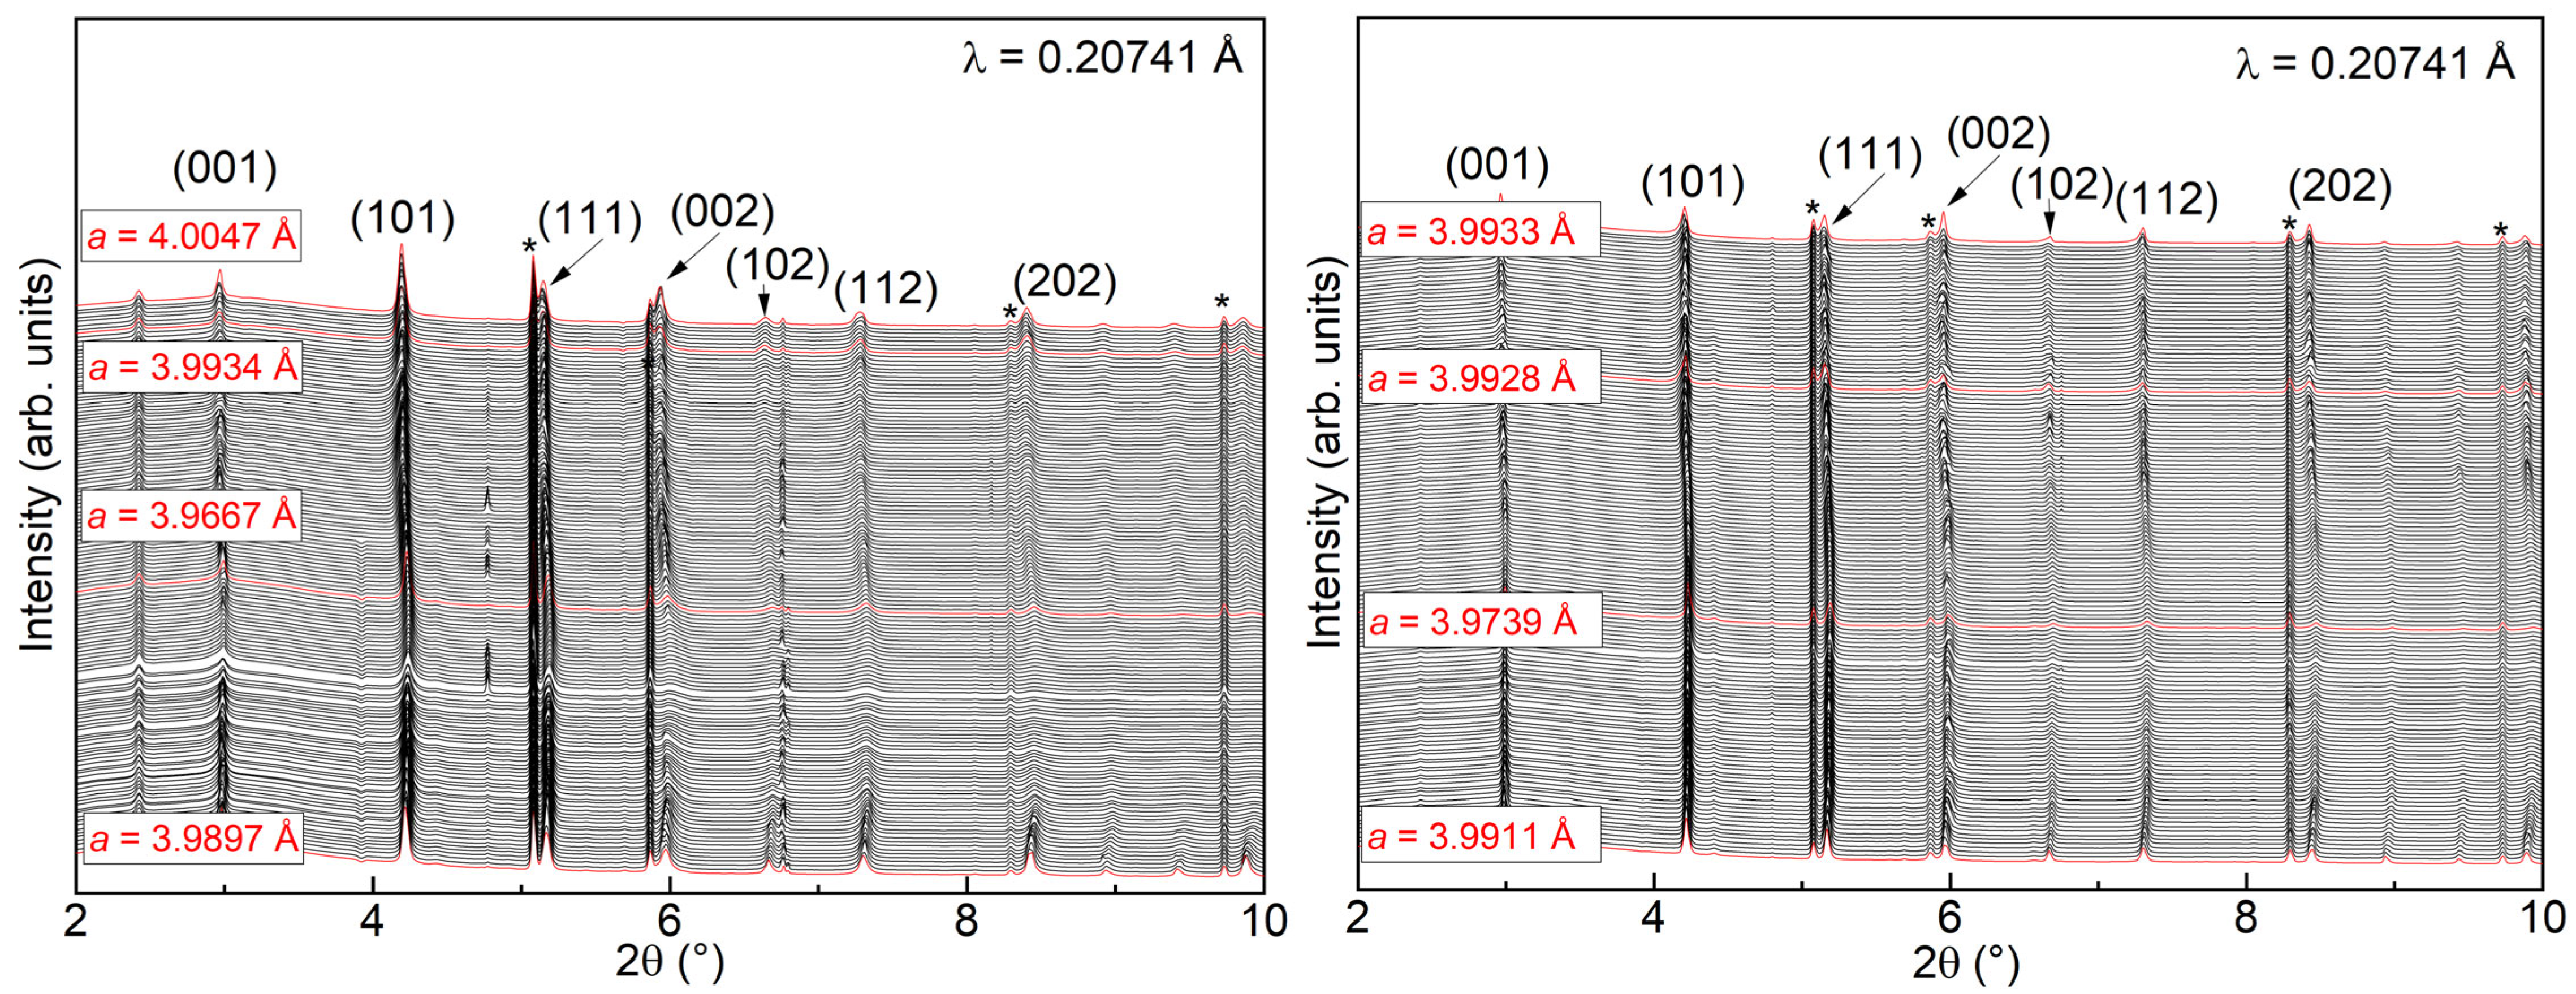
3.4. Operando X-ray Diffraction

X-ray diffraction patterns recorded operando during electrochemical charge and discharge point to a single-phase reaction mechanism of reversible lithium extraction for both Li2Fe0.7Co0.3SeO and Li2Fe0.5Co0.5SeO (see Figure 6). Both compositions reveal a unit cell shrinkage upon Li removal. However, a relative unit cell volume change for Li2Fe0.7Co0.3SeO (concerning the initial a value of 3.9911 Å) after delithiation reaches 1.29%, while for Li2Fe0.5Co0.5SeO (the initial a value is 3.9897 Å), it is 1.72% for the same amount of remaining lithium. Note that two effects contribute to the change of the cell metrics: a lattice shrinkage due to Li deintercalation and repulsion forces of chalcogenide-anions.
After returning to the initial stoichiometry after cell discharge, both materials exhibit an increase in their lattice parameters and subsequently, 0.27% of relative volume change for Li2Fe0.5Co0.5SeO and 0.13% for Li2Fe0.7Co0.3SeO. A peculiar fact is that the crystal structure of the latter is able to adapt more lithium than it was extracted with, with almost no change to the lattice parameter: when on discharge, the initial stoichiometry is regained, and the cell parameter is equal to 3.9928 Å. Afterwards, up to 0.4 extra Li per unit formula may be intercalated, but the cell parameter changes only to 3.9933 Å. Similar behaviour was observed for Li2Fe0.5Co0.5SeO, and its lattice parameter increased to 4.0047 Å after the insertion of 0.5 Li above the initial stoichiometry. Additionally, both materials regain their crystallinity completely after a completed charge–discharge cycle, and no additional phases form, even when Li stoichiometry is exceeded by a such a significant amount. Certain lithium deficiencies up to 10–12% observed earlier for some Se-containing anti-perovskites studied in [19] are not high enough to explain this peculiarity. The influence of the carbon-conducting additive should be excluded here, since for non-graphitic carbons, the Li intercalation potential lays way below 1.2 V [37].

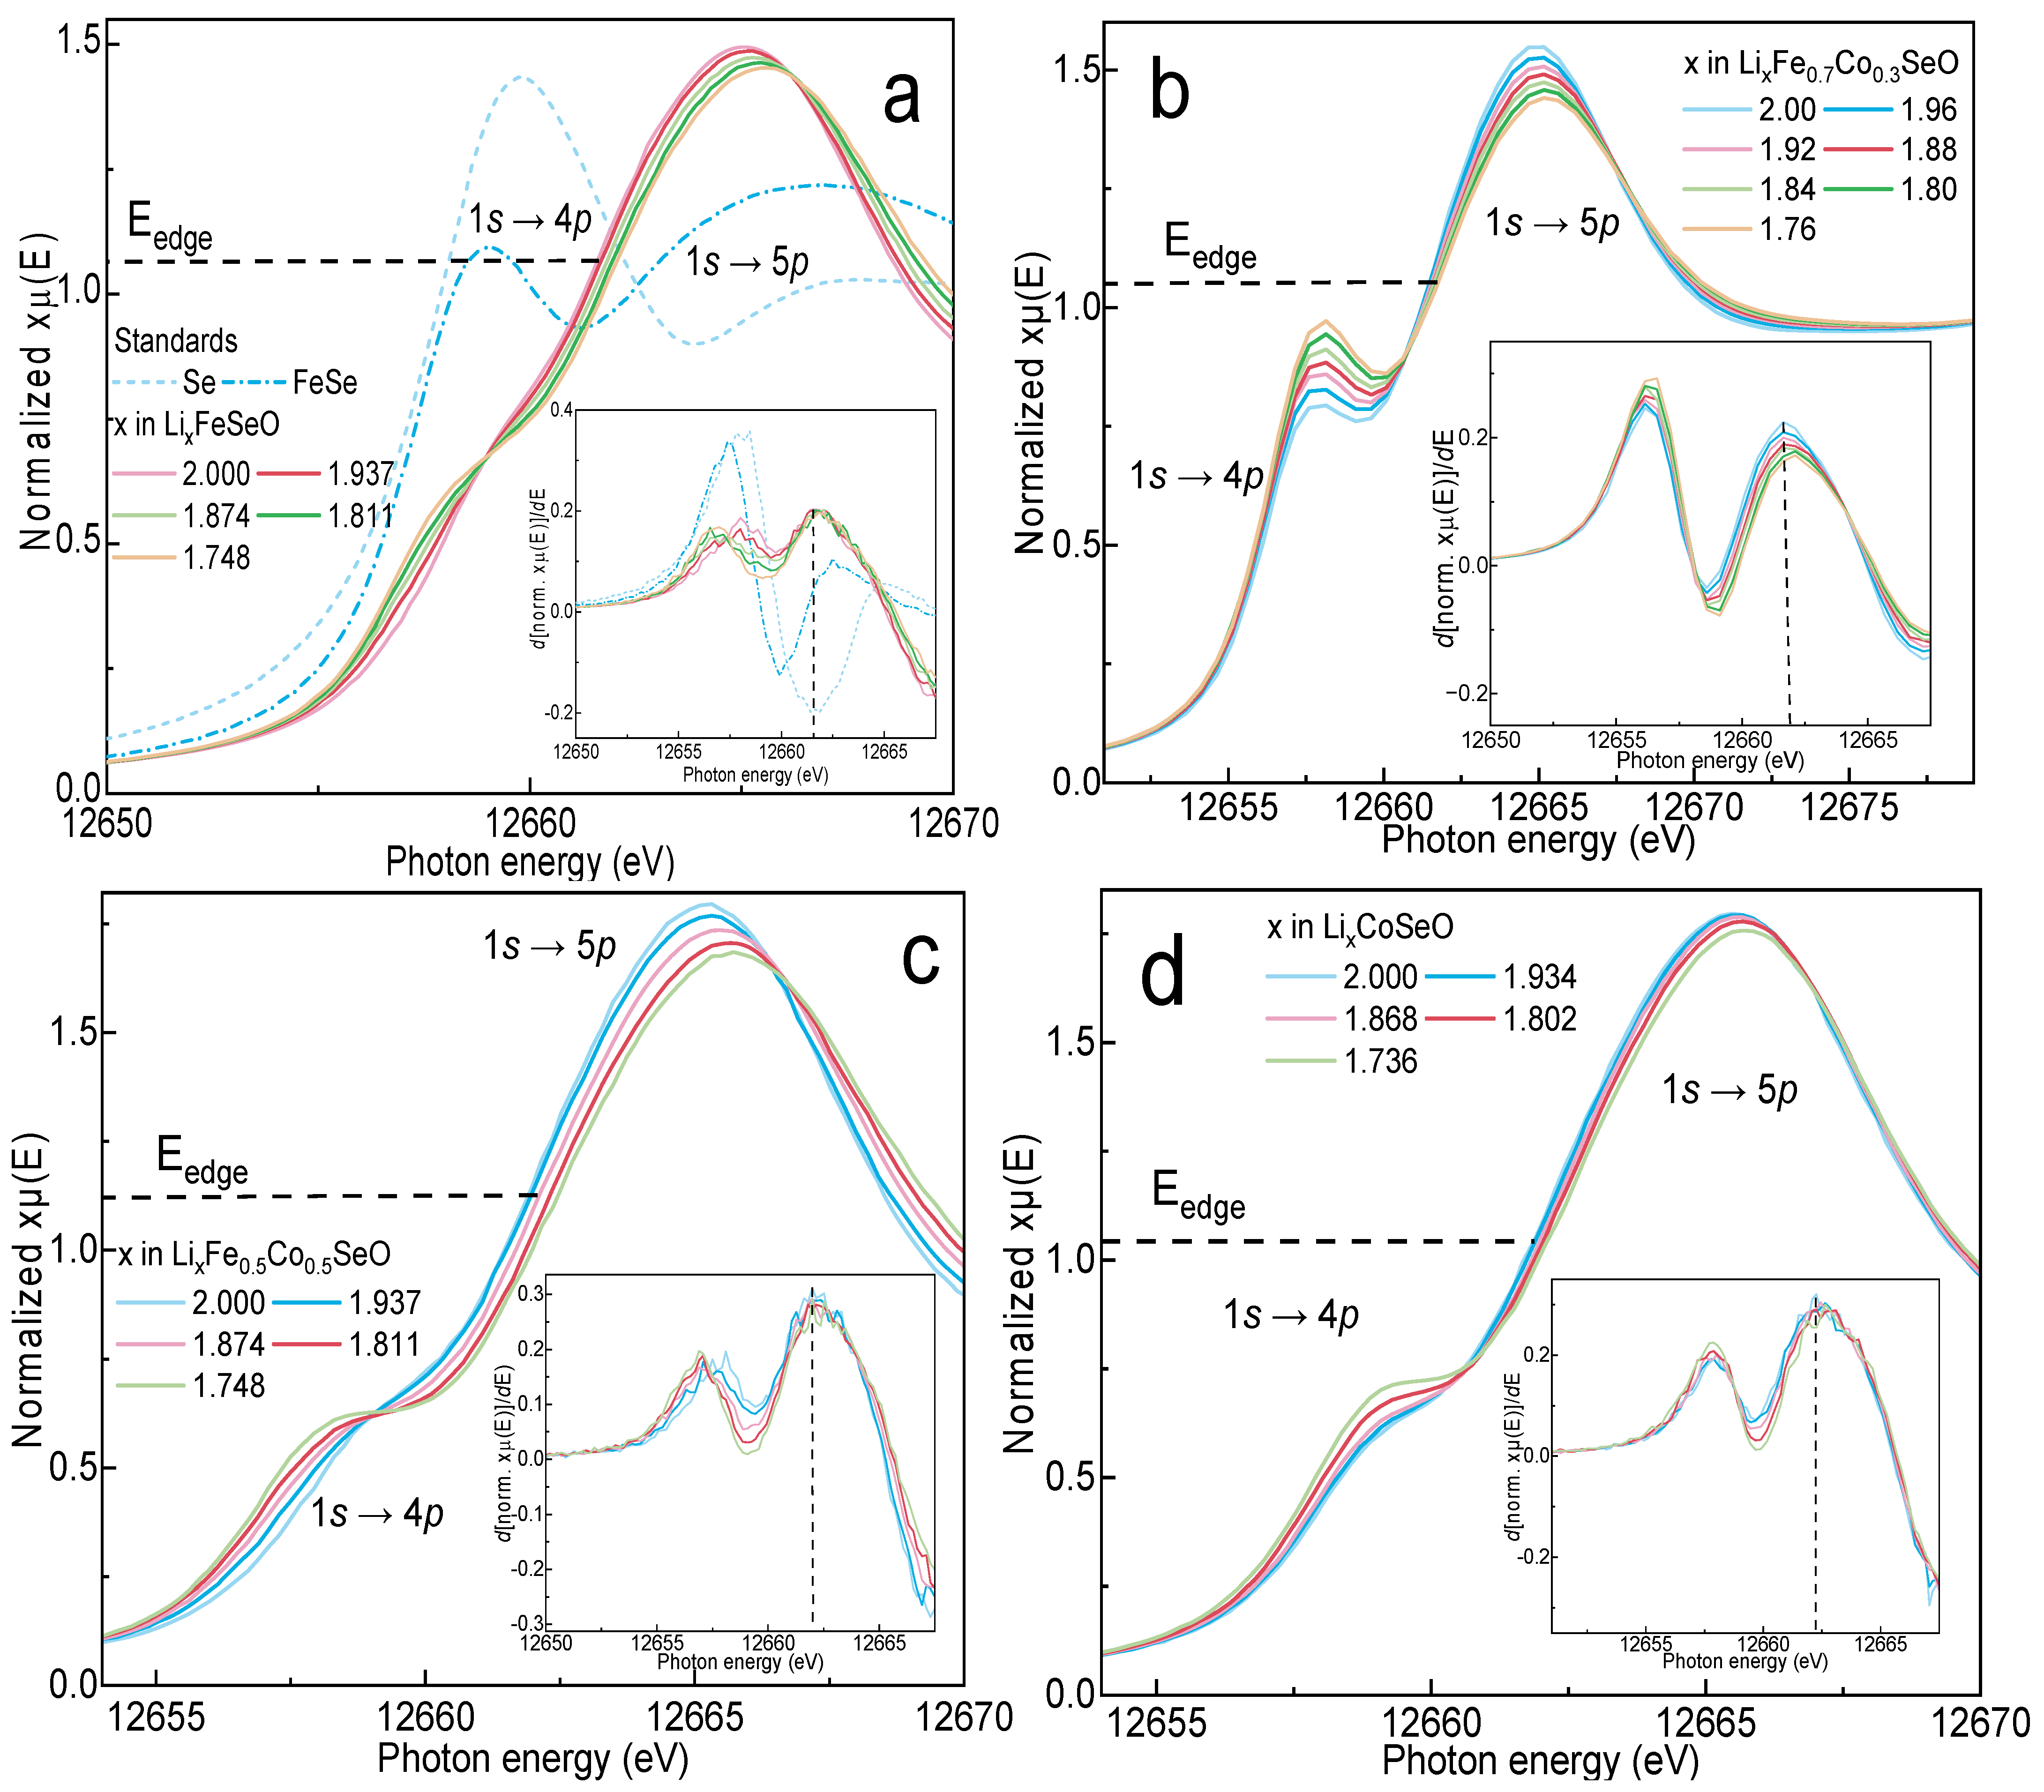
3.5. Operando X-ray Absorption Spectroscopy

The influence of cobalt amount in Li2Fe1−xCoxSeO on the redox behaviour of selenium was investigated using the XAS technique. Both samples, subjected to operando XAS, were charged again after conducting the operando XRD experiment. The point of interest here is the ratio between intensities of 1s → 4p and 1s → 5p electron transition. In the literature, there are various approaches to defining the Se K-edge position: either based on the 1s → 4p transition [38] or on the 1s → 5p one, considering the 1s → 4p as a pre-edge [39]. Actually, due to the strong hybridization between the 4p orbitals of Se and the 3d orbitals of a transition metal, the energy position of the 1s → 4p transition is strongly correlated with the oxidation state of the metal and a covalency degree of the metal–selenium bonds. In contrast, the energy position of the 1s → 5p transition depends more on the selenium oxidation state [39]. Therefore, we analysed the energy positions of both transitions; the results are presented in Figure 7. Additionally, Figure S3 is demonstrating the XAS spectra for Li2Fe0.5Co0.5SeO in the Fe K-edge and Co K-edge region. It confirms the initial valence states of 3d elements being close to 2+, and clearly ensures that, unlike iron, cobalt does not participate in the electrochemical redox process.
According to the Pauling electronegativity values for Li, Co, Fe, and Se of 0.98, 1.88, 1.83, and 2.55 [22,40], respectively, the Li–Se chemical bond remains on the verge of the empirical criterium for a typical ionic bond (the difference between electronegativities should be ≥1.9), whereas the Fe–Se and Co–Se bonds are more of a covalent type. Clearly, lithium removal would increase the amount of covalently bonded selenium, which would result in growing 1s → 4p feature, as it is shown for all studied Li2Fe1−xCoxSeO materials. Interestingly, this feature is more resolved for Li2Fe0.7Co0.3SeO, and it grows more significantly with lithium extraction compared to other compounds. This finding is probably associated with some electronic effects, as iron and cobalt have almost the same values of electronegativity.
The shift of the 1s → 5p electron transitions to a higher energy, which is attributed to the oxidation of the absorbing element [41], and is visible for all compositions, whereas the 1s → 4p peak mostly remains at the same energy with the delithiation of Li2Fe0.7Co0.3SeO and even shifts to lower energy values for other materials. Here, one should consider multiple factors. Firstly, it would grow in intensity with the oxidation of iron, since the interaction between the latter and selenium would become more covalent, as it is shown in work [39]. The oxidation of selenium would strengthen this effect. Secondly, the oxidation of iron would stabilize the iron 3d and selenium 1s orbitals, shifting the 1s → 4p electron transition to a lower energy [39]. The oxidation of selenium would then influence the pre-edge peak versatile: on the one hand, the oxidation of selenium would shift it to a higher energy and increase its intensity; on the other hand, the simultaneous oxidation of iron would shift it to a lower energy and also make the peak higher in intensity. Therefore, for Li2Fe0.7Co0.3SeO, we may assume an equal contribution of the mentioned phenomena.
For Li2FeSeO, we observe the prevalence of iron influence on the position of pre-edge on the energy grid. With the increasing amount of cobalt, selenium oxidation should become more dominant; however, for Li2Fe0.5Co0.5SeO, we still observe the shift of the 1s → 4p feature to the lower energy upon delithiation, whereas the 1s → 5p electron transition clearly shifts to the higher energy. For almost the same amount of Li extracted, the shifts are 0.48, 0.25, 0.60, and 0.24 eV for the compounds shown in panels a, b, c, and d of Figure 7, respectively. It is surprising that corresponding shift is higher for Li2FeSeO and Li2Fe0.5Co0.5SeO in comparison to Li2CoSeO, as Co was observed to be electrochemically inactive [19], and the whole charge compensation must be realised through the oxidation of selenium. One should note though that Se K-edge shifts were not assessed for high amounts of extracted lithium. In the end, it seems that also the position of the 1s → 5p electron transition on the energy grid depends on various factors, among which the oxidation state of Se is just the prevailing one, allowing for the comparison between compounds with the same elemental composition. However, the method of measuring how far the edge shifts on the energy grid upon oxidation is defined by multiple parameters, making the comparison between anti-perovskites with different cationic compositions challenging, especially for the low amount of lithium extracted.
These facts point to a non-linear dependence of the Se electrochemical activity on the amount of cobalt in the structure. The current finding is particularly interesting, because our earlier research showed that the general presence of cobalt “boosts” the anionic electrochemical activity of Pm-3m anti-perovskites [19]. However, it seems that not only its presence, but also its amount, plays an important role.

4. Conclusions

We studied correlations between changes in differential capacity plots of Li2Fe1−xCoxSeO anti-perovskites as cathodes in Li-based cells, their structural behaviour, and the electrochemical activity of selenium. It was shown that the introduction of a significant amount of cobalt (30%) shifts the electrochemical process to lower cell potentials; however, the influence is non-linear, and after reaching the amount of 50%, almost no changes occur. We believe that the high amount of cobalt in Li2Fe1−xCoxSeO makes the Se0/Se2− redox couple dominant in the charge-compensation process. Apart from that, the Li diffusion coefficient changes non-linearly with the composition.
Unlike Li2FeSeO, Co-containing materials do not decompose after the same amount of lithium is removed, as was proven by both XRD and XAS synchrotron studies, which points to the stabilizing role of cobalt in terms of structural behaviour during reversible delithiation, which is in agreement with the work [19].
Even though Li2Fe0.5Co0.5SeO showed the best performance during electrochemical cycling at higher current densities (0.5 C, 1 C), Li2Fe0.7Co0.3SeO indicates less structural stress upon reversible lithium removal, as its unit cell volume changes by only 0.13% after a complete charge–discharge cycle. This is twice lower than that for Li2Fe0.5Co0.5SeO. Moreover, although both materials are able to adopt significantly more lithium on discharge than would be expected by stoichiometry, almost zero lattice expansion is observed for LixFe0.7Co0.3SeO when x is formally equal to 2.4. The mechanism of such a peculiarity remains unclear and would possibly require more investigations, including theoretical methods. Currently, we can assume that Li2Fe0.7Co0.3SeO represents a combination of structural stability and a reasonable balance between cationic and anionic electrochemical activities, which results in this compound outperforming the others from the studied series. However, the latter is only relevant for low current densities.
Lastly, we demonstrated the non-linear influence of cobalt amount on the electrochemical activity of selenium by XAS experiments. As the oxidation of selenium is observed during the whole charge process, we suppose that oxidation of Fe and Se cannot be clearly separated in terms of cell voltages. However, the impact of each element might be distinguished: if the cell voltage is shifted to lower values, the capacity is mainly delivered by the selenium redox. Nevertheless, further DFT calculations are needed, which would allow us to explain the effect of Co introduction in the structure on the charge-compensation mechanism in Li2Fe1−xCoxSeO anti-perovskites in detail.

Supplementary Materials

The following supporting information can be downloaded at https://www.mdpi.com/article/10.3390/pr12040756/s1, Figure S1: (a–g) Linear relationship between the applied current and square root of voltage changing rate for Li2Fe1-xCoxSeO anti-perovskites at the maximal values of differential capacity plots. Panel h—dQ/dE plots for Li2CoSeO as an example; Figure S2: Voltage and x vs. time for (left) LixFe0.5Co0.5SeO- and (right) LixFe0.7Co0.3SeO-based operando cells; Figure S3: Part of XAS spectra recorded for Li2Fe0.5Co0.5SeO in (a) Fe K-edge and (b) Co K-edge, to evaluate the initial valence states and redox behaviours of 3d elements.

Author Contributions

Conceptualization, D.M.; methodology, M.V.G. and D.M.; software, M.V.G.; validation, D.M.; formal analysis, D.M.; investigation, M.V.G. and D.M.; resources, D.M.; data curation, M.V.G. and D.M.; writing—original draft preparation, M.V.G.; writing—review and editing, D.M.; visualization, M.V.G.; supervision, D.M.; project administration, D.M.; funding acquisition, D.M. All authors have read and agreed to the published version of the manuscript.

Funding

This work was funded by the IFW Dresden excellence program, German Federal Ministry of Education and Research (BMBF) in the project HeNa (03XP0390C), and by the German Research Foundation (DFG) in the project KIBSS (448719339).

Data Availability Statement

The raw data supporting the conclusions of this article will be made available by the corresponding author on reasonable request.

Acknowledgments

The research has benefitted from beamtime allocation at beamlines P02.1 and P64 at the PETRA III synchrotron (DESY, Hamburg, Germany).

Conflicts of Interest

The authors declare no conflict of interest.

References

  1. Krivovichev, S.V. Minerals with antiperovskite structure: A review. Z. Krist. 2008, 223, 109. [Google Scholar] [CrossRef]
  2. Pabst, A. The Crystal Structure of Sulphohalite. Z. Krist. 1934, 89, 514. [Google Scholar] [CrossRef]
  3. Dawson, J.A.; Farmprikis, T.; Johnston, K.E. Anti-perovskites for solid-state batteries: Recent developments, current challenges and future prospects. J. Mater. Chem. A 2021, 9, 18746. [Google Scholar] [CrossRef]
  4. He, T.; Huang, Q.; Ramirez, A.P.; Wang, Y.; Regan, K.A.; Rogado, N.; Hayward, M.A.; Haas, M.K.; Slusky, J.S.; Inumara, K.; et al. Superconductivity in the non-oxide perovskite MgCNi3. Nature 2001, 411, 54. [Google Scholar] [CrossRef] [PubMed]
  5. Huang, R.; Li, L.; Cai, F.; Xu, X.; Qian, L. Low-temperature negative thermal expansion of the antiperovskite manganese nitride Mn3CuN codoped with Ge and Si. Appl. Phys. Lett. 2008, 93, 81902. [Google Scholar] [CrossRef]
  6. Kamishima, K.; Goto, T.; Nakagawa, H.; Miura, N.; Ohashi, M.; Mori, N.; Sasaki, T.; Kanomata, T. Giant magnetoresistance in the intermetallic compound Mn3GaC. Phys. Rev. B Condens. Matter Mater. Phys. 2000, 63, 24426. [Google Scholar] [CrossRef]
  7. Lukashev, P.; Sabirianov, R.F.; Belashchenko, K. Theory of the piezomagnetic effect in Mn-based antiperovskites. Phys. Rev. B Condens. Matter Mater. Phys. 2008, 78, 184414. [Google Scholar] [CrossRef]
  8. Zhu, Y.; Chen, G.; Zhong, Y.; Chen, Y.; Ma, N.; Zhou, W.; Shao, Z. A surface-modified antiperovskite as an electrocatalyst for water oxidation. Nat. Commun. 2018, 9, 2326. [Google Scholar] [CrossRef]
  9. Zhao, Y.; Daemen, L.L. Superionic Conductivity in Lithium-Rich Anti-Perovskites. J. Am. Chem. Soc. 2012, 134, 15042. [Google Scholar] [CrossRef]
  10. Xu, Z.; Liu, Y.; Sun, X.; Xie, X.; Guan, X.; Chen, C.; Lu, P.; Ma, X. Theoretical design of Na-rich anti-perovskite as solid electrolyte: The effect of cluster anion in stability and ionic conductivity. J. Solid State Chem. 2022, 316, 123643. [Google Scholar] [CrossRef]
  11. Lai, K.T.; Antonyshyn, I.; Prots, Y.; Valldor, M. Anti-Perovskite Li-Battery Cathode Materials. J. Am. Chem. Soc. 2017, 139, 9645. [Google Scholar] [CrossRef] [PubMed]
  12. Lai, K.T.; Antonyshyn, I.; Prots, Y.; Valldor, M. Extended Chemical Flexibility of Cubic Anti-Perovskite Lithium Battery Cathode Materials. Inorg. Chem. 2018, 57, 13296. [Google Scholar] [CrossRef] [PubMed]
  13. Lu, Z.; Ciucci, F. Anti-perovskite cathodes for lithium batteries. J. Mater. Chem. A 2018, 6, 5185. [Google Scholar] [CrossRef]
  14. Mikhailova, D.; Giebeler, L.; Maletti, S.; Oswald, S.; Sarapulova, A.; Indris, S.; Hu, Z.; Bednarcik, J.; Valldor, M. Operando Studies of Antiperovskite Lithium Battery Cathode Material (Li2Fe)SO. ACS Appl. Energy Mater. 2018, 1, 6593. [Google Scholar] [CrossRef]
  15. Wang, J.; Dreyer, S.L.; Wang, K.; Ding, Z.; Diemant, T.; Karkera, G.; Ma, Y.; Sarkar, A.; Zhou, B.; Gorbunov, M.V.; et al. P2-type layered high-entropy oxides as sodium-ion cathode materials. Mater. Futures 2022, 1, 035104. [Google Scholar] [CrossRef]
  16. Gorbunov, M.V.; Carocci, S.; Gonzalez Martinez, I.G.; Baran, V.; Mikhailova, D. Studies of Li2Fe0.9M0.1SO Antiperovskite Materials for Lithium-Ion Batteries: The Role of Partial Fe2+ to M2+ Substitution. Front. Energy Res. 2021, 9, 657962. [Google Scholar] [CrossRef]
  17. Gorbunov, M.V.; Carrocci, S.; Maletti, S.; Valldor, M.; Doert, T.; Hampel, S.; Gonzalez Martinez, I.G.; Mikhailova, D.; Gräßler, N. Synthesis of (Li2Fe1–yMny)SO Antiperovskites with Comprehensive Investigations of (Li2Fe0.5Mn0.5)SO as Cathode in Li-ion Batteries. Inorg. Chem. 2020, 59, 15626. [Google Scholar] [CrossRef] [PubMed]
  18. Mohamed, M.A.A.; Gorbunov, M.V.; Valldor, M.; Hampel, S.; Gräßler, N.; Mikhailova, D. Tuning the electrochemical properties by anionic substitution of Li-rich antiperovskite (Li2Fe)S1−xSexO cathodes for Li-ion batteries. J. Mater. Chem. A 2021, 9, 23095. [Google Scholar] [CrossRef]
  19. Gorbunov, M.V.; Janson, O.; Stöber, M.; Baran, V.; Mikhailova, D. Correlation between Cationic Composition and Anionic Electrochemical Activity of Li2MSeO Anti-perovskites. J. Mater. Chem. A 2024. submitted. [Google Scholar]
  20. Le Bail, A.; Duroy, H.; Fourquet, J.L. Ab-initio structure determination of Lisbwo8 by x-ray powder diffraction. Mat. Res. Bull. 1988, 23, 447. [Google Scholar] [CrossRef]
  21. Petricek, V.; Dusek, M.; Palatinus, L. Crystallographic Computing System JANA2006: General features. Z. Krist. 2014, 229, 345. [Google Scholar]
  22. Faraday, M., VI. Experimental researches in electricity. Seventh Series. Philos. Trans. R. Soc. 1834, 124, 77. [Google Scholar]
  23. Dippel, A.-C.; Liermann, H.-P.; Delitz, J.T.; Walter, P.; Schulte-Schrepping, H.; Seecka, O.H.; Franza, H. Beamline P02.1 at PETRA III for high-resolution and high-energy powder diffraction. J. Synchrotron Radiat. 2015, 22, 675. [Google Scholar] [CrossRef] [PubMed]
  24. Filik, J.; Ashton, A.W.; Chang, P.C.Y.; Chater, P.A.; Day, S.J.; Drakopoulos, M.; Gerring, M.W.; Hart, M.L.; Magdysyuk, O.V.; Michalik, S.; et al. Processing two-dimensional X-ray diffraction and small-angle scattering data in DAWN 2. J. Appl. Cryst. 2017, 50, 959. [Google Scholar] [CrossRef] [PubMed]
  25. Herklotz, M.; Weiß, J.; Ahrens, E.; Yavuz, M.; Mereacre, L.; Kiziltas-Yavuz, N.; Dräger, C.; Ehrenberg, H.; Eckert, J.; Fauth, F.; et al. A novel high-throughput setup for in situ powder diffraction on coin cell batteries. J. Appl. Cryst. 2016, 49, 340. [Google Scholar] [CrossRef]
  26. Rietveld, H.M. A profile refinement method for nuclear and magnetic structures. J. Appl. Cryst. 1969, 2, 65. [Google Scholar] [CrossRef]
  27. Caliebe, W.A.; Murzin, V.; Kalinko, A.; Görlitz, M. High-flux XAFS-beamline P64 at PETRA III. AIP Conf. Proc. 2019, 2054, 060031. [Google Scholar]
  28. Ravel, B.; Newville, M. ATHENA, ARTEMIS, HEPHAESTUS: Data analysis for X-ray absorption spectroscopy using IFEFFIT. J. Synchrotron Radiat. 2005, 12, 537. [Google Scholar] [CrossRef] [PubMed]
  29. Goldschmidt, V.M. Die Gesetze der Krystallochemie. Naturwissenschaften 1926, 14, 477. [Google Scholar] [CrossRef]
  30. Shannon, R.D. Revised effective ionic radii and systematic studies of interatomic distances in halides and chalcogenides. Acta Crystallogr. A Cryst. phys. Diffr. Theor. Gen. Crystallogr. 1976, A32, 751. [Google Scholar] [CrossRef]
  31. Haynes, W.M.; Lide, D.R.; Bruno, T.J. Handbook of Chemistry and Physics; CRC Press: Boca Raton, FL, USA; London, UK; New York, NY, USA, 2015. [Google Scholar]
  32. Gorbunov, M.V.; Doert, T.; Mikhailova, D. Na2Fe2Se2O: A double anti-perovskite with prevalence of anionic redox activity in Na-ion batteries. Chem. Commun. 2023, 59, 13763. [Google Scholar] [CrossRef] [PubMed]
  33. Jahn, H.A.; Teller, E. Stability of Polyatomic Molecules in Degenerate Electronic States. I. Orbital Degeneracy. Proc. R. Soc. A 1937, 161, 220. [Google Scholar]
  34. Vegard, L. Die Konstitution der Mischkristalle und die Raumfüllung der Atome. Z. Phys. 1921, 5, 17. [Google Scholar] [CrossRef]
  35. Bard, A.J.; Faulkner, L.R. Electrochemical Methods: Fundamentals and Applications; John Wiley & Sons: New York, NY, USA, 2001. [Google Scholar]
  36. Emly, A.; Kioupakis, E.; Van der Ven, A. Phase Stability and Transport Mechanisms in Antiperovskite Li3OCl and Li3OBr Superionic Conductors. Chem. Mater. 2013, 25, 4663. [Google Scholar] [CrossRef]
  37. Alvin, S.; Cahyadi, H.S.; Hwang, J.; Chang, W.; Kwak, S.K.; Kim, J. Revealing the Intercalation Mechanisms of Lithium, Sodium, and Potassium in Hard Carbon. Adv. Energy Mater. 2020, 10, 2000283. [Google Scholar] [CrossRef]
  38. Cui, Y.; Abouimrane, A.; Lu, J.; Bolin, T.; Ren, Y.; Weng, W.; Sun, C.; Maroni, V.A.; Heald, S.M.; Amine, K. (De)Lithiation Mechanism of Li/SeSx (x = 0–7) Batteries Determined by in Situ Synchrotron X-ray Diffraction and X-ray Absorption Spectroscopy. J. Am. Chem. Soc. 2013, 135, 8047. [Google Scholar] [CrossRef]
  39. Henthorn, J.T.; Arias, R.J.; Koroidov, S.; Kroll, T.; Sokaras, D.; Bergmann, U.; Rees, D.C.; DeBeer, S. Localized Electronic Structure of Nitrogenase FeMoco Revealed by Selenium K-Edge High Resolution X-ray Absorption Spectroscopy. J. Am. Chem. Soc. 2019, 141, 13676. [Google Scholar] [CrossRef]
  40. Pauling, L. The Nature of the Chemical Bond, 3rd ed.; Cornell University Press: New York, NY, USA, 1960. [Google Scholar]
  41. Newville, M. Fundamentals of XAFS; Rev. 1.7; University of Chicago: Chicago, IL, USA, 2004. [Google Scholar]
Figure 1. Crystal structure of cubic Pm-3m Li2Fe1−xCoxSeO anti-perovskites. Oxygen is shown in red, lithium in yellow, iron/cobalt in green, and selenium in brown colour.
Processes 12 00756 g001
Figure 2. (Left) Powder X-ray diffractograms of the synthesized Li2Fe1−xCoxSeO compounds (S. G. Pm3m). “Fe” and “Co” in the labels correspond to Li2FeSeO and Li2CoSeO, respectively, and the abbreviation “FeCoXY” reflects the ratios of 3d metals. (Right) Linear change of the cell parameter (shown by black points) in dependence on the 3d metals ratio.
Processes 12 00756 g002
Figure 3. Normalized differential capacity plots for: (Left) the end members of the Li2Fe1−xCoxSeO row and Li2Fe0.5Co0.5SeO; (Right) the materials with unequal amounts of Fe and Co in the structure. Numbers 1–4 reflect the electrochemical processes discussed in the text.
Processes 12 00756 g003
Figure 4. (Left) typical galvanostatic charge–discharge curves for Li2Fe1−xCoxSeO solid solutions; (Right) results of their rate-capability tests. Note that for Li2FeSeO, the lower potential cut-off was moved to 1.0 V vs. Li+/Li as an attempt to increase its Coulombic efficiency towards 100%.
Processes 12 00756 g004
Figure 5. Diffusion coefficient vs. chemical composition for Li2Fe1−xCoxSeO solid solutions at 298 K.
Processes 12 00756 g005
Figure 6. X-ray diffraction patterns recorded operando for one complete charge–discharge cycle of (Left) Li2Fe0.5Co0.5SeO and (Right) Li2Fe0.7Co0.3SeO. Corresponding GCPL curves are available in SI (Figure S2). “*” symbols correspond to the signals from Al mesh.
Processes 12 00756 g006
Figure 7. Operando XAS studies of (a) Li2FeSeO, (b) Li2Fe0.7Co0.3SeO, (c) Li2Fe0.5Co0.5SeO and (d) Li2CoSeO on Se K-edge. The insets represent first derivatives of the corresponding spectra.
Processes 12 00756 g007
Disclaimer/Publisher’s Note: The statements, opinions and data contained in all publications are solely those of the individual author(s) and contributor(s) and not of MDPI and/or the editor(s). MDPI and/or the editor(s) disclaim responsibility for any injury to people or property resulting from any ideas, methods, instructions or products referred to in the content.

