Article

Fabrication and Characterisation of Sustainable 3D-Printed Parts Using Post-Consumer PLA Plastic and Virgin PLA Blends

by
Mohammad Raquibul Hasan
1,*,
Ian J. Davies
2,
Alokesh Paramanik
2,
Michele John
1 and
Wahidul K. Biswas
1,*
1
Sustainable Engineering Group, School of Civil and Mechanical Engineering, Curtin University, Bentley, WA 6102, Australia
2
School of Civil and Mechanical Engineering, Curtin University, Bentley, WA 6102, Australia
*
Authors to whom correspondence should be addressed.
Processes 2024, 12(4), 760; https://doi.org/10.3390/pr12040760
Submission received: 19 March 2024 / Revised: 5 April 2024 / Accepted: 7 April 2024 / Published: 9 April 2024

Abstract

:
Sustainable manufacturing practices are becoming increasingly necessary due to the growing concerns regarding climate change and resource scarcity. Consequently, material recycling technologies have gradually become preferred over conventional processes. This study aimed to recycle waste polylactic acid (PLA) from household-disposed cups and lids to create 3D-printed parts and promote sustainable manufacturing practices. To achieve this, the current study utilised virgin and post-consumer PLA (PC-PLA) (sourced from household waste) blends. The PC-PLA wastes were shredded and sorted by size with the aid of a washing step, resulting in a filament with a 1.70 ± 0.5 mm diameter without fragmentation or dissolution. A 50:50 wt.% blend of virgin PLA (vPLA) and PC-PLA was selected as the standard recycling percentage based on previous research and resource conservation goals. The study investigated the impact of three 3D printing parameters (layer height (LH), infill density (I), and nozzle temperature (NT)) on the quality of 3D-printed parts using a three-level L9 Taguchi orthogonal array. The findings revealed that blending PC-PLA with vPLA led to significant improvements in tensile, flexural, and impact strengths by 18.40%, 8%, and 9.15%, respectively, compared to those of recycled PLA (rPLA). This conclusion was supported by the investigation of the fracture surface area, which revealed fractographic features associated with printing parameters, such as plastic deformation and interfilament debonding. An ANOVA analysis revealed a positive influence of a greater layer height and high nozzle temperature on mechanical properties. Subsequently, the optimal printing parameters (LH: 0.3 mm, I: 100%, and NT: 215 °C) were determined using the S/N ratio, and a confirmation test using the optimum printing parameters exhibited a strong correlation with the statistically predicted outcomes. Finally, the study used optimum printing parameters to fabricate 100% PC-PLA 3D-printed parts, demonstrating their potential for low-strength applications. The findings suggest that employing vPLA and PC-PLA blended filaments for fabricating 3D-printed components presents an effective means of promoting plastic recycling within a closed-loop recycling system and achieving a circular economy.

1. Introduction

Plastics, whilst commonly utilised in human life, have been identified as long-lasting pollutants in the environment [1]. Plastics are utilised in several aspects of life, such as clothes, electronics, toys, healthcare supplies, and food packaging [2]. In 2022, approximately 400 million tons of plastic were produced worldwide, using a significant share of crude oil [3]. The majority of current polymer and plastic materials are derived from non-renewable petrochemical resources, which is not a sustainable solution in the long term. The continued increase in plastic production will lead to the depletion of fossil fuels and negatively impact the economy and human livelihoods. In addition, plastic production and disposal release greenhouse gases (GHGs) and contribute to global warming [4]. The decomposition of plastics in landfills takes 10–450 years and significantly contributes to water and environmental pollution [5,6]. Furthermore, the production and disposal of plastics consume a considerable amount of energy [6].
The efficient management of plastic waste in daily life is crucial for environmental conservation and the ecological well-being of future generations. Reusing and recycling plastic products can significantly contribute to achieving a circular economy (CE), offering benefits such as reducing dependence on virgin non-renewable resources, minimising waste, enhancing resource efficiency, and fostering a sustainable recycling ecosystem [7,8,9,10]. Integrating plastic recycling into a closed-loop system could enhance waste management. Closed-loop recycling repurposes post-consumer (PC) plastic materials, such as industrial parts or household waste, to create new products with similar properties, thereby ensuring a circular flow of resources [8]. Under these circumstances, PC plastic waste has drawn considerable attention from researchers, governments, and industries. Therefore, recycling PC waste could play a significant role in improving natural resource utilisation efficiency and mitigating the adverse environmental impacts of plastics [11,12,13].
Various methods for recycling plastic waste, including bioconversion [14], dissolution recycling, injection moulding [15], mechanical recycling [16], additive manufacturing (3D printing) [17], and other similar approaches, have been developed to improve our ability to manage plastic waste and contribute to a sustainable future [1]. Among these technologies, 3D printing has gained widespread acceptance as the optimal solution for producing functional components in various industries, including unmanned aerial vehicles (UAVs), aerospace, civil engineering, agriculture, bioprinting, biomedical engineering, biomedicine, membrane technology, multi-material components, metal matrix composites, and food production [18,19].
The use of recycled polymers in additive manufacturing (AM) has been identified as a potential solution to extend the lifespan of plastic items [7]. AM enables the fabrication of recycled plastic filaments and produces no scraps or solid wastes, thereby establishing a closed-loop supply chain that conforms to the principles of the CE or reduces both sink and source. This approach not only reduces plastic waste but also adds value by reusing PC plastic to create new useable products while simultaneously lowering levels of energy consumption and GHG emissions [20]. Many AM techniques have been developed, and the most popular method is fused deposition modelling (FDM) additive technology. This technology involves the continuous feeding of a thermoplastic filament into the printer, heating it until it melts, extruding the material through a heated nozzle, and depositing it onto a printing platform [21].
Acrylonitrile butadiene styrene (ABS), polylactic acid (PLA), polyethylene terephthalate (PET), and polycarbonate (PC) are commonly used polymer materials for FDM [22,23]. Among these, PLA has gained significant popularity due to its biodegradable nature [24,25]. Specifically, PLA production requires 65% less energy and generates 68% less GHG than traditional plastics. Moreover, PLA is highly recyclable and contains no toxins, making it a potential candidate for replacing traditional plastics [25,26]. The global production capacity of PLA is expected to reach approximately 677,000 metric tons by 2023, reflecting its growing popularity as a sustainable alternative to conventional oil-based plastics [27]. However, the biodegradability of PLA presents challenges for appropriate disposal, as it takes several years to degrade in the environment (between 3 and 5 years) [13,28]. Additionally, PLA made from corn and sugarcane can cause a “food vs. filament” issue as it not only creates pressure on cultivable land but could affect food scarcity unless this biobased filament is recycled. Furthermore, the weaknesses of pure PLA polymers, including their poor mechanical strength, brittleness, low ductility, poor thermal stability, and narrow processing window, have limited their application [29].
Some of these weaknesses can be overcome by selecting optimal printing parameters to obtain the required mechanical properties [30,31]. This is important as the growing market volume of PLA has prompted ongoing efforts to reprocess and recycle PC-PLA. Beltran et al. [32] observed a minor influence of mechanical recycling on the thermal, structural, and mechanical properties of PLA, indicating the reusing capability of recycled PLA in low value-added applications such as packaging. However, the repeated extrusion cycling of virgin PLA could steadily increase the melt flow rate (MFR) of the reprocessed samples, resulting in a decrease in the tensile and impact strengths [33]. Similarly, Pillin et al. [34] found a notable reduction in tensile strength upon repeated injection moulding of PLA. In addition, Zhao et al. [35] found that the recyclability of PLA in 3D printing decreased significantly after only two reprocessing cycles, causing a significant deterioration in the polymer properties and viscosity.
Therefore, blending recycled plastics with virgin plastics could be a straightforward approach to recover the properties of recycled polymers, reduce plastic waste, and save fossil fuels by lessening the conversion of petroleum products to produce virgin plastics [1,9,23,31]. Although the strength of the filament decreased with an increase in the recycled material [36,37], Bergaliyeva et al. [38] found that the strength of the blend specimens increased with an increase in the recycled content. However, further studies are required to analyse the impact of the process parameters on blend-printed specimens, as these studies did not address this research gap.
The fabrication of blend filaments is a fundamental step in FDM 3D printing and requires precise adjustment of extrusion parameters such as screw speed and temperature to ensure a high level of accuracy in the final printed products [38]. These extruder parameters are experimentally fine-tuned and may vary accordingly. In addition, design of experiments (DoE), particularly the Taguchi method, is commonly employed to optimise printing parameters and enhance physical properties [39,40,41,42]. Through this method, researchers achieve the desired performance by identifying key influencing factors and conducting experiments and analyses accordingly, thereby demonstrating the reliability and maturity of this approach [29].
The existing literature on 3D printing has primarily focused on limited production orientations, which hinder our understanding of anisotropic behaviour and material degradation. Therefore, a detailed study on the implementation of blended PLA filaments in 3D printing is necessary. This study aimed to bridge the existing gap by examining the implementation of blended PLA filaments, specifically incorporating PC-PLA with vPLA. The resulting physical and mechanical characteristics of 3D-printed components at various printing temperatures were carefully determined. It is noteworthy that relatively few investigations have been carried out regarding the effects of printing temperature on the 3D printability of vPLA/PC-PLA blends. This research aimed to contribute valuable insights into the effects of printing temperature on the quality of 3D-printed parts using a 50:50 wt.% blend of 100% virgin commercial PLA pellets and PC-PLA waste. This research provides in-depth information on material fabrication and characterisation, which will offer additional insights for the manufacturing of blended PLA filaments.

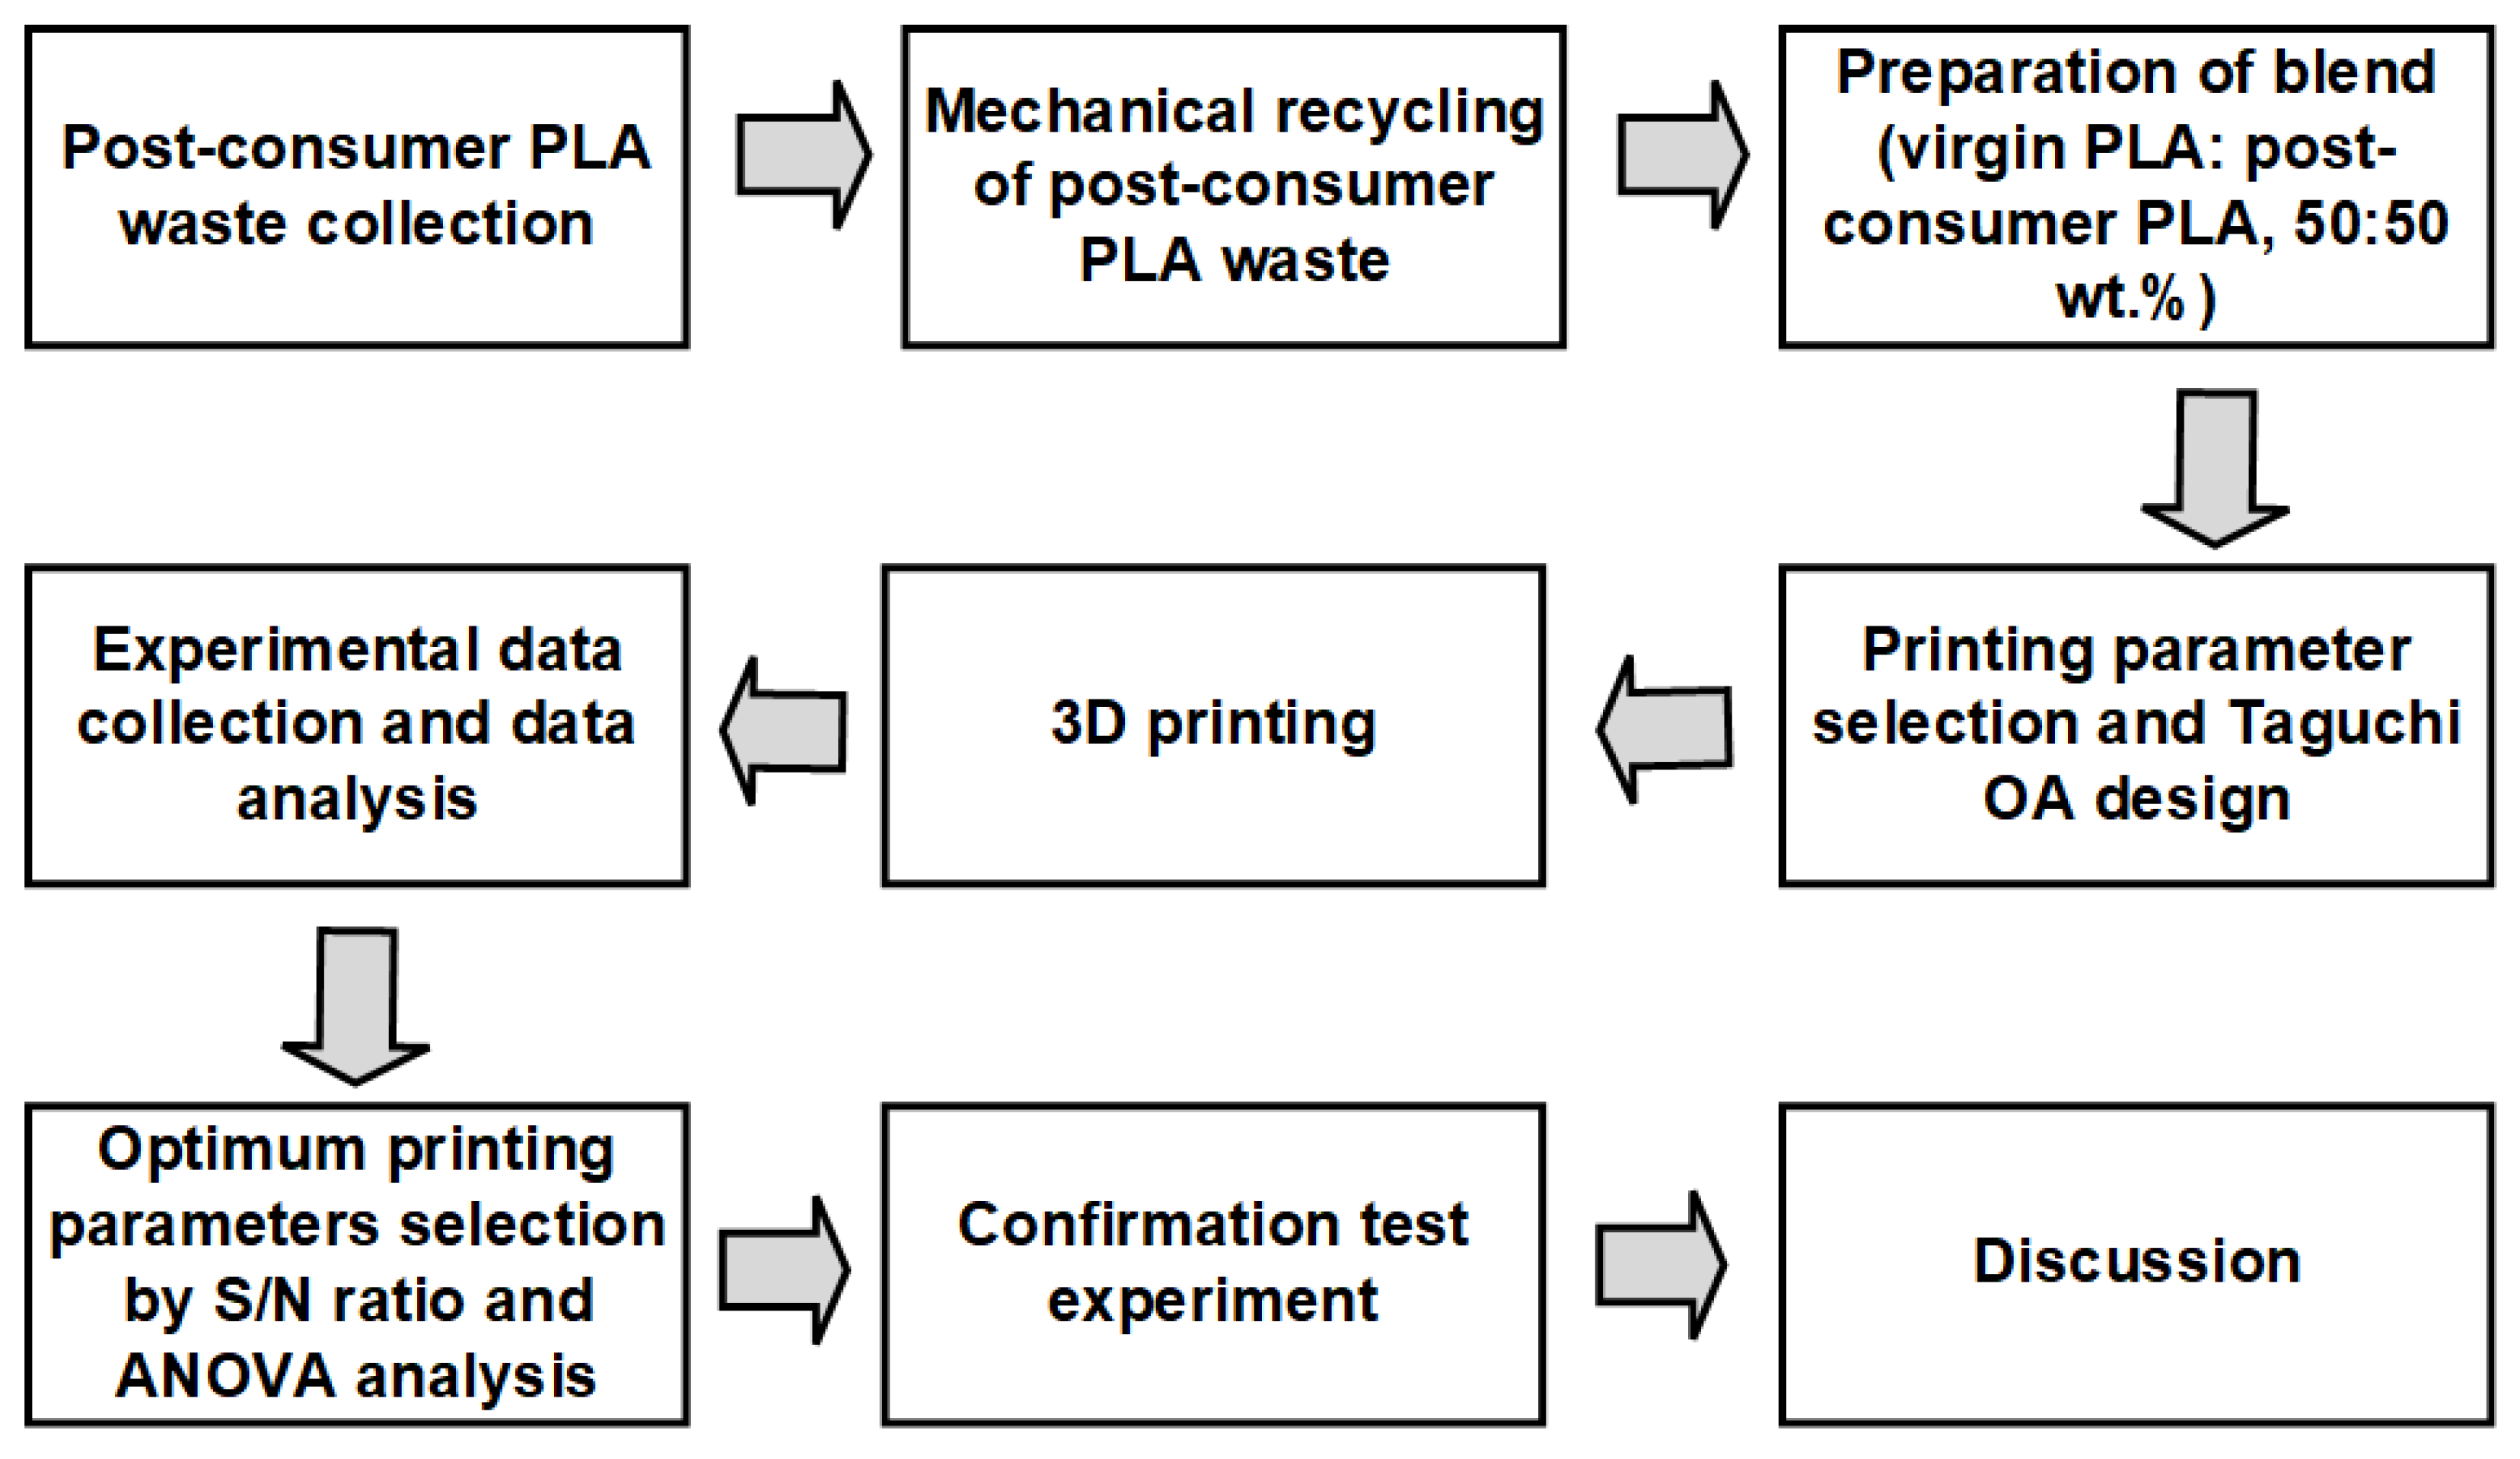
2. Materials and Methods

A systematic approach was employed to manufacture eco-friendly 3D-printed components from PC-PLA, as depicted in Figure 1. This method was implemented to achieve sustainable 3D printing practices by minimising plastic waste and promoting the use of environmentally friendly materials. The detailed methodology employed for the production of the PC-PLA filament included material selection for filament extrusion, printing parameter selection, mechanical property testing, and optimisation of process parameters.

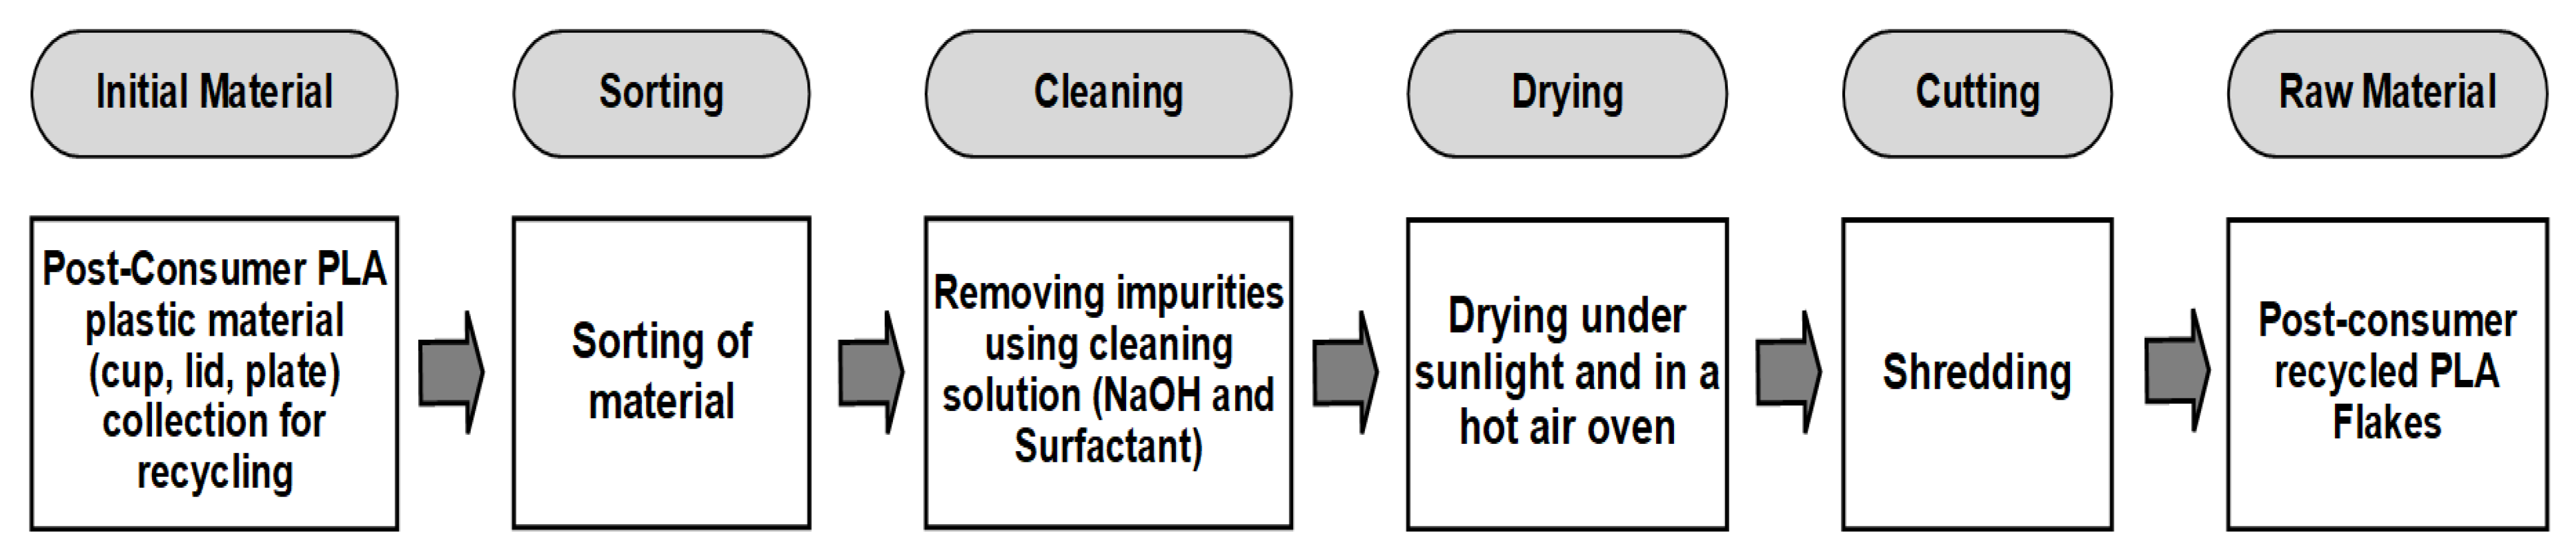
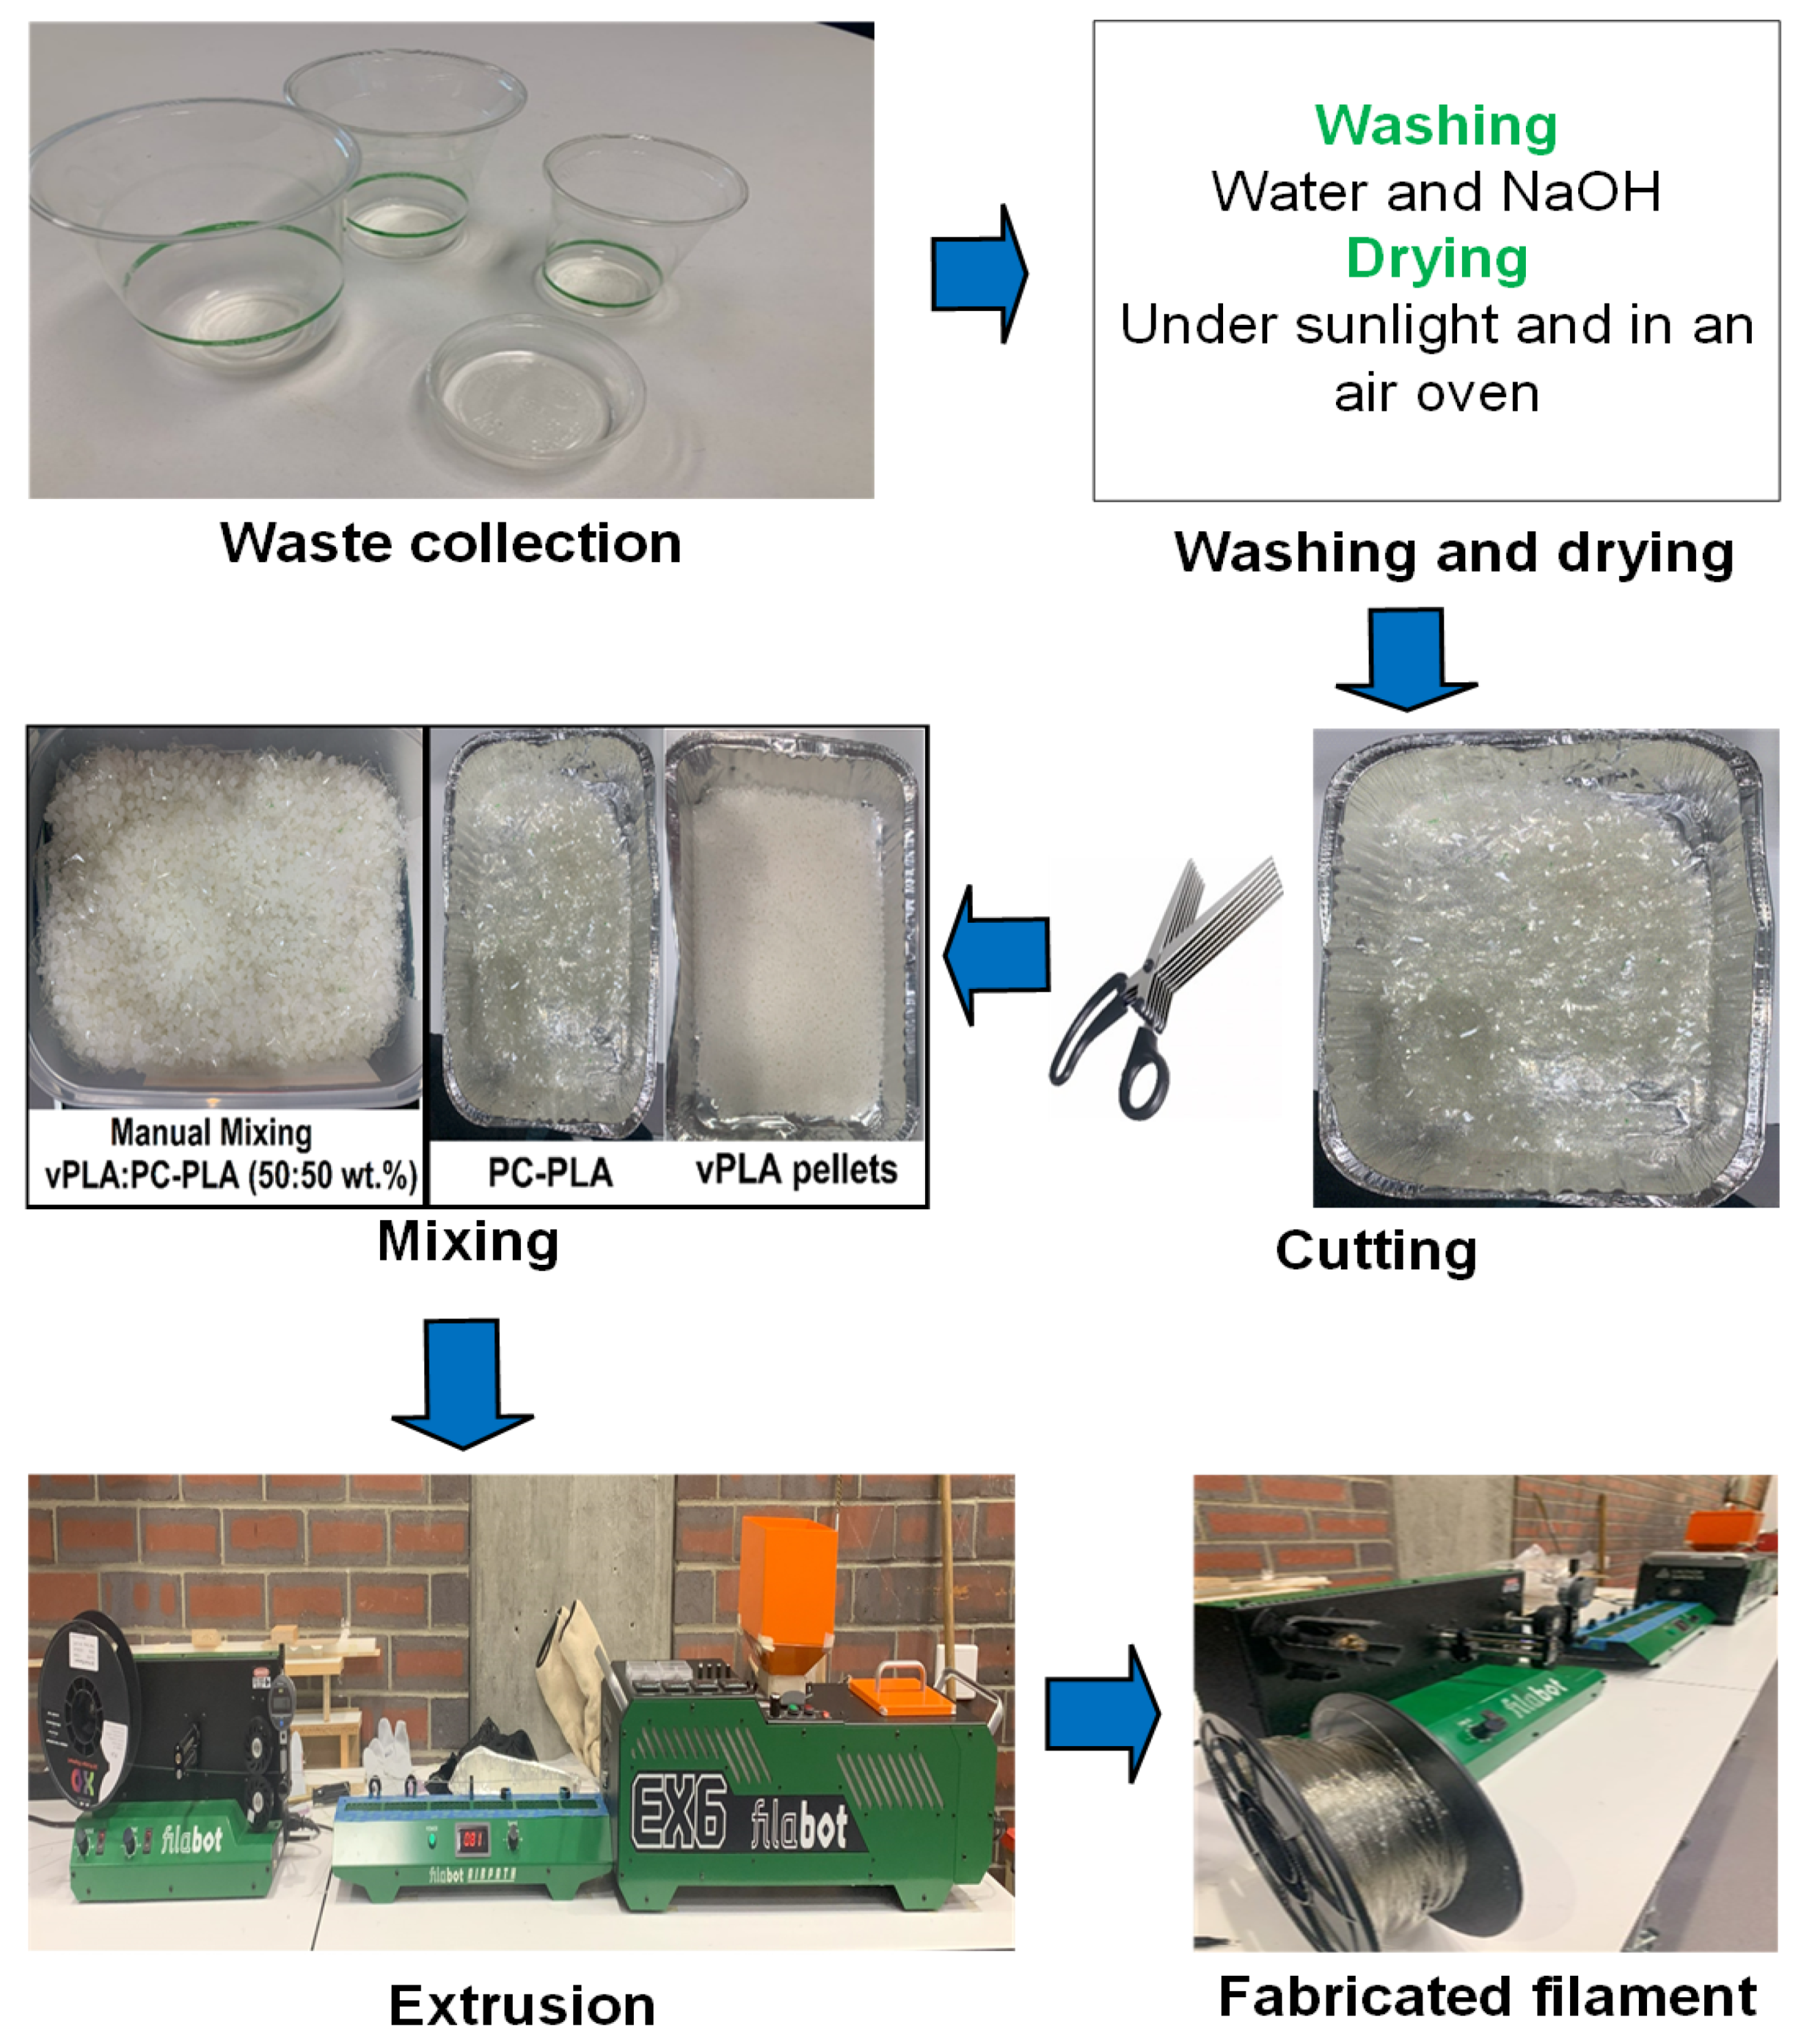
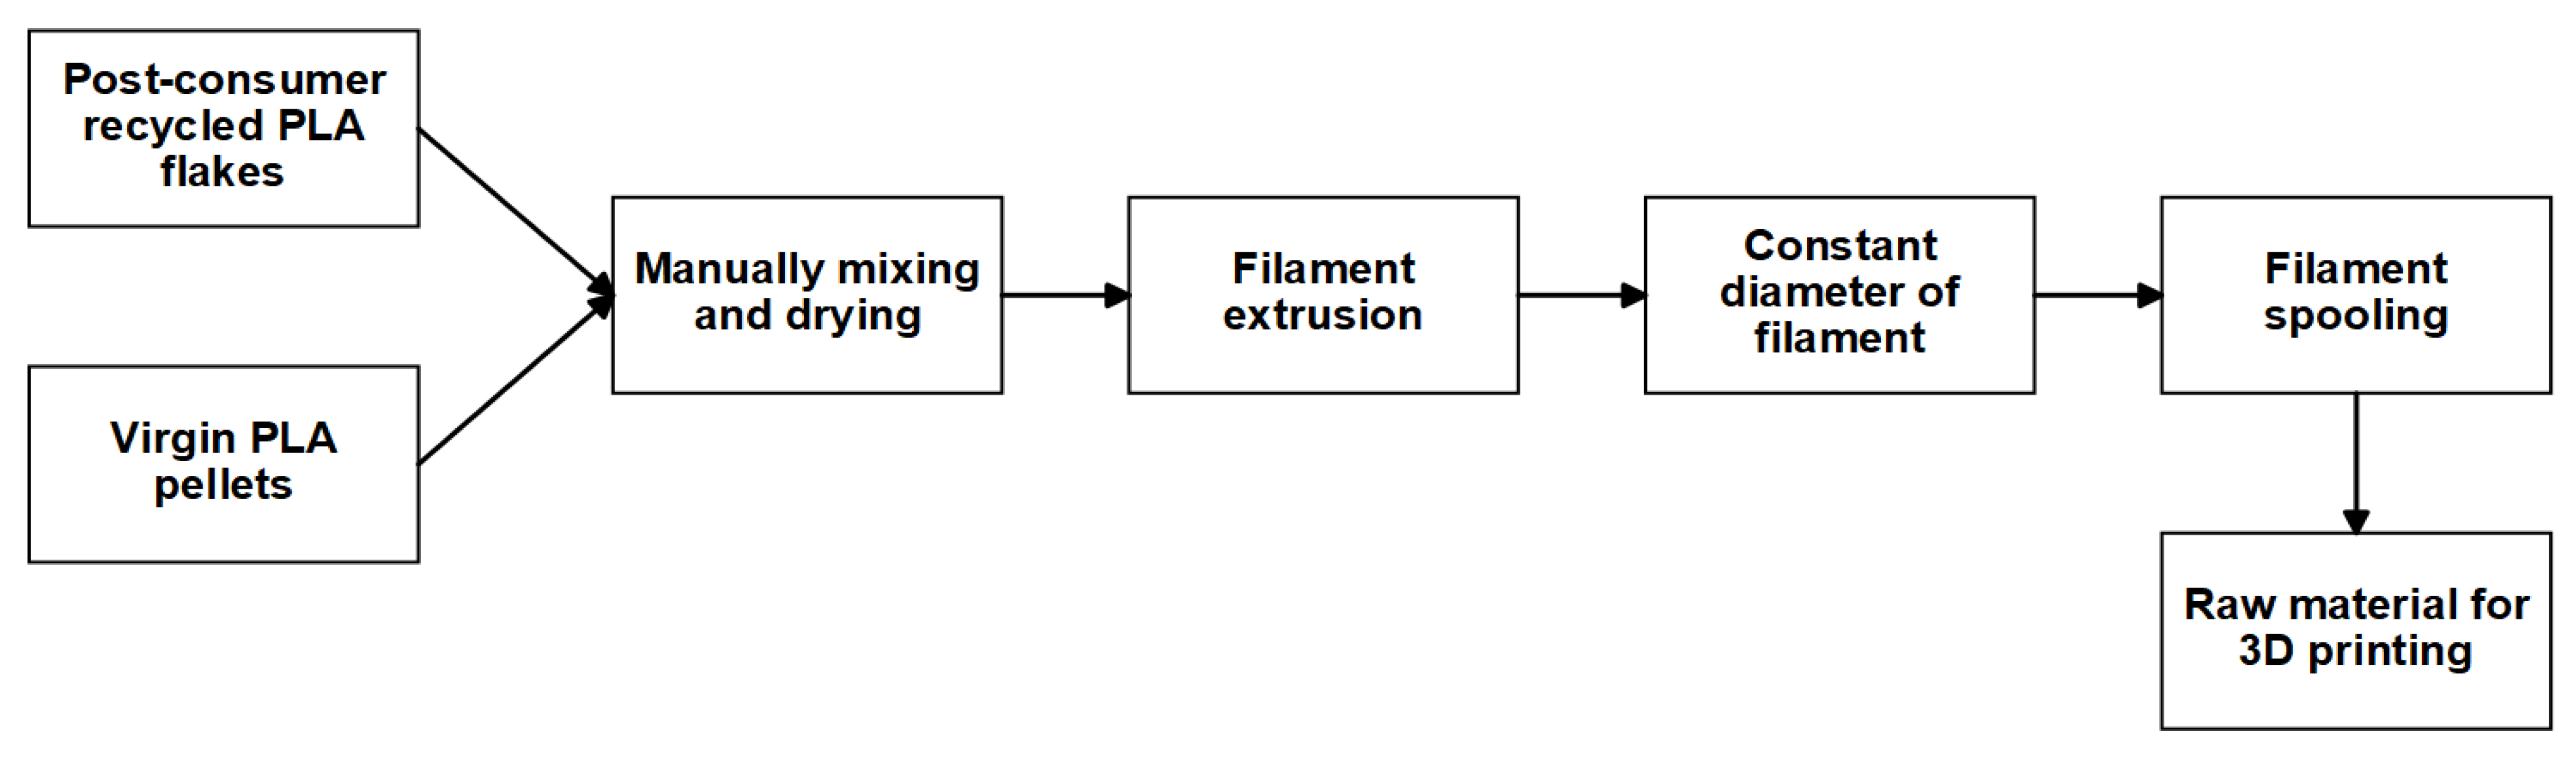
2.1. Preparation of Raw Materials

Material selection is a critical aspect of fused deposition modelling. This process involves the identification of plastic waste that can be utilised as 3D printing filaments, which requires the selection of specific types of plastic as a source material. Plastic waste can be classified into various categories based on their properties, such as thermoplastics and thermosetting plastics [43]. The aim of this study is to fabricate low-cost blended filaments; therefore, PC-PLA and virgin PLA plastics were selected. Commercially available vPLA pellets from AURARUM (Victoria, Australia) with a 1.24 g/cm3 density and a printing temperature of 200–230 °C were used as the primary PLA. Waste cups and lids made from PLA plastic were chosen because they are one of the most readily available types of waste. PC-PLA waste was collected from household waste, then washed to remove any visible contaminants, and then dried by exposure to sunlight. Once the waste had been dried, it was cut into pieces that were not larger than 4 mm (between 2 mm and 4 mm) to facilitate its conversion into the intended form and dimensions for the subsequent stage of the procedure. It is essential to cut the waste into smaller pieces for the overall success of the process, which allows the efficient utilisation of recycled plastic in the production of 3D printing filaments [43]. Furthermore, they were then dried in two steps: first in an open atmosphere under hot sunlight (with an atmospheric temperature of 30 °C and humidity of 50%) for one day and then in a hot air oven at 80 °C for 12 h [44,45]. The samples were then stored in a sealed container containing silica gel to avoid moisture adsorption. The processing of the PLA waste used in this study is shown in Figure 2.

2.2. Filament Extrusion

The next step in the process involved the conversion of PC-PLA and vPLA into 3D printing filaments. Following the preparation of the plastic raw materials, the vPLA pellets were manually combined with PC-PLA with an appropriate weight ratio (50:50 wt.%) to create a blend (Figure 3). The mixture was subsequently dried in a hot air oven at 80 °C for 4 h to eliminate moisture content and prepare it for extrusion [44,45]. The materials were then fed into an extruder (Figure 4). The present research employed a commercial filament manufacturing system, namely FilaBot EX6 (Barre, VT, USA), to produce blend filaments through three main procedures, namely filament extrusion, filament/winding path, and spooling. A pellet feeding hopper, four heating units for separate heating zones, and a motor-driven screw passage characterise the extruder. The material is uniformly heated and sufficiently fluidised for extrusion by means of the four heating units. The extruded material is cooled using fans operating at a steady speed throughout the winding path. A driving wheel and spool holder are the two main components of the spooler. The detailed steps for plastic recycling followed in this study are as follows: the initial step involved setting the temperature of each heating zone to a certain target value and feeding vPLA:PC-PLA into the hopper. Secondly, the hot material (filament) was extruded along the winding path and cooled using fans. Thirdly, the extruded material was wound onto a spooler holder at a constant rate to maintain uniform filament quality (Figure 3) [46,47].
In this research, the optimal parameters for extrusion were identified through a series of trial-and-error experiments and past studies. The Filabot EX6 configuration for producing the blend filament was assembled in a straight line. The temperature settings for each heating unit were set at 40 °C, 175 °C, 180 °C, and 175 °C, respectively, to ensure that the material inside the extruder barrel was properly heated and melted and then forced through a 1.75 mm diameter nozzle. The extruder motor and spooling speed were then manually adjusted to achieve an extruded filament diameter in the range of 1.65 to 1.75 mm. Once the filament was extruded from the nozzle, it was directed towards the air path, for which the speed of the fan was set at 65 rpm. The filament was carefully wound onto the spool by adjusting the winder speed in accordance with the extrusion speed to ensure that it was securely and uniformly wound, preventing the formation of knots or tangles that could compromise its quality. After the winding process was completed and the spool was filled, the filament was stored and prepared for use in 3D printing. The resulting filament exhibited a consistent diameter and was suitable for use in 3D printers. The process flow for producing the vPLA:PC-PLA (50:50) blend filament is shown in Figure 4.

2.3. FDM Printing of Specimens

The specimens were fabricated through the FDM method to determine the mechanical properties. To fabricate high-quality samples, this study followed the printing parameter selection criteria proposed by Hasan et al. [48]. In this context, three different layer heights (LH) (0.1 mm, 0.2 mm, and 0.3 mm), infill percentages (I) (60%, 80%, and 100%), and nozzle temperatures (NT) (195 °C, 205 °C, and 215 °C) were determined. The Taguchi L9 orthogonal array (OA) experimental design was used to print the test samples (Table 1). Table 2 lists the parameters for 3D printing that were employed in this investigation.
Following the Taguchi table, the samples were manufactured using a MakerBot Replicator 2X 3D printer purchased from MakerBot Industries, Brooklyn, NY, USA. The 3D printer was equipped with a 0.4 mm nozzle diameter and used MakerBot desktop beta software (version 3.10.1). The test samples were created using SolidWorks 2022 (SP5.0) software, which was subsequently transformed into the standard tessellation language (STL) file format, which is compatible with the 3D printer slicing process. The MakerBot desktop slicing program was used to convert the solid models of the samples into geometric code (G-code) files, which were then used to print the 3D specimens/samples.

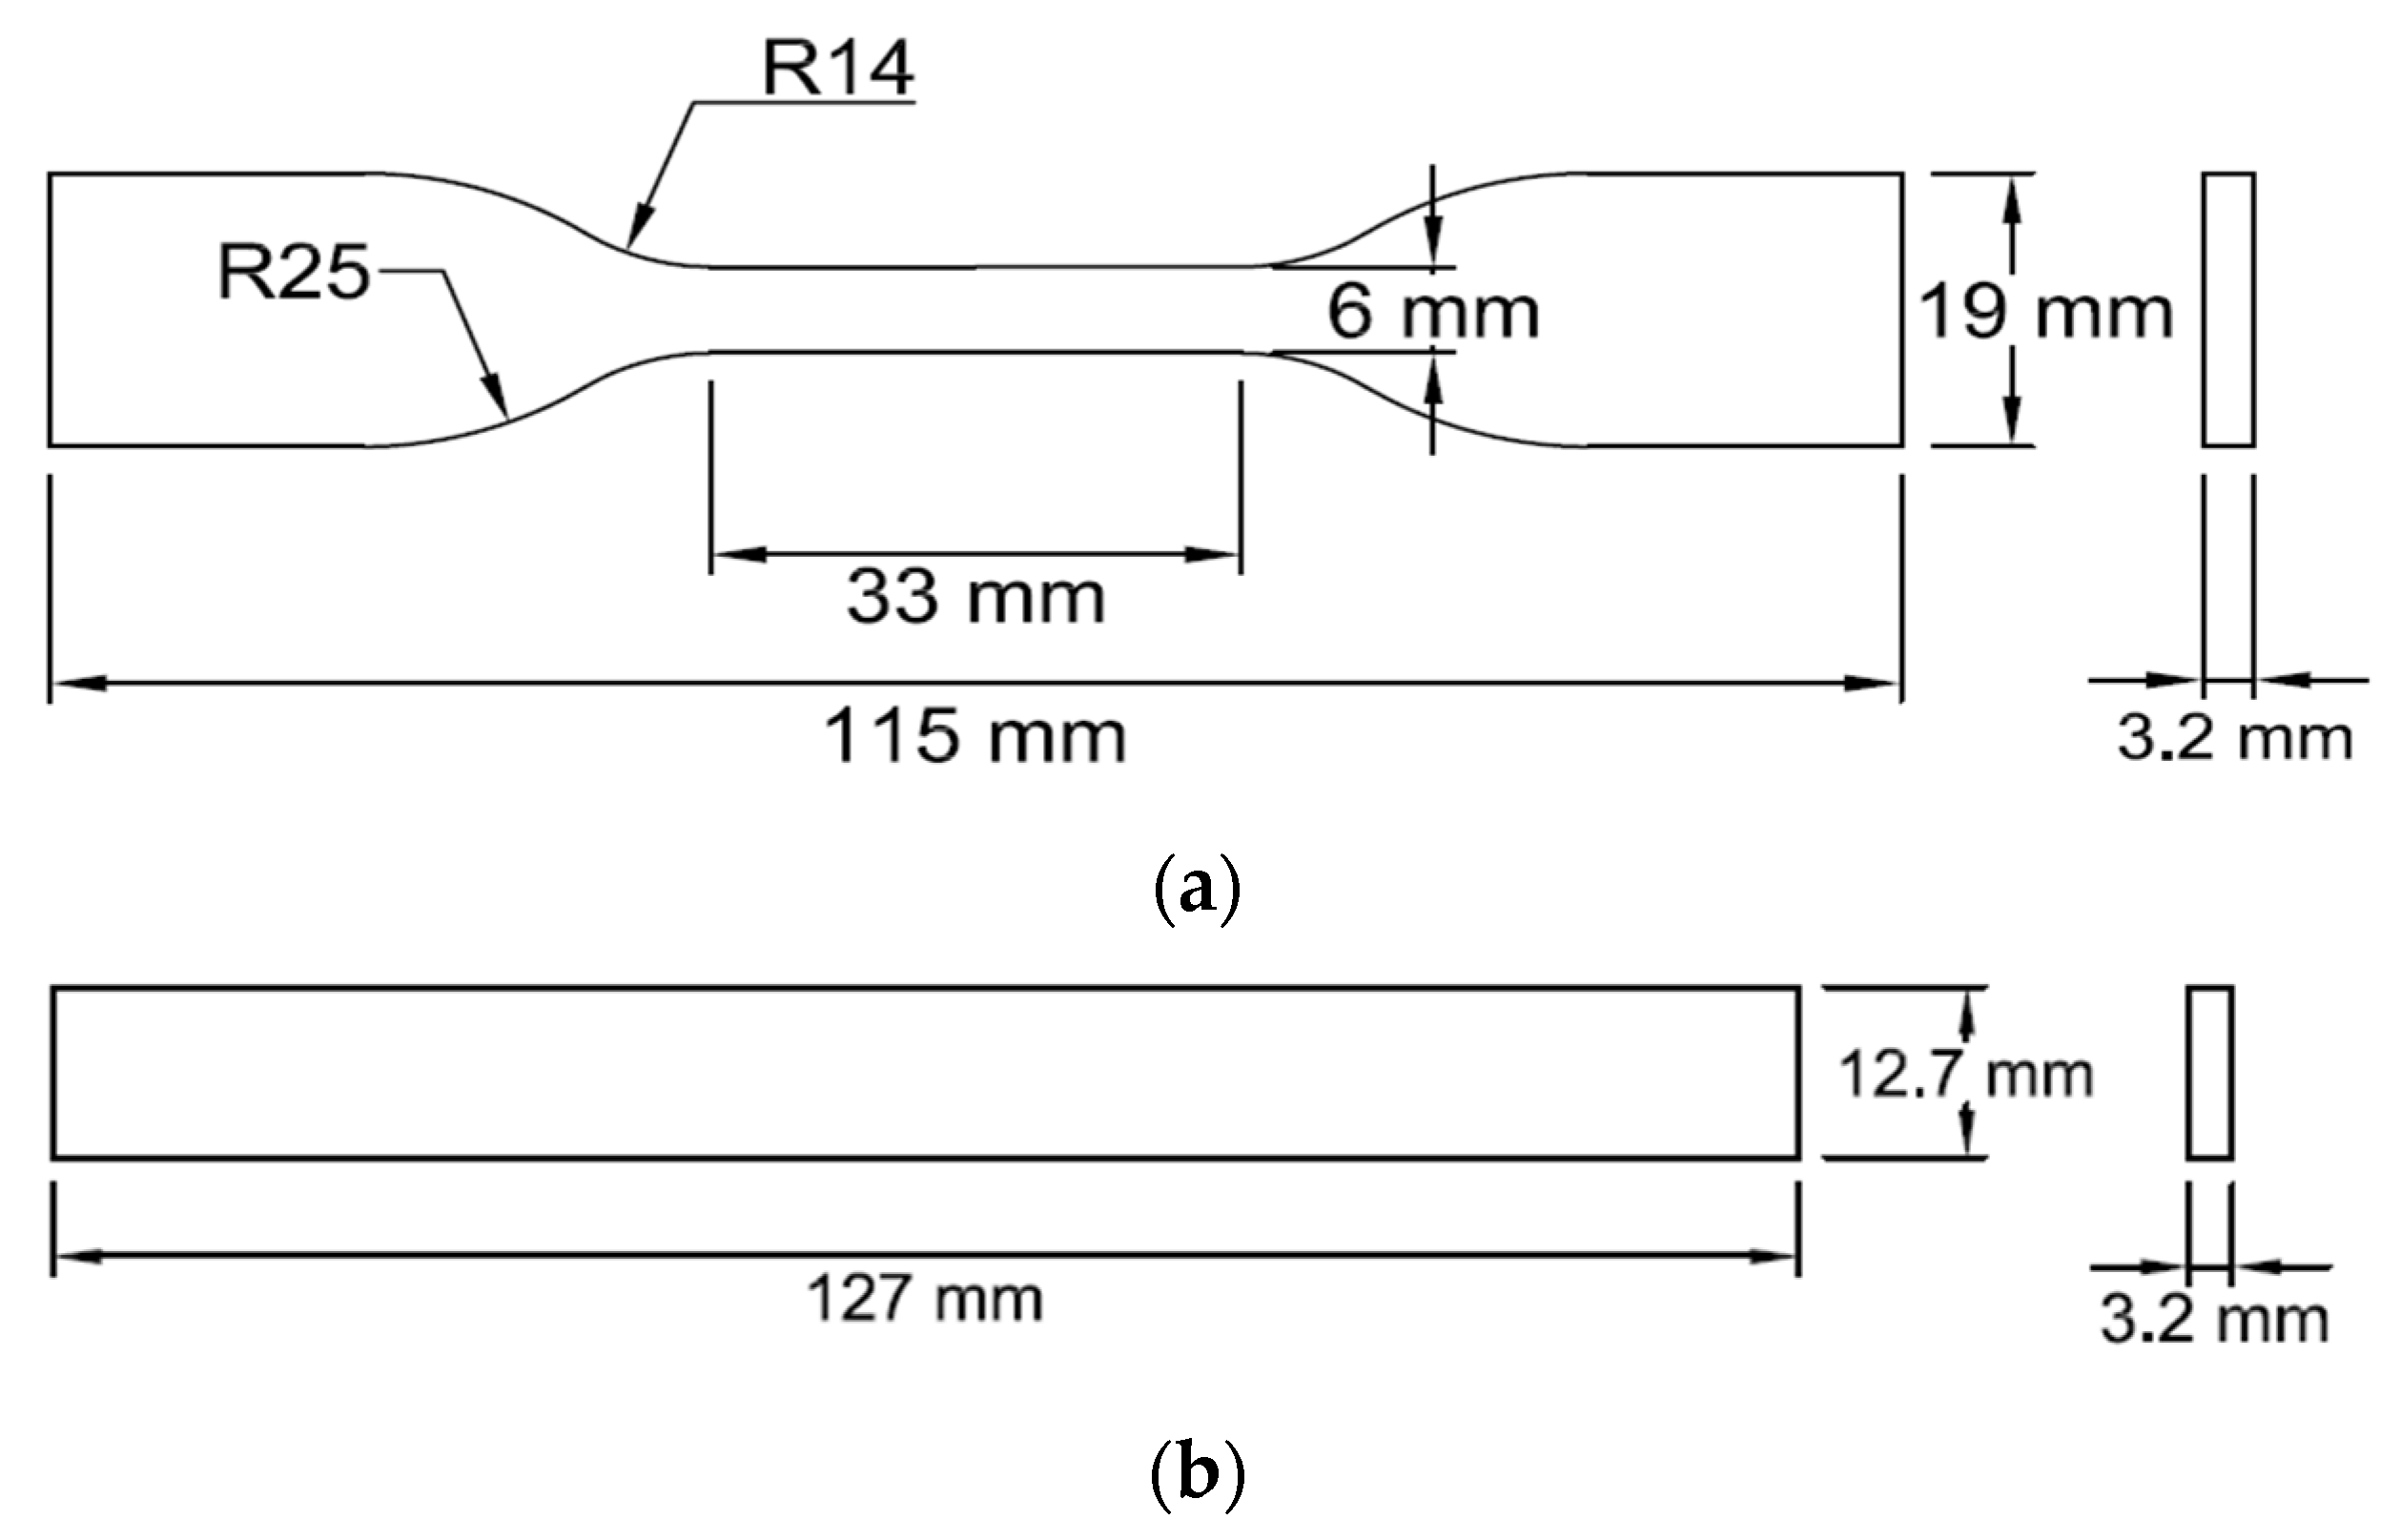
2.4. Mechanical Testing and Material Characterisation

The mechanical properties of the 3D-printed specimens were determined using tensile, three-point bending (flexural), impact, and hardness tests. The tests were conducted in accordance with ASTM standards [49,50,51,52,53]. Consequently, a total of 45 specimens were printed for each mechanical test (tensile, three-point bending, and impact), with five samples produced for each experimental run in each of the three tests. In addition, 27 samples were prepared for the hardness tests. Visual inspection of the printed specimens revealed no signs of shrinkage or warping, indicating excellent quality of the samples.
Tensile tests were performed using a Shimadzu Autograph AGS-X universal testing system with a load cell capacity of 50 kN. As depicted in Figure 5a, a dog-bone-shaped Type IV 3D-printed specimen with dimensions of 115   m m × 19   m m × 3.2   m m was tested following the ASTM-D638-22 [49] standard. The specimens were subjected to a crosshead loading speed of 5 mm/min until fracture occurred. Additionally, a 3-point bending setup was utilised on a Shimadzu Autograph AGS-X universal testing machine with a 10 kN load cell capacity to test 3D-printed strip-like samples ( 127   m m × 12.7   m m × 3.2   m m ) in accordance with the ASTM-D790-17 [50] standard (Figure 5b). The samples were examined at a testing speed of 3 mm/min and a support span of 51.2 mm. To calculate the tensile and flexural properties, the steps described by the author Hasan et al. [48] were followed. The tests for each experimental run were repeated a minimum of five times, and the test results are presented as the mean value with standard deviation (SD).
Charpy impact testing was conducted utilising a Zwick 5102 (model D-7900) impact tester fitted with a 6.5 J hammer. The specimens for the examination were fabricated following the ASTM-D6110-18 [51] standard, with measurements of 127   m m × 12.7   m m × 6.2   m m and notched at a 45° angle, as illustrated in Figure 6a. The hardness of the samples was assessed using a Sauter HBD 100-0 Shore D hardness testing device according to the ASTM-D2240-15 [52] standard using dimensions of 40   m m × 40   m m × 8   m m (Figure 6b). The average data, including the standard deviations, were computed using the testing outcomes of a minimum of five samples for each material batch to assess the reproducibility of the tests.
The impact of the printing parameters on surface roughness was investigated using a Mitutoyo SJ-210 surface roughness tester. The roughness of the largest surface of the tensile specimens was measured following the ASTM-D7127-17 standard [53]. The arithmetic mean roughness (Ra) and root mean square roughness (Rq) were assessed quantitatively at the micrometre (μm) scale. The measurements were obtained from five selected locations across the samples (Figure 7), and the mean value with the standard deviation of five measurements was tabulated.
Fractographic analysis of the fractured cross-sectional structures of the investigated materials was performed using a Pro-MicroScan microscope fitted with an eyepiece camera from Oplenic Corporation, Hangzhou, China. The samples were prepared for analysis according to the procedure described by Hasan et al. [48]. Following the examination, all the test samples were stored in plastic zip bags.

2.5. Optimisation of Process Parameters

The Taguchi method is a well-established approach for analysing quality characteristics in the context of signal-to-noise ratio (S/N). By examining the S/N ratio, researchers can identify the effective process parameters that influence the results and determine the optimal sets for achieving desired outcomes [54]. The S/N ratio can be assessed in terms of three categories: smaller-the-better, larger-the-better, and nominal-is-best [55,56]. In this study, the mechanical properties were evaluated using the “larger-the-better” whereas “smaller-the-better” was used to evaluate surface roughness.
To further refine the analysis, a statistical analysis of variance (ANOVA) was conducted to measure the relative importance of quality attributes. A factor is considered statistically significant if the probability value (p-value) is lower than the predetermined significance level (α) [57]. F-value and percentage contribution were used to represent the relative significance of the factors [54,58,59]. The F-value or percentage contribution is used to quantify the relative importance of these factors. A larger F-value indicates more significant variation in the process parameters, or when the p-value is less than 0.05, the factor is more significant [55,59].

2.6. DoE Confirmation Test

Once the optimum levels of printing parameters were determined, the final step involved the theoretical prediction and experimental confirmation of these parameters. The results obtained are then compared to evaluate the enhancement in the quality characteristics achieved by employing the optimal printing parameters [60]. This comparison aids in evaluating the consistency between the predicted and observed parameters. It is expected that there should be a reasonable agreement of ±5% (with a 95% confidence interval) between the predicted values and the results confirmed through experiments [60].
The predicted S/N ratio and confidence interval (C.I.) can be determined using Equations (1) and (2) as follows [60].
S / N p r e d i c t e d = S / N ¯ + j = 1 k ( S / N k ¯ S / N ¯ )
where S / N ¯ represents the overall mean of all S/N ratios, S / N k ¯ denotes the average S/N ratio derived from the determined significant factors at the optimum level, and k represents the chosen factor.
C . I . p r e d i c t e d = F ( α , ϑ 1 , ϑ 2 ) V e × 1 N e
where F α , ϑ 1 , ϑ 2 represents the F -ratio obtained from the F -table, α denotes the significance level corresponding to the confidence level of (1 − α ), ϑ 1 stands for the degree of freedom ( D O F ) of the mean (which is always set to 1), and ϑ 2 represents D O F of the error term. Meanwhile, V e denotes the error variance, and N e signifies the effective number of replications, as mathematically expressed by Equation (3) as follows [61]:
N e = ( N u m b e r   o f   T r i a l s ) [ D O F   o f   m e a n   a l w a y s   1 + D O F   o f   a l l   f a c t o r s   u s e d   i n   t h e   e s t i m a t e ]
Finally, after conducting a confirmation run, the S/N ratio can be used as the value of S / N c o n f i r m a t i o n . The formula for calculating the C.I. for S / N c o n f i r m a t i o n is presented in Equation (4) as follows, where R is the number of replicas [61].
C . I . c o n f i r m a t i o n = F ( α , ϑ 1 , ϑ 2 ) V e × 1 N e + 1 R

2.7. Statistical Analysis

Microsoft 365 MSO Excel software (version 2402 build 16.0.17328.20124/32-bit) (a data management tool developed by Microsoft), was employed in this study for the purpose of data management. The results include the average values derived from the material property characterisation tests, along with their corresponding standard deviations. In addition, Minitab 21.4 software was employed to analyse the signal-to-noise (S/N) ratio of the obtained mechanical properties and conduct an analysis of variance to determine the printing parameters that have a significant impact on these mechanical properties.

2.8. Comparative Analysis

In order to assess the improvement or deterioration of the mechanical properties of the virgin PLA and post-consumer PLA blend (vPLA:PC-PLA, 50:50), a comparison was made with the outcomes of 100% virgin PLA (vPLA) and 100% recycled PLA (rPLA) (recycled from residual extrusion waste stream, free from additives, subsequently recompounded and homogenised) filament 3D-printed parts, which were recorded by the author Hasan et al. [48] under the same printing parameters and testing conditions.

3. Results and Discussions

The objective of this study is to determine the optimal printing parameters for fabricating 3D-printed components using a vPLA:PC-PLA (50:50) blended filament consisting of 50 wt.% PC-PLA and 50 wt.% vPLA. To achieve this, 45 samples (five samples for each experimental run) each for tensile, flexural, and impact testing and 27 samples (three samples for each experimental run) were fabricated for hardness testing. Surface roughness measurements were obtained from the tensile samples before conducting the tensile tests.
Following manufacturing, a comprehensive assessment of the surface roughness and mechanical properties, including the hardness, tensile strength, flexural strength, and impact strength, was performed. The performances of the blended filament-produced specimens were compared with those of 100% virgin PLA and 100% recycled PLA (sourced from residual extrusion waste streams) specimens whose results were published by the authors [48]. The same 3D printing parameters were considered in both the current and previous studies. This investigation aimed to gain insights into the performance attributes of specimens printed with blended filaments by assessing selected printing parameters and determining if they exhibit properties comparable to those of vPLA. The following sections present a comprehensive analysis of the experimental data obtained by testing the specimens to determine their material properties.

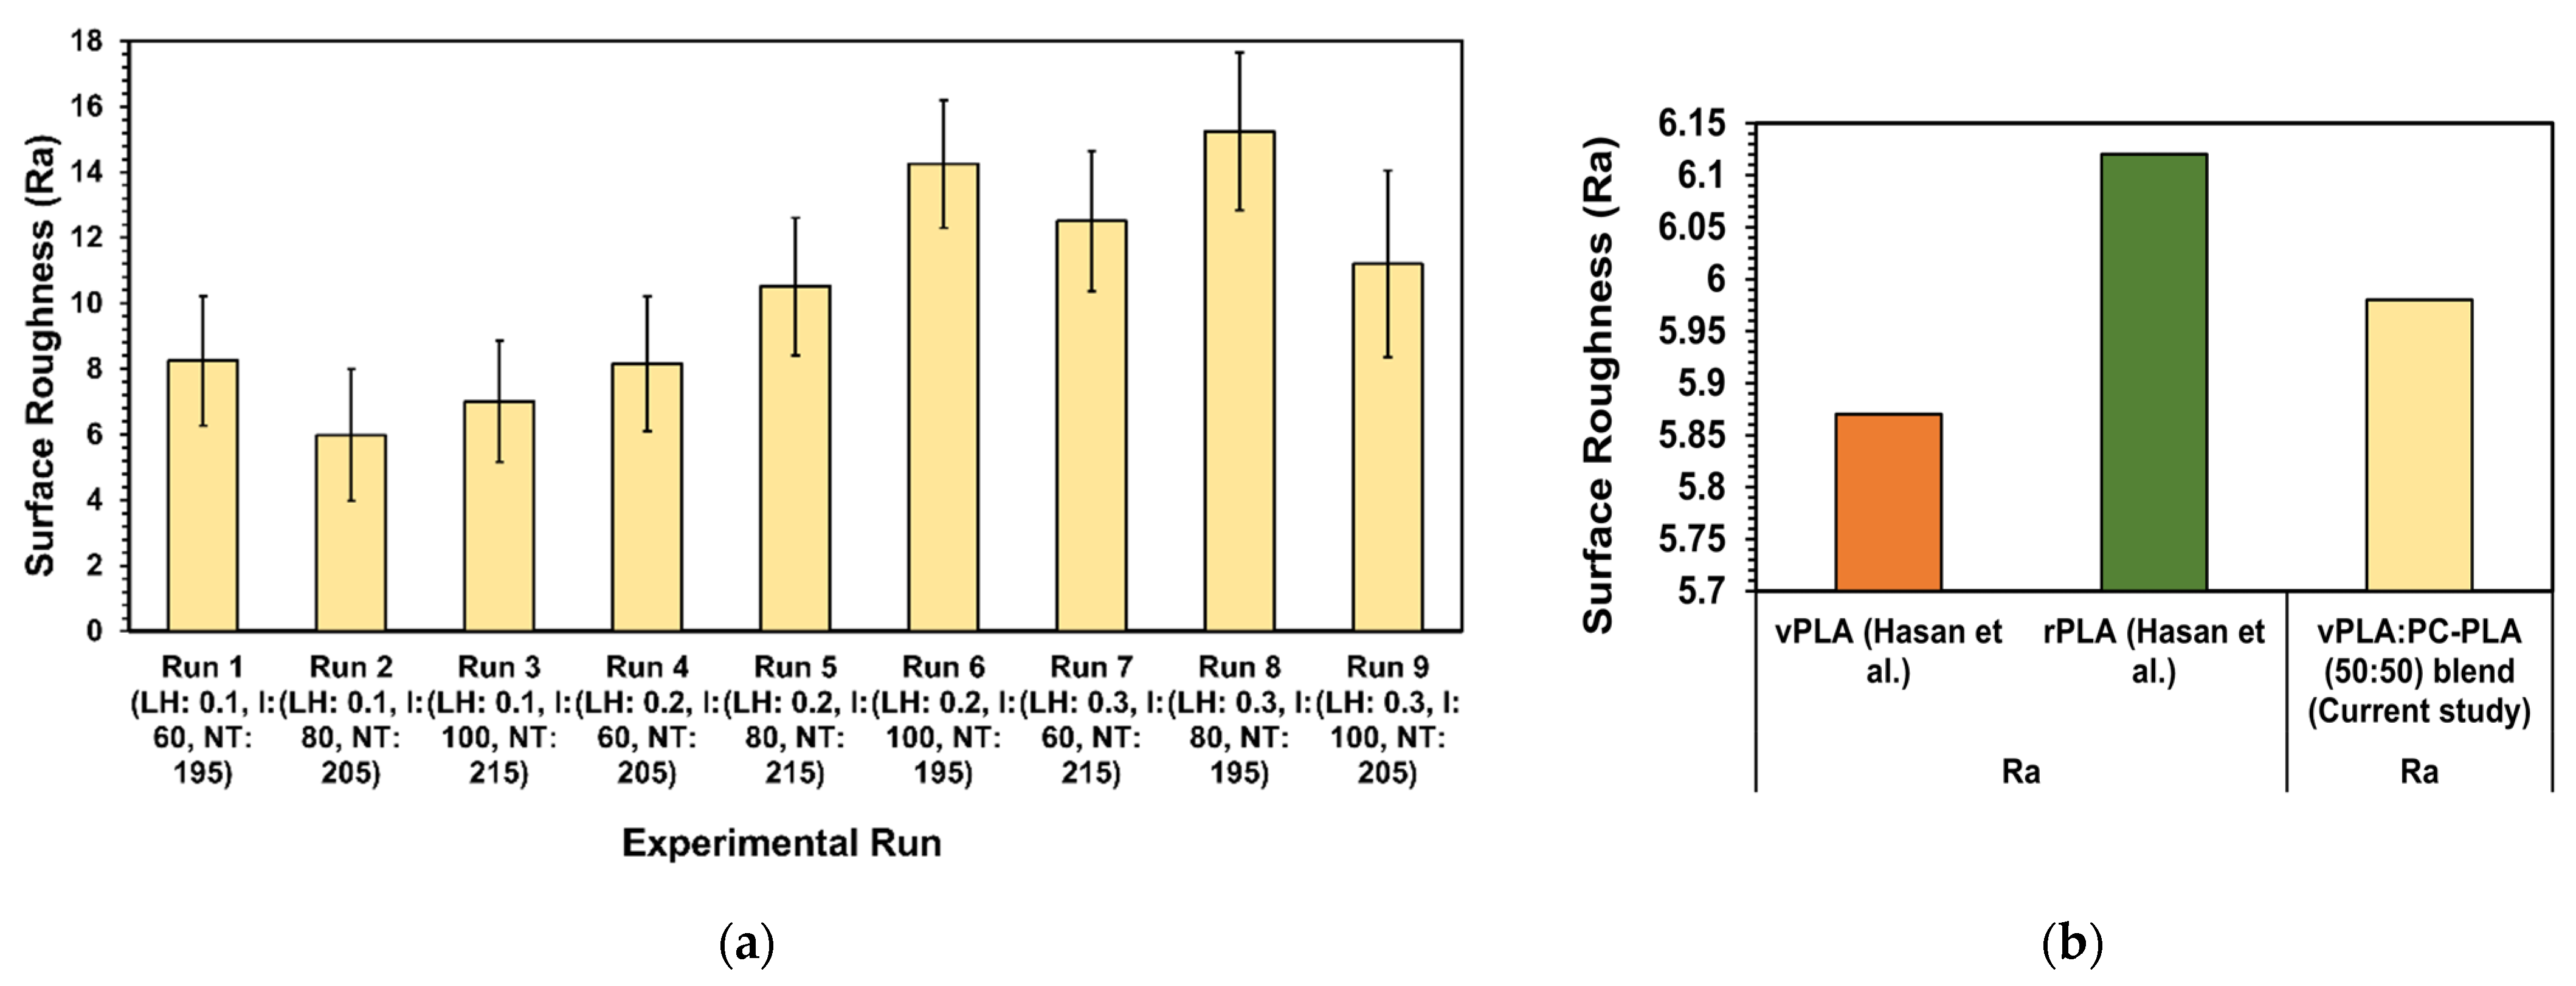
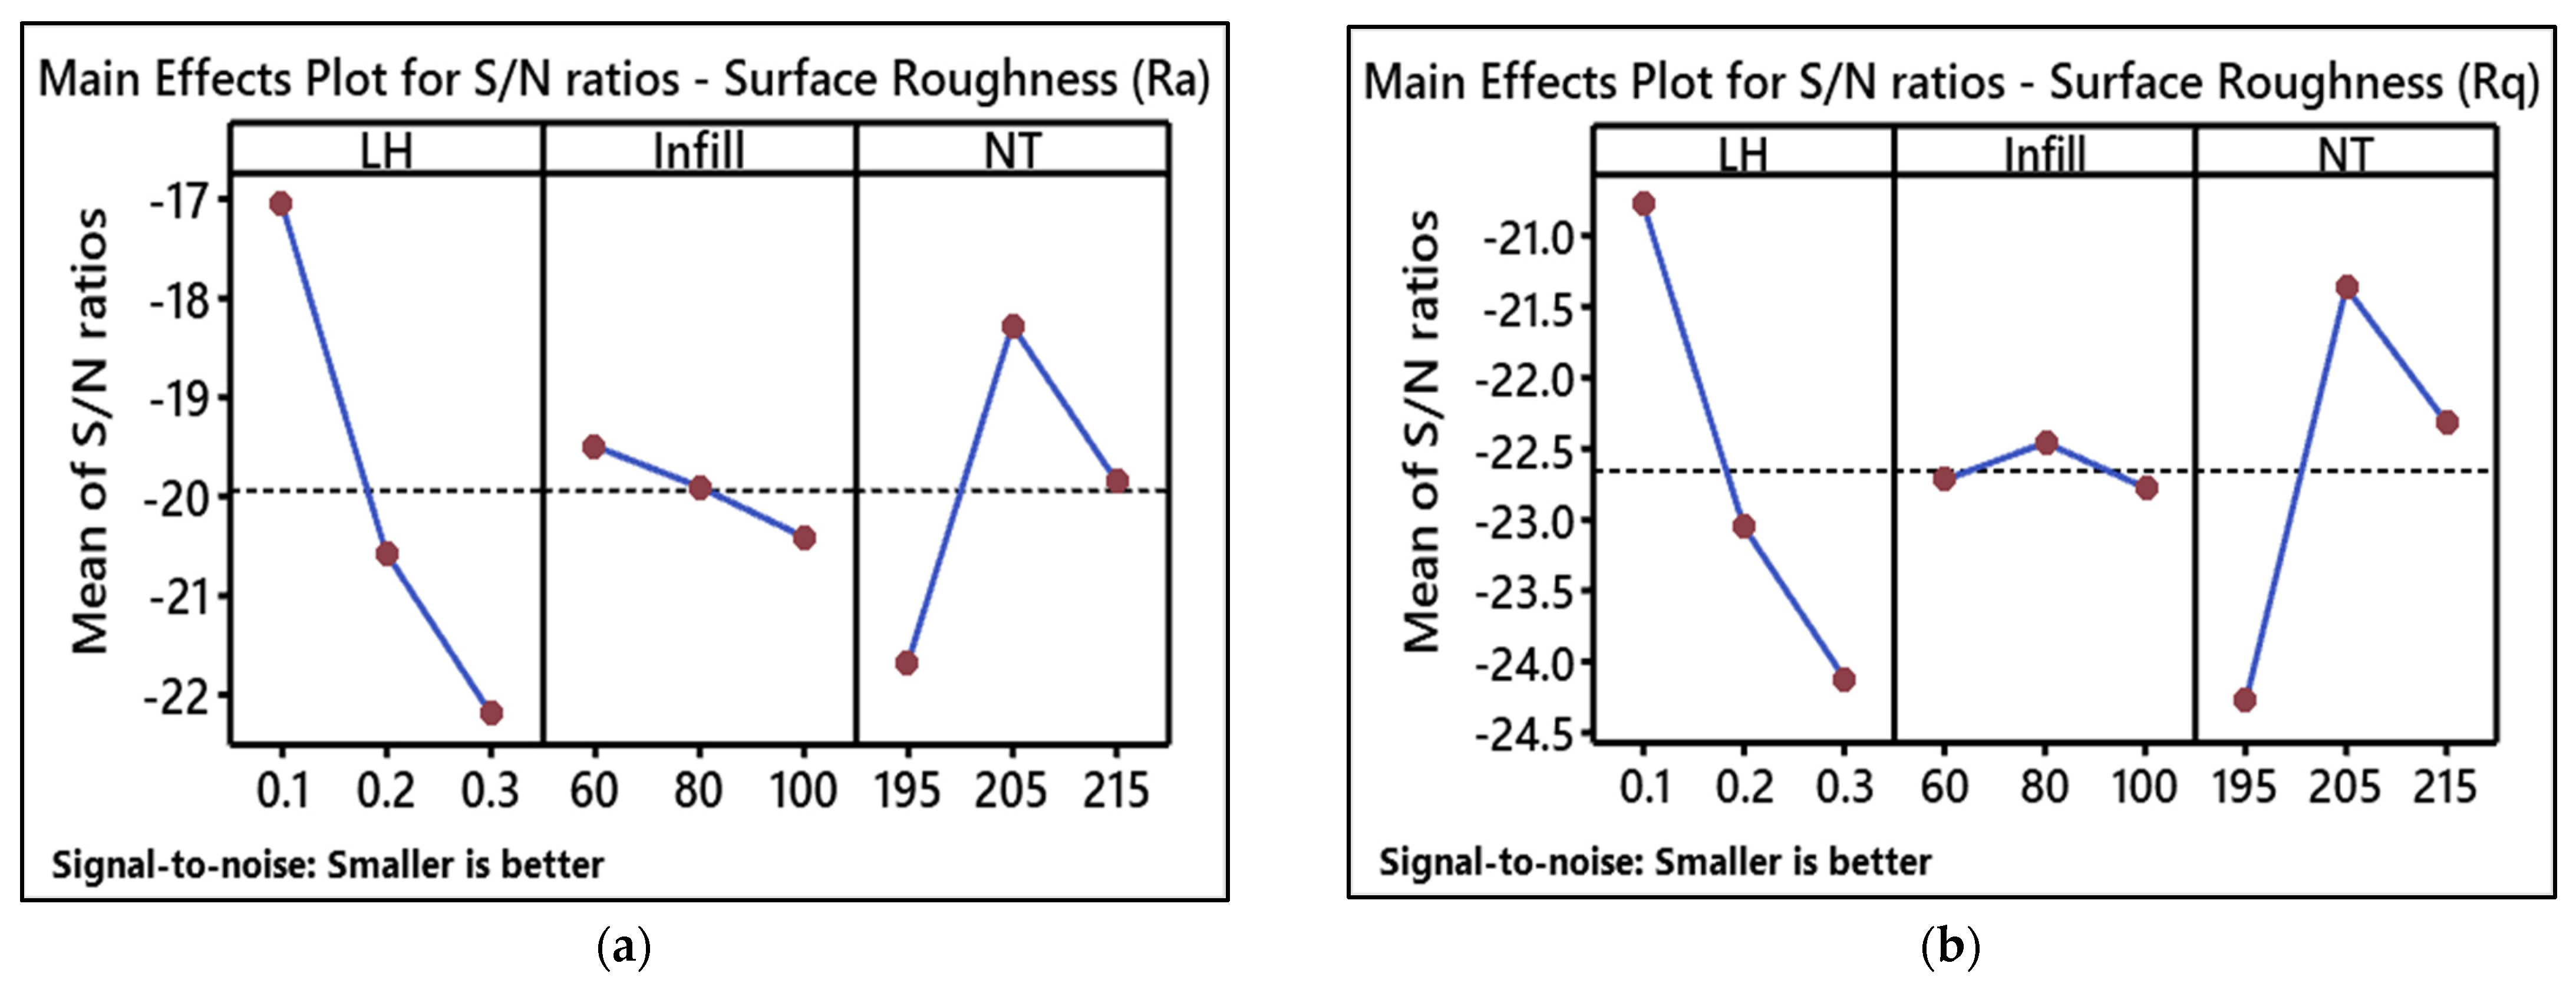
3.1. Surface Roughness
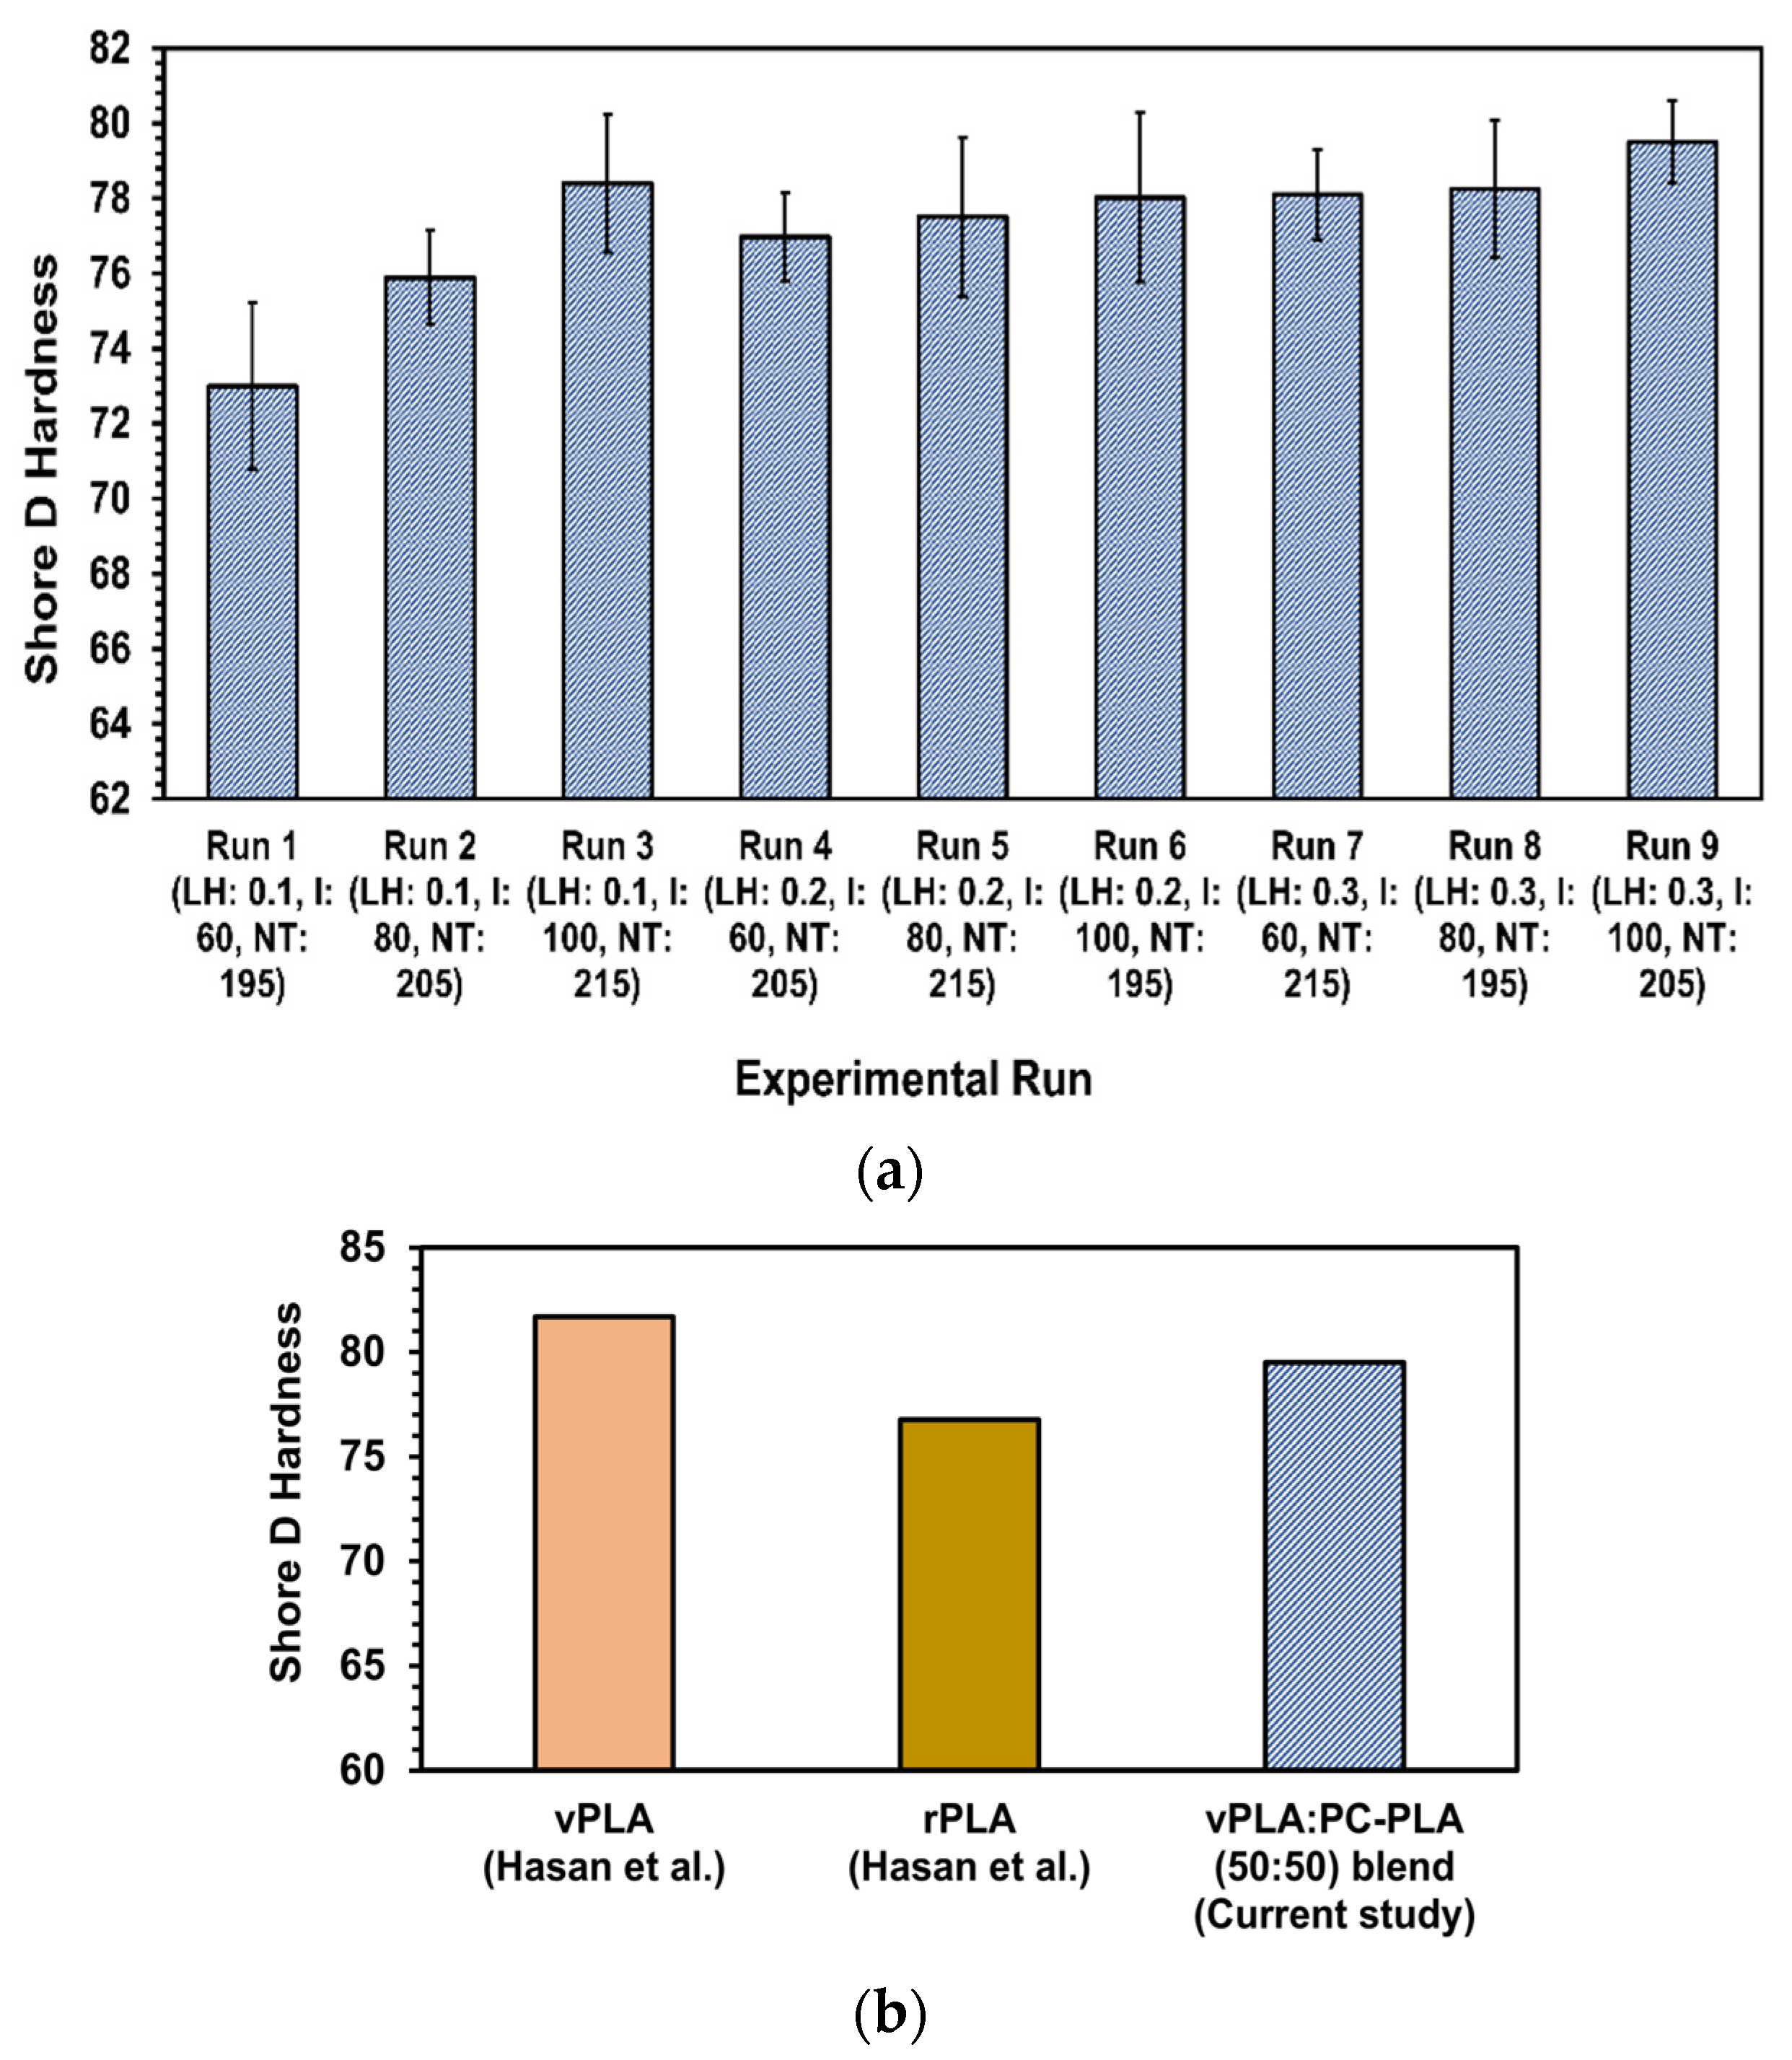
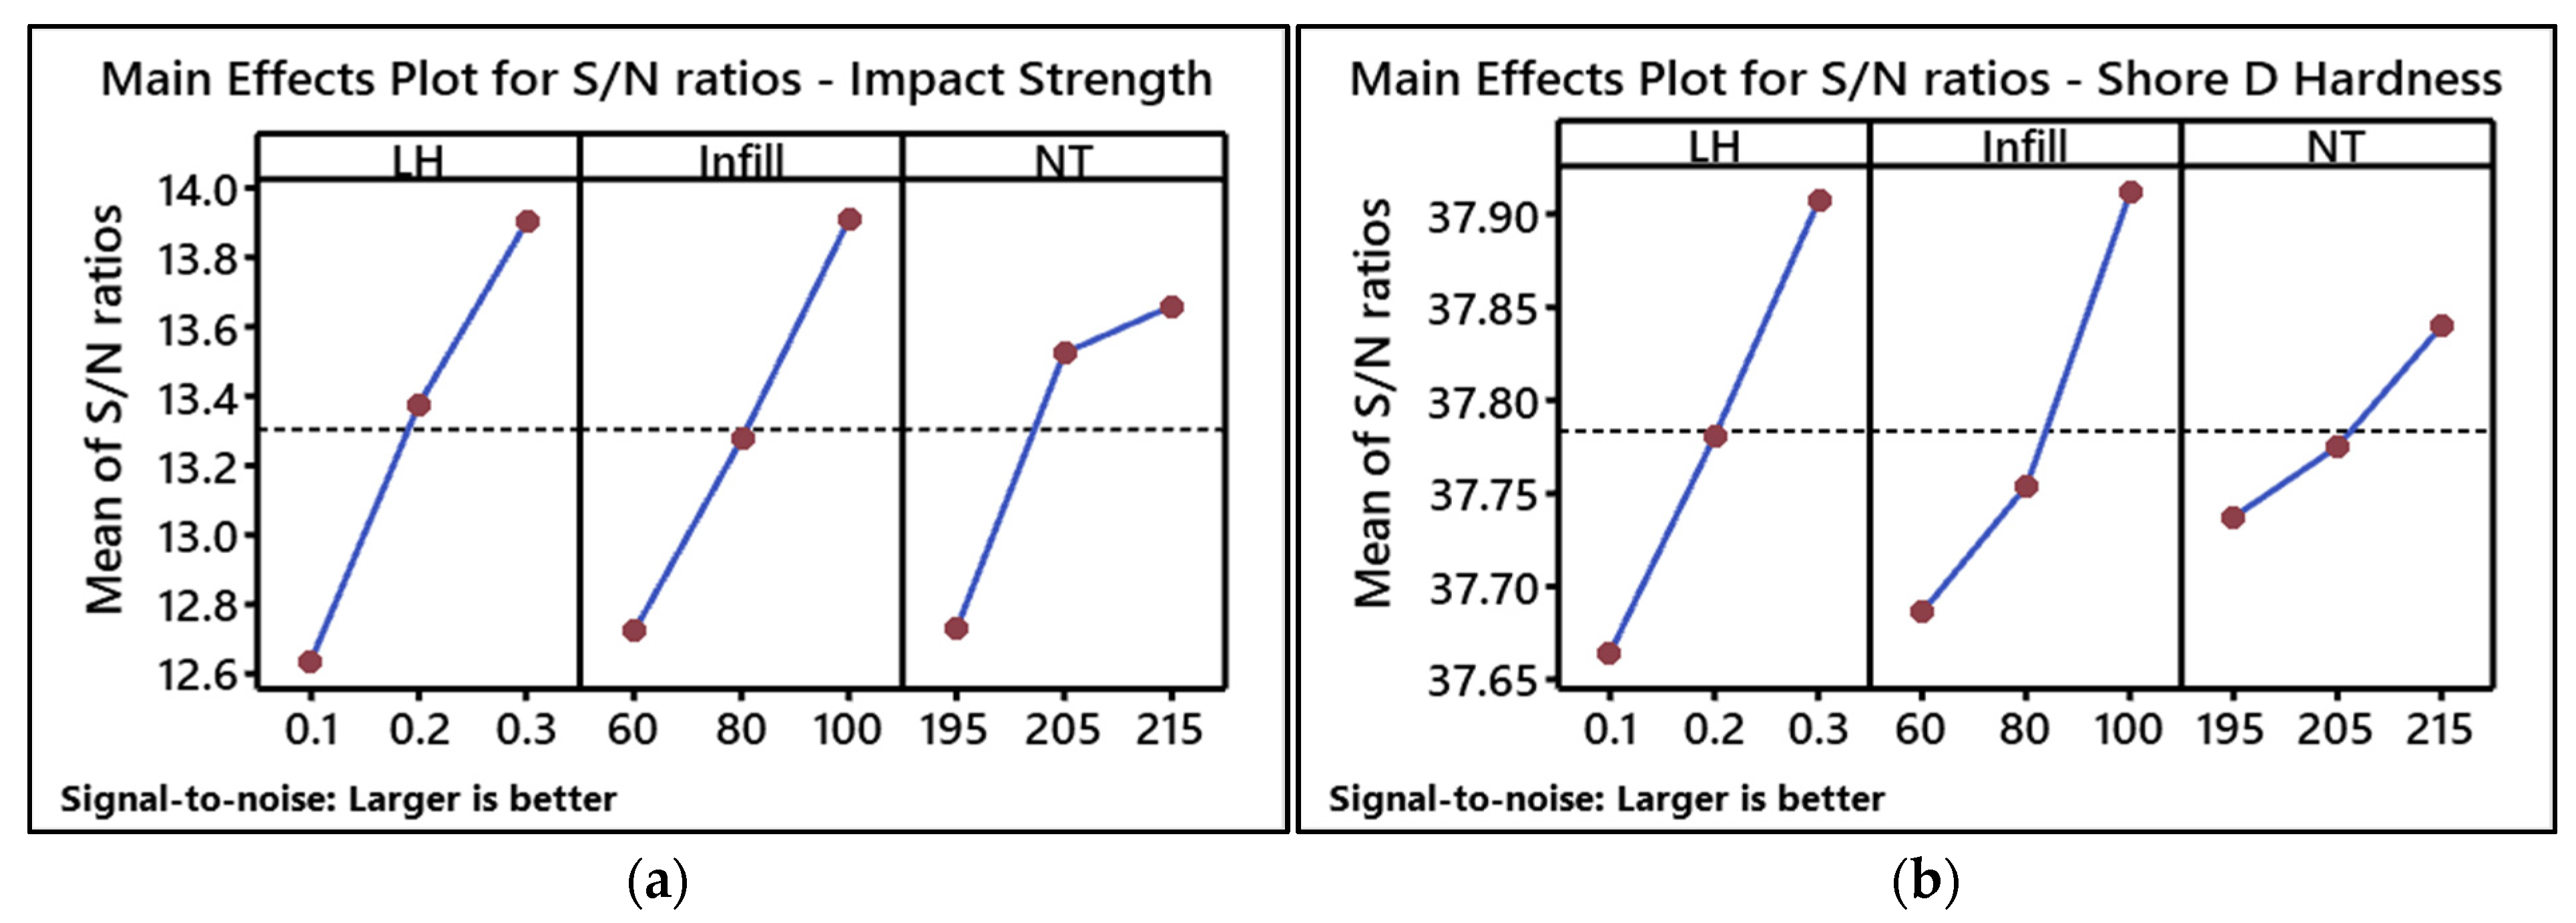
One primary concern in additive manufacturing is surface quality, which is crucial for ensuring the operation and effectiveness of printed components over time. During the additive manufacturing process, the surface roughness stage plays a critical role in achieving the desired surface quality [62]. The surface roughness, Ra, of printed parts has a significant impact on their mechanical behaviour, such as the initiation of cracks, wear resistance, and fatigue life. The requirement for a decrease in surface roughness is contingent upon the specific experimental approach and purpose for which the components are printed [62]. The surface roughness of the vPLA:PC-PLA (50:50) blended printed tensile test samples was analysed to evaluate the impact of the printing parameters on the manufactured samples.
The surface roughness values of all the tested specimens are illustrated in Figure 8a. The results indicate that experimental run 2 (LH: 0.1 mm, I: 100%, and NT: 205 °C) produced the lowest surface roughness of 5.98 μm, followed by experimental run 3 (7.01 μm) and experimental run 1 (8.25 μm). A higher surface roughness was observed when the specimens were printed using experimental run 8 (LH: 0.3 mm, I: 80%, and NT: 195 °C). As shown in Figure 8a, the surface roughness of the blended filaments increases with increasing layer height. The printing temperature also plays a critical role in the production of high-quality prints. The test results indicated that at higher selected temperatures (215 °C) and lower selected temperatures (195 °C), the surface roughness increased, whereas at 205 °C, the surface roughness was found to be at its minimum. A higher printing temperature (215 °C) may cause samples to overheat, whereas a lower printing temperature (195 °C) could lead to inadequate material flow, which can negatively impact the print quality [63]. It was observed that as a result of uneven solidification and possible shrinkage, samples printed at 195 °C had a poorer surface quality than those printed at 205 °C, which might lead to regulated solidification and produce smoother surfaces. Similar trends for the positive correlation between layer height and nozzle temperature were observed in the studies on virgin PLA and recycled PLA [48]. Hasan et al. [48] found that rPLA samples had higher surface roughness values than vPLA samples, indicating rougher surfaces (for experimental run 2). In contrast, the current study observed that the vPLA:PC-PLA (50:50) blended filament had a lower surface roughness than that of rPLA, indicating better surface properties compared to those of rPLA for the same experimental run. The surface roughness of the blended specimen demonstrated a 2.29% lower value compared to rPLA (as shown in Figure 8b). Studies have reported that the blending of virgin material with recycled material positively affects the surface roughness of 3D-printed samples [45,64]. Specifically, an increase in the percentage of virgin material added to the recycled material led to a significant enhancement in surface roughness. This improvement may be attributed to the more pronounced influence of the virgin material on the properties of the recycled material, which are typically more consistent in vPLA than in rPLA. The upgraded surface finish was due to the improved melt flow and cooling behaviour of vPLA, leading to a more consistent 3D printing process [38].

3.2. Hardness

The degree of hardness of a material indicates its capacity to withstand local deformation, including the effects of surface indentation or penetration. To attain an optimal number of production runs for an additively manufactured component, a high degree of hardness is required [65]. The detailed results of the hardness of all the vPLA:PC-PLA (50:50) blended prepared samples are shown in Figure 9a. The sample with the maximum infill and layer height exhibited the highest hardness. This may be attributable to the significant influence of the infill density on the output. In experimental run 9 (LH: 0.3 mm, I: 100%, NT: 205 °C), the samples were printed with the highest infill density and layer height, resulting in the highest hardness of 79.51. In contrast to this, experimental run 1 (LH: 0.1 mm, I: 60%, NT: 195 °C) exhibited a lower hardness value of 73.12 for the blended specimen. This increase in hardness may be attributed to a better diffusion of the material in the subsequent layers at higher infill densities, resulting in fewer voids in the interspace of the structure and higher hardness values [66]. Another possible reason is that the cross-sectional area of the material increased as the percentage of filling increased, resulting in a harder internal structure. In contrast, a larger internal air gap with a lower filling percentage facilitates an easier penetration of the hardness tip into the surface of the test specimen [66].
The printing temperature also plays a significant role in determining the hardness of the material. As the printing temperature decreases, the hardness value also decreases. The reason for this is the incomplete melting of the material, which results in poor layer-to-layer bonding, a larger porosity, and a lower hardness [67]. Conversely, an increase in printing temperature led to a decrease in the rate of change in hardness, which may be attributed to the stronger bonding between the materials caused by the high printing temperature or the work of adhesion between the filaments [67]. In summary, the results of this study illustrate a direct correlation between the nozzle temperature and infill percentage, resulting in an increase in hardness. This observation aligns with the outcomes reported by Hasan et al. [48] for vPLA and rPLA, as well as findings by Mani et al. [68] and Maguluri et al. [69] for vPLA. A comparison of the hardness of the vPLA:PC-PLA (50:50) blended with 100% recycled PLA and 100% virgin PLA showed that the hardness of the blend samples produced using experimental run 9 (LH: 0.3 mm, I: 100%, NT: 205 °C) exhibited a 5% increase compared to that of rPLA, whereas it was 6% lower than that of vPLA (Figure 9b) [48]. Mishra et al. [45] and Abbas et al. [70] noted that blending enhances the compatibility between polymers at the chemical and structural levels, which stimulates the formation of a homogeneous blend. This, in turn, improves intermolecular interactions, thereby enhancing the resistance to abrasion and making it more resilient to plastic deformation, ultimately contributing to an improved hardness [45,64].

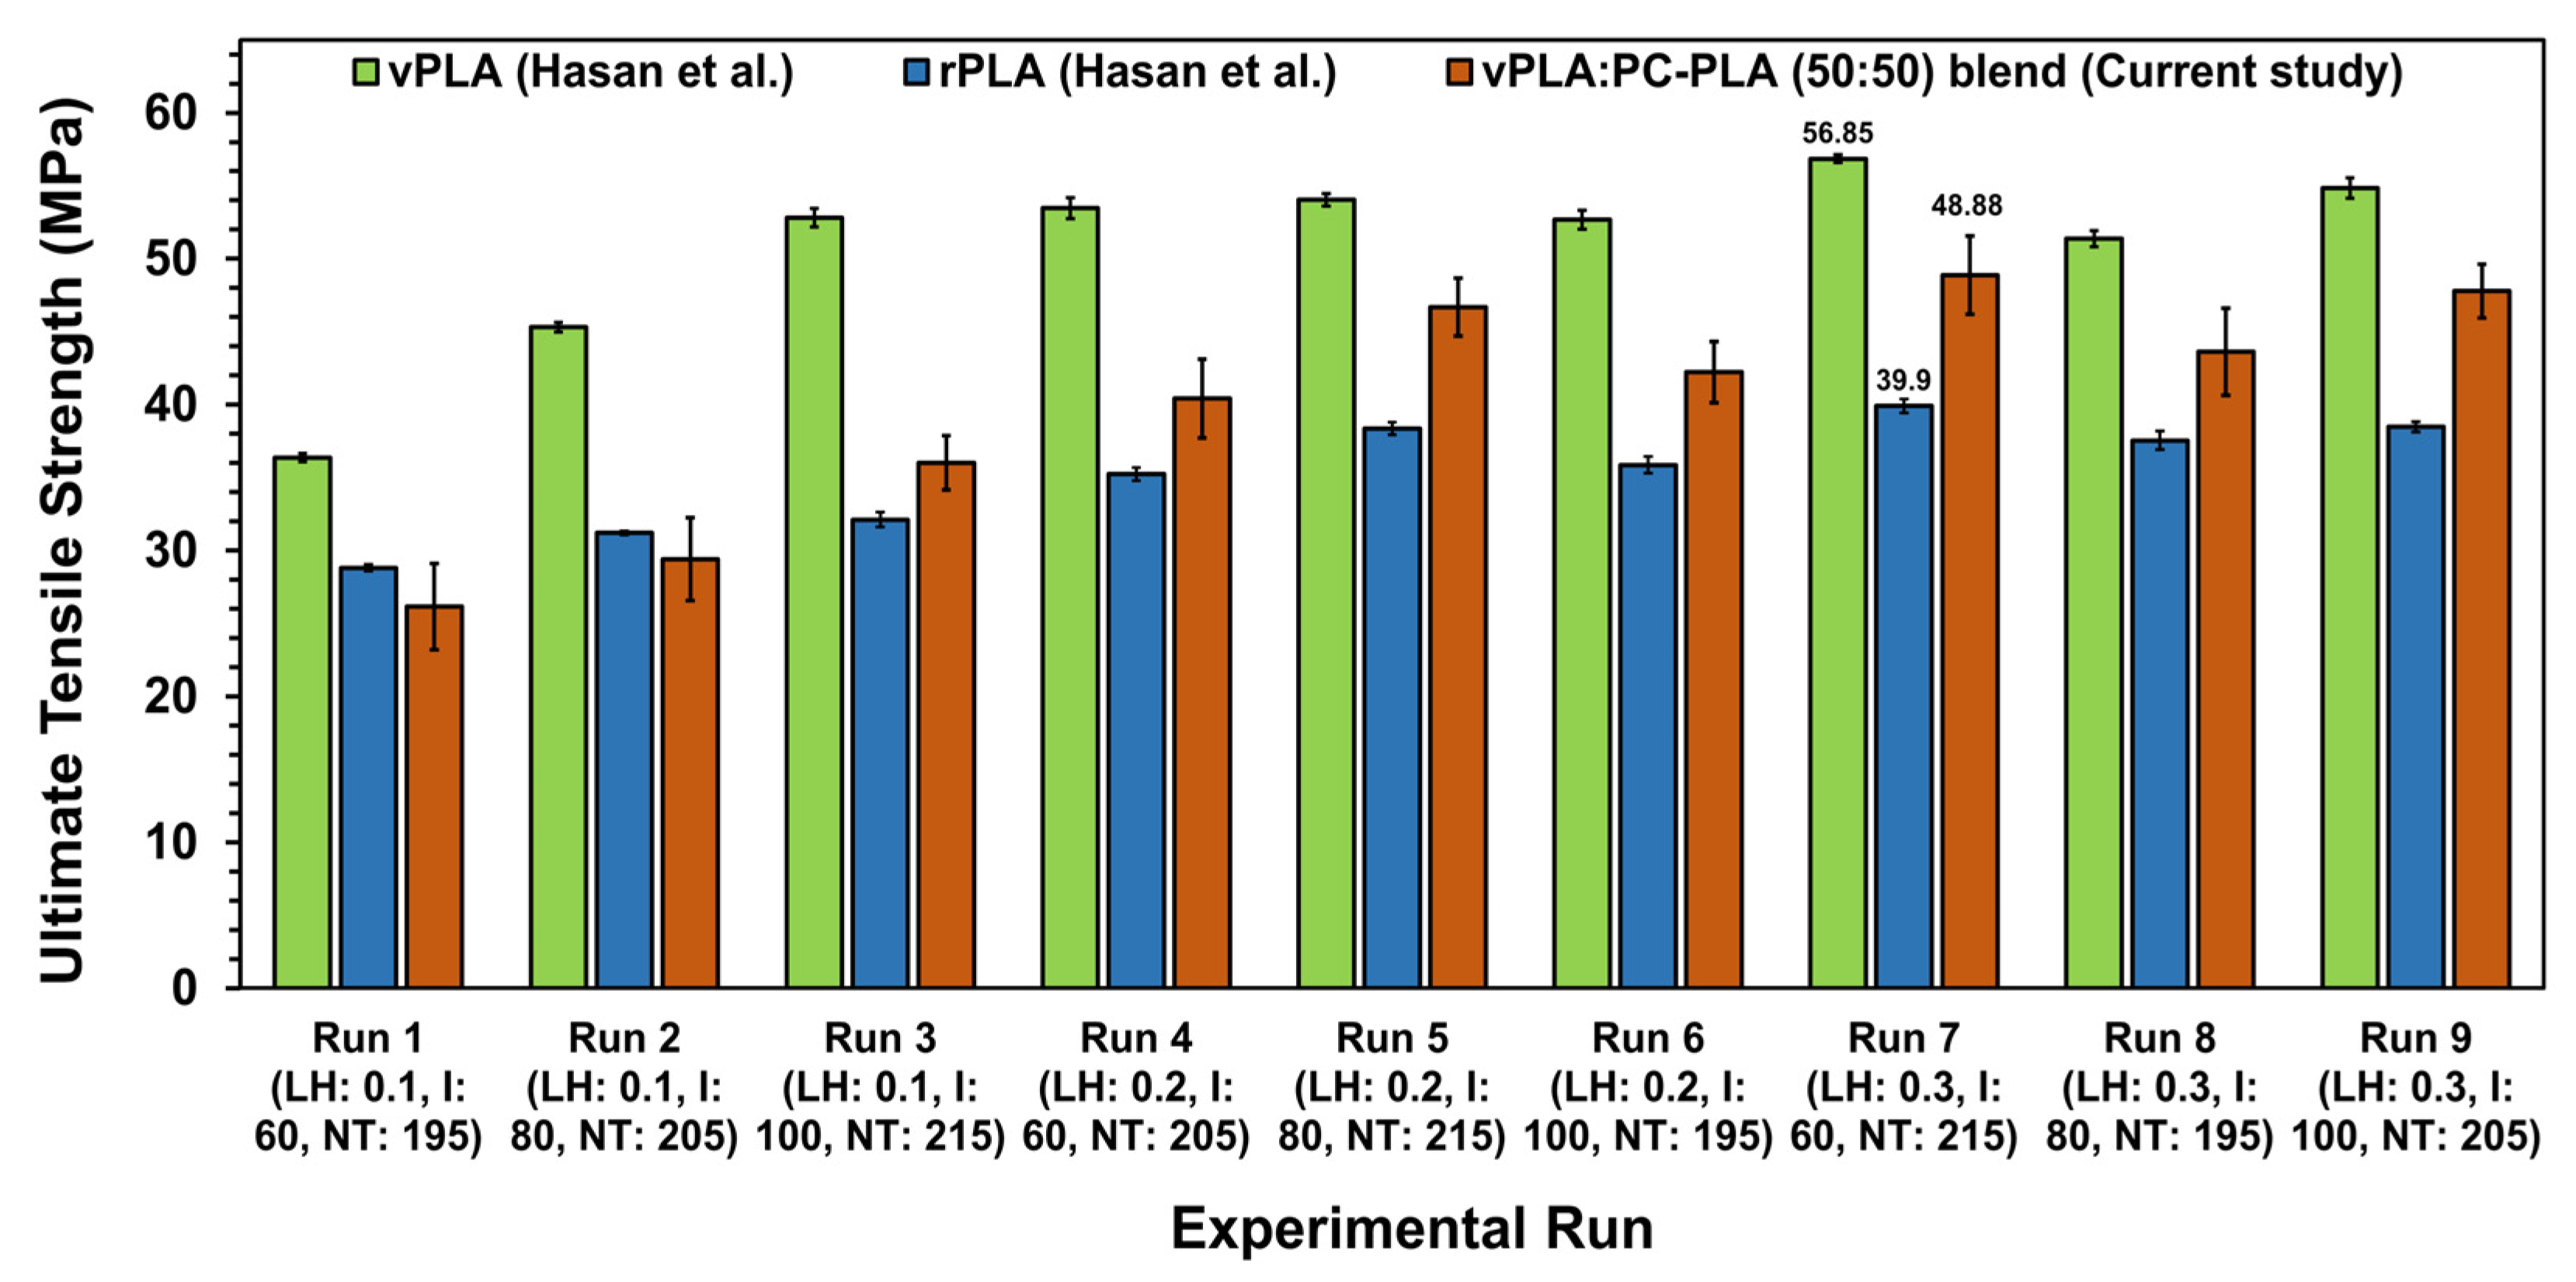
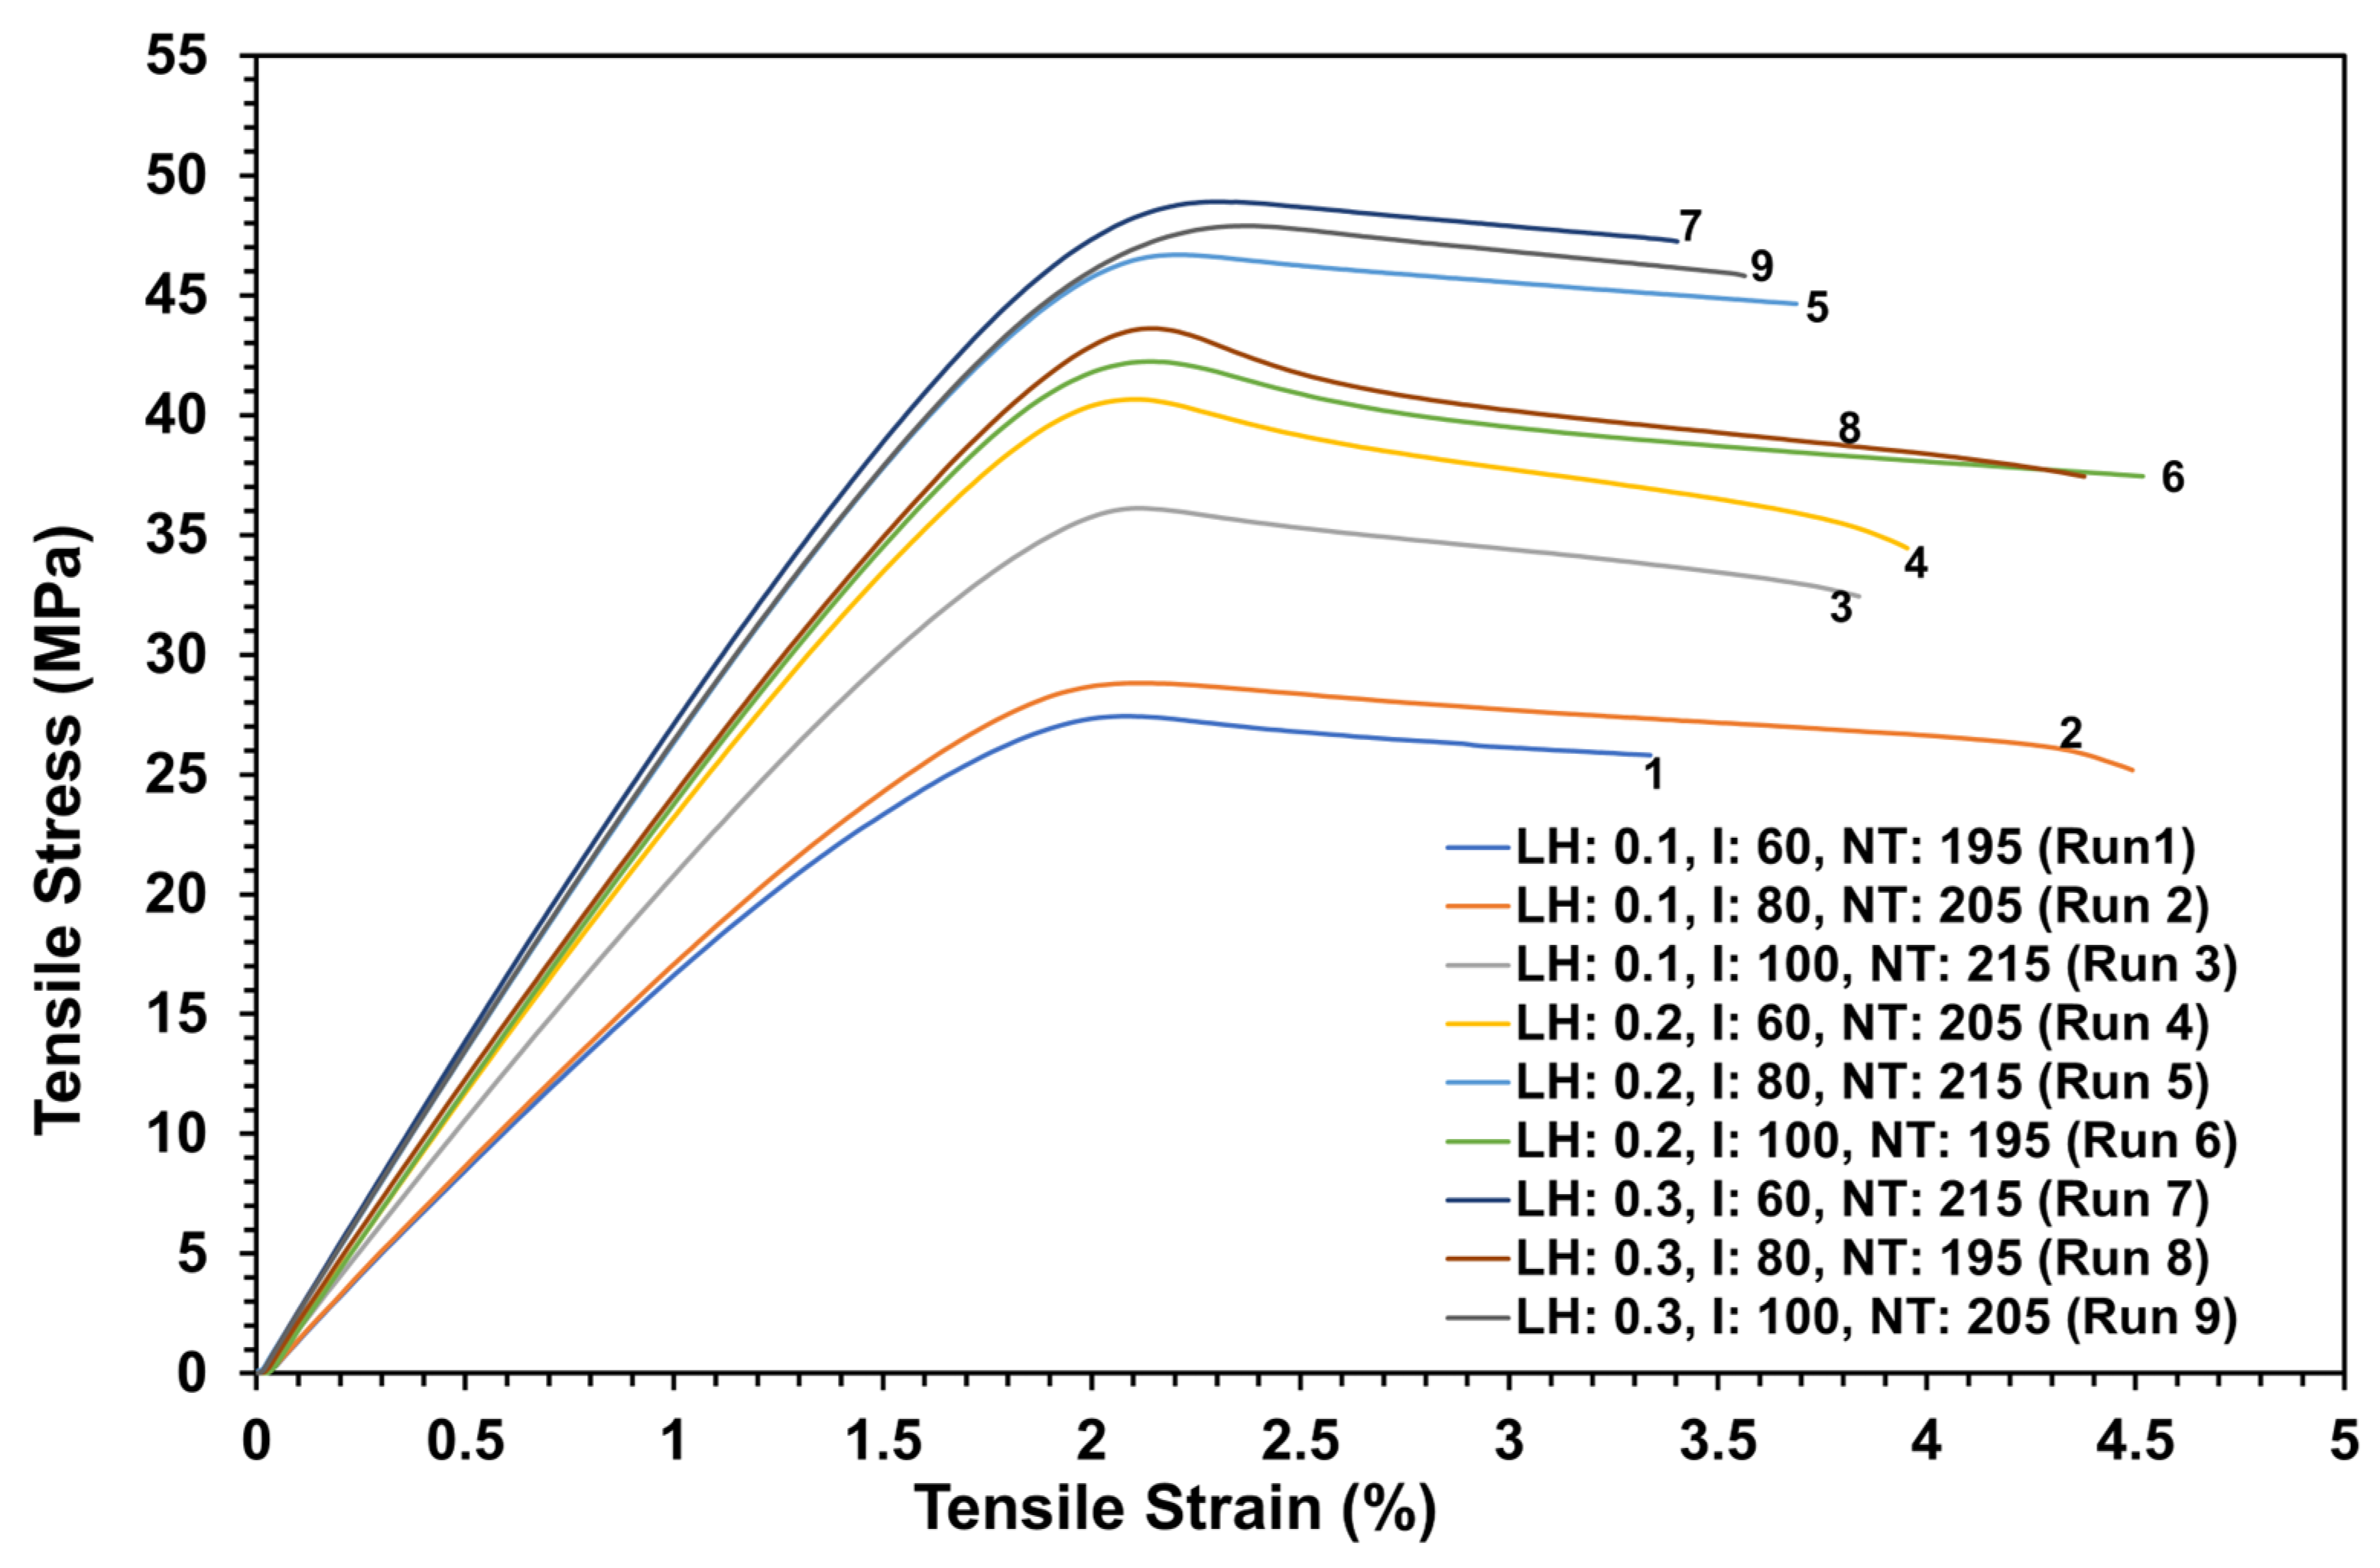
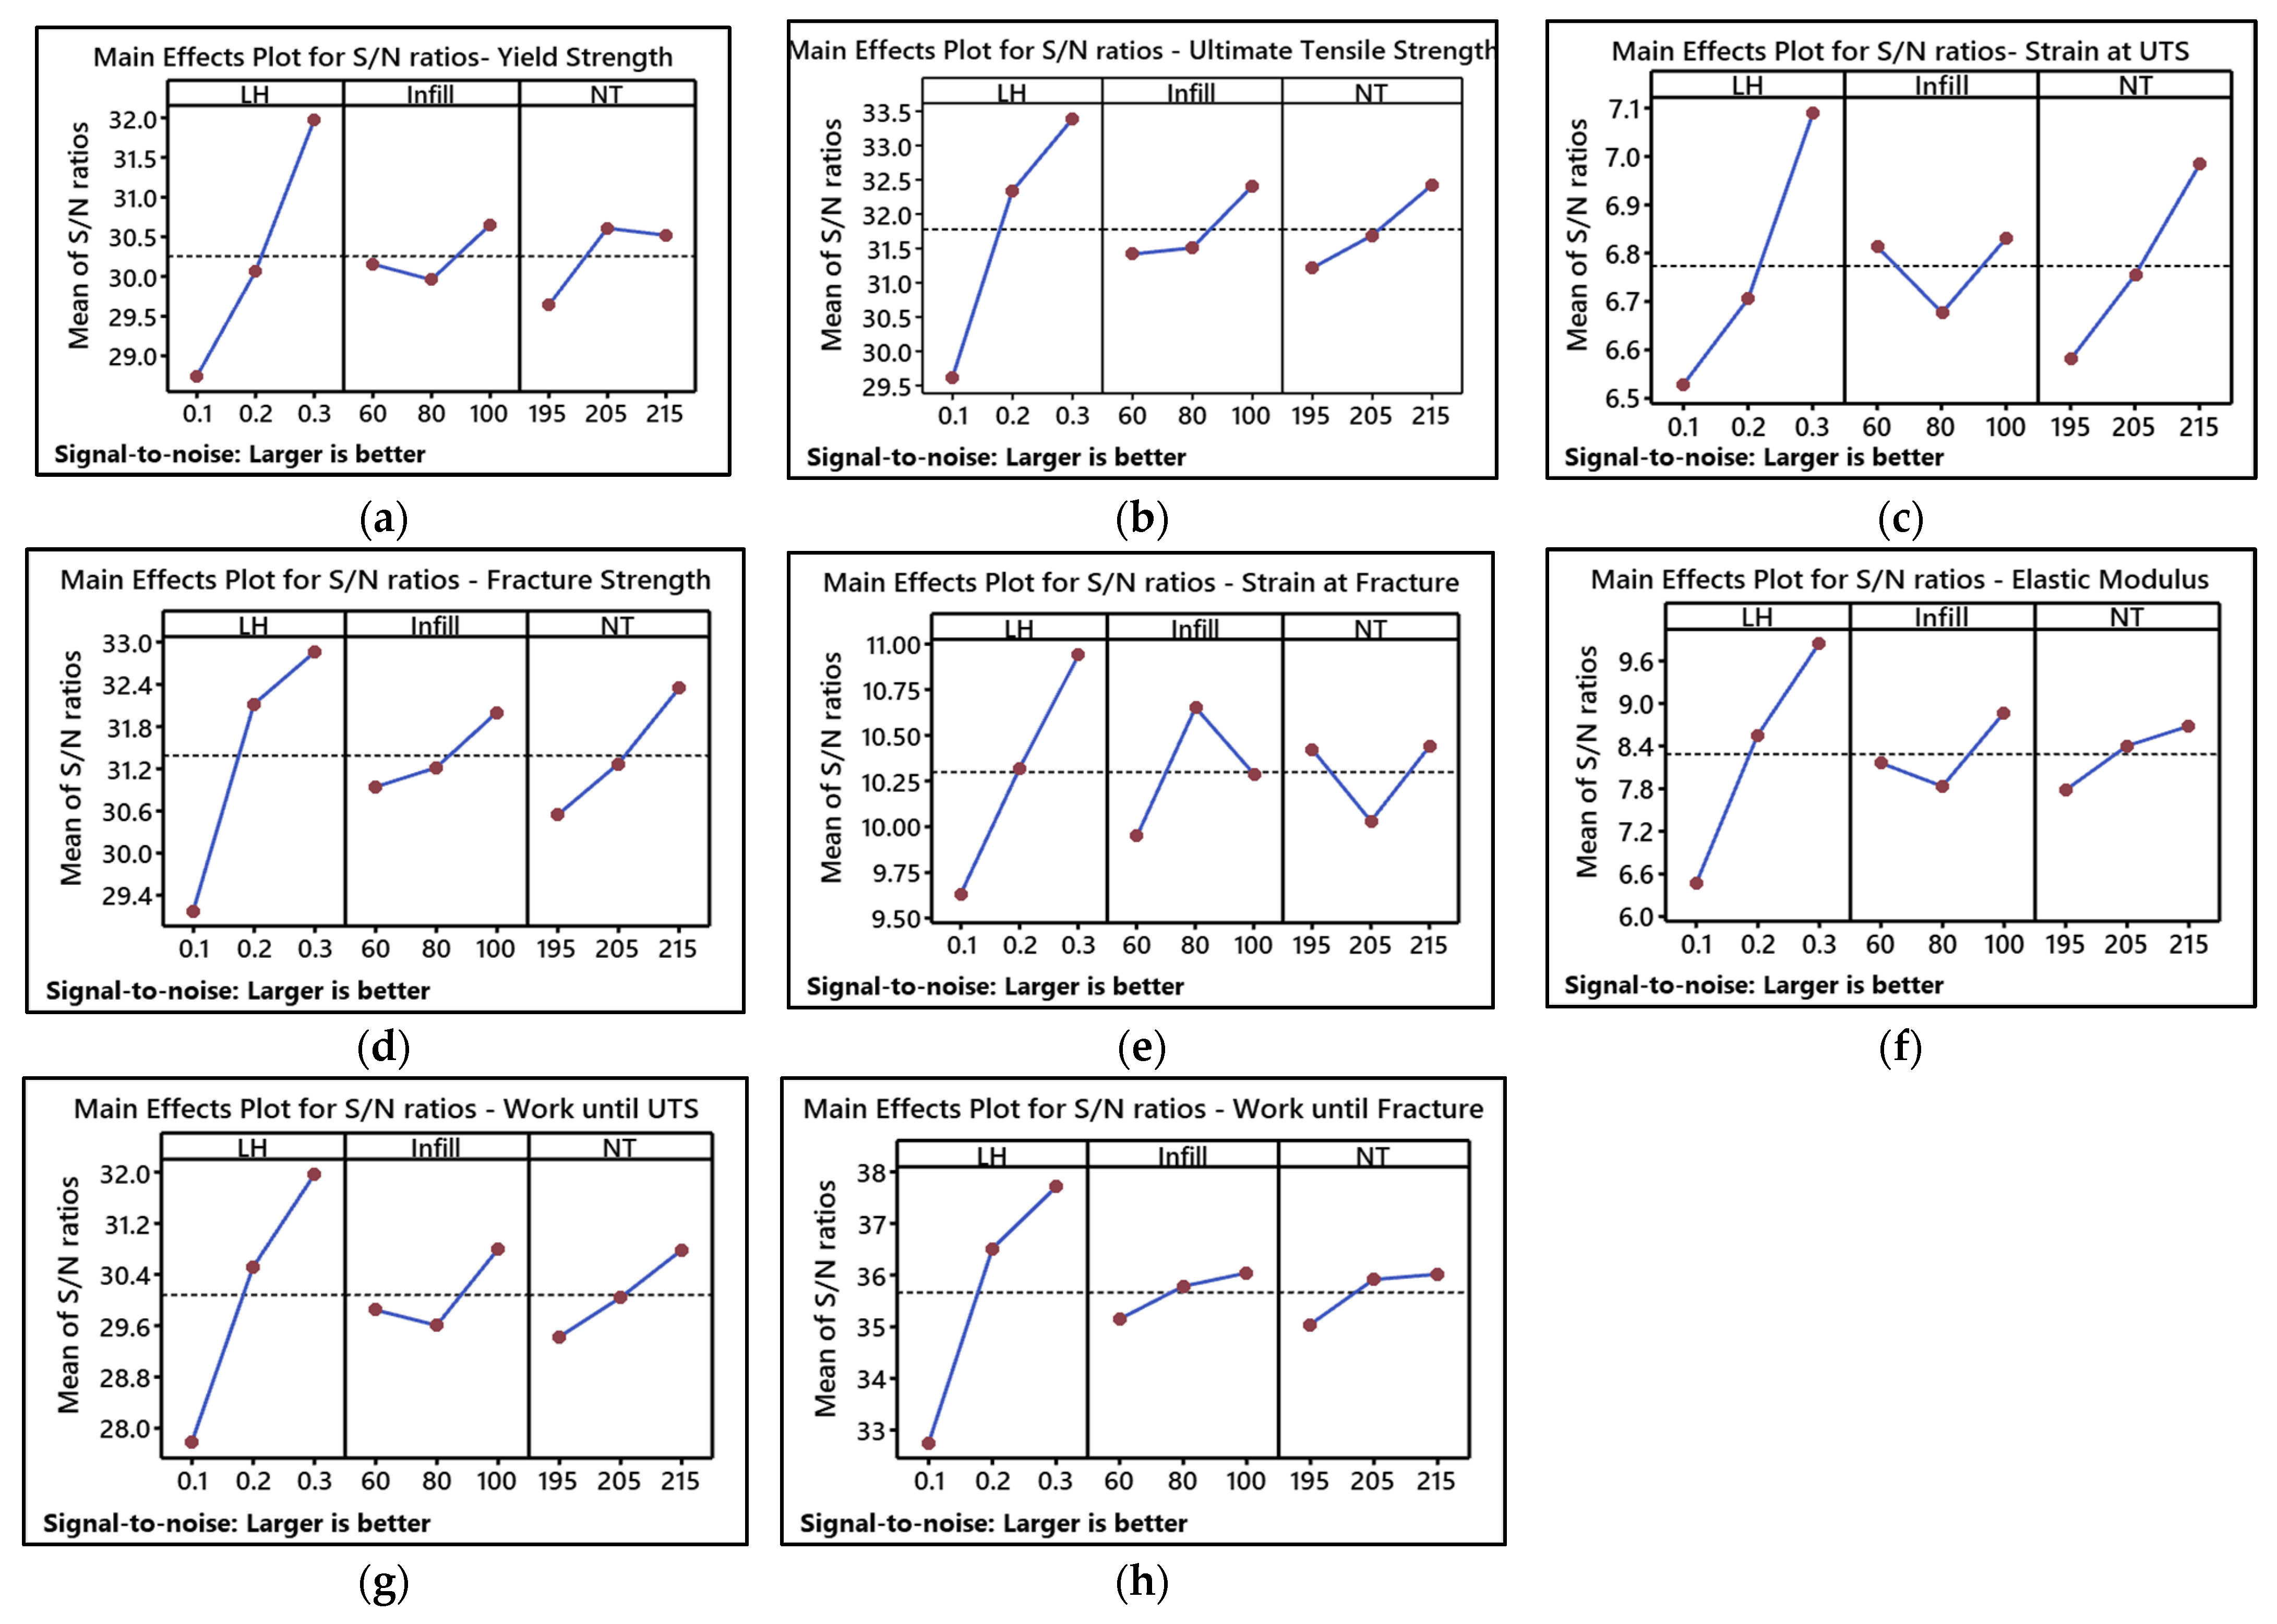
3.3. Tensile Behaviour

The tensile test results were obtained using the Taguchi OA for the three printing parameters examined in this study, namely, layer height, infill density, and printing temperature. Each Taguchi experiment involved testing five specimens, and consistent repeatability was demonstrated by the tensile results. Therefore, a single stress–strain curve representing each set of five specimens is presented in Figure 10. The stress–strain curve demonstrated that the fracture formed in the vPLA:PC-PLA (50:50) blended 3D-printed specimens exhibited ductile behaviour. In addition, the curves show that after reaching the maximum tensile stress, the tensile stress remained constant with a small increase in the strain values. The raw data obtained from the load and displacement after the tensile test were utilised to calculate the yield strength, ultimate tensile strength (UTS), strain at UTS, elastic modulus, fracture strength, strain at fracture, work until UTS, and work until fracture.
The results of the tensile test showed that the strength decreased when the specimens were printed at a lower temperature (195 °C) and smaller layer height (0.1 mm) and improved when they were printed at a higher temperature (215 °C) and larger layer height (0.3 mm). Studies have shown that specimens with a larger layer height (0.3 mm) exhibit the best tensile properties because they experience minimal distortions [71]. In FDM printing, the interlayer strength typically is lower than the intralayer strength. This is because the temperature gradient within a layer is less pronounced than that between consecutive layers, leading to the formation of weaker bonds between the layers [72]. The bonding strength between the layers is determined by the extruder temperature; a lower temperature restricts the molecular chains of the deposited material from reorganising adequately, thereby reducing the bonding strength between adjacent layers and ultimately lowering the tensile strength [72,73].
The highest tensile strength among the vPLA:PC-PLA (50:50) blended specimens was achieved at 48.88 MPa in experimental run 7 (LH: 0.3 mm, I: 60%, NT: 215 °C) (Table 3). The second highest value for the tensile strength was estimated to be 47.88 MPa for experimental run 9 (LH: 0.3 mm, I:100%, and NT: 205 °C), and the third highest value reached 46.67 MPa in experimental run 5 (LH: 0.2 mm, I: 100%, and NT: 215 °C).
A comparison of the tensile strengths of the vPLA:PC-PLA (50:50) blended specimens with 100% rPLA and 100% vPLA (as shown in Figure 11) [48] showed that, in general, the blended filament specimens exhibited higher tensile properties than those of the 100% rPLA samples, but were lower than those of the vPLA samples. For experimental run 7, the tensile strength of the blended specimens was 18.40% higher than the corresponding value of 39.90 MPa for the rPLA-printed specimens (Figure 11). For experimental runs 9 and 5, the blended specimens demonstrated increases of 20% and 17.81%, respectively, compared to the rPLA specimens. The enhancement in tensile strength observed in the blended specimens may be ascribed to the improved load transfer capacity resulting from the additional cross-linking of polymer chains caused by the blending process while increasing the interlayer bonding [38,74]. Previous research on polymer processing has demonstrated that blending extrusion can cause microstructural changes, which may involve higher shear forces, resulting in the alignment of polymer chains and thereby improving the tensile properties of the material [74,75].
In contrast, the tensile strengths of the rPLA samples in experimental runs 1 (LH: 0.1 mm, I: 60%, NT: 195 °C) and 2 (LH: 0.1 mm, I: 80%, NT: 205 °C) were higher than those of the blended samples for the same experimental runs by 9.23% and 5.76%, respectively. Notably, the tensile strength of the blended samples decreased with the decrease in the printing temperature and layer height. This decline can be attributed to the incomplete melting of the material caused by a smaller layer height, resulting in reduced layer-to-layer adhesion and subsequent brittleness [67]. In addition, the blended filament specimens showed a comparatively lower strain at fracture of 3.8 to 4.2% for all of the experimental runs, compared to the rPLA specimens, whose strain at fracture was 5.5 to 7% for the same printing parameters; however, this result is consistent with the strain at fracture of vPLA [48]. This phenomenon, which occurred in the blended filament samples, may be attributed to the moisture content of the material [76]. PLA plastic is known to be susceptible to moisture absorption, which can result in hydrolytic degradation during the filament extrusion process. This degradation may cause the breakdown of polymeric chains and decrease the material elongation [77,78,79]. However, the same moisture content acts as a plasticiser, making the material softer and more ductile [79].

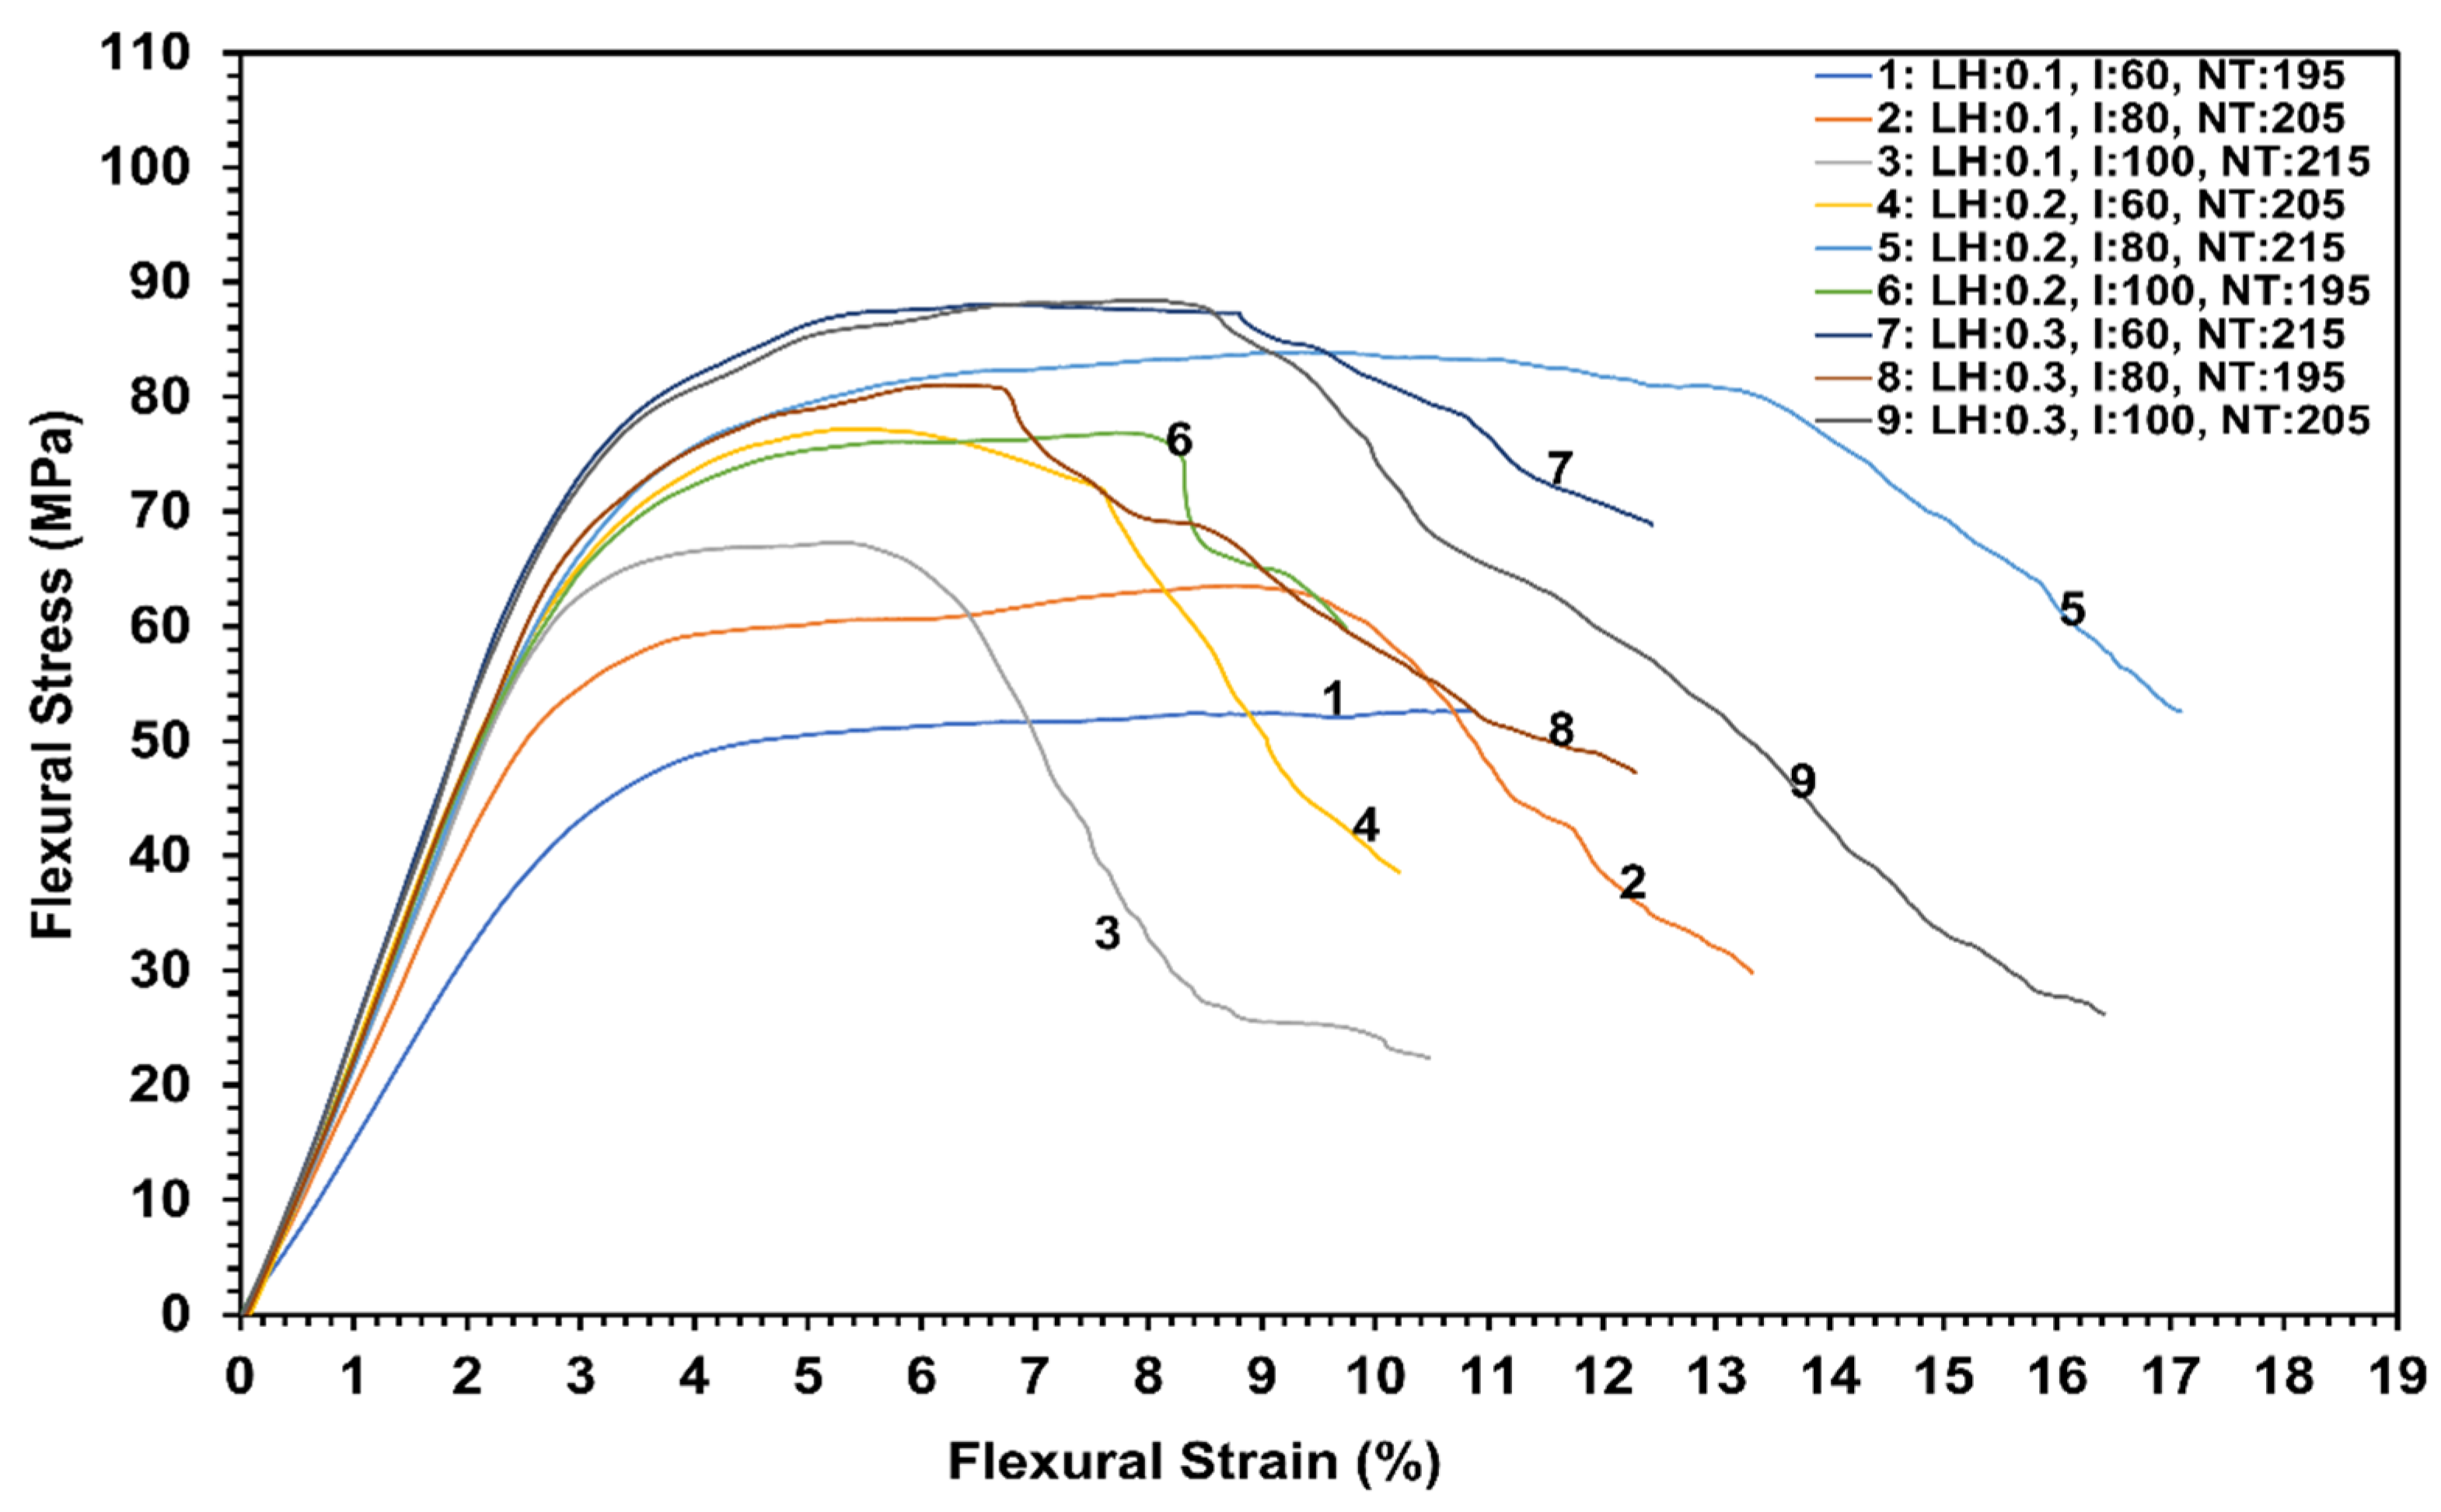
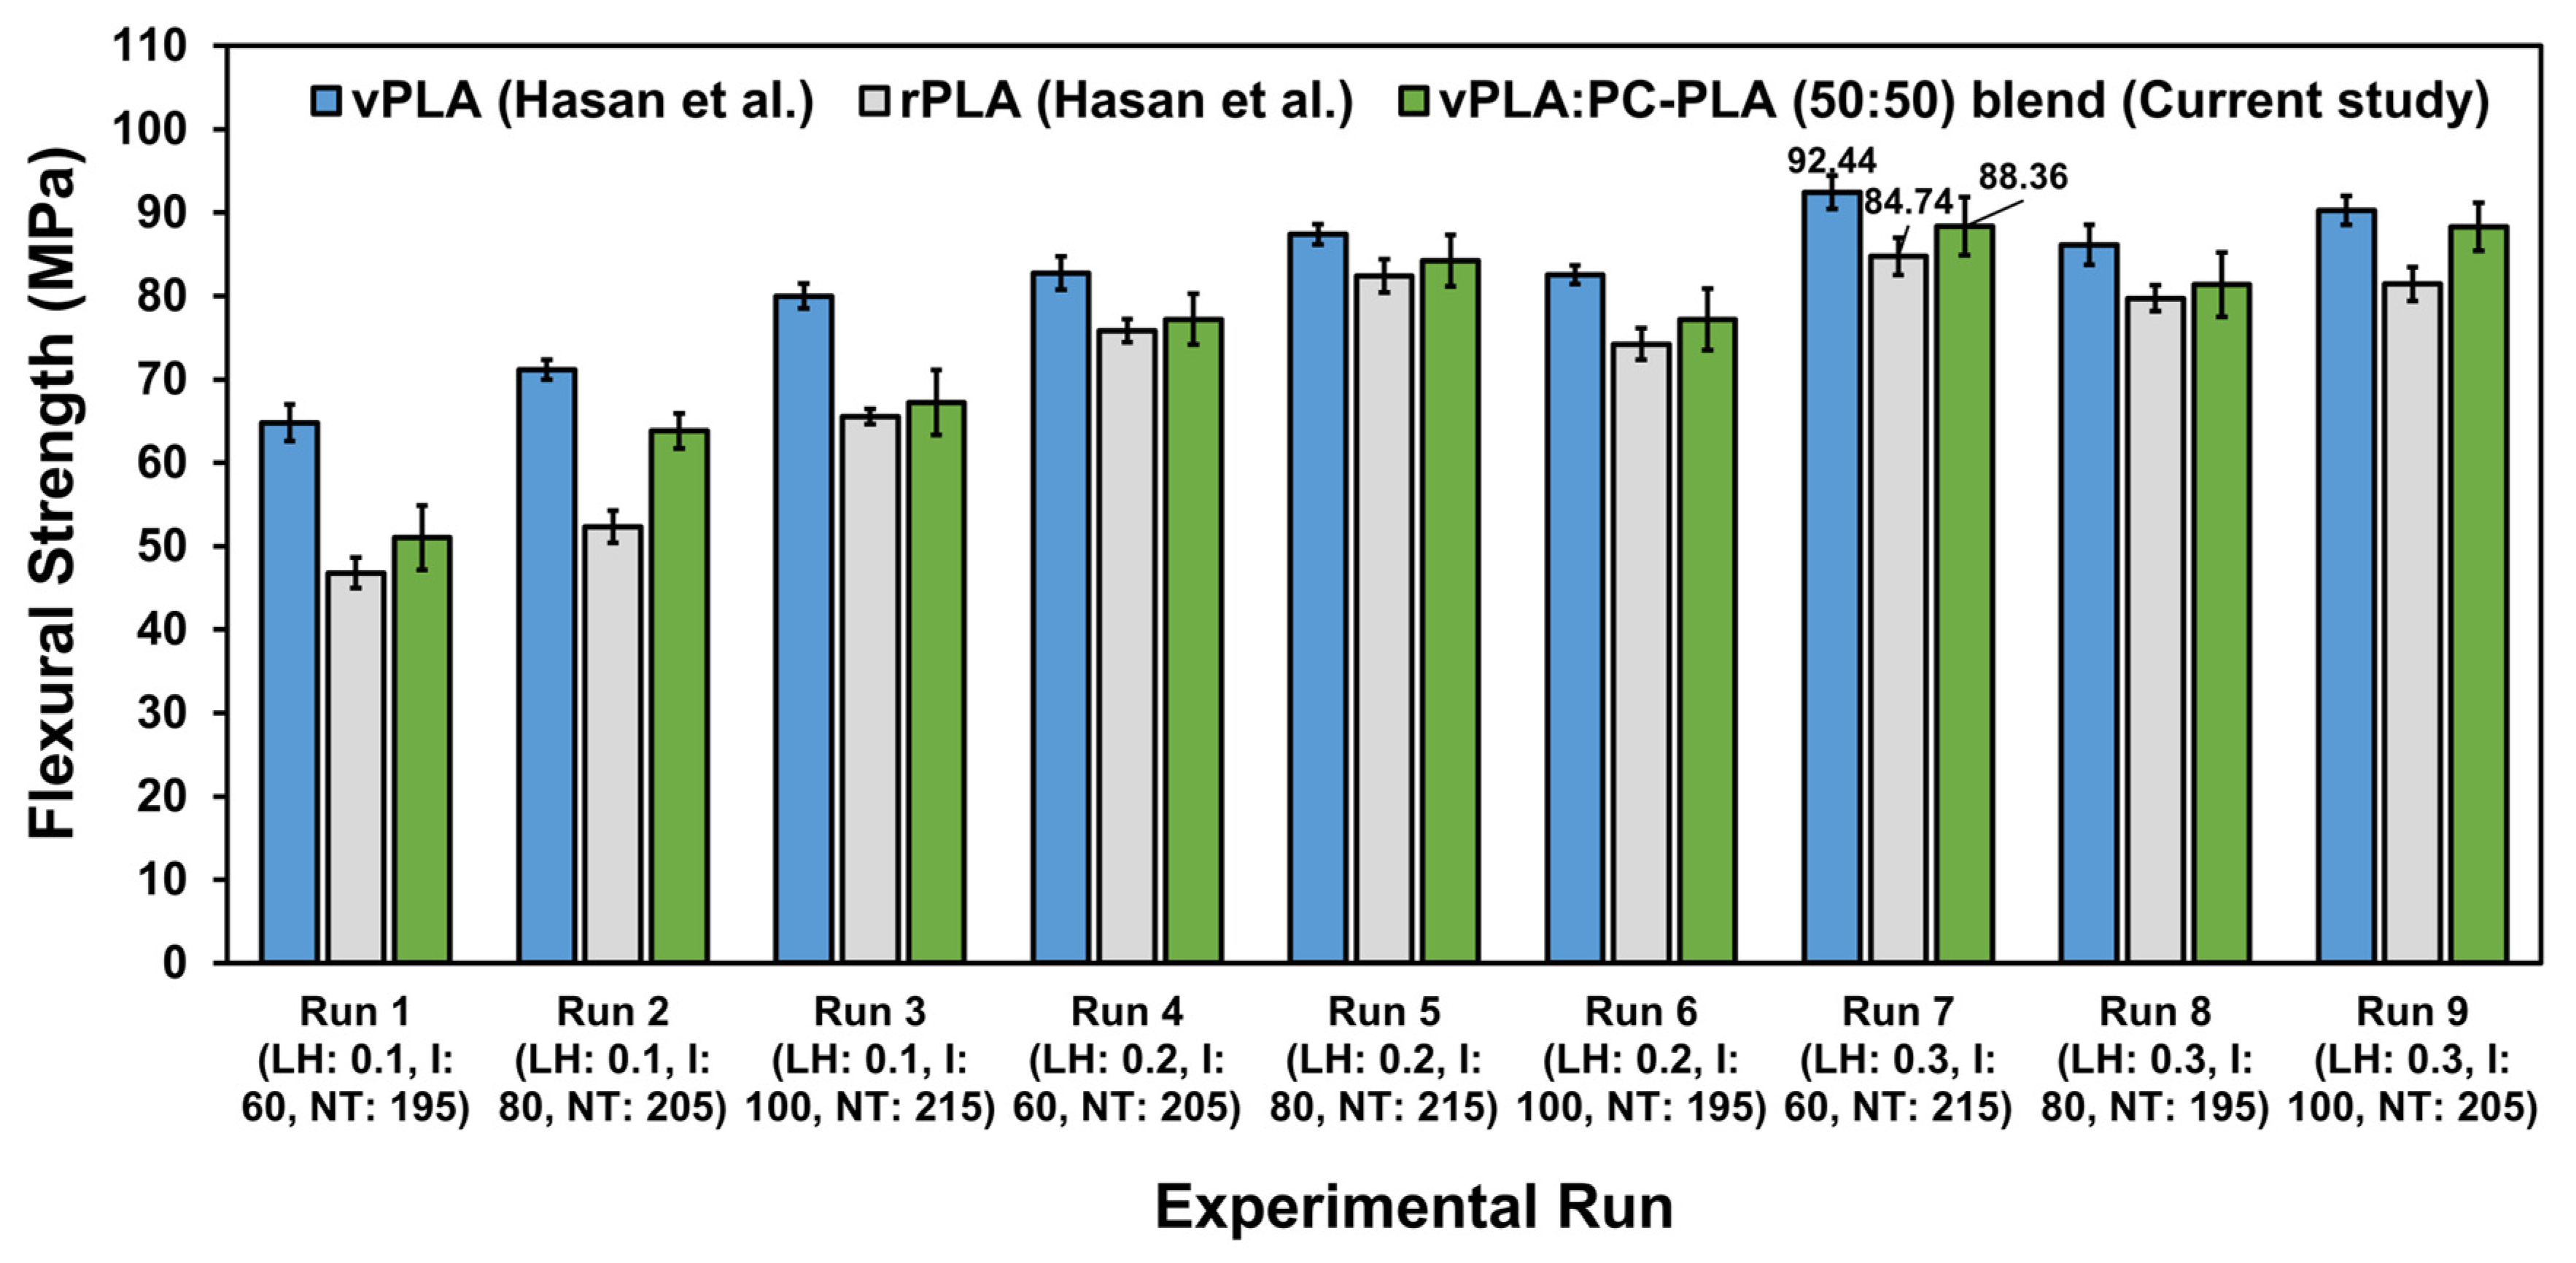
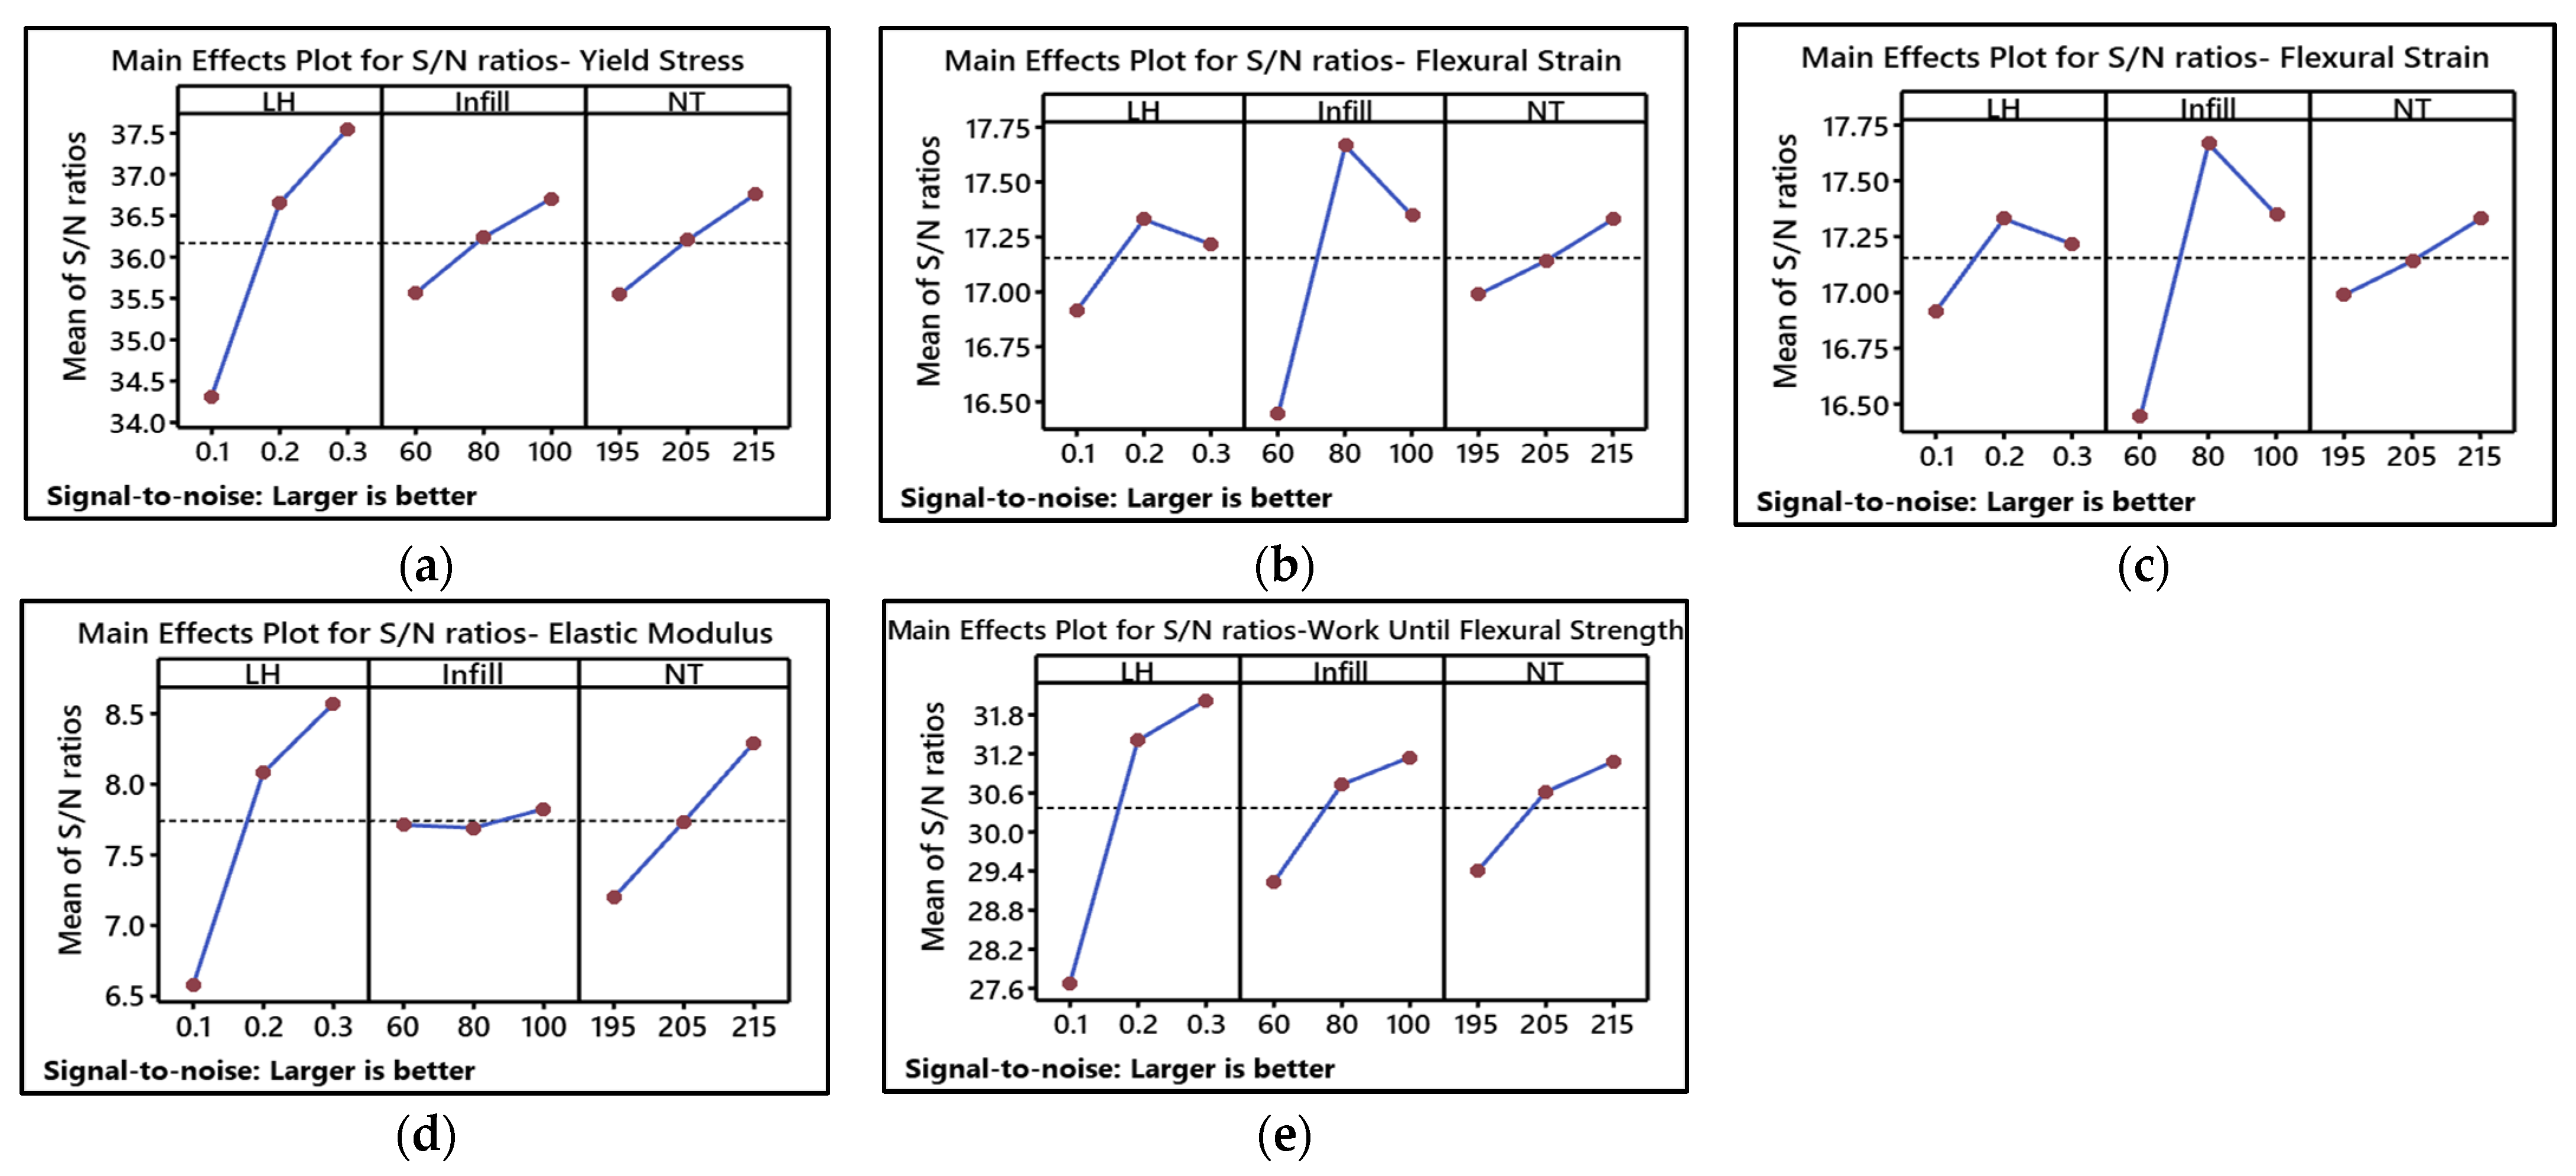
3.4. Flexural Behaviour

The effects of the printing parameters on the flexural properties (yield strength, flexural strength, flexural strain, elastic modulus, and work until flexural strength) of the 3D-printed vPLA:PC-PLA (50:50) blended specimens were obtained and examined through load-deflection data measured during the flexural tests for each set of experimental runs. A total of 45 flexural tests were performed, with five tests for each experimental run. Typical flexural stress–strain curves for each experimental run are shown in Figure 12. The selection of the flexural stress–strain curves in the figure represents the average flexural strength level for each set of experimental runs. The behaviour observed during the flexural tests revealed that the blended samples did not reach the fracture point, which suggests that the samples were ductile and had a high degree of plastic deformation. Examining the stress–strain curves, it is evident that the blended specimens with a larger layer height and high nozzle temperature exhibited the highest flexural stress. Conversely, as the layer height and nozzle temperature were reduced, the flexural stress value tended to decrease, exhibiting a trend similar to that observed for tensile strength.
A summary of the flexural tests for each experimental run of the vPLA:PC-PLA (50:50) blended specimens is presented in Table 4, which lists the average results of the yield stress, maximum flexural stress, flexural strain, elastic modulus, and work until the maximum flexural stress with the standard deviation. The standard deviation (1.65–4.34%) indicated the excellent repeatability and reliability of the obtained data. The highest flexural stress, 88.36 MPa, was observed in experimental run 7 (LH: 0.3 mm, I: 100%, NT: 205 °C), followed by experimental run 9 (LH: 0.3 mm, I: 100%, NT: 205 °C), which is 88.29 MPa, which showed a similar value. The results clearly show the impact of a larger layer height and nozzle parameters on the flexural properties. The results of this study are consistent with those of other studies that have demonstrated a similar trend with regard to the impact of printing parameters on the flexural properties [48,80,81]. A comparison of the vPLA:PC-PLA (50:50) blended specimens with 100% recycled PLA and 100% vPLA showed a clear increase in their flexural properties compared to those of the rPLA specimens and a slightly lower result than that of the vPLA specimens under the same experimental conditions (Figure 13). The flexural strength of the blended specimen for experimental run 7 was 8% higher than that of the recycled PLA and 4.5% lower than that of vPLA for the same printing parameters [48]. The second highest values of the blended specimens for experimental runs 9 and 5 were 8.41% and 2.3% higher than those of the rPLA specimens and 2.2% and 3.62% lower than those of the vPLA specimens, respectively. Overall, the flexural strength of the blended printed samples for all experimental runs increased by 5–15% compared to that of the recycled PLA-printed samples. This improvement in strength is attributed to the elevated crystallinity and enhanced interfacial bonding among the constituent elements [63]. Research has revealed that a distinct crystal structure is formed when virgin polymers are combined with recycled polymers, which co-crystallise to create stereocomplex crystallites. These crystals increase the melting temperature, and their presence may significantly improve the properties of blended PLA specimens [82,83]. In addition, vPLA acts as a “bridge” within the blended system, reducing the phase boundary between the polymers and enhancing their bonding. This results in improved flexural properties because the phases between the polymers allow for closer connections [84].

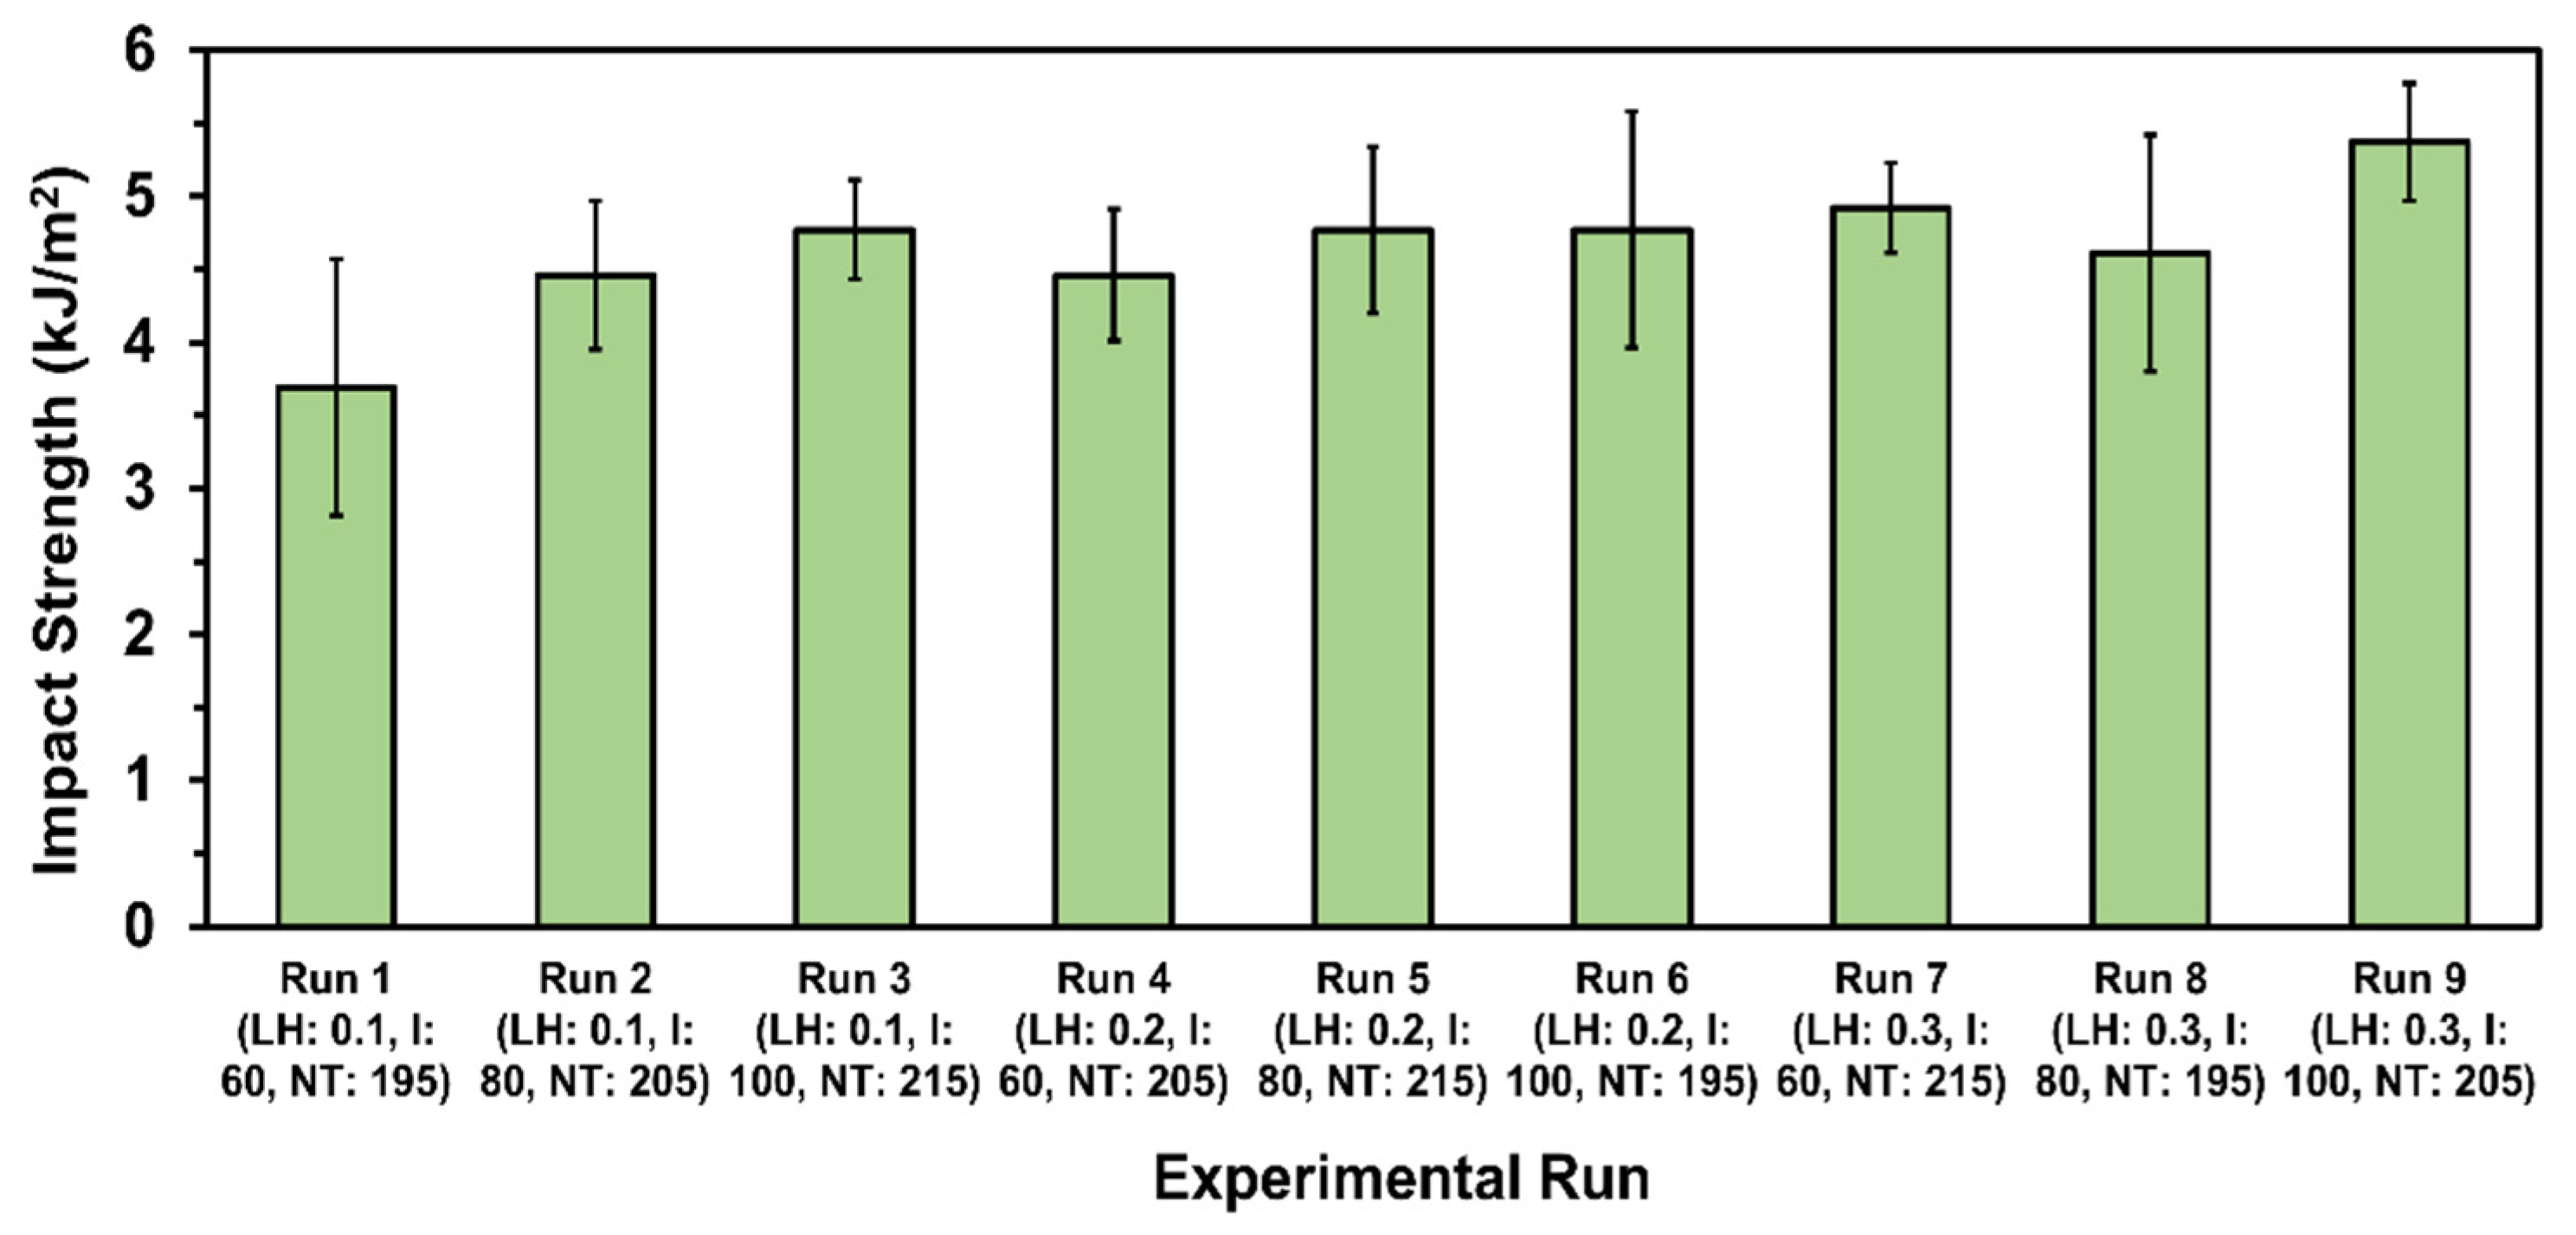
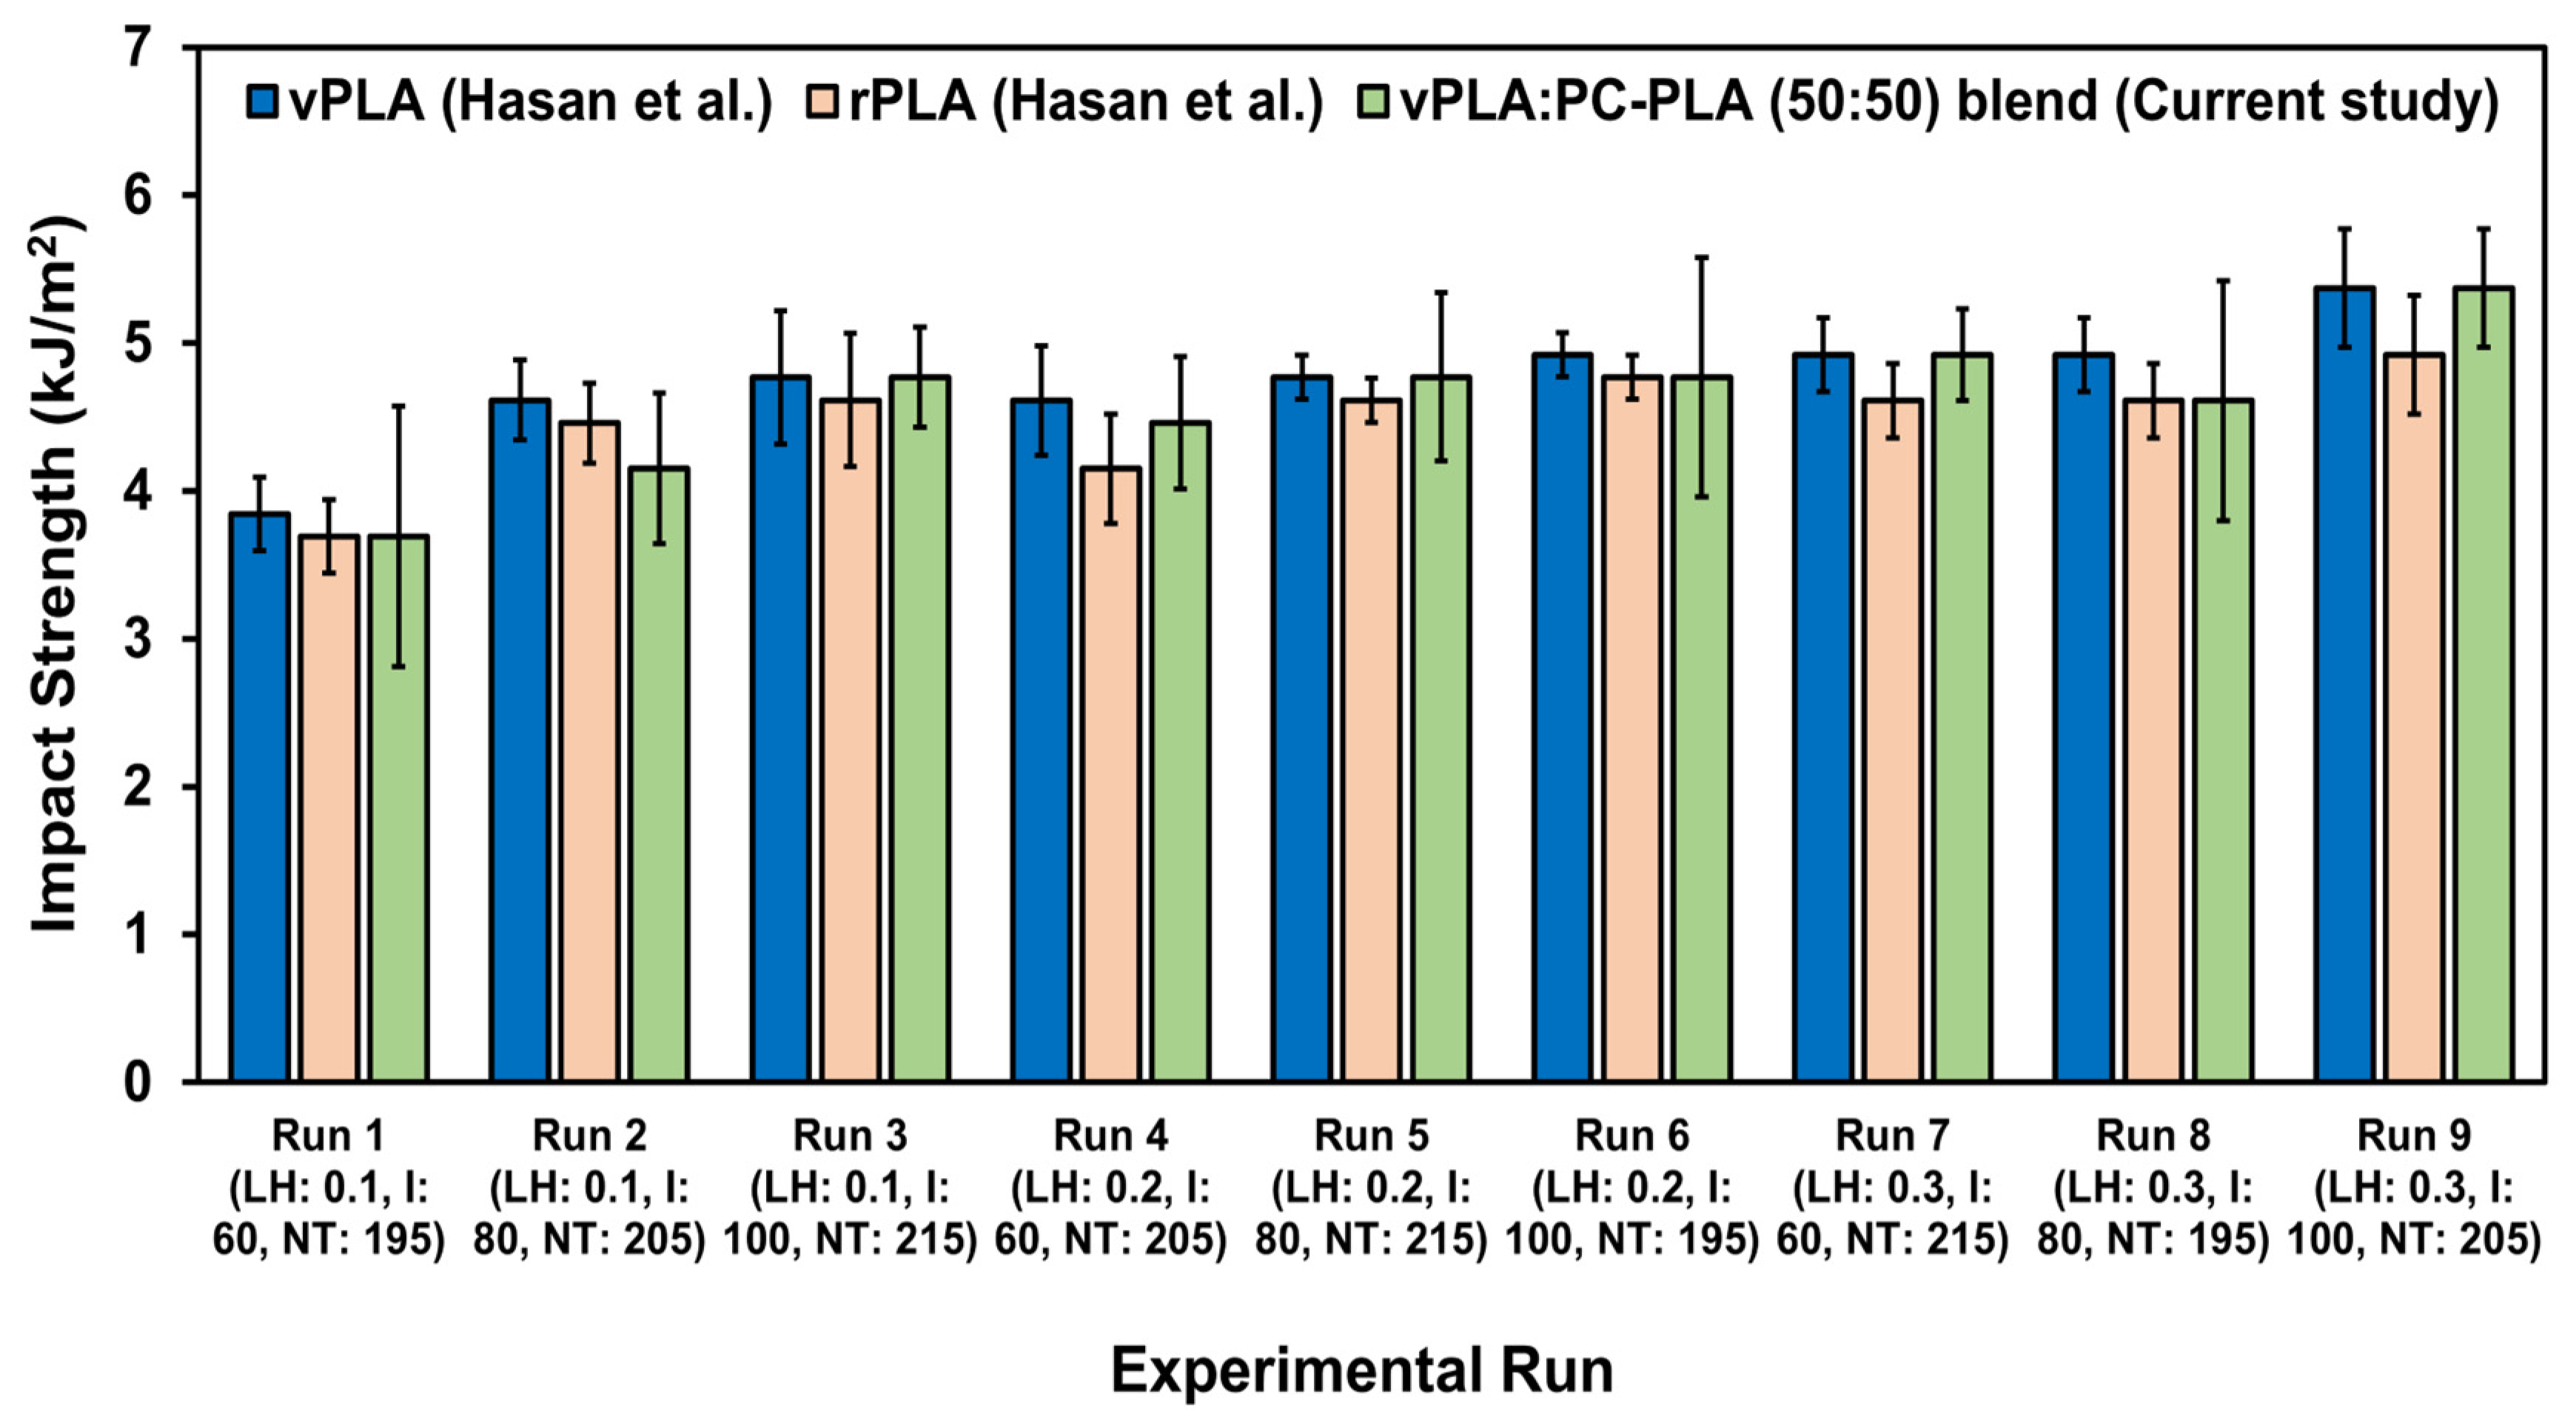
3.5. Impact Behaviour

The results of the Charpy impact tests are depicted in Figure 14. The results indicated that the impact strength of the vPLA:PC-PLA (50:50) blended specimens was influenced by the layer height and infill percentage. The lowest impact strength, measuring 3.69 kJ/m2, was observed in run 1 (LH: 0.1 mm, I: 60%, NT: 195 °C) when the samples were printed with a low layer height and infill. In contrast, the highest impact strength among all the experimental runs was recorded at a value of 5.37 kJ/m2 in experimental run 9 (LH: 0.3 mm, I: 100%, NT: 205 °C) when both the layer height and infill were at their maximum. This value was 40% higher than that in run 1. As examined by Syrlybayev et al. [85], an escalation in the infill rate leads to a reduction in the number of voids in the printed substance. A higher amount of material, resulting from the increased infill percentage, is capable of absorbing the force of impact. In addition, a larger layer height offers more resistance to the impact forces. This is because fewer layers are deposited at a larger layer height; therefore, fewer bonding lines and voids exist between the layers, which also helps to improve the impact strength [86].
A comparison of the impact strength data (Figure 15) for the vPLA:PC-PLA (50:50) blended specimens with those of 100% rPLA and 100% vPLA [48] showed that the vPLA:PC-PLA (50:50) blended specimens exhibited a 9.15% higher impact strength than the rPLA samples and an approximately similar impact strength to that of the vPLA specimens when printed at a larger layer height and high infill (experimental run 9). The impact test results showed that when vPLA was incorporated into PC-PLA, it acted as the centre of the built-in stress, resulting in an increased capacity for absorbing energy during the impact test and enhancing the impact strength [87]. In addition, owing to the increase in infill density, the interlayer adhesion between two consecutive layers increases, which improves the impact strength [88,89]. In contrast, the blended specimens performed poorly compared to rPLA when printed using a smaller layer height and lower temperature, as in experimental runs 1 and 2. The tensile test results also demonstrated a low impact strength for the smaller-layer-height specimens printed at a low temperature (Figure 11). These defects originated from the poor interfacial bonding between vPLA and PC-PLA at a lower nozzle temperature and layer height, which might have reduced the impact strength [86,87]. In addition, a lower layer height results in a higher number of bonding lines between the layers, which leads to a higher probability of void formation. This phenomenon contributes to the premature failure of the specimen, resulting in a lower impact strength [87,88]. Moreover, a lower nozzle temperature can potentially result in the formation of interlayer gaps, facilitating inadequate adhesion between layers during the printing process. Consequently, when the specimens are subjected to loading during impact testing, these interlayer gaps can propagate further cracking, ultimately resulting in material failure [88].

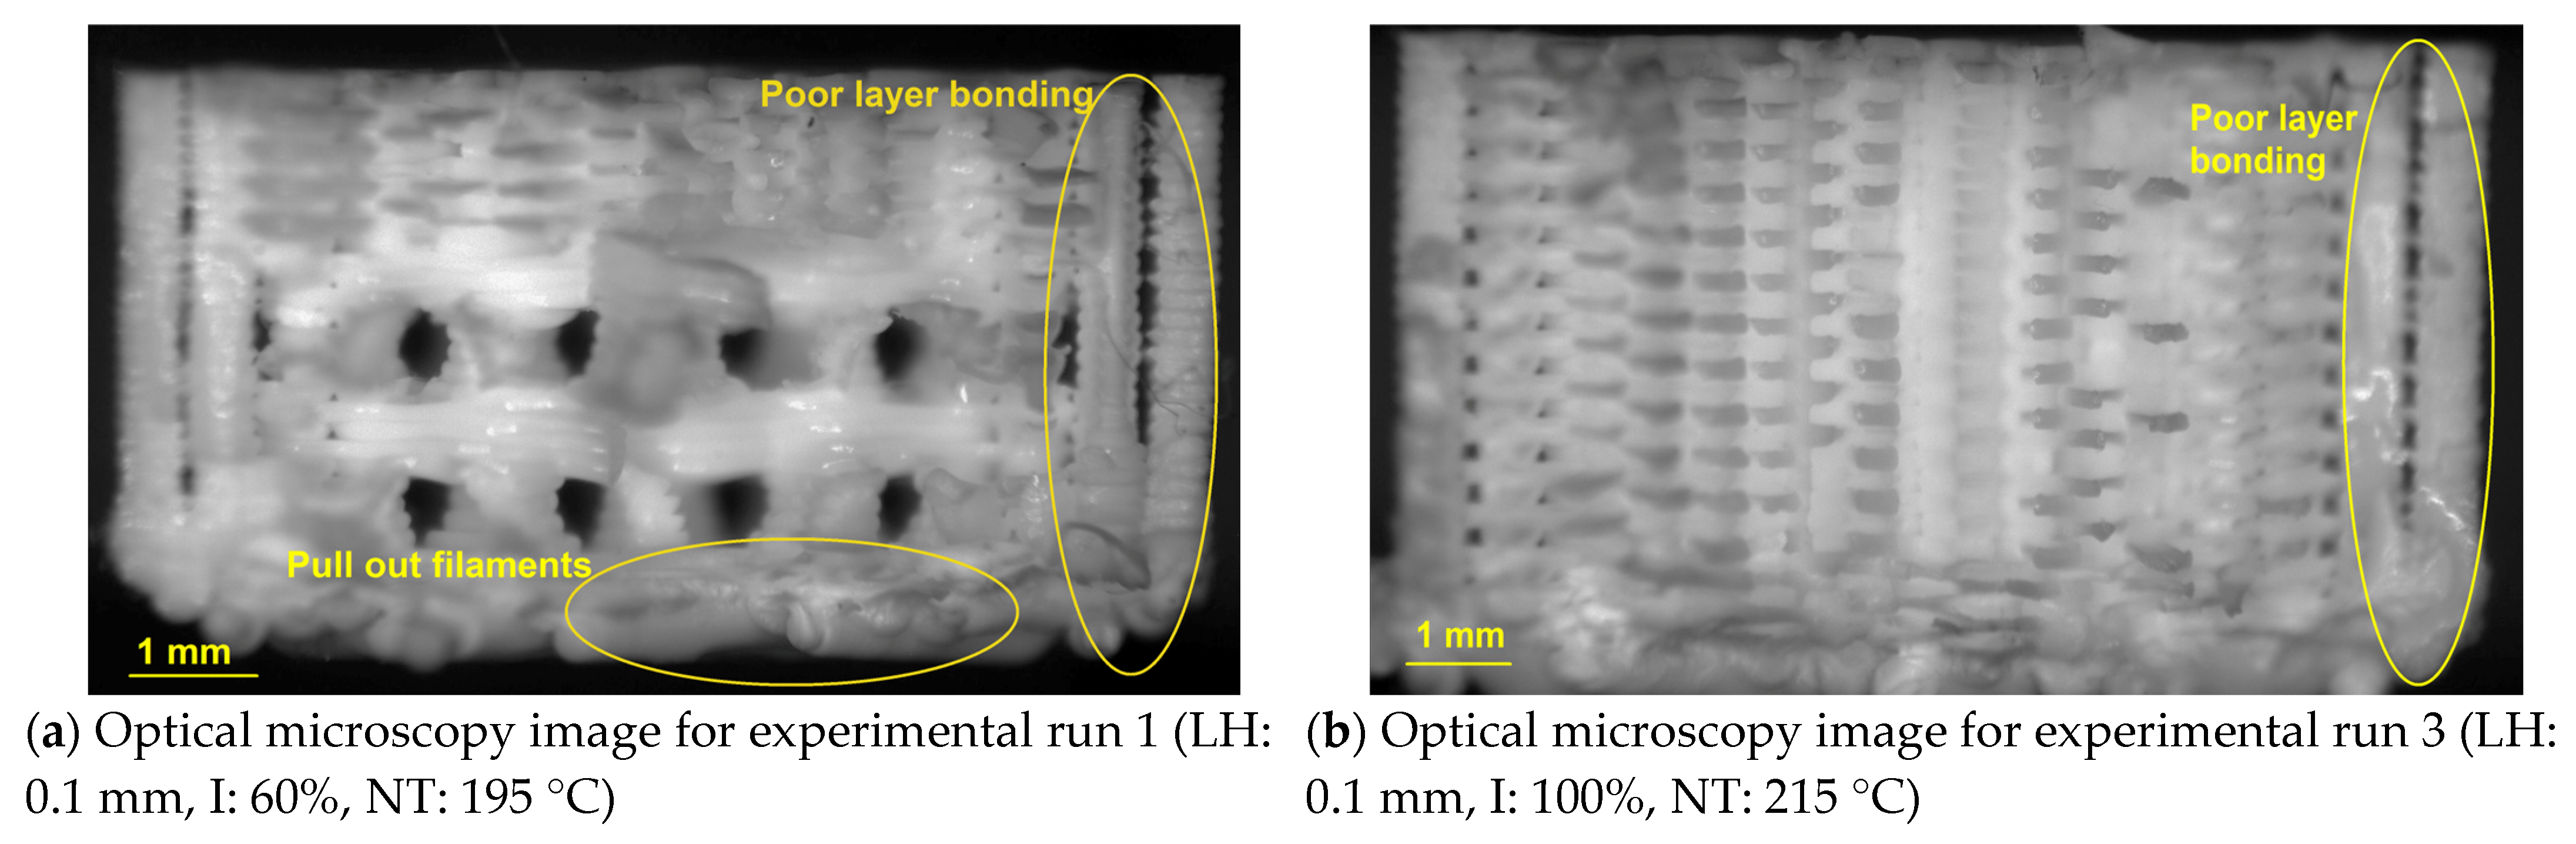
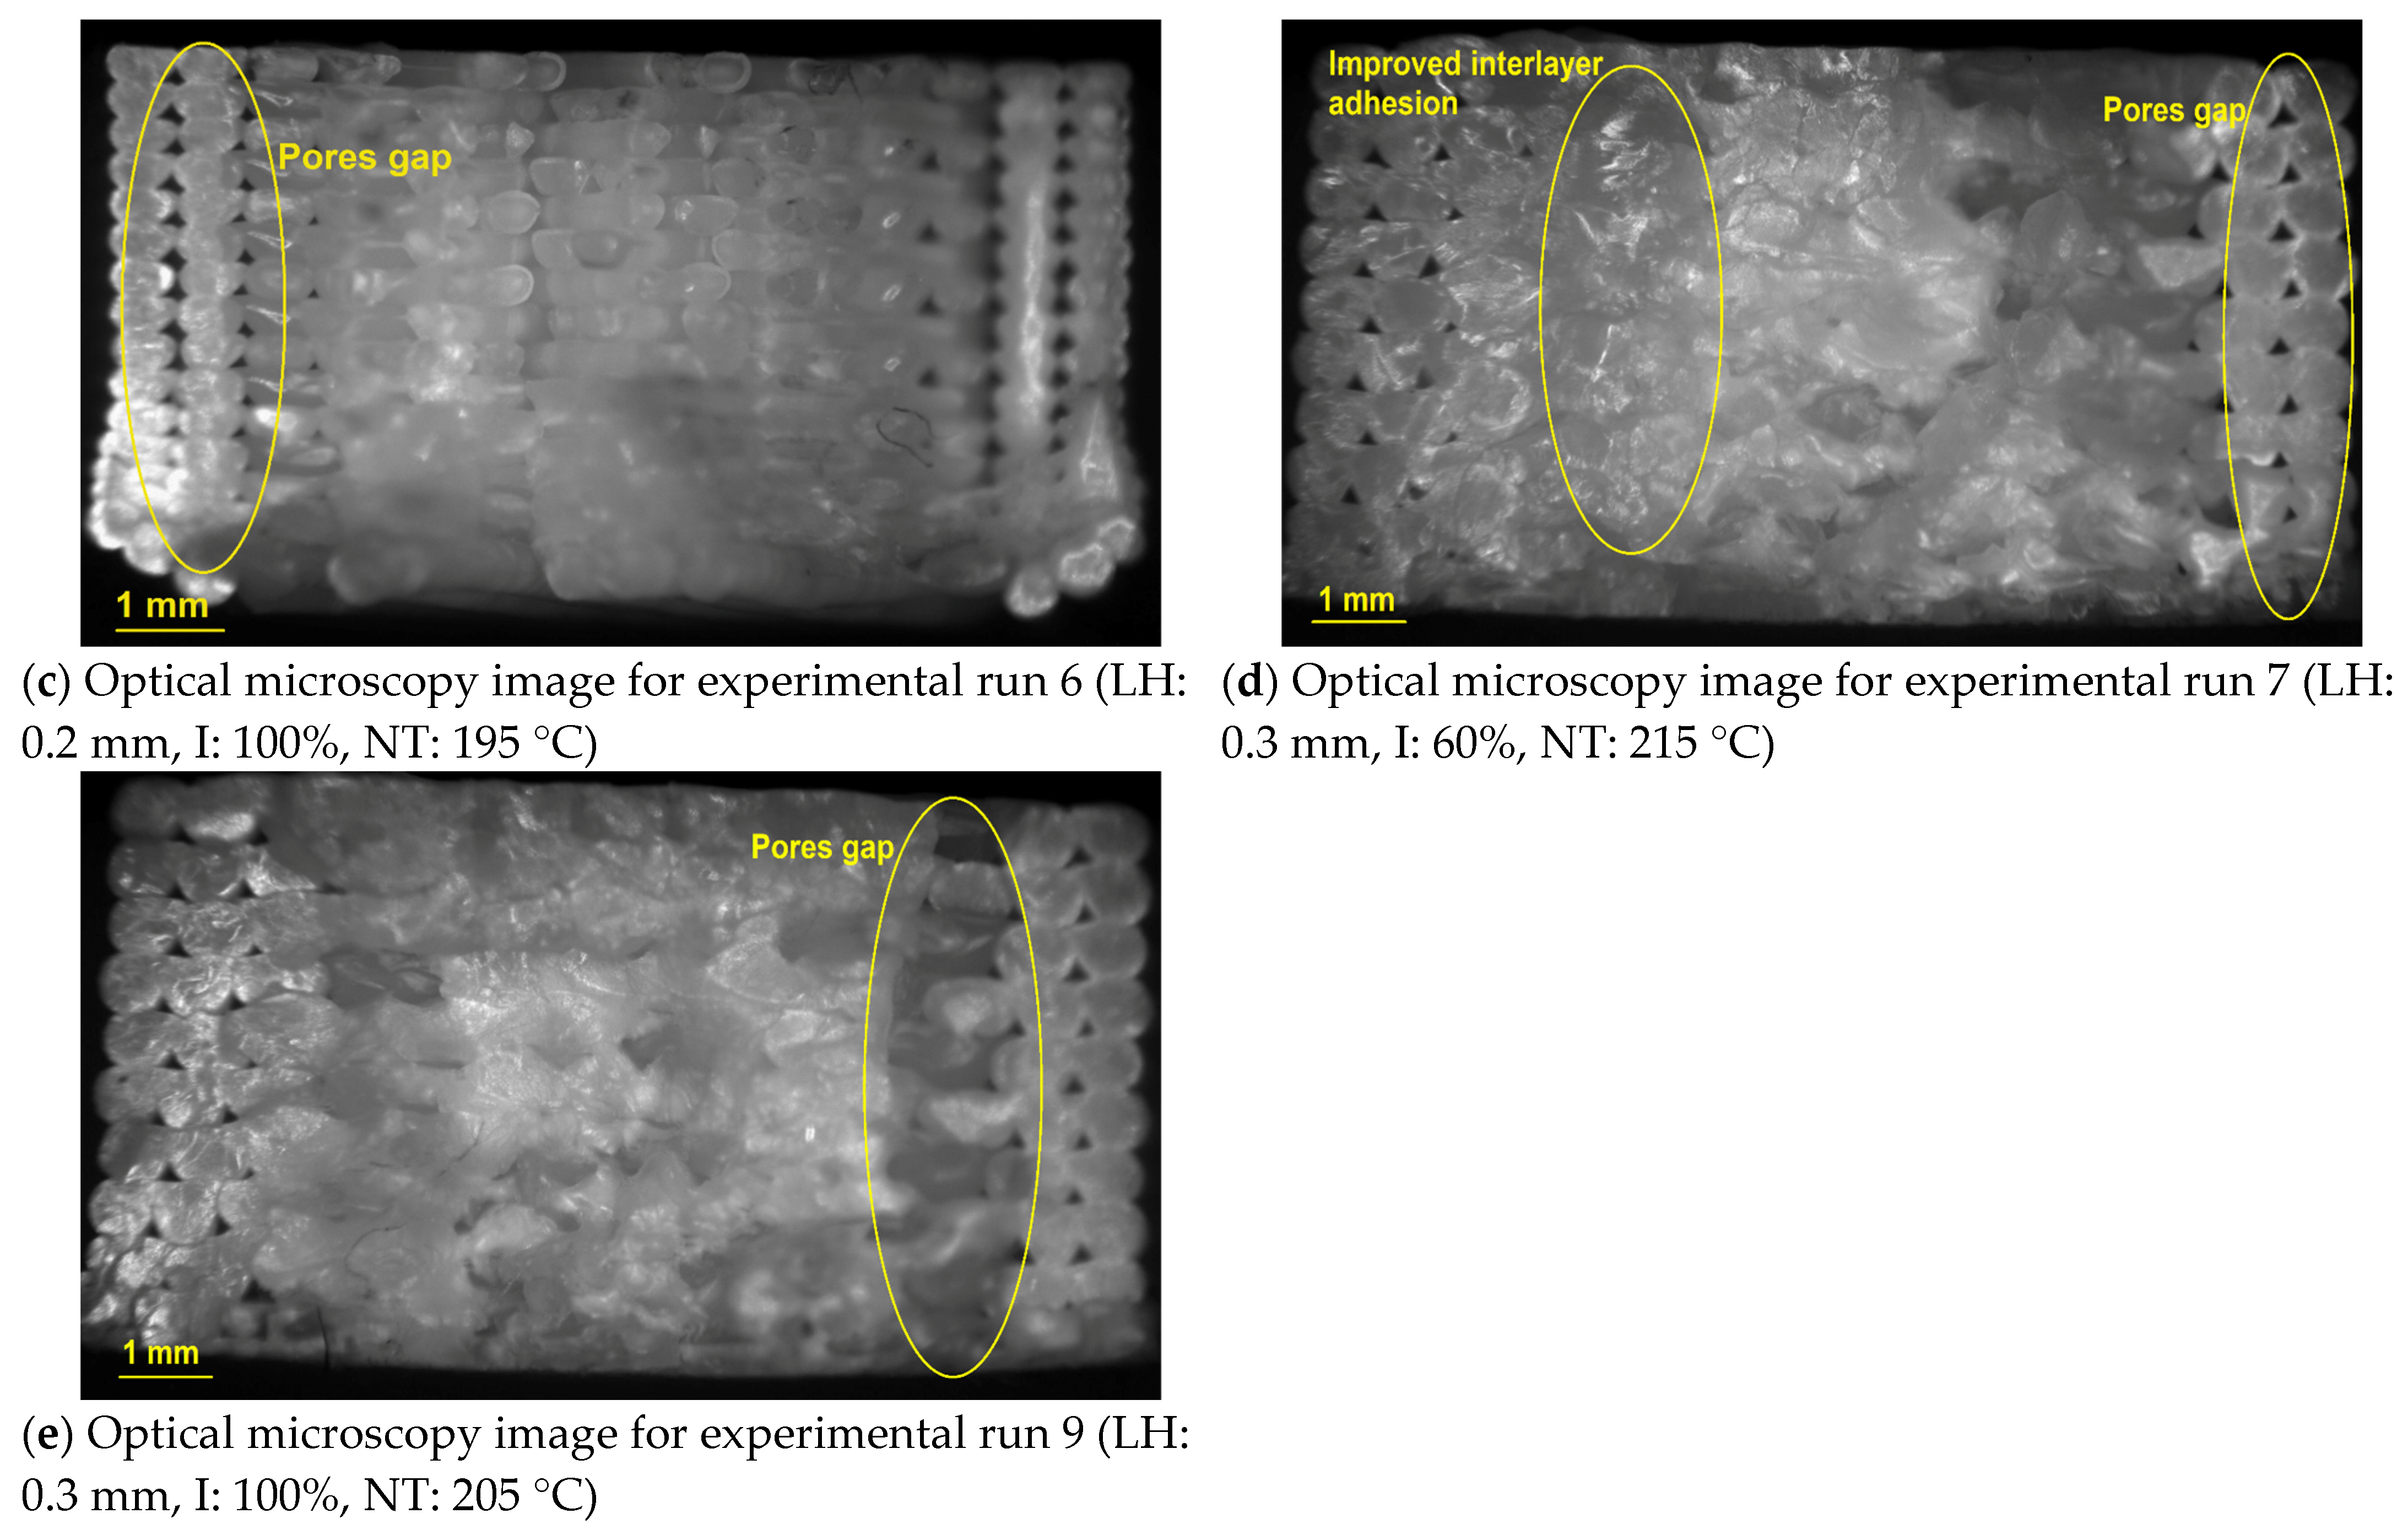
3.6. Fractography Analysis

To examine the deformation and fracture behaviour of the vPLA:PC-PLA (50:50) blended specimens during mechanical testing, the fracture interface was studied. The micrographs of the specimens were examined using a microscope after performing the tensile tests. One specimen that best represented the failure mode was selected for each batch of five specimens. The micrographs presented in Figure 16a–e depict the cross-sectional images of the blended parts with the selected printing parameter settings.
As shown in Figure 16a, during experimental run 1, the layer height, infill, and nozzle temperature were low (LH: 0.1 mm, I: 60%, NT: 195 °C). As a result, the specimen exhibited noticeable gaps and void areas, which were attributed to filament pull-out. This phenomenon indicates poor layer bonding and ultimately leads to a decrease in strength owing to the separation of the filaments from the material [55]. The cavities in experimental run 1 were also apparent because of the low infill density [90]. Therefore, with an increase in the layer height, infill density, and nozzle temperature, the gaps and voids inside the specimen decreased, as shown in Figure 16b–e. This reduction can be attributed to the increased infill density, which led to a dense structure with a low level of porosity. Nevertheless, the reduction in gaps and improvement of layer bonding in a specimen cannot be achieved solely by increasing the infill density. For instance, when the specimen was printed at a high temperature of 215 °C and a high infill of 100% (experimental run 3), it exhibited a minimal number of or absence of voids (Figure 16b); however, it had a lower tensile strength owing to the low layer height (0.1 mm). This was caused by the higher inner layer porosity of the specimen, which negatively affected its mechanical properties [55,91]. In contrast, an increase in layer height, as observed in experimental runs 7 and 9 (Figure 16d,e), resulted in a noticeable reduction in porosity and improved layer bonding, which led to a significant increase in strength.
The nozzle temperature also played a significant role in determining the strength of the specimens. With an increase in the nozzle temperature from 195 °C to 215 °C, the size of voids in the fractured specimens decreased. For example, in experimental run 7, as illustrated in Figure 16d, it was evident that despite the low infill percentage (60%), the specimens exhibited a higher strength compared to that of the other experimental runs because of the larger layer height (0.3 mm) and higher nozzle temperature (215 °C). The reason for this phenomenon is the increase in the nozzle temperature, which leads to a decrease in the melt viscosity and an improvement in the wettability of the polymers. Consequently, the printed layers remained in a molten state for a longer duration, facilitating increased coalescence within the printed layers [44]. As a consequence, there was a notable enhancement in the adhesion between the printed layers, and a reduction in voids was observed, which improved the strength [90]. In contrast, in experimental run 9, even though there was an increase in interlayer adhesion and a decrease in voids owing to the high infill (100%) and larger layer height (0.3 mm) (Figure 16e), the mechanical strength was lower than that in run 7 because of the lower nozzle temperature (205 °C). In addition, the image of experimental run 6, as depicted in Figure 16c, reveals that although the layer height was increased to 0.2 mm and the infill percentage was set at 100%, the strength of the material was still affected by the low nozzle temperature (195 °C). This delamination was caused by the presence of air gaps and weak interlayer adhesion due to the low printing temperature [44,92]. This finding is supported by the mechanical test results (tensile, flexural, impact, and hardness tests) discussed earlier.
Overall, an improvement in the layer bonding and reduction in voids were observed for the vPLA:PC-PLA (50:50) blended specimens when the fractured surface was compared with that of recycled PLA, as described by Hasan et al. [48]. This development was attributed to the fact that PC-PLA and vPLA are miscible blends, as both are semicrystalline polymers. Furthermore, both polymers (vPLA and PC-PLA) had identical crystallisation phases, leading to strong interphase adhesion. In addition, more coalescence was observed between the printed layers, indicating a promising level of adhesion strength at the blend interphase [36,37].

3.7. Optimisation of Process Parameters

In this investigation, signal-to-noise (S/N) ratio diagrams were employed to assess the outcomes of the experimental results. The interpretation of the S/N ratio diagram was based on the “larger the better” criterion for mechanical properties (tensile strength, flexural strength, impact strength, and hardness), while the “smaller the better” criterion was applied for surface roughness properties. Specifically, the mechanical properties were analysed using the “larger the better” criterion since the objective of this research is to maximise them. The peak point observed in the S/N ratio diagram signifies the optimal conditions.
Figure 17a–h illustrates the main effects plots of the S/N ratios for the tensile properties. This graph indicates that the S/N ratio is correlated with the layer height, as high S/N ratios were obtained with a larger layer height. The second most significant factor derived from the plot is the nozzle temperature. In contrast, the infill had a minimal effect on the tensile properties compared to the layer height and infill density. This is because the larger layer height and nozzle temperature increased the interlayer adhesion and melt viscosity, which facilitated the bonding of the blend material, ultimately increasing its tensile strength [93]. From the main effects plots, it is evident that the optimal printing parameters for tensile strength are a 0.3 mm layer height, 100% infill, and 215 °C nozzle temperature.
The flexural properties (Figure 18) exhibited a similar trend for the printing parameters to that of the tensile properties, which also confirmed the impact of the larger layer height (0.3 mm), infill (100%), and nozzle temperature (215 °C) on the flexural properties. This outcome aligns with the findings of Hasan et al. [48], who reported the same trend regarding the optimum printing parameters for 100% virgin PLA and 100% recycled PLA.
The impact strength is mainly dependent on the properties of the material used to resist shock. Therefore, upon analysing the main effects plots of the S/N ratios (Figure 19a), it was observed that compared to the other printing parameters, the infill density exhibited a significant influence on the impact strength. A higher S/N ratio was observed with a larger layer height, high infill, and high nozzle temperature. Consequently, the optimal printing parameters for achieving the maximum impact strength were determined to be a layer height of 0.3 mm, an infill density of 100%, and a nozzle temperature of 215 °C.
The hardness properties of the blended samples also demonstrated the optimum printing parameters to be a 0.3 mm layer height, 100% infill, and nozzle temperature of 215 °C (Figure 19b). Therefore, with an increase in the infill density, there is a corresponding increase in the penetration of layers into each other, leading to an improved interlayer strength [94]. Consequently, the impact and hardness properties improved at a high infill density (100%).
The S/N ratio main effects plots of the input process parameter levels for the arithmetic mean roughness (Ra) and root mean square roughness (Rq) are shown in Figure 20a,b, respectively. It can be observed from the main effects plots that the layer height is the most critical and influential parameter in determining the outcome of surface roughness. This is followed by the nozzle temperature and infill in terms of importance. The optimum printing parameter levels for the “smaller the better” criterion for achieving a lower surface roughness were a 0.1 mm layer height, 60% infill, and 205 °C nozzle temperature.

Analysis of Variance (ANOVA) Assessment

The main objective of an ANOVA is to apply a statistical method to evaluate the impact of individual printing parameters on the material properties. Roy [95] offers a comprehensive explanation of the ANOVA technique. For each quality parameter, the effect of each factor was determined by using a 95% confidence interval. The ANOVA results for tensile strength, flexural strength, impact strength, hardness, and surface roughness are presented in Table 5. A p-value below 0.05 indicates that the variable is considered significant in relation to the response.
In this study, the layer height was found to be the most significant factor influencing the tensile strength, flexural strength, and surface roughness, accounting for approximately 75% of the variation. Conversely, the infill density and nozzle temperature were found to be insignificant because their associated p-values were greater than 0.05. Notably, the infill had a significant influence on the impact strength and Shore D hardness. These findings are consistent with the conclusions reached by Hasan et al. [48], Atakok et al. [41], and Teharia et al. [96]. They also observed the influence of the layer height on the tensile, flexural, and surface roughness properties, as well as the impact of the infill on the impact strength and Shore D hardness.

3.8. Confirmation Test

Based on the S/N ratio main effect plots and ANOVA, the optimum printing parameters were determined for the mechanical properties and surface roughness. A summary of the optimal printing parameters is presented in Table 6.
After determining the optimum printing parameters from the Taguchi method, the final step in the process involved confirmation experiments to validate the optimum printing parameters. Therefore, a confirmation experiment was conducted using the optimal printing parameters listed in Table 6. The confirmation test results for the vPLA:PC-PLA (50:50) blended specimens demonstrated an increase in strength compared with that of recycled PLA. In particular, the tensile strength, flexural strength, and impact strength were 51.81 MPa, 94.44 MPa, and 5.54 kJ/m2, respectively, representing a 12.71%, 5.08%, and 3.17% increase in strength. Additionally, the Shore D hardness increased by 1.59% to 80.78, and the surface roughness decreased by 1.32% to 2.25 μm. These findings illustrate that the specimens fabricated using the optimal printing parameters exhibited a superior strength compared to those produced using L9 OA. Therefore, the S/N ratio of the confirmation test was compared with that of the theoretical prediction of the S/N ratio under the optimal conditions obtained using Equation (1). The confirmation test results for the tensile strengths were 1.14 dB higher than the sum of the predicted S/N ratios (Table 7). The other mechanical properties, namely, the flexural strength, impact strength, and Shore D hardness, were 0.76 dB, 0.35 dB, and 0.09 dB, respectively, higher than those of the predicted S/N values. This result shows that the confirmation test using the optimal printing parameters produces better outcomes than the predicted conditions.
Finally, the confidence intervals (C.I.s) for both the confirmed and predicted results were calculated using Equations (2)–(4) to verify the validity of the optimal printing parameters. A considerable overlap was noted between the C.I.s of the confirmation tests and the predicted results for the mechanical properties and surface roughness of the vPLA:PC-PLA (50:50) blended specimens, as shown in Table 7. The results indicated a significant improvement in both quality characteristics, and the optimum printing parameters were acceptable for use in the optimum manufacturing of blended filament 3D-printed specimens.

4. Comparison between 100% PC-PLA and vPLA:PC-PLA (50:50) Blended Specimens

To assess the tensile properties of 100% PC-PLA, five dog-bone-shaped samples were prepared using the optimal printing parameters and subsequently subjected to testing. The resulting tensile strength of the 100% PC-PLA was then compared with that of the vPLA:PC-PLA (50:50) blended specimens produced under the same printing conditions. The tensile strength of 100% PC-PLA was 32.86 MPa, which was 35% and 28% lower than that of the vPLA:PC-PLA (50:50) blended specimens and 100% recycled PLA, respectively (Figure 21b). The potential cause of the reduction in the tensile strength of 100% PC-PLA could be the presence of moisture during the extrusion process [97]. In addition, the variance in the feeding of PC-PLA flakes in the extrusion process would have induced a greater porosity, which would have contributed to the reduced strength. Moreover, the molecular weight of 100% PC-PLA may decrease because of the recycling process, which breaks the bonds of the original materials and reduces their tensile strength [46]. In addition, the stress–strain curve of the blended filament-printed specimens exhibited a brittle nature, with a lower strain at fracture than that of the vPLA:PC-PLA (50:50) blended specimens and 100% recycled PLA (Figure 21a). During mechanical recycling, plastics are exposed to high temperatures and shear forces, which increases their crystallinity, ultimately leading to a reduction in the strain at break of 100% PC-PLA [93,98]. However, this result demonstrates the potential of using 100% PC-PLA as a feedstock material for 3D printing.

5. Conclusions and Future Work

This study explored the processing and characterisation of 3D-printed vPLA/PC-PLA blended samples. Sustainable 3D printer feedstock filaments with a 1.7 ± 0.05 mm diameter were made using a vPLA:PC-PLA (50:50) blend. Utilising the Taguchi OA, the samples were subjected to a 3D printing process with three distinct parameters: layer height, infill, and nozzle temperature. These parameters were optimised to generate the desired outcome. The physical and mechanical properties of the printed specimens were evaluated and investigated thoroughly. The incorporation of vPLA in PC-PLA to create blended filaments demonstrated a notable increase in its mechanical properties compared to those of recycled PLA. However, the strength of the blended samples was lower than that of the virgin PLA. Compared to 100% recycled PLA, the blended samples exhibited an improvement of 18.40% in tensile strength, 8% in flexural strength, 9.15% in impact strength, and 5% in hardness. Our fractographic analysis revealed that the blended samples exhibited better interlayer adhesion, contributing to the increase in mechanical properties. The driving agents for this improvement were the increased layer height and nozzle temperature. Specifically, experimental run 7 (LH: 0.3 mm, I: 60%, and NT: 215 °C) demonstrated high tensile and flexural properties. This suggests that a large layer height and high nozzle temperature can lead to increased strength, even with a low infill percentage. On the other hand, experimental run 9 (LH: 0.3 mm, I: 100%, and NT: 205 °C) showed that a high infill percentage can improve impact and hardness properties. The optimisation of the printing parameters showed that for a large layer height (0.3 mm), high infill (100%), and high nozzle temperature (215 °C), the S/N ratio was high. The ANOVA table reveals that the layer height had the most significant influence on the mechanical properties of the three printing parameters. The experimental results of the 3D-printed specimens using optimal printing parameters showed a high tensile strength of 51.81 MPa, which demonstrates the potential of using blended filaments in 3D printing. Future research should concentrate on blending various percentages of vPLA and PC-PLA. Future research could also include value-added product development using blended filaments for industrial applications and the testing of upcycled rPLA-based products. An estimation of the fatigue life and service life of PC-PLA could also be included in future research, which would provide valuable insights into its formulation durability, longevity, and sustainability. Also, it is crucial to consider the sustainability of PC-PLA for various applications. A comprehensive life-cycle assessment (LCA) of PC-PLA could provide valuable information on the environmental impacts of this material. Research in this area can lead to the development of more sustainable and environmentally friendly manufacturing materials.

Author Contributions

Conceptualisation, M.R.H., I.J.D., A.P., M.J. and W.K.B.; methodology, M.R.H., I.J.D., A.P., M.J. and W.K.B.; validation, M.R.H., I.J.D., A.P., M.J. and W.K.B.; formal analysis, M.R.H.; investigation, M.R.H.; data curation M.R.H.; writing—original draft preparation, M.R.H.; writing—review and editing, M.R.H., I.J.D., A.P., M.J. and W.K.B.; supervision, I.J.D., A.P., M.J. and W.K.B. All authors have read and agreed to the published version of the manuscript.

Funding

This research received no external funding.

Data Availability Statement

The research data will be made available at Curtin Research Data Collection.

Acknowledgments

The authors are grateful for the support from the technical staff of Curtin University, Australia.

Conflicts of Interest

The authors declare no conflicts of interest.

References

  1. Mishra, V.; Ror, C.K.; Negi, S.; Kar, S.; Borah, L.N. Development of sustainable 3D printing filaments using recycled/virgin ABS blends: Processing and characterization. Polym. Eng. Sci. 2023, 63, 1890–1899. [Google Scholar] [CrossRef]
  2. Belioka, M.P.; Markozanne, G.; Chrissopoulou, K.; Achilias, D.S. Advanced Plastic Waste Recycling—The Effect of Clay on the Morphological and Thermal Behavior of Recycled PET/PLA Sustainable Blends. Polymers 2023, 15, 3145. [Google Scholar] [CrossRef] [PubMed]
  3. Bioplastics, E. Bioplastics Facts and Figures; European Bioplastics e.V.: Berlin, Germany, 2023. [Google Scholar]
  4. Pinho, A.C.; Amaro, A.M.; Piedade, A.P. 3D printing goes greener: Study of the properties of post-consumer recycled polymers for the manufacturing of engineering components. Waste Manag. 2020, 118, 426–434. [Google Scholar] [CrossRef] [PubMed]
  5. Björklund, A.; Finnveden, G. Recycling revisited—Life cycle comparisons of global warming impact and total energy use of waste management strategies. Resour. Conserv. Recycl. 2005, 44, 309–317. [Google Scholar] [CrossRef]
  6. Singh, S.; Ramakrishna, S. Recycling of Thermoplastic Wastes: A Route of Waste to Wealth via Three-Dimensional Printing. In Encyclopedia of Materials: Plastics and Polymers; CRC Press: Boca Raton, FL, USA, 2022; pp. 510–515. [Google Scholar]
  7. Fernández, P.; Marqués, R.; Beltrán, N.; Puerto, B.; Blanco, D. Using PETG/rPET Blends in Fused Particle Fabrication: Analysis of Feasibility and Mechanical Behaviour. In 10th Manufacturing Engineering Society International Conference (MESIC 2023), Sevilla, Spain, 28–30 June 2023; Trans Tech Publications Ltd.: Bäch, Switzerland, 2023; pp. 147–154. [Google Scholar]
  8. Kassab, A.; Al Nabhani, D.; Mohanty, P.; Pannier, C.; Ayoub, G.Y. Advancing Plastic Recycling: Challenges and Opportunities in the Integration of 3D Printing and Distributed Recycling for a Circular Economy. Polymers 2023, 15, 3881. [Google Scholar] [CrossRef] [PubMed]
  9. Cestari, S.P.; Martin, P.J.; Hanna, P.R.; Kearns, M.P.; Mendes, L.C.; Millar, B. Use of virgin/recycled polyethylene blends in rotational moulding. J. Polym. Eng. 2021, 41, 509–516. [Google Scholar] [CrossRef]
  10. Suárez-Eiroa, B.; Fernández, E.; Méndez-Martínez, G.; Soto-Oñate, D. Operational principles of circular economy for sustainable development: Linking theory and practice. J. Clean. Prod. 2019, 214, 952–961. [Google Scholar] [CrossRef]
  11. Hadi, A.J.; Najmuldeen, G.F.; Yusoh, K.B. Dissolution/reprecipitation technique for waste polyolefin recycling using new pure and blend organic solvents. J. Polym. Eng. 2013, 33, 471–481. [Google Scholar] [CrossRef]
  12. Kamalian, P.; Khorasani, S.N.; Abdolmaleki, A.; Karevan, M.; Khalili, S.; Shirani, M.; Neisiany, R.E. Toward the development of polyethylene photocatalytic degradation. J. Polym. Eng. 2020, 40, 181–191. [Google Scholar] [CrossRef]
  13. Sirisinha, K.; Wirasate, S.; Sirisinha, C.; Wattanakrai, N. One-Pot Reactive Melt Recycling of PLA Post-Consumer Waste for the Production of Block Copolymer Nanocomposites of High Strength and Ductility. Polymers 2022, 14, 3642. [Google Scholar] [CrossRef]
  14. Webb, H.; Arnott, J.; Crawford, R.; Ivanova, E. Plastic Degradation and Its Environmental Implications with Special Reference to Poly(ethylene terephthalate). Polymers 2012, 5, 1–18. [Google Scholar] [CrossRef]
  15. Torres, N.; Robin, J.; Boutevin, B. Study of thermal and mechanical properties of virgin and recycled poly (ethylene terephthalate) before and after injection molding. Eur. Polym. J. 2000, 36, 2075–2080. [Google Scholar] [CrossRef]
  16. Hopewell, J.; Dvorak, R.; Kosior, E. Plastics recycling: Challenges and opportunities. Philos. Trans. R. Soc. B Biol. Sci. 2009, 364, 2115–2126. [Google Scholar] [CrossRef]
  17. Huang, Y.; Leu, M.C.; Mazumder, J.; Donmez, A. Additive Manufacturing: Current State, Future Potential, Gaps and Needs, and Recommendations. J. Manuf. Sci. Eng. 2015, 137, 014001. [Google Scholar] [CrossRef]
  18. Ferreira, R.T.L.; Amatte, I.C.; Dutra, T.A.; Bürger, D. Experimental characterization and micrography of 3D printed PLA and PLA reinforced with short carbon fibers. Compos. Part B Eng. 2017, 124, 88–100. [Google Scholar] [CrossRef]
  19. Jayawardane, H.; Davies, I.J.; Gamage, J.R.; John, M.; Biswas, W.K. Sustainability perspectives—A review of additive and subtractive manufacturing. Sustain. Manuf. Serv. Econ. 2023, 2, 100015. [Google Scholar] [CrossRef]
  20. Pavlo, S.; Fabio, C.; Hakim, B.; Mauricio, C. 3D-Printing Based Distributed Plastic Recycling: A Conceptual Model for Closed-Loop Supply Chain Design. In Proceedings of the 2018 IEEE International Conference on Engineering, Technology and Innovation (ICE/ITMC), Stuttgart, Germany, 17–20 June 2018. [Google Scholar]
  21. Hidalgo-Carvajal, D.; Munoz, A.H.; Garrido-Gonzalez, J.J.; Carrasco-Gallego, R.; Alcazar Montero, V. Recycled PLA for 3D Printing: A Comparison of Recycled PLA Filaments from Waste of Different Origins after Repeated Cycles of Extrusion. Polymers 2023, 15, 3651. [Google Scholar] [CrossRef] [PubMed]
  22. Pulok, M.K.H.; Rahman, M.S.; Chakravarty, U.K. Crack Propagation and Fracture Toughness of Additively Manufactured Polymers. In Proceedings of the ASME 2021 International Mechanical Engineering Congress and Exposition. Volume 4: Advances in Aerospace Technology, Virtual, Online, 1–5 November 2021; ASME: New York, NY, USA, 2021. [Google Scholar]
  23. Jayawardane, H.; Davies, I.J.; Gamage, J.R.; John, M.; Biswas, W.K. Additive manufacturing of recycled plastics: A ‘techno-eco-efficiency’ assessment. Int. J. Adv. Manuf. Technol. 2023, 126, 1471–1496. [Google Scholar] [CrossRef]
  24. Al-Mazrouei, N.; Al-Marzouqi, A.H.; Ahmed, W. Characterization and Sustainability Potential of Recycling 3D-Printed Nylon Composite Wastes. Sustainability 2022, 14, 10458. [Google Scholar] [CrossRef]
  25. Rezvani Ghomi, E.R.; Khosravi, F.; Saedi Ardahaei, A.S.; Dai, Y.; Neisiany, R.E.; Foroughi, F.; Wu, M.; Das, O.; Ramakrishna, S. The Life Cycle Assessment for Polylactic Acid (PLA) to Make It a Low-Carbon Material. Polymers 2021, 13, 1854. [Google Scholar] [CrossRef]
  26. Balla, E.; Daniilidis, V.; Karlioti, G.; Kalamas, T.; Stefanidou, M.; Bikiaris, N.D.; Vlachopoulos, A.; Koumentakou, I.; Bikiaris, D.N. Poly(lactic Acid): A Versatile Biobased Polymer for the Future with Multifunctional Properties-From Monomer Synthesis, Polymerization Techniques and Molecular Weight Increase to PLA Applications. Polymers 2021, 13, 1822. [Google Scholar] [CrossRef] [PubMed]
  27. Bioplastics, E. Bioplastics Market Development Update 2023; European Bioplastics e.V.: Berlin, Germany, 2023. [Google Scholar]
  28. Taib, N.-A.A.B.; Rahman, M.R.; Huda, D.; Kuok, K.K.; Hamdan, S.; Bakri, M.K.B.; Julaihi, M.R.M.B.; Khan, A. A review on poly lactic acid (PLA) as a biodegradable polymer. Polym. Bull. 2022, 80, 1179–1213. [Google Scholar] [CrossRef]
  29. Yao, B.; Zhu, Y.; Xu, Z.; Wu, Y.; Yang, L.; Liu, J.; Shang, J.; Fan, J.; Ouyang, L.; Fan, H.J.S. Taguchi design and optimization of the PLA/PCL composite filament with plasticizer and compatibilizer additives for optimal 3D printing. Polym. Eng. Sci. 2023, 63, 3743–3761. [Google Scholar] [CrossRef]
  30. Alexandre, A.; Cruz Sanchez, F.A.; Boudaoud, H.; Camargo, M.; Pearce, J.M. Mechanical Properties of Direct Waste Printing of Polylactic Acid with Universal Pellets Extruder: Comparison to Fused Filament Fabrication on Open-Source Desktop Three-Dimensional Printers. 3D Print. Addit. Manuf. 2020, 7, 237–247. [Google Scholar] [CrossRef]
  31. Hasan, M.R.; Davies, I.J.; Pramanik, A.; John, M.; Biswas, W.K. Potential of Recycled PLA in 3D Printing: A Review. Sustain. Manuf. Serv. Econ. 2024, 3, 100020. [Google Scholar] [CrossRef]
  32. Beltran, F.R.; Lorenzo, V.; Acosta, J.; de la Orden, M.U.; Martinez Urreaga, J. Effect of simulated mechanical recycling processes on the structure and properties of poly(lactic acid). J. Environ. Manag. 2018, 216, 25–31. [Google Scholar] [CrossRef] [PubMed]
  33. Żenkiewicz, M.; Richert, J.; Rytlewski, P.; Moraczewski, K.; Stepczyńska, M.; Karasiewicz, T. Characterisation of multi-extruded poly(lactic acid). Polym. Test. 2009, 28, 412–418. [Google Scholar] [CrossRef]
  34. Pillin, I.; Montrelay, N.; Bourmaud, A.; Grohens, Y. Effect of thermo-mechanical cycles on the physico-chemical properties of poly(lactic acid). Polym. Degrad. Stab. 2008, 93, 321–328. [Google Scholar] [CrossRef]
  35. Zhao, P.; Rao, C.; Gu, F.; Sharmin, N.; Fu, J. Close-looped recycling of polylactic acid used in 3D printing: An experimental investigation and life cycle assessment. J. Clean. Prod. 2018, 197, 1046–1055. [Google Scholar] [CrossRef]
  36. Babagowda; Math, R.S.K.; Goutham, R.; Prasad, K.R.S. Study of Effects on Mechanical Properties of PLA Filament which is blended with Recycled PLA Materials. In Proceedings of the International Conference on Advances in Materials and Manufacturing Applications (IConAMMA-2017), IOP Conference Series: Materials Science and Engineering, Bengaluru, India, 17–19 August 2018; IOP Publishing: London, UK, 2018. [Google Scholar]
  37. Tanney, D.; Meisel, N.A.; Moore, J.D. Investigating material degradation through the recycling of PLA in additively manufactured parts. In Proceedings of the 2017 Annual International Solid Freeform Fabrication Symposium (28th Annual International Solid Freeform Fabrication Symposium)—An Additive Manufacturing Conference, Austin, TX, USA, 7–9 August 2017; Bourell, D.L., Crawford, R.H., Seepersad, C.C., Beaman, J.J., Fish, S., Eds.; University of Texas at Austin: Austin, TX, USA, 2017. [Google Scholar]
  38. Bergaliyeva, S.; Sales, D.L.; Delgado, F.J.; Bolegenova, S.; Molina, S.I. Manufacture and Characterization of Polylactic Acid Filaments Recycled from Real Waste for 3D Printing. Polymers 2023, 15, 2165. [Google Scholar] [CrossRef]
  39. Kam, M.; İpekci, A.; Şengül, Ö. Taguchi Optimization of Fused Deposition Modeling Process Parameters on Mechanical Characteristics of PLA+ Filament Material. Sci. Iran. 2021, 29, 79–89. [Google Scholar] [CrossRef]
  40. Kam, M.; İpekçi, A.; Şengül, Ö. Investigation of the effect of FDM process parameters on mechanical properties of 3D printed PA12 samples using Taguchi method. J. Thermoplast. Compos. Mater. 2021, 36, 307–325. [Google Scholar] [CrossRef]
  41. Atakok, G.; Kam, M.; Koc, H.B. Tensile, three-point bending and impact strength of 3D printed parts using PLA and recycled PLA filaments: A statistical investigation. J. Mater. Res. Technol. 2022, 18, 1542–1554. [Google Scholar] [CrossRef]
  42. Chen, W.H.; Uribe, M.C.; Kwon, E.E.; Lin, K.Y.A.; Park, Y.K.; Ding, L.; Saw, L.H. A comprehensive review of thermoelectric generation optimization by statistical approach: Taguchi method, analysis of variance (ANOVA), and response surface methodology (RSM). Renew. Sustain. Energy Rev. 2022, 169, 112917. [Google Scholar] [CrossRef]
  43. Nikam, M.; Pawar, P.; Patil, A.; Patil, A.; Mokal, K.; Jadhav, S. Sustainable fabrication of 3D printing filament from recycled PET plastic. Mater. Today Proc. 2023. [Google Scholar] [CrossRef]
  44. Chu, J.S.; Koay, S.C.; Chan, M.Y.; Choo, H.L.; Ong, T.K. Recycled plastic filament made from post-consumer expanded polystyrene and polypropylene for fused filamant fabrication. Polym. Eng. Sci. 2022, 62, 3786–3795. [Google Scholar]
  45. Mishra, V.; Ror, C.H.K.; Negi, S.; Kar, S.; Borah, L.N. 3D printing with recycled ABS resin: Effect of blending and printing temperature. Mater. Chem. Phys. 2023, 309, 128317. [Google Scholar]
  46. Di, L.; Yang, Y. Towards closed-loop material flow in additive manufacturing: Recyclability analysis of thermoplastic waste. J. Clean. Prod. 2022, 362, 132427. [Google Scholar] [CrossRef]
  47. Naganaboyina, H.P.S.; Nagaraju, P.; Sonaye, S.Y.; Bokam, V.K.; Sikder, P. In-house processing of carbon fiber-reinforced polyetheretherketone (CFR-PEEK) 3D printable filaments and fused filament fabrication-3D printing of CFR-PEEK parts. Int. J. Adv. Manuf. Technol. 2023, 128, 5011–5024. [Google Scholar] [CrossRef]
  48. Hasan, M.R.; Davies, I.J.; Pramanik, A.; John, M.; Biswas, W.K. Impact of process parameters on improving the performance of 3D printed recycled polylactic acid (rPLA) components. Int. J. Adv. Manuf. Technol. 2024, 131, 3751–3779. [Google Scholar] [CrossRef]
  49. ASTM-D638-22; Standard Test Method for Tensile Properties of Plastics. ASTM International: West Conshohocken, PA, USA, 2022.
  50. ASTM-D790-17; Standard Test Methods for Flexural Properties of Unreinforced and Reinforced Plastics and Electrical Insulating Materials. ASTM International: West Conshohocken, PA, USA, 2017.
  51. ASTM-D6110-18; Standard Test Method for Determining the Charpy Impact Resistance of Notched Specimens of Plastics. ASTM International: West Conshohocken, PA, USA, 2018.
  52. ASTM-D2240-15; Standard Test Method for Rubber Property-Durometer Hardness. ASTM International: West Conshohocken, PA, USA, 2021.
  53. ASTM-D7127-17; Standard Test Method for Measurement of Surface Roughness of Abrasive Blast Cleaned Metal Surfaces Using a Portable Stylus Instrument. ASTM International: West Conshohocken, PA, USA, 2017.
  54. Dehnad, K. Quality Control, Robust Design, and the Taguchi Method; Springer: New York, NY, USA, 2012. [Google Scholar]
  55. Ahmad, M.N.; Ishak, M.R.; Mohammad Taha, M.; Mustapha, F.; Leman, Z.; Anak Lukista, D.D.; Irianto; Ghazali, I. Application of Taguchi Method to Optimize the Parameter of Fused Deposition Modeling (FDM) Using Oil Palm Fiber Reinforced Thermoplastic Composites. Polymers 2022, 14, 2140. [Google Scholar] [CrossRef] [PubMed]
  56. Salam, H.; Dong, Y.; Davies, I.J.; Pramanik, A. Optimization of material formulation and processing parameters in relation to mechanical properties of bioepoxy/clay nanocomposites using Taguchi design of experiments. J. Appl. Polym. Sci. 2018, 135, 45769. [Google Scholar] [CrossRef]
  57. Greenwald, A.G.; Gonzalez, R.; Harris, R.J.; Guthrie, D. Effect sizes and p values: What should be reported and what should be replicated? Psychophysiology 1996, 33, 175–183. [Google Scholar] [CrossRef] [PubMed]
  58. Son, J.; Kim, I.; Kim, H.; Kim, I.; Kang, B.; Kim, H. A study on the prediction of bead geometry in the robotic welding system. J. Mech. Sci. Technol. 2007, 21, 1726–1731. [Google Scholar] [CrossRef]
  59. Muhammad, N.; Manurung, Y.H.P.; Jaafar, R.; Abas, S.K.; Tham, G.; Haruman, E. Model development for quality features of resistance spot welding using multi-objective Taguchi method and response surface methodology. J. Intell. Manuf. 2012, 24, 1175–1183. [Google Scholar] [CrossRef]
  60. Belavendram, N. Quality by Design, Taguchi Techniques for Industrial Experimentation; Prentice Hall: Hoboken, NJ, USA, 1995. [Google Scholar]
  61. Roy, R.K. A Primer on the Taguchi Method, 2nd ed.; Society of Manufacturing Engineers: Southfield, MI, USA, 2010. [Google Scholar]
  62. Maier, R.; Bucaciuc, S.G.; Mandoc, A.C. Reducing Surface Roughness of 3D Printed Short-Carbon Fiber Reinforced Composites. Materials 2022, 15, 7398. [Google Scholar] [CrossRef] [PubMed]
  63. Kumar, S.; Ramesh, M.R.; Doddamani, M. Recycling potential of MWCNTs/HDPE nanocomposite filament: 3D printing and mechanical characterization. J. Mater. Cycles Waste Manag. 2023, 25, 1168–1178. [Google Scholar] [CrossRef]
  64. Dorigato, A. Recycling of polymer blends. Adv. Ind. Eng. Polym. Res. 2021, 4, 53–69. [Google Scholar] [CrossRef]
  65. Kim, G.; Barocio, E.; Tsutsui, W.; Wang, P.; Dubikovsky, S.; Pipes, R.B.; Sterkenburg, R. Enhancing surface characteristics of additively manufactured fiber reinforced thermoplastic mold using thermoset coating with ceramic particles. Surf. Coat. Technol. 2021, 422, 127536. [Google Scholar] [CrossRef]
  66. Kumar, S.; Singh, R.; Singh, T.P.; Batish, A. On investigations of thermal conductivity, circumferential compressive strength, and surface characterization of 3D-printed hybrid blended magnetostrictive PLA composite. J. Thermoplast. Compos. Mater. 2020, 35, 631–650. [Google Scholar] [CrossRef]
  67. Hsueh, M.H.; Lai, C.J.; Liu, K.Y.; Chung, C.F.; Wang, S.H.; Pan, C.Y.; Huang, W.C.; Hsieh, C.H.; Zeng, Y.S. Effects of Printing Temperature and Filling Percentage on the Mechanical Behavior of Fused Deposition Molding Technology Components for 3D Printing. Polymers 2021, 13, 2910. [Google Scholar] [CrossRef] [PubMed]
  68. Mani, M.; Karthikeyan, A.G.; Kalaiselvan, K.; Muthusamy, P.; Muruganandhan, P. Optimization of FDM 3-D printer process parameters for surface roughness and mechanical properties using PLA material. Mater. Today Proc. 2022, 66, 1926–1931. [Google Scholar] [CrossRef]
  69. Maguluri, N.; Suresh, G.; Guntur, S.R. Effect of printing parameters on the hardness of 3D printed poly-lactic acid parts using DOE approach. In Proceedings of the International Conference on Materials Science and Engineering (ICMSE 2022), IOP Conference Series: Materials Science and Engineering, Virtual, Online, 6 November–6 December 2022; IOP Publishing: London, UK, 2022. [Google Scholar]
  70. Abbas, Z.A.; Aleabi, S.H. Studying some of mechanical properties (tensile, impact, hardness) and thermal conductivity of polymer blend reinforce by magnesium oxide. In Xiamen-Custipen Workshop on the Equation of State of Dense Neutron-Rich Matter in the Era of Gravitational Wave Astronomy; AIP Publishing LLC: Melville, NY, USA, 2019. [Google Scholar]
  71. Samykano, M.; Selvamani, S.K.; Kadirgama, K.; Ngui, W.K.; Kanagaraj, G.; Sudhakar, K. Mechanical property of FDM printed ABS: Influence of printing parameters. Int. J. Adv. Manuf. Technol. 2019, 102, 2779–2796. [Google Scholar] [CrossRef]
  72. Farashi, S.; Vafaee, F. Effect of printing parameters on the tensile strength of FDM 3D samples: A meta-analysis focusing on layer thickness and sample orientation. Prog. Addit. Manuf. 2022, 7, 565–582. [Google Scholar] [CrossRef]
  73. Vanaei, H.R.; Raissi, K.; Deligant, M.; Shirinbayan, M.; Fitoussi, J.; Khelladi, S.; Tcharkhtchi, A. Toward the understanding of temperature effect on bonding strength, dimensions and geometry of 3D-printed parts. J. Mater. Sci. 2020, 55, 14677–14689. [Google Scholar] [CrossRef]
  74. Sanusi, H.; Mohamad Ridzwan, I.; Mohd Sapuan, S.; Noorfaizal, Y.; Syamir Alihan Showkat, A.; Mohd Sabri, H.; Maliki, I.; Asmawi, S. Tensile Properties of 3D Printed Recycled PLA Filament: A Detailed Study on Filament Fabrication Parameters. J. Adv. Res. Appl. Mech. 2023, 110, 63–72. [Google Scholar] [CrossRef]
  75. Sam-Daliri, O.; Ghabezi, P.; Steinbach, J.; Flanagan, T.; Finnegan, W.; Mitchell, S.; Harrison, N. Experimental study on mechanical properties of material extrusion additive manufactured parts from recycled glass fibre-reinforced polypropylene composite. Compos. Sci. Technol. 2023, 241, 110125. [Google Scholar] [CrossRef]
  76. Algarni, M. The Influence of Raster Angle and Moisture Content on the Mechanical Properties of PLA Parts Produced by Fused Deposition Modeling. Polymers 2021, 13, 237. [Google Scholar] [CrossRef] [PubMed]
  77. Hamid, R.A.; Hamezah, F.H.; Abd Razak, J. Influence of Humidity on the Tensile Strength of 3D Printed PLA Filament. In Intelligent Manufacturing and Mechatronics; Ali Mokhtar, M.N., Jamaludin, Z., Abdul Aziz, M.S., Maslan, M.N., Razak, J.A., Eds.; Springer: Singapore, 2022. [Google Scholar]
  78. Aniskevich, A.; Bulderberga, O.; Stankevics, L. Moisture Sorption and Degradation of Polymer Filaments Used in 3D Printing. Polymers 2023, 15, 2600. [Google Scholar] [CrossRef] [PubMed]
  79. Ror, C.K.; Negi, S.; Mishra, V. Development and characterization of sustainable 3D printing filaments using post-consumer recycled PET: Processing and characterization. J. Polym. Res. 2023, 30, 350. [Google Scholar] [CrossRef]
  80. Sharma, P.; Dhanopia, A.K.; Joshi, D. An experimental study on carbon fiber thickness and layer thickness of depositing material in fused deposition modeling. Mater. Today Proc. 2021, 44, 4479–4484. [Google Scholar] [CrossRef]
  81. Nugroho, A.A.R.; Rusita, L.; Larasati, I.L. Effect of layer thickness on flexural properties of PLA (PolyLactid Acid) by 3D printing. IOP Conf. Ser. J. Phys. 2018, 1130, 012017. [Google Scholar] [CrossRef]
  82. Nofar, M.; Sacligil, D.; Carreau, P.J.; Kamal, M.R.; Heuzey, M.C. Poly (lactic acid) blends: Processing, properties and applications. Int. J. Biol. Macromol. 2019, 125, 307–360. [Google Scholar] [CrossRef] [PubMed]
  83. Tsuji, H. Poly(lactic acid) stereocomplexes: A decade of progress. Adv. Drug Deliv. Rev. 2016, 107, 97–135. [Google Scholar] [CrossRef] [PubMed]
  84. Chen, C.C.; Chueh, J.Y.; Tseng, H.; Huang, H.M.; Lee, S.Y. Preparation and characterization of biodegradable PLA polymeric blends. Biomaterials 2003, 24, 1167–1173. [Google Scholar] [CrossRef] [PubMed]
  85. Syrlybayev, D.; Zharylkassyn, B.; Seisekulova, A.; Akhmetov, M.; Perveen, A.; Talamona, D. Optimisation of Strength Properties of FDM Printed Parts-A Critical Review. Polymers 2021, 13, 1587. [Google Scholar] [CrossRef] [PubMed]
  86. Rajpurohit, S.R.; Dave, H.K. Impact strength of 3D printed PLA using open source FFF-based 3D printer. Prog. Addit. Manuf. 2020, 6, 119–131. [Google Scholar] [CrossRef]
  87. Yu, W.; Sun, L.; Li, M.; Li, M.; Lei, W.; Wei, C. FDM 3D Printing and Properties of PBS/PLA Blends. Polymers 2023, 15, 4305. [Google Scholar] [CrossRef] [PubMed]
  88. Ding, S.; Zou, B.; Wang, P.; Ding, H. Effects of nozzle temperature and building orientation on mechanical properties and microstructure of PEEK and PEI printed by 3D-FDM. Polym. Test. 2019, 78, 105948. [Google Scholar] [CrossRef]
  89. Gunasekaran, K.N.; Aravinth, V.; Muthu Kumaran, C.B.; Madhankumar, K.; Pradeep Kumar, S. Investigation of mechanical properties of PLA printed materials under varying infill density. Mater. Today Proc. 2021, 45, 1849–1856. [Google Scholar] [CrossRef]
  90. Maqsood, N.; Rimašauskas, M. Tensile and flexural response of 3D printed solid and porous CCFRPC structures and fracture interface study using image processing technique. J. Mater. Res. Technol. 2021, 14, 731–742. [Google Scholar] [CrossRef]
  91. Tekinalp, H.L.; Kunc, V.; Velez-Garcia, G.M.; Duty, C.E.; Love, L.J.; Naskar, A.K.; Blue, C.A.; Ozcan, S. Highly oriented carbon fiber–polymer composites via additive manufacturing. Compos. Sci. Technol. 2014, 105, 144–150. [Google Scholar] [CrossRef]
  92. Kanabenja, W.; Passarapark, K.; Subchokpool, T.; Nawaaukkaratharnant, N.; Román, A.J.; Osswald, T.A.; Aumnate, C.; Potiyaraj, P. 3D printing filaments from plasticized Polyhydroxybutyrate/Polylactic acid blends reinforced with hydroxyapatite. Addit. Manuf. 2022, 59, 103130. [Google Scholar] [CrossRef]
  93. Gabriel, D.S.; Tiana, A.N. Mechanical Properties Improvement of Recycled Polypropylene with Material Value Conservation Schemes Using Virgin Plastic Blends. Mater. Sci. Forum 2020, 1015, 76–81. [Google Scholar] [CrossRef]
  94. Maguluri, N.; Suresh, G.; Rao, K.V. Assessing the effect of FDM processing parameters on mechanical properties of PLA parts using Taguchi method. J. Thermoplast. Compos. Mater. 2023, 36, 1472–1488. [Google Scholar] [CrossRef]
  95. Roy, R.K. Design of Experiments Using the Taguchi Approach: 16 Steps to Product and Process Improvement; John Wiley & Sons: Hoboken, NJ, USA, 2001. [Google Scholar]
  96. Teharia, R.; Singari, R.M.; Kumar, H. Optimization of process variables for additive manufactured PLA based tensile specimen using taguchi design and artificial neural network (ANN) technique. Mater. Today Proc. 2022, 56, 3426–3432. [Google Scholar] [CrossRef]
  97. Little, H.A.; Tanikella, N.G.; Reich, M.J.; Fiedler, M.J.; Snabes, S.L.; Pearce, J.M. Towards Distributed Recycling with Additive Manufacturing of PET Flake Feedstocks. Materials 2020, 13, 4273. [Google Scholar] [CrossRef] [PubMed]
  98. Cisneros-López, E.O.; Pal, A.K.; Rodriguez, A.U.; Wu, F.; Misra, M.; Mielewski, D.F.; Kiziltas, A.; Mohanty, A.K. Recycled poly(lactic acid)–based 3D printed sustainable biocomposites: A comparative study with injection molding. Mater. Today Sustain. 2020, 7–8, 100027. [Google Scholar] [CrossRef]
Figure 1. Flow chart of the research methodology.
Processes 12 00760 g001
Figure 2. Processing of household PC-PLA waste.
Processes 12 00760 g002
Figure 3. Flowchart of blended filament production.
Processes 12 00760 g003
Figure 4. Illustration of the process followed for blended filament production.
Processes 12 00760 g004
Figure 5. Schematic of (a) tensile [49] and (b) flexural test specimens [50].
Processes 12 00760 g005
Figure 6. Schematic of (a) impact [51] and (b) hardness test specimens [52].
Processes 12 00760 g006
Figure 7. Surface roughness measurement on the selected five points of the top surface of tensile specimens [48].
Processes 12 00760 g007
Figure 8. (a) Surface roughness of vPLA:PC-PLA (50:50) blended filament 3D-printed specimens; and (b) comparison of surface roughnesses of vPLA [48], rPLA [48], and vPLA:PC-PLA (50:50) blended filament printed specimens (where LH is the layer height, I is the infill percentage, and NT is the nozzle temperature).
Processes 12 00760 g008
Figure 9. (a) Shore D hardness of the vPLA:PC-PLA (50:50) blended filament 3D-printed specimens; and (b) comparison of hardness values for vPLA [48], rPLA [48], and vPLA:PC-PLA (50:50) blended filament printed specimens (where LH is the layer height, I is the infill percentage, and NT is the nozzle temperature).
Processes 12 00760 g009
Figure 10. Tensile stress vs. tensile strain curves for vPLA:PC-PLA (50:50) blended filament 3D-printed specimens (where LH is the layer height, I is the infill percentage, and NT is the nozzle temperature).
Processes 12 00760 g010
Figure 11. Comparison of UTS for vPLA [48], rPLA [48], and vPLA:PC-PLA (50:50) blended filament printed specimens (where LH is the layer height, I is the infill percentage, and NT is the nozzle temperature).
Processes 12 00760 g011
Figure 12. Flexural stress–strain curves for vPLA: PC-PLA (50:50) blended filament 3D-printed specimens (where LH is the layer height, I is the infill percentage, and NT is the nozzle temperature).
Processes 12 00760 g012
Figure 13. Comparison of flexural strength for vPLA [48], rPLA [48], and vPLA:PC-PLA (50:50) blended filament printed specimens (where LH is the layer height, I is the infill percentage, and NT is the nozzle temperature).
Processes 12 00760 g013
Figure 14. Charpy impact strength of vPLA:PC-PLA (50:50) blended filament 3D-printed specimens (where LH is the layer height, I is the infill percentage, and NT is the nozzle temperature).
Processes 12 00760 g014
Figure 15. Comparison of the impact strengths of vPLA [48], rPLA [48], and vPLA:PC-PLA (50:50) blended filament printed specimens (where LH is the layer height, I is the infill percentage, and NT is the nozzle temperature).
Processes 12 00760 g015
Figure 16. Micrographs of the fractured vPLA:PC-PLA (50:50) blended filament 3D-printed tensile specimens for (a) run 1, (b) run 3, (c) run 6, (d) run 7, and (e) run 9.
Processes 12 00760 g016aProcesses 12 00760 g016b
Figure 17. Main effects plots illustrating S/N ratios for the tensile properties of blended specimens: (a) yield strength, (b) ultimate tensile strength (UTS), (c) strain at UTS, (d) fracture strength, (e) strain at fracture, (f) elastic modulus, (g) work until UTS, and (h) work until fracture.
Processes 12 00760 g017
Figure 18. Main effects plots illustrating S/N ratios for the flexural properties of blended specimens: (a) yield strength, (b) flexural strength, (c) flexural strain, (d) elastic modulus, and (e) work until flexural strength.
Processes 12 00760 g018
Figure 19. Main effect plots of S/N ratios for (a) impact strength and (b) hardness of blended specimens.
Processes 12 00760 g019
Figure 20. Main effects plot of S/N ratios for surface roughness of blended specimen (a) Ra, (b) Rq.
Processes 12 00760 g020
Figure 21. (a) Stress–strain diagram of 100% PC-PLA 3D-printed tensile sample, and (b) comparison of UTS for vPLA, rPLA, and vPLA:PC-PLA (50:50) blended specimens and 100% PC-PLA tensile samples.
Processes 12 00760 g021
Table 1. Experimental layout based on Taguchi L9 OA design [48].
Experimental RunCoded MatrixUn-Coded Matrix
ABCLayer Height (mm)Infill (%)Nozzle Temperature (°C)
11110.160195
21220.180205
31330.1100215
42120.260205
52230.280215
62310.2100195
73130.360215
83210.380195
93320.3100205
Table 2. Fixed printing parameters and their corresponding values.
ParameterSpecific ParameterValues (Constant)
LayerShell thickness2 mm
ExtruderExtrusion width0.4 mm
Retraction speed40 mm/s
InfillInfill patternRectilinear
SpeedPrinting speed50 mm/s
Infill speed50 mm/s
SupportSupport structureNone
Platform additionNone
TemperatureHeat bed temperature 45 °C
Table 3. Tensile properties of the vPLA:PC-PLA (50:50) blended filament 3D-printed specimens (where LH is the layer height, I is the infill percentage, and NT is the nozzle temperature).
Experimental RunYield Strength (MPa)Ultimate Tensile Strength (UTS) (MPa)Strain at UTS
(%)
Fracture Strength (MPa)Strain at Fracture (%)Elastic Modulus (GPa)Work until UTS (kJ/m2)Work until Fracture (kJ/m2)
Run 1 (LH: 0.1, I: 60, NT: 195)25.35 ± 1.9826.15 ± 2.952.09 ± 2.3125.25 ± 1.562.90 ± 1.861.98 ± 1.1521.97 ± 1.5835.81 ± 1.51
Run 2 (LH: 0.1, I: 80, NT: 205)28.72 ± 2.2529.40 ± 2.852.13 ± 2.1027.51 ± 1.853.15 ± 2.852.02 ± 1.1723.36 ± 1.0246.61 ± 1.92
Run 3 (LH: 0.1, I: 100, NT: 215)28.12 ± 2.1036.01 ± 1.852.14 ± 2.2534.33 ± 1.933.05 ± 2.532.33 ± 1.0228.62 ± 1.0949.06 ± 1.52
Run 4 (LH: 0.2, I: 60, NT: 205)31.24 ± 2.0540.41 ± 1.122.12 ± 1.2537.66 ± 1.833.03 ± 2.142.65 ± 1.0532.25 ± 1.1967.50 ± 1.38
Run 5 (LH: 0.2, I: 80, NT: 215)41.85 ± 1.9546.67 ± 1.982.20 ± 1.4544.95 ± 1.843.41 ± 1.972.85 ± 1.1439.74 ± 1.1475.52 ± 1.52
Run 6 (LH: 0.2, I: 100, NT: 195)32.37 ± 1.9142.22 ± 2.252.17 ± 1.5838.83 ± 1.793.42 ± 2.052.70 ± 1.5434.18 ± 1.2766.98 ± 1.24
Run 7 (LH: 0.3, I: 60, NT: 215)43.64 ± 1.6848.88 ± 1.562.37 ± 1.8746.05 ± 1.893.35 ± 2.613.20 ± 1.3242.31 ± 1.3477.66 ± 1.34
Run 8 (LH: 0.3, I: 80, NT: 195)34.01 ± 1.8143.62 ± 2.102.14 ± 2.3738.92 ± 1.873.69 ± 2.132.75 ± 1.2934.524 ± 1.5175.36 ± 1.05
Run 9 (LH: 0.3, I: 100, NT: 205)43.47 ± 1.8847.78 ± 2.542.28 ± 2.2147.35 ± 1.943.54 ± 2.103.40 ± 1.1842.51 ± 1.2477.74 ± 1.19
Table 4. Flexural test results of the vPLA: PC-PLA (50:50) blended filament 3D-printed specimens (where LH is the layer height, I is the infill percentage, and NT is the nozzle temperature).
Experimental RunYield Stress (MPa)Flexural Stress (MPa)Flexural Strain (%)Elastic Modulus (GPa)Work until Maximum Flexural Stress (kJ/m2)
Run 1 (LH: 0.1, I: 60, NT: 195)43.76 ± 3.2151.01 ± 1.866.69 ± 1.891.97 ± 1.2619.09 ± 2.83
Run 2 (LH: 0.1, I: 80, NT: 205)54.04 ± 2.5663.81 ± 2.107.69 ± 2.672.15 ± 2.5725.86 ± 2.01
Run 3 (LH: 0.1, I: 100, NT: 215)59.32 ± 2.2167.23 ± 2.926.71 ± 2.152.29 ± 2.9328.78 ± 2.12
Run 4 (LH: 0.2, I: 60, NT: 205)62.80 ± 2.2177.20 ± 2.046.25 ± 2.652.52 ± 2.3433.49 ± 2.05
Run 5 (LH: 0.2, I: 80, NT: 215)71.13 ± 2.1484.23 ± 2.098.40 ± 2.392.65 ± 2.0142.34 ± 2.45
Run 6 (LH: 0.2, I: 100, NT: 195)69.19 ± 2.7677.18 ± 1.677.64 ± 2.952.44 ± 1.8536.30 ± 1.54
Run 7 (LH: 0.3, I: 60, NT: 215)76.24 ± 2.8988.36 ± 1.477.07 ± 2.282.89 ± 2.0137.92 ± 2.31
Run 8 (LH: 0.3, I: 80, NT: 195)70.87 ± 3.9081.37 ± 1.856.92 ± 1.122.50 ± 1.4537.19 ± 1.41
Run 9 (LH: 0.3, I: 100, NT: 205)78.11 ± 2.2988.29 ± 2.177.82 ± 2.562.67 ± 2.2045.19 ± 2.07
Table 5. ANOVA responses of various properties examined in this study (where LH is the layer height, and NT is the nozzle temperature).
ResponseSourceDFSeq SSAdj SSAdj MSF-Valuep-Value% Contribution
Tensile strengthLH222.7522.7511.3740.870.02483.24
Infill21.781.780.893.210.2386.54
NT22.232.231.124.010.1998.18
Residual error20.550.550.28 2.04
Total827.31 100.00
Flexural strengthLH215.8715.877.9366.190.01579.89
Infill21.121.120.564.680.1765.65
NT22.632.631.3110.980.08313.25
Residual error20.240.240.11 1.21
Total819.87 100.00
Impact strengthLH22.132.131.0715.890.05934.28
Infill22.452.451.2218.260.05239.19
NT21.521.520.7611.330.08124.38
Residual error20.130.130.07 2.15
Total86.24 100.00
Shore D hardnessLH20.090.090.0412.70.07346.29
Infill20.080.080.0411.440.0841.69
NT20.020.020.012.30.3038.37
Residual error20.010.010.00 3.64
Total80.19 100.00
Surface roughnessLH241.5641.5620.7897.840.0168.47
Infill21.261.260.632.970.2522.08
NT217.4517.458.7341.080.02428.75
Residual error20.420.420.21 0.70
Total860.70 100.00
Table 6. Summary of optimum printing parameters for vPLA:PC-PLA (50:50) blended specimens.
FactorsTensile StrengthFlexural StrengthImpact StrengthShore D HardnessSurface Roughness
LevelDescriptionLevelDescriptionLevelDescriptionLevelDescriptionLevelDescription
Layer Height (mm)30.330.330.330.310.1
Infill (%)3100310031003100160
Nozzle Temperature (°C)32153215220532152205
Table 7. Confirmation test summary based on optimum factors.
Output ResponsePredictionConfirmation
S / N p r e d i c t e d C . I . p r e d i c t e d S / N c o n f i r m a t i o n C . I . c o n f i r m a t i o n
Tensile Strength34.67±2.5835.81±1.52
Flexural Strength39.58±4.1940.34±2.51
Impact Strength14.62±0.1614.97±0.15
Shore D Hardness38.14±0.7038.23±1.05
Surface Roughness−14.94±1.07−5.90±1.32
Disclaimer/Publisher’s Note: The statements, opinions and data contained in all publications are solely those of the individual author(s) and contributor(s) and not of MDPI and/or the editor(s). MDPI and/or the editor(s) disclaim responsibility for any injury to people or property resulting from any ideas, methods, instructions or products referred to in the content.

