1. Introduction
Distillation is one of the most important separation techniques in chemical engineering. Distillation accomplishes the separation of mixtures by utilizing the differences in relative volatility between the components. The separation of mixtures with close boiling points or azeotropes by conventional distillation becomes difficult or even impossible. Extractive distillation (ED) can be applied to the separation of mixtures that are difficult to achieve by conventional distillation [
1]. In ED, the relative volatility between components is increased to different levels by using different entrainers, and the separation and entrainer recovery are achieved by using an extractive distillation column (EDC) and an entrainer recovery column (ERC).
The main driving force of ED relies on the strength of the interactions between the entrainer and each component [
2]. The entrainer must be selected to exhibit a strong affinity for one or multiple components, realizing a change in relative volatility. Entrainer screening is one of the important steps in designing ED [
3]. The design and optimization of ED is complicated by the fact that the selection of a reasonable entrainer is not only related to the successful separation of azeotropes, but also closely related to the economics and environmental impact of the process [
4].
In ED processes, the component removed from the top of the EDC is not always the one with the lowest boiling point [
5,
6]. The entrainer may reverse the relative volatility of the components in ED, resulting in components with higher boiling points being removed from the top of the EDC due to the strength of interactions between the entrainer and each component [
7]. For example, chlorobenzene (CB) and toluene are used as entrainers to separate methanol–acetone, with the high-boiling-point methanol being removed from the top of the EDC, and the low-boiling-point acetone and entrainer being removed from the bottom of the EDC. Other entrainers such as water, N,N-Dimethylformamide (DMF) lead to acetone being removed from the top of the EDC [
8]. The impact of feed composition on the distillation sequence in some specific extractive distillation and pressure swing distillation processes has been explored. In the heterogeneous azeotropic distillation case of separating the ethanol–water mixture using cyclohexane as the entrainer, direct introduction into the azeotropic distillation column is advisable when the feed composition is close to the azeotropic point. Conversely, if the feed composition deviates significantly from the azeotropic composition, the process necessitates first directing the feed to a water removal column to obtain a mixture with the composition close to the azeotropic point, before proceeding to the azeotropic distillation column for further separation [
9]. Lee et al. [
10] investigated the separation of isopropanol (IPA), water, and diisopropyl ether (DIPE) through pressure swing distillation. They suggested that for a feed composition of DIPE/IPA/water = 0.36:0.48:0.16, a sequence of a medium-pressure (MP) column, followed by a low-pressure (LP) column, and then a high-pressure (HP) column should be adopted for optimal separation. Conversely, for a feed composition of DIPE/IPA/water = 0.47:0.44:0.09, a “LP-HP-LP” sequence is more effective. However, there are no systematic studies to show whether the distillation sequence is affected by the feed composition for the ED processes.
There are many studies on entrainer selection [
11,
12,
13]. Among them, the selection of entrainers is mainly based on the ability of different entrainers to change the relative volatility at the same molar ratio of entrainer to feed (E/F). Zhang et al. [
14] chose dimethyl sulfoxide, 1,2-propanediol (PG), CB, and p-xylene as the candidate entrainers for separating ethanol and benzene. The
x-
y diagram of ethanol and benzene was plotted at E/F = 1, and PG and p-xylene were used as the preferred entrainers due to their greater degree of deviation from the diagonal. The changes in the relative volatility of ethanol and benzene were plotted at E/F = 0 to 1.5 in steps of 0.3. When E/F was less than 1.3, PG showed better performance in changing the relative volatility of ethanol and benzene; when E/F was more than 1.3, p-xylene showed better performance. PG was selected as the entrainer and there was no detailed discussion on how to select the entrainer The current selection of entrainers is commonly performed with the E/F at 0.5, 1, and 2, which is usually chosen as an empirical value and not taking into account whether the E/F needs to be adjusted with the feed composition.
In this work,
Section 2 presents the conditions and optimization methods used for the design of ED;
Section 3 describes the ED process under different light and heavy key components after the addition of different entrainers;
Section 4 and
Section 5 are two ED case studies, ethyl acetate–ethanol and acetone–methanol, respectively. This work investigated which type of entrainer is more economical for altering or not altering the light and heavy key components, and how to determine a reasonable E/F for screening entrainers, across different feed compositions.
2. Design Basis
2.1. Economic Evaluation
The economic evaluation adopted the minimum total annual cost (TAC) including total equipment cost (TCC) and operating cost (OC) as the optimization objective [
15]. The equipment cost only considered the components such as heat exchanger, distillation column, plate, etc.; the operating cost only considered steam consumption. The TAC was calculated as follows:
The OP represented the operating period of the plant, considered to be 3 years, and the annual operating time was calculated as 8000 h. The column internal diameter (ID) was calculated using the Tray Sizing function embedded in the Aspen Plus software, and the plate type used was the sieve plate. The plate spacing was 610 mm according to the default value, and the pressure drop of each theoretical plate was specified as 680 Pa. The heat transfer coefficients (K) were calculated according to 852 W/m
2·K (for condenser) and 568 W/m
2·K (for the reboiler). The detailed calculation process for the TAC is given in
Table S1 of the Supplementary Materials.
2.2. Energy Consumption
Energy consumption is another important measure of the distillation process. Here, the total energy consumption (
QTEC) is defined as the sum of the additional energy.
where
QRi is the reboiler heat duty (kW) and n is the number of reboilers.
2.3. Optimization Process
Determining the type, number, and range of optimized parameters is an important step before optimization begins. The independent and dependent parameters of the distillation process are determined by freedom analysis. Although product purity can be achieved through the design specification of the reflux ratio, sometimes the design specification is affected by the tolerance problems and the calculation of the initial value, causing it to miss the reasonable solution. Therefore, this study did not optimize the reflux ratio through design specifications. The design parameters to be optimized for the ED process included the entrainer flow rate (E), distillate rate (D), theoretical plate number (NT), feed position (NF), and reflux ratio (RR).
Product flow rate is an important optimization parameter, and setting an unreasonable range will greatly affect the optimization speed. The setting range should not exceed the total flow rate of the component in the feed, and at the same time, too low the flow rate will affect the subsequent separation. Taking the A–B system in the ED process as an example, the purity requirements for the two products are
xD1 and
xD2, respectively. The range for the product rate should satisfy Equations (3) and (4).
Table 1 demonstrates the range of optimization parameters and speed in ED.
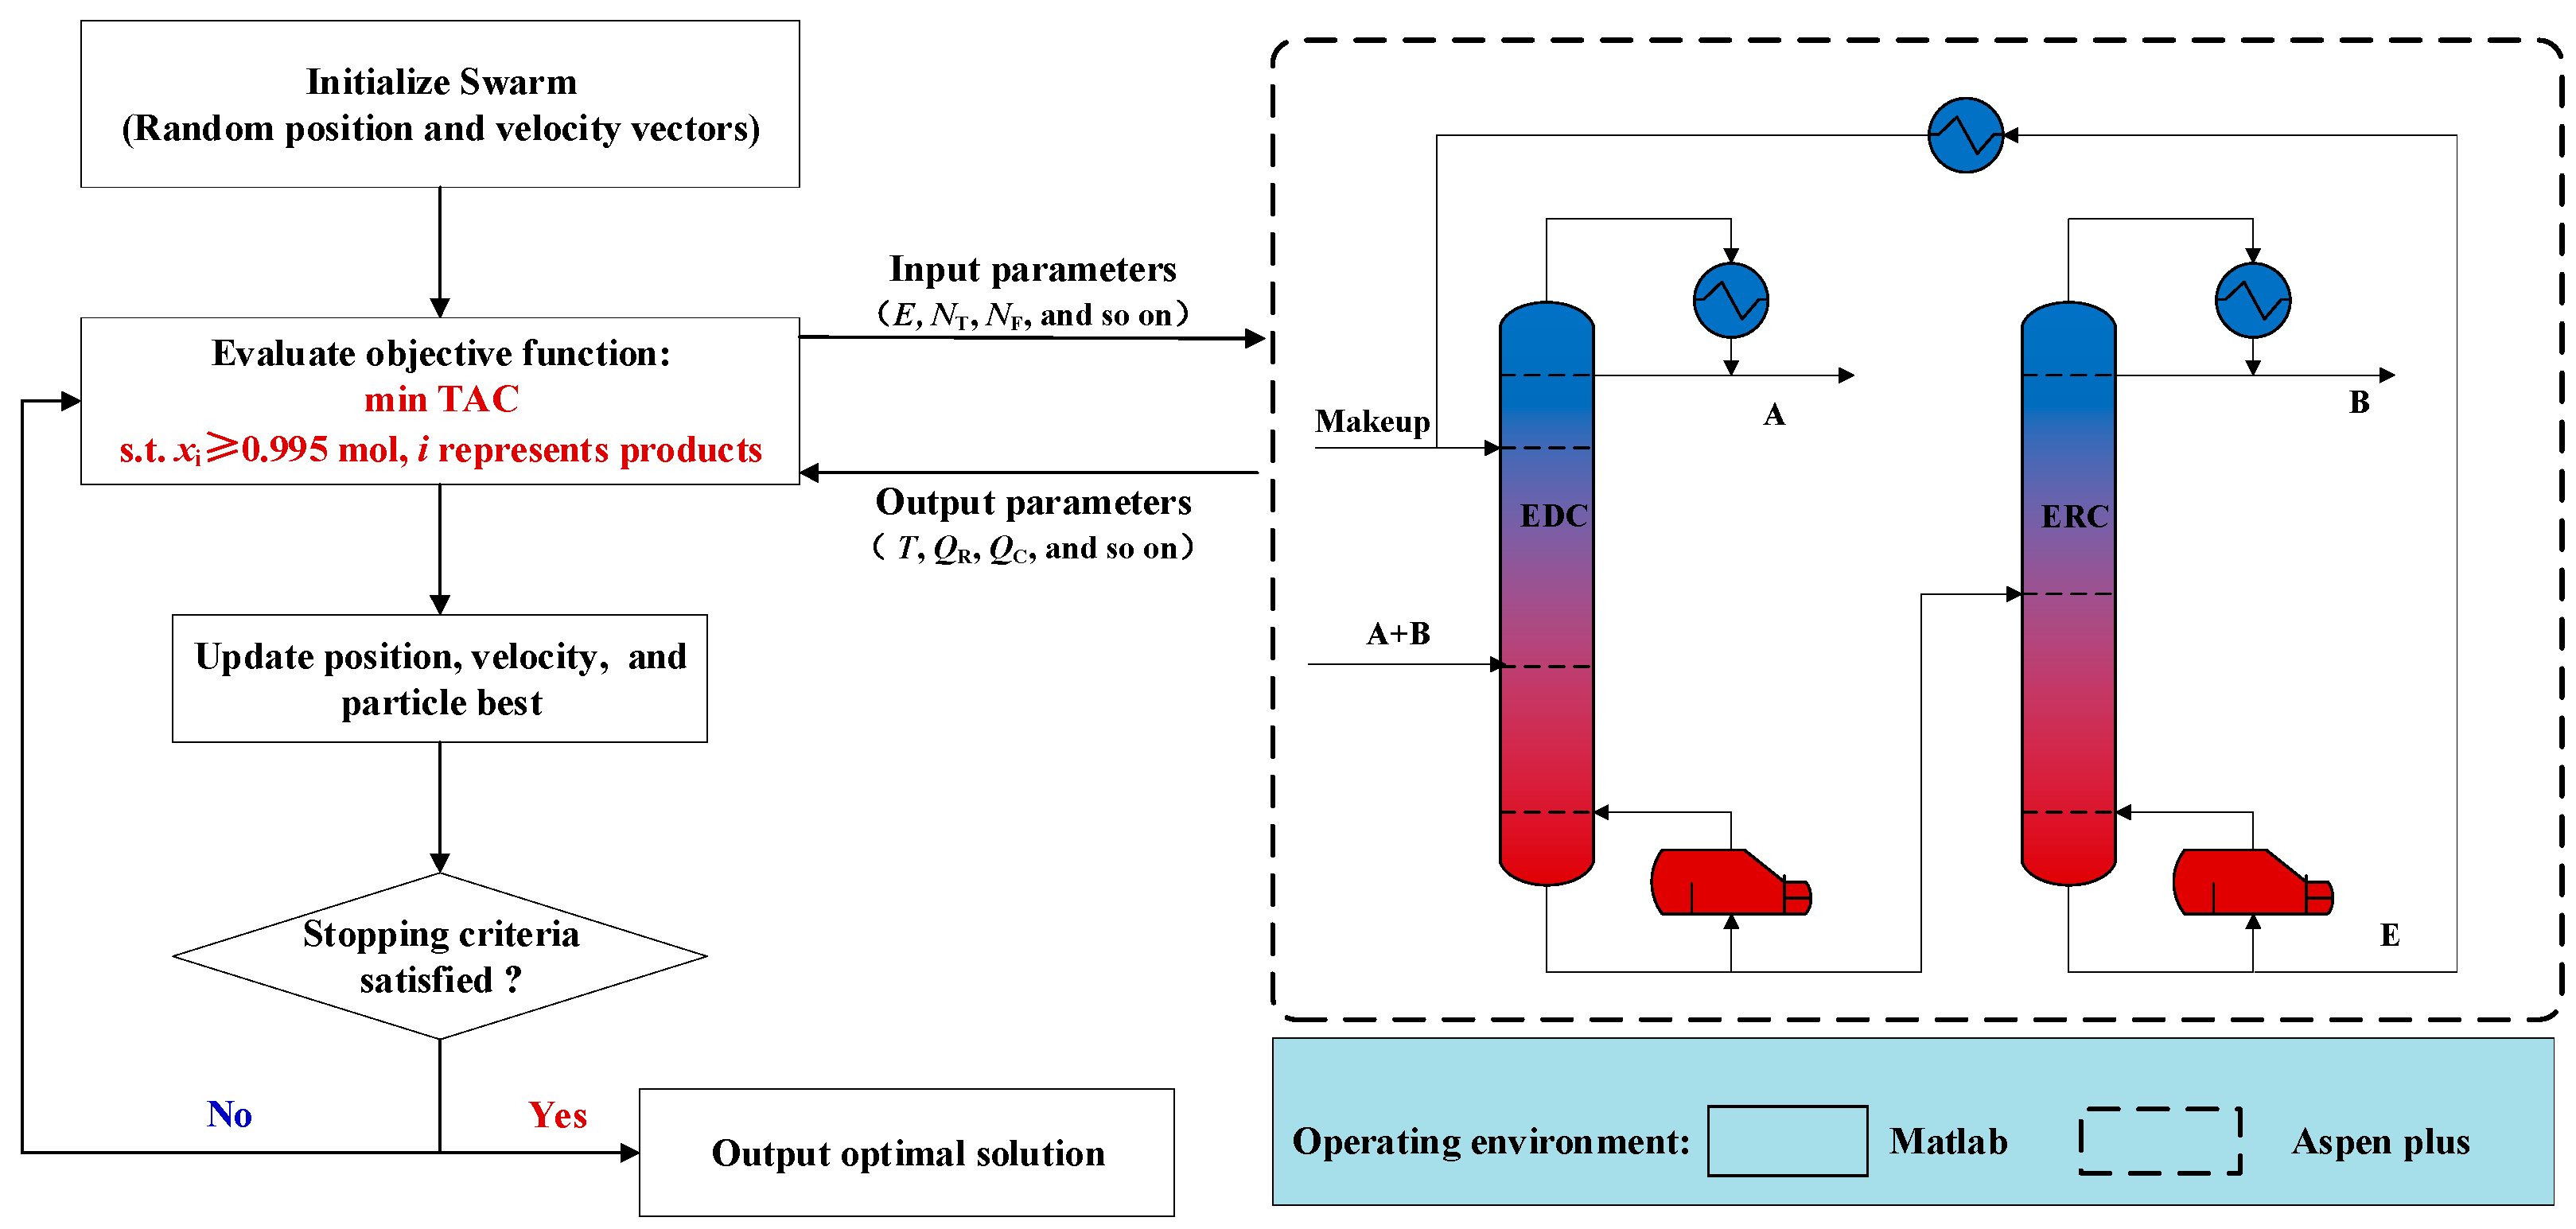
Figure 1 shows the optimization process for each entrainer. The Component Object Model technology facilitated data exchange between Matlab and Aspen Plus. The Particle Swarm Optimization (PSO) algorithm was employed to optimize the parameters of the distillation process in Matlab [
16]. The PSO algorithm obtained different particles (representing distillation parameters). Subsequently, duty, ID, and other related parameters were obtained in the Aspen Plus software. These parameters were then returned to Matlab for calculating the TAC and comparison. This information was used to further update all particles until the specified requirements were met, ultimately producing the optimized results. For simulation errors that did not converge or resulted in errors within the Aspen Plus software, they were deemed unfeasible and were assigned a maximum TAC value of 2 × 10
7 USD/year to ensure they did not affect the output of the optimal result. The positions of the particles were controlled by the following formulas:
In them,
t represents the number of iterations for the population;
c1 and
c2 are acceleration constants;
r1 and
r2 are random numbers within the range of [0,1], which increases the randomness of particles;
j = 1, 2,..., n;
pij represents the position of the particle, while
pgj represents the current optimal particle position. The particle velocity,
vij, changes as iterations progress and is confined within the range
vij∈[−
vmax,
vmax], where −
vmax and
vmax are listed in
Table 1. The relevant parameters set for the PSO algorithm are shown in
Table 2. The sizepop,
c1, and
c2 were set as 50, 1.4, and 1.4, respectively [
17].
w is the inertia weight, it started at 0.9 and linearly decreased with each iteration to 0.4 [
18].
3. Conceptual Design
For binary azeotropic systems, especially when the boiling points of the two components are very close (usually not exceeding 10 K), the conversion of light and heavy key components can be achieved by adding controllable entrainers, such as with ethyl acetate–ethanol, ethanol–benzene, and acetone–methanol.
Table 3 illustrates the conversion of light and heavy key components for three systems under different entrainers. After the addition of an entrainer, if the low-boiling-point component is removed from the top of the EDC, the entrainer is termed a positive entrainer. Conversely, when the high-boiling-point component is removed from the top of the EDC after the addition of an entrainer, the entrainer is referred to as a reverse entrainer.
For the separation process of non-azeotropic systems containing more than two feed components, the common practice is to remove the component with the largest proportion to reduce the duty of subsequent distillation columns and energy consumption. However, no literature has been found to confirm that this approach is still applicable to ED processes. Thus, it is essential to investigate the impact of feed composition on the of ED separation sequence. Given that positive and reverse entrainers can alter the separation sequence in ED processes, understanding the potential influence of feed composition on entrainer selection is particularly crucial.
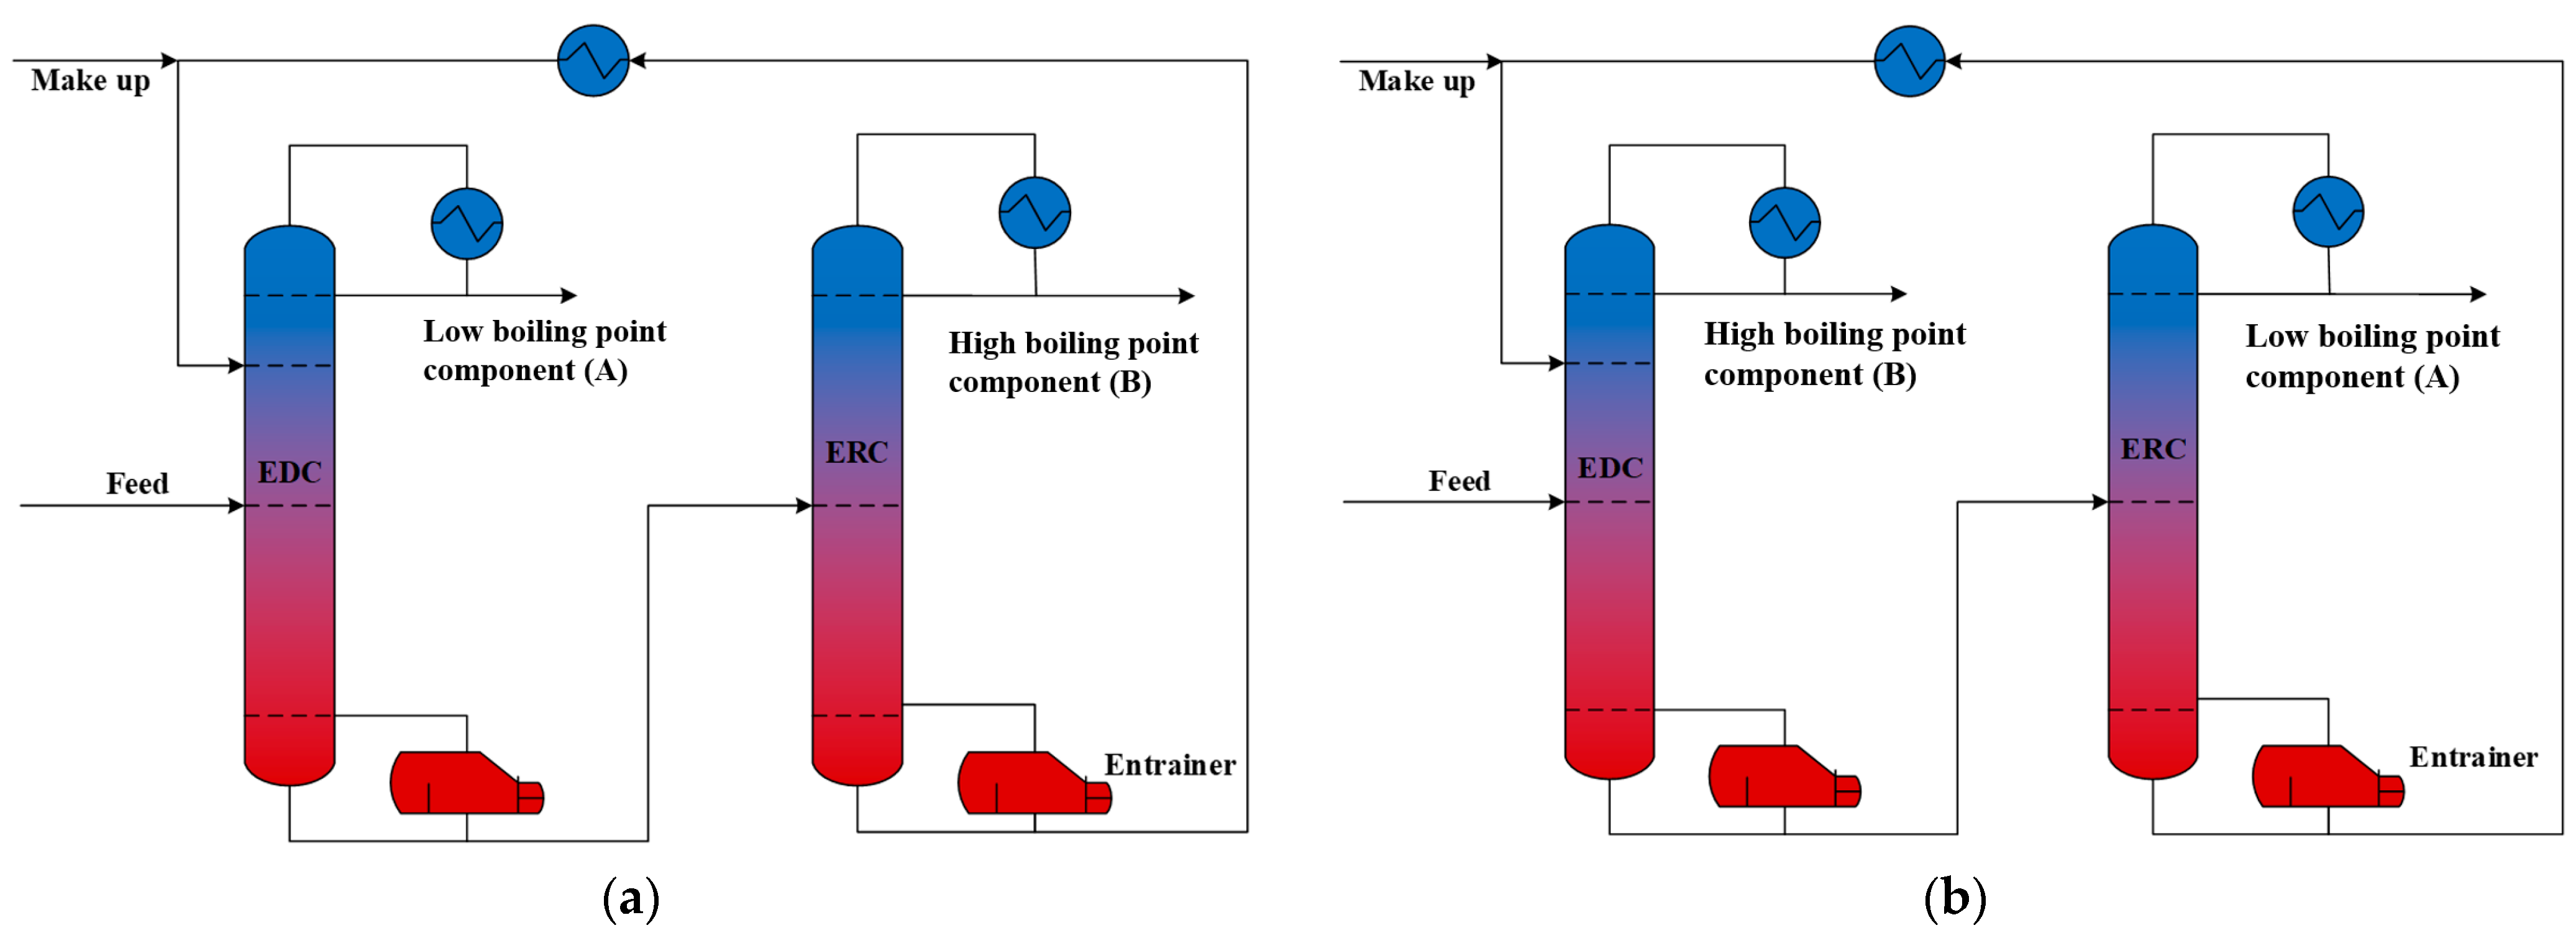
Figure 2 illustrates the sequences of extractive distillation using positive and reverse entrainers. Fresh feed and the positive entrainer enter the EDC at different trays, obtaining high-purity product A at the top of the EDC. The mixture of the entrainer and B is removed from the bottom of the EDC, and high-purity product B and the entrainer are separately withdrawn from the top and bottom of the ERC, respectively. The entrainer is cooled, and then returns to the EDC. For the ED process utilizing a reverse entrainer, there is an exchange in the positions for obtaining products A and B. Product B is removed in the EDC, while product A is withdrawn in the ERC.
This study selected the ethyl acetate–ethanol system as the object of study and investigated the economy and energy consumption of the ED process for five different feed compositions with positive and reverse entrainers, respectively. It provides insights into selecting suitable entrainers based on the feed composition, particularly when there are significant differences in the contents of various components. Additionally, this study found that the E/F is influenced by the feed composition, shedding light on how entrainer selection may be affected. Furthermore, the universality of the patterns observed was validated through the acetone–methanol system.
4. Case Study 1: Ethyl Acetate–Ethanol
Ethyl acetate–ethanol is a common alcohol–ester azeotropic system found in many industrial production processes, such as esterification [
19]. In an ethyl acetate–ethanol system, the boiling points of ethyl acetate and ethanol are 350.35 K and 351.46 K, respectively. Due to the existence of an azeotropic point [azeotropic temperature = 344.96 K, and the azeotropic composition is ethyl acetate/ethanol = 0.5530:0.4470 (mole fraction) at 1 atm], conventional distillation cannot achieve high-purity separation. The separation of alcohol–ester compounds is commonly achieved through ED.
4.1. Selection of Thermodynamic Model and Entrainer
Four entrainers, namely PG, methyl isobutyl ketone (MIK), furfural, and EG, were chosen based on the previous literature [
20,
21,
22,
23]. Zhang et al. [
14] evaluated the deviation between vapor–liquid phase equilibrium data and the data calculated by the Wilson, NRTL, and UNIQUAC models in Aspen Plus software. Among these models, the UNIQUAC model exhibited the smallest deviation. Therefore, the UNIQUAC model was chosen to predict the vapor–liquid phase equilibrium behavior of the ethyl acetate–ethanol in this study. The binary interaction parameters of the UNIQUAC model used in this process were sourced from the Aspen Plus software, as shown in
Table 4.
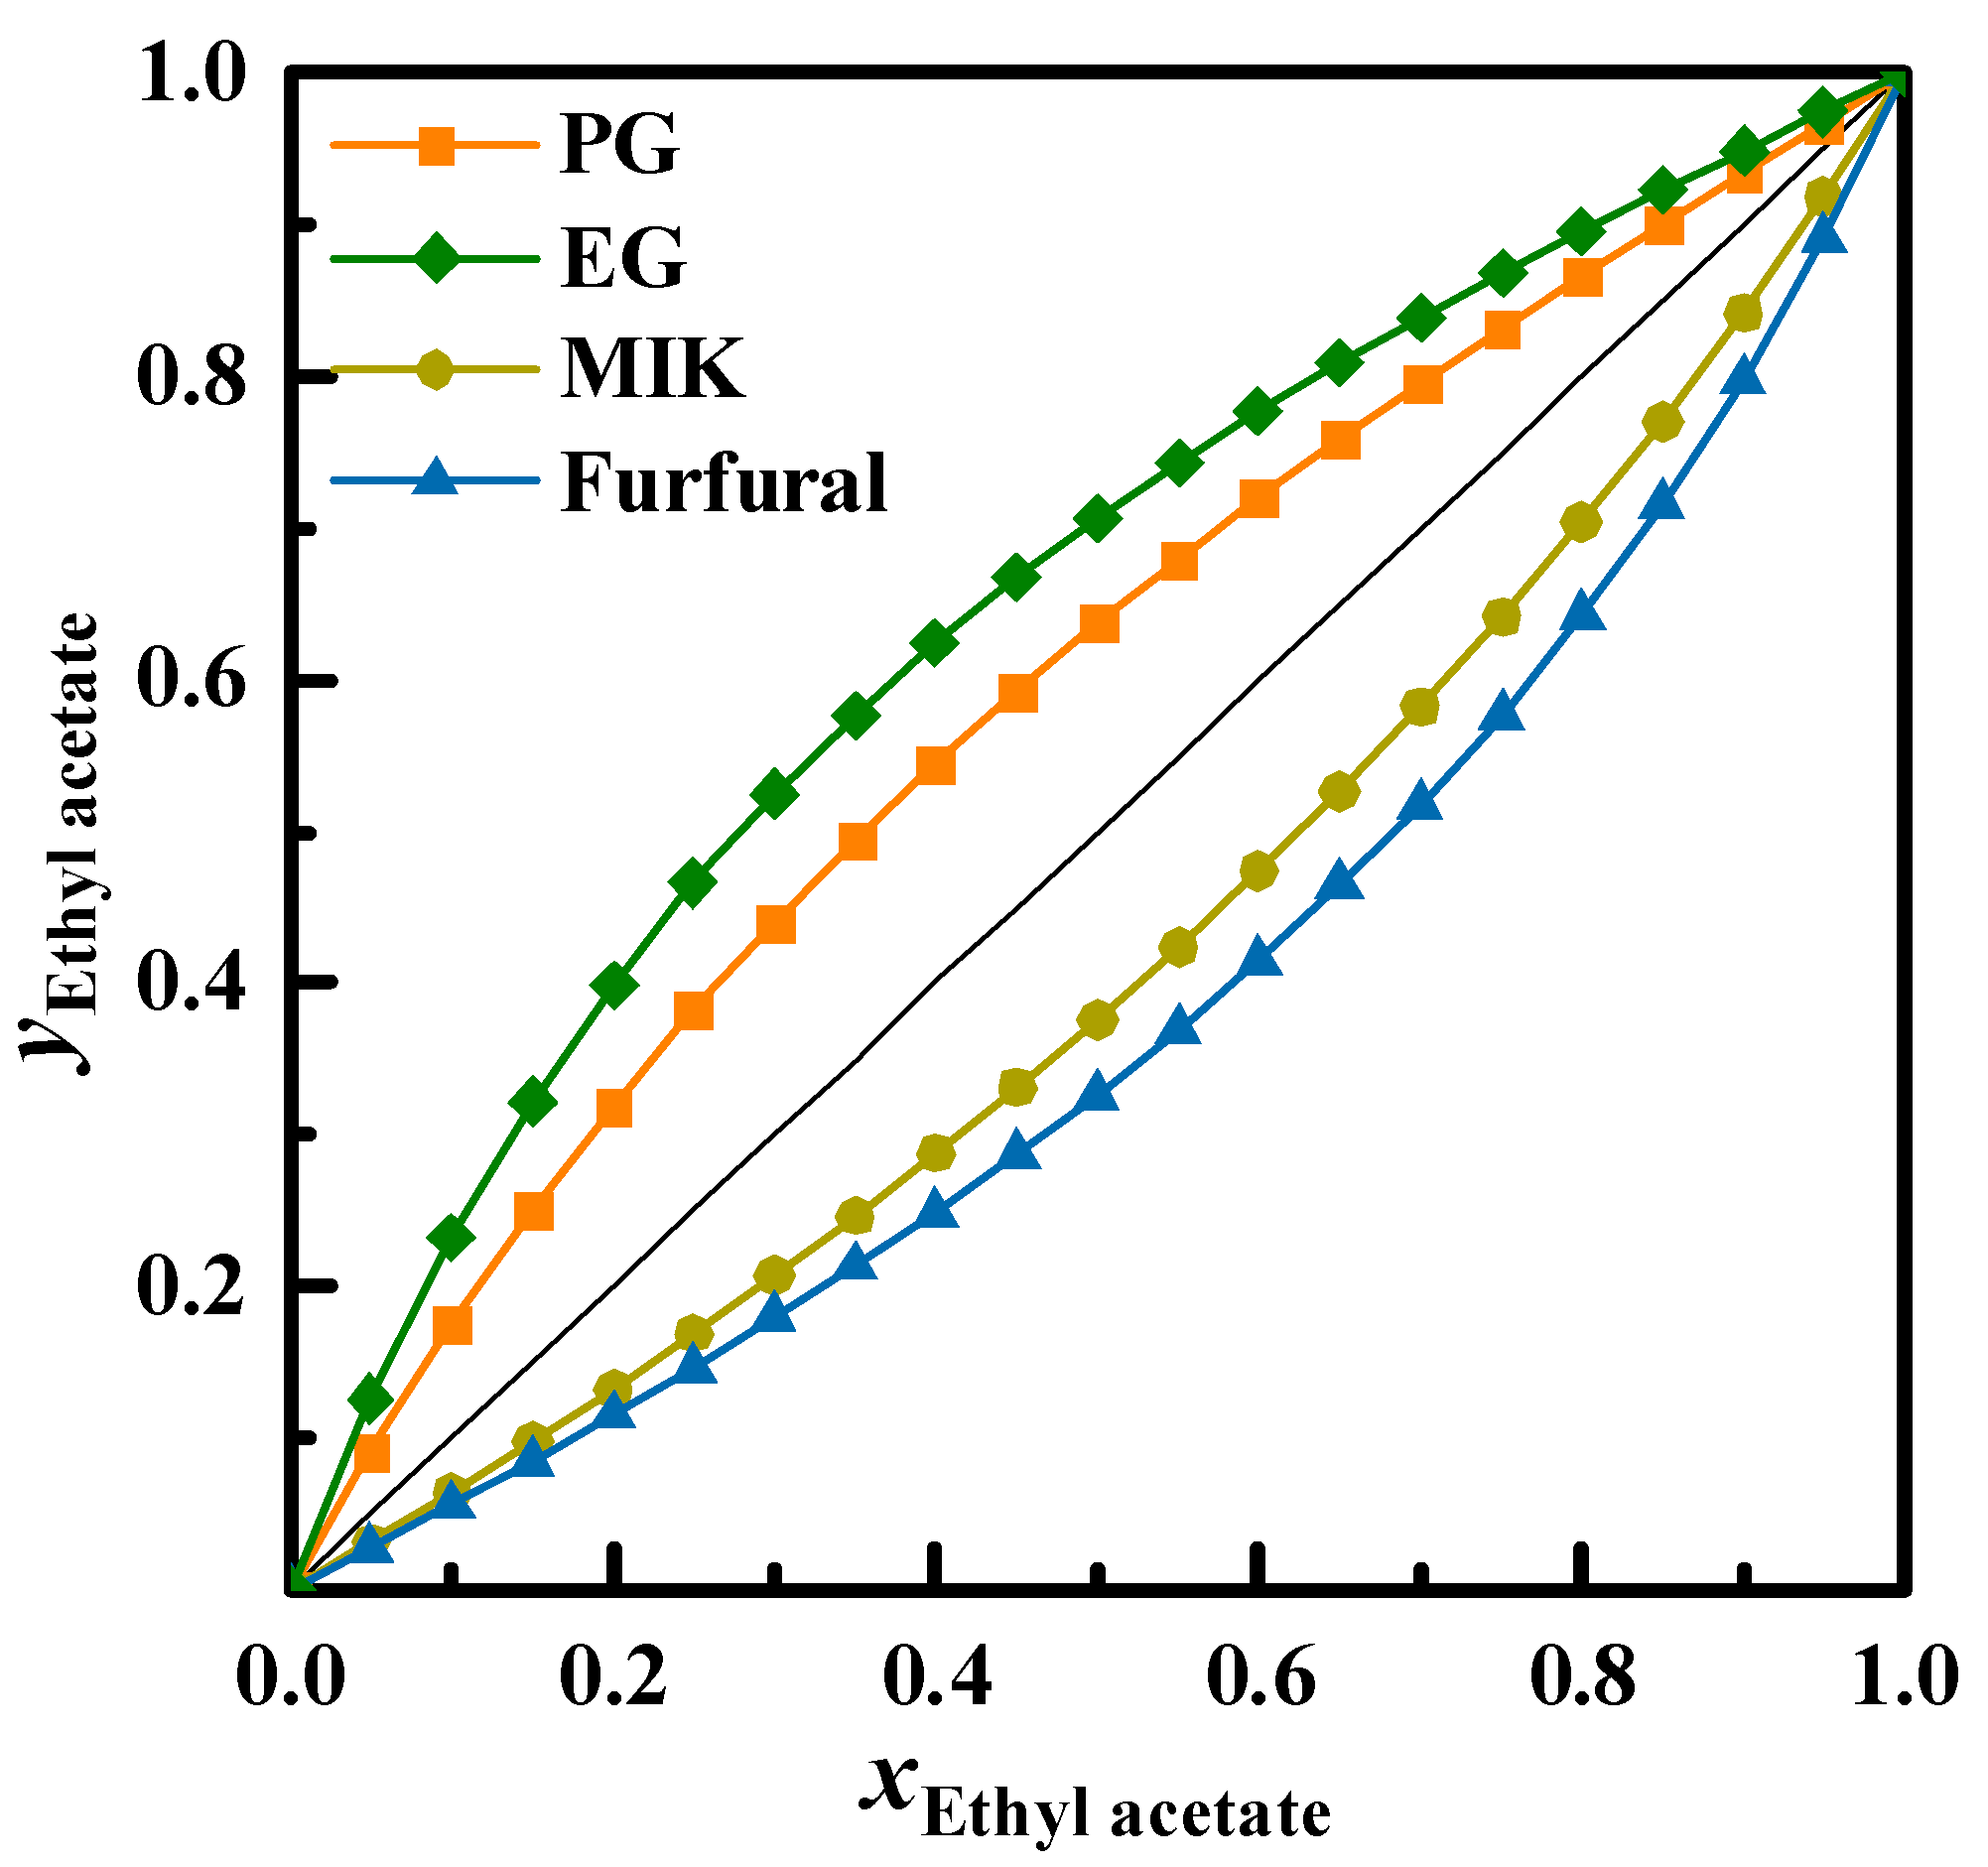
Figure 3 illustrates the
x-
y diagrams for the ethyl acetate–ethanol with E/F = 4 under the different entrainers. The four entrainers effectively alter the relative volatility of the azeotropic system. When PG and EG are used as the entrainer, ethyl acetate is removed as the light key component from the top of the EDC, defining them as positive entrainers. Conversely, when MIK and furfural are used as the entrainer, causing the removal of ethanol as the light key component from the top of the EDC, they are classified as reverse entrainers. In terms of their ability to alter relative volatility, EG demonstrates a superior effect among the positive entrainers compared to PG. Among the reverse entrainers, furfural shows a greater effect than MIK. Some literature indicates that the effectiveness of entrainers is influenced by multiple factors such as the relative volatility of components and entrainers. This study further investigated the ED process with the four entrainers using the TAC as the optimization goal to select economically optimal entrainers and explore the impact of feed compositions on positive and reverse entrainer choices.
The total feed flow rate was set at 500 kmol/h, with a molar feed ratio of 0.5:0.5 for ethyl acetate and ethanol. The product purity requirement for ethyl acetate and ethanol was set at no less than 99.5 mol%, and the entrainer recovery purity was required to be not less than 99.99 mol%.
4.2. Optimization Results
Table 5 presents the optimization results for the ED process using four different entrainers. The most optimal positive entrainer was found to be EG, with a TAC of 13.10 × 10
5 USD/year. The best reverse entrainer was furfural, with a TAC of 13.95 × 10
5 USD/year. The TAC values of these two types of entrainers were quite similar. PG and MIK exhibited comparable abilities to alter the relative volatility. However, there was a significant difference in their TAC values. This difference could potentially be due to the impact of the recovery section. When EG is employed as the entrainer, the function of the ERC is to separate ethanol–EG, with an average relative volatility of 128.36. When furfural is used as the entrainer, the main function of the ERC is to separate ethyl acetate–furfural, with an average relative volatility of 15.6. Despite the considerable difference in relative volatility values, after a relative volatility exceeds 4, its influence on the economic performance of the distillation process is not significant [
24].
The positive entrainer EG and reverse entrainer furfural were chosen to explore the relationship between the distillation sequence (influenced by the entrainer type) and the proportions in the feed compositions. Five different feed compositions were arranged with the proportion of the low-boiling-point component in the feed ranging from low to high (0.2–0.8, 0.4–0.6, 0.5–0.5, 0.6–0.4, 0.8–0.2). The total feed flow rate and product purity requirements remained consistent with the settings during entrainer selection.
The best optimization results for ten schemes were obtained, as depicted in
Table 6.
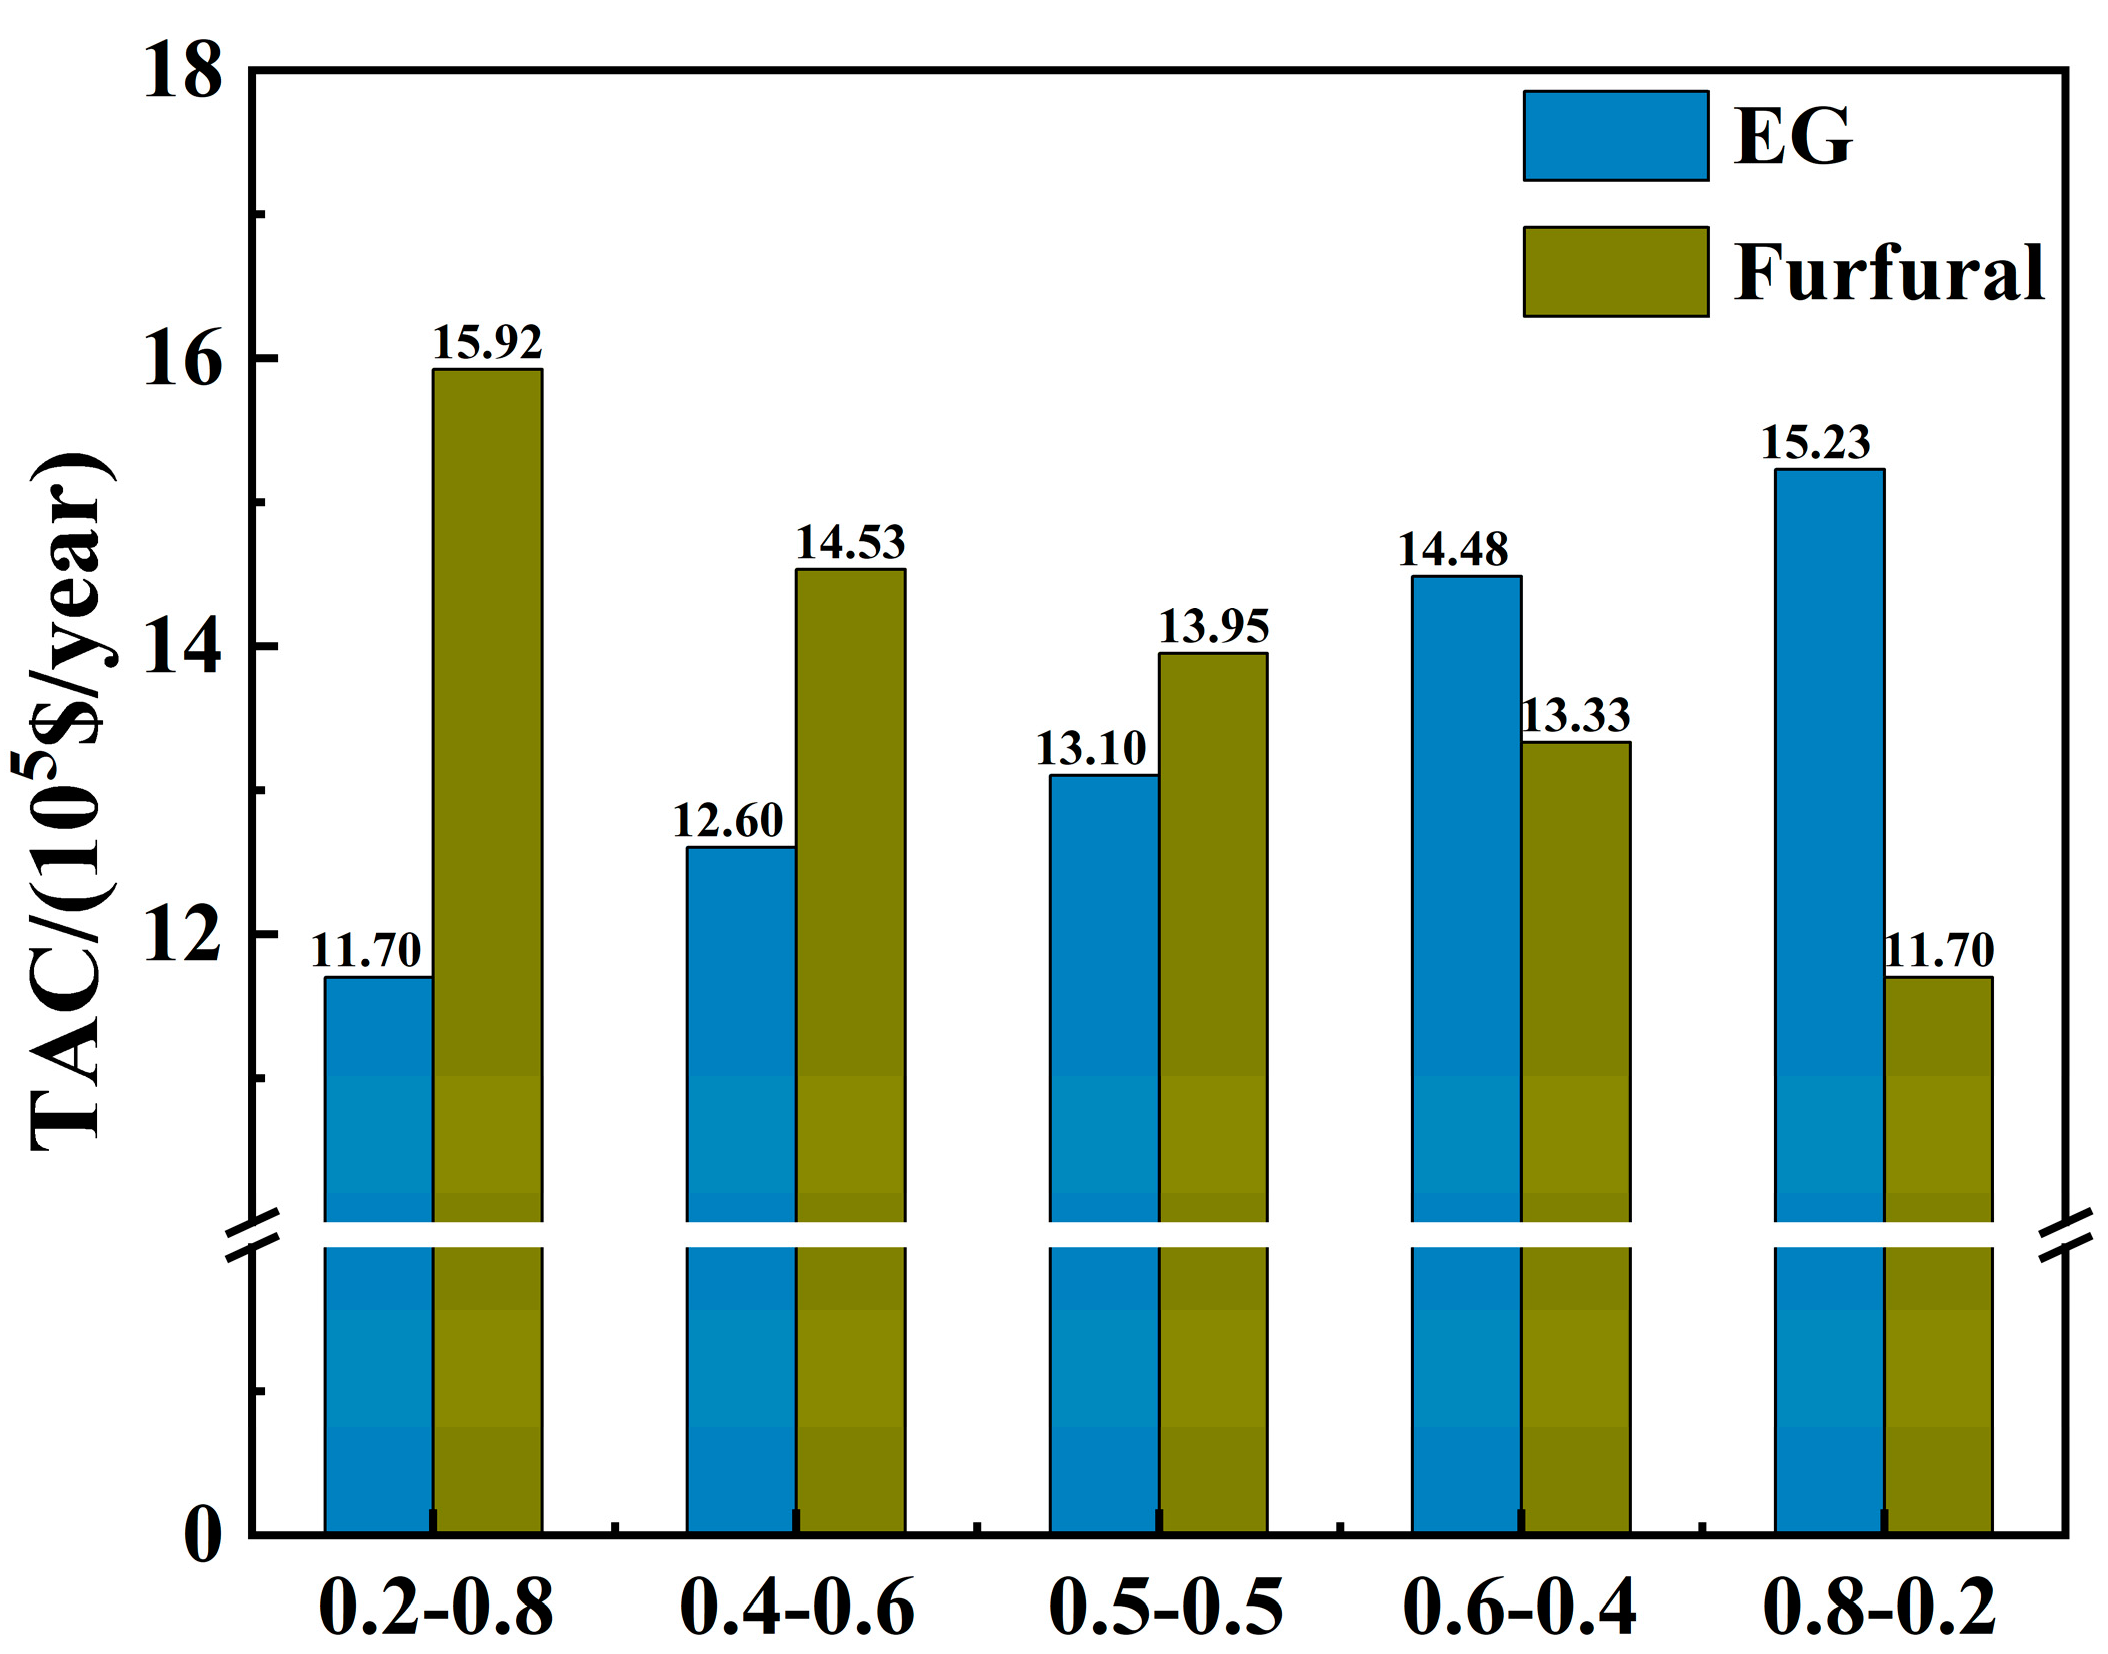
Figure 4 better illustrates the economic trend of the ED schemes with varying proportions of low-boiling-point ethyl acetate in the feed, under different entrainers. It is evident that when EG is used as the entrainer, the TAC required for the separation process increases as the proportion of the light key component, ethyl acetate, in the feed increases. Conversely, when furfural is employed as the entrainer, the TAC decreases as the proportion of the heavy key component, ethyl acetate, in the feed increases. Prioritizing the removal of components with lower proportions in the feed demonstrates superior economic performance. This superiority becomes more pronounced with an increase in the disparity between the light and heavy key components. For instance, in the 0.2–0.8 feed composition, the TAC difference between preferentially removing components with lower and higher proportions reached 36.09%. Choosing components with smaller proportions for removing in the ED process will yield enhanced economic efficiency.
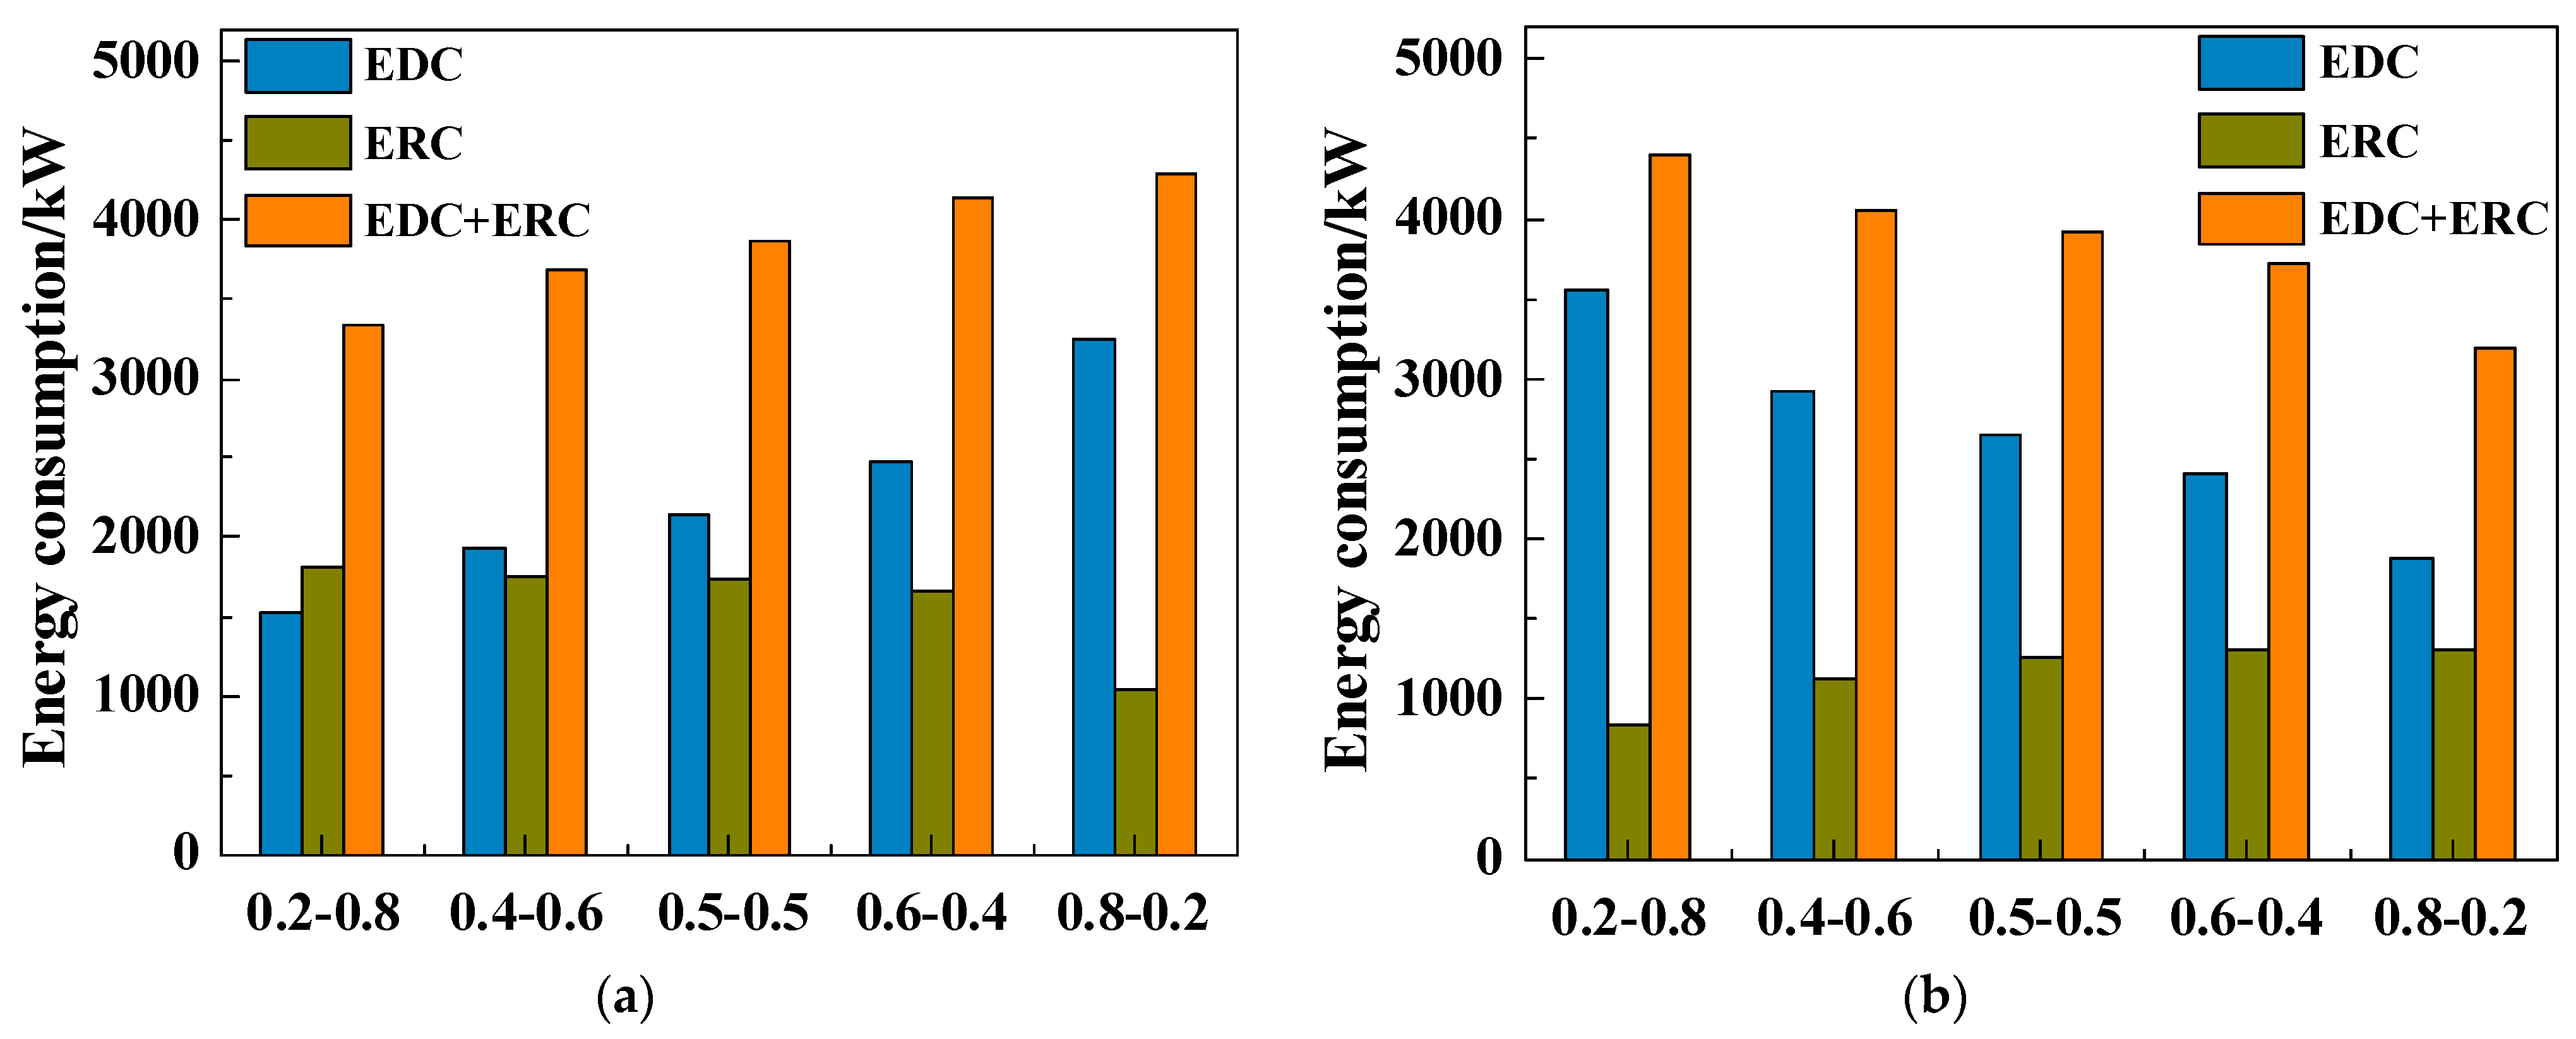
Figure 5 presents the energy consumption of the EDC, the ERC, and the total energy consumption when EG and furfural are used as entrainers to separate ethyl acetate and ethanol at different feed compositions. When EG is used as the entrainer, the energy consumption of the EDC gradually increases, while the energy consumption of the ERC decreases, resulting in a gradual increase in the total energy consumption with an increase in ethyl acetate content. Conversely, when furfural is the entrainer, an increase in the ethyl acetate content leads to a reduction in the energy consumption of the EDC, while the energy consumption of the ERC gradually increases, resulting in a reduction in the total energy consumption of the distillation column. When the feed composition of ethyl acetate and ethanol was at 0.2–0.8, prioritizing the removal of ethyl acetate showed a minimal difference in energy consumption between the EDC and the ERC. However, as the ethyl acetate content in the feed increased, the difference in energy consumption between the EDC and the ERC reached 2200.37 kW. Similarly, when furfural was used as the entrainer, an increase in the priority of removing ethanol led to a gradual increase in the difference in energy consumption between the EDC and the ERC. Additionally, prioritizing removing component with lower content can reduce the difference in the ID between the EDC and the ERC, providing a foundation for further coupling.
4.3. Analysis of Column Composition
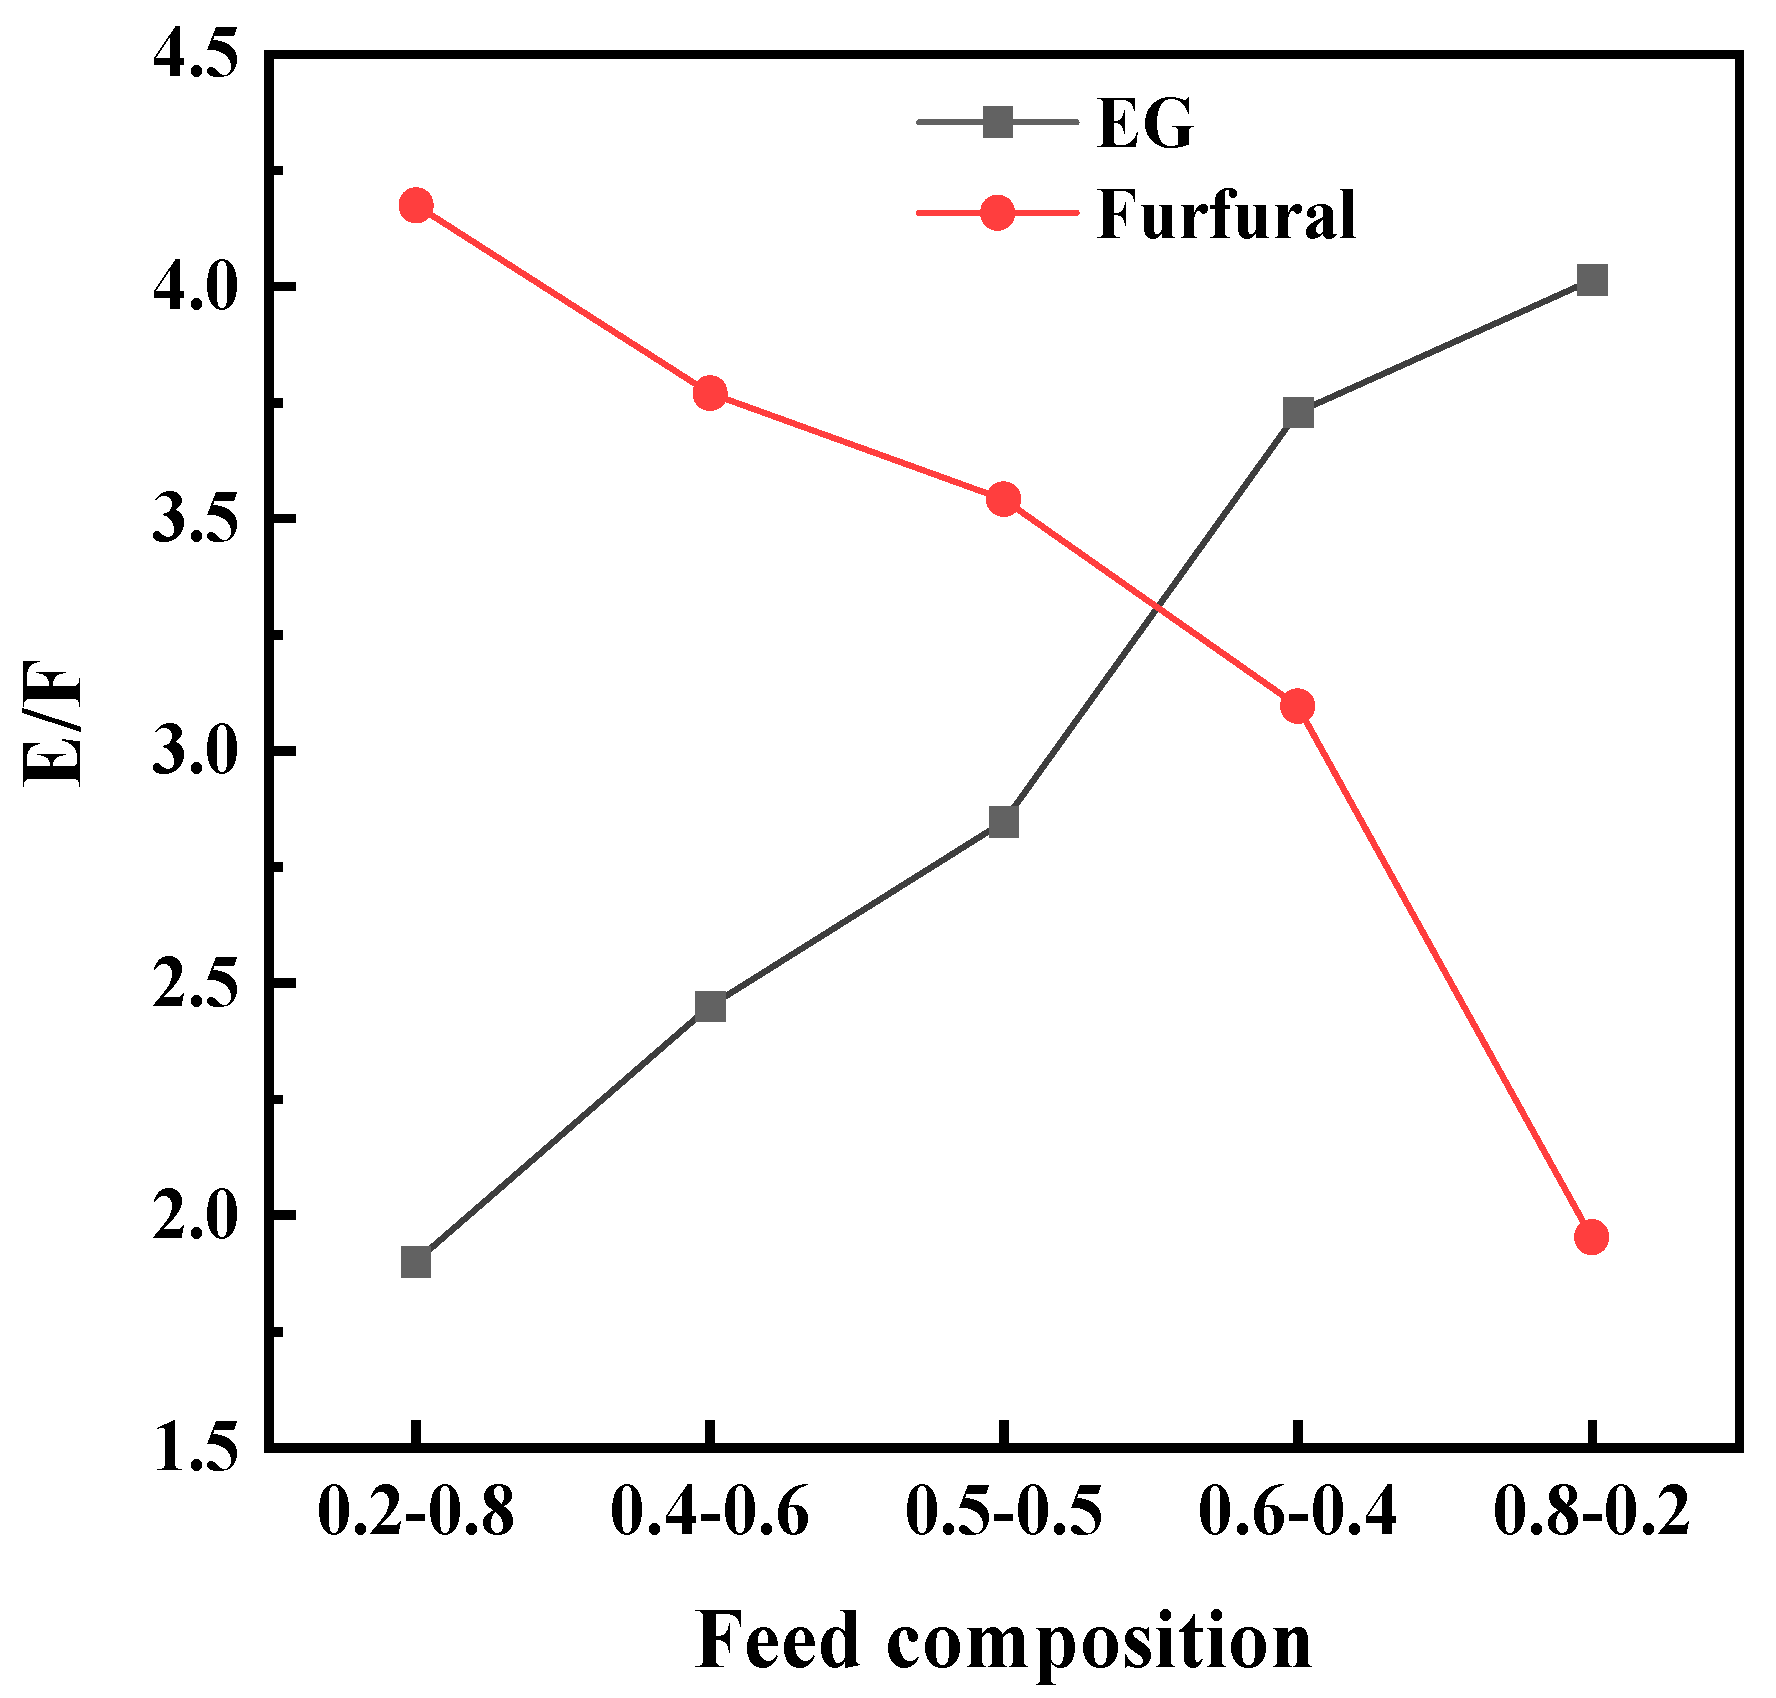
The E/F needed increased with the rise in the content of light key components in the feed composition, as shown in
Figure 6. When EG was the entrainer, ethyl acetate was the key light component; when furfural was the entrainer, ethanol became the key light component. When the light key component content was at 0.2, the E/F for EG and furfural, used as entrainers, were 1.89 and 1.95, respectively. When the light key component content reached 0.8, the E/F for EG and furfural were 4.01 and 4.17. Therefore, one of the reasons for the disparity in energy consumption between the EDC and the ERC, which is due to the changing feed composition, is the varying E/F.
When two different entrainers modify the relative volatility of the azeotropic system at different proportions, one should give preference to the entrainer showing better relative volatility performance under a higher E/F when the light key component content is higher. Conversely, if the light key component content is lower, the choice should prioritize an entrainer showing better relative volatility performance under a lower E/F. Therefore, when selecting entrainers for binary azeotropes, the content of light key components in the feed composition can provide ideas for the selection of E/F during the initial screening of entrainers.
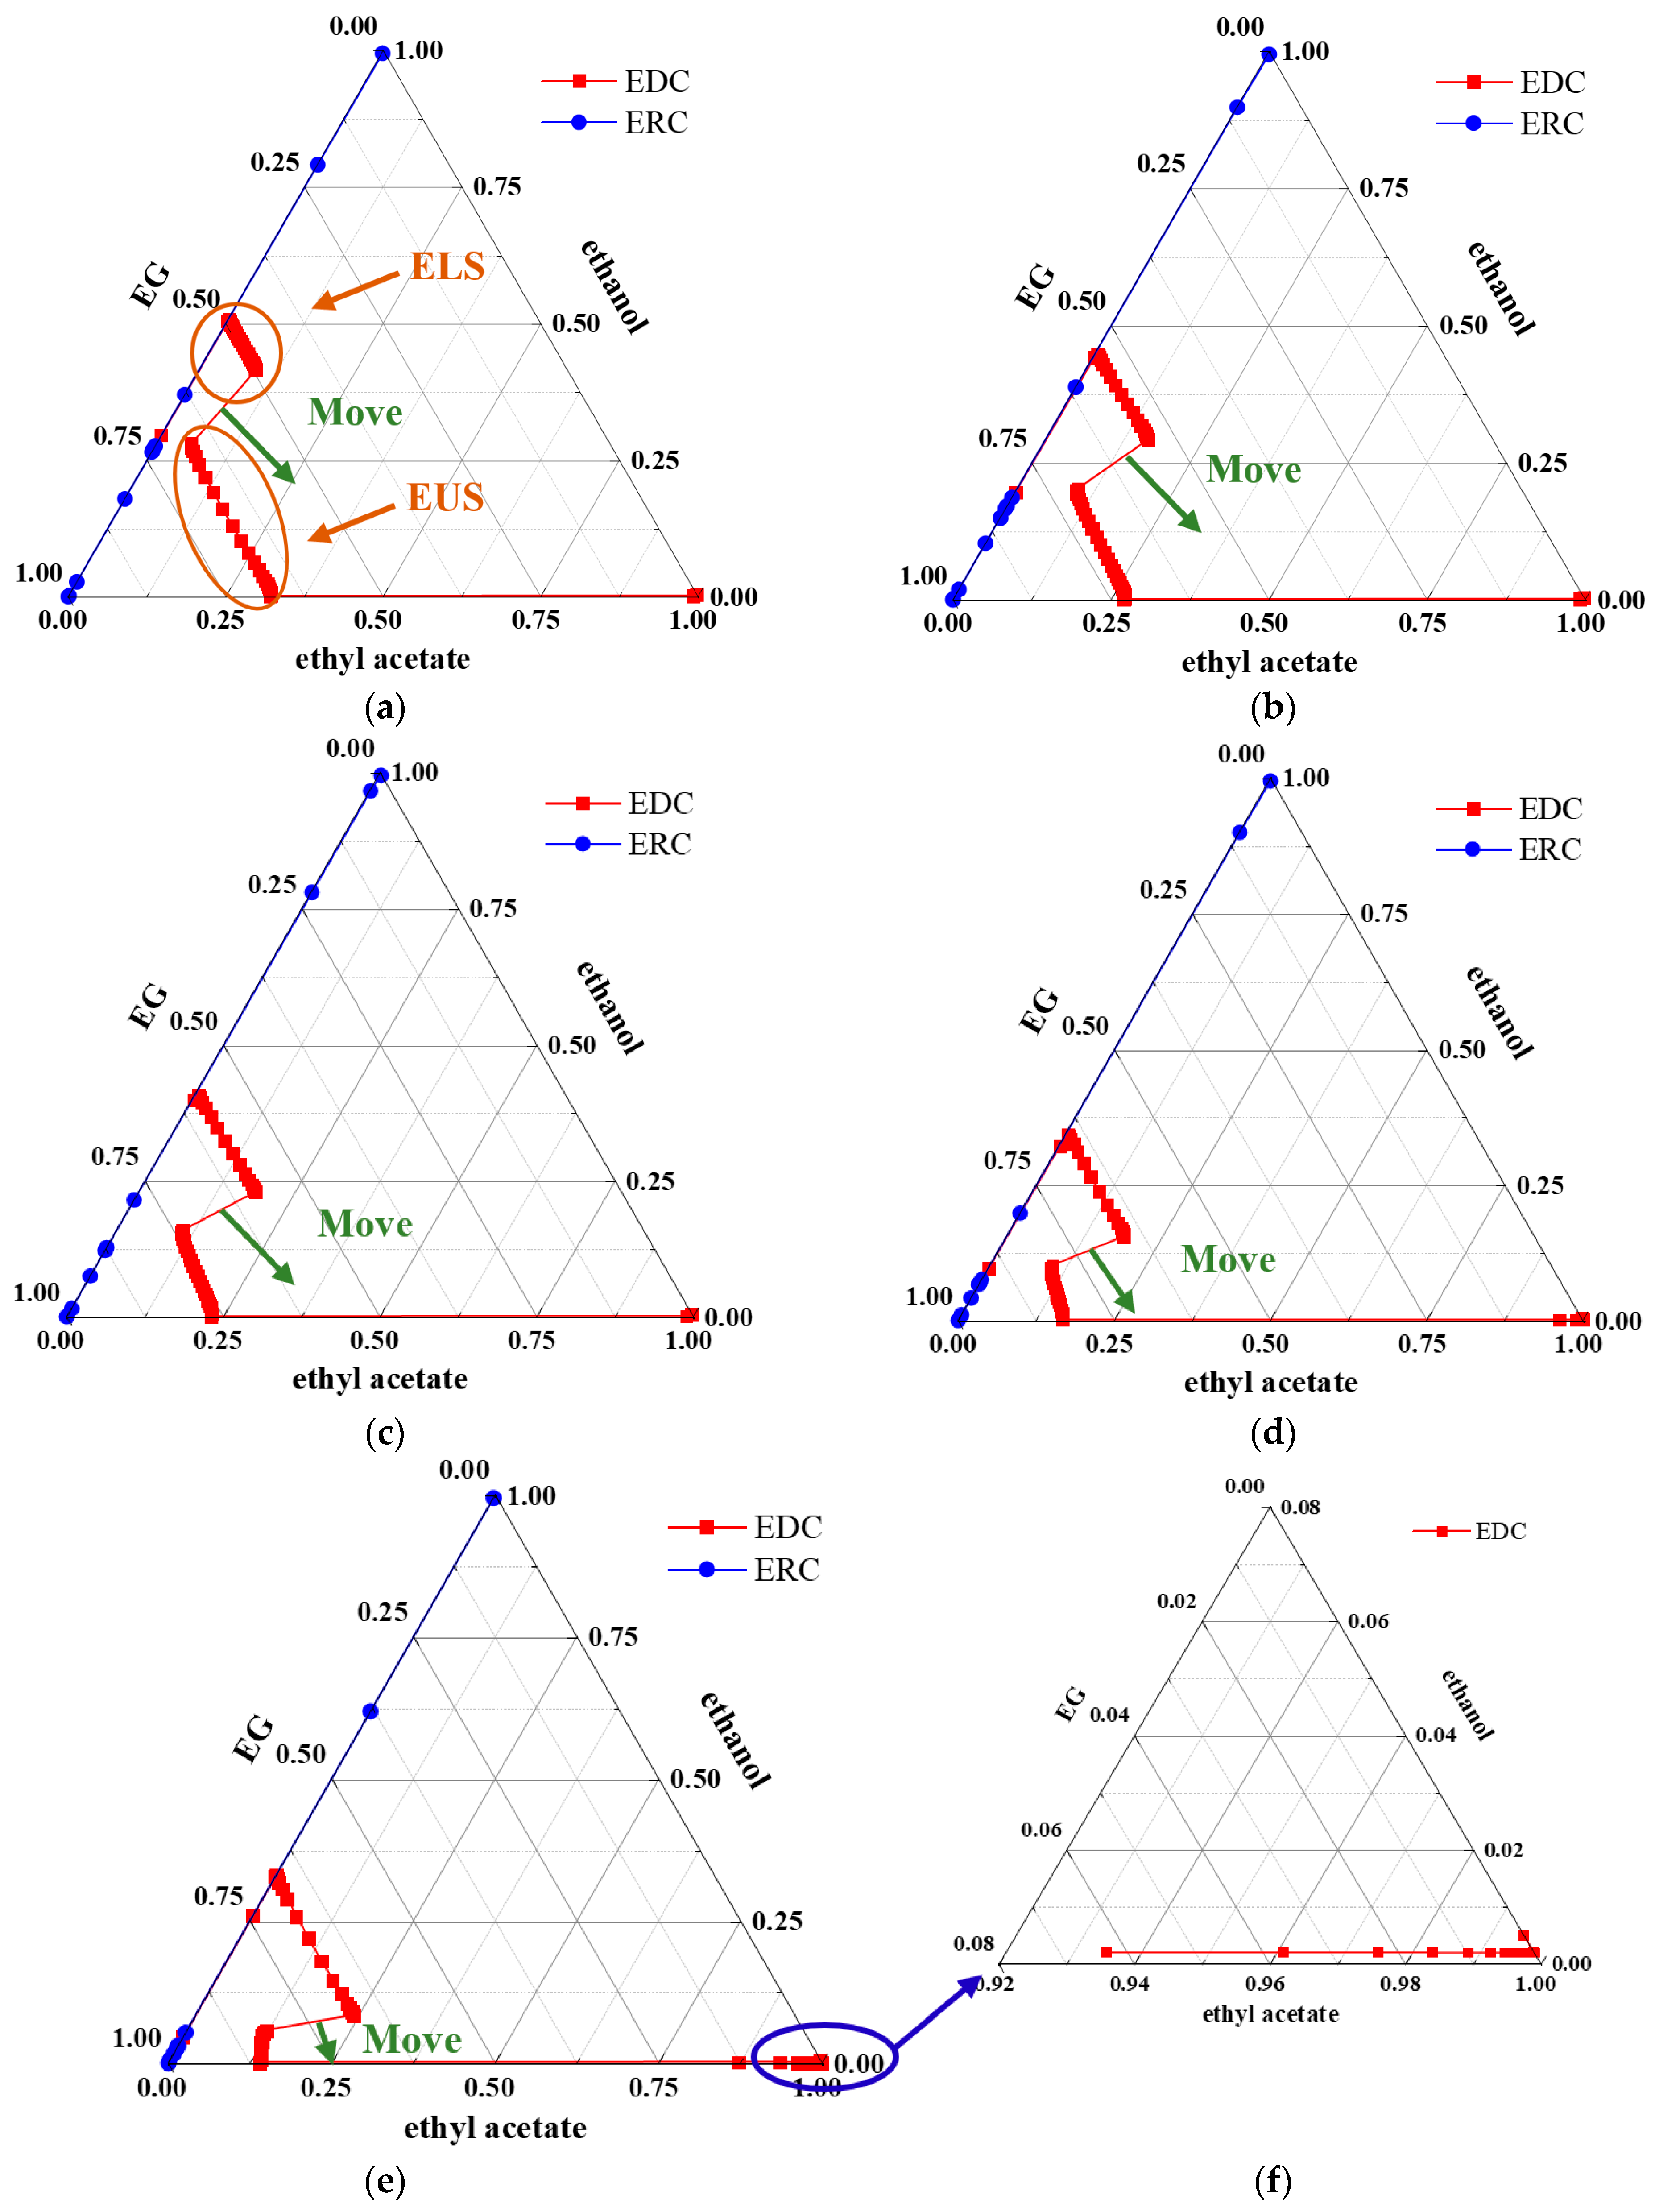
Figure 7 illustrates the composition distribution within the columns during the ED process with EG as the entrainer. The EDC can be divided into the rectification section, extractive section, and stripping section. The primary function of the extractive section of the EDC is to separate ethyl acetate and ethanol. The extractive section is divided into the upper end of the extractive section (EUS) and the lower end of the extractive section (ELS) by the feed position. The feed significantly increases the mass flow rate of components, except for the entrainer in the ELS, thereby resulting in a lower concentration of the entrainer compared to the EUS. The EUS is primarily responsible for separating ethyl acetate and ethanol under high entrainer concentration, while the ELS achieves the removal of ethyl acetate and ethanol under low entrainer concentration. Therefore, ensuring a longer EUS is more economical. However, as the light key component increases, the EUS gradually shortens, and the ELS lengthens, leading to an overall increase in separation difficulty. Using the results for 0.2–0.8 feed composition as an example, the ratios of feed position to total theoretical plate number for the positive and reverse entrainers were 30/59 and 50/67, respectively, which also align with the aforementioned analysis.
The rectification section mainly works to separate the entrainer and light key component ethyl acetate. With an increase in the content of light key components in the feed, the theoretical plate number in the rectification section of the EDC increases. When the light key component content in the feed reached 0.8, the backmixing occurred at the top section of the EDC. This issue arises from the decreasing EG content at the upper end of the column, which causes the relative volatility of ethyl acetate and ethanol to be approximately between 0.4 and 0.5. Consequently, the increasing ethanol content leads to backmixing issues.
The increase in the light key component resulted in an increased entrainer dosage, leading to a decrease in the RR, and the overhead vapor increased. This implies that under the same conditions, the low-temperature steam requirement for the reboiler increases, and the boilup rate also causes an increase in the ID. This is why the load on the EDC demonstrates an upward trend with the increasing content of light key components in the feed.
5. Case Study 2: Acetone–Methanol
From the case study of ethyl acetate–ethanol, it was discovered that introducing specific entrainers is more economically advantageous for removing the feed component with lower content as the light key component. To validate its universality, another common binary system, acetone and methanol, was chosen. The boiling points of acetone and methanol are 329.28 K and 337.85 K, respectively. Acetone and methanol have an azeotropic point [azeotropic temperature = 328.39 K and azeotropic composition is acetone/methanol = 0.7777:0.2223 (mole fraction) at 1 atm].
5.1. Selection of Thermodynamic Model and Entrainer
Water, CB, toluene, and DMF were chosen as effective candidate entrainers [
25,
26,
27,
28,
29]. The NRTL model was employed to predict the vapor–liquid equilibrium behavior of the acetone–methanol–entrainer systems [
30]. The binary interaction parameters for the NRTL model used in this process were sourced from the Aspen Plus software, as shown in
Table 7.
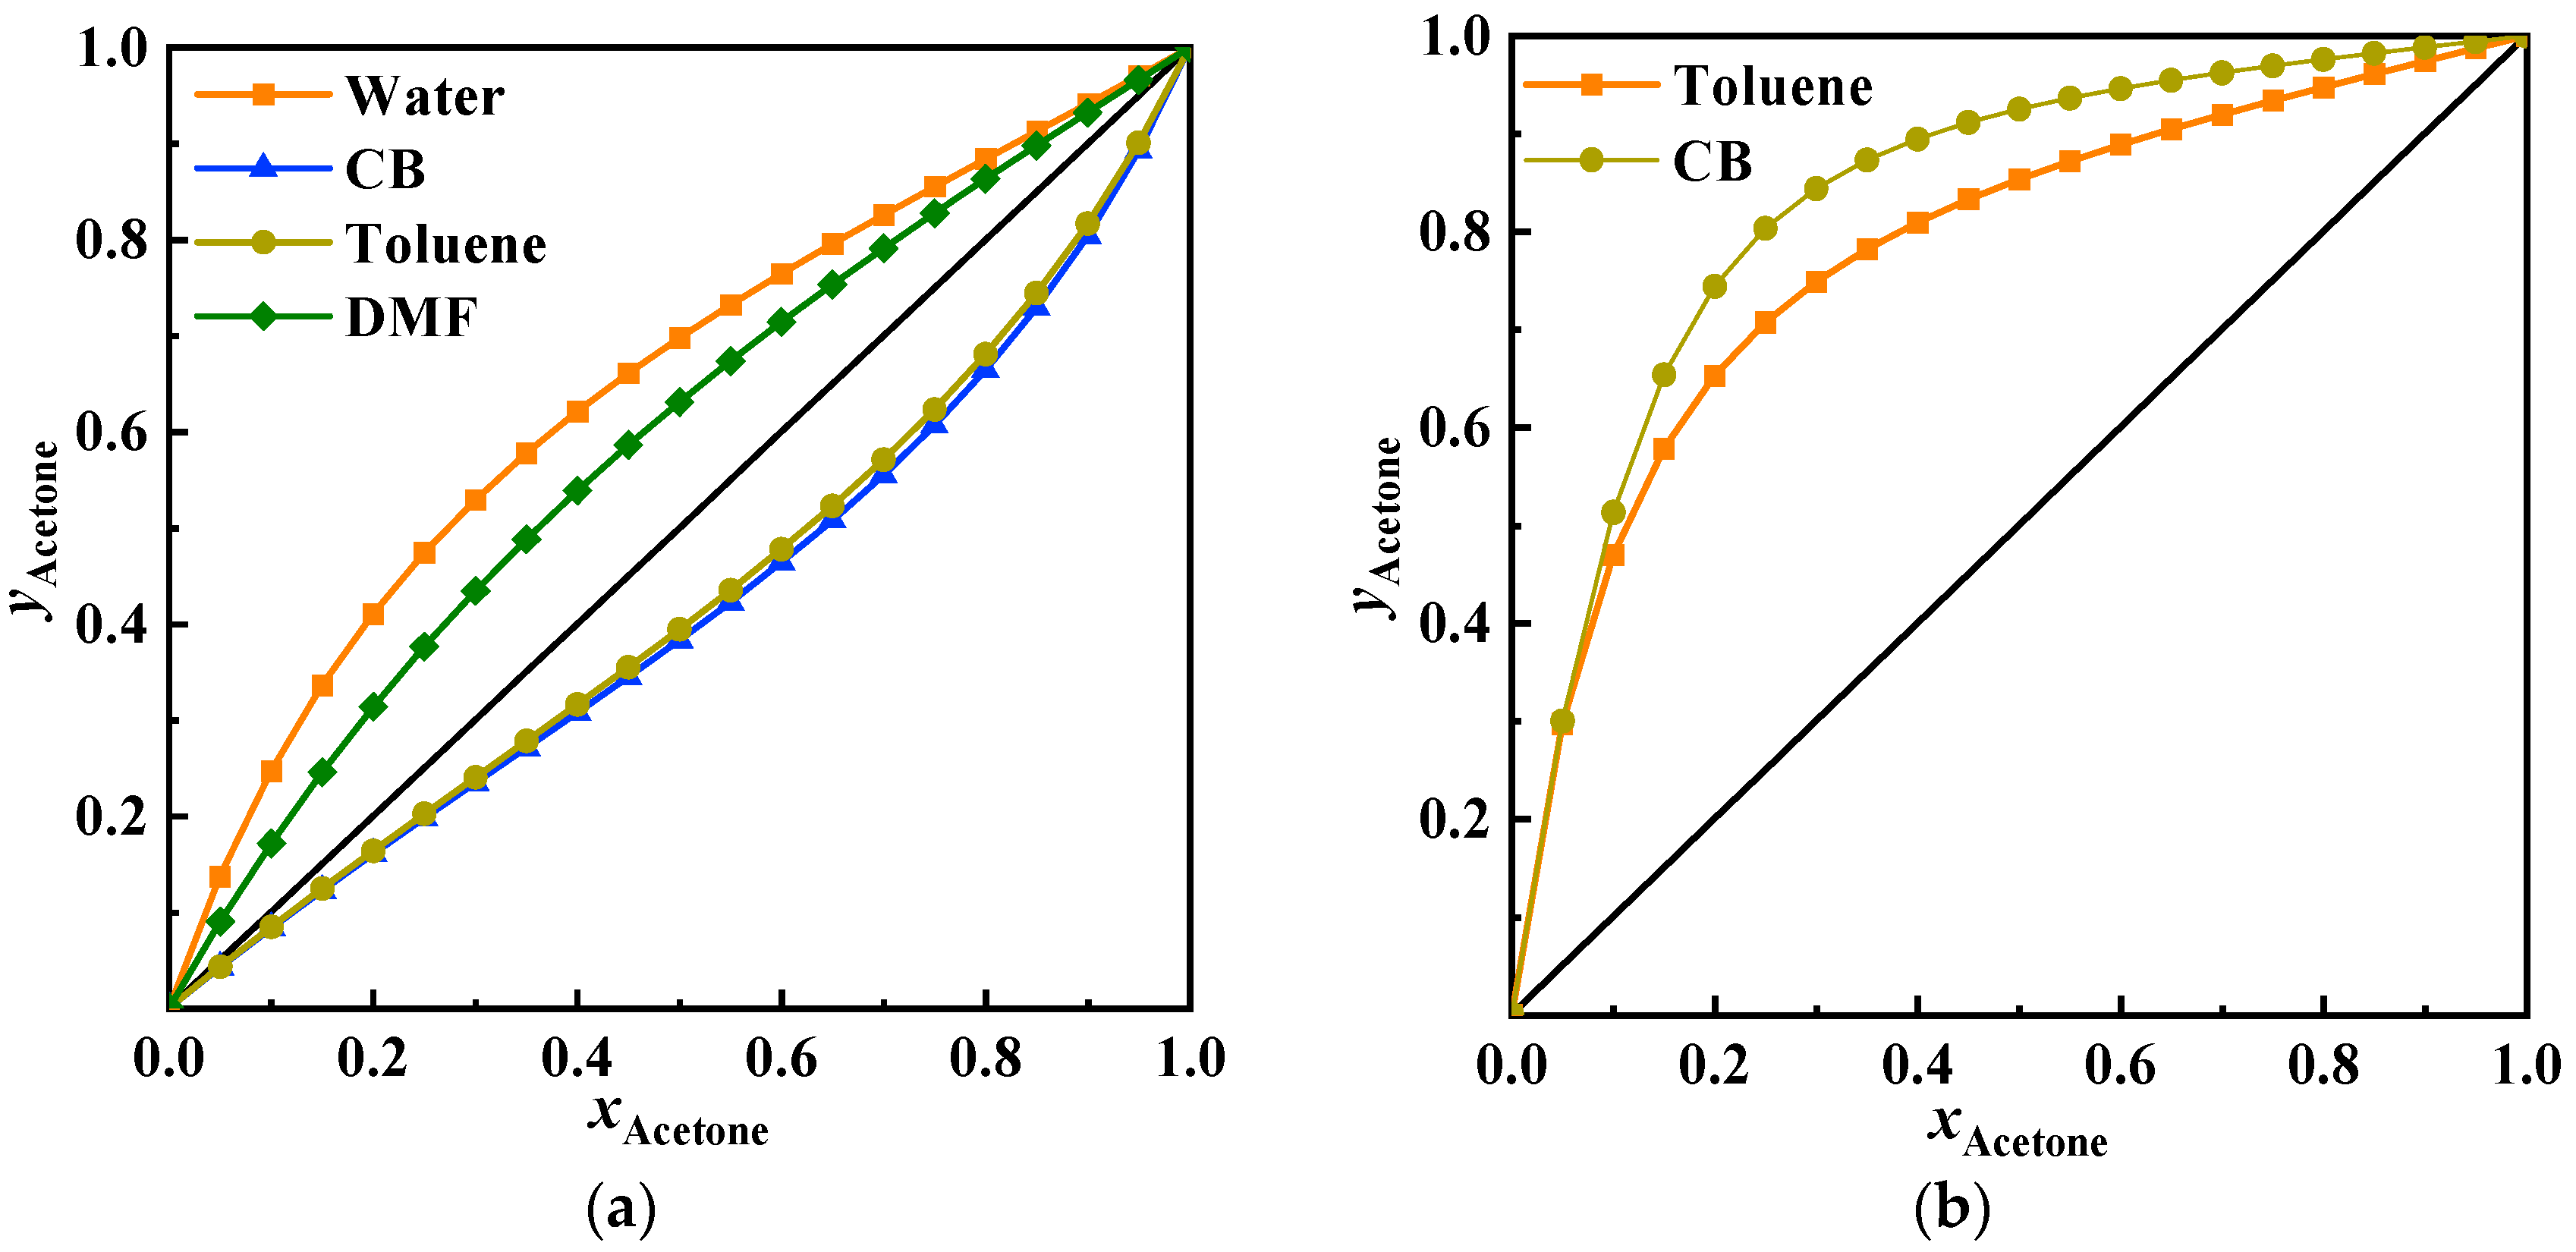
Figure 8a displays the
x-
y diagrams for acetone–methanol under the same E/F. Water and DMF are positive entrainers. Water more effectively alters the relative volatility of acetone–methanol. Toluene and CB are reverse entrainers. CB more effectively alters the relative volatility of acetone–methanol and results in a higher relative volatility between acetone and CB during recovery, as
Figure 8b shows. Therefore, water and CB were selected as the positive and reverse entrainers, respectively, to separate the acetone and methanol. This study explored the ED process with five different feed compositions, similar to the ethyl acetate and ethanol case.
5.2. Optimization Results
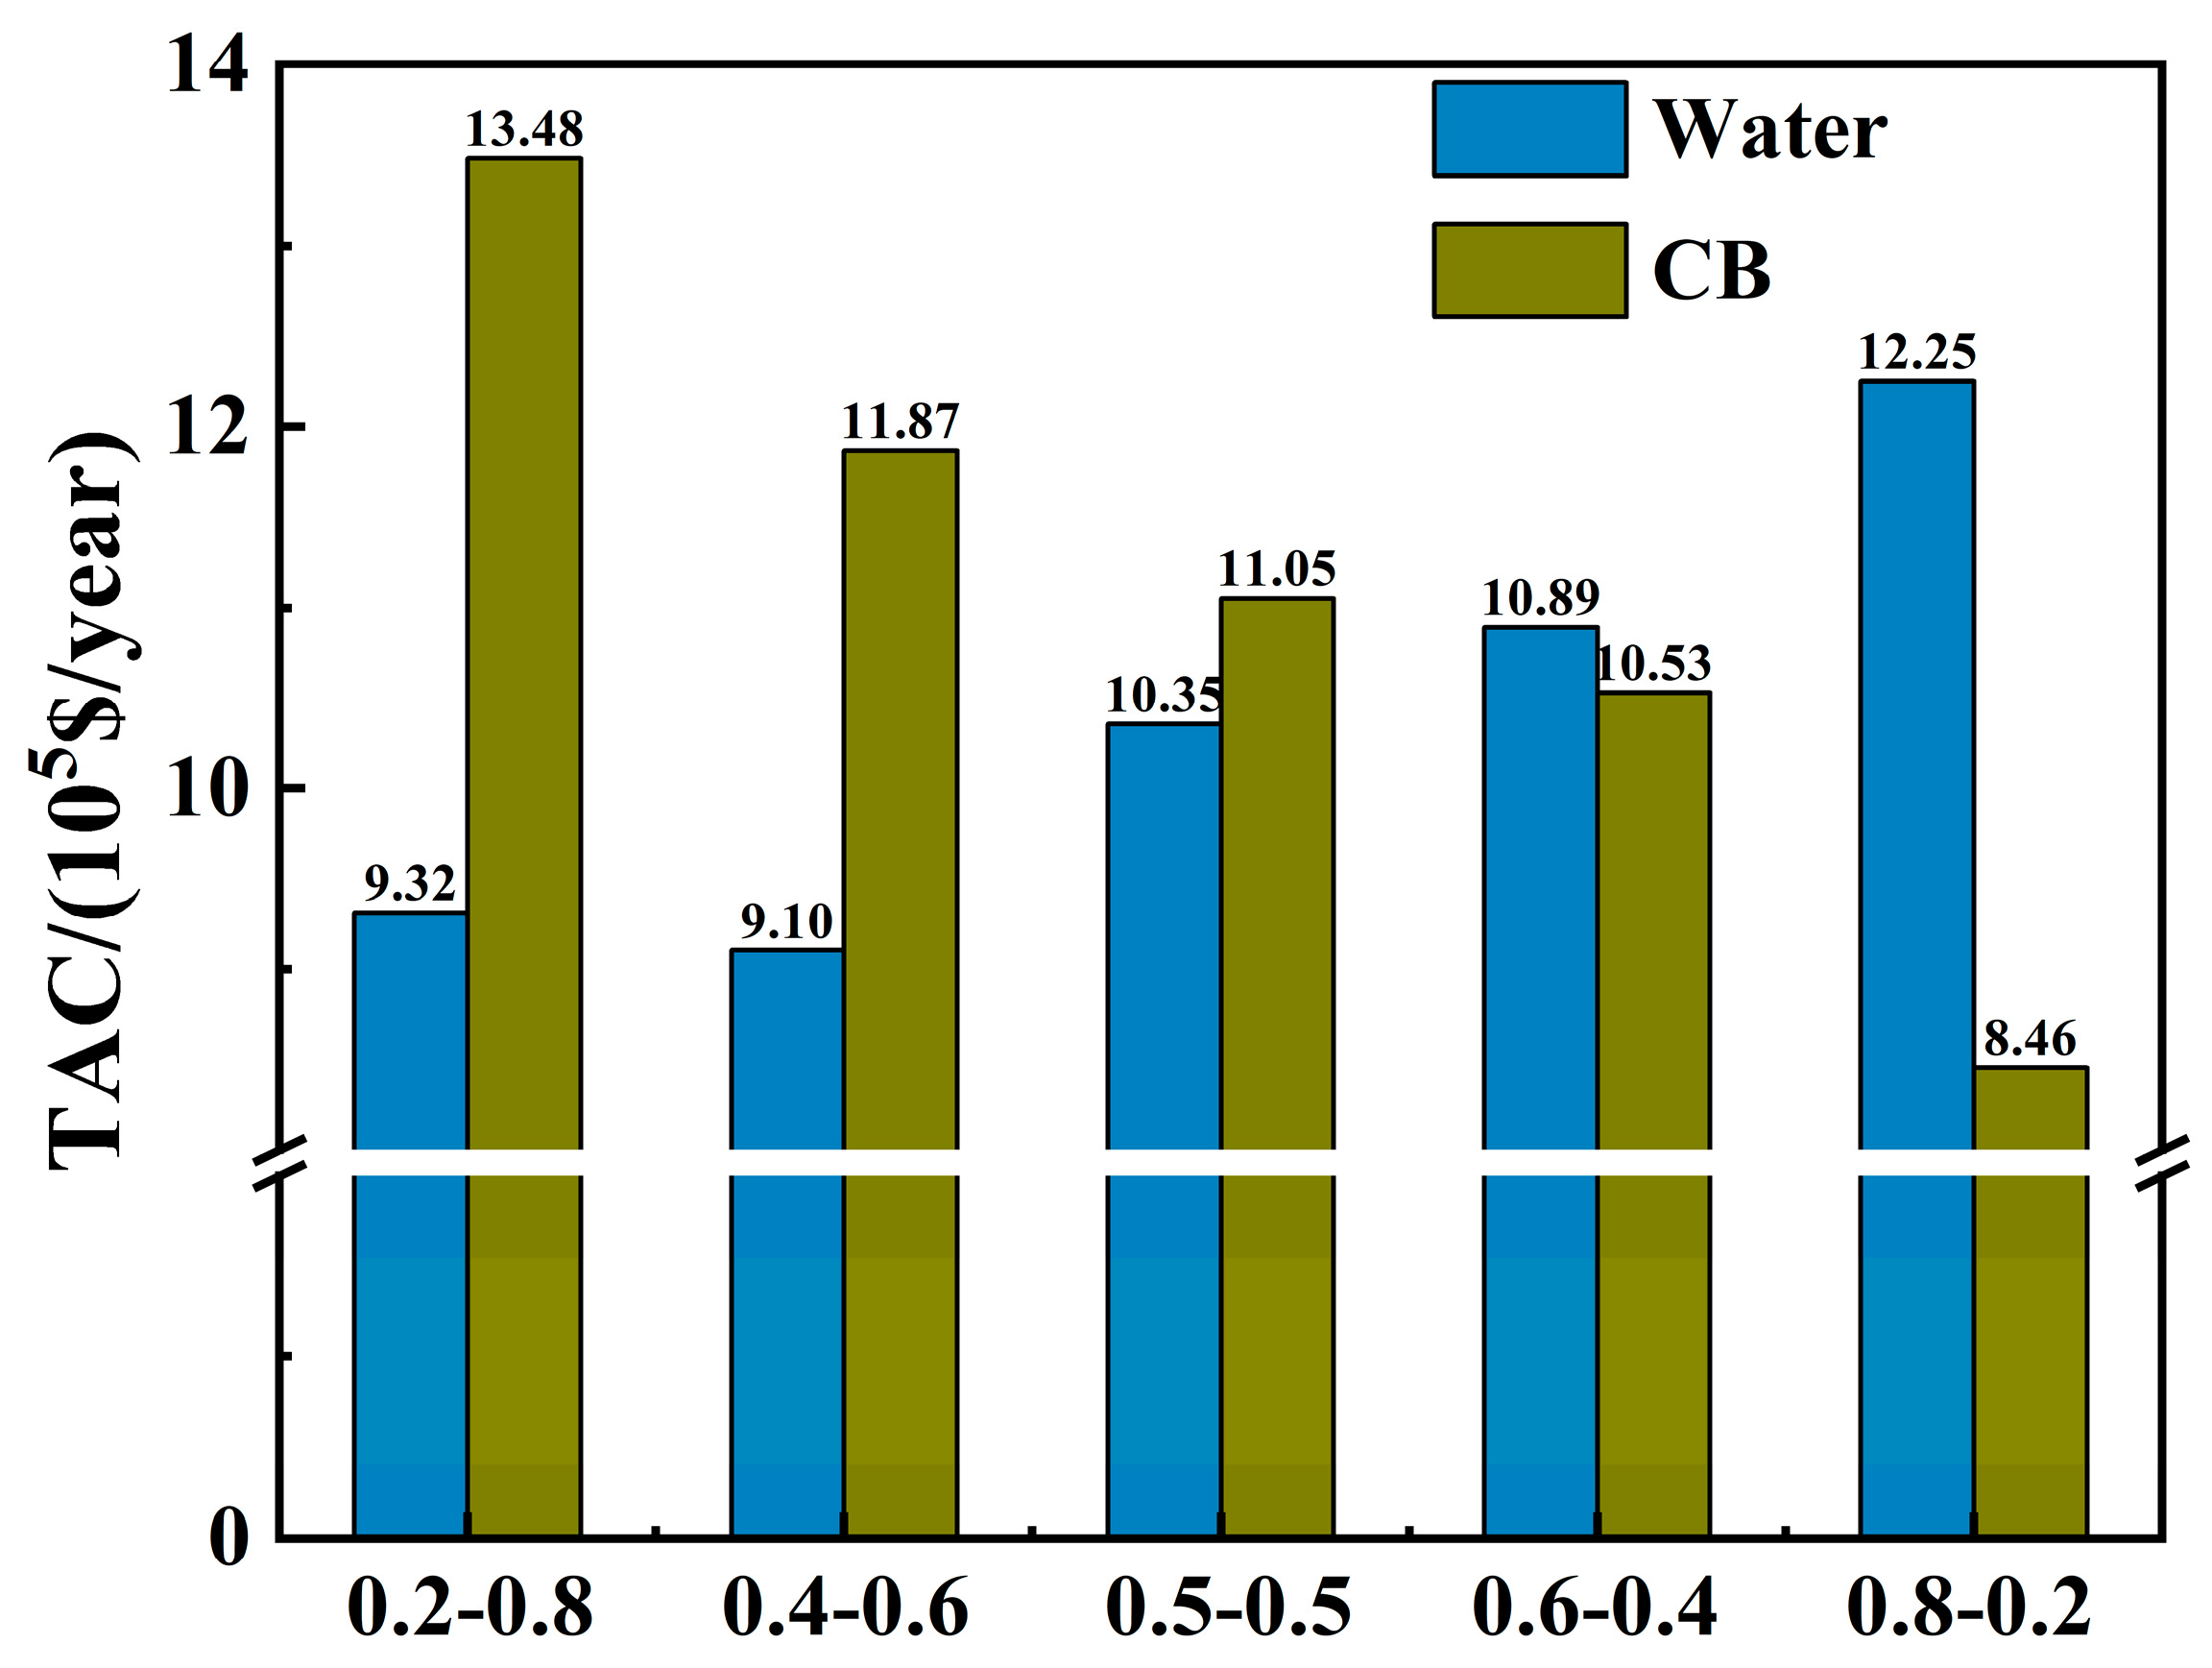
Figure 9 presents the TAC values for the optimal distillation schemes of water and CB as entrainers under different feed compositions. It is evident that, similarly to Case Study 1, first separating the low-content component in the feed as the light key component can reduce the TAC.
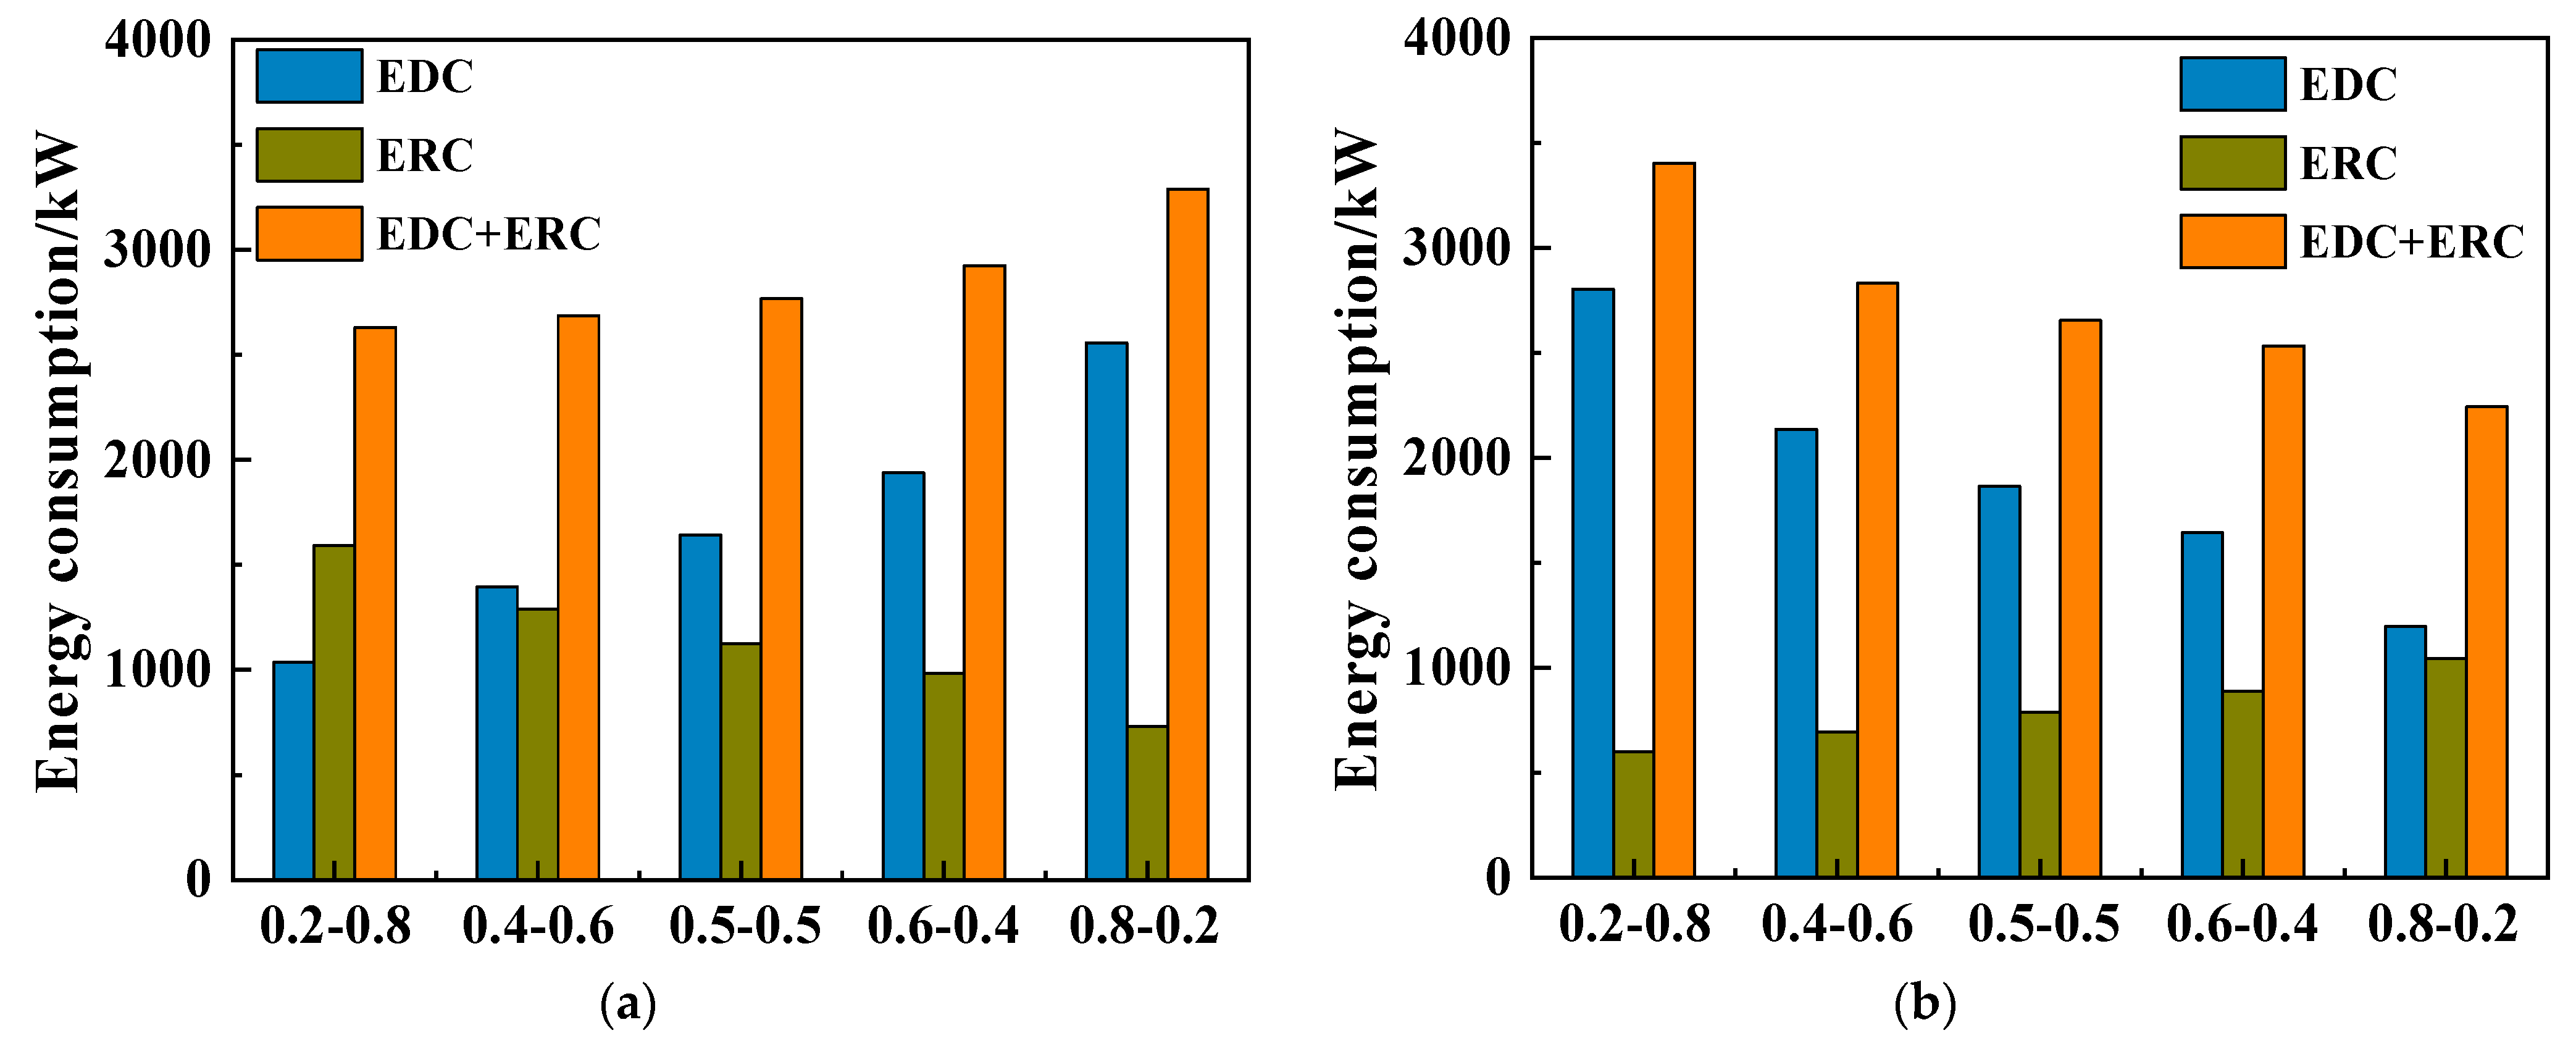
Figure 10 illustrates the energy consumption of each distillation column and the total energy consumption separating acetone and methanol using CB and water as entrainers under different feed compositions. With water as the entrainer, the EDC energy consumption gradually rose as the light key component acetone content increased, while the ERC energy consumption decreased, causing an upward trend in the total energy consumption. When the feed composition of acetone and methanol was 0.2–0.8, prioritizing the removal of acetone showed energy consumption rates for the EDC and the ERC that were very close. As the acetone content increased in the feed composition, the energy consumption difference between the EDC and the ERC could reach a maximum of 1822.90 kW.
5.3. Analysis of Column Composition
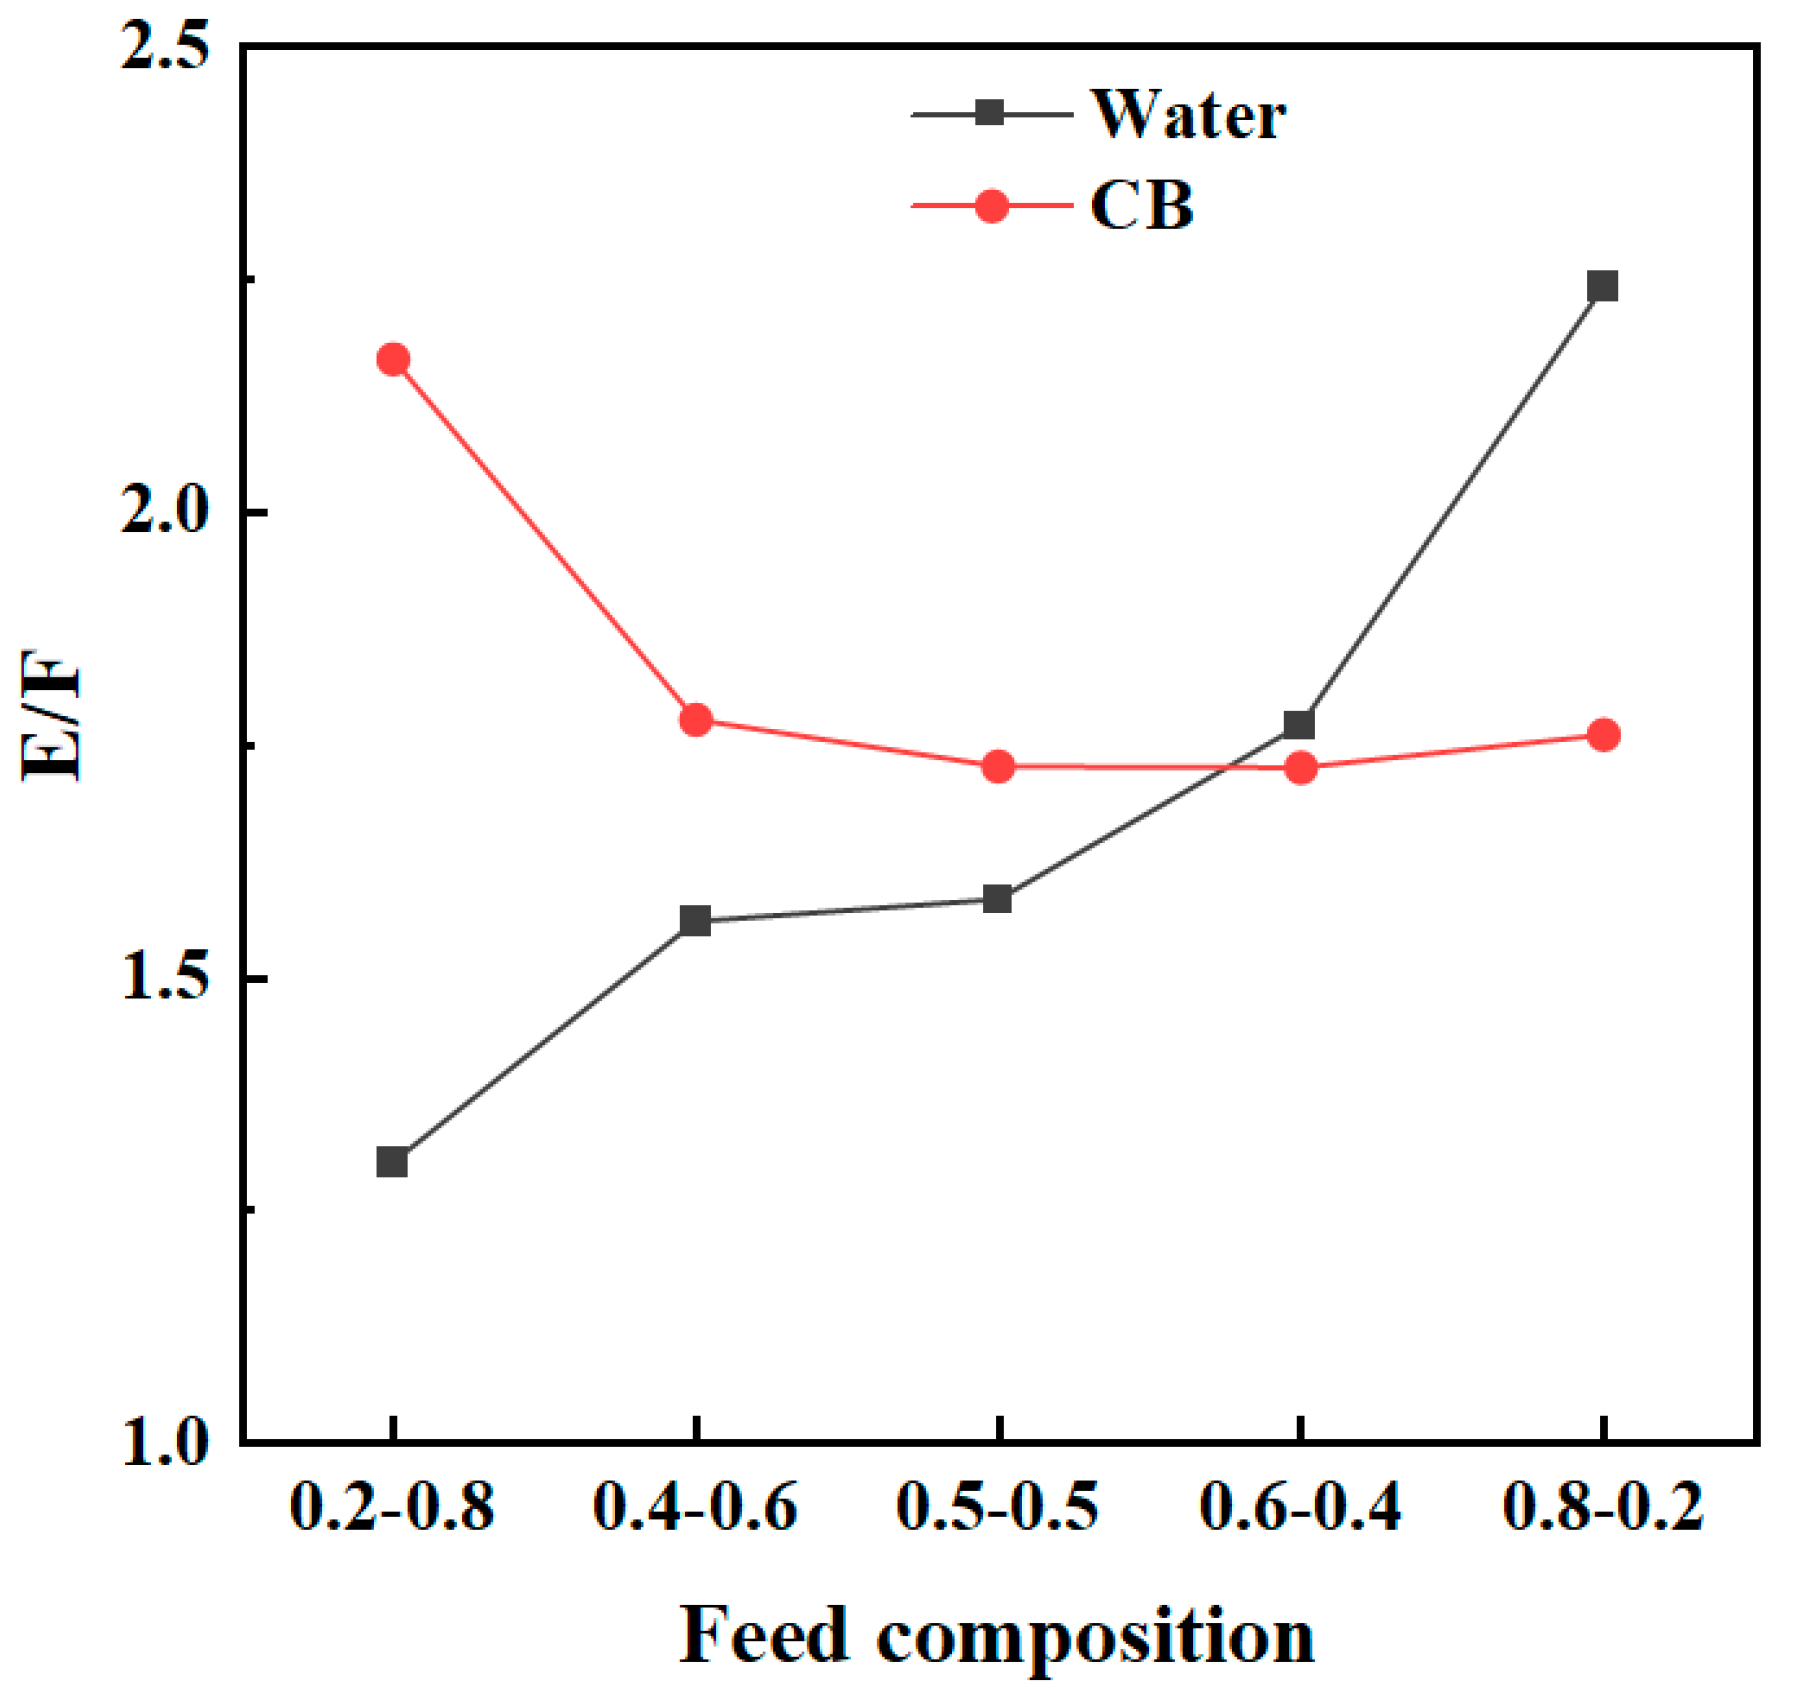
When the light key component content was 0.2, the E/F for CB and water as entrainers were 1.76 and 1.3, respectively; when the light key component content was 0.8, the E/F for CB and water as entrainers were 2.16 and 2.24, respectively, as shown in
Figure 11. As the light key component content increased, the E/F also increased. Therefore, it is advisable to preferentially remove the component present in lower quantities in the feed, a conclusion similar to that drawn in Case Study 1. Similarly, the difference in the ID of the EDC and the ERC decreases with the decrease in the light key component content. When the ability of the two entrainers to alter the relative volatility of the azeotropic system varies with E/F, if the content of the light key component is higher than the heavy, the entrainer that performs better at higher E/F should be selected. Conversely, the entrainer should be prioritized for changes in relative volatility under lower E/F for lower light key component contents. Therefore, the entrainer selection for binary azeotropes should consider the light key component content in the feed.
Shen et al.’s research [
24] indicates that the introduction of an entrainer significantly enhances the separation efficiency when the relative volatility’s value is between 2 and 4. However, when the relative volatility surpasses 4, the augmented mass of entrainer escalates the duty of the column, mandating an enlargement of the distillation column’s ID and operational costs. In our case studies (ethyl acetate–ethanol and acetone–toluene), the optimal solvent ratio resulted in an average relative volatility close to the range of 2 to 4.
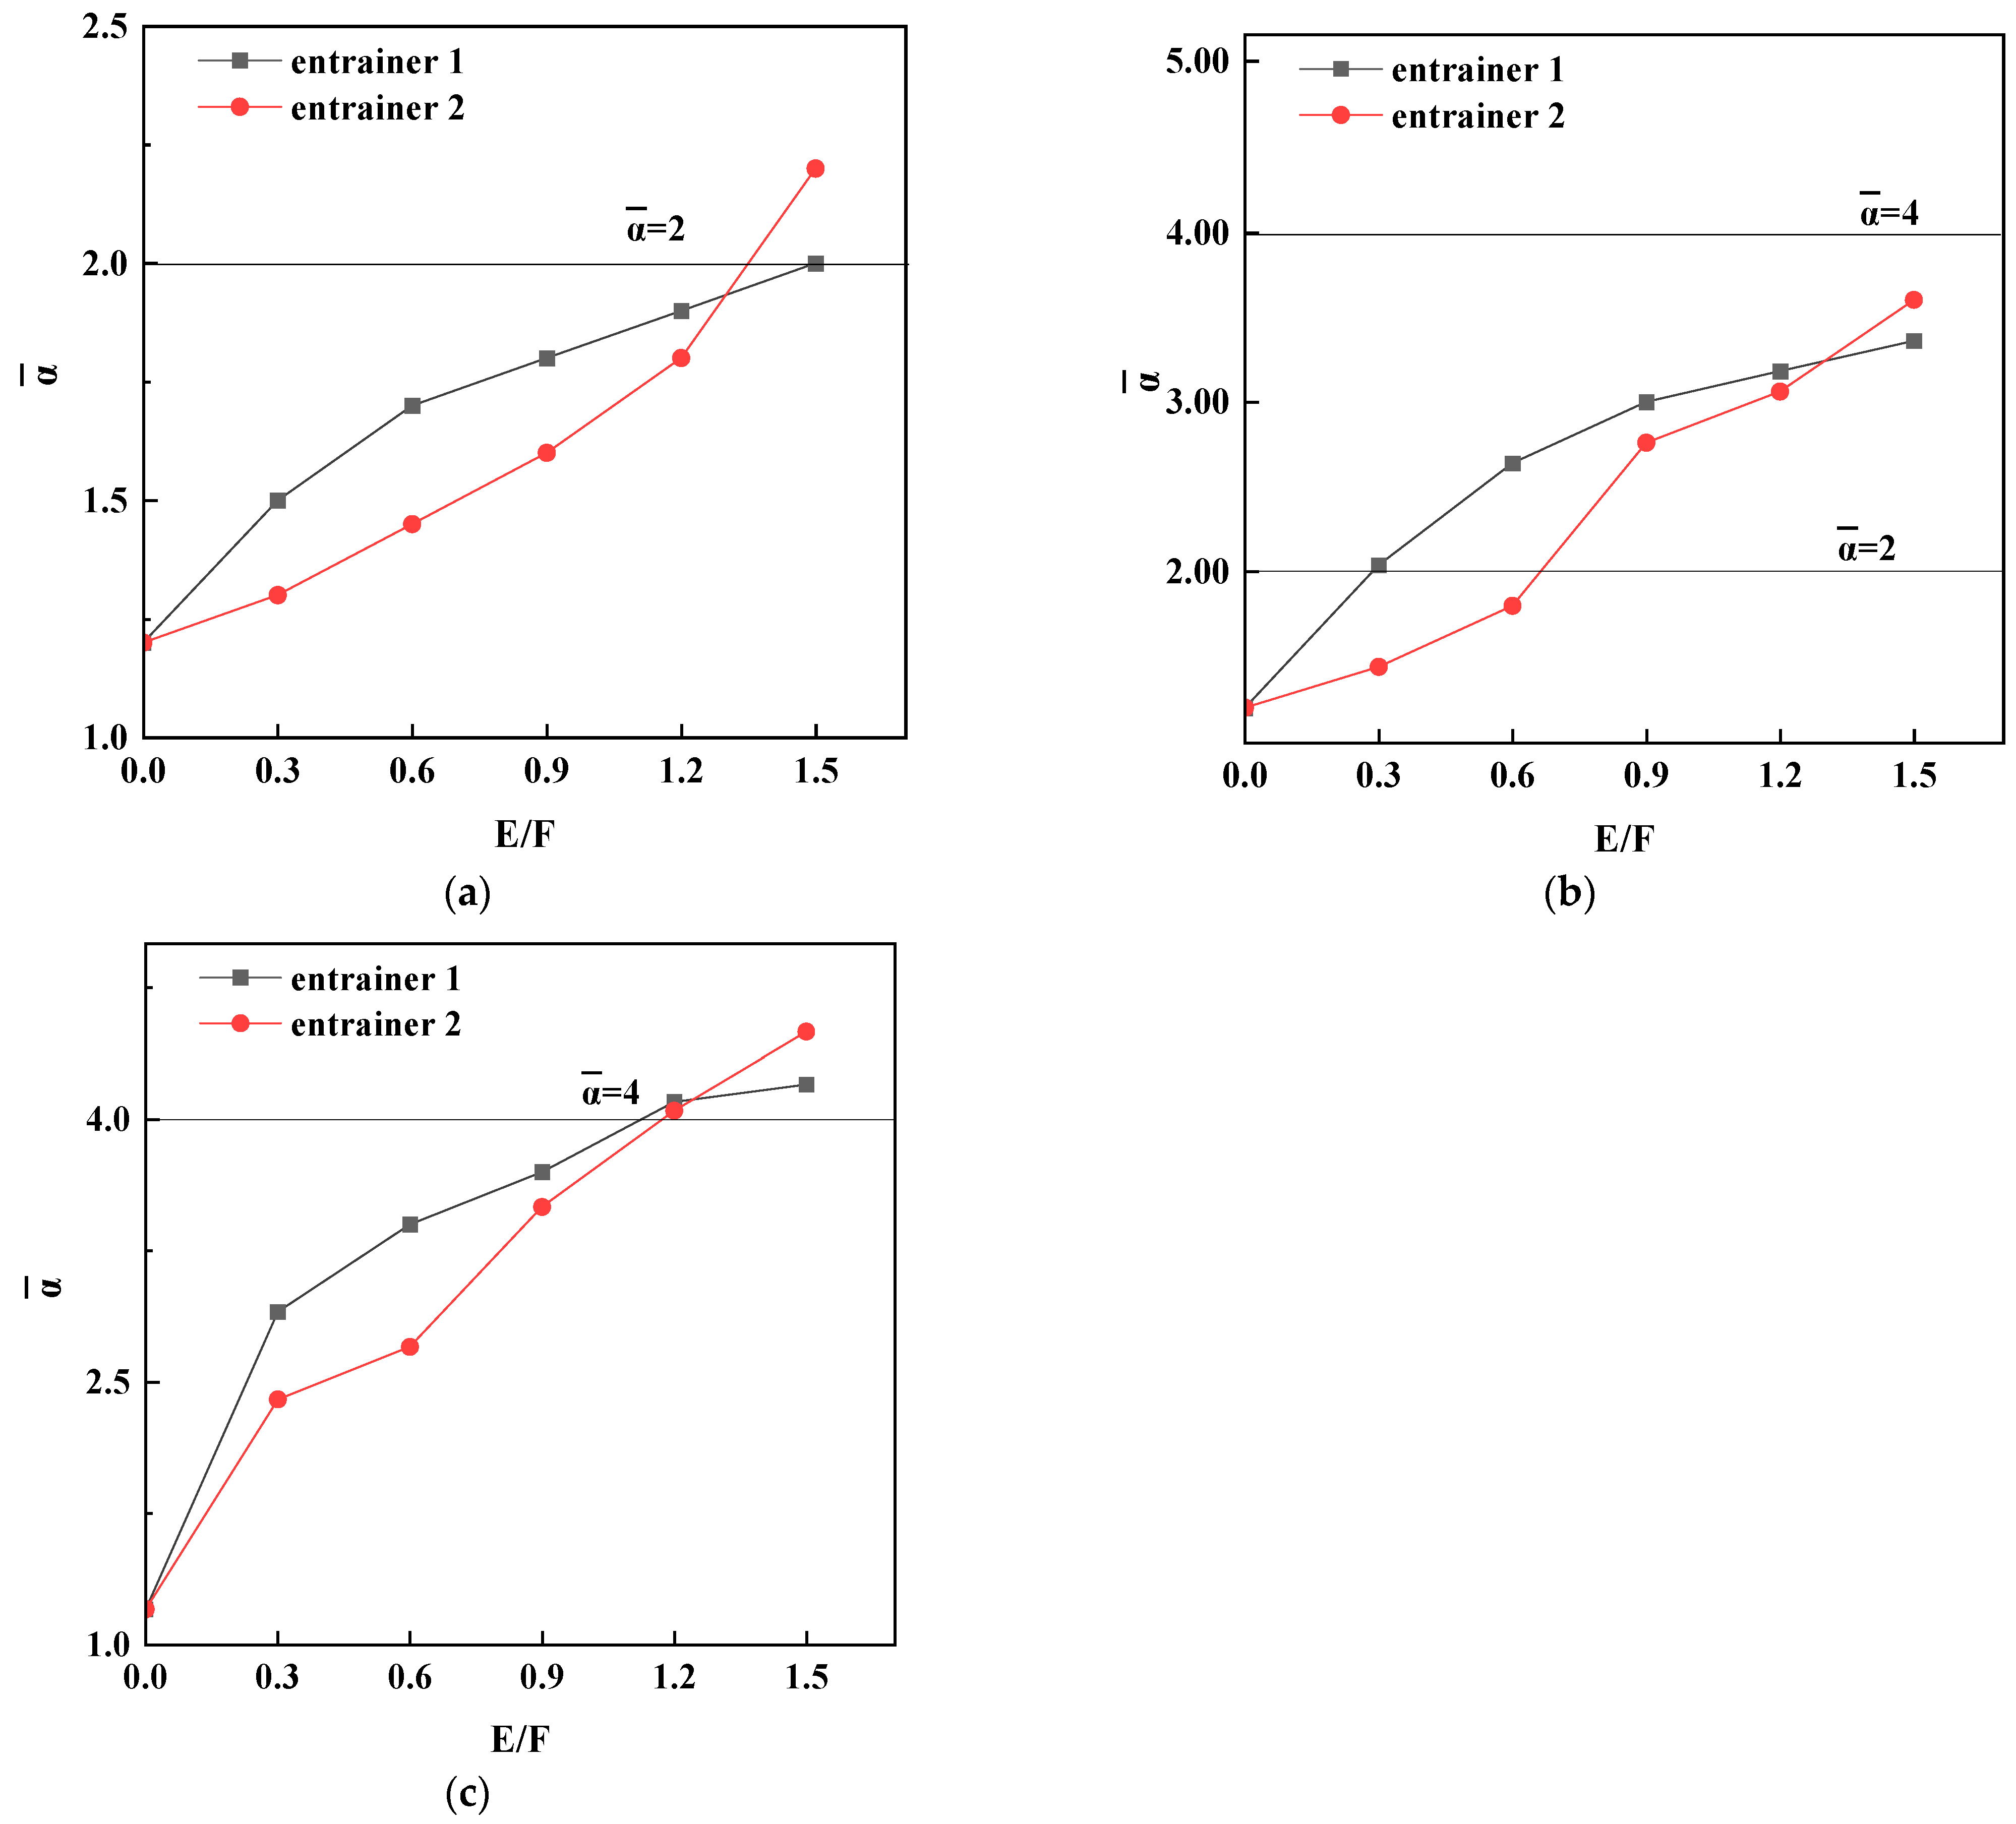
Building upon Shen et al.’s conclusion and our case analysis, we propose a strategy for selecting the entrainer, depicted in
Figure 12a–c. Entrainer 1 demonstrates a stronger capability to alter relative volatility at lower E/F, whereas entrainer 2 is more effective at higher E/F. The strategy is as follows: when the average relative volatility is equivalent and the corresponding value of average relative volatility is less than 2, entrainer 2 should be selected, as shown in
Figure 12a; conversely, if the equivalent value exceeds 4, entrainer 1 should be selected, as in
Figure 12c; if the equivalent value lies between 2 and 4, further optimization calculations are required to make the selection, as illustrated in
Figure 12b.
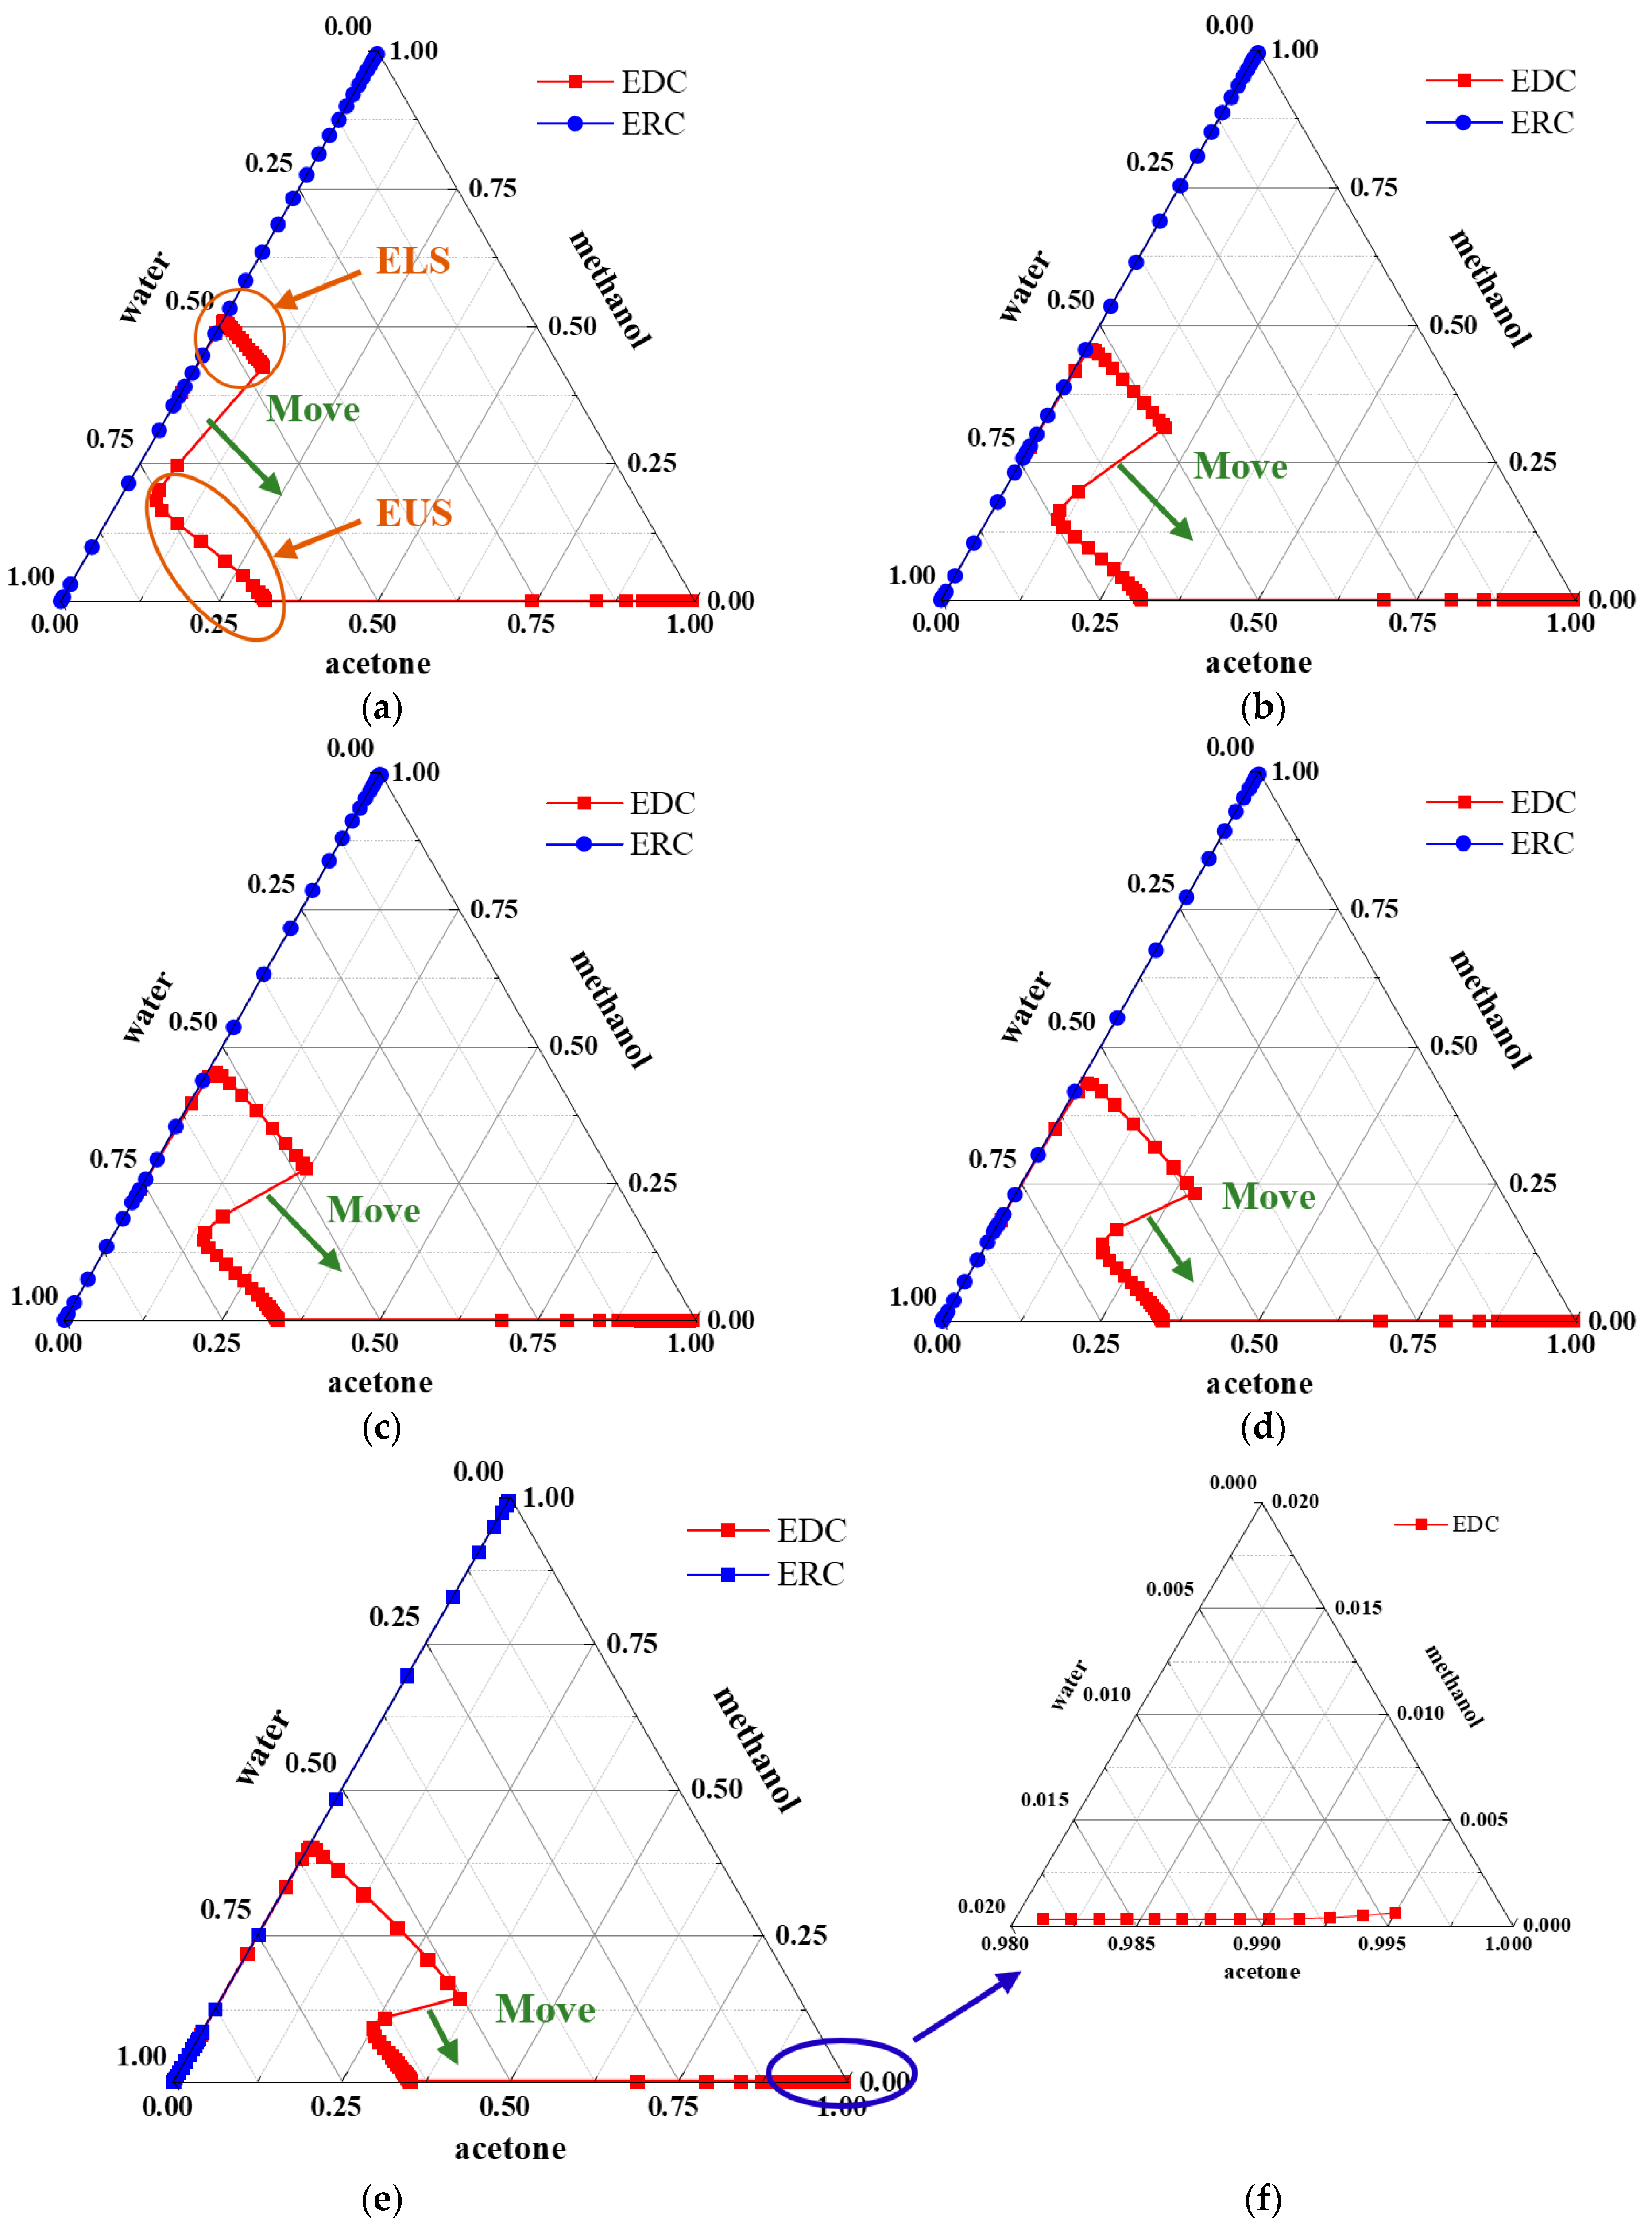
With water as the entrainer, the compositions of the EDC and the ERC were plotted as ternary diagrams, as shown in
Figure 13. Similar to the results of separating ethyl acetate and ethanol systems using EG as the entrainer, as the content of the light key component acetone increased in the feed, the light key component content increased on the theoretical plates dividing the EUS and ELS. Simultaneously, the change in heavy key component content that EUS occupies increased, while the change in the range of heavy key components that ELS occupies decreased. When the reverse entrainer was CB, the same phenomenon was observed.
6. Conclusions
This work conducted case studies on the extractive distillation separation of ethyl acetate–ethanol and acetone–methanol under various feed compositions. It was demonstrated that the type of entrainer (positive or reverse) should be regulated to achieve preferential separation of the lower-content component in the feed. Take the feed composition of 0.2–0.8 as an example: the case study of ethyl acetate–ethanol demonstrated that, compared to prioritizing the separation of ethanol with furfural as the entrainer, employing EG to preferentially separate ethyl acetate reduced the TAC and energy consumption by 36.09% and 24.14%, respectively; in the case study of acetone–methanol, using water as the entrainer to preferentially separate acetone resulted in reductions in the TAC and energy consumption by 30.86% and 22.72%, respectively, compared to using CB to prioritize the separation of methanol.
Furthermore, it is noteworthy that the optimal vapor and liquid loads may vary significantly with the feed composition. For instance, as the acetone content in the feed increased from 0.2 to 0.8, the optimized ID of the extractive distillation column expanded from 0.79 m to 1.27 m. Consequently, for actual production (the ID of columns is fixed), if the feed source is not fixed and the feed composition changes significantly, there is a high demand for operational flexibility of columns. This necessitates the use of plates with superior performance in terms of weeping and entrainment compared to the sieve plates employed in this work.
The optimization results revealed that with an increase in the content of the light key component, the E/F correspondingly ascends. Additionally, it was discovered that when the feed contains a lower concentration of the light key component, it is advisable to prioritize selecting an entrainer that is more effective at altering the relative volatility of the azeotropic mixture at lower E/F.
It is worth noting that the subjects of this study were all minimum azeotropic mixtures, and further investigation is needed to determine the applicability for maximum azeotropic mixtures.
Supplementary Materials
The following supporting information can be downloaded at:
https://www.mdpi.com/article/10.3390/pr12040764/s1, Figure S1: Optimization results of extractive distillation schemes using EG as the entrainer with stream information for separating ethyl acetate–ethanol, and the feed composition is (a) 0.2–0.8, (b) 0.4–0.6, (c) 0.5–0.5, (d) 0.6–0.4, and (e) 0.8–0.2. Figure S2: Optimization results of extractive distillation schemes using furfural as the entrainer with stream information for separating ethyl acetate–ethanol, and the feed composition is (a) 0.2–0.8, (b) 0.4–0.6, (c) 0.5–0.5, (d) 0.6–0.4, and (e) 0.8–0.2. Figure S3: Optimization results of extractive distillation schemes using water as the entrainer with stream information for separating acetone–methanol, and the feed composition is (a) 0.2–0.8, (b) 0.4–0.6, (c) 0.5–0.5, (d) 0.6–0.4, and (e) 0.8–0.2. Figure S4: Optimization results of extractive distillation schemes using CB as the entrainer with stream information for separating acetone–methanol, and the feed composition is (a) 0.2–0.8, (b) 0.4–0.6, (c) 0.5–0.5, (d) 0.6–0.4, and (e) 0.8–0.2. Figure S5: Composition distribution within the column of extractive distillation schemes using furfural as the entrainer for separating ethyl acetate–ethanol, and the feed composition is (a) 0.2–0.8, (b) 0.4–0.6, (c) 0.5–0.5, (d) 0.6–0.4, and (e) 0.8–0.2. Figure S6: Composition distribution within the column of extractive distillation schemes using CB as the entrainer for separating acetone–methanol, and the feed composition is (a) 0.2–0.8, (b) 0.4–0.6, (c) 0.5–0.5, (d) 0.6–0.4, and (e) 0.8–0.2. Table S1: The formulas and parameters used for economic optimization. Table S2: Results of correlation with three thermodynamic models for separating ethyl acetate–ethanol. Table S3: Energy consumption of extractive distillation process under different feed compositions for separating ethyl acetate–ethanol: (a) EG and (b) 2-furfural. Table S4: Energy consumption of extractive distillation process under different feed compositions for separating acetone–methanol: (a) water and (b) CB.
Author Contributions
Conceptualization, N.H.; methodology, N.H. and Q.W.; software, N.H. and Q.W.; validation, S.Z. and Y.P.; formal analysis, N.H. and Q.W.; investigation, Q.W. and N.H.; resources, Q.L.; data curation, N.H.; writing—original draft preparation, Q.L., Q.W., N.H., and Z.Y.; writing—review and editing, Q.L., Q.W., N.H., and Z.Y.; visualization, S.Z., Y.P., and N.H.; supervision, Q.L., N.H., and Z.Y.; project administration, Q.L.; funding acquisition, Q.L. All authors have read and agreed to the published version of the manuscript.
Funding
National Key Research and Development Program of China (2022YFC2106300).
Data Availability Statement
The raw data supporting the conclusions of this article will be made available by the authors on request.
Conflicts of Interest
The authors declare no conflicts of interest.
References
- Frolkova, A.; Frolkova, A.; Gaganov, I. Extractive and Auto-Extractive Distillation of Azeotropic Mixtures. Chem. Eng. Technol. 2021, 44, 1397–1402. [Google Scholar] [CrossRef]
- Cignitti, S.; Rodriguez-Donis, I.; Abildskov, J.; You, X.; Shcherbakova, N.; Gerbaud, V. CAMD for entrainer screening of extractive distillation process based on new thermodynamic criteria. Chem. Eng. Trans. 2018, 69, 223–228. [Google Scholar] [CrossRef]
- Dong, Y.; Yang, Q.; Li, Z.; Lei, Z. Extractive distillation of the benzene and acetonitrile mixture using an ionic liquid as the entrainer. Green Energy Environ. 2021, 6, 444–451. [Google Scholar] [CrossRef]
- Gerbaud, V.; Rodriguez-Donis, I.; Hegely, L.; Lang, P.; Denes, F.; You, X. Review of extractive distillation. Process design, operation, optimization and control. Chem. Eng. Res. Des. 2019, 141, 229–271. [Google Scholar] [CrossRef]
- Shi, X.; Zhao, X.; Zhang, Z.; Li, M.; Gao, J. Energy-saving quaternary extractive distillation processes with single- or double-dividing-wall column for separation of acetone/methanol/butanone/tert-butyl alcohol. Chem. Eng. Process.-Process Intensif. 2020, 153, 107999. [Google Scholar] [CrossRef]
- Cheng, H.; Wang, Y.; Wang, W.; Wen, C.; Wei, X.; Wang, Y.; Wang, Y.; Cui, P.; Zhu, Z. Economic, environmental, exergy (3E) analysis and multi-objective genetic algorithm optimization of efficient and energy-saving separation of diethoxymethane/toluene/ethanol by extractive distillation with mixed extractants. Energy 2023, 284, 129262. [Google Scholar] [CrossRef]
- Kossack, S.; Kraemer, K.; Gani, R.; Marquardt, W. A systematic synthesis framework for extractive distillation processes. Chem. Eng. Res. Des. 2008, 86, 781–792. [Google Scholar] [CrossRef]
- An, Y.; Li, W.; Li, Y.; Huang, S.; Ma, J.; Shen, C.; Xu, C. Design/optimization of energy-saving extractive distillation process by combining preconcentration column and extractive distillation column. Chem. Eng. Sci. 2015, 135, 166–178. [Google Scholar] [CrossRef]
- Franke, M.B. MINLP optimization of a heterogeneous azeotropic distillation process: Separation of ethanol and water with cyclohexane as an entrainer. Comput. Chem. Eng. 2016, 89, 204–221. [Google Scholar] [CrossRef]
- Lee, H.; Seo, C.; Lee, M.; Lee, J.W. Synthesis of heat-integrated pressure-swing azeotropic distillation using a graphical pinch analysis. AIChE J. 2022, 68, e17476. [Google Scholar] [CrossRef]
- Malik, H.; Khan, H.W.; Hassan Shah, M.U.; Ahmad, M.I.; Khan, I.; Al-Kahtani, A.A.; Sillanpää, M. Screening of ionic liquids as green entrainers for ethanol water separation by extractive distillation: COSMO-RS prediction and aspen plus simulation. Chemosphere 2023, 311, 136901. [Google Scholar] [CrossRef] [PubMed]
- Aniya, V.; De, D.; Satyavathi, B. Comprehensive Approach toward Dehydration of tert-Butyl Alcohol by Extractive Distillation: Entrainer Selection, Thermodynamic Modeling and Process Optimization. Ind. Eng. Chem. Res. 2016, 55, 6982–6995. [Google Scholar] [CrossRef]
- Iqbal, A.; Ahmad, S.A.; Ojasvi. Entrainer based economical design and plantwide control study for Tetrahydrofuran/Water separation process. Chem. Eng. Res. Des. 2018, 130, 274–283. [Google Scholar] [CrossRef]
- Zhang, X.; Li, X.; Li, G.; Zhu, Z.; Wang, Y.; Xu, D. Determination of an optimum entrainer for extractive distillation based on an isovolatility curve at different pressures. Sep. Purif. Technol. 2018, 201, 79–95. [Google Scholar] [CrossRef]
- Hu, N.; Wu, Q.; Yue, H.; Ren, Z.; Gu, J.; Zhao, H.; Li, Q. Enhanced heat-integrated distillation processes: Simultaneous synthesis via structural modification utilizing the matrix method. J. Clean. Prod. 2023, 428, 139491. [Google Scholar] [CrossRef]
- Hu, N.; Zhang, Y.; Hu, X.; Gu, J.; Xue, J.; Li, Q. Efficient Single-Column Extractive Distillation Process Achieved through Vapor–Liquid Separation of Feed. Ind. Eng. Chem. Res. 2023, 62, 19833–19844. [Google Scholar] [CrossRef]
- Miao, G.; Zhuo, K.; Li, G.; Xiao, J. An advanced optimization strategy for enhancing the performance of a hybrid pressure-swing distillation process in effective binary-azeotrope separation. Sep. Purif. Technol. 2022, 282, 120130. [Google Scholar] [CrossRef]
- Shi, Y.; Eberhart, R.C. Parameter Selection in Particle Swarm Optimization; Springer: Berlin/Heidelberg, Germany, 1998; pp. 591–600. [Google Scholar]
- Grisales Díaz, V.H.; Willis, M.J. Ethyl acetate production from dilute bioethanol with low energy intensity. J. Clean. Prod. 2022, 376, 134137. [Google Scholar] [CrossRef]
- Zhu, Z.; Yu, M.; Zhang, W.; Liu, Y.; Cui, P.; Yang, J.; Wang, Y.; Gao, J. Exploration of the effects of pressure on the controllability of extractive distillation for separating pressure-sensitive azeotropes. Sep. Purif. Technol. 2019, 227, 115681. [Google Scholar] [CrossRef]
- Varyemez, H.S.; Kaymak, D.B. Effect of operating pressure on design of extractive distillation process separating DMC-MeOH azeotropic mixture. Chem. Eng. Res. Des. 2022, 177, 108–116. [Google Scholar] [CrossRef]
- Duan, C.; Li, C. Novel energy-saving methods to improve the three-column extractive distillation process for separating ethyl acetate and ethanol using furfural. Sep. Purif. Technol. 2021, 272, 118887. [Google Scholar] [CrossRef]
- Cruz Valdez, J.A.; Patiño-Herrera, R.; Avilés Martínez, A.; Pérez, E. Separation of the cyclohexane-benzene mixture by the extractive distillation process using ethylene glycol as a solvent. Chem. Eng. Process.-Process Intensif. 2024, 196, 109686. [Google Scholar] [CrossRef]
- Shen, W.; Dong, L.; Wei, S.A.; Li, J.; Benyounes, H.; You, X.; Gerbaud, V. Systematic design of an extractive distillation for maximum-boiling azeotropes with heavy entrainers. AIChE J. 2015, 61, 3898–3910. [Google Scholar] [CrossRef]
- Gil, I.D.; Botía, D.C.; Ortiz, P.; Sánchez, O.F. Extractive Distillation of Acetone/Methanol Mixture Using Water as Entrainer. Ind. Eng. Chem. Res. 2009, 48, 4858–4865. [Google Scholar] [CrossRef]
- You, X.; Rodriguez-Donis, I.; Gerbaud, V. Investigation of Separation Efficiency Indicator for the Optimization of the Acetone–Methanol Extractive Distillation with Water. Ind. Eng. Chem. Res. 2015, 54, 10863–10875. [Google Scholar] [CrossRef]
- Wang, C.; Wang, C.; Guang, C.; Zhang, Z. Comparison of extractive distillation separation sequences for acetonitrile/methanol/benzene multi-azeotropic mixtures. J. Chem. Technol. Biotechnol. 2018, 93, 3302–3316. [Google Scholar] [CrossRef]
- Zhao, L.; Lyu, X.; Wang, W.; Shan, J.; Qiu, T. Comparison of heterogeneous azeotropic distillation and extractive distillation methods for ternary azeotrope ethanol/toluene/water separation. Comput. Chem. Eng. 2017, 100, 27–37. [Google Scholar] [CrossRef]
- Wang, Q.; Yu, B.; Xu, C. Design and Control of Distillation System for Methylal/Methanol Separation. Part 1: Extractive Distillation Using DMF as an Entrainer. Ind. Eng. Chem. Res. 2012, 51, 1281–1292. [Google Scholar] [CrossRef]
- You, X.; Rodriguez-Donis, I.; Gerbaud, V. Reducing process cost and CO2 emissions for extractive distillation by double-effect heat integration and mechanical heat pump. Appl. Energy 2016, 166, 128–140. [Google Scholar] [CrossRef]
Figure 1.
Process optimization framework.
Figure 1.
Process optimization framework.
Figure 2.
The conceptual diagrams of ED with different entrainers: (a) positive entrainer; (b) reverse entrainer.
Figure 2.
The conceptual diagrams of ED with different entrainers: (a) positive entrainer; (b) reverse entrainer.
Figure 3.
x-y (mole fraction in the liquid and vapor phases under vapor–liquid equilibrium state, respectively) diagram of ethyl acetate–ethanol system with different entrainers.
Figure 3.
x-y (mole fraction in the liquid and vapor phases under vapor–liquid equilibrium state, respectively) diagram of ethyl acetate–ethanol system with different entrainers.
Figure 4.
Optimization results of ED under different feed compositions.
Figure 4.
Optimization results of ED under different feed compositions.
Figure 5.
Energy consumption of ED process under different feed compositions: (a) EG; (b) furfural.
Figure 5.
Energy consumption of ED process under different feed compositions: (a) EG; (b) furfural.
Figure 6.
Relationship between feed composition and E/F for Case Study 1.
Figure 6.
Relationship between feed composition and E/F for Case Study 1.
Figure 7.
Composition distribution within the column of extractive distillation schemes using EG as the entrainer for separating ethyl acetate–ethanol, with the feed composition being (a) 0.2–0.8; (b) 0.4–0.6; (c) 0.5–0.5; (d) 0.6–0.4; (e) 0.8–0.2; (f) 0.8–0.2 in the range of 0.92–1.
Figure 7.
Composition distribution within the column of extractive distillation schemes using EG as the entrainer for separating ethyl acetate–ethanol, with the feed composition being (a) 0.2–0.8; (b) 0.4–0.6; (c) 0.5–0.5; (d) 0.6–0.4; (e) 0.8–0.2; (f) 0.8–0.2 in the range of 0.92–1.
Figure 8.
(a) x-y diagram of acetone–methanol within entrainers; (b) x-y diagram of acetone–entrainer.
Figure 8.
(a) x-y diagram of acetone–methanol within entrainers; (b) x-y diagram of acetone–entrainer.
Figure 9.
Comparison of TAC under different feed compositions.
Figure 9.
Comparison of TAC under different feed compositions.
Figure 10.
Energy consumption under different feed compositions: (a)water; (b) CB.
Figure 10.
Energy consumption under different feed compositions: (a)water; (b) CB.
Figure 11.
Relationship between feed composition and E/F for Case Study 2.
Figure 11.
Relationship between feed composition and E/F for Case Study 2.
Figure 12.
Changes in average relative volatility (ᾱ) of azeotropes with varying E/F for different entrainer types; categorized by the transition point’s ᾱ value: (a) ᾱ ≤ 2; (b) 2 < ᾱ ≤ 4; (c) 4 < ᾱ.
Figure 12.
Changes in average relative volatility (ᾱ) of azeotropes with varying E/F for different entrainer types; categorized by the transition point’s ᾱ value: (a) ᾱ ≤ 2; (b) 2 < ᾱ ≤ 4; (c) 4 < ᾱ.
Figure 13.
Composition distribution within the column of extractive distillation schemes using water as the entrainer for separating acetone–methanol, with the feed composition being (a) 0.2–0.8; (b) 0.4–0.6; (c) 0.5–0.5; (d) 0.6–0.4; (e) 0.8–0.2; (f) 0.8–0.2 in the range of 0.98–1.
Figure 13.
Composition distribution within the column of extractive distillation schemes using water as the entrainer for separating acetone–methanol, with the feed composition being (a) 0.2–0.8; (b) 0.4–0.6; (c) 0.5–0.5; (d) 0.6–0.4; (e) 0.8–0.2; (f) 0.8–0.2 in the range of 0.98–1.
Table 1.
Optimization parameter range and speed in ED.
Table 1.
Optimization parameter range and speed in ED.
| Entrainer Type | Parameter | Parameter Range | Particle Velocity (v) |
|---|
| Upper Limit | Lower Limit | Upper Limit (vmax) | Lower Limit (−vmax) |
|---|
| | E (kmol/h) | 500 | 20 | 50 | −50 |
| | NT1 | 100 | 15 | 5 | −5 |
| | NEF | 100 | 2 | 5 | −5 |
| | NF1 | 100 | 2 | 5 | −5 |
| | NT2 | 100 | 5 | 5 | −5 |
| | NF2 | 100 | 2 | 5 | −5 |
| Positive entrainer | D1 (kmol/h) | FeedA/xD1,A | FeedA − FeedB(1 − xD2,B) | 0.1 | −0.1 |
| D2 (kmol/h) | FeedB/xD2,B | FeedB − FeedA(1 − xD1,A) | 0.1 | −0.1 |
| Reverse entrainer | D1 (kmol/h) | FeedB/xD1,B | FeedB − FeedA(1 − xD2,A) | 0.1 | −0.1 |
| D2 (kmol/h) | FeedA/xD2,A | FeedA − FeedB(1 − xD1,B) | 0.1 | −0.1 |
| | RR1 | 50 | 0.001 | 3 | −3 |
| | RR2 | 50 | 0.001 | 3 | −3 |
Table 2.
Relevant parameters of PSO algorithm.
Table 2.
Relevant parameters of PSO algorithm.
| Number of Particles | Sizepop | wini | wend | c1 | c2 |
|---|
| 300 | 50 | 0.9 | 0.4 | 1.4 | 1.4 |
Table 3.
Conversion of light and heavy key components under different entrainers.
Table 3.
Conversion of light and heavy key components under different entrainers.
| System | Entrainer | Light Key Component | Heavy Key Component |
|---|
| Ethyl acetate (350.21 K)–ethanol (351.44 K) | Ethylene glycol (EG) | Ethyl acetate | Ethanol |
| Furfural | Ethanol | Ethyl acetate |
| Ethanol (351.44 K)–benzene (353.24 K) | CB | Ethanol | Benzene |
| PG | Benzene | Ethanol |
| Acetone (329.29 K)–methanol (337.68 K) | Water | Acetone | Methanol |
| CB | Methanol | Acetone |
Table 4.
Binary interaction parameters of ethyl acetate–ethanol–entrainer.
Table 4.
Binary interaction parameters of ethyl acetate–ethanol–entrainer.
| Component i | Component j | aij | aji | bij/K | bji/K | cij |
|---|
| Ethyl acetate | Ethanol | −0.2733 | 0.6541 | −159.1655 | −155.2346 | 0 |
| Ethanol | PG | 1.6544 | −0.9646 | −479.2631 | 82.541 | 0 |
| Ethyl acetate | PG | 0.5152 | 0.0409 | −378.6953 | −26.7131 | 0 |
| Ethanol | MIK | 0 | 0 | 152.82 | −363.7095 | 0 |
| Ethyl acetate | MIK | 0 | 0 | −443.6452 | 241.6555 | 0 |
| Ethanol | Furfural | 0 | 0 | 76.7492 | −309.5652 | 0 |
| Ethyl acetate | Furfural | 0 | 0 | −342.1748 | 193.6552 | 0 |
| Ethanol | EG | −8.2308 | 2.6876 | 2632.9255 | −959.5647 | 0 |
| Ethyl acetate | EG | 5.2798 | −4.7319 | −2215.4663 | 1628.6154 | 0 |
Table 5.
Optimization results for extractive distillation separation of ethyl acetate and ethanol with a feed composition of 0.5–0.5 using different entrainers.
Table 5.
Optimization results for extractive distillation separation of ethyl acetate and ethanol with a feed composition of 0.5–0.5 using different entrainers.
| Entrainer | TAC (105 USD/year) |
|---|
| PG | 19.67 |
| EG | 13.10 |
| Furfural | 13.95 |
| MIK | 25.59 |
Table 6.
Optimization results of ED under different feed compositions.
Table 6.
Optimization results of ED under different feed compositions.
Feed Composition
(Ethyl Acetate–Ethanol) | TAC/(105 USD/y) | TAC Saving
/(105 USD/y) | Relative TAC Saving
/% |
|---|
Positive Entrainer
(EG) | Reverse Entrainer
(Furfural) |
|---|
| 0.2–0.8 | 11.70 | 15.92 | 4.22 | 36.09 |
| 0.4–0.6 | 12.60 | 14.53 | 1.93 | 15.35 |
| 0.5–0.5 | 13.10 | 13.95 | 0.84 | 6.43 |
| 0.6–0.4 | 14.48 | 13.33 | −1.15 | −7.95 |
| 0.8–0.2 | 15.23 | 11.70 | −3.52 | −23.14 |
Table 7.
Binary interaction parameters of acetone–methanol–entrainer.
Table 7.
Binary interaction parameters of acetone–methanol–entrainer.
| Component i | Component j | aij | aji | bij/K | bji/K | cij |
|---|
| acetone | methanol | 0 | 0 | 101.8859 | 114.1347 | 0.3 |
| acetone | water | 6.3981 | 0.0544 | −1808.991 | 419.9716 | 0.3 |
| methanol | water | −0.693 | 2.7322 | 172.9871 | −617.2687 | 0.3 |
| acetone | CB | 7.1096 | −6.4924 | −2221.6992 | 2172.9419 | 0.3 |
| methanol | CB | 1.9141 | −2.7734 | −415.8773 | 1535.1284 | 0.3 |
| acetone | toluene | 1.2032 | −1.2846 | −400.547 | 630.0969 | 0.3 |
| methanol | toluene | 0 | 0 | 371.0837 | 446.8746 | 0.3 |
| acetone | DMF | 0 | 0 | 120.6035 | −59.8053 | 0.3 |
| methanol | DMF | −0.501 | −0.8325 | 712.2657 | −208.2091 | 0.3 |
| Disclaimer/Publisher’s Note: The statements, opinions and data contained in all publications are solely those of the individual author(s) and contributor(s) and not of MDPI and/or the editor(s). MDPI and/or the editor(s) disclaim responsibility for any injury to people or property resulting from any ideas, methods, instructions or products referred to in the content. |
© 2024 by the authors. Licensee MDPI, Basel, Switzerland. This article is an open access article distributed under the terms and conditions of the Creative Commons Attribution (CC BY) license (https://creativecommons.org/licenses/by/4.0/).


