
The Influence of CO2 Physical Properties on Casing and Its Prediction Method


Abstract
:1. Introduction
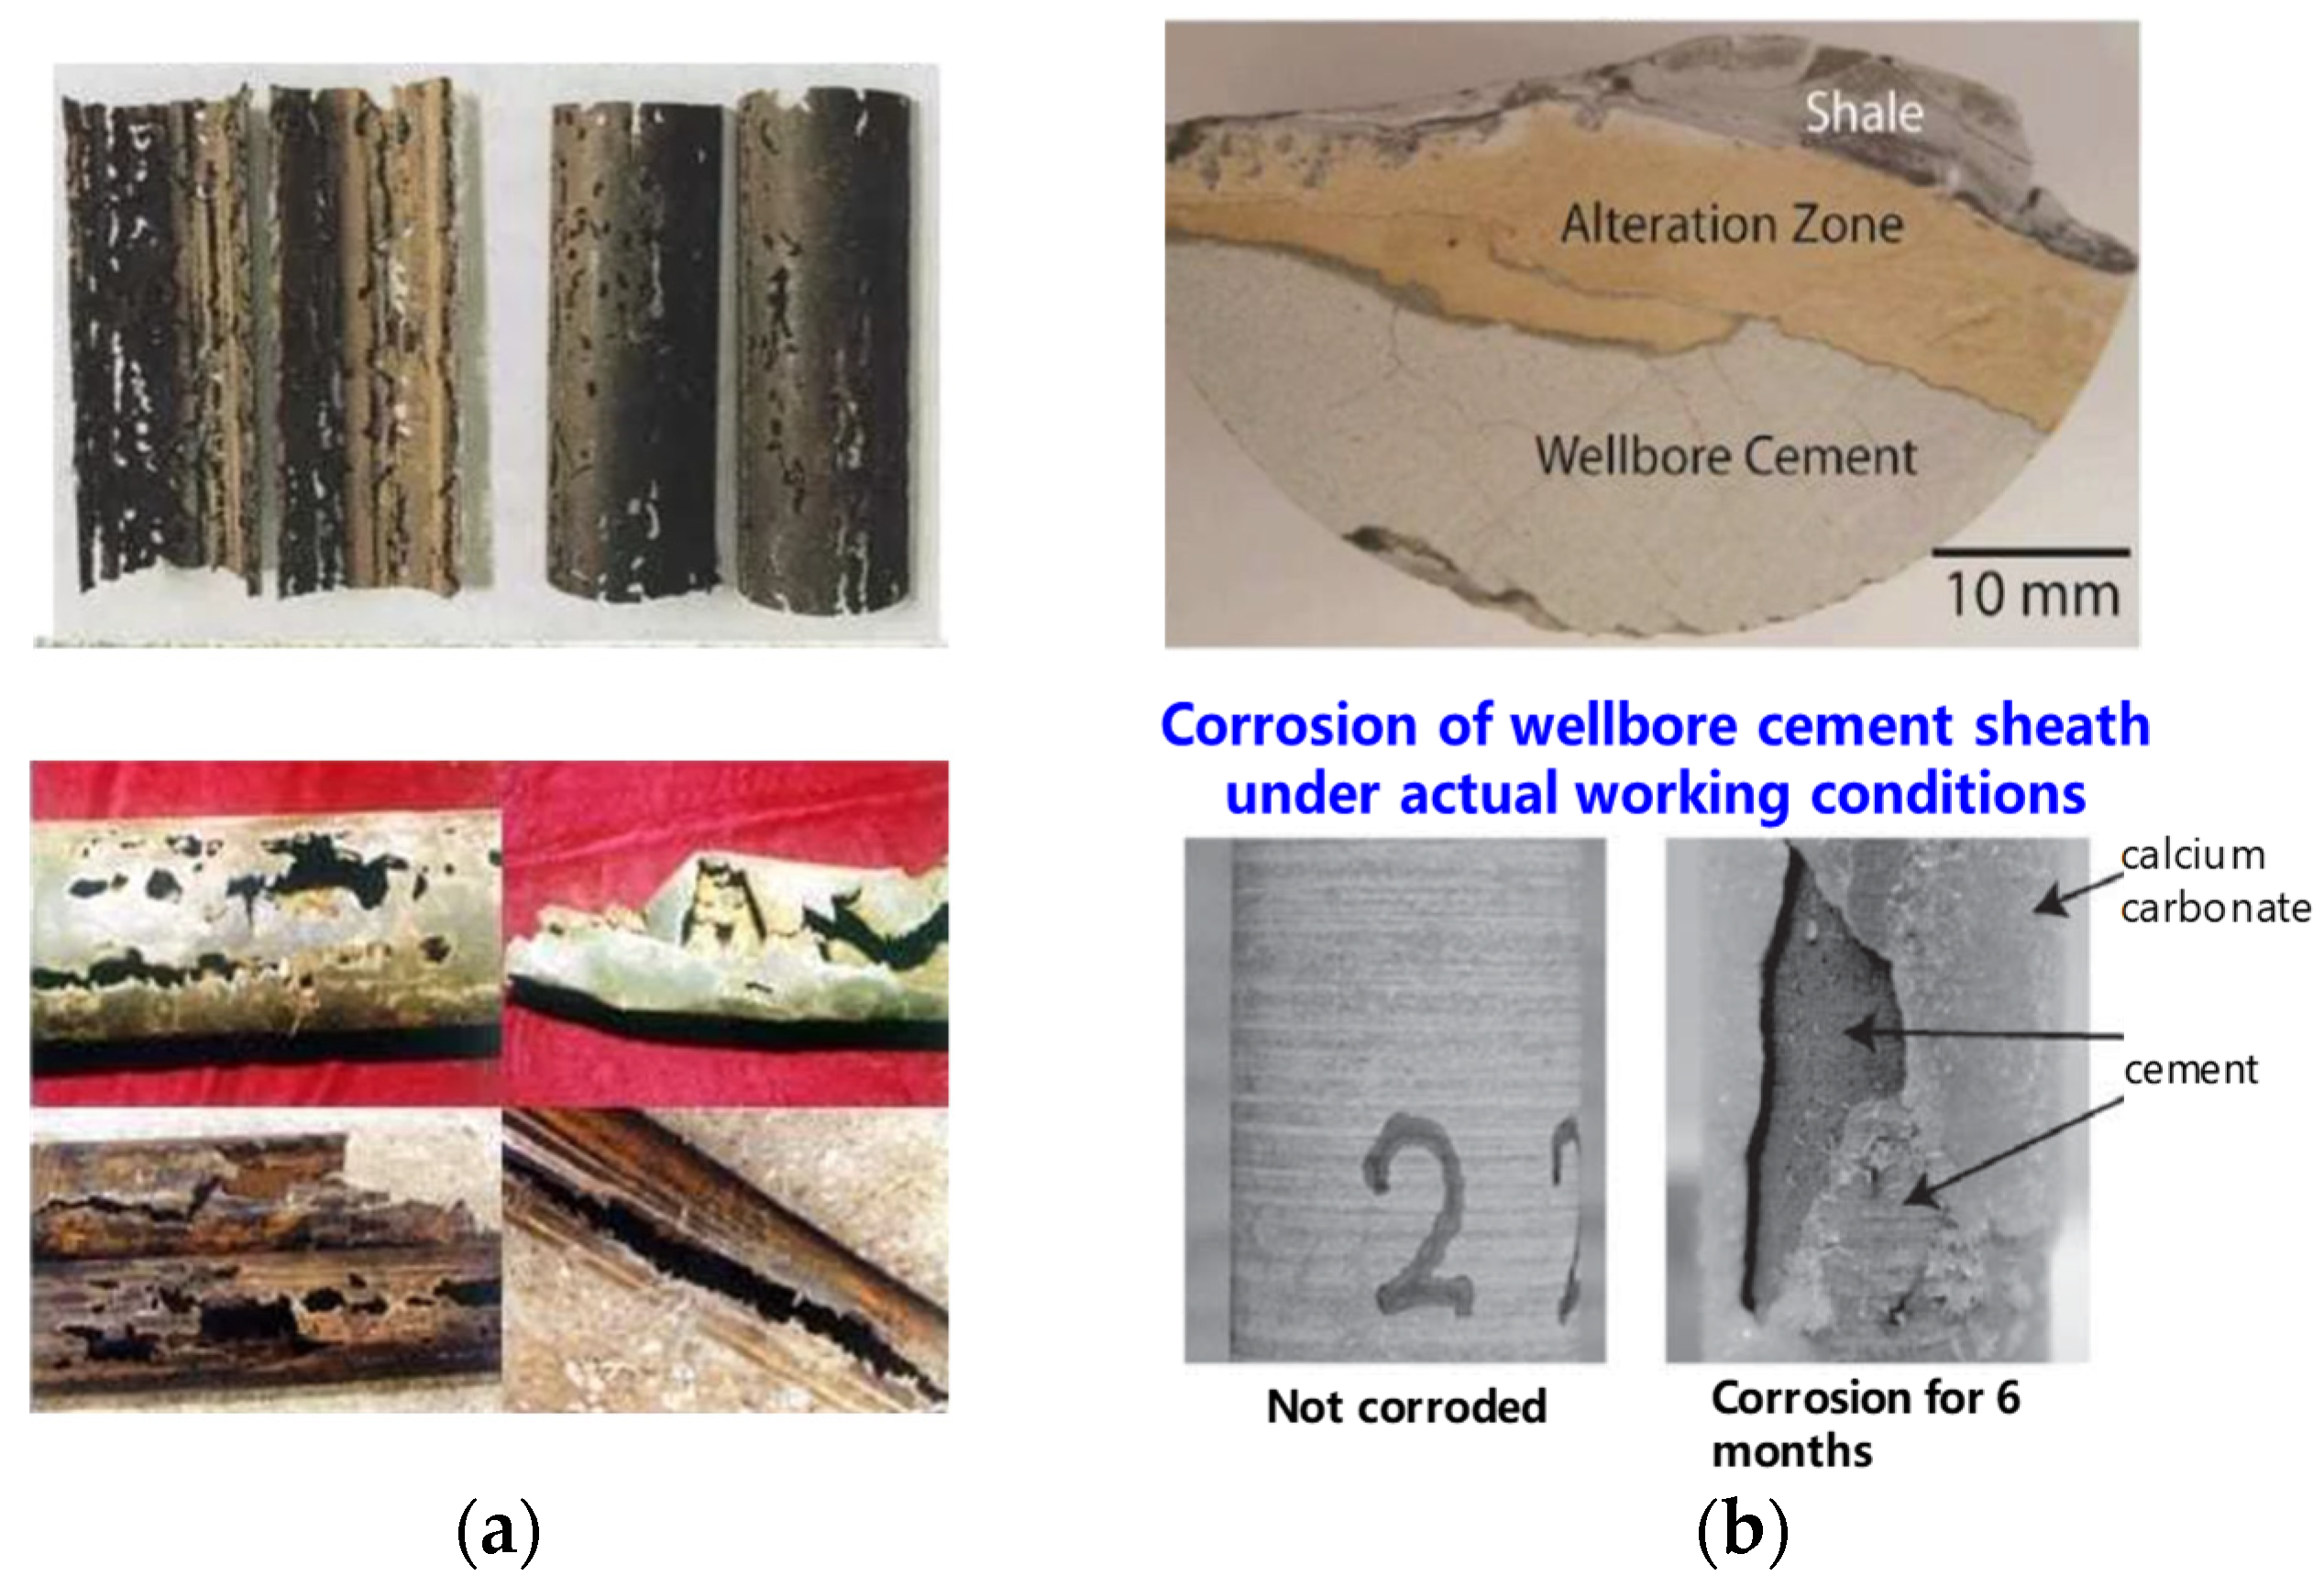
2. The Effect of CO2 on Wellbore Integrity Failure
3. Physical Properties of CO2 under Actual Stratigraphic Conditions
3.1. Physical Properties of CO2 under Actual Stratigraphic Conditions
3.2. Mathematical Model of Wellbore Temperature Field and Pressure Field
3.2.1. Wellbore Heat-Transfer Model
3.2.2. Tubing Inner Wall Temperature
4. The Influence of CO2 Corrosion on Casing, Cement and Stone, and Interface
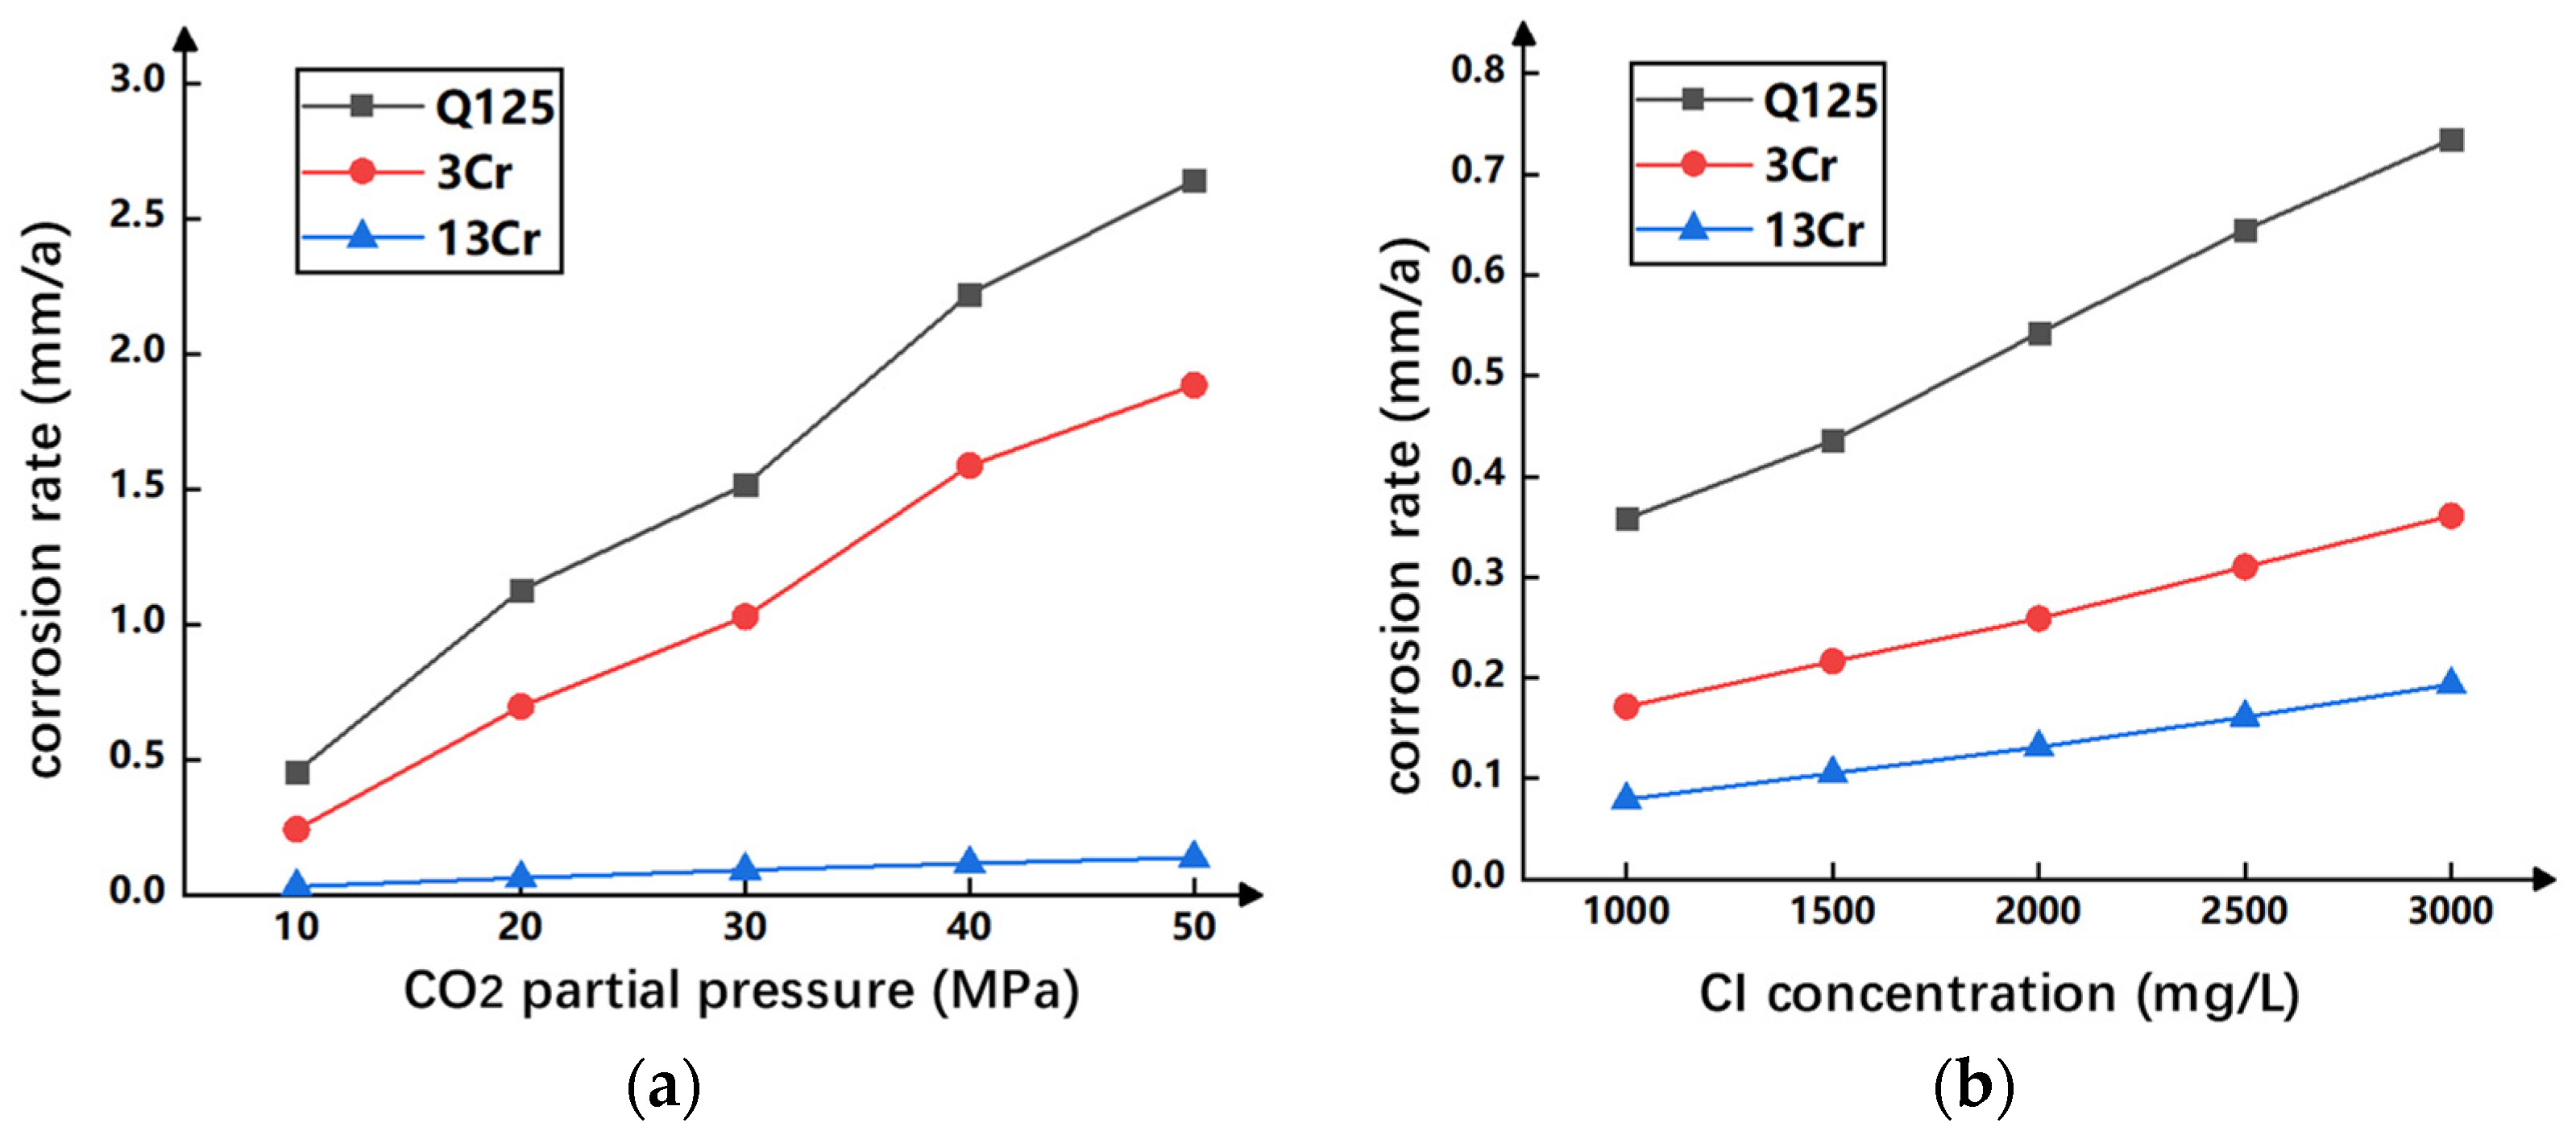
4.1. The Influence of CO2 Partial Pressure and Cl− Concentration on CO2 Corrosion Casing
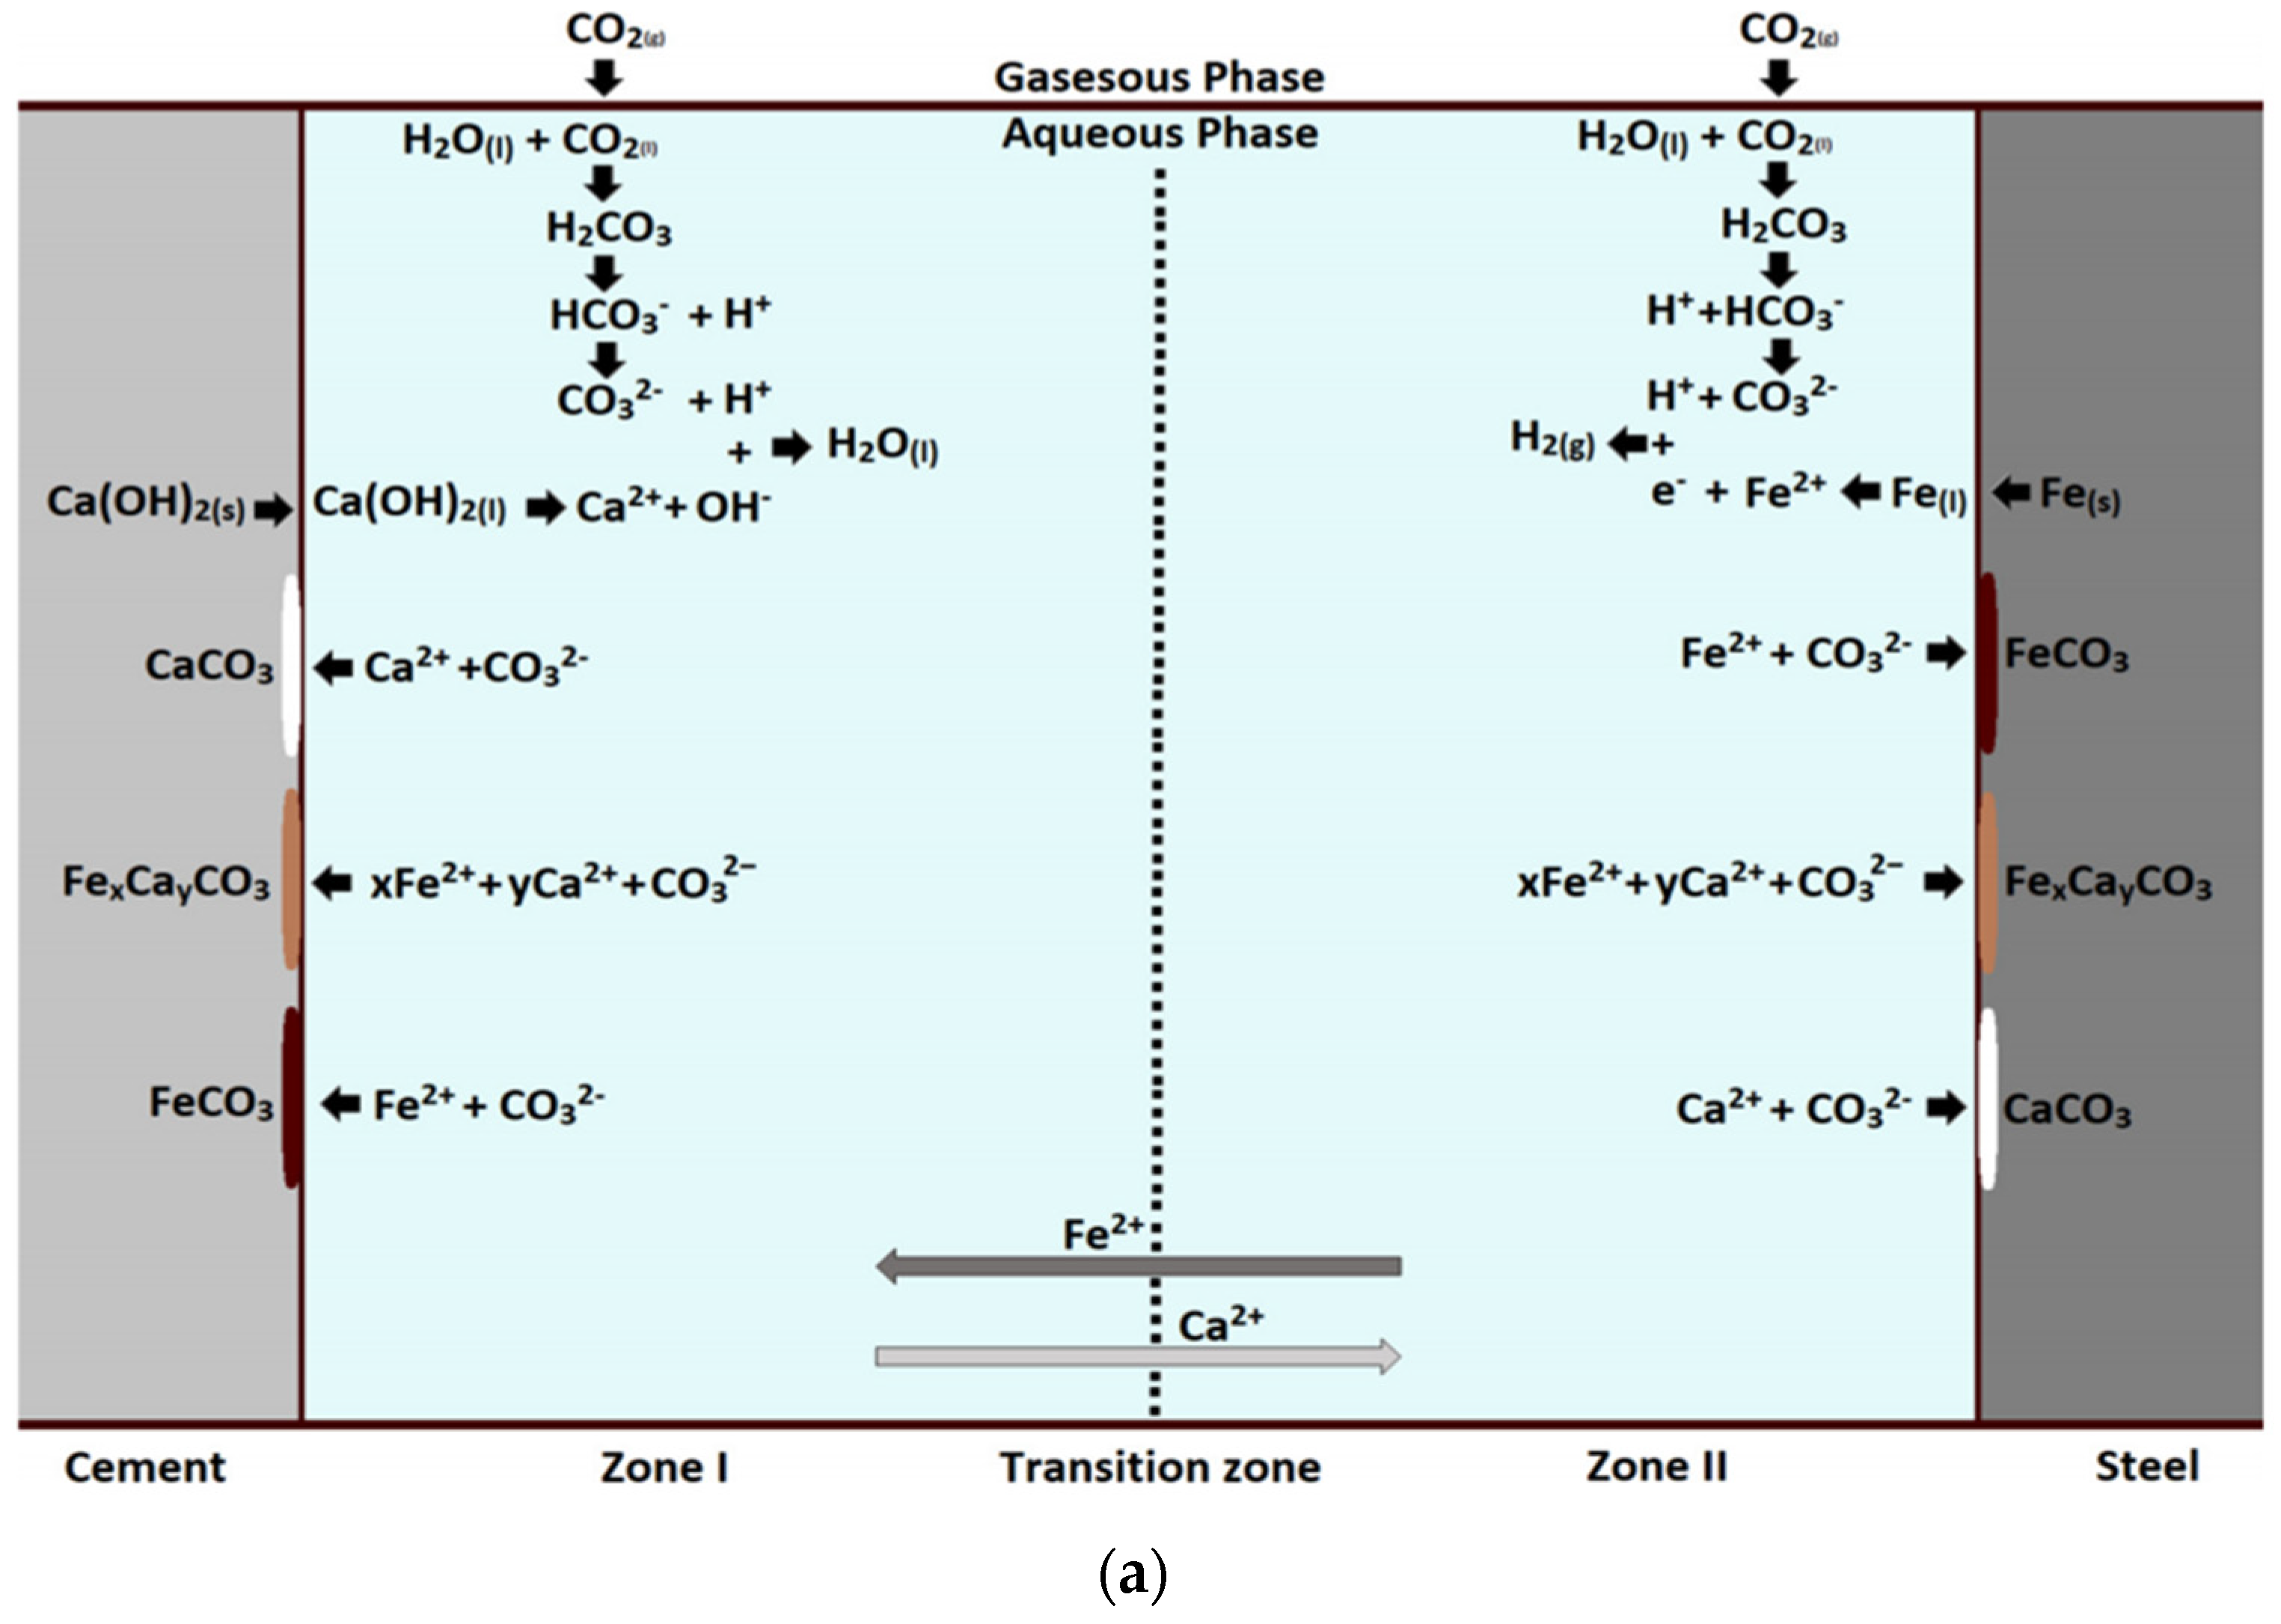
4.2. Mechanism and Laws of CO2 Corrosion of Cement Stone
- Carbonization effect
- 2.
- Neutralization effect
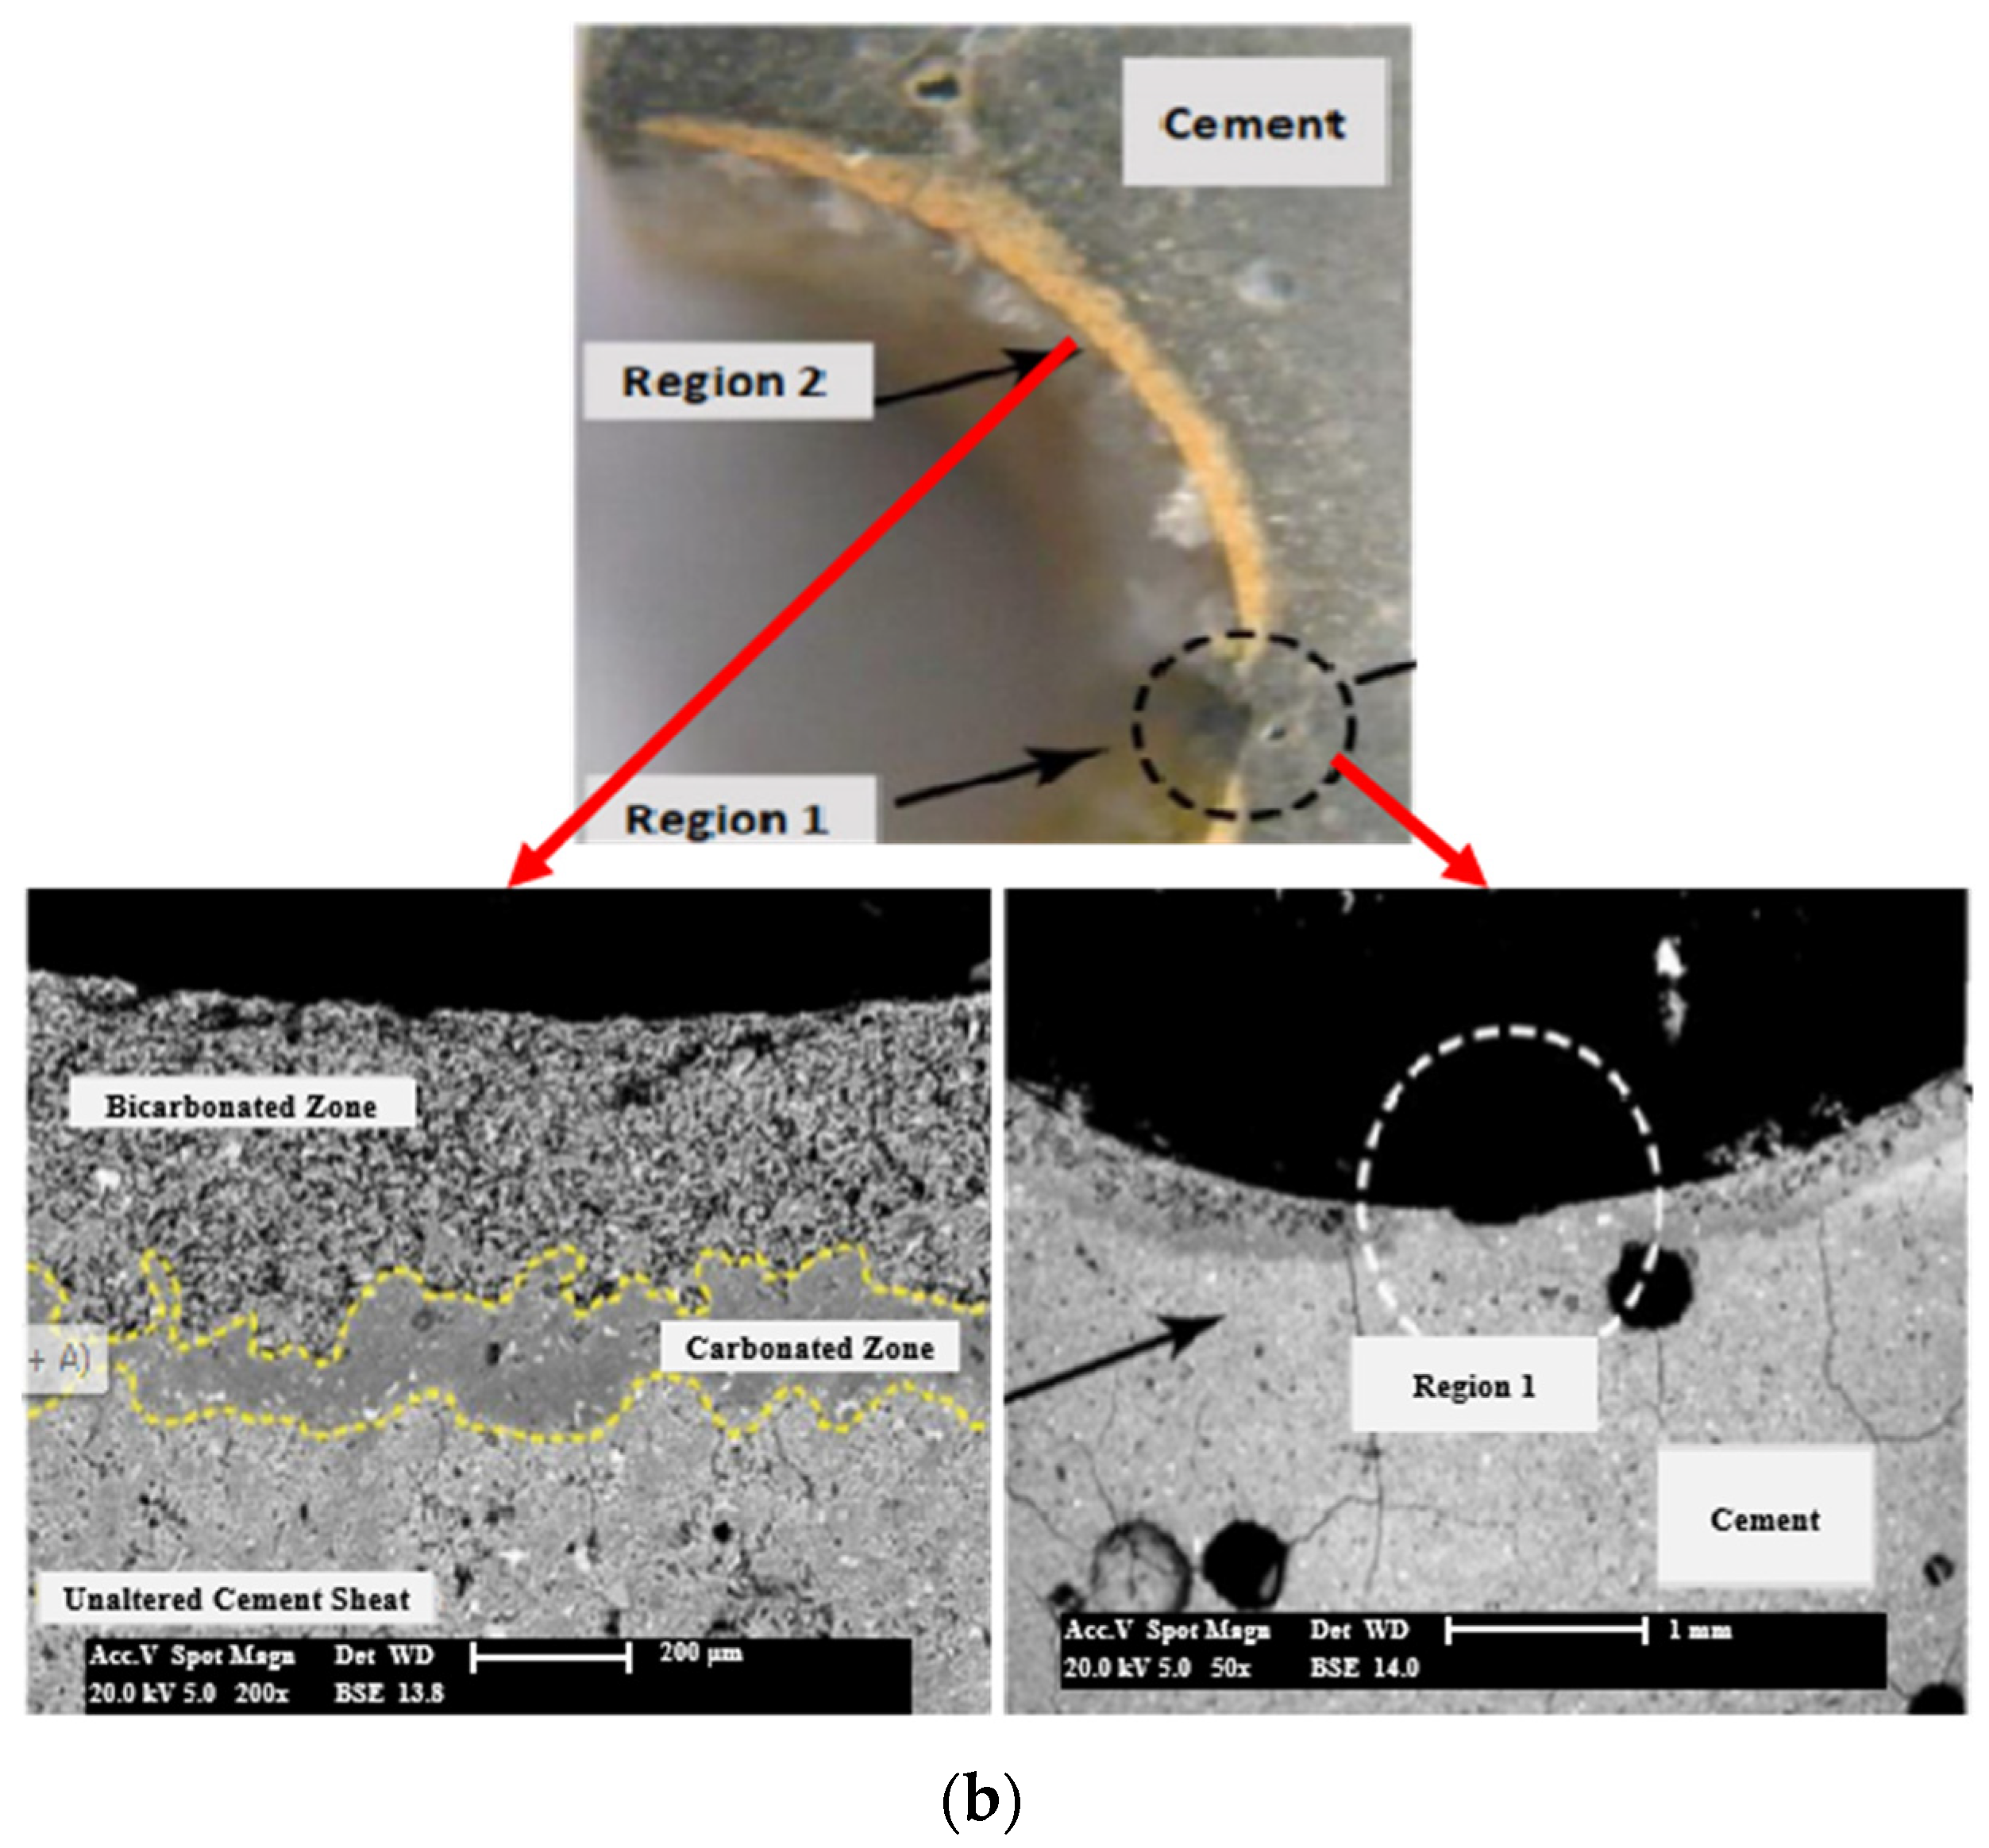
4.3. Mechanism and Law of CO2 Corrosion at Casing–Cement Stone Interface
4.4. Test of Casing, Cement Stone, and Interface Properties before and after Corrosion under Non-Bearing Conditions
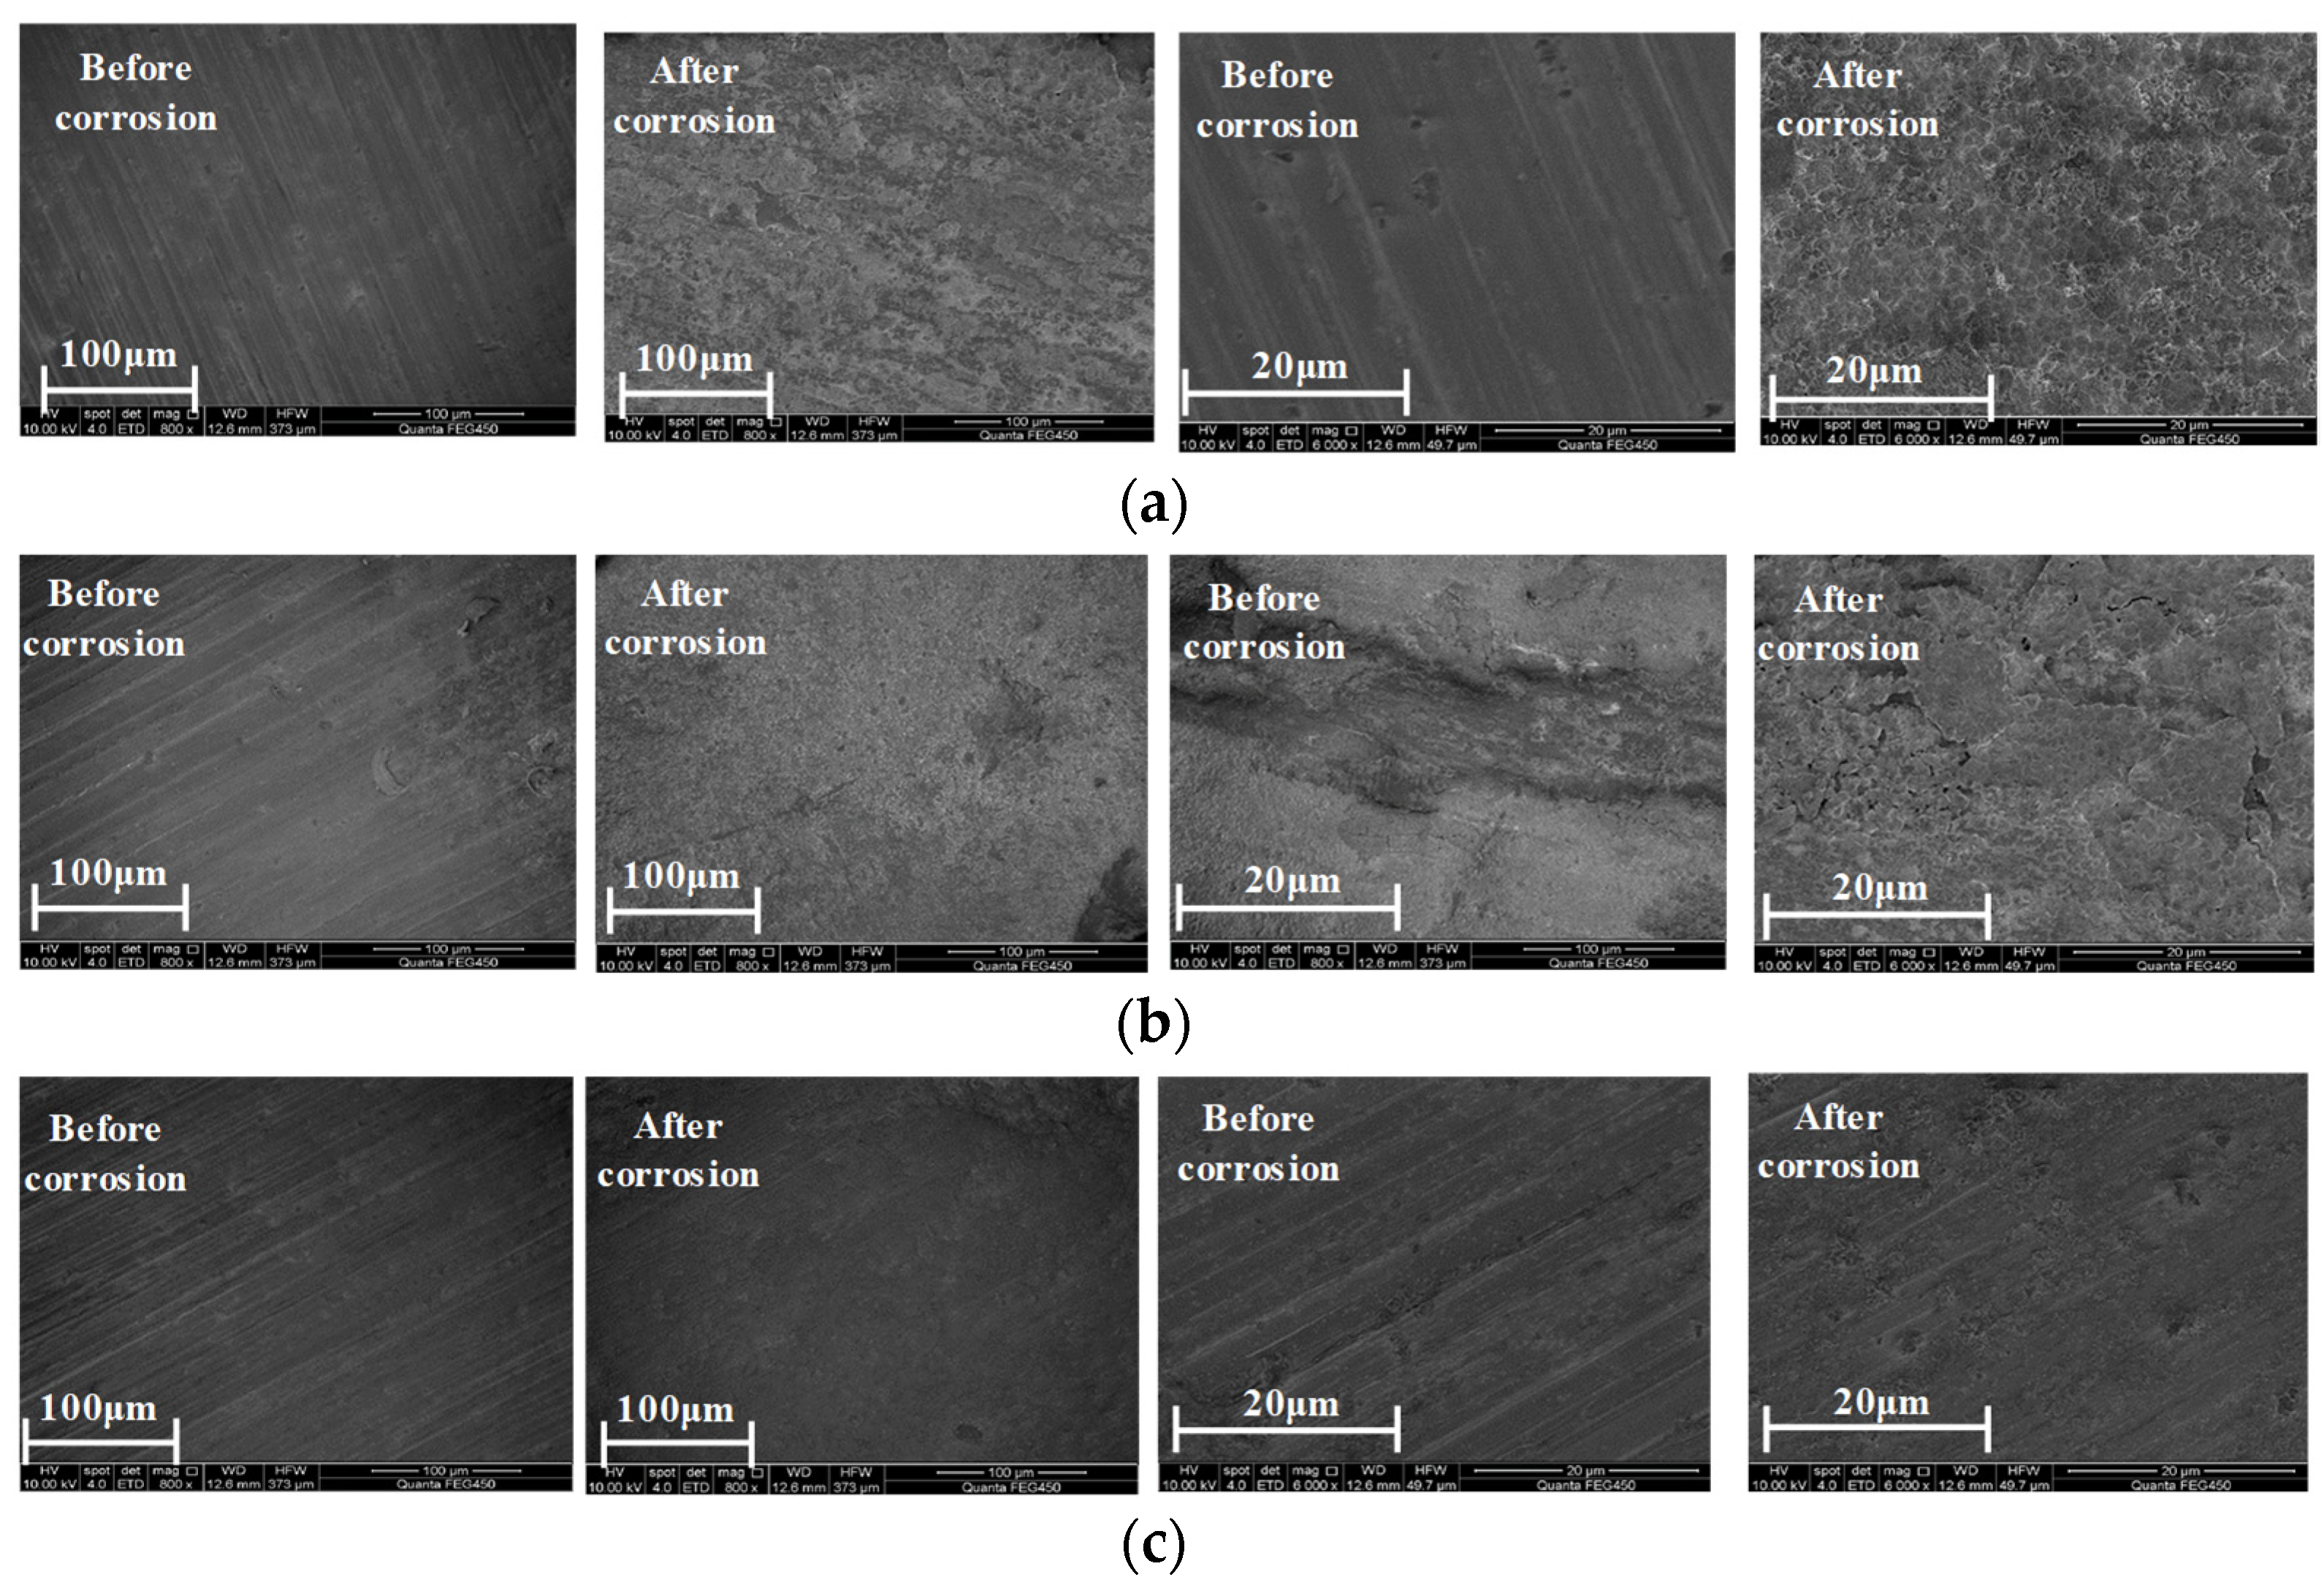
4.4.1. Test Results of Casing Properties before and after Corrosion
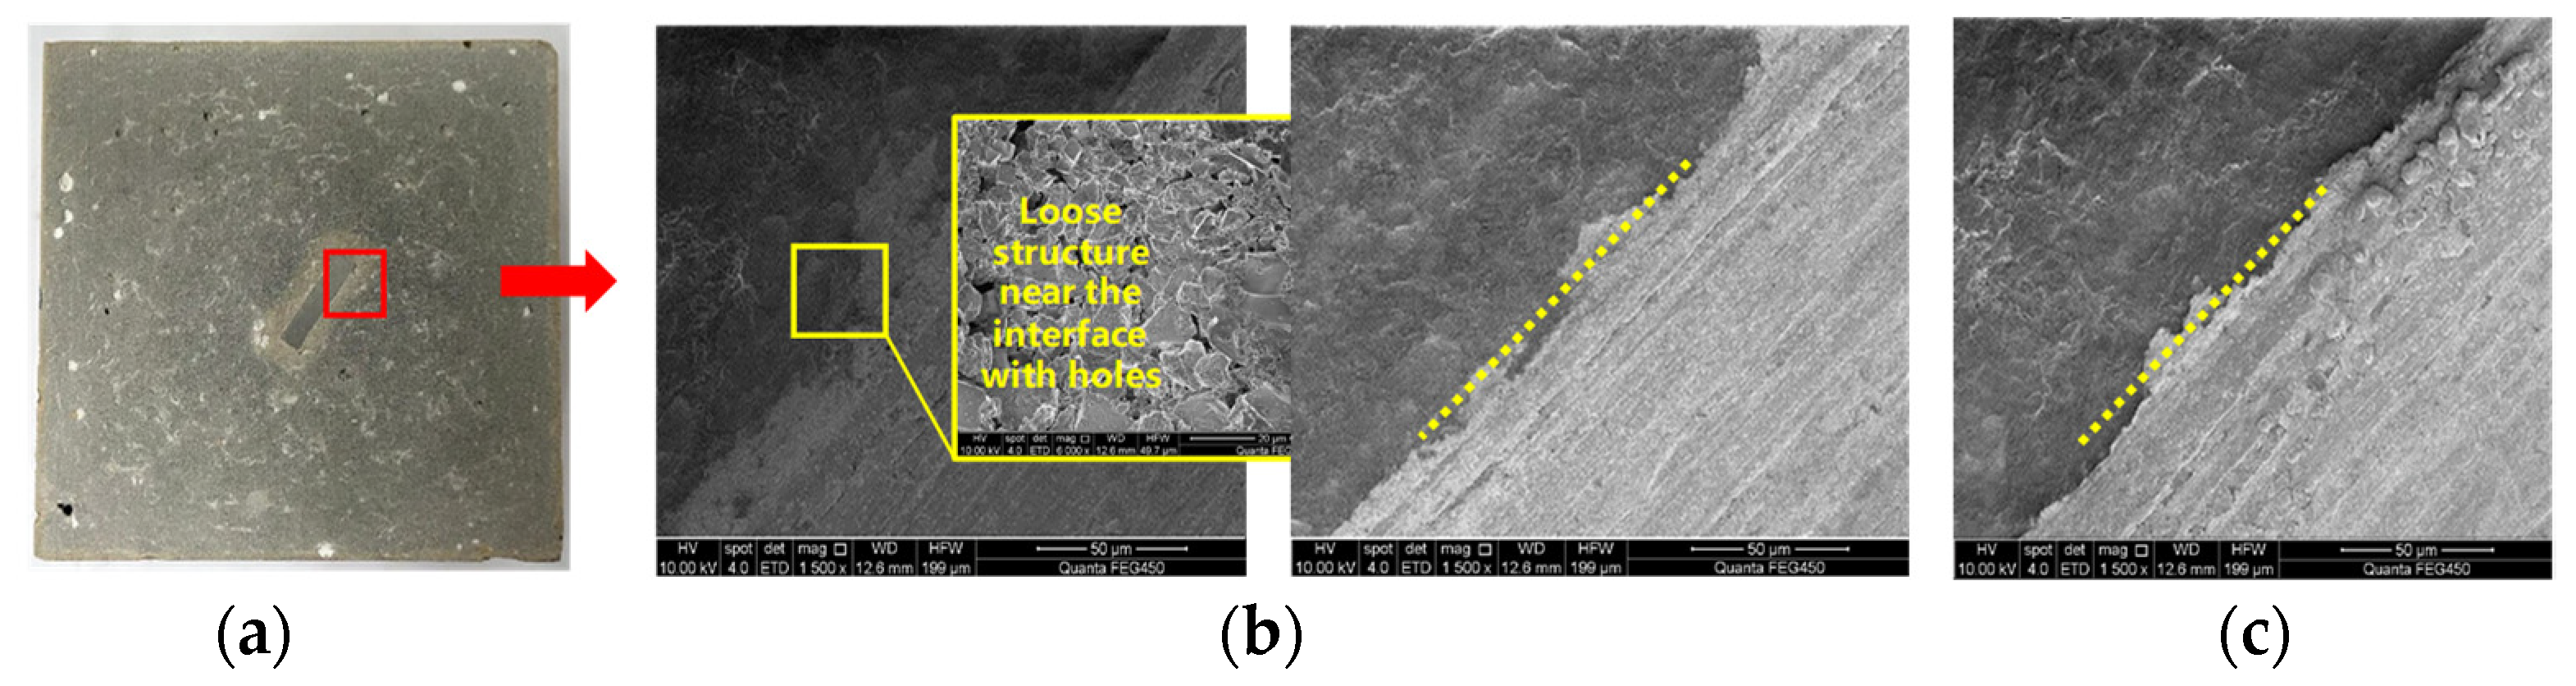
4.4.2. Test Results of Casing–Cement Stone Interface Properties before and after Corrosion
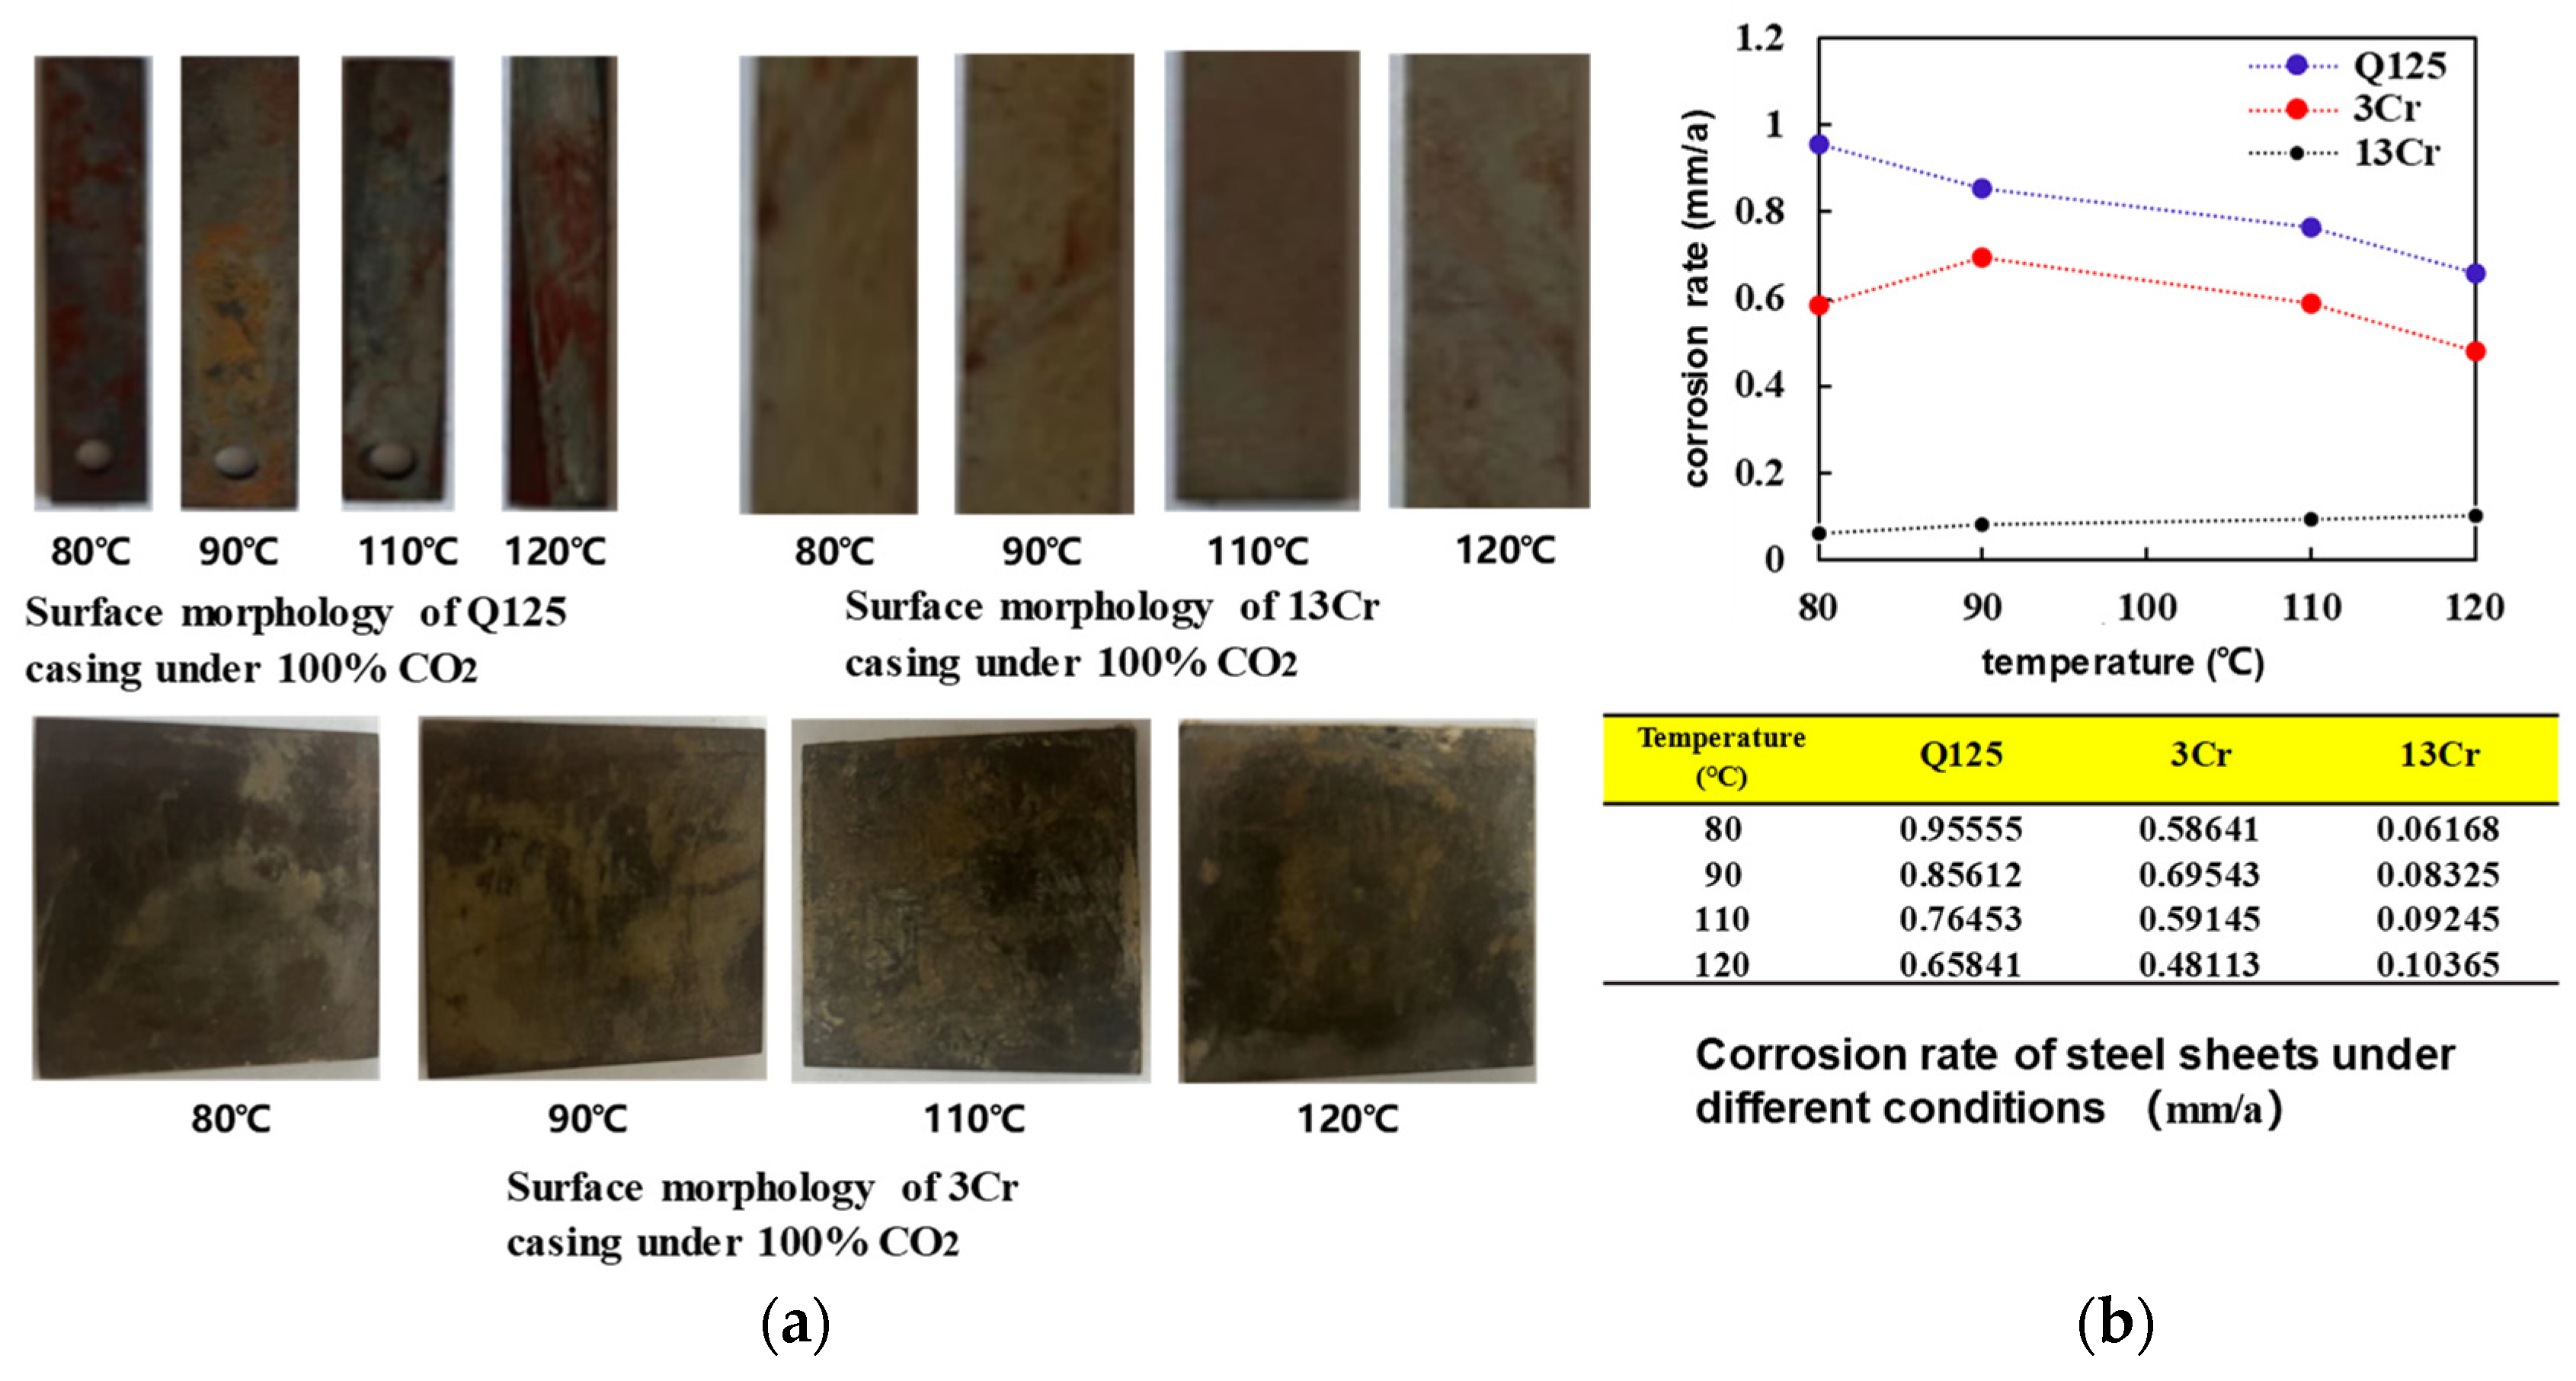
4.4.3. Effect of CO2 on Casing Corrosion Rate Test under Non-Load-Bearing Conditions—Temperature
5. A Prediction Method for Wellbore Damage under Fracturing and CO2 Long-Term Corrosion Conditions
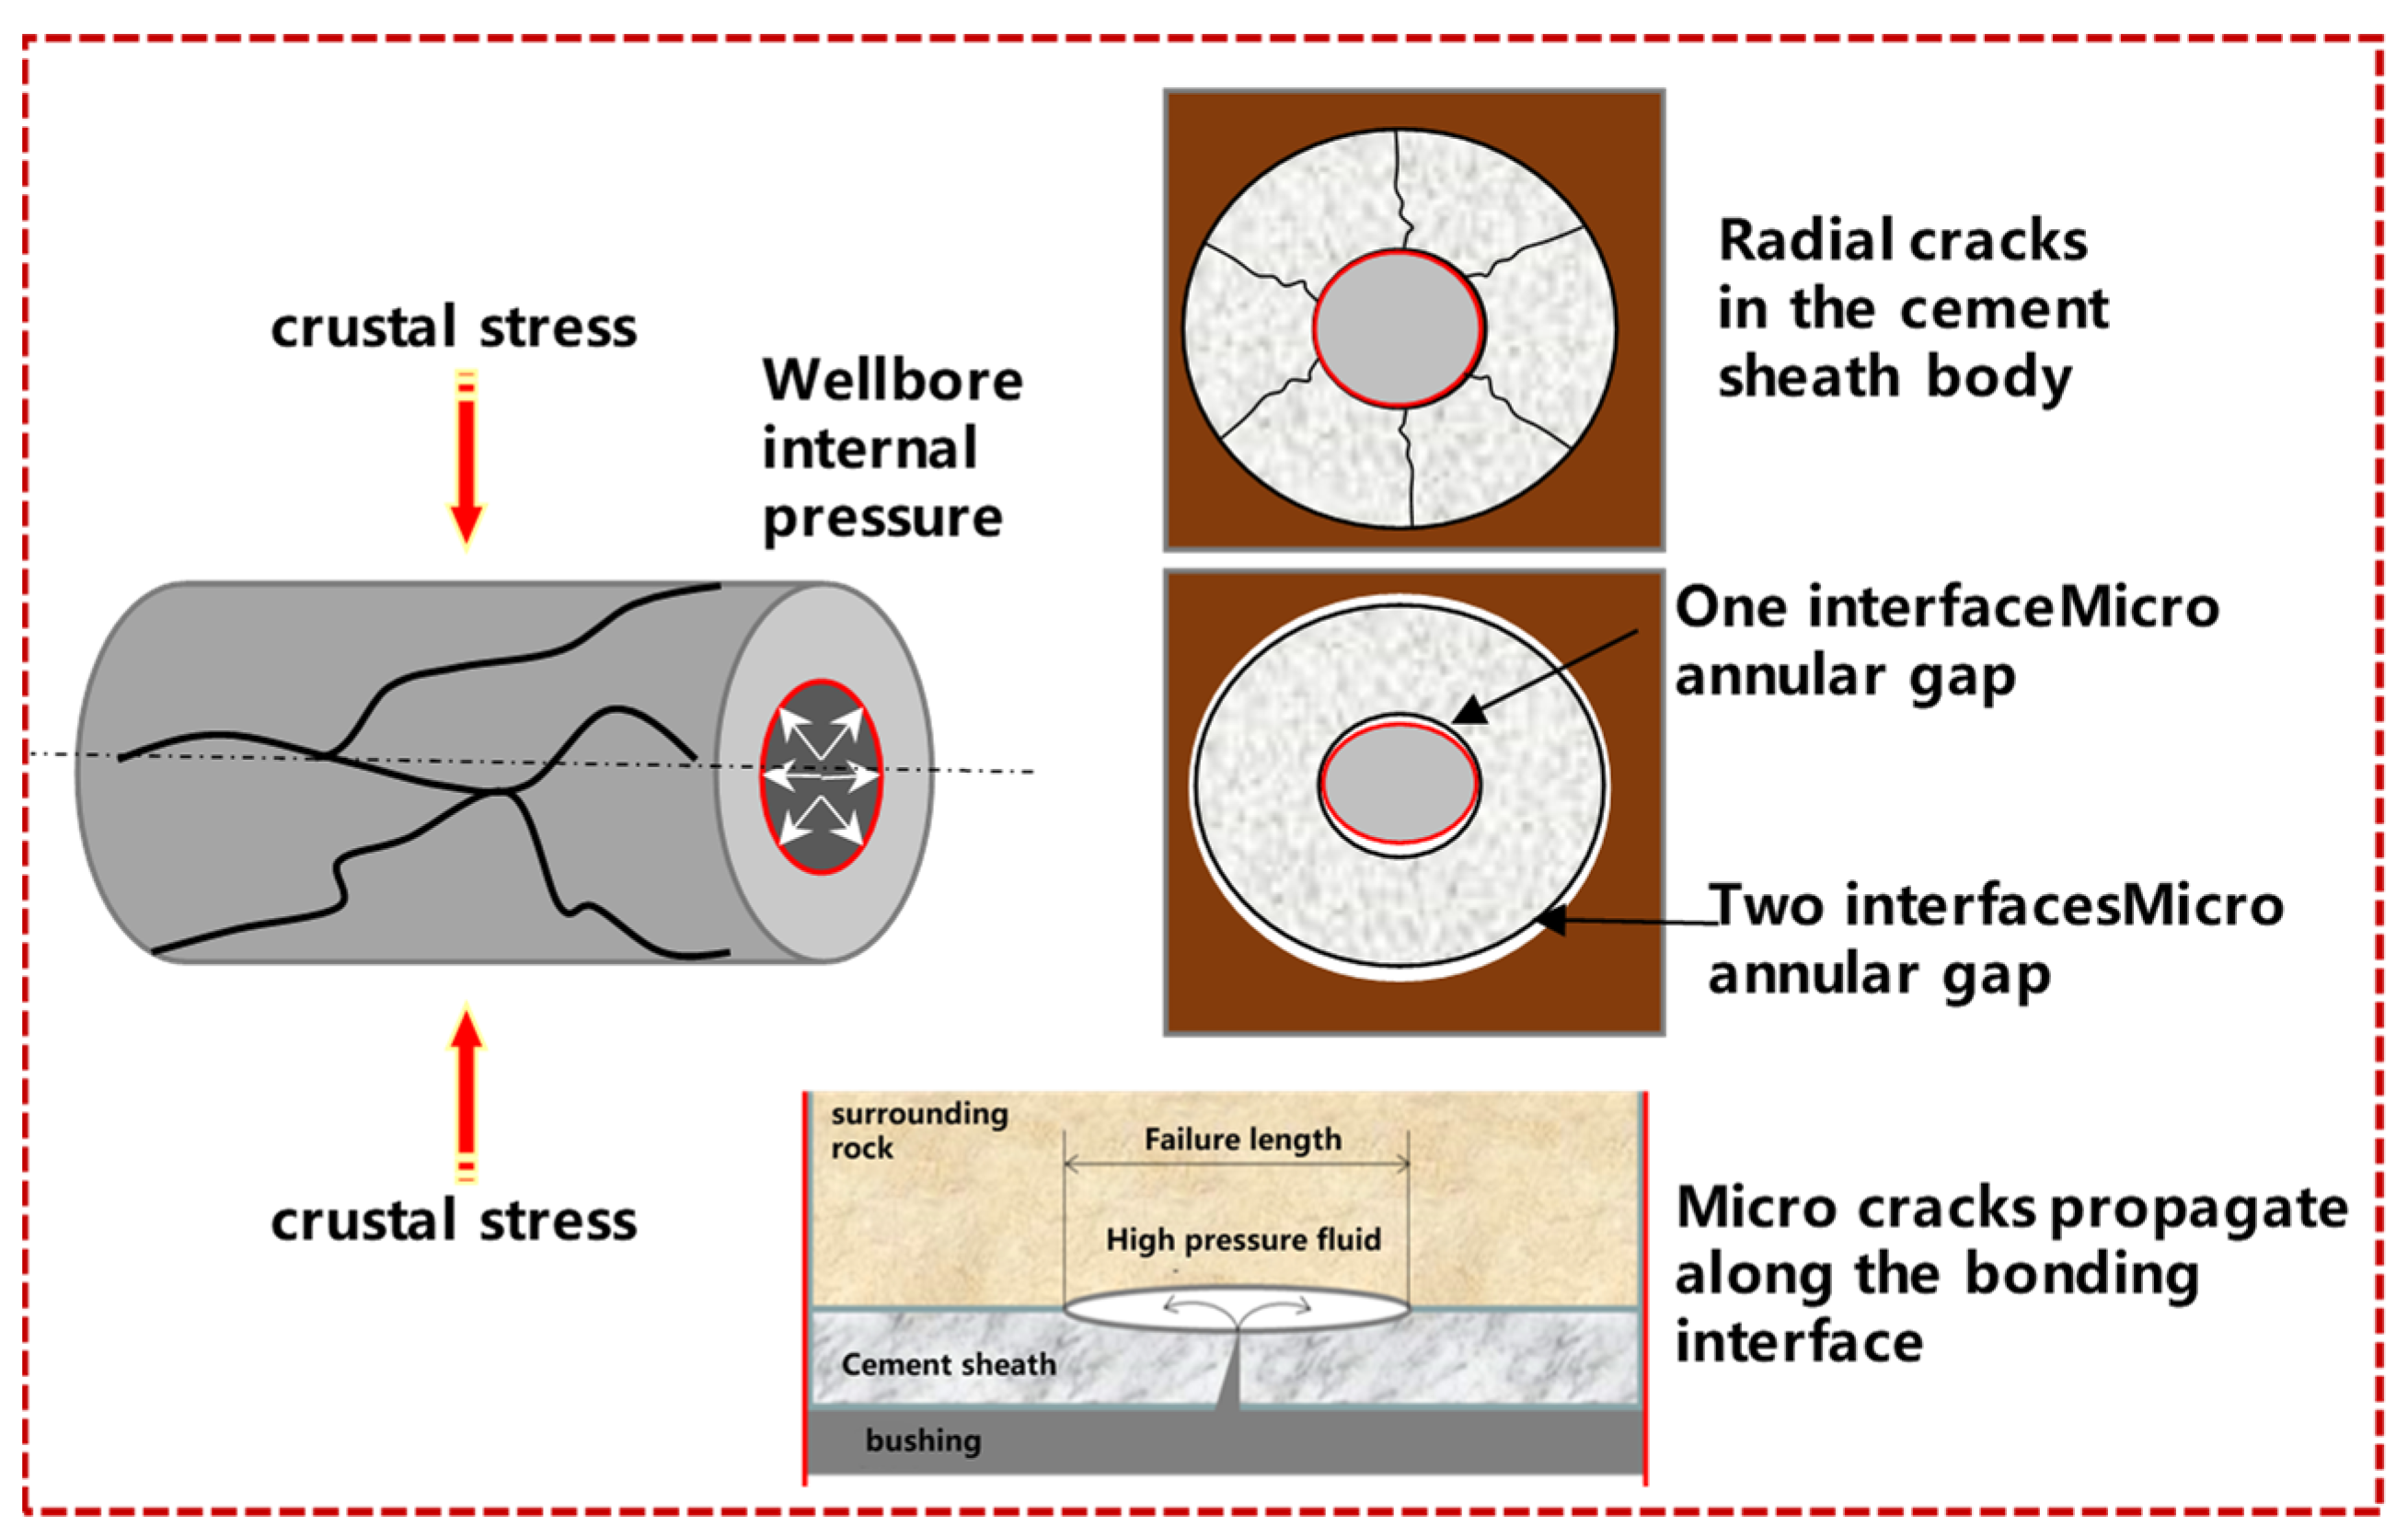
5.1. Wellbore Damage Failure Modes
- (1)
- Failure of the cement-sheath body—the cementing interface is well cemented, but tensile failure occurs due to insufficient strength of the cement-sheath body;
- (2)
- Micro-annular gap at the casing–cement sheath interface—the cementing interface is imperfect, and micro-annular gap occurs due to the discontinuity of interface displacement during loading-unloading;
- (3)
- Channeling fractures are formed at the cement sheath–formation interface—during the fracturing process, channeling channels are formed due to the initial damage and expansion of the fracturing fluid along the interface. According to the conditions of fracturing and long-term CO2 corrosion, the schematic diagram describing the wellbore damage prediction is shown in Figure 10.
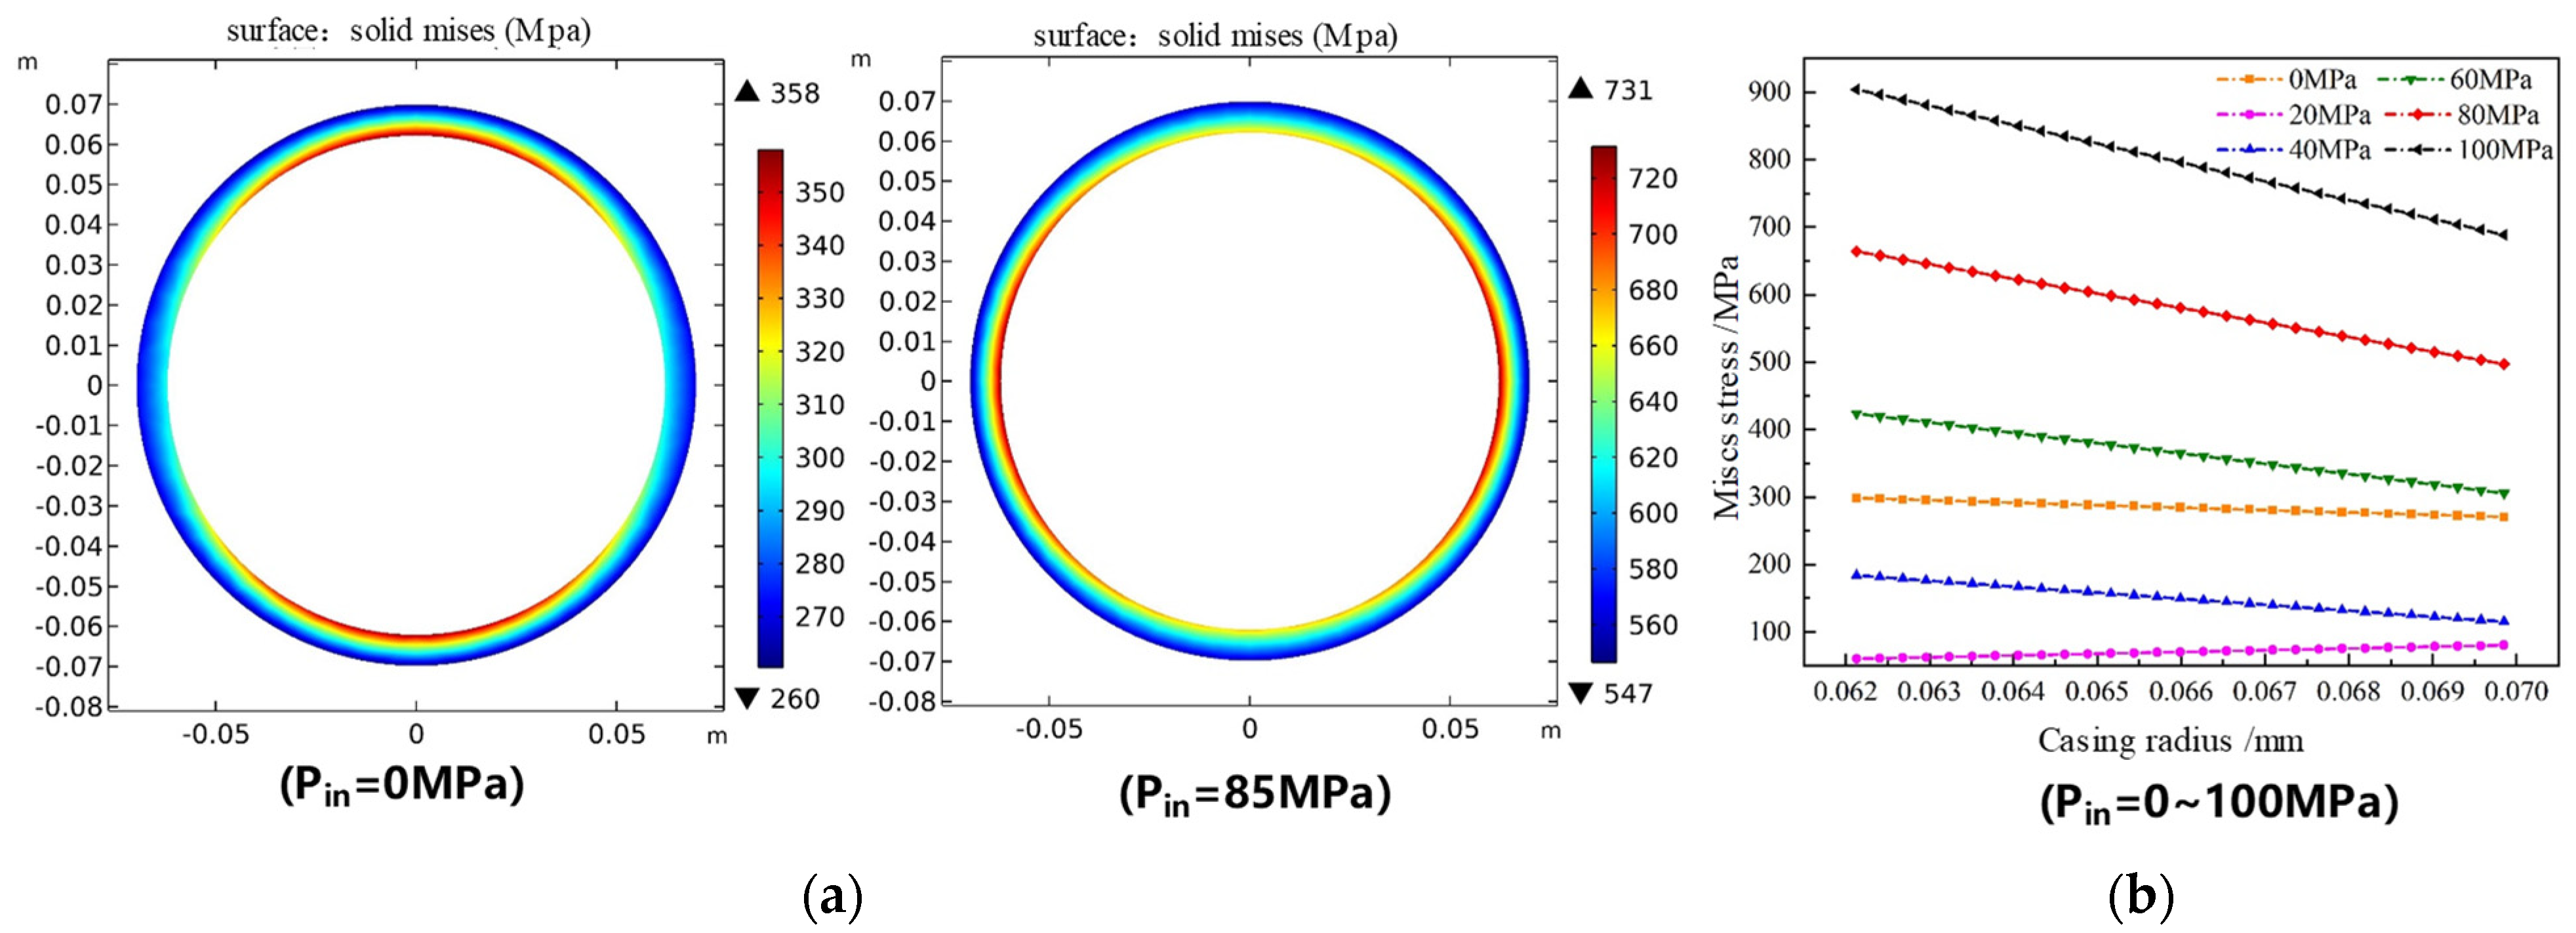
5.2. Stress Distribution of the Loading Process Assembly
5.2.1. Casing Stress
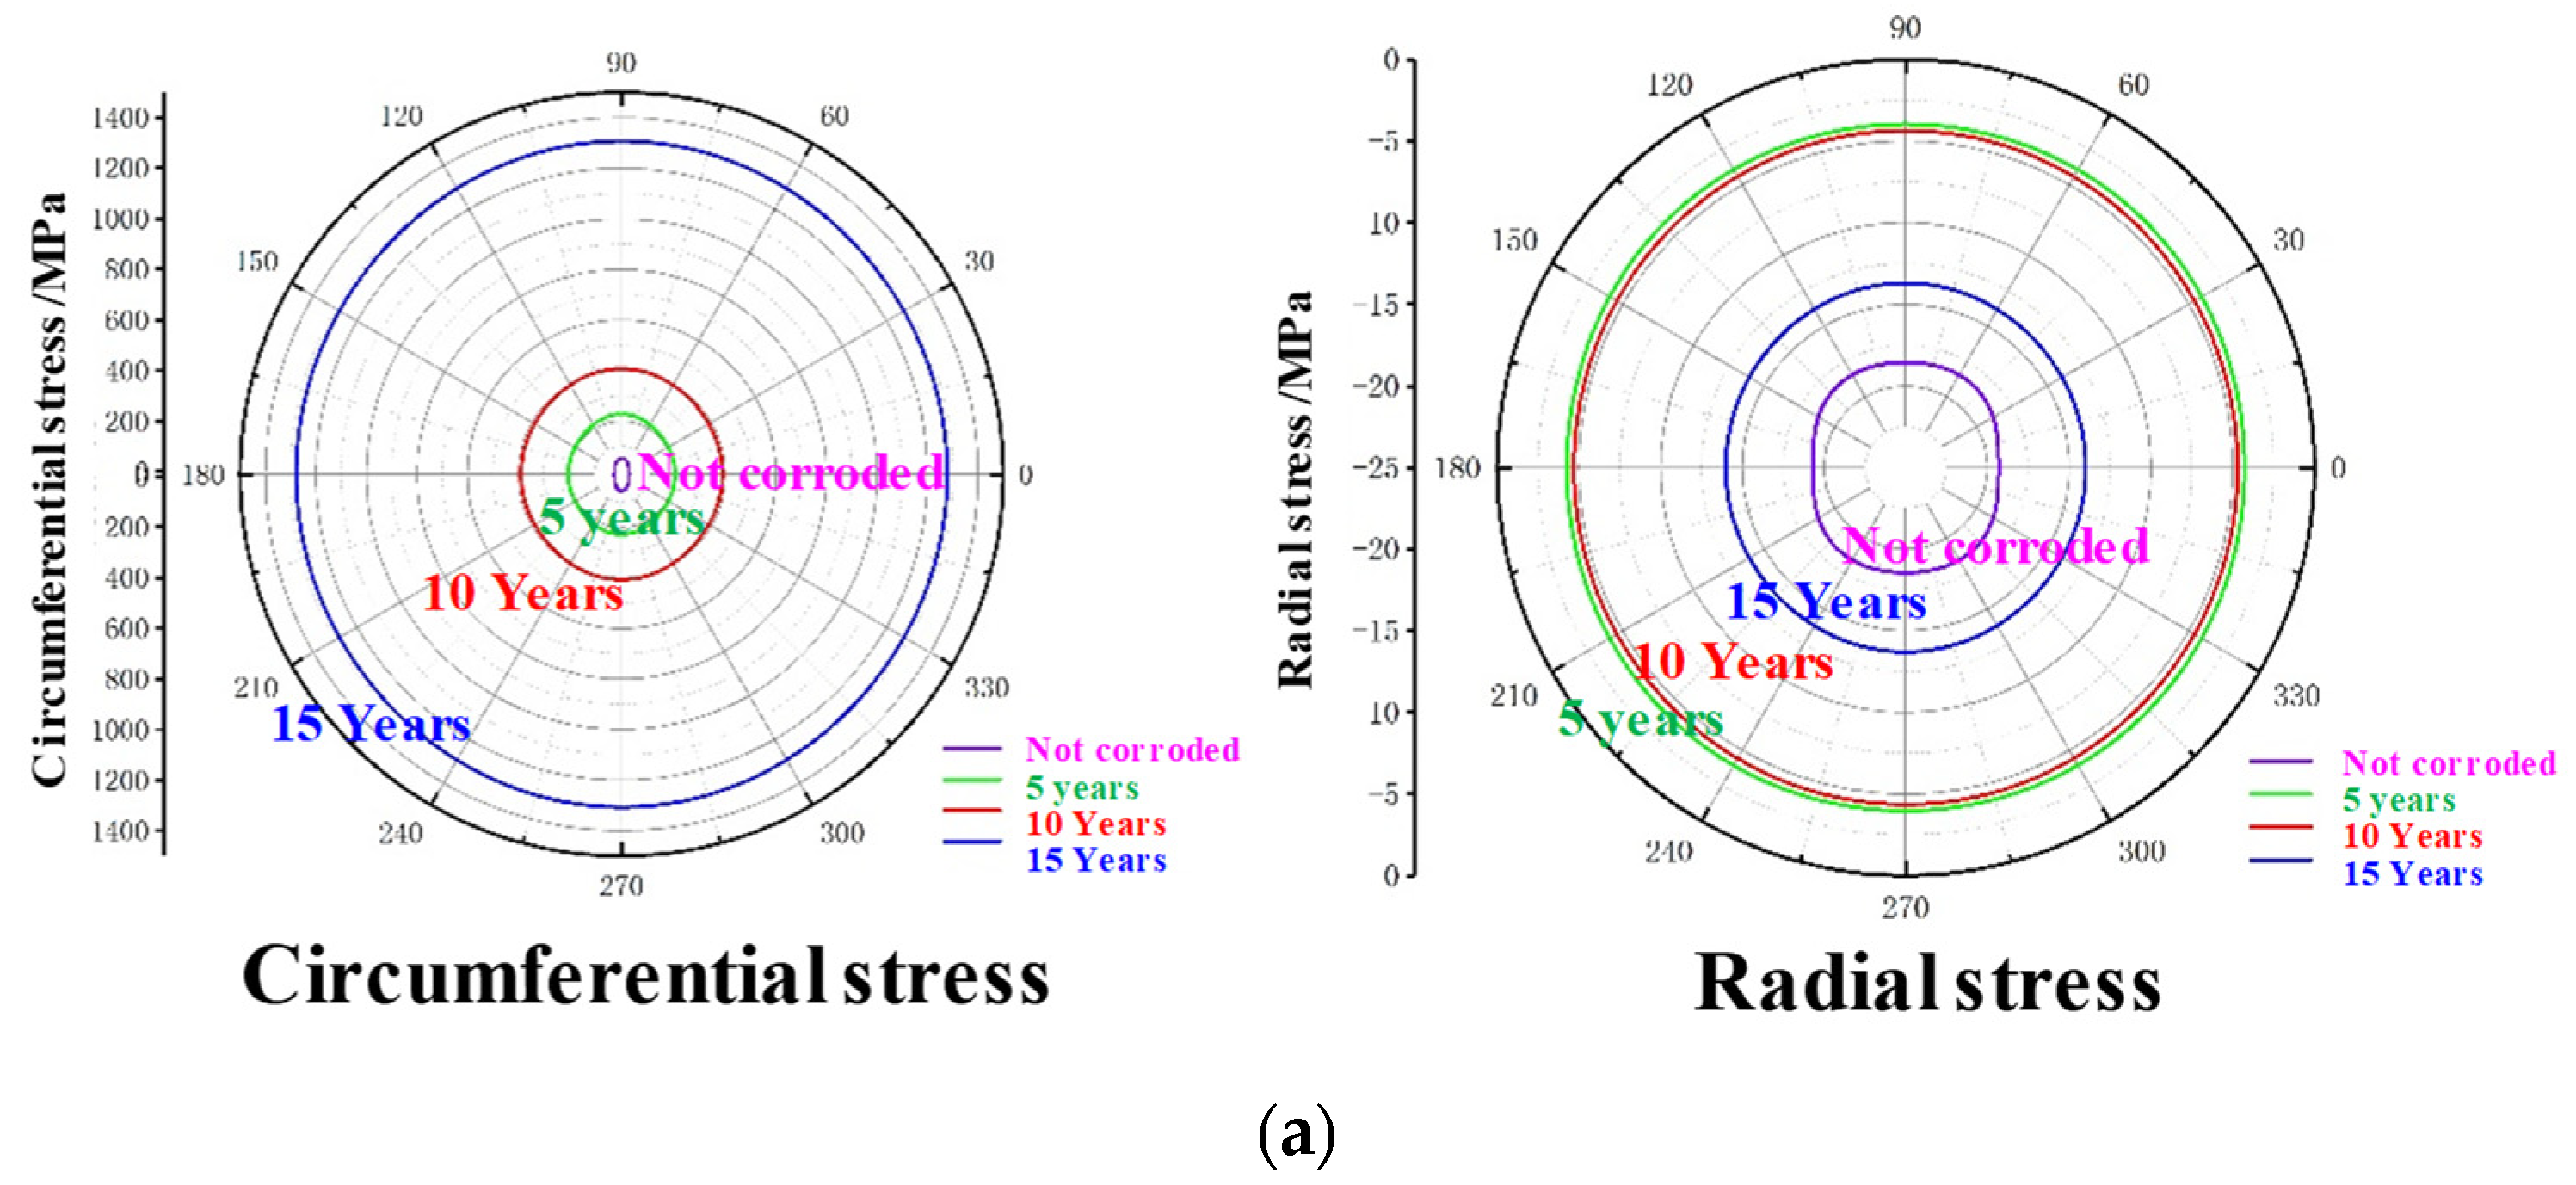
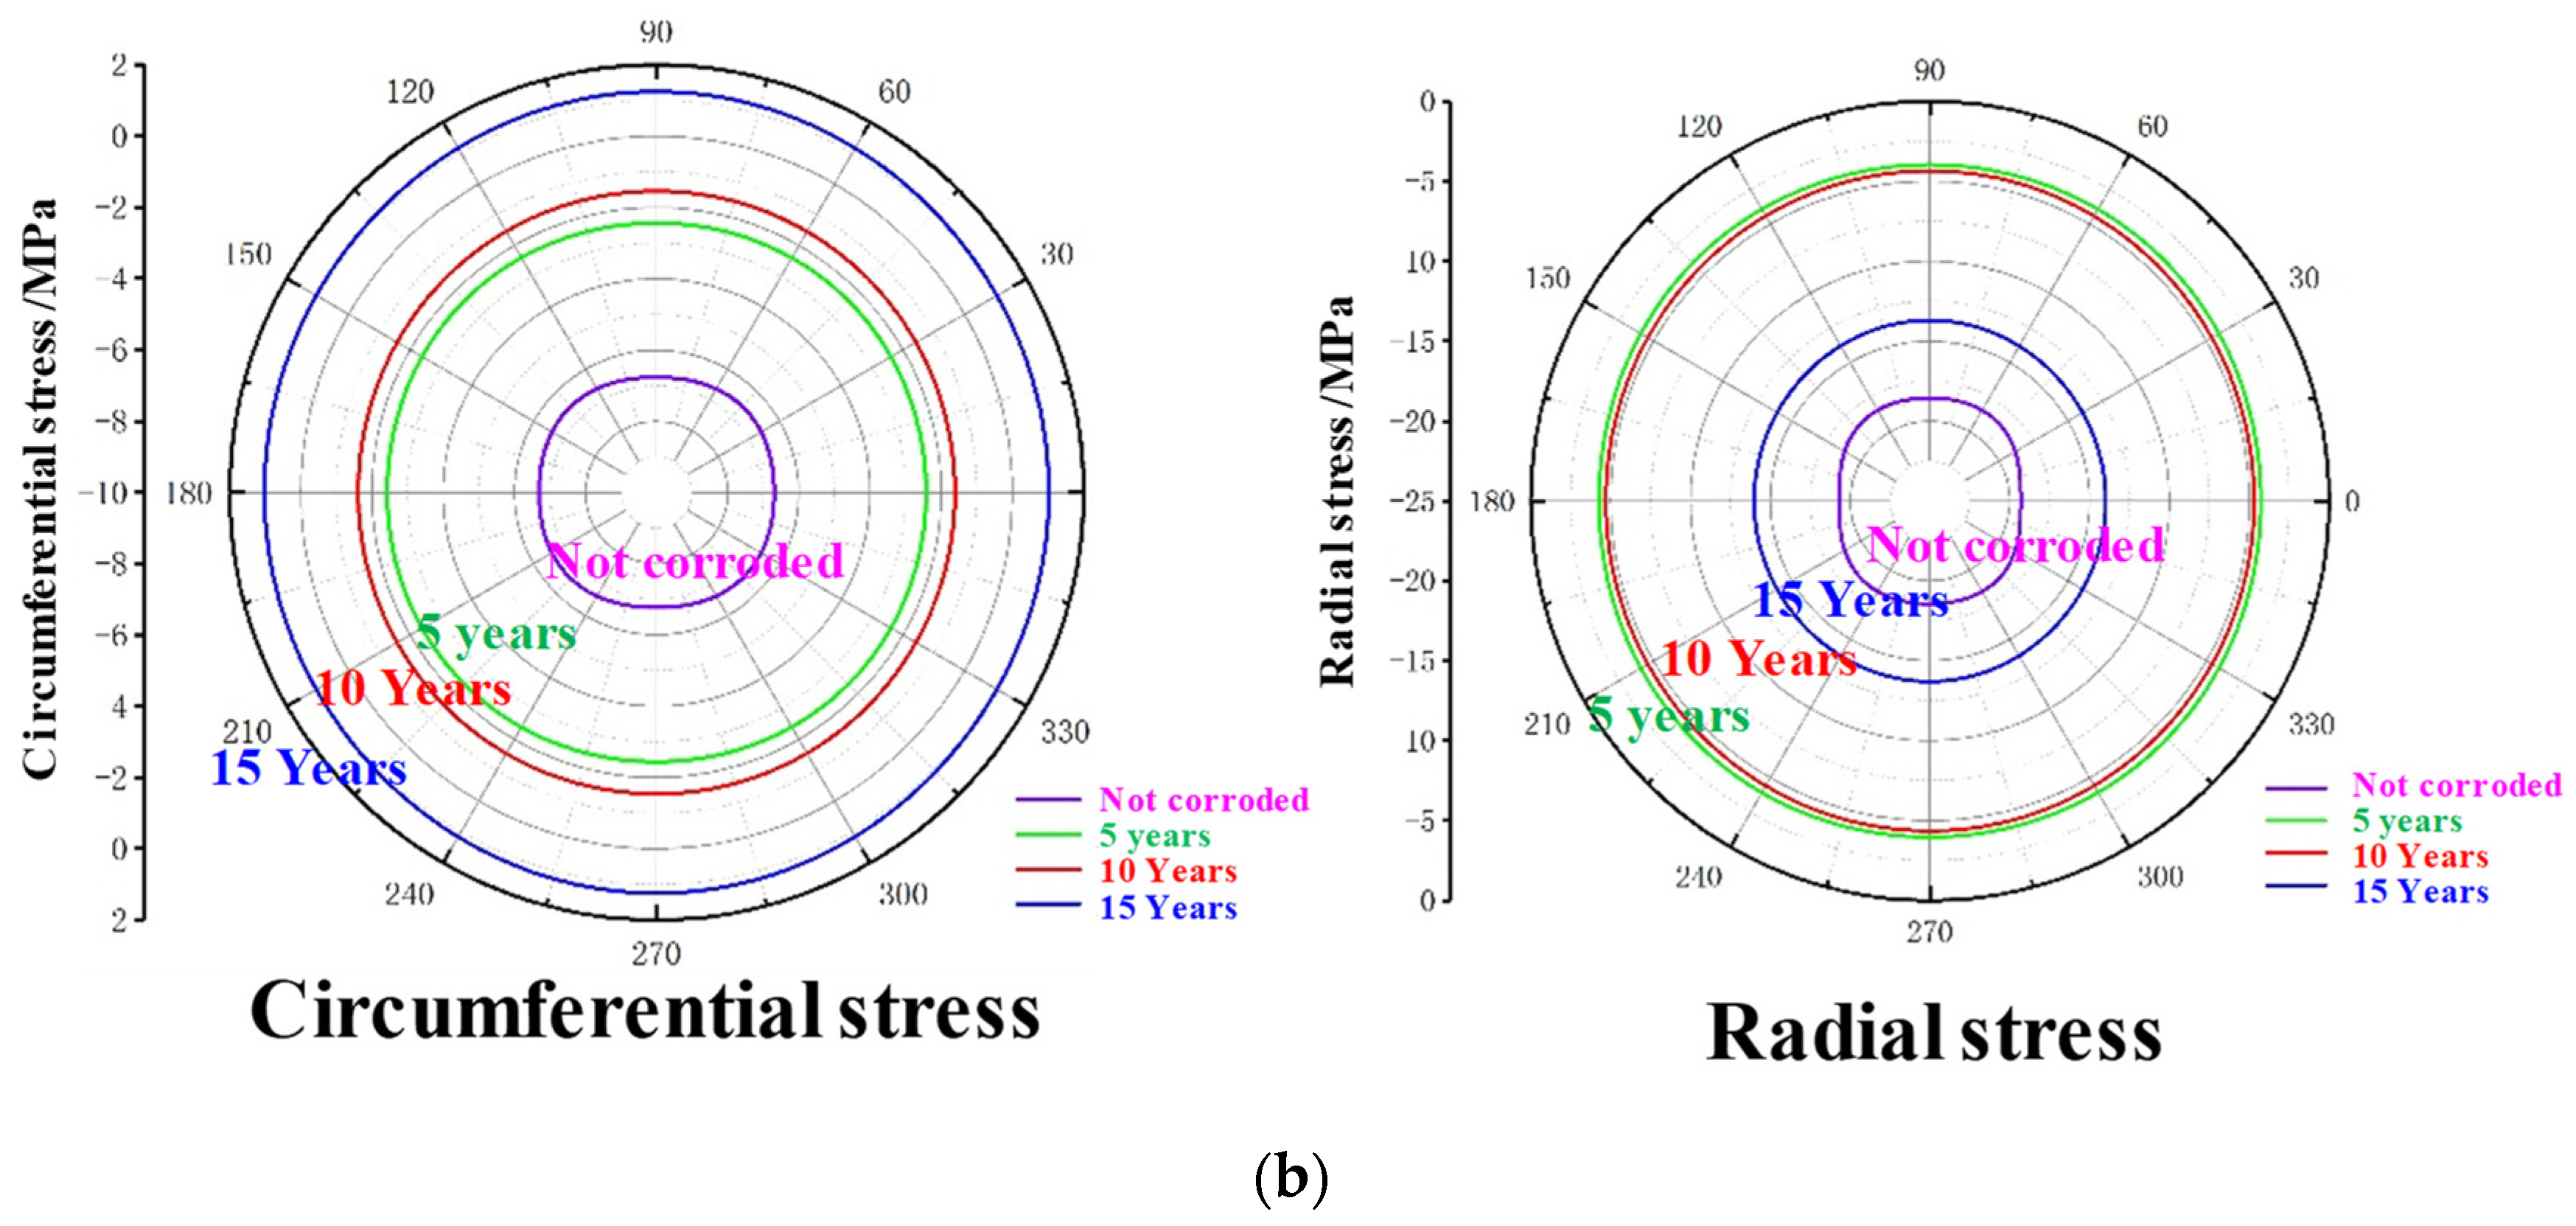
5.2.2. The Mechanical Properties of the Casing and Cement Sheath Vary with the Corrosion Time and the Influence of Stress Distribution on the Assembly
6. Summary
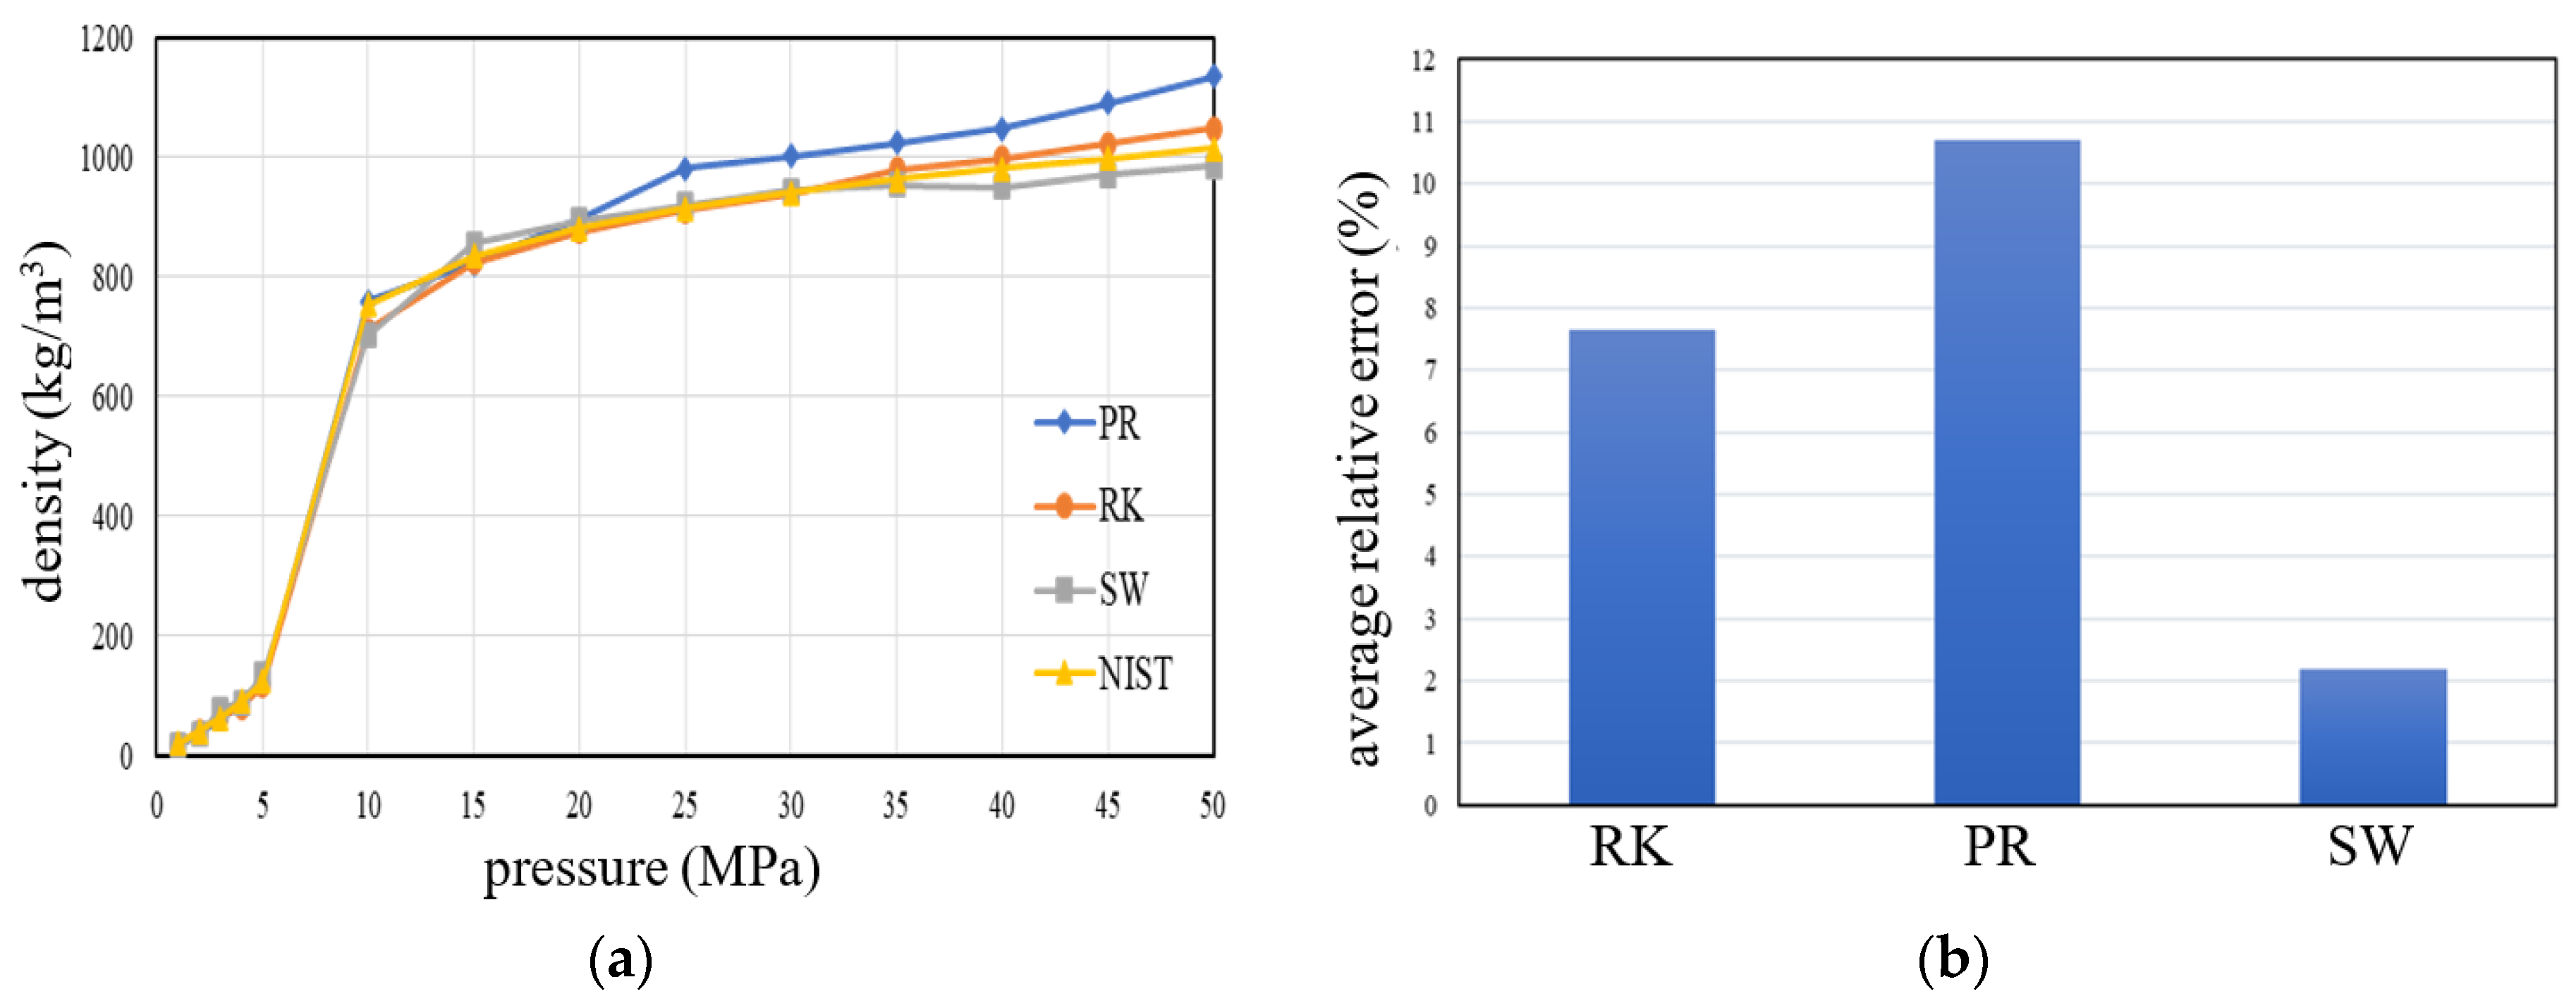
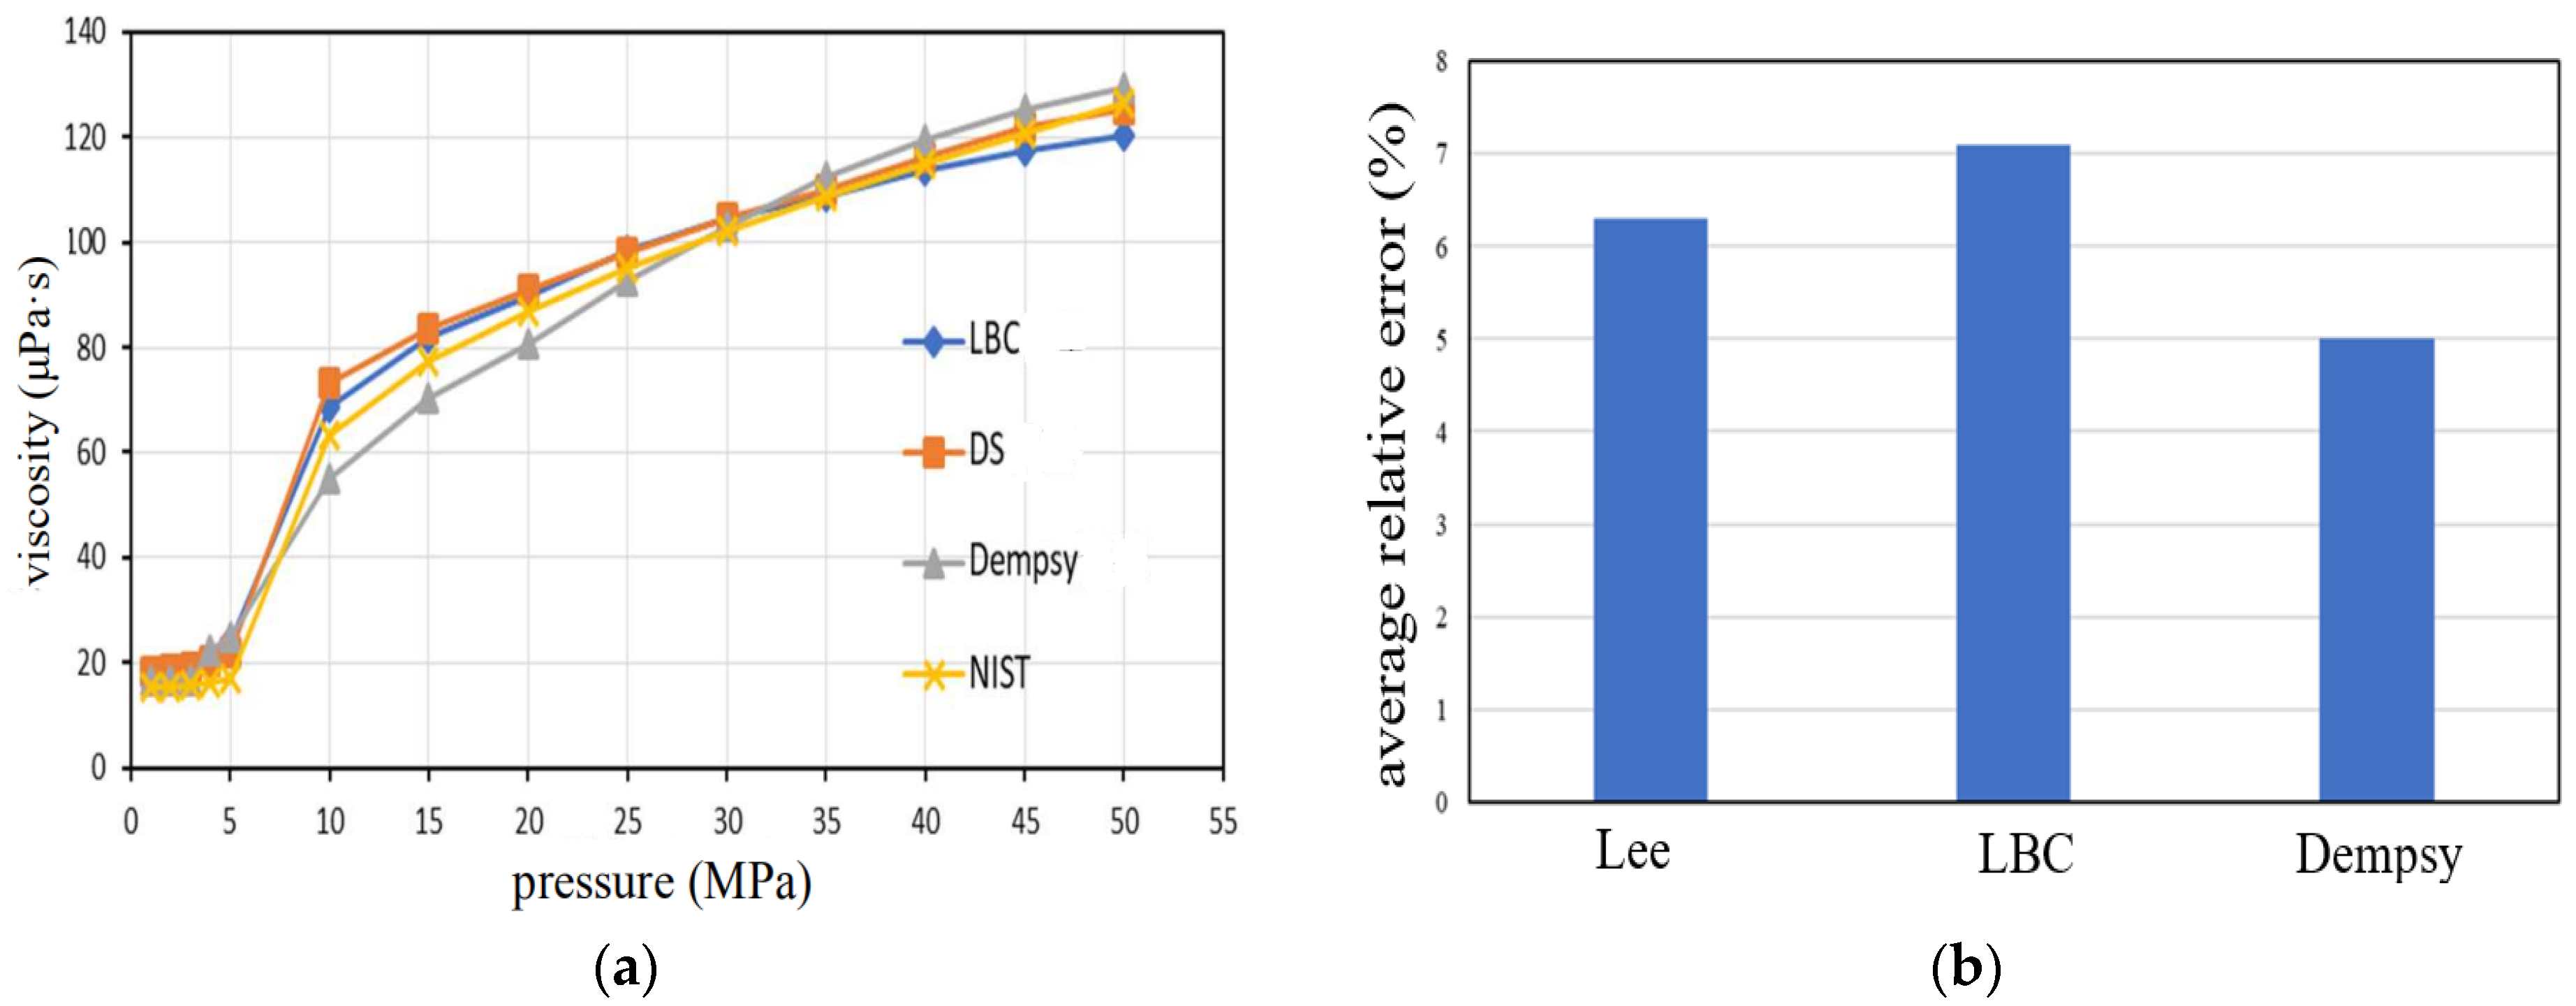
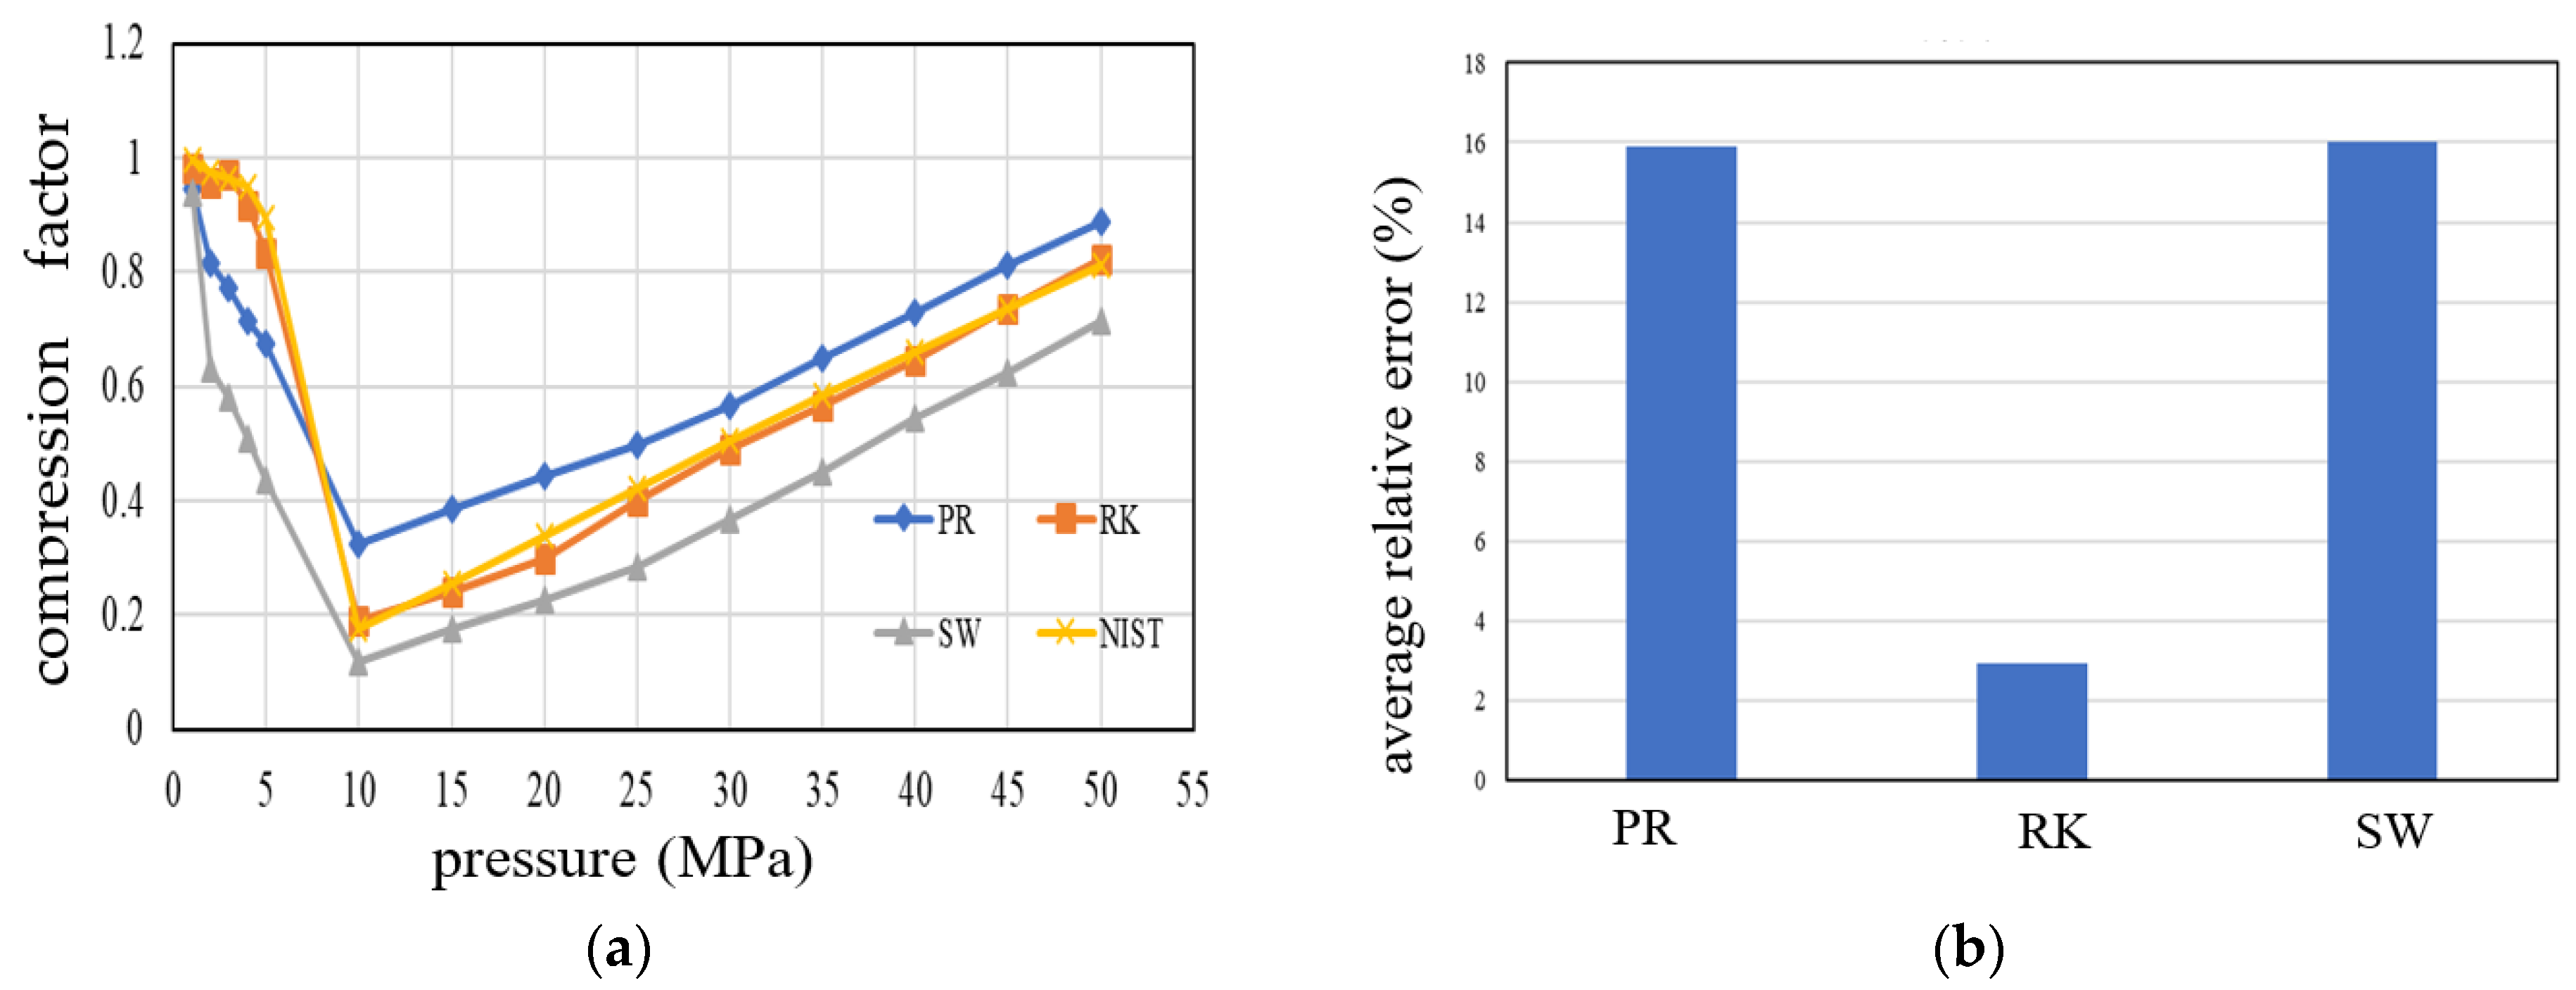
- (1)
- The physical characteristics of CO2 under actual formation conditions are revealed, and the change trend of CO2 density, viscosity, and compression factor along the wellbore is calculated. The density and viscosity show a downward trend along the well depth, while the compression factor shows an upward trend;
- (2)
- The influence of CO2 corrosion on the casing and cement are studied. After corrosion, the casing surface of Q125 and 3Cr has a rough and loose structure, the interface is also loose, and the morphology of 13Cr does not change significantly;
- (3)
- Under the corrosion condition of a CO2 concentration of more than 50%, the corrosion depth of Q125 casing advances linearly with time, and the corrosion rate changes little with the corrosion time. The corrosion depth of the 3Cr and 13Cr casing increases slowly with the extension of corrosion time, and the corrosion rate decreases gradually;
- (4)
- The circumferential stress of the casing increases with the extension of the corrosion time but does not exceed 400 MPa within 10 years of corrosion. The radial stress of the casing and the cement decreases first and then increases with the corrosion time. The compressive strength of the cement sheath does not exceed the compressive strength, and no damage occurs.
Author Contributions
Funding
Data Availability Statement
Conflicts of Interest
References
- Zhang, J.; Mu, L.; Guo, Q.; Cai, Z.; Lu, F.; Jiao, Z. Research on Well Integrity during CO2 Geological Utilization and Storage Based on CT Scanning Technique. In Proceedings of the Carbon Management Technology Conference, Houston, TX, USA, 15–18 July 2019. CMTC-553321-MS. [Google Scholar]
- Amour, F.; Hosseinzadehsadati, S.B.; Hajiabadi, M.R.; Nick, H.M. Shear and vertical deformation behaviour at the field scale during CO2 storage in a depleted chalk reservoir (Danish North Sea). In Proceedings of the 57th US Rock Mechanics/Geomechanics Symposium, Atlanta, GA, USA, 25–28 June 2023. ARMA 23–673. [Google Scholar]
- Lüftenegger, M.; Rath, A.; Smith, M.; Danilko, A. CO2 Injection in a Depleted Gas Field. In Proceedings of the SPE/IATMI Asia Pacific Oil & Gas Conference and Exhibition, Jakarta, Indonesia, 10–12 October 2023. SPE-212589-MS. [Google Scholar]
- Gu, C.; Su, F.; Feng, Y.; Li, X.; Deng, J. Investigation on Radial Crack of Cement Sheath During CO2 Injection Using a TM-XFEM Coupled Model. In Proceedings of the 57th US Rock Mechanics/Geomechanics Symposium, Atlanta, GA, USA, 25–28 June 2023. ARMA 23–525. [Google Scholar]
- Zhang, W.; Liao, W.; Eckert, A.; Ma, H.; Prevallet, A.; Goedde, T.; Wronkiewicz, D.; Meng, M. Wellbore integrity evaluation for CO2 sequestration wells: An integrated experimental, geochemical, and numerical investigation. In Proceedings of the 56th US Rock Mechanics/Geomechanics Symposium, Santa Fe, NM, USA, 26–29 June 2022. ARMA 22–816. [Google Scholar]
- Dian, W.; Jun, L.; Xianbo, L.; Tuo, L.; Penglin, L.; Wei, L. Analysis of cement plug bonding surface integrity in CO2 geological storage. In Proceedings of the 56th US Rock Mechanics/Geomechanics Symposium, Santa Fe, NM, USA, 26–29 June 2022. ARMA 22–213. [Google Scholar]
- Meng, M.; Frash, L.P.; Chen, B.; Welch, N.J.; Li, W.; Carey, J.W. Experimental study of water and CO2 transport along the casing-cement interface. In Proceedings of the 55th US Rock Mechanics/Geomechanics Symposium, Houston, TX, USA, 20–23 June 2021. ARMA 21–1196. [Google Scholar]
- Xie, X.; Edvardsen, L.; Cerasi, P. CO2-induced creep on Draupne shale and impact on cemented wellbore integrity. In Proceedings of the 55th US Rock Mechanics/Geomechanics Symposium, Houston, TX, USA, 20–23 June 2021. ARMA 21–1399. [Google Scholar]
- Wise, J.; Nygaard, R.; Hareland, G. Numerical Analysis of Wellbore Integrity and Cement Sheath Debonding for Wells in the Eugene Island OPD, Gulf of Mexico. In Proceedings of the 53rd US Rock Mechanics/Geomechanics Symposium, New York, NY, USA, 23–26 June 2019. ARMA 19–439. [Google Scholar]
- Wan, T.; Zhang, J.; Dong, Y. The impact of fracture network on CO2 storage in shale oil reservoirs. Geoenergy Sci. Eng. 2023, 231, 212322. [Google Scholar] [CrossRef]
- Sobolik, S.R.; Gomez, S.P.; Matteo, E.N.; Dewers, T.A.; Newell, P.; Stormont, J.C.; Reda Tha, M.M. Geomechanical Modeling to Predict Wellbore Stresses and Strains for the Design of Wellbore Seal Repair Materials for Use at a CO2 Injection Site. In Proceedings of the 49th US Rock Mechanics/Geomechanics Symposium, San Francisco, CA, USA, 28 June–1 July 2015. ARMA 15–290. [Google Scholar]
- Roy, P.; Morris, J.P.; Walsh, S.D.C.; Iyer, J.; Carroll, S. Effect of thermal stress on wellbore integrity during CO2 injection. Int. J. Greenh. Gas Control. 2018, 77, 14–26. [Google Scholar] [CrossRef]
- Kuang, N.-J.; Zhou, J.-P.; Xian, X.-F.; Zhang, C.-P.; Yang, K.; Dong, Z.-Q. Geomechanical risk and mechanism analysis of CO2 sequestration in unconventional coal seams and shale gas reservoirs. Rock Mech. Bull. 2023, 2, 100079. [Google Scholar] [CrossRef]
- Lemaire, P.; Vasilache, M.; Dailey, C.; Ghaderi, A.; Barrabino, A.; Crandall, D.; Moore, J.; Tapriyal, D.; Beckman, E.; Enick, R. Using high pressure solutions of polyfluoroacrylate and CO2 to Seal cement cracks for improved wellbore integrity. Geoenergy Sci. Eng. 2023, 230, 212038. [Google Scholar] [CrossRef]
- Bagheri, M.; Shariatipour, S.M.; Ganjian, E. Parametric study on the integrity of wellbores in CO2 storage sites. Constr. Build. Mater. 2021, 268, 121060. [Google Scholar] [CrossRef]
- Liu, Y.; Liu, Q. Review of gel systems for CO2 geological storage leakage and conformance control for enhanced oil recovery: Mechanisms, recent advances, and future perspectives. J. Nat. Gas Sci. Eng. 2020, 74, 103097. [Google Scholar] [CrossRef]
- Dong, X.; Duan, Z.; Gao, D. Assessment on the cement integrity of CO2 injection wells through a wellbore flow model and stress analysis. J. Nat. Gas Sci. Eng. 2020, 74, 103097. [Google Scholar] [CrossRef]
- Song, Y.; Jun, S.; Na, Y.; Kim, K.; Jang, Y.; Wang, J. Geomechanical challenges during geological CO2 storage: A review. Chem. Eng. J. 2023, 456, 140968. [Google Scholar] [CrossRef]
- Iyer, J.; Lackey, G.; Edvardsen, L.; Bean, A.; Carroll, S.A.; Huerta, N.; Smith, M.M.; Torsaeter, M.; Dilmore, R.M.; Cerasi, P. A Review of Well Integrity Based on Field Experience at Carbon Utilization and Storage Sites. Int. J. Greenh. Gas Control. 2022, 113, 103533. [Google Scholar] [CrossRef]
- Dalla Vecchia, F.; dos Santos, V.H.J.M.; Schütz, M.K.; Ponzi, G.G.D.; e Stepanha, A.S.d.G.; de Fraga Malfatti, C.; da Costa, E.M. Wellbore integrity in a saline aquifer: Experimental steel-cement interface degradation under supercritical CO2 conditions representative of Brazil’s Parana basin. Int. J. Greenh. Gas Control. 2020, 98, 103077. [Google Scholar] [CrossRef]
- Gao, D.; Dou, H.; Dong, X. Research progress in wellbore cement sheath integrity under conditions of CO2 injection and storage. J. Yan’an Univ. Nat. Sci. Ed. 2022, 41, 1–9. [Google Scholar]
- Feng, Y.; Wang, Y.; Zhang, H.; Cui, C.; Huang, F.; Yuan, B. Influence of Wellbore Temperature Variation on Cement Ring Seal Integrity in CO2-EOR Wells. Sci. Technol. Innov. 2022, 31, 5–8. [Google Scholar]
- Lian, L.; Qin, J.; Yang, S.; Yang, Y.; Li, S.; Chen, X. An improved viscosity model for CO2-crude system. Pet. Explor. Dev. 2014, 41, 648–653. [Google Scholar] [CrossRef]
- Bertini, M.; Fiaschi, D.; Manfrida, G.; Niknam, P.H.; Talluri, L. Evaluation of the property methods for pure and mixture of CO2 for power cycles analysis. Energy Convers. Manag. 2021, 245, 114568. [Google Scholar] [CrossRef]


| Inner Diameter of Casing/Mm | Inner Diameter of Cement Ring/mm | Infinite Stratum | |
|---|---|---|---|
| Inner Diameter/mm | External Diameter/mm | ||
| 118.6 | 139.7 | 215.9 | 1000 |
| Name | Casing | Cement | Stratum |
|---|---|---|---|
| elastic modulus/GPa | 210 | 6 | 20 |
| Poisson’s ratio | 0.3 | 0.2 | 0.25 |
| triaxial stress | σH | σh | σv |
| 60 MPa | 50 MPa | 54.8 MPa |
Disclaimer/Publisher’s Note: The statements, opinions and data contained in all publications are solely those of the individual author(s) and contributor(s) and not of MDPI and/or the editor(s). MDPI and/or the editor(s) disclaim responsibility for any injury to people or property resulting from any ideas, methods, instructions or products referred to in the content. |
© 2024 by the authors. Licensee MDPI, Basel, Switzerland. This article is an open access article distributed under the terms and conditions of the Creative Commons Attribution (CC BY) license (https://creativecommons.org/licenses/by/4.0/).
Share and Cite
Cai, M.; Li, J.; Ma, W.; Zhang, N.; Wang, P.; Zhang, X.; Yang, S.; Cao, J. The Influence of CO2 Physical Properties on Casing and Its Prediction Method. Processes 2024, 12, 768. https://doi.org/10.3390/pr12040768
Cai M, Li J, Ma W, Zhang N, Wang P, Zhang X, Yang S, Cao J. The Influence of CO2 Physical Properties on Casing and Its Prediction Method. Processes. 2024; 12(4):768. https://doi.org/10.3390/pr12040768
Chicago/Turabian StyleCai, Meng, Junliang Li, Wenhai Ma, Nan Zhang, Peng Wang, Xiaochuan Zhang, Shangyu Yang, and Jing Cao. 2024. "The Influence of CO2 Physical Properties on Casing and Its Prediction Method" Processes 12, no. 4: 768. https://doi.org/10.3390/pr12040768