Article

Preparation, Characterization, and Scattering Characteristics of Mixed Aerosol of Fly Ash and Ammonium Sulfate

1
College of Materials and Environmental Engineering, Hangzhou Dianzi University, Hangzhou 310018, China
2
Institute of Energy, Department of Physics, Hangzhou Dianzi University, Hangzhou 310018, China
*
Authors to whom correspondence should be addressed.
Processes 2024, 12(4), 769; https://doi.org/10.3390/pr12040769
Submission received: 14 March 2024 / Revised: 31 March 2024 / Accepted: 5 April 2024 / Published: 11 April 2024
(This article belongs to the Section Chemical Processes and Systems)

Abstract

:
The mixed aerosols formed by fly ash and ammonium sulfate have a vital impact on the scattering characteristics of the atmosphere. This paper proposes to investigate the scattering characteristics of an individual optically levitated mixed aerosol of fly ash and ammonium sulfate using a coupled laser levitation and scattering measuring apparatus. The mixed aerosols were first prepared and characterized by multiple techniques. The results demonstrated that mixed aerosol particles completely encapsulated ammonium sulfate crystals on the rough porous surface of fly ash, resembling the “core-shell” structure. Moreover, the surface formed columnar ammonium sulfate crystals that exhibit the highest regularity when the solid mass concentration of fly ash was 1000 mg/L. The scattering intensity of mixed aerosols was measured, and the comparisons among fly ash aerosol and mixed aerosols were made to evaluate the effect of fly ash concentration on scattering. The measurements demonstrated that the mixed aerosols exhibited a lower overall scattering intensity compared to fly ash alone. The higher regularity of ammonium sulfate crystals formed on the surface of mixed aerosols at different solid mass concentrations of fly ash corresponds to higher scattering intensity. These findings will be helpful for recognizing the scattering characteristics of real atmospheric aerosols in depth.

1. Introduction

Aerosols, a mixture of solid or liquid particles and gases suspended in the air, play a pivotal role in atmospheric visibility due to their scattering and absorption of sunlight. Their radiative effects also alter Earth’s energy balance, influencing climate [1]. Therefore, understanding the optical properties of aerosols is crucial for assessing climate and environmental impacts, and it has become a topic that garnered significant attention across various fields, including atmospheric science, climate studies, and atmospheric laser transmission [2,3].
Carbonaceous aerosols like fly ash have pronounced absorption in the visible and near-infrared spectrum [4]. In particular, carbonaceous aerosols easily form mixed aerosols that interact with the water-soluble ammonium sulfate and ammonium nitrate aerosols. It results in noticeable variations in the optical characteristics of aerosol particles and significantly affects both the environment and the climate.
Research on the scattering properties of aerosols with mixed-phase compositions currently relies mostly on substrate-supported measurements [5,6] or single numerical simulation analyses [7,8,9]. While these methods provide a reliable theoretical basis for studying the scattering properties of multi-component aerosols, accurately simulating the evolving environment of suspended aerosol particles in actual atmospheres poses a challenge. Additionally, substrate measurements are susceptible to external interferences, such as slides and probes. Some scholars have also investigated the optical properties of mixed aerosols in ambient air. For instance, Miriam et al. [10] employed cavity ring-down aerosol extinction spectroscopy (CRD-AES) to measure the optical properties of internally mixed aerosol particles composed of dicarboxylic acid and ammonium sulfate at a wavelength of 532 nm. This technique allows researchers to determine the refractive index of a given mixture by comparing experimentally measured extinction with predictions from Mie scattering theory. Furthermore, Malm et al. [11] explored the light scattering characteristics of aerosols in the southeastern region of the United States as a function of relative humidity using an integrating nephelometer. They compared the impacts of different aerosol components on visibility through various mixed structure theoretical models and experimental data. However, it is important to note that these studies may have pre-selected aerosol particle sizes, and the measurement or calculation methods used essentially provide averages of the optical properties of aerosol particles within the sample. This could potentially affect the accuracy of the experimental results.
In the current study, the integration of optical tweezers technology has proven invaluable for manipulating individual aerosol particles in gas-phase environments. For example, some researchers have used optical trapping in combination with a simple elastic scattering measurement device to measure the size and coagulation of sodium chloride aerosol particles [12]. The authors measured the backward scattering light from polystyrene beads and deduced the radius and new empirical constants of the wavelength dispersion of the refractive index in the air [13]. It is worthy to note that the studies mentioned in the literature mainly focus on single aerosol droplets or transparent particles. There are relatively fewer studies on opaque solid aerosol particles and heterogeneous particles like fly ash and soot.
Therefore, to deeply understand the influence of ammonium sulfate on the surface of fly ash and recognize the corresponding scattering characteristics of mixed aerosols of fly ash and ammonium sulfate, in this study, the scattering characteristics of mixed aerosols and lonely fly ash particles were investigated in detail. Firstly, the mixed aerosol particles of fly ash and ammonium sulfate were prepared with fly ash solid mass concentration of 500, 1000, 1500, 2000, and 2500 mg·L−1, respectively. Secondly, the as-prepared mixed aerosol particles were characterized using scanning electron microscopy (SEM), energy-dispersive X-ray spectroscopy (EDS), X-ray diffraction (XRD), and Fourier infrared spectrometer (FTIR). Finally, the scattering intensity of individual lonely fly ash and mixed aerosol particles at the scattering angle of ~0° was measured by using self-built coupled laser levitation and particle scattering apparatus, and the scattering characteristics of mixed aerosols were discussed in depth.

2. Materials and Experimental Methods

2.1. Materials

The original fly ash used in this study was obtained from a coal-fired power plant in Hangzhou, China, with the specific parameters tested by multiple instruments listed in Table 1. The particle size distribution (mass fraction) of the sieved fly ash was determined and is presented in Figure 1. The sum of particles larger than 125 μm and those smaller than 37.5 μm was less than 5%, with the mass fraction of particles in the 37.5–75 μm size range accounting for approximately 75%. Ammonium sulfate ((NH4)2SO4, molecular weight: 132.14) and anhydrous ethanol (C2H5OH, molecular weight: 46.07) used in the experiment were analytically pure and were purchased from Hangzhou Mike Chemical Instrument Co., Ltd., Hangzhou, China.

2.2. Sample Preparation

The procedure for preparing the mixed aerosols of fly ash and ammonium sulfate used in the scattering measurement experiments, as well as the control group consisting of ammonium sulfate crystals, is outlined below: (1) Weigh 246 g of ammonium sulfate and dissolve it thoroughly in 500 mL of deionized water to obtain a solution with a mass fraction of ~33% (NH4)2SO4. (2) Take five portions of 100 mL each from the above solution. Add 0.05, 0.10, 0.15, 0.20, and 0.25 g of fly ash particles separately. This results in solid concentrations of fly ash in the (NH4)2SO4 solution of 500, 1000, 1500, 2000, and 2500 mg/L, respectively. Mix the solutions thoroughly using an ultrasonic oscillator for 20 min. (3) Filter the mixed solutions using a vacuum filtration apparatus (SHZ-D, Shanghai Lichen Technology, China). Place the filter cake on a tray and dry it in an electric blast oven at 105 °C for 1 h to obtain the solid powder, which constitutes the mixed aerosol particles. (4) For the pure ammonium sulfate crystals, accelerate the crystallization reaction by heating. Place the prepared 33% (NH4)2SO4 solution in a water bath on a heat-collecting constant-temperature magnetic stirrer (DF-101S, Yuhua, Gongyi City, China) heated to 70 °C. When a large number of crystals precipitate, turn off the water bath and cool for 4 h to obtain the concentrated solution. Filter the solution with a vacuum filtration apparatus and wash the filter cake with anhydrous ethanol several times. Finally, dry the solid crystals in an electric blast drying oven at 105 °C for 1 h. The specific parameters for sample preparation are provided in Table 2, where Sample 1 represents pure ammonium sulfate crystals, and Samples 2–6 represent the mixed aerosol particles with different concentrations of fly ash.

2.3. Material Characterization

The morphology and microstructure of fly ash and mixed aerosols were characterized and analyzed using a SEM-EDS (Zeiss Sigma 300 from Oberkochen, Germany, supplied by Carl Zeiss AG; and Oxford Xplore 50 from Shanghai, China, supplied by Oxford Instruments (Shanghai) Co., Ltd.), following the specific procedures outlined below: A minute amount of the sample was directly adhered to conductive adhesive, and a gold coating was applied for 45 s using a Quorum SC7620 (from Sacramento, CA, USA, supplied by Quorum Technologies) sputter coater at 10 mA. Subsequently, the samples were examined using a scanning electron microscope for morphological imaging and energy spectrum mapping. The acceleration voltage during morphology imaging was set to 3 kV, while during energy spectrum mapping, it was set to 15 kV, with a SE2 secondary electron detector.
XRD tests were performed on fly ash and mixed aerosols using a Thermo ARL SCINTAG X’TRA X-ray diffractometer (CuKα radiation, λ = 0.154056 nm) at 40 kV within a 2θ range of 10–80°, sourced from Waltham, USA and supplied by Thermo Fisher Scientific. The continuous scanning speed was 2 °/min. The obtained diffraction spectra were characterized and analyzed for phase retrieval and feature peak analysis using MDI Jade 6 software.
Functional group information for fly ash and mixed aerosols was characterized and analyzed using an FTIR (Nicolet iS20 from Waltham, MA, USA, supplied by Thermo Fisher Scientific.) under dry conditions. A suitable quantity of the sample and dried potassium bromide powder was added to a mortar, thoroughly ground, and then pressed into a transparent thin sheet using a press (pressing into a transparent thin sheet). During testing, the background was first collected, followed by the infrared spectrum of the sample, with a resolution of 4 cm−1, 32 scans, and a wave-number range of 650–4000 cm−1.

2.4. Laser Levitation and Scattering Measurement System

The apparatus of coupled laser levitation and scattering measurement system has been described in our previous work [15], including laser levitation part and scattering measurement part. The first part can provide two counter-propagating Bessel beams by integrating laser (532 nm), conical lens, half-wave plate, polarizing beam splitter, convex lens, microscopic objective (50×) components, etc., to form an optical trap and stably levitate the fly ash aerosol and mixed aerosol particles. A high-speed camera with a magnifying objective lens (20×) was used to record the images of aerosol particles, and a lamp was installed to illuminate the view field for imaging. The second part mainly focuses on receiving and processing the scattering signal by constructing laser (650 nm), reflective mirror, lensed-fiber, photomultiplier tube, data acquisition components, etc.
When conducting scattering measurement experiments, the initial step involved adjusting the position and angle of the levitation chamber and the fiber probe to ensure that the lensed fiber can adequately receive the scattering signals. Once the levitation laser is activated, gently disturb the particles at the bottom of the levitation chamber using a pipette tip. Subsequently, seal the levitation chamber and let it stand by. As the particles are stably levitated in the chamber, turn on the scattering laser and record the scattering signals from the levitated particles.

2.5. Levitation Stability Data Processing Method

Owing to the thermal Brownian motion of molecules in the gas and potential instabilities in the levitation laser beam, such as fluctuations in light intensity or changes in phase, particles are not entirely stable at a fixed position in the levitated state. To gain a deeper understanding of the fluctuation characteristics of levitated particles, the relative instability of the particle center of mass is calculated as a measure of its stability. The calculation formula is as follows:
D p = 4 S p L p
R I = L m a x D p
Here, D p represents the particle’s equivalent diameter, S p and L p denote the particle’s area and perimeter, respectively, and L m a x signifies the maximum distance traveled by the particle’s centroid. The specific calculation method is as follows: Firstly, high-speed cameras capture video footage of particle fluctuations in a direction perpendicular to the optical axis. After converting it into image format, cropping, binarization, contour extraction, and graphic filling, etc., are performed. Secondly, particle features are extracted from the processed images, including the area ( S p ), perimeter ( L p ), and centroid coordinates. Finally, by calibration, the particle’s equivalent diameter and centroid motion displacement are calculated. The maximum distance of centroid displacement is then divided by the particle’s equivalent diameter to calculate the relative instability (RI). A smaller RI indicates less positional variation during particle motion, suggesting higher stability. Conversely, a larger value indicates greater particle fluctuation and lower stability.

2.6. Scattering Signal Processing Methods

The PMT is exceptionally sensitive to optical signals. Consequently, subtle deviations in the lensed-fiber probe may lead to variations in background values in the measurement results. Therefore, in this work, a normalized treatment is executed to ensure the comparability among the scattering signals. The normalized amplitude of scattering signal intensity (A*) can be expressed as follows:
A * = A i A m i n A m a x A m i n
in which A i is the measured signal intensity, and Amax and Amin is the maximum and minimum measured signal intensity, respectively.

3. Results and Discussion

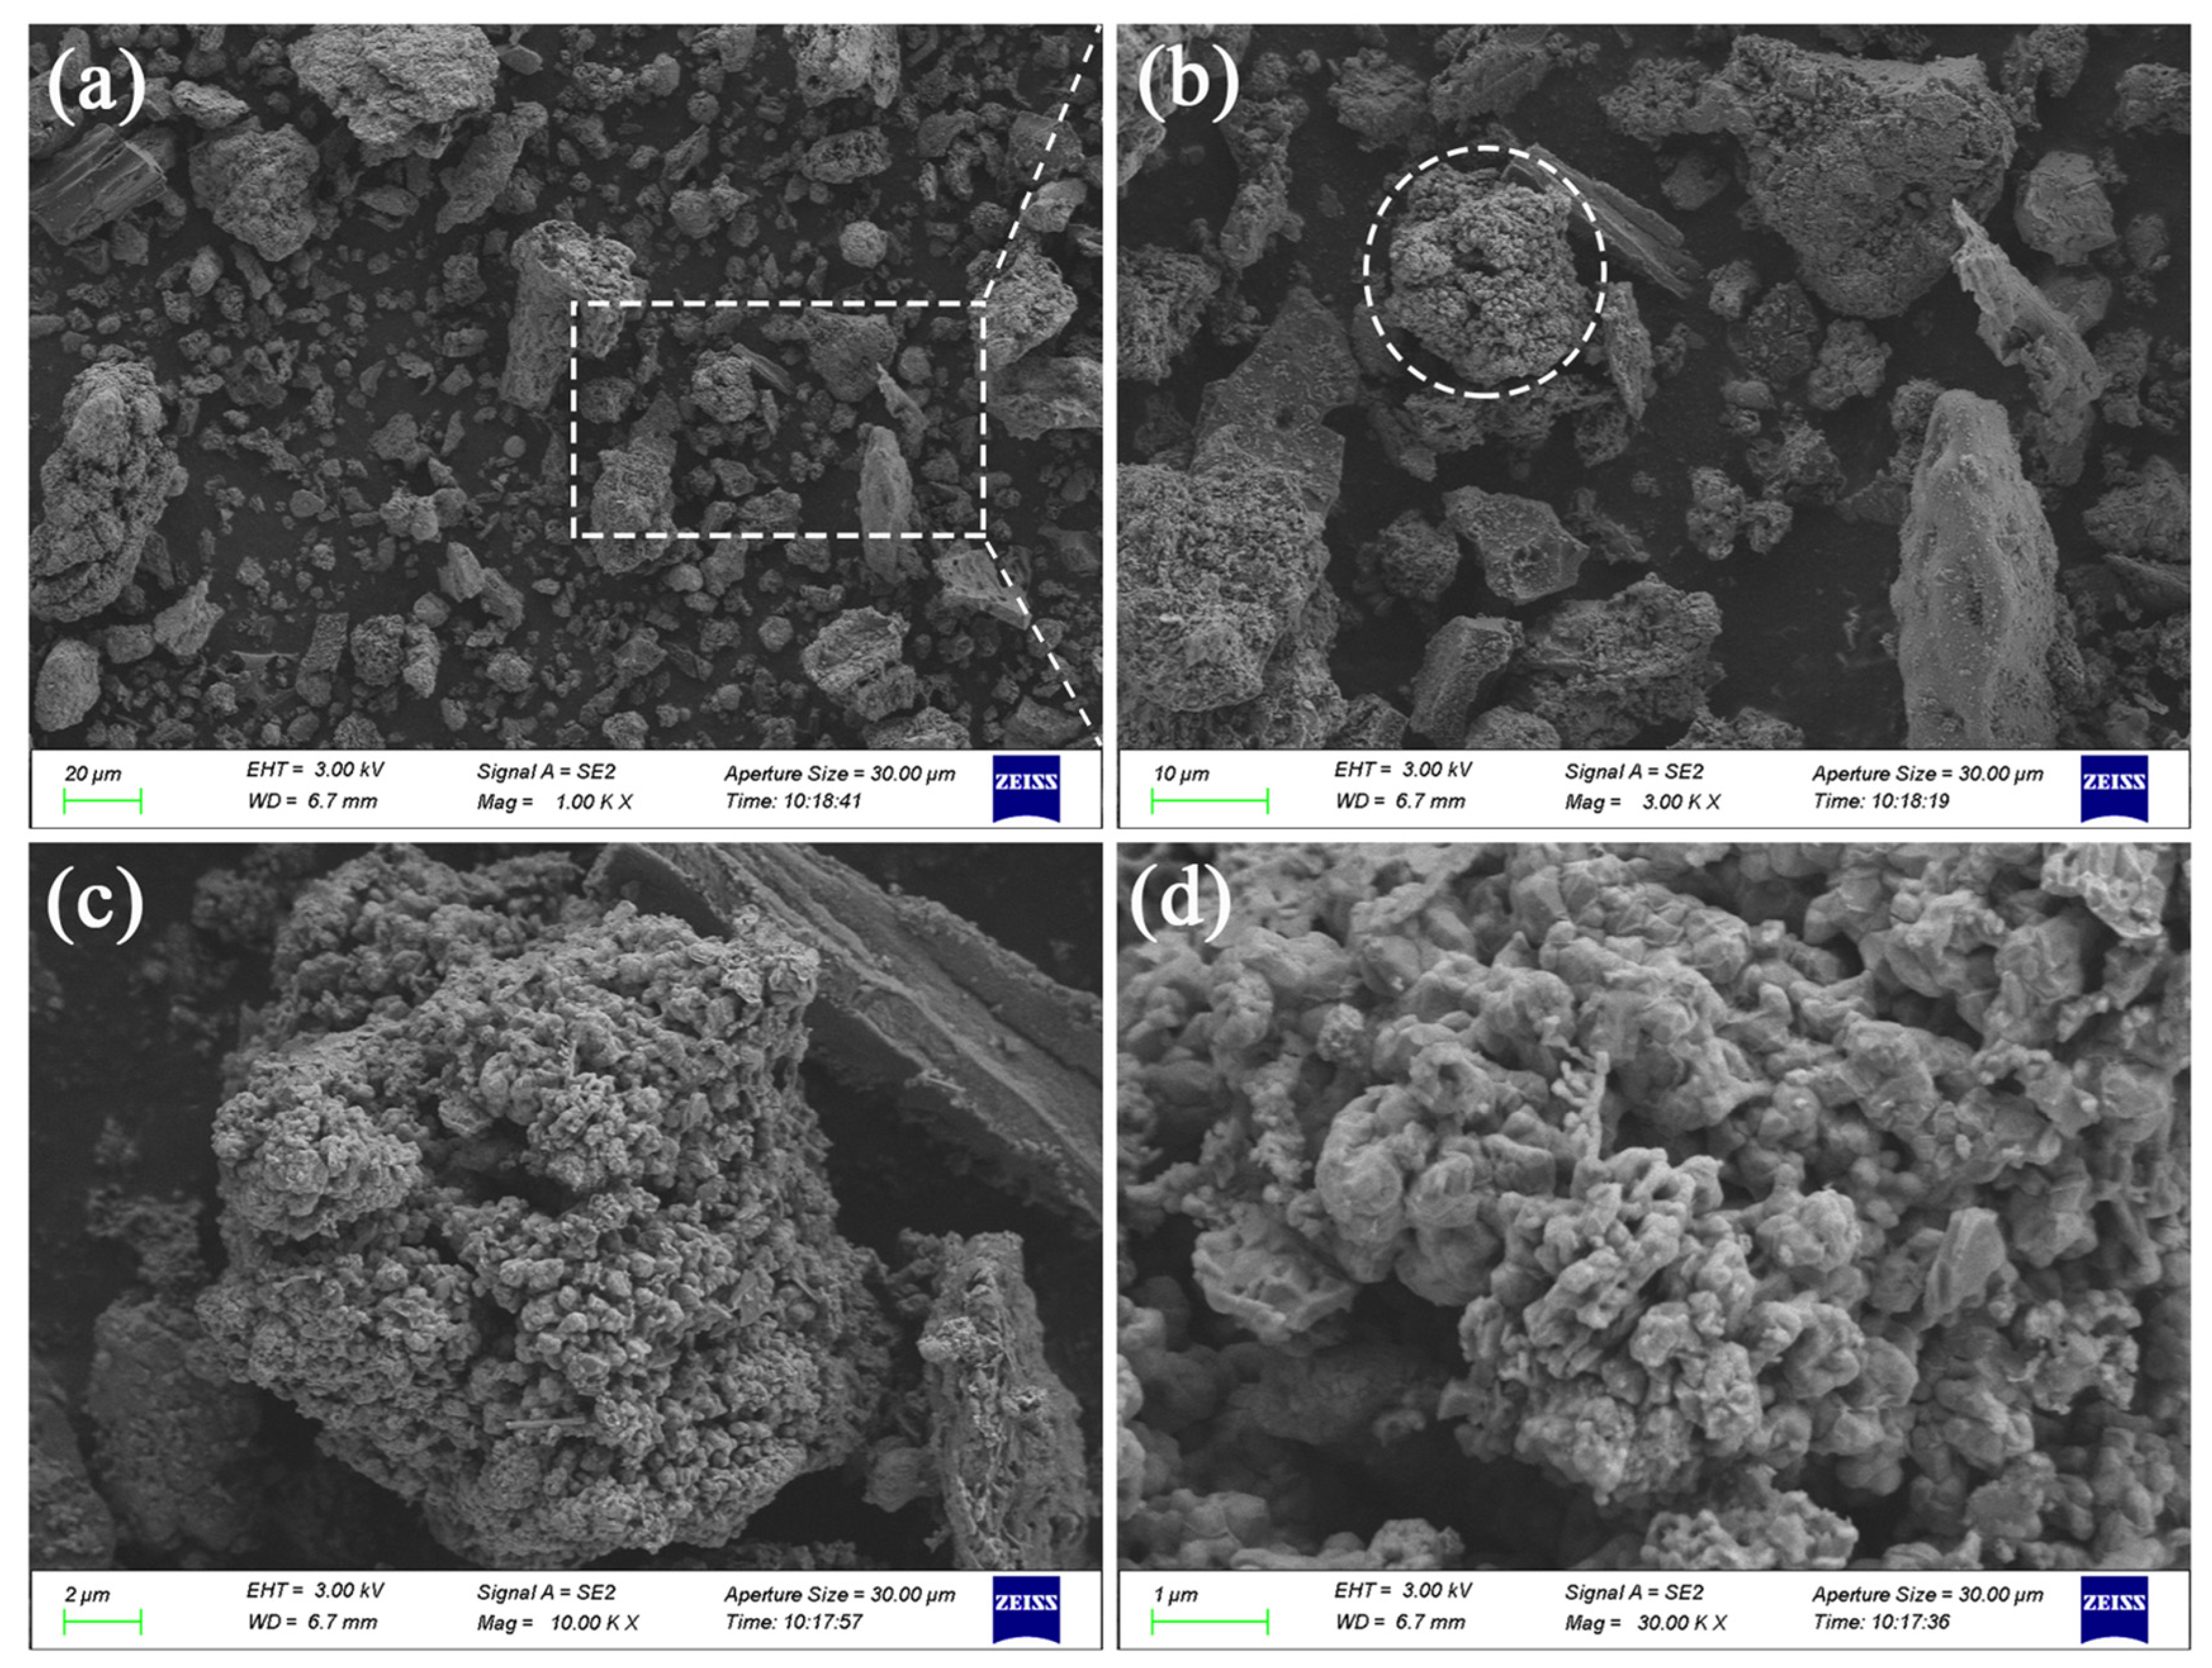
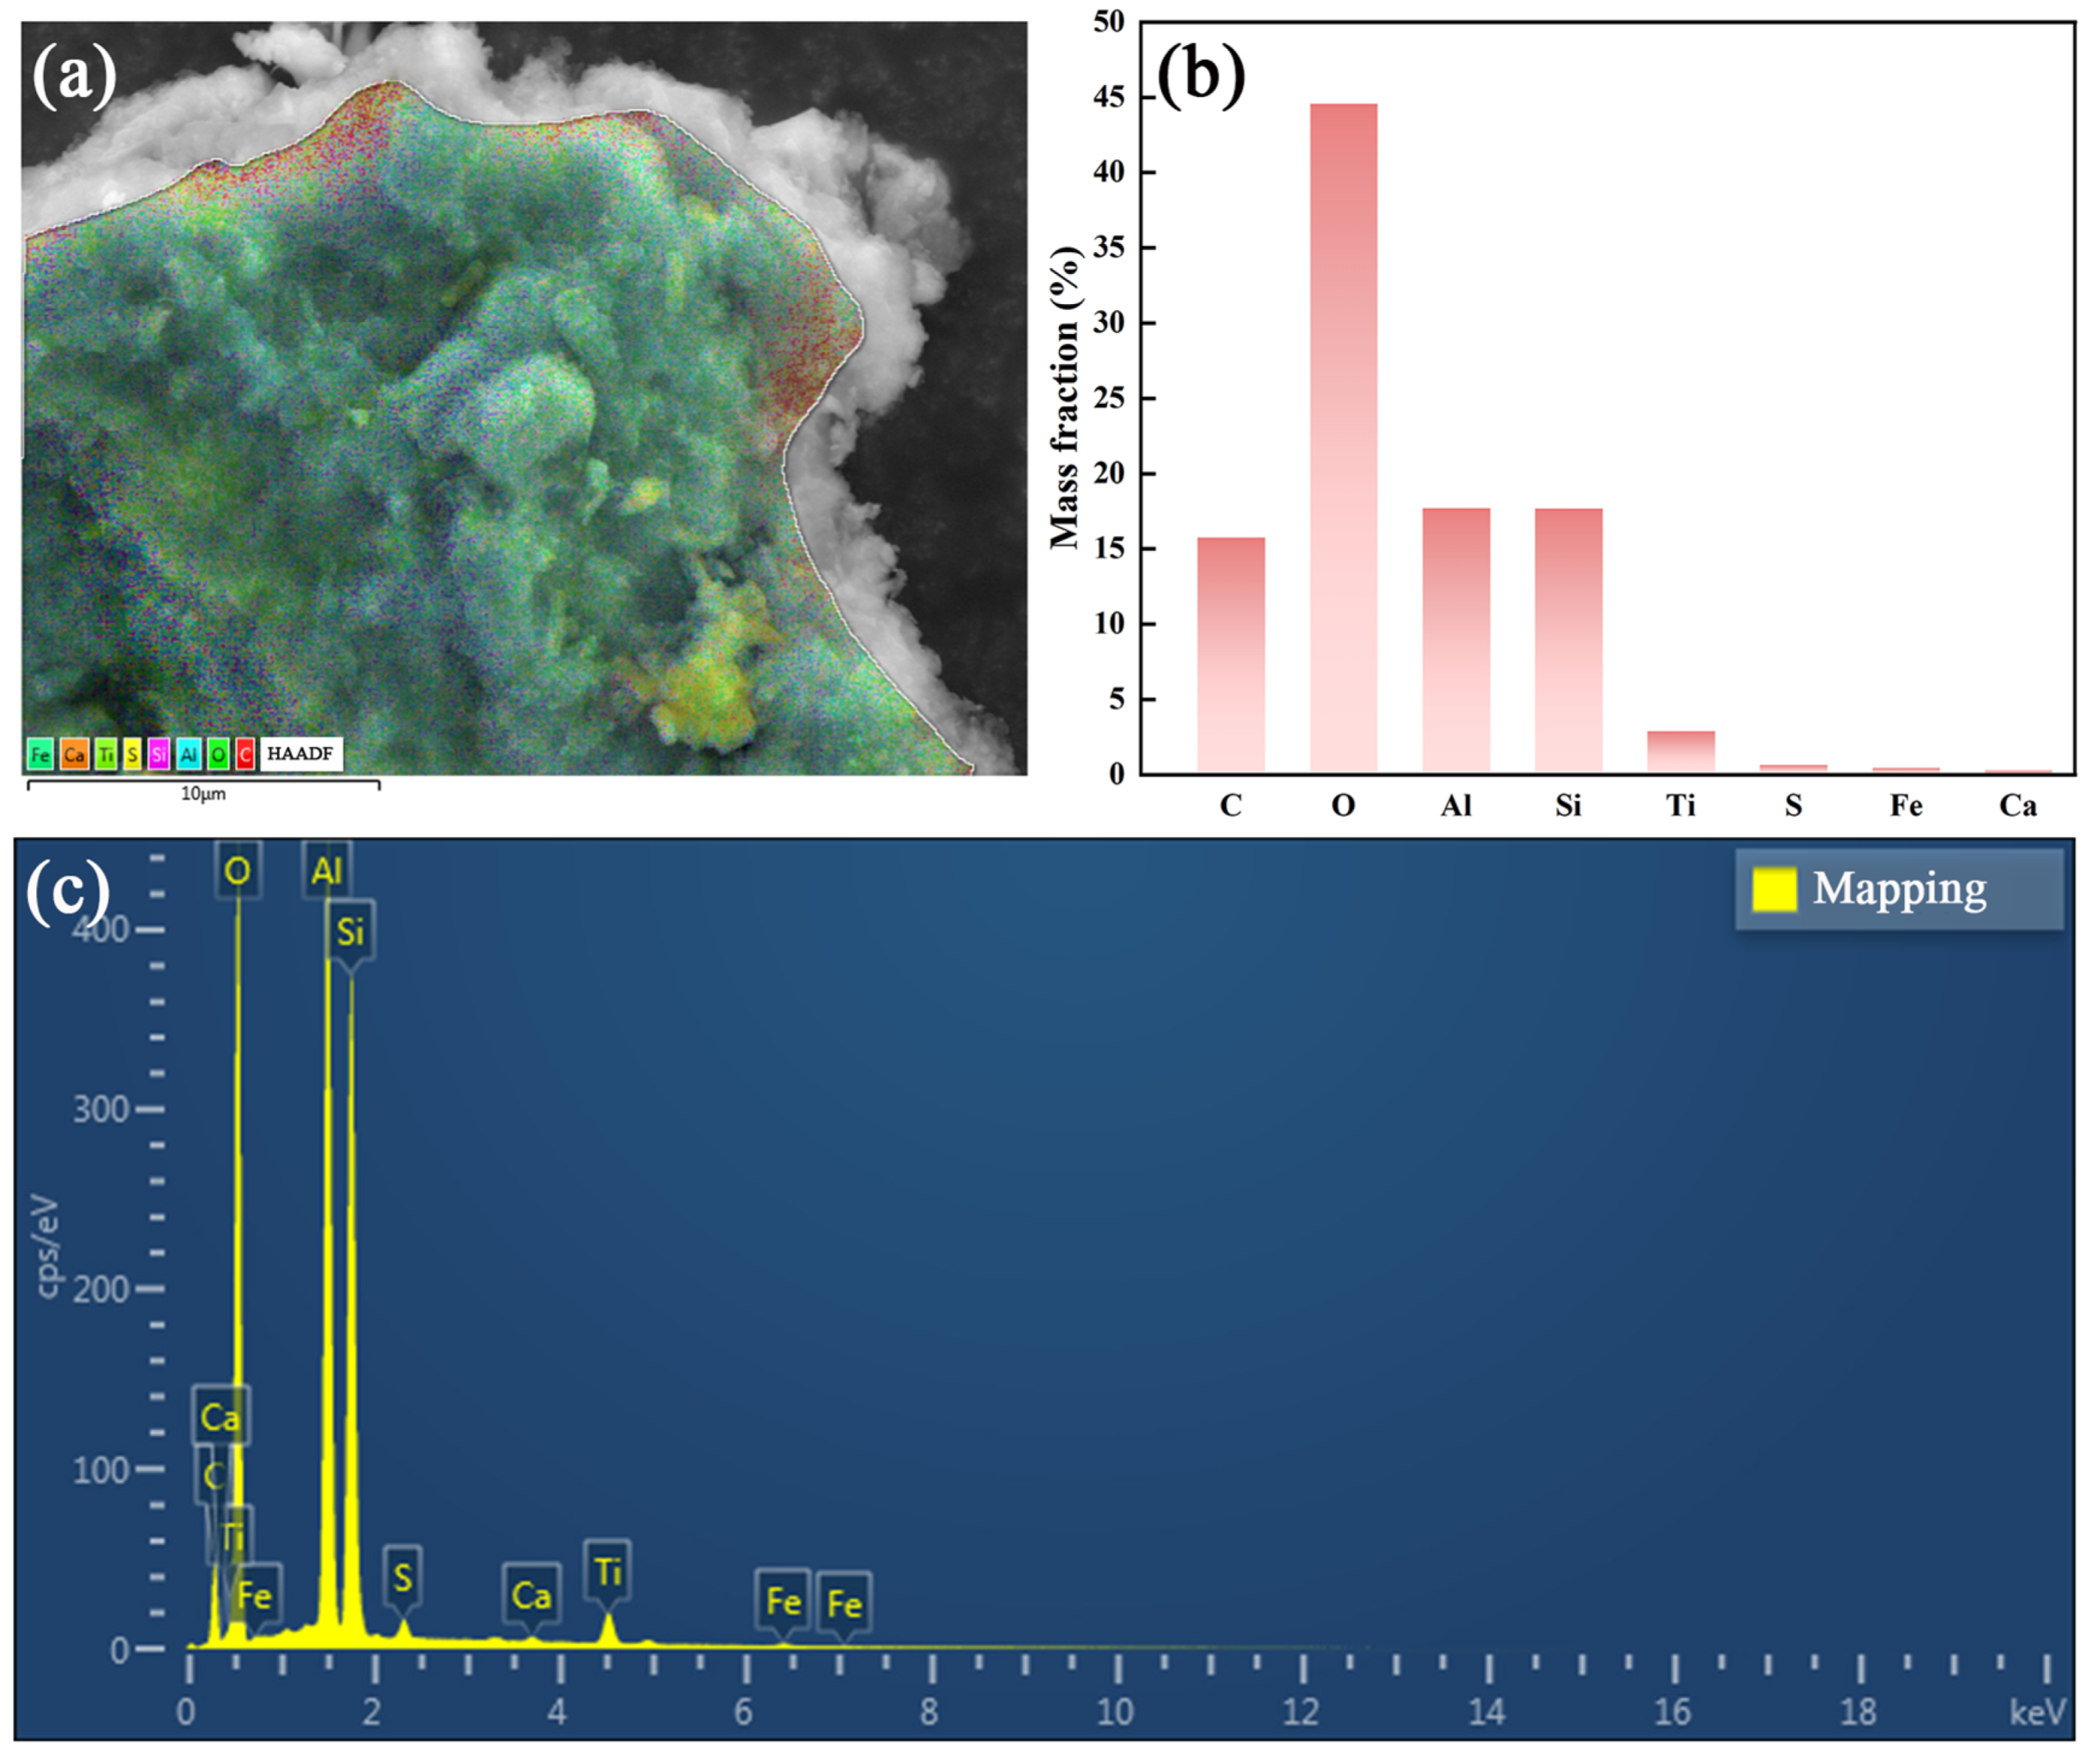
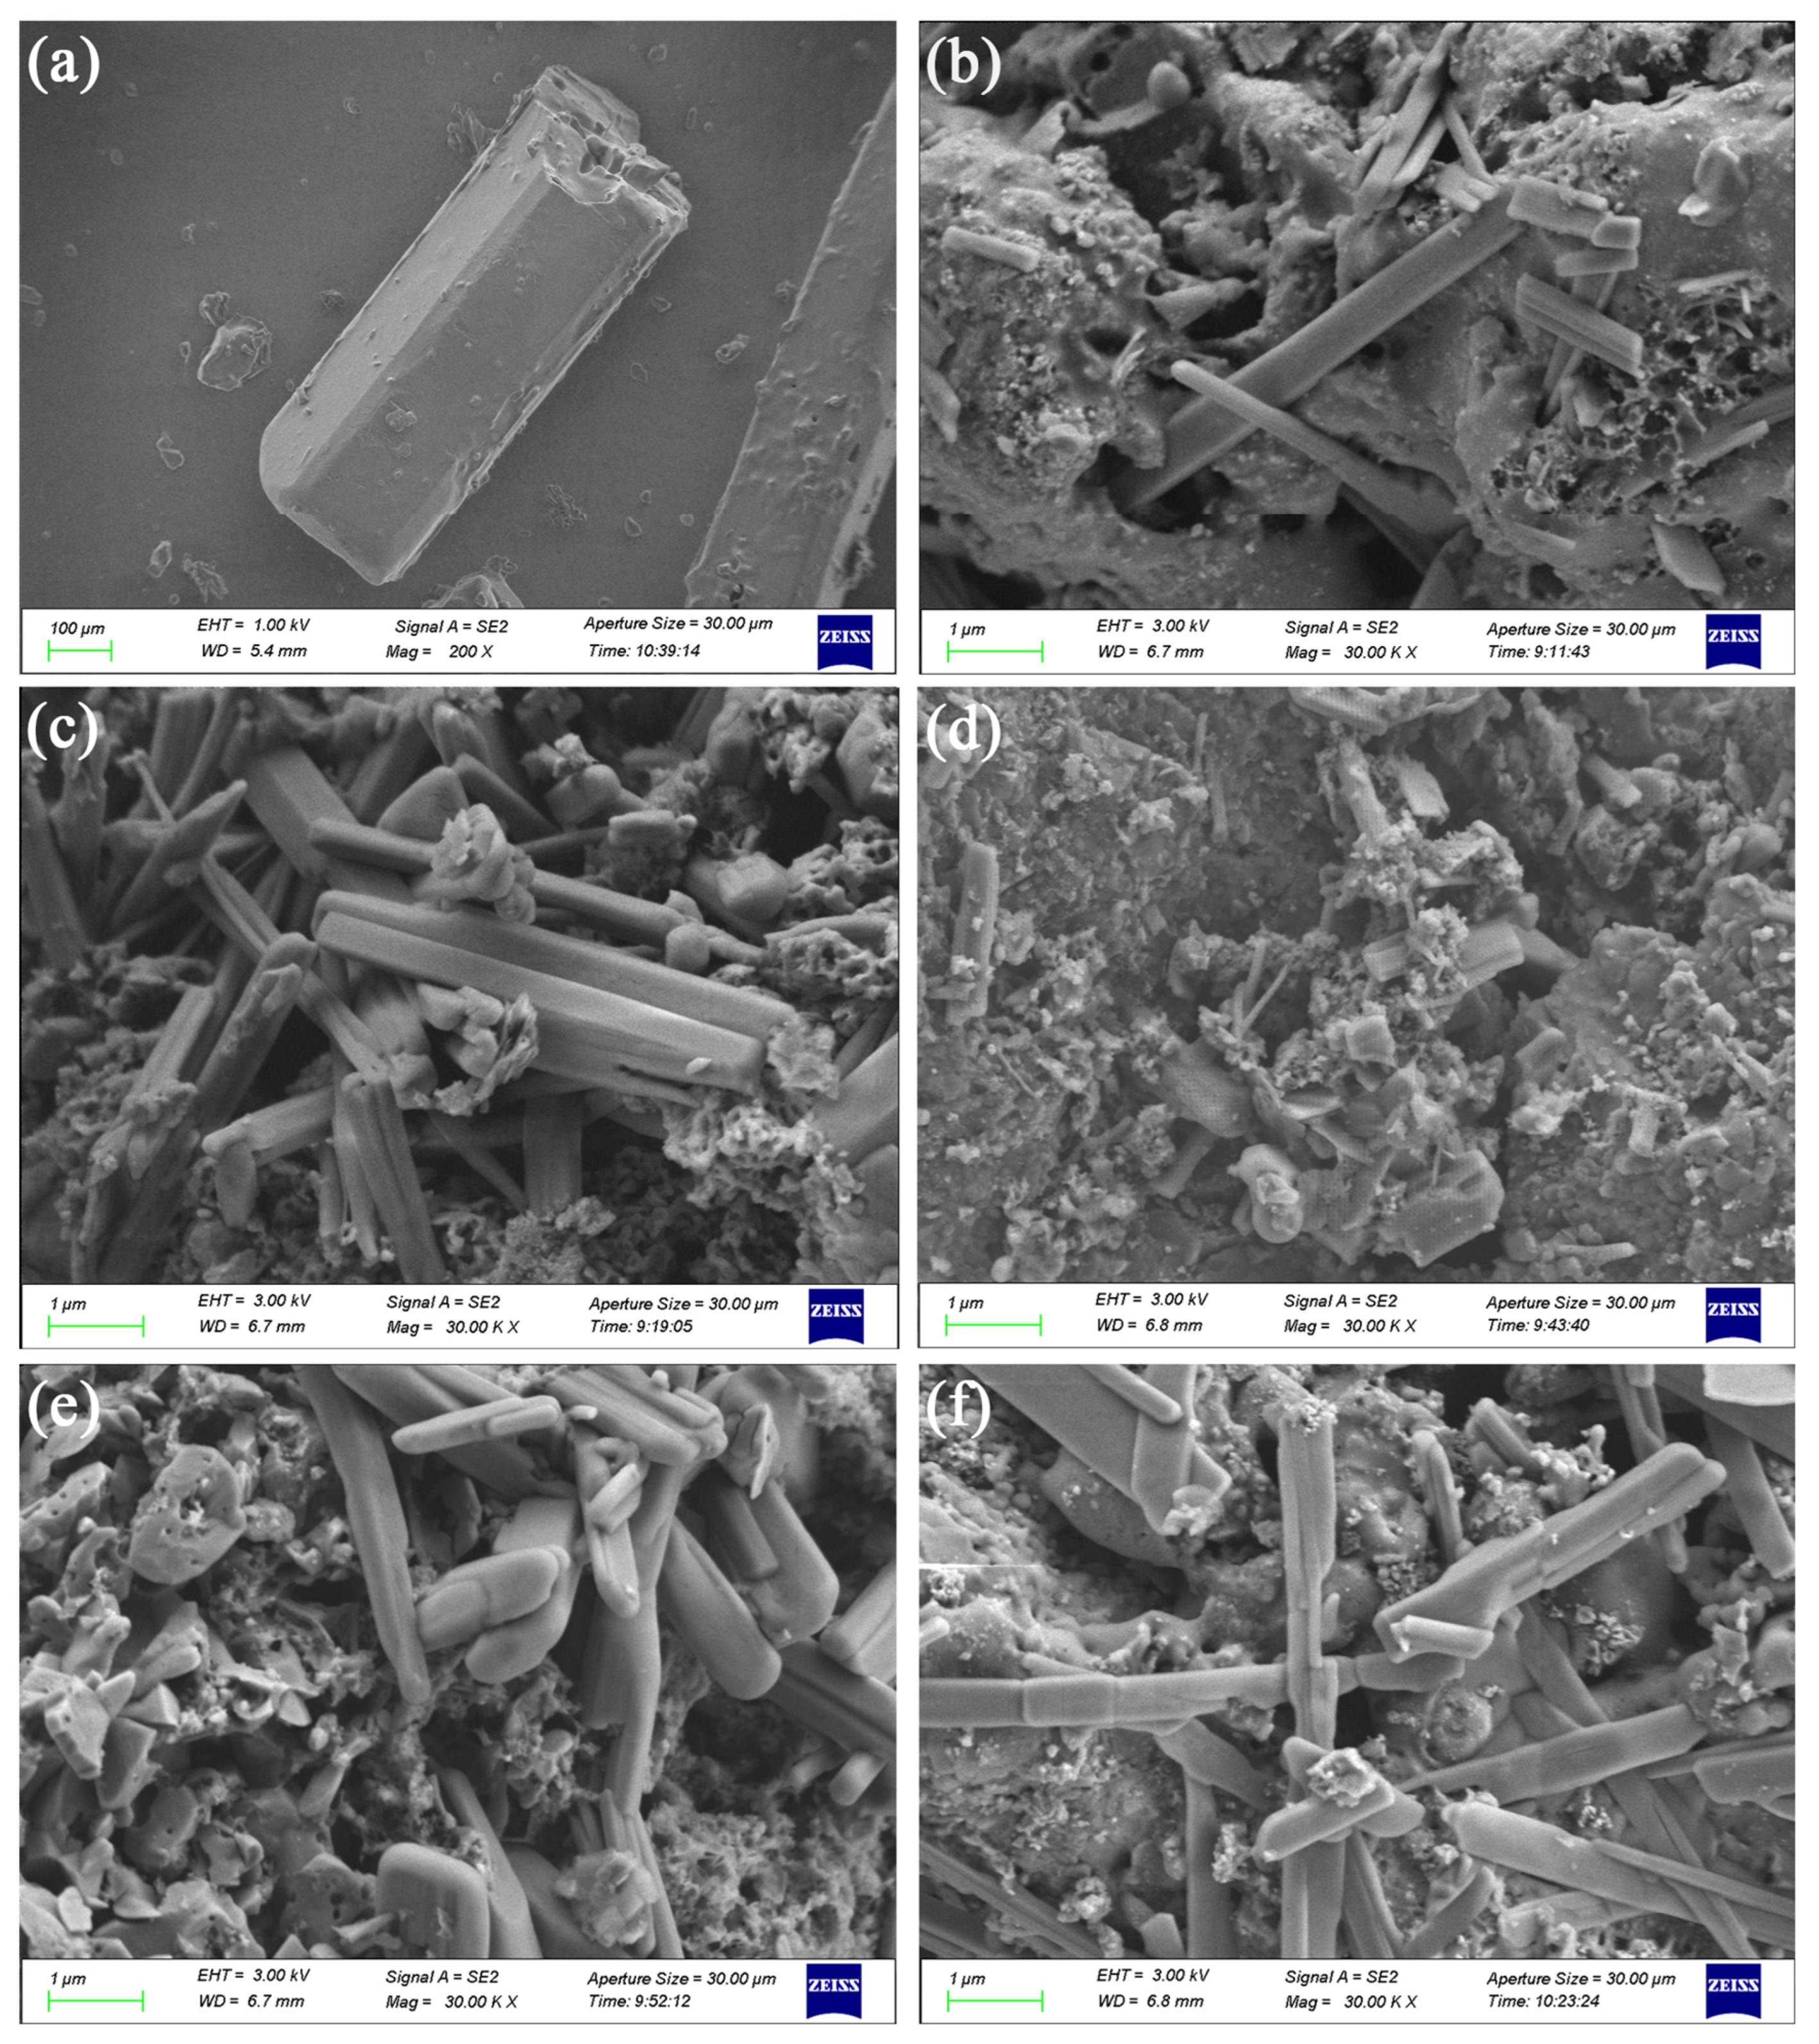
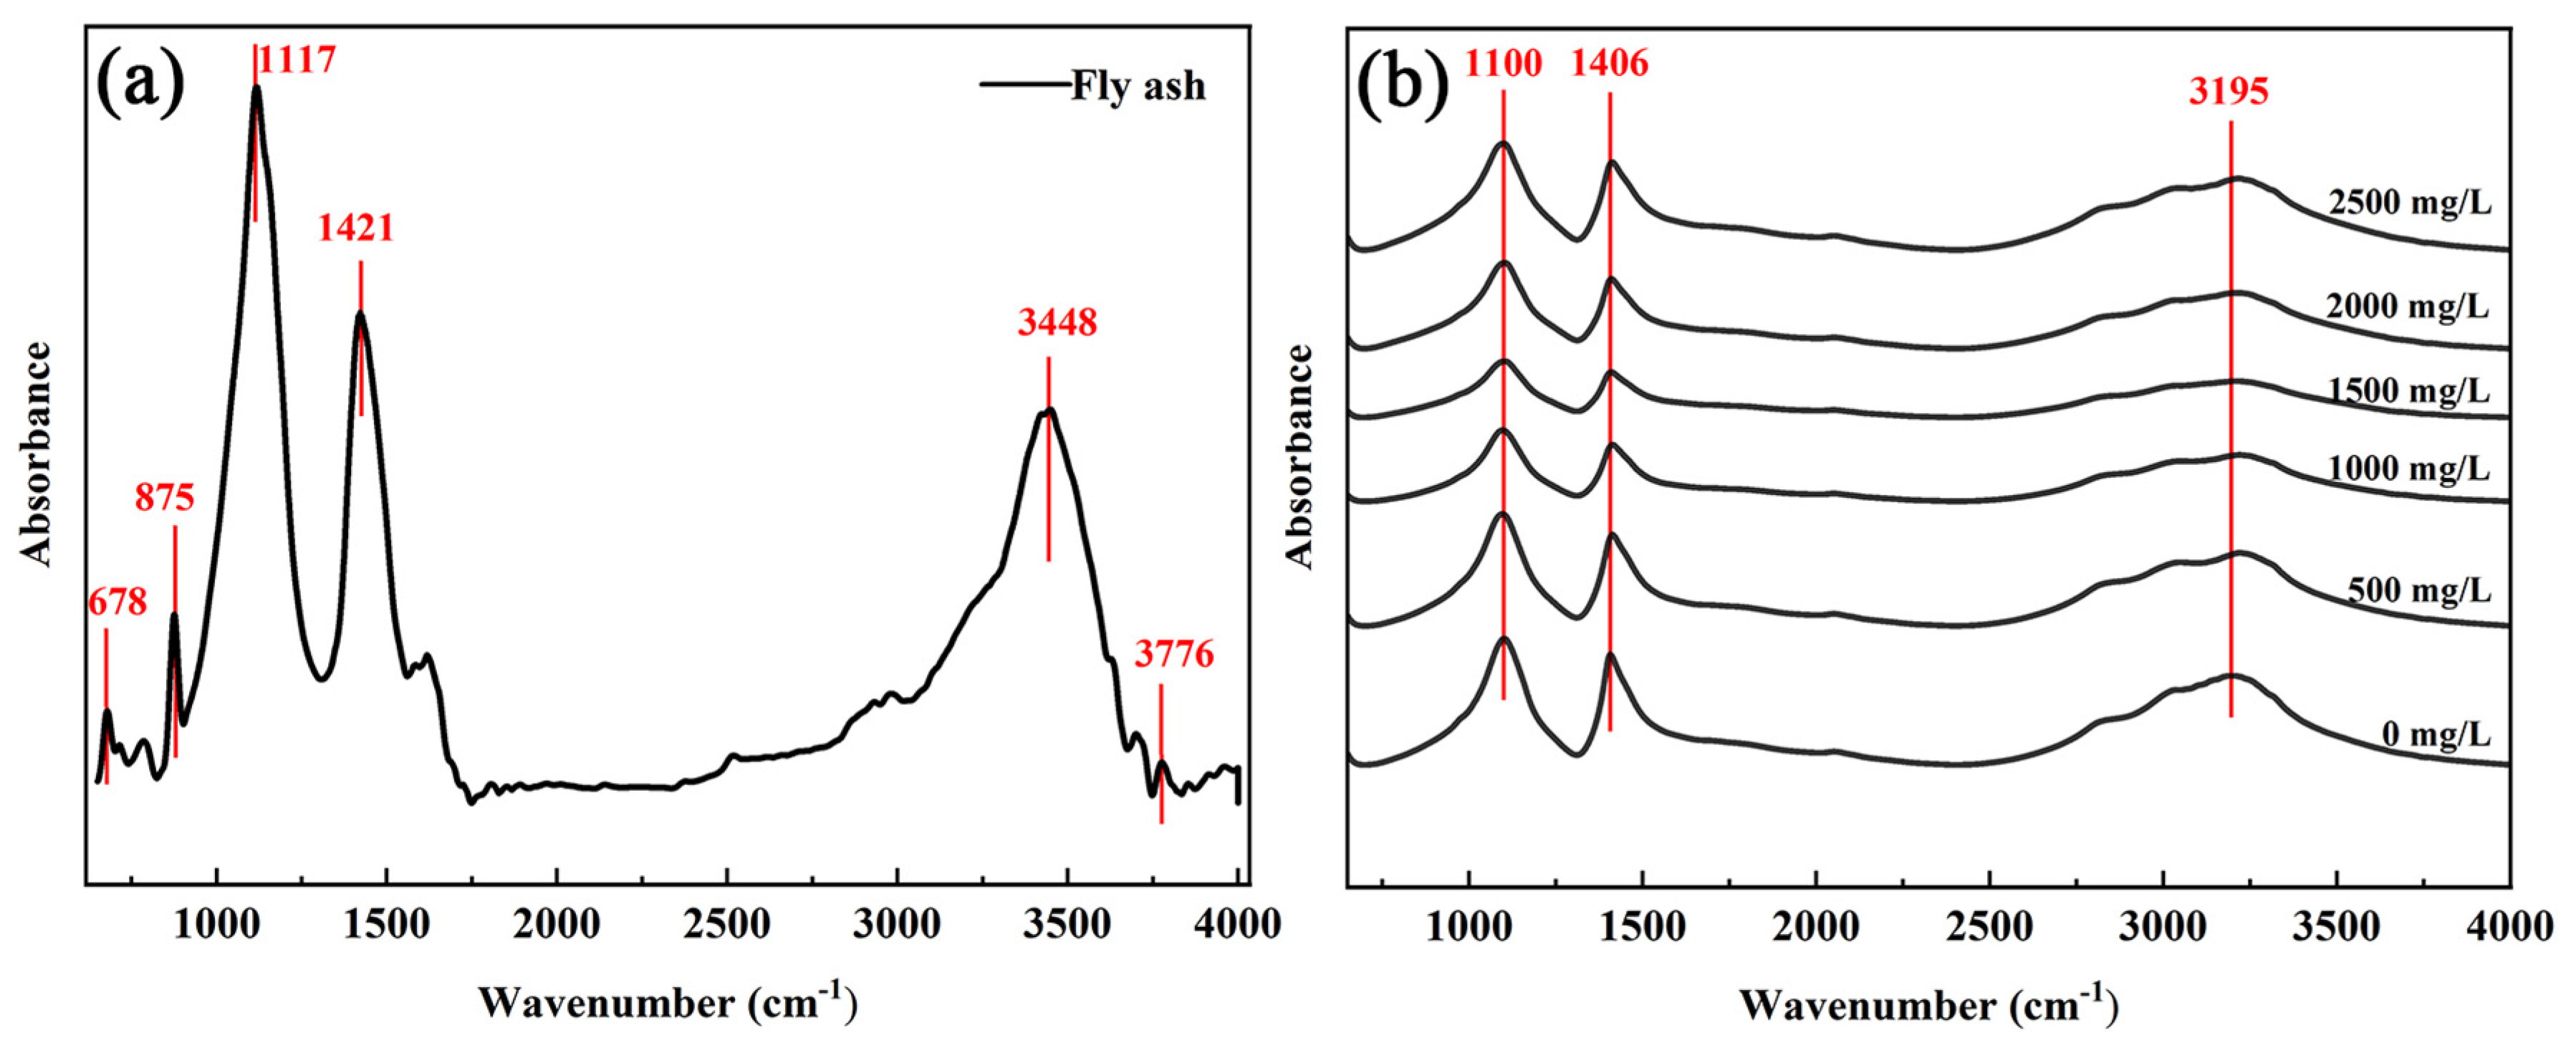
3.1. Sample Characterization

Figure 2 shows SEM images of the original fly ash sample at various magnifications. As observed in Figure 2a, the majority of fly ash particles exhibit irregular, non-crystalline structures with non-uniform particle size distribution. Figure 2b shows a magnified SEM image of the selected area from Figure 2a, with a magnification level of 3000×, it is evident that these irregular aggregates appear stacked, with rough surfaces and densely distributed pores. Figure 2c,d are SEM images of individual particles in the dashed circles in Figure 2b magnified 10,000× and 30,000× respectively, and the porous structure becomes more apparent, revealing a loose arrangement of particulate aggregates with a larger specific surface area. This distinctive particle structure would be beneficial to facilitate the adherence of ammonium sulfate on its surface.
The elemental composition and mass fractions of the fly ash particles were analyzed using EDS, as shown in Figure 3. Owing to particle embedding in epoxy resin conductive adhesive and considering that fly ash is primarily derived from coal combustion, the mass fractions of C and O are exceptionally high. From Figure 3b, it is evident that, aside from C and O, the main elements in this region are Si and Al, with a minimal mass fraction of S at only 0.66%. In Figure 3c, significant peaks for Si, O, Al, and Ca are observed, while S and Fe peaks are relatively small. Based on the elemental composition, it is inferred that fly ash particles predominantly consist of carbonaceous particles with Si, Ca, and Al as the main components, with sulfur oxides and iron oxides adhering to the particle surface.
The crystal structure of fly ash was characterized using XRD. As shown in Figure 4, the complexity of the combustion process and other treatment factors result in a diverse composition of coal fly ash, leading to multiple diffraction peaks on the XRD pattern. By comparing the peaks on the XRD pattern with the database (PDF, powder diffraction file) in MDI Jade 6 software, it was determined that the main crystalline phases in fly ash included silicon dioxide (SiO2), calcium sulfate (CaSO4), and calcium carbonate (CaCO3). The XRD-derived crystal phase information agrees with the elemental composition obtained from the EDS results for fly ash. Compounds containing elements such as Al and Fe, with lower content and weaker peak intensity, are not explicitly indicated in the XRD pattern.
The characterization of mixed aerosol particles using SEM is shown in Figure 5. It is found that in the absence of mixed fly ash and ammonium sulfate crystals exhibit regular, larger-sized prismatic structures. After mixing with fly ash under different solid mass concentrations, prismatic (NH4)2SO4 crystals are observed on the surface of fly ash particles. The illustration in Figure 5c depicts that the surface of fly ash is completely coated with a layer of ammonium sulfate crystals. Comparing these results with the morphology characteristics of differently mixed black carbon aerosol particles collected in the North China Plain [16] and New Mexico [17] regions, it is found that the mixed aerosol particles produced through this method conform to the fully encapsulated type of black carbon particles. In other words, the surface of black carbon is entirely enveloped by non-black carbon substances, forming an approximate “core-shell” structure.
With the increase in the solid mass concentration of fly ash in the (NH4)2SO4 solution, the regularity of (NH4)2SO4 crystal shapes undergoes changes. When the solid mass concentration of fly ash in the solution increased from 0 to 500 mg/L, the crystals formed after (NH4)2SO4 solution crystallization exhibit a prismatic structure; however, the crystal sizes vary, and the edges are not sufficiently clear. Nevertheless, when the solid mass concentration of fly ash was enhanced to 1000 mg/L, the regularity of the crystallized (NH4)2SO4 crystals reached its maximum, with consistent crystal sizes and smooth surfaces, accompanied by clear edges. As the solid mass concentration of fly ash increased from 1000 mg/L to 2500 mg/L, the regularity of the crystallized (NH4)2SO4 crystals decreased, with an uneven distribution of crystal sizes and no apparent prismatic structure. Therefore, in the preparation of mixed aerosols, there exists an optimum value of 1000 mg/L for the impact of fly ash on the regularity of (NH4)2SO4 crystals.
For the mixed aerosol sample with the highest regularity of ammonium sulfate crystals (solid mass concentration of fly ash = 1000 mg/L), an elemental composition analysis was conducted using EDS, and the results are illustrated in Figure 6. In Figure 6b, the major elements in the mixed aerosol show a relatively high mass fraction of S, which significantly increases from 0.66% (as shown in Figure 3b for fly ash) to 20.2%. Additionally, in Figure 6c, the sulfur peak is noticeably enhanced compared to Figure 3c, further confirming the presence of ammonium sulfate on the surface of fly ash, demonstrating the successful preparation of fully coated mixed aerosol particles.
The crystal structure of mixed aerosols with different solid mass concentrations of fly ash was characterized by XRD (Figure 7). The diffraction peak positions of (NH4)2SO4 remain consistent with varying fly ash solid mass concentrations. However, changes in the matching growth of (NH4)2SO4 crystal facets occur with the alteration in fly ash solid mass concentration from 500 to 2500 mg/L. In particular, when the fly ash solid mass concentration is 1000 mg/L, the growth of ammonium sulfate crystal facets is better matched. Both the inhibition of crystal facet growth at low fly ash solid mass concentrations and the excessive growth inhibition at high fly ash solid mass concentrations are unfavorable for the formation of regular (NH4)2SO4 crystals. This further confirms the results of the SEM analysis, indicating that the regularity of (NH4)2SO4 crystals is optimal when the fly ash solid mass concentration is 1000 mg/L.
The functional groups of fly ash and mixed aerosols were characterized by FTIR, as shown in Figure 8. Strong absorption peaks are observed at 1421 cm−1 and 875 cm−1 in Figure 8a, corresponding to the stretching and bending vibrations of the -CO3 groups in CaCO3 crystals, indicating the presence of carbonate. The absorption band in the range of 1300–900 cm−1 is attributed to the anti-symmetric stretching vibrations of Si-O (Si, Al) with a peak at 1117 cm−1, while the weaker absorption band in the range of 600–400 cm−1 is due to the bending vibrations of Si-O(Si) with a peak at 678 cm−1 [18]. A sharp absorption peak appears at 3448 cm−1, representing a significant amount of free -OH in the sample. A vibration absorption band is observed near 3776 cm−1, typically attributed to crystalline water molecules.
Figure 8b shows the FTIR spectrum of mixed aerosols with different fly ash solid mass concentrations, with three typical characteristic peaks at 1100 cm−1, 1406 cm−1, and 3195 cm−1. The peak at 1100 cm−1 corresponds to the stretching vibration absorption peak of the S=O double bond. At 1406 cm−1, an asymmetric vibration characteristic absorption peak of the covalent group O=S=O (SO42−) occurs, and with the increase in fly ash solid mass concentration, this characteristic absorption peak becomes more pronounced. The broad absorption band in the range of 3500–3100 cm−1 is attributed to the stretching vibration of the N-H bond, exhibiting a similar changing trend to the SO42− characteristic peak.

3.2. Stability Analysis of Levitated Particles

Figure 9a shows the image of a levitated fly ash particle, which has an equivalent diameter of 5.50 μm. By analyzing the images of the fluctuating particle, the statistical centroids of the levitated fly ash particle are illustrated in Figure 9b. The y and z axes represent the lateral and axial directions of beam propagation, respectively. The origin (black dot) is the initial position of the fly ash. The green dots correspond to the trajectory coordinates. The red dot indicates the farthest fluctuation displacement of the fly ash particle, 3.88 μm. The red circle depicts the motion range of the particle’s centroid. The yellow circle is equivalent diameter. Thus, according to Equation (2), the relative instability (RI) index is approximately 0.71. The statistical data demonstrated that the RI index is relatively small, demonstrating the stable performance of optical levitation. It was testified that the minor fluctuation of levitated particles has an extremely weak impact on the scattering signals.

3.3. Measurement of Scattering Characteristics of Mixed Aerosols

Figure 10 illustrates the variation in scattering signal intensity with particle size for fly ash and mixed aerosols with different fly ash solid mass concentrations. Both fly ash and mixed aerosol particles exhibit scattering intensity characteristics that agree with the Mie theory [19], where higher particle size parameters lead to higher peaks in forward scattering. Moreover, for mixed aerosol particles, the overall scattering intensity was lower than that of single-component fly ash. According to the Mie theory, it is known that the scattering phase function of particles is closely related to particle size and complex refractive index [20]. Thus, it is speculated that the lower forward scattering peak in mixed aerosol compared to fly ash alone may be attributed to the relatively smaller complex refractive index of ammonium sulfate attached to the surface of mixed aerosol particles.
The differences in the scattering intensities of fly ash and mixed aerosol particles within different particle size ranges are illustrated in Figure 11. Combining the results of SEM and XRD material characterization, it can be observed that the scattering intensity of mixed aerosol particles is correlated with the regularity of the internal mixed ammonium sulfate crystals. For the mixed aerosol particles, when the fly ash solid mass concentration is 1000 mg/L, the prism-shaped ammonium sulfate crystals formed on the surface are the most regular, and the matching degree of crystal growth is the highest. Consequently, the peak of the scattering intensity is also the highest. However, when the fly ash solid mass concentration is 500 mg/L or 1500 mg/L, the regularity of the crystals is lower, and the matching degree of crystal growth is reduced. As the solid mass concentration increases to 2000 mg/L, the regularity and the matching degree of the crystals are improved but, overall, are still lower than those at 1000 mg/L. The trend of the scattering intensity measured in the scattering experiments follows a similar pattern. This preliminary analysis suggests that higher regularity of crystals corresponds to higher scattering intensity of mixed aerosol particles.
The internal arrangement regularity of atoms or molecules within crystals can affect the propagation of light, thus influencing the refractive index. This regularity leads to different responses of crystals to light in various directions. For instance, in anisotropic crystals, light may exhibit different refractive indices when propagating along different directions, known as birefringence [21]. Therefore, the crystal structure in mixed aerosol particles can affect their refractive index, with a higher regularity of prism-shaped ammonium sulfate crystals on the fly ash surface resulting in a higher refractive index and, consequently, changes in the scattering intensity.

4. Conclusions

In summary, it is found that by using SEM, EDS, XRD, and FTIR characterization methods, the rough porous structure on the surface of fly ash facilitates the adhesion of ammonium sulfate. The experimentally obtained mixed aerosol particles completely encapsulate ammonium sulfate crystals on their surface, resembling the “core-shell” structure of black carbon aerosols in the actual atmosphere. Moreover, the surface formed columnar ammonium sulfate crystals that exhibit the highest regularity when the solid mass concentration of fly ash was 1000 mg/L.
The measurements of the scattering intensity were conducted on individual optically levitated fly ash and mixed aerosol particles at scattering angles around 0°. The scattering intensity enhances with increasing the particle size, which is consistent with the scattering characteristics of Mie particles. It is testified that the mixed aerosols exhibit lower forward scattering peaks compared to fly ash alone since ammonium sulfate primarily contributes to the scattering due to the “core-shell” structure. The higher regularity of ammonium sulfate crystals formed on the surface of mixed aerosols at different solid mass concentrations of fly ash corresponds to a higher scattering intensity. This suggests that the crystal structure influences the refractive index, subsequently causing variations in scattering intensity.

Author Contributions

Conceptualization, S.L. and X.H.; methodology, S.L., X.H., J.L. (Jiaxin Li), M.Z. and Z.W.; formal analysis, J.L. (Jiaxin Li), M.Z., Z.W., S.L., Y.S., J.L. (Jie Liu) and X.H.; investigation, J.L. (Jiaxin Li), M.Z. and Z.W.; writing—original draft preparation, J.L. (Jiaxin Li) and S.L.; writing—review and editing, S.L. and X.H.; supervision, S.L.; project administration, X.H.; funding acquisition, S.L. and X.H. All authors have read and agreed to the published version of the manuscript.

Funding

This research was funded by Natural Science Foundation of Zhejiang Province (LY24E060006) and National Major Scientific Instruments and Equipments Development Project of National Natural Science Foundation of China (52027809).

Data Availability Statement

The data could be available on inquiries to the correspondence author.

Conflicts of Interest

The authors declare no conflict of interest.

References

  1. Li, J.; Carlson, B.E.; Yung, Y.L.; Lv, D.; Hansen, J.; Penner, J.E.; Dong, Y. Scattering and absorbing aerosols in the climate system. Nat. Rev. Earth Environ. 2022, 3, 363–379. [Google Scholar] [CrossRef]
  2. Gueymard, C.A.; Yang, D. Worldwide validation of CAMS and MERRA-2 reanalysis aerosol optical depth products using 15 years of AERONET observations. Atmos. Environ. 2020, 225, 117216. [Google Scholar] [CrossRef]
  3. Zhang, Y.G.; Zhang, J.; Wu, S.T.; Gao, J.L.; Hao, Z.Q.; Li, C.L. Study on laser scattering depolarization characteristics of typical aerosol particles. Opt. Commun. 2022, 518, 128183. [Google Scholar] [CrossRef]
  4. Liu, D.T.; Whitehead, J.; Alfarra, M.R.; Reyes-Villegas, E.; Spracklen, D.V.; Reddington, C.L.; Allan, J.D. Black-carbon absorption enhancement in the atmosphere determined by particle mixing state. Nat. Geosci. 2017, 10, 184–188. [Google Scholar] [CrossRef]
  5. Martins, J.V.; Artaxo, P.; Liousse, C.; Reid, J.S.; Hobbs, P.V.; Kaufman, Y.J. Effects of black carbon content, particle size, and mixing on light absorption by aerosol particles from biomass burning in Brazil. J. Geophys. Res. Atmos. 1998, 103, 32041–32050. [Google Scholar] [CrossRef]
  6. Pósfai, M.; Anderson, J.R.; Buseck, P.R.; Sievering, H. Soot and sulfate aerosol particles in the remote marine troposphere. J. Geophys. Res. Atmos. 1999, 104, 21685–21693. [Google Scholar] [CrossRef]
  7. Mishchenko, M.I.; Liu, L.; Mackowski, D.W. T-matrix modeling of linear depolarization by morphologically complex soot and soot-containing aerosols. J. Quant. Spectrosc. Radiat. Transf. 2013, 123, 135–144. [Google Scholar] [CrossRef]
  8. Zhang, X.L.; Huang, Y.B.; Rao, R.Z. Equivalence of light scattering by one internal-mixed model for aerosol particles. Acta Optica Sinica 2012, 32, 0629001. [Google Scholar] [CrossRef]
  9. Hao, L.; Yang, W.; Wu, T.W.; Shi, G.Y.; Zhao, J.Q.; Tan, Y. Study on radiative property of soot-sulfate mixed aerosol. Plateau Meteor. 2010, 29, 1238–1245. [Google Scholar]
  10. Freedman, M.A.; Hasenkopf, C.A.; Beaver, M.R.; Margaret, A. Optical Properties of Internally Mixed Aerosol Particles Composed of Dicarboxylic Acids and Ammonium Sulfate. J. Phys. Chem. A 2009, 113, 13584–13592. [Google Scholar] [CrossRef]
  11. Malm, W.; Day, D.; Kreidenweis, S. Light scattering characteristics of aerosols as a function of relative humidity: Part I—A comparison of measured scattering and aerosol concentrations using the theoretical models. J. Air Waste Manag. Assoc. 2000, 50, 686–700. [Google Scholar] [CrossRef]
  12. Carruthers, A.E.; Reid, J.P.; Orr-Ewing, A.J. Longitudinal optical trapping and sizing of aerosol droplets. Opt. Express 2010, 18, 14238–14244. [Google Scholar] [CrossRef]
  13. Jones, S.H.; King, M.D.; Ward, A.D. Determining the unique refractive index properties of solid polystyrene aerosol using broadband Mie scattering from optically trapped beads. Phys. Chem. Chem. Phys. 2013, 15, 20735–20741. [Google Scholar] [CrossRef] [PubMed]
  14. GB/T 212-2008; Proximate Analysis of Coal. General Administration of Quality Supervision, Inspection and Quarantine of the People’s Republic of China; Standardization Administration of the People’s Republic of China; Standards Press of China: Beijing, China, 2008.
  15. Huang, X.; Chen, C.; Li, J.; Zhang, M.; Li, S. Measurement of scattering intensity distribution of single microparticles/nanoclusters based on laser levitation. Acta Phys. Sin. 2023, 72, 174201. [Google Scholar] [CrossRef]
  16. China, S.; Mazzoleni, C.; Gorkowski, K.; Aiken, A.C.; Dubey, M.K. Morphology and mixing state of individual freshly emitted wildfire carbonaceous particles. Nat. Commun. 2013, 4, 2122. [Google Scholar] [CrossRef] [PubMed]
  17. Adachi, K.; Buseck, P.R. Internally mixed soot, sulfates, and organic matter in aerosol particles from Mexico City. Atmos. Chem. Phys. 2008, 8, 6469–6481. [Google Scholar] [CrossRef]
  18. Rożek, P.; Król, M.; Mozgawa, W. Spectroscopic studies of fly ash-based geopolymers. Spectrochim. Acta A 2018, 198, 283–289. [Google Scholar] [CrossRef] [PubMed]
  19. Wei, Z.; Yuan, L. Analysis of characteristics of Mie scattering. Opt. Tech. 2010, 36, 936–939. [Google Scholar]
  20. Hu, S.; Gao, T.C.; Liu, L. Analysis on scattering characteristics and equivalent Mie scattering errors of non-spherical aerosol. J. Meteorol. Res. 2014, 34, 612–619. [Google Scholar]
  21. Niklasson, G.A.; Granqvist, C.G.; Hunderi, O. Effective medium models for the optical properties of inhomogeneous materials. Appl. Opt. 1981, 20, 26–30. [Google Scholar] [CrossRef] [PubMed]
Figure 1. Mass fractions of fly ash particle sizes.
Processes 12 00769 g001
Figure 2. SEM images of fly ash at various magnifications: (a) 1000×; (b) 3000×, a magnified SEM image of the selected area from (a); (c) 10,000×, SEM image of individual particles in the dashed circles in (b); (d) 30,000×, SEM image of individual particles in the dashed circles in (b).
Processes 12 00769 g002
Figure 3. (a) SEM image of fly ash particle surface in a selected zone; (b) mass fractions of major elements; (c) EDS spectrum in the selected zone.
Processes 12 00769 g003
Figure 4. The XRD pattern of fly ash.
Processes 12 00769 g004
Figure 5. The SEM images of ammonium sulfate (a) and mixed aerosols at different fly ash solid mass concentrations: (b) 500 mg/L; (c) 1000 mg/L; (d) 1500 mg/L; (e) 2000 mg/L; (f) 2500 mg/L.
Processes 12 00769 g005
Figure 6. (a) SEM image of mixed aerosol in a selected zone; (b) mass fractions of major elements; (c) EDS spectrum in the selected zone.
Processes 12 00769 g006
Figure 7. XRD patterns of mixed aerosols at different fly ash solid mass concentrations.
Processes 12 00769 g007
Figure 8. (a) FTIR spectrum of fly ash; (b) FTIR spectrum of mixed aerosols at different fly ash solid mass concentrations.
Processes 12 00769 g008
Figure 9. (a) A levitated fly ash particle and (b) levitation stability of the fly ash particle.
Processes 12 00769 g009
Figure 10. Normalized scattering signal intensity of fly ash (a) and mixed aerosols with different fly ash solid mass concentrations are shown in (b) 500 mg/L, (c) 1000 mg/L, (d) 1500 mg/L, (e) 2000 mg/L, and (f) 2500 mg/L.
Processes 12 00769 g010
Figure 11. Normalized scattering intensity differences in fly ash and mixed aerosols with different fly ash solid mass concentrations in different particle size ranges.
Processes 12 00769 g011
Table 1. Properties of fly ash.
MoistureAsh ContentVolatile MatterFixed Carbon
MethodGB/T 212-2008 “Proximate analysis of coal” [14]
InstrumentElectric blast drying ovenMuffle furnaceMuffle furnaceMuffle furnace
Results1.73%64.14%13.29%20.84%
Table 2. Specific parameters of as-prepared ammonium sulfate and mixed aerosol particles.
SampleFly Ash Addition (g)0.33 wt.%
(NH4)2SO4 Volume (L)
Fly Ash Solid Mass Concentration (mg/L)
100.100
20.050.10500
30.100.101000
40.150.101500
50.200.102000
60.250.102500
Disclaimer/Publisher’s Note: The statements, opinions and data contained in all publications are solely those of the individual author(s) and contributor(s) and not of MDPI and/or the editor(s). MDPI and/or the editor(s) disclaim responsibility for any injury to people or property resulting from any ideas, methods, instructions or products referred to in the content.

