Article

Influence of Shale Mineral Composition and Proppant Filling Patterns on Stress Sensitivity in Shale Reservoirs

1
Research Institute of Experiment and Detection, Xinjiang Oilfield Company, Petro China, Karamay 834000, China
2
National Key Laboratory of Petroleum Resources and Engineering, China University of Petroleum (Beijing), Beijing 102249, China
3
College of Petroleum Engineering, China University of Petroleum (Beijing), Beijing 102249, China
*
Authors to whom correspondence should be addressed.
Processes 2024, 12(4), 789; https://doi.org/10.3390/pr12040789
Submission received: 8 March 2024 / Revised: 8 April 2024 / Accepted: 11 April 2024 / Published: 14 April 2024
(This article belongs to the Section Energy Systems)

Abstract

:
Shale reservoirs typically exhibit high density, necessitating the use of horizontal wells and hydraulic fracturing techniques for efficient extraction. Proppants are commonly employed in hydraulic fracturing to prevent crack closure. However, limited research has been conducted on the impact of shale mineral composition and proppant filling patterns on shale stress sensitivity. In this study, shale cylindrical core samples from two different lithologies in Jimusaer, Xinjiang in China were selected. The mineral composition and microscopic structures were tested, and a self-designed stress sensitivity testing system was employed to conduct stress sensitivity tests on natural cores and fractured cores with different proppant filling patterns. The experimental results indicate that the stress sensitivity of natural shale porous cores is weaker, with a stress sensitivity coefficient below 0.03, significantly lower than that of fractured cores. The shale mineral composition has a significant impact on stress sensitivity, with the stress sensitivity of clayey argillaceous shale cores, characterized by higher clay mineral content, being higher than that of sandy argillaceous shale, characterized by higher quartz mineral content. This pattern is also applicable to fractured cores filled with proppants, but the difference gradually diminishes with increased proppant concentration. The choice of large particles and high-concentration proppant bedding can enhance crack conductivity. Within the experimental range, the crack conductivity of 20–40 mesh quartz sand is more than three times that of 70–120 mesh quartz sand. At an effective stress of 60 MPa, the conductivity of cores with a proppant concentration of 2 kg/m2 is 3.61 times that of cores with a proppant concentration of 0.3 kg/m2. Under different particle size combinations of proppant filling patterns, the crack conductivity at the crack front with large-particle proppants is 6.21 times that of mixed bedding. This study provides valuable insights for the hydraulic fracturing design of shale reservoirs and optimization of production system parameters in subsequent stages.

1. Introduction

With the continuous decline in global conventional oil and gas production and increasing energy demands, unconventional oil and gas resources have emerged as feasible supplements to conventional energy sources [1,2,3]. In recent years, the rapid development of shale oil and gas has also attracted widespread attention to shale reservoir petroleum resources, making shale oil and gas a hot research topic in petroleum exploration. Shale reservoirs generally exhibit ultralow porosity and ultralow permeability characteristics, requiring the use of horizontal wells and large-scale hydraulic fracturing techniques for effective development [4,5,6]. The combination of horizontal wells and multistage fracturing technology creates a large network of fractures in the reservoir, significantly increasing the oil and gas flow area and initial production rates [7,8]. In 2011, a portion of the Eagle Ford formation in the Hawkville field was chosen. This area is primarily limestone with permeability ranging from 100 to 600 nD and total porosity between 7% and 10%. Hydraulic fracturing was tested in 12 horizontal wells, with results compared to 38 offset wells treated conventionally. Data from 50 wells indicated hydrocarbon production increases ranging from 32% to 68% with channel fracturing [9].
However, the rock framework of oil and gas reservoirs is simultaneously influenced by the overlying rock pressure and the internal pore fluid pressure within the reservoir. The overlying pressure is correlated with the depth of the reservoir, increasing gradually as the reservoir depth increases [10]. Moreover, as the oil and gas development progresses, there is a reduction in internal fluid within the reservoir, leading to a decrease in pore fluid pressure. This results in compression of internal pores, natural fractures, and hydraulic fracturing fractures, ultimately causing a decrease in production capacity. This stress sensitivity phenomenon constrains the sustainable and efficient development of shale oil and gas resources [11,12].
Shale is a typical heterogeneous rock characterized by its heterogeneous microstructure and mineral composition [13]. The mineral composition of shale is complex, primarily composed of clay minerals (layered silicates), other common soil minerals (such as framework silicates like quartz and feldspar, as well as carbonates), and highly cemented aggregates of organic matter. The lithofacies of shale can be classified based on its mineral composition [14,15]. Studies have shown that shale of different lithofacies exhibits variations in mechanical properties [16,17]. Furthermore, the mineralogical properties of shale also influence the shale’s pore structure and surface characteristics [18,19]. This suggests that shale of different lithofacies may exhibit different stress sensitivity characteristics. Dong et al. [20] separately measured the permeability of sandstone and shale under various confining pressures. The results indicated that the stress sensitivity of shale permeability was significantly greater than that of sandstone. Therefore, analyzing the mineralogy (including composition and content) and pore structure of shale contributes to understanding the stress sensitivity patterns in shale oil reservoirs.
Proppants injected into the reservoir during the fracturing process play a critical role in creating conduits with specific conductivity after propping open the artificial fractures. This facilitates the passage of oil and gas, thereby enhancing production and mitigating damage from stress sensitivity [21,22,23]. The effectiveness of supporting agents in the formation is influenced by factors such as temperature, pressure, and their own properties, with the migration of supporting agents being challenging to observe directly [24,25,26]. Numerous scholars have extensively researched the conductivity of fractures using API conductivity meters and rock slabs [27,28]. It is worth noting that the smooth surface of rock slabs may not accurately simulate the fracture morphology formed after fracturing in reservoirs [29]. Raimbay et al. [30] roughened the resin–glass plate surface through a series of casting and molding processes to simulate the surface morphology of real cracks. However, this method still cannot accurately simulate the true tortuosity and surface roughness of reservoir fractures. To address this issue, Arshadi et al. [31] induced rough-walled fractures in cylindrical shale core samples by conducting Brazilian tests, resulting in breaking the samples into two pieces along their length and parallel to the bedding, followed by filling the fractures with proppant samples and resealing the core. The proppant-packed core preparation process is illustrated in Figure 1. Kassis et al. [32] compared the permeability variation of shale under different effective stresses using different types of proppants (ceramic proppants, Ottawa sand). They found that ceramic proppants were less prone to fracturing under high-stress conditions, exhibiting a higher degree of embedment into the shale matrix, while Ottawa sand was more prone to fracturing under high-stress conditions, resulting in microcracks within the shale samples, thus favoring enhanced permeability.
While considerable research has been conducted on the stress sensitivity of proppant-filled shale by scholars, there remains a lack of systematic investigation into the influence patterns of shale mineral composition and various-particle-size proppant filling patterns on shale stress sensitivity. This study focuses on two typical lithological shale core samples from Jimusaer shale in Xinjiang, China. X-ray diffraction (XRD), scanning electron microscopy (SEM), and cast thin section (CTS) techniques are employed to characterize the mineral composition and microstructure of the samples. Additionally, a self-designed cylindrical core stress sensitivity testing system is used to investigate the stress sensitivity patterns of natural shale cores with different lithologies and artificial fracture shale cores filled with proppants under simulated reservoir temperature and pressure conditions. The study aims to explore the influence of shale mineral composition, proppant filling modes, and other factors on the stress sensitivity of shale reservoirs.

2. Experimental Materials and Methods

2.1. Materials

The test fluid used in this experiment is neutral kerosene from Aladdin Company, with a viscosity of 0.73 mPa·s at a reservoir temperature of 80 °C. To better simulate real field conditions, the proppant samples used are sourced from quartz sand proppants used in Xinjiang oil fields. These proppants come in three specifications (20–40 mesh, 40–70 mesh, 70–120 mesh), with particle sizes of 0.42–0.841 mm, 0.21–0.42 mm, and 0.125–0.21 mm, respectively.
The shale cores used in the experiment were drilled from the Jimusaer shale reservoir in Xinjiang, with a core diameter of 2.5 cm and lengths ranging from 4.02 to 5.32 cm, ensuring a length-to-diameter ratio greater than 1.5:1. Parallel samples were prepared for mineralogical analysis experiments. Due to the development of bedding in the reservoir block, resulting in low core recovery rates, we endeavored to preserve the length of the core for potential utilization in subsequent research. It is noteworthy that both permeability and conductivity calculations consider the core length, while the dosage of proppant for each core plug is determined accordingly. Hence, slight variations in core length do not compromise the reliability of our experimental outcomes. The samples represent two typical lithological types of shale in the region (sandy argillaceous shale and clayey argillaceous shale). Prior to the experiments, the cores were cleaned with a solution of 75% alcohol and 25% benzene to remove any residual oil, followed by drying. Helium porosity and permeability tests were conducted, and the results are presented in Table 1. The processing procedures for the abovementioned core samples strictly followed the Chinese National Standard Practices for Core Analysis (GB/T 29172-2012) [33].
The test results indicate that overall, both lithological rock cores exhibit relatively low porosity and permeability, except for SA2 and CA2. The average porosity of sandy argillaceous shale cores is 14.42% with an average permeability of 0.051 md, excluding SA2. The average porosity of clayey argillaceous shale cores is 12.27% with an average permeability of 0.040 md, excluding CA2. The higher porosity and permeability of SA2 and CA2 are attributed to the evident microfractures generated after washing oil. Both shale types exhibited similar porosity and permeability, but differences were observed in their mineral compositions.

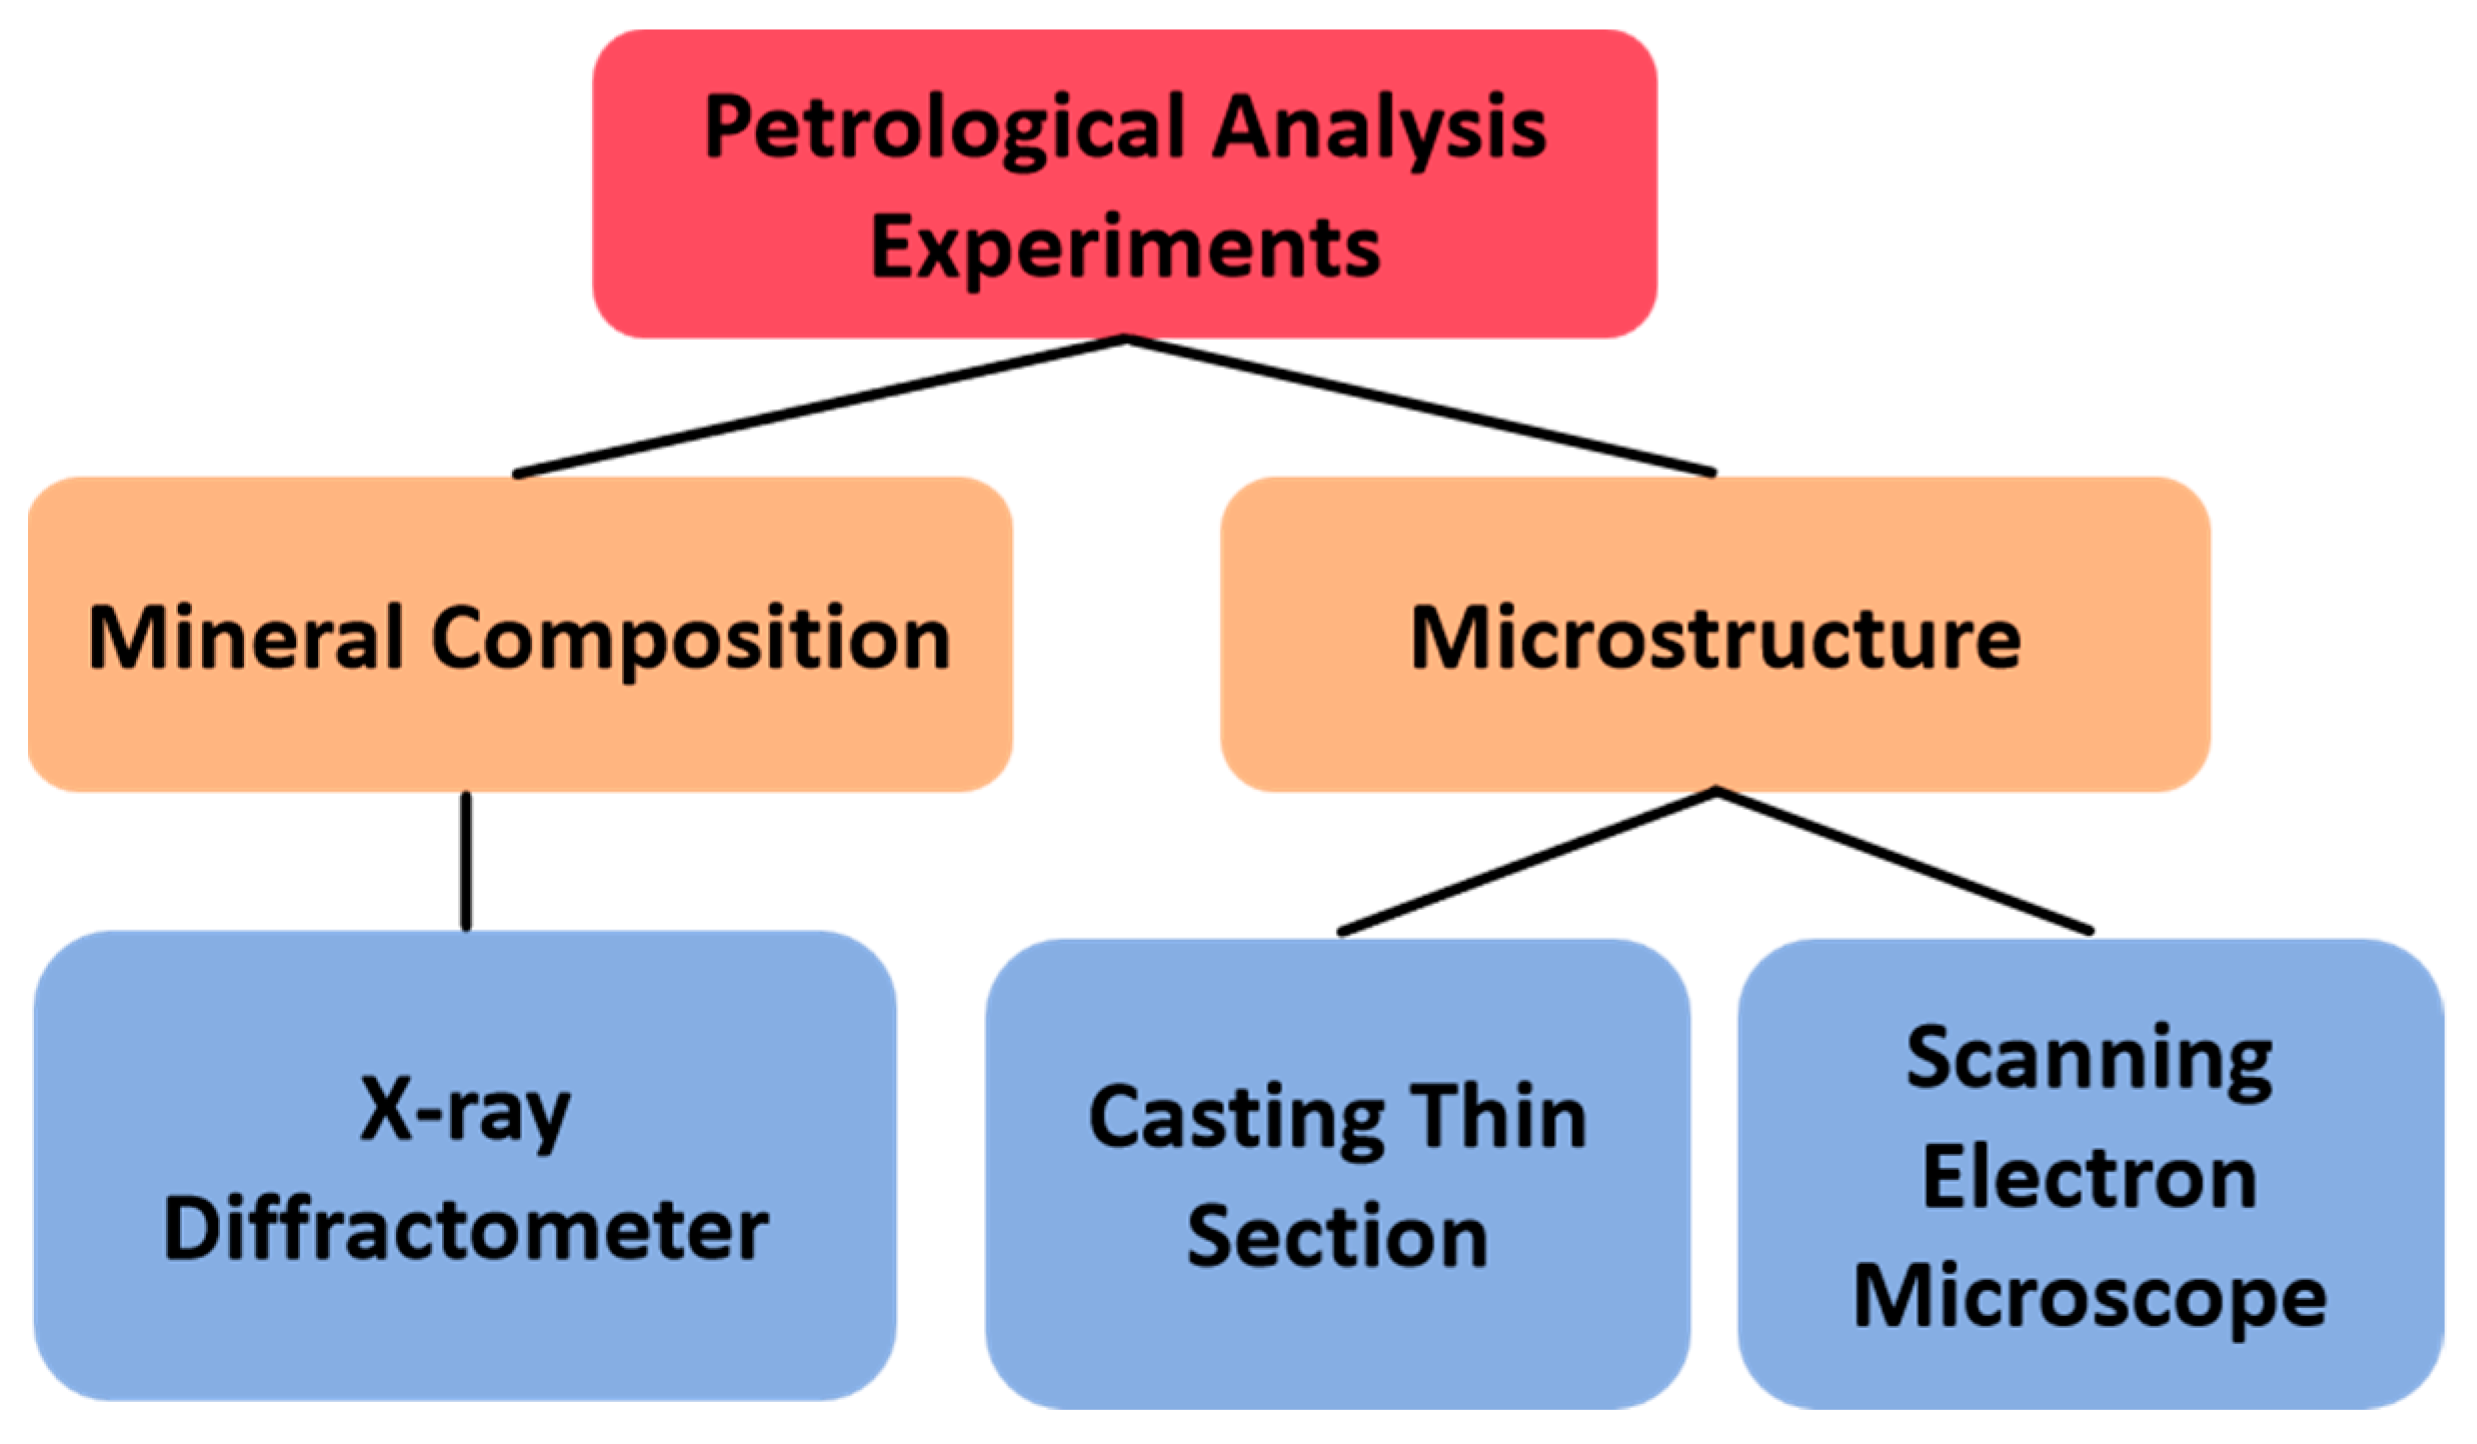
2.2. Petrological Analysis Experiments

The mineral composition of the samples was quantitatively analyzed using a DX-2700 X-ray diffractometer. For the cast thin section (CTS) experiment, a colored liquid was injected into the rock pores under vacuum pressure. Subsequently, the rock was ground into thin sections, and reservoir structures were examined under a microscope. SEM observations were conducted using the Quanta 200 F field-emission scanning electron microscopy platform. The freshly crushed sample surfaces were bombarded with an electron beam to directly observe features such as interstitial materials, pore structures, and cementation. The specific experimental design process is shown in Figure 2.

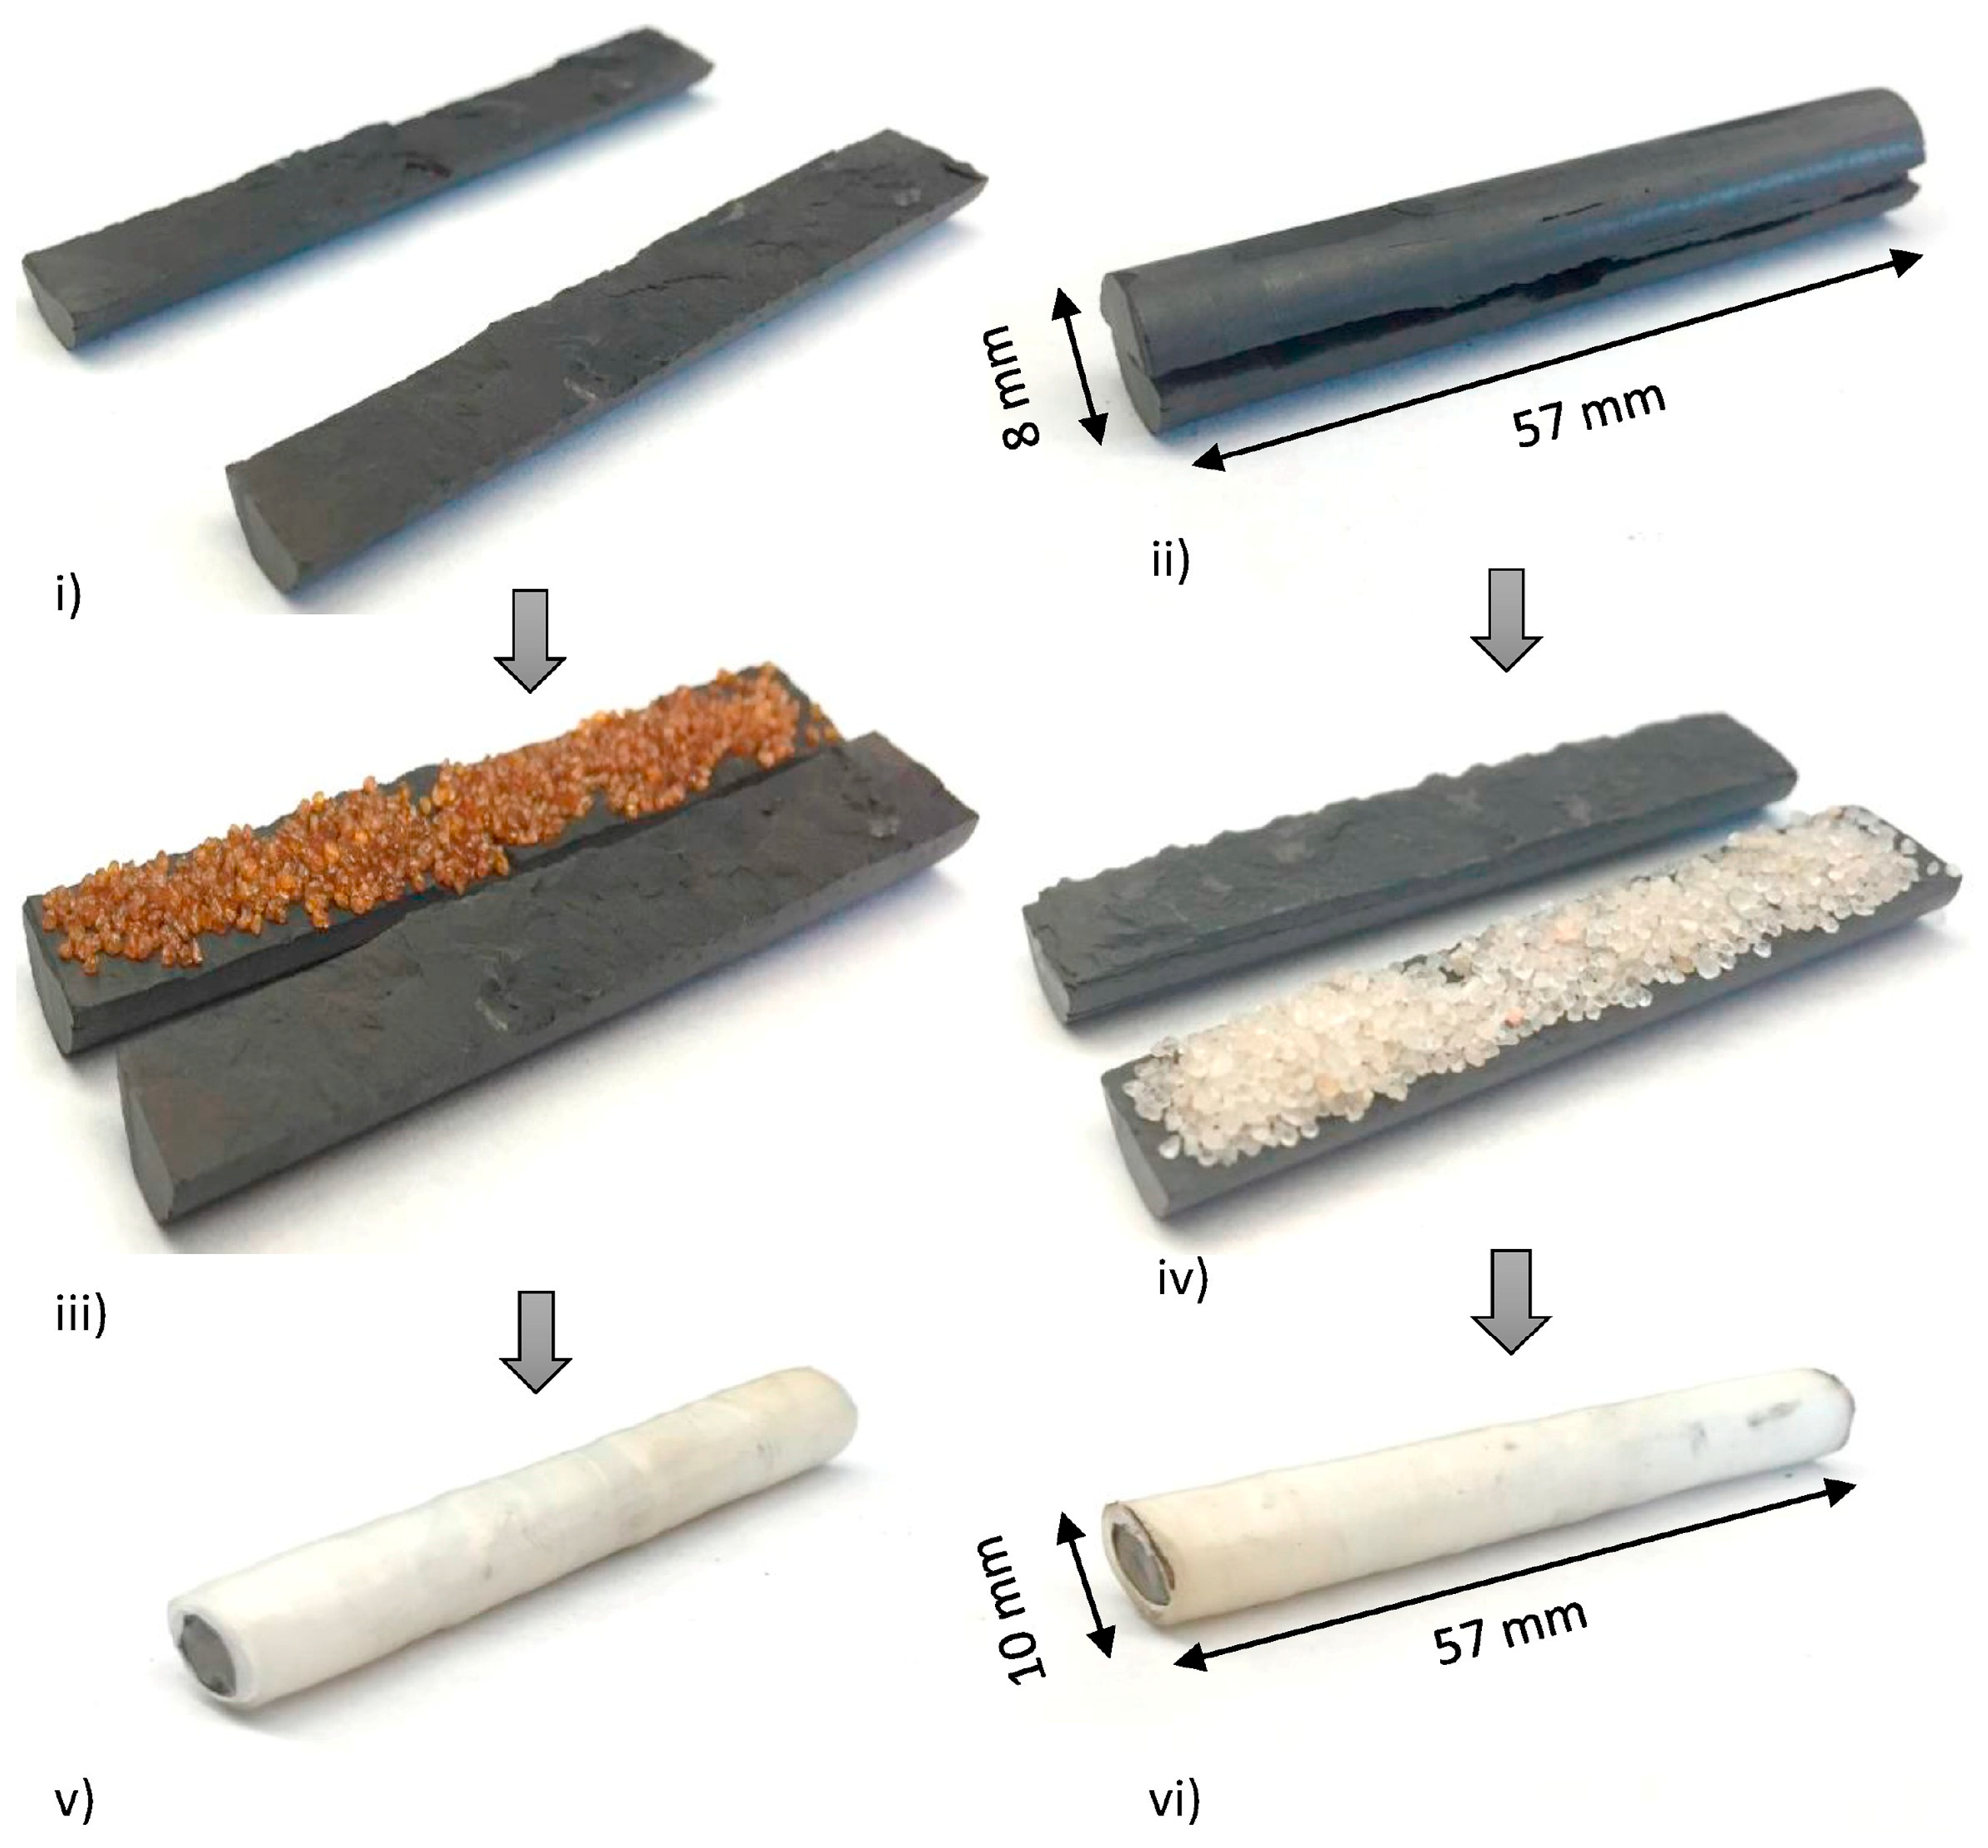
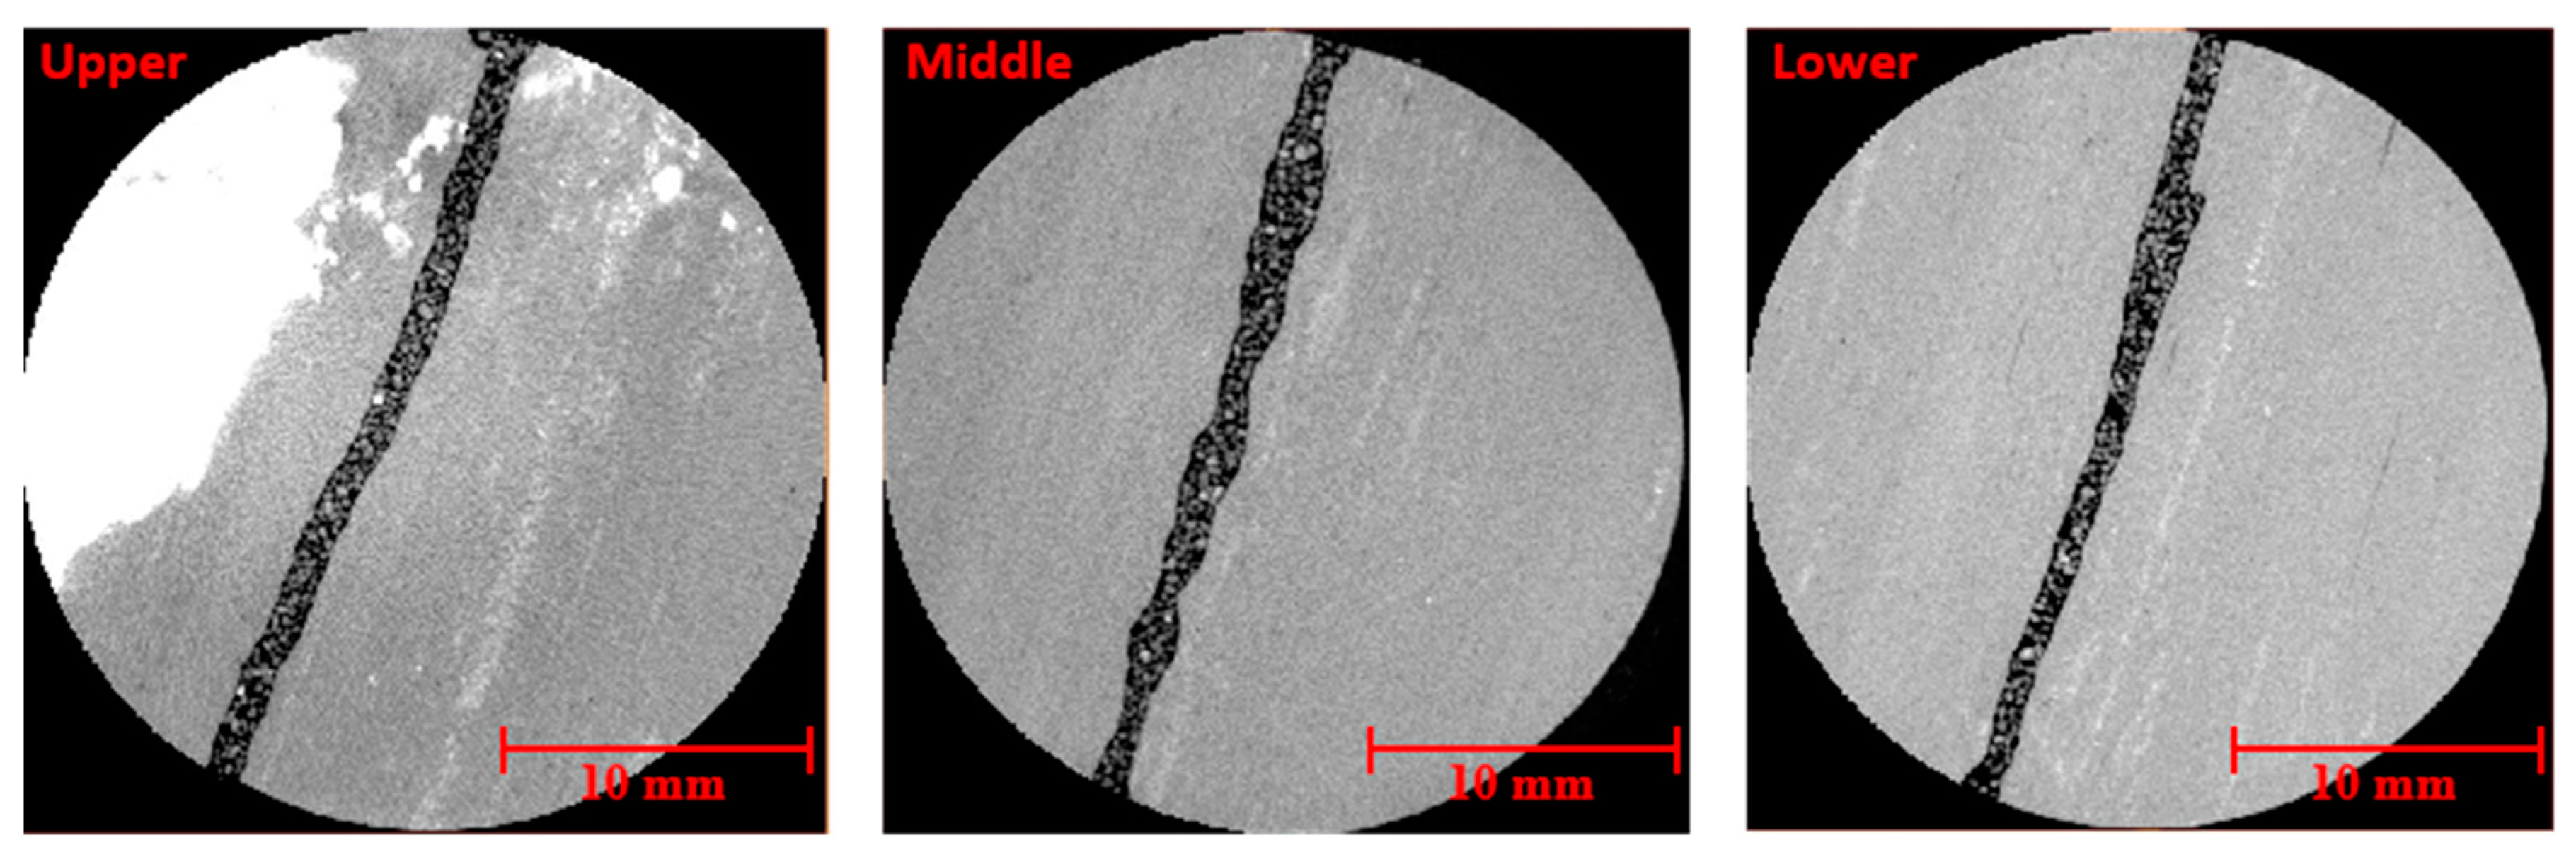
2.3. Preparation of Fractured Core with Proppant Fill

The Brazilian splitting method was utilized to split cylindrical shale cores along bedding planes, ensuring axial symmetry. This method simulates the natural formation of rock fractures by applying pressure orthogonal to the axis of the core sample, which better replicates the true fracture morphology of shale reservoirs than linear cutting [31]. Multiple measurements of the length and width of the split segments were taken, and their averages were calculated to minimize errors. This method provides a better simulation of the expansion morphology of shale fractures during hydraulic fracturing than cores obtained using glass plates, rock slabs, or wire cutting. For the preparation of fully propped fractured cores, an appropriate mass of proppant was first weighed and evenly distributed on the split segments of the shale core to prevent proppant loss. Subsequently, two 200-mesh (70 μm) sieves were placed at the inlet and outlet faces of the core to prevent any migration of proppant and/or shale fragments towards the core holder fittings and pipelines. Finally, the core was sealed and secured with heat shrink film. CT scanning was performed on the prepared proppant-filled fractured cores, as illustrated in Figure 3, demonstrating uniform proppant distribution throughout the core. This indicates that the method employed for preparing fractured cores filled with proppant meets the experimental requirements.
The design scheme for fractured rock core filled with proppant is shown in Table 2.

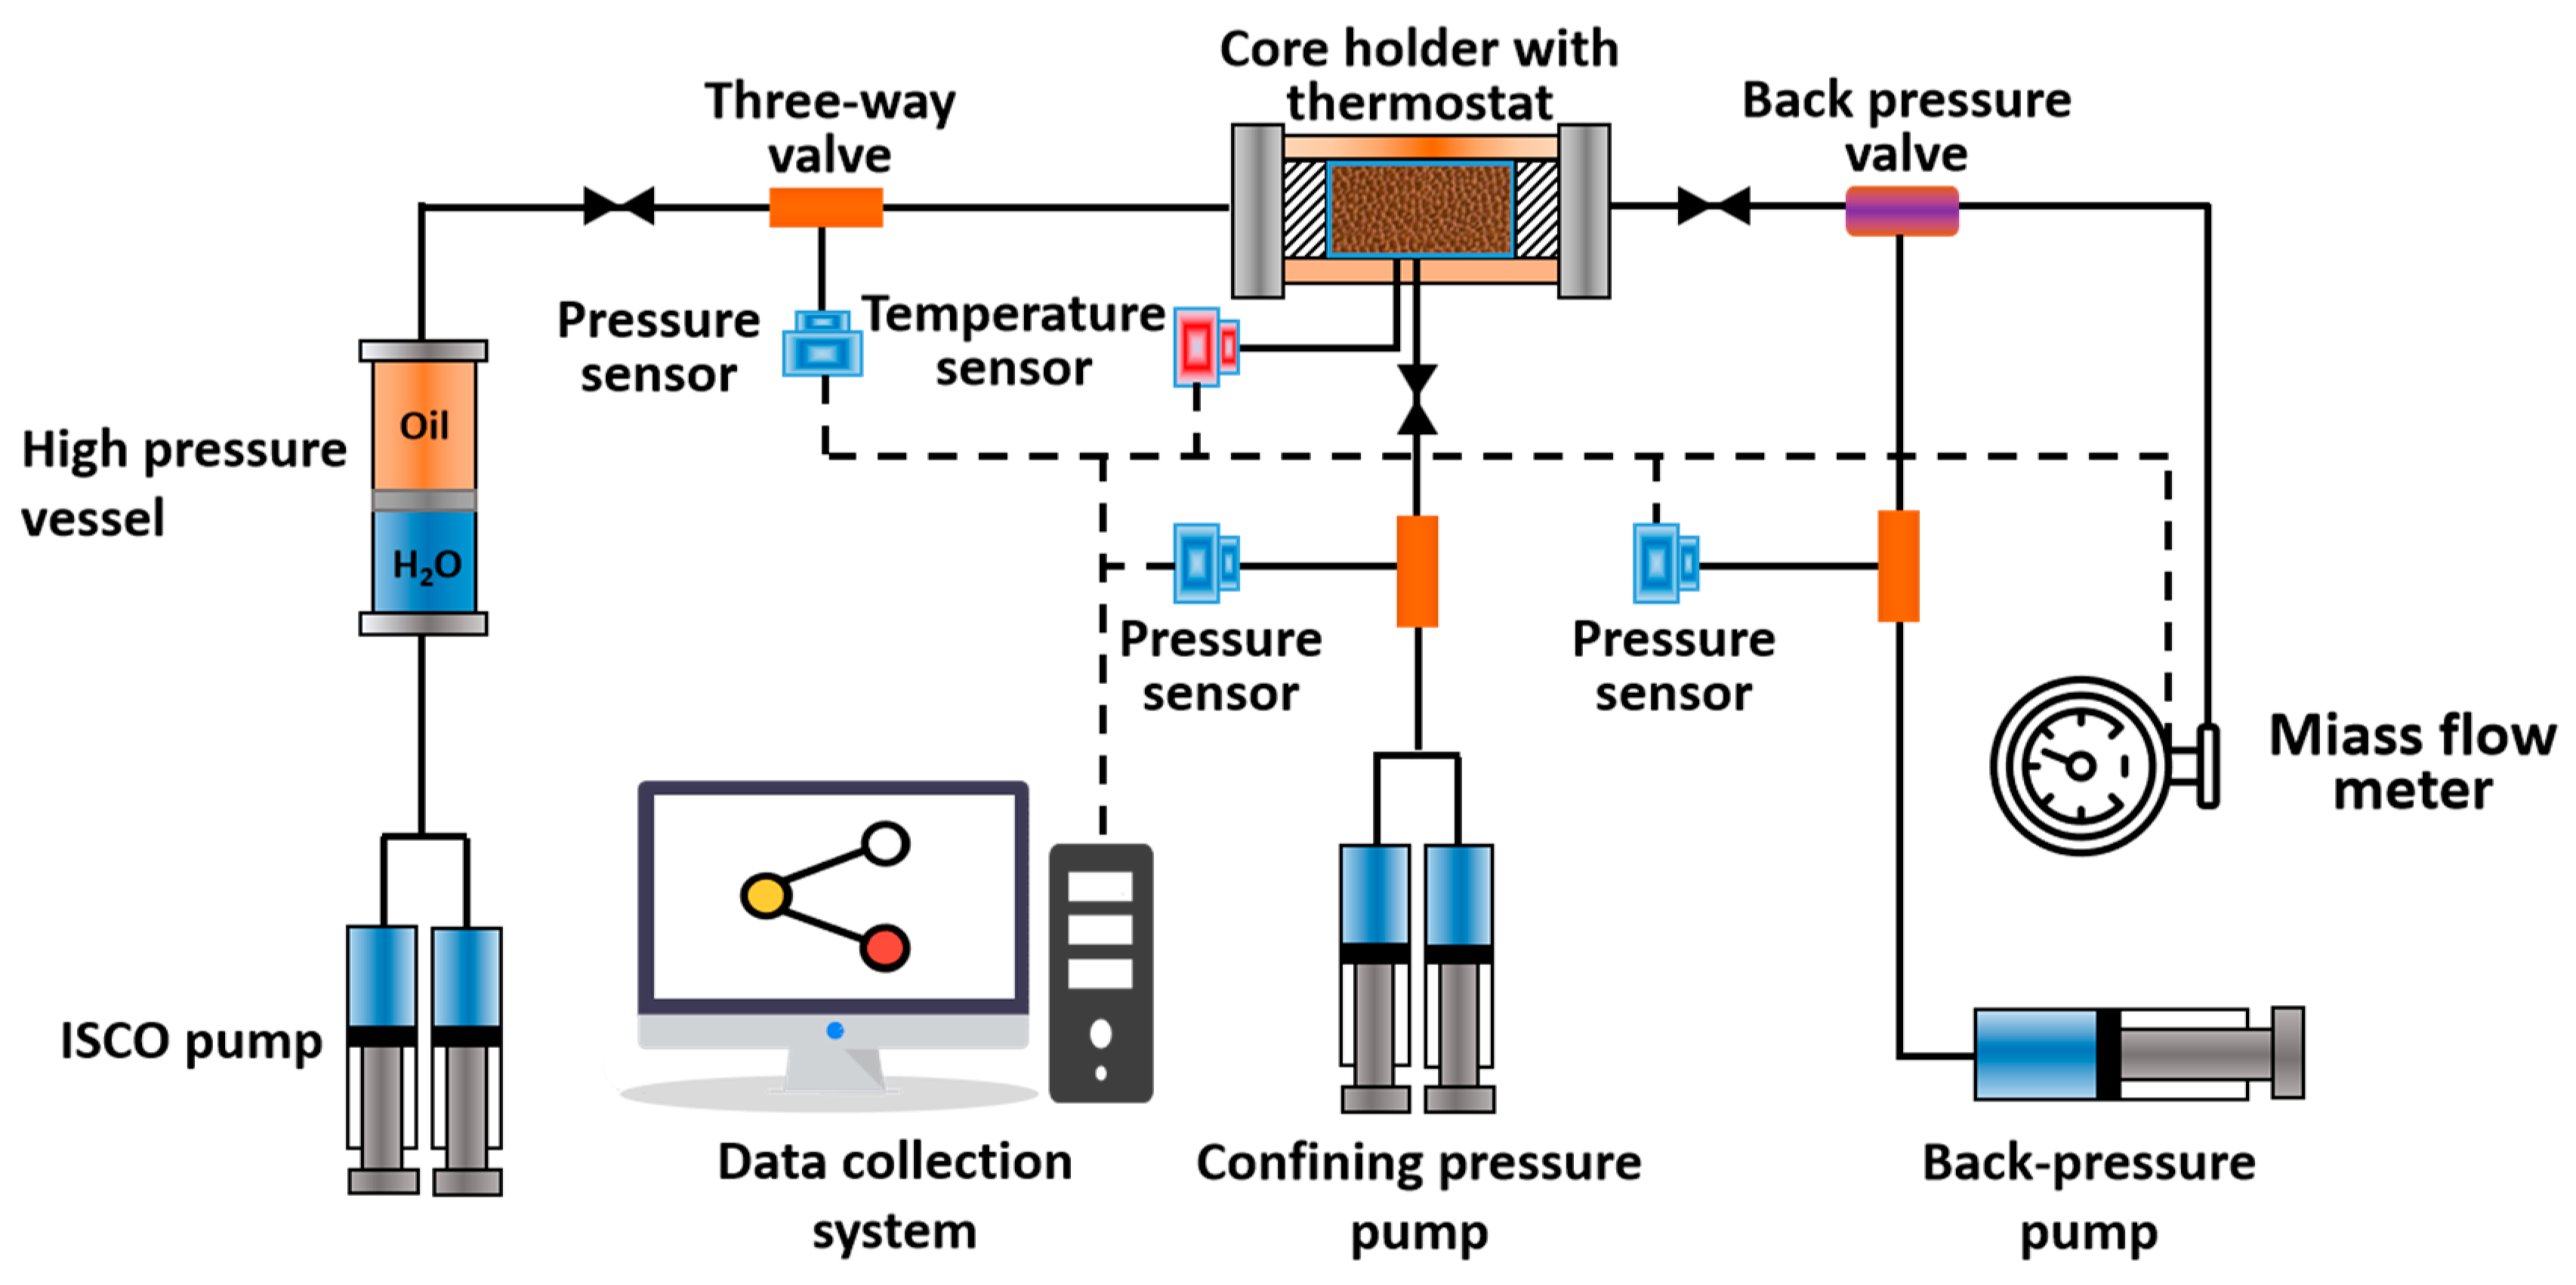
2.4. Stress Sensitivity Test Method

The experimental equipment utilized for stress sensitivity testing is the independently developed TC-180 cylindrical rock core stress sensitivity testing system, as illustrated in Figure 4. The apparatus consists mainly of a constant temperature device, temperature sensor, pressure sensor, high-temperature rock core clamp, confining pressure pump, flow pressure pump, back pressure pump, liquid flowmeter, data collection system, and other components. The data collection system utilizes the Ht3.0 temperature-pressure acquisition software designed by Jiangsu Haian Petroleum Scientific Instrument Co., Ltd., Nantong, China.
To ensure complete sealing during the testing process, all components, such as pipelines, valves, and fittings in the equipment, including the high-temperature rock core clamp that employs a special rock core sleeve, are specifically designed for ultrahigh-pressure applications with a maximum operating pressure exceeding 30% of the equipment’s design pressure. The maximum working pressure of the system can reach 180 MPa, with the highest working temperature being 150 °C.
Based on well logging data, the reservoir midpoint temperature is around 80 °C, with an original formation pressure of 50 MPa and overlying rock pressure of 80 MPa. Experimental conditions mimic this setup, with a temperature of 80 °C, initial flow pressure matching the original reservoir pressure of 50 MPa, and confining pressure set at 80 MPa to simulate overlying rock pressure. The development process of shale reservoirs consists of stages relying on reservoir energy elastic development and replenishment development. To simulate the stress sensitivity during these two stages, stress sensitivity tests under cyclic loading conditions are required, wherein the gradual increase in effective stress simulates the reservoir’s elastic development phase, and the gradual decrease in effective stress simulates the replenishment development phase [34]. The experimental steps are as follows.
(1)
Connect the experimental instruments and inspect their sealing integrity.
(2)
Place the saturated oil rock core into the high-temperature rock core clamp and set the temperature to 80 degrees Celsius. Once the temperature stabilizes, gradually increase the confining pressure and flow pressure to 80 MPa and 50 MPa, respectively.
(3)
Reduced flow pressure stress sensitivity test (simulating the elastic development phase): Maintain the confining pressure at 80 MPa and gradually adjust the flow pressure. The difference between the confining pressure and flow pressure is regarded as the effective stress. By gradually decreasing the fluid pressure, the effective stress sustained by the core gradually increases. Data on stable flow rate and pressure are recorded at effective stress levels of 30, 35, 40, 50, and 60 MPa.
(4)
Increased flow pressure stress sensitivity test (simulating replenishment development phase): Maintain the confining pressure at 80 MPa and gradually adjust the flow pressure. Gradually increasing the fluid pressure leads to a gradual decrease in the effective stress sustained by the core. Similarly, data on stable flow rate and pressure are recorded at effective stress levels of 60, 50, 40, 35, and 30 MPa.
Since the proppant-filled fractured core is used to simulate stress sensitivity tests after hydraulic fracturing replenishment, only experimental steps (1) to (3) are performed when conducting stress sensitivity tests on proppant-filled fractured cores.
Shale is a porous medium, and the permeability (k) of rock core can be calculated using Darcy’s law, as shown in Equation (1):
k = 10 Q μ L A Δ P
where k is the permeability (×10−3 μm2), Q is the fluid flow rate through the porous medium (mL/s), μ is the fluid viscosity (mPa⋅s), L is the rock core length (cm), A is the rock core cross-sectional area (cm2), and Δp is the pressure difference across the rock core (MPa).
For the proppant filling fractured core, the internal structure of artificial fractures can be regarded as a porous medium formed by the accumulation of proppants. Typically, the electrical conductivity (Df) is used as the evaluation parameter for stress sensitivity instead of permeability [35]. Electrical conductivity is defined as the product of fluid permeability through the porous medium and the equivalent fracture width. The electrical conductivity can be expressed by Equation (2):
D f = k w f = 10 Q μ L d f Δ P
where Df is the conductivity (×10−3 μm2·cm), wf is the equivalent fracture width (cm), and df is the width of the splitting section (cm).

3. Results and Discussion

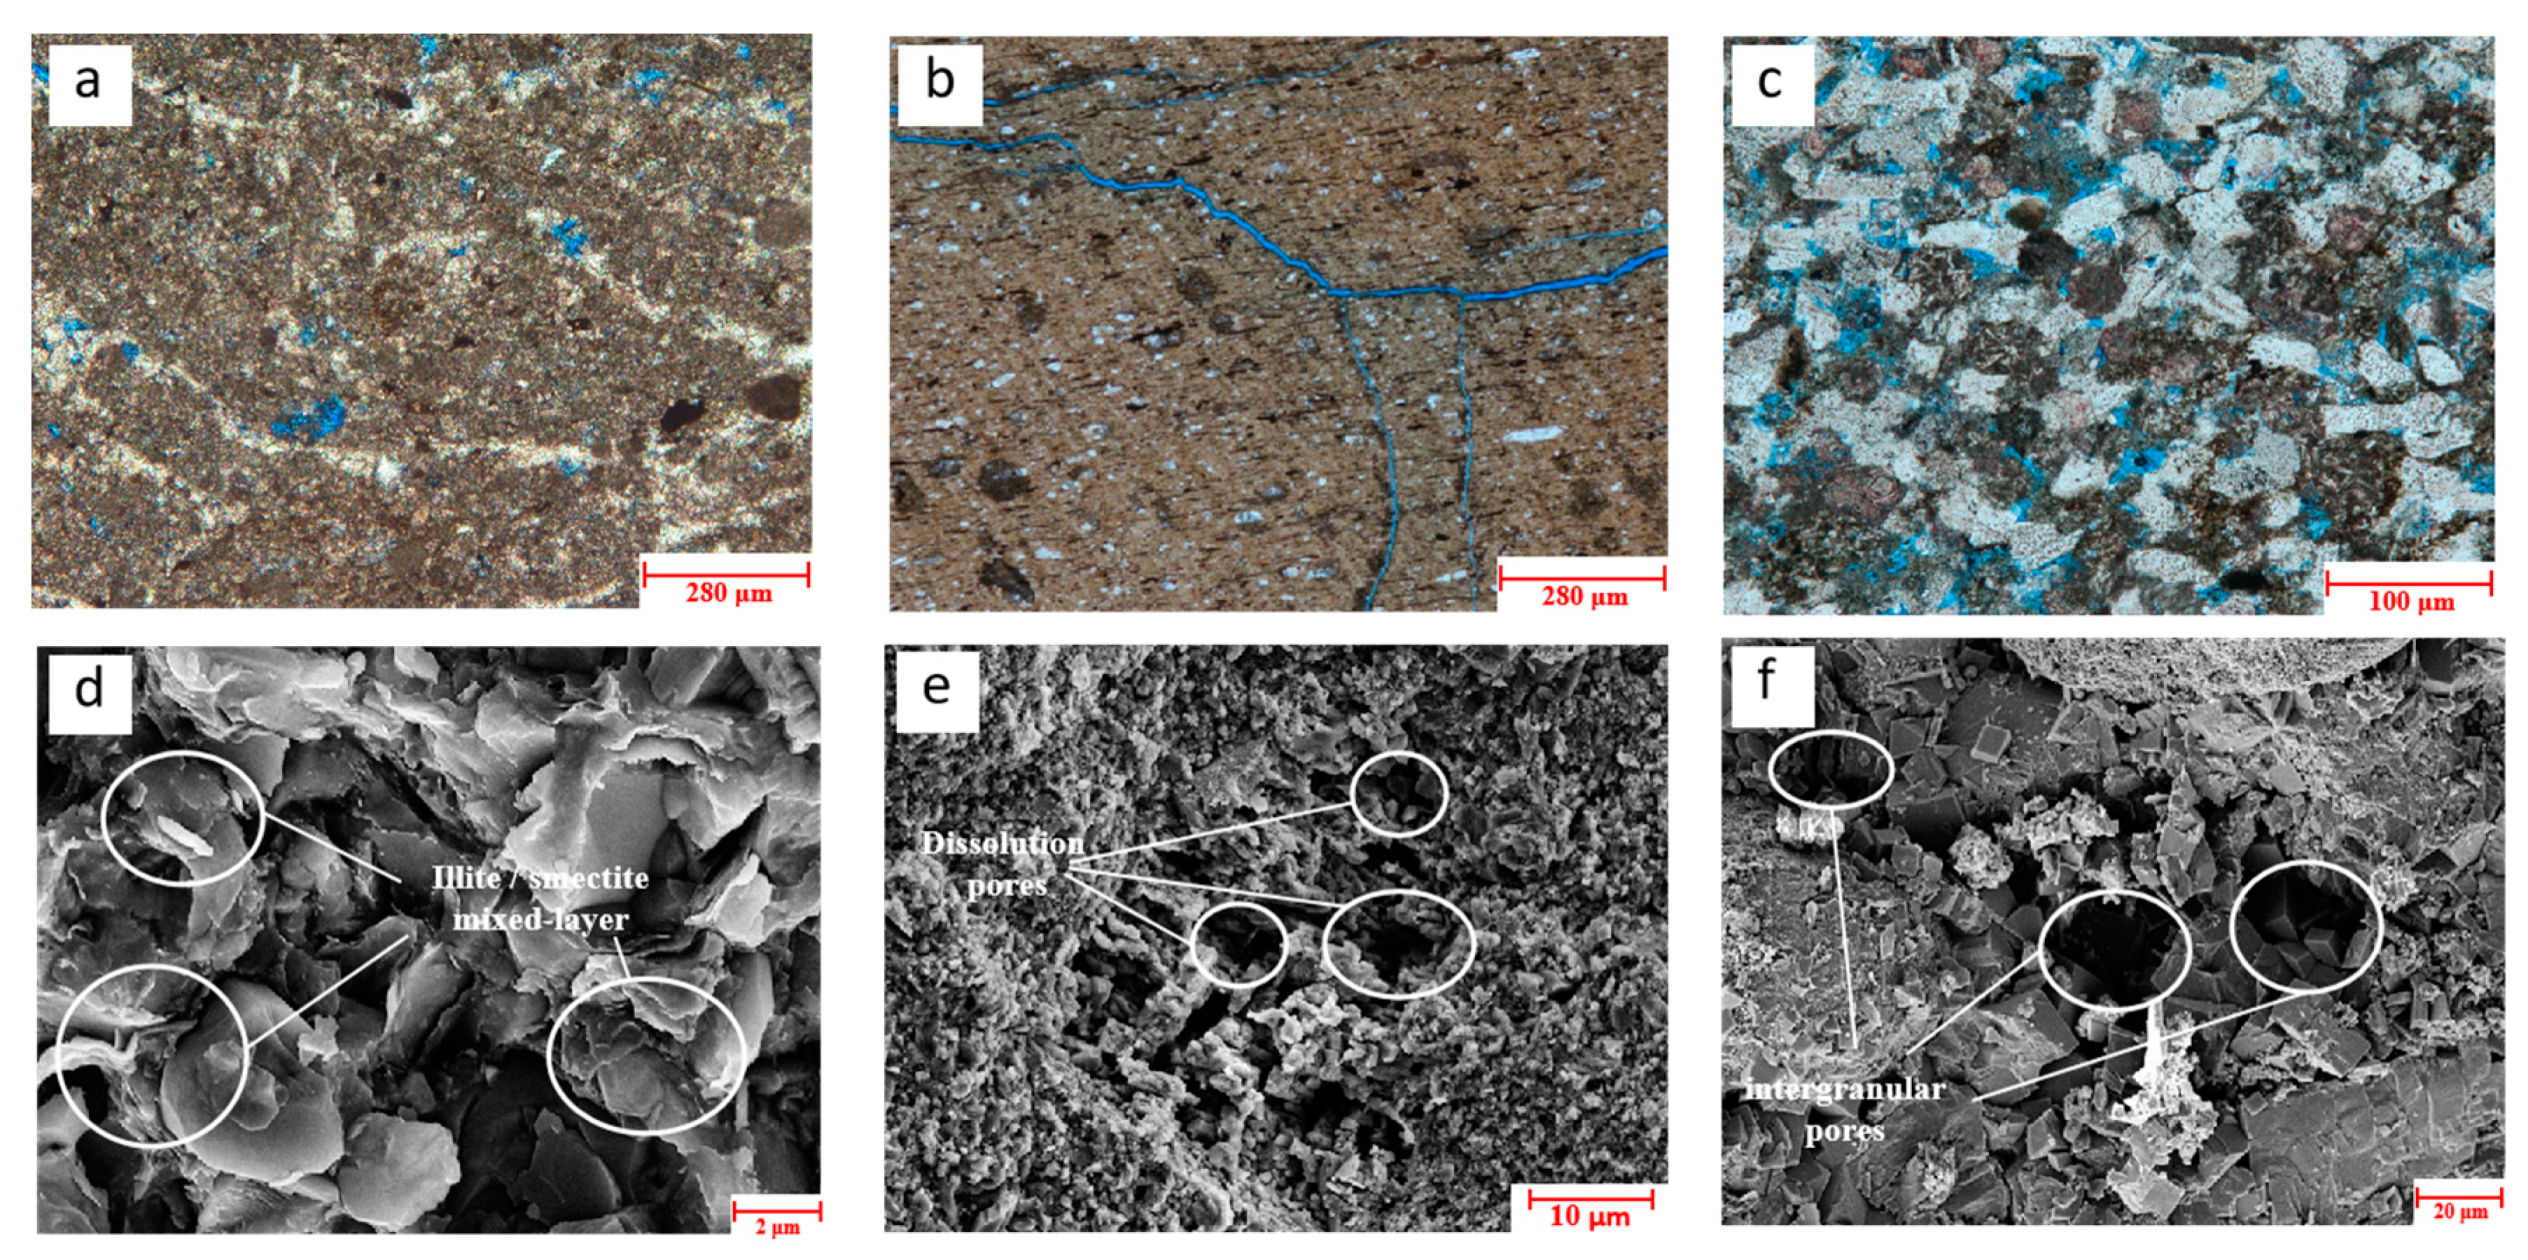
3.1. Mineral Composition and Microstructure of Rocks

The mineral composition of the core samples was analyzed using a DX-2700 X-ray diffractometer. The test results are presented in Table 3. The analysis revealed that the main minerals in the Jimsar shale from Xinjiang include quartz, feldspar, calcite, dolomite, and various clay minerals, with quartz and feldspar showing relatively high abundance, indicative of their brittle nature. Moreover, notable differences in mineral composition were observed between the two lithologies. In the sandy argillaceous shale, dolomite content was higher and clay mineral content lower, with an average of 28.02%. Conversely, in the clayey argillaceous shale, dolomite content was lower and clay mineral content relatively higher, averaging at 17.53%.
The results of cast thin sections (CTSs) and scanning electron microscopy (SEM) tests are shown in Figure 5. Observations from the CTSs and SEM reveal various pore types in Jimsar shale, including intergranular pores, intercrystalline pores, and dissolution pores, with some core samples exhibiting natural fracture development. Figure 5a,b display CTSs of clayey argillaceous shale core samples, where intergranular spaces are filled with clay minerals, and the predominant cement type is matrix-supported. Figure 5b also shows distinct features of microfracture development, which are further observed under SEM (Figure 5d), revealing irregular illite/smectite mixed-layer minerals phases. Figure 5c presents CTSs of sandy argillaceous shale core samples, mainly composed of detrital grains with point or line contacts between them, and the dominant cement type is clastic. SEM observations reveal the presence of dissolution pores (Figure 5e) and intergranular pores (Figure 5f) in the sandy argillaceous shale core samples, with rhombohedral calcite crystals observed within the pores in Figure 5f.

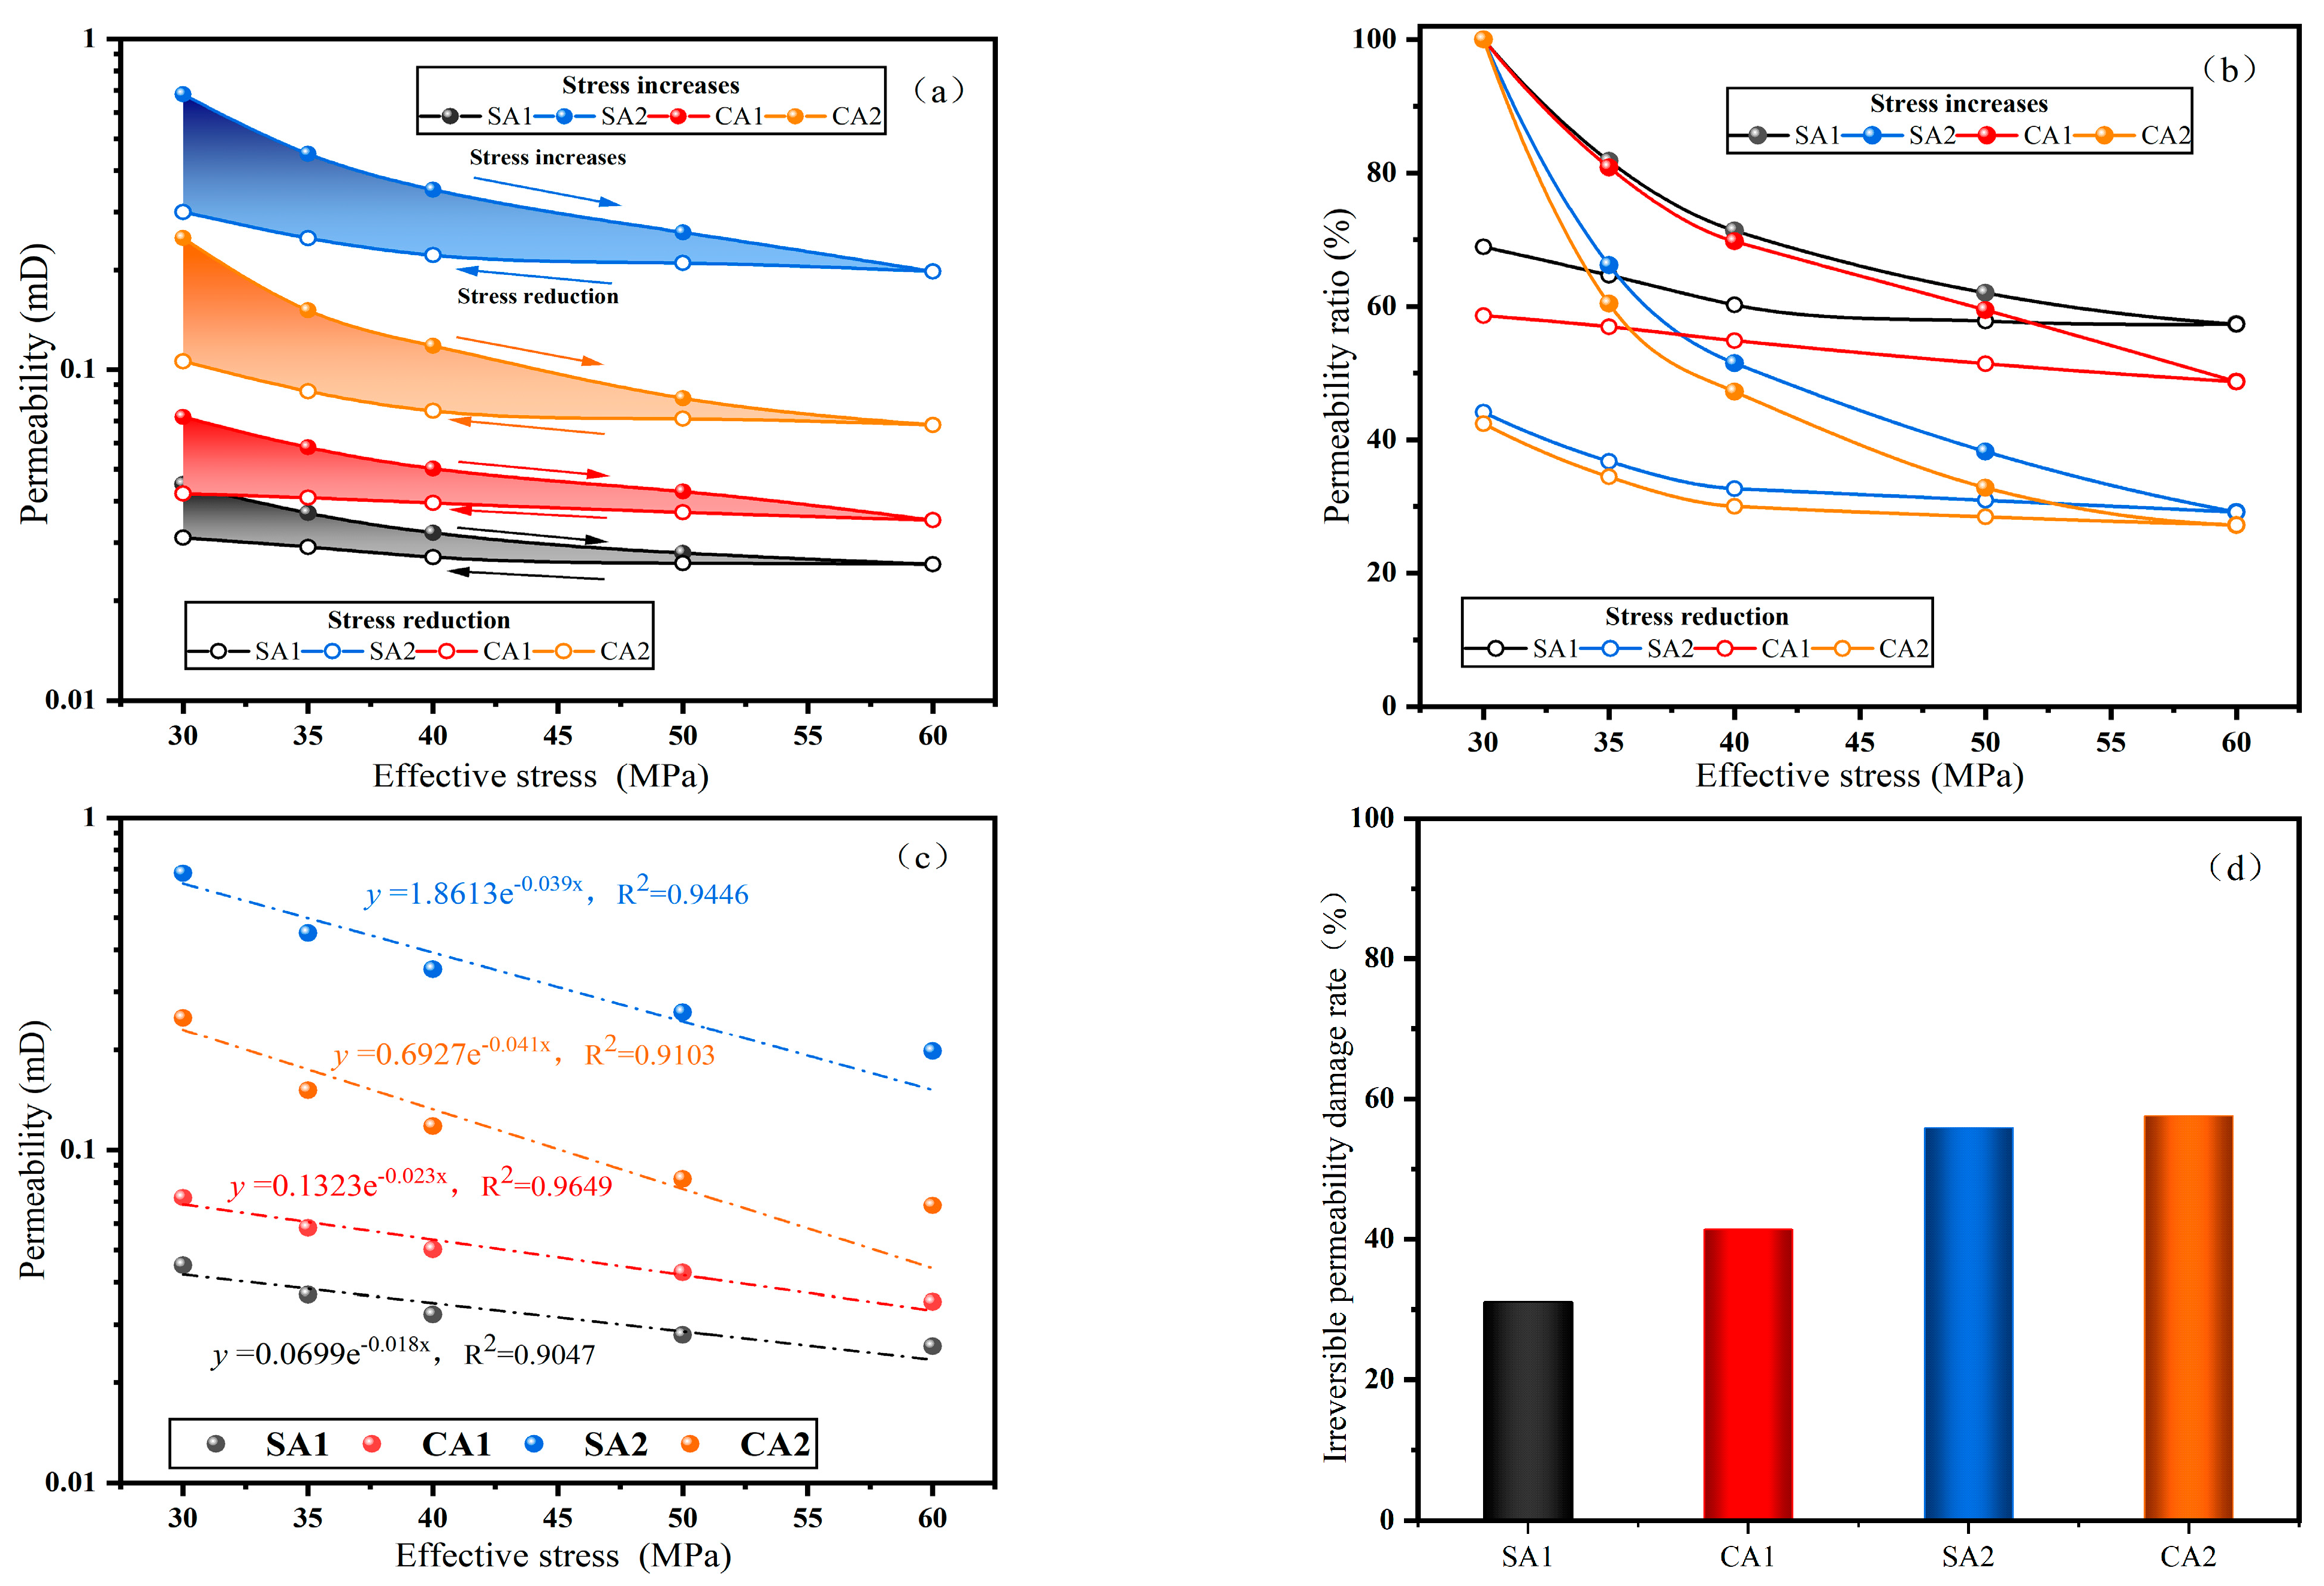
3.2. Stress Sensitivity of Natural Core Permeability

Shale reservoirs are renowned for their tightness, with the development of large pores and microfractures serving as the primary natural conduits for oil and gas migration [36]. In this study, permeability stress sensitivity tests were conducted on natural core samples from two lithological shale formations in Jimusaer, Xinjiang under cyclic loading conditions. The experimental results are presented in Figure 6. It is noteworthy that SA2 and CA2 represent fracture-type cores developed in sandy argillaceous shale and clayey argillaceous shale, respectively, while SA1 and CA1 represent pore-type cores in sandy argillaceous shale and clayey argillaceous shale. As shown in Figure 6a, the permeability of fracture-type cores is significantly higher than that of pore-type cores, differing by an order of magnitude.
However, with the increase in effective stress, the permeability of the cores decreases markedly, with the reduction in permeability being more pronounced for fracture-type cores than for pore-type cores. This indicates that the naturally occurring fractures in the reservoir enhance fluid migration efficiency, yet their permeability is more sensitive to reservoir stress variations.
Due to the inherent differences in permeability between the two lithological core samples, in order to compare the stress sensitivity of these cores, the ratio of core permeability under different effective stresses to the initial permeability at the initial effective stress of the formation (30 MPa) was plotted. This comparison is depicted in Figure 6b, illustrating how the ratio of core permeability to initial permeability varies with changes in effective stress. It is evident that there is a significant difference in the permeability ratio between the pore-type cores of sandy argillaceous shale and clayey argillaceous shale. At 60 MPa, the permeability ratio for sandy argillaceous shale (SA1) is 68.89%, while for clayey argillaceous shale (CA1), the permeability ratio is 58. 61%.
The ratio of permeability change only characterizes the stress sensitivity state under individual effective stresses and cannot represent the stress sensitivity state under continuous changes in effective stress. Researchers typically perform exponential fitting on the permeability at various effective stresses, where the coefficient of the exponential term, termed the stress sensitivity coefficient, is used to characterize the overall stress sensitivity [37,38].
Therefore, we performed exponential fitting on the permeability curves with increasing effective stress for four core samples (Figure 6c). It can be observed that the stress sensitivity coefficient of fractured core samples is greater than that of pore-type core samples. This result is consistent with the findings of Duan et al. [39]. However, overall, the stress sensitivity coefficients of both pore-type and fracture-type cores are higher than those reported by Duan et al., which could be attributed to differences in the properties of the experimental test cores and variations in the range of effective stress testing. Additionally, there is a significant difference in the stress sensitivity coefficients between the two types of porous core samples, with the stress sensitivity coefficient for the sandy argillaceous shale core (SA1) being 0.018 and for the clayey argillaceous shale core (CA1) being 0.023. In contrast, the stress sensitivity coefficients of the two fractured core samples are nearly similar, with the stress sensitivity coefficients for the sandy argillaceous shale core (SA2) and clayey argillaceous shale (CA2) being 0.039 and 0.041, respectively.
Generally, as the pore fluid pressure decreases, the internal pore throats of shale are further compressed. Due to the high plasticity of clay minerals, deformation is more likely to occur as the rock framework bears increased stress. Therefore, clayey argillaceous shale, with a higher clay mineral content, is more prone to compression and less likely to recover deformation under stress. In contrast, sandy argillaceous shale, with a higher content of brittle minerals, such as clay, relies mainly on particle support for its structural integrity. The compression of pores in such rocks is more elastic, resulting in smaller changes in compression. Consequently, clayey argillaceous shale exhibits a stronger sensitivity to stress than sandy argillaceous shale. Figure 6d compares the irreversible permeability change ratio of four core samples. The irreversible permeability change ratio is defined as the ratio of core permeability when the effective stress is restored to the original reservoir stress state to the initial core permeability. It can be observed that the irreversible permeability change ratio of clayey argillaceous shale is higher than that of sandy argillaceous shale, especially for porous core samples, providing further evidence for the previously mentioned observations.
However, there was no significant difference observed in the stress sensitivity coefficient of the two lithological fractured cores. This could be attributed to the gradual closure of fractures with increasing effective stress, wherein the fine particles cementing the fracture surfaces of the argillaceous siltstone are gradually detached from the rock matrix due to fluid flushing and stress variations, thereby accumulating and blocking the fracture pathways, resulting in a decrease in permeability. In contrast, the higher content of clay minerals in clayey argillaceous shale leads to more stable bonding between particles and clay minerals within the rock matrix, thereby maintaining better fluid flow pathways within the fracture channels.

3.3. Stress Sensitivity of Fractured Rock Cores with Proppant Fill

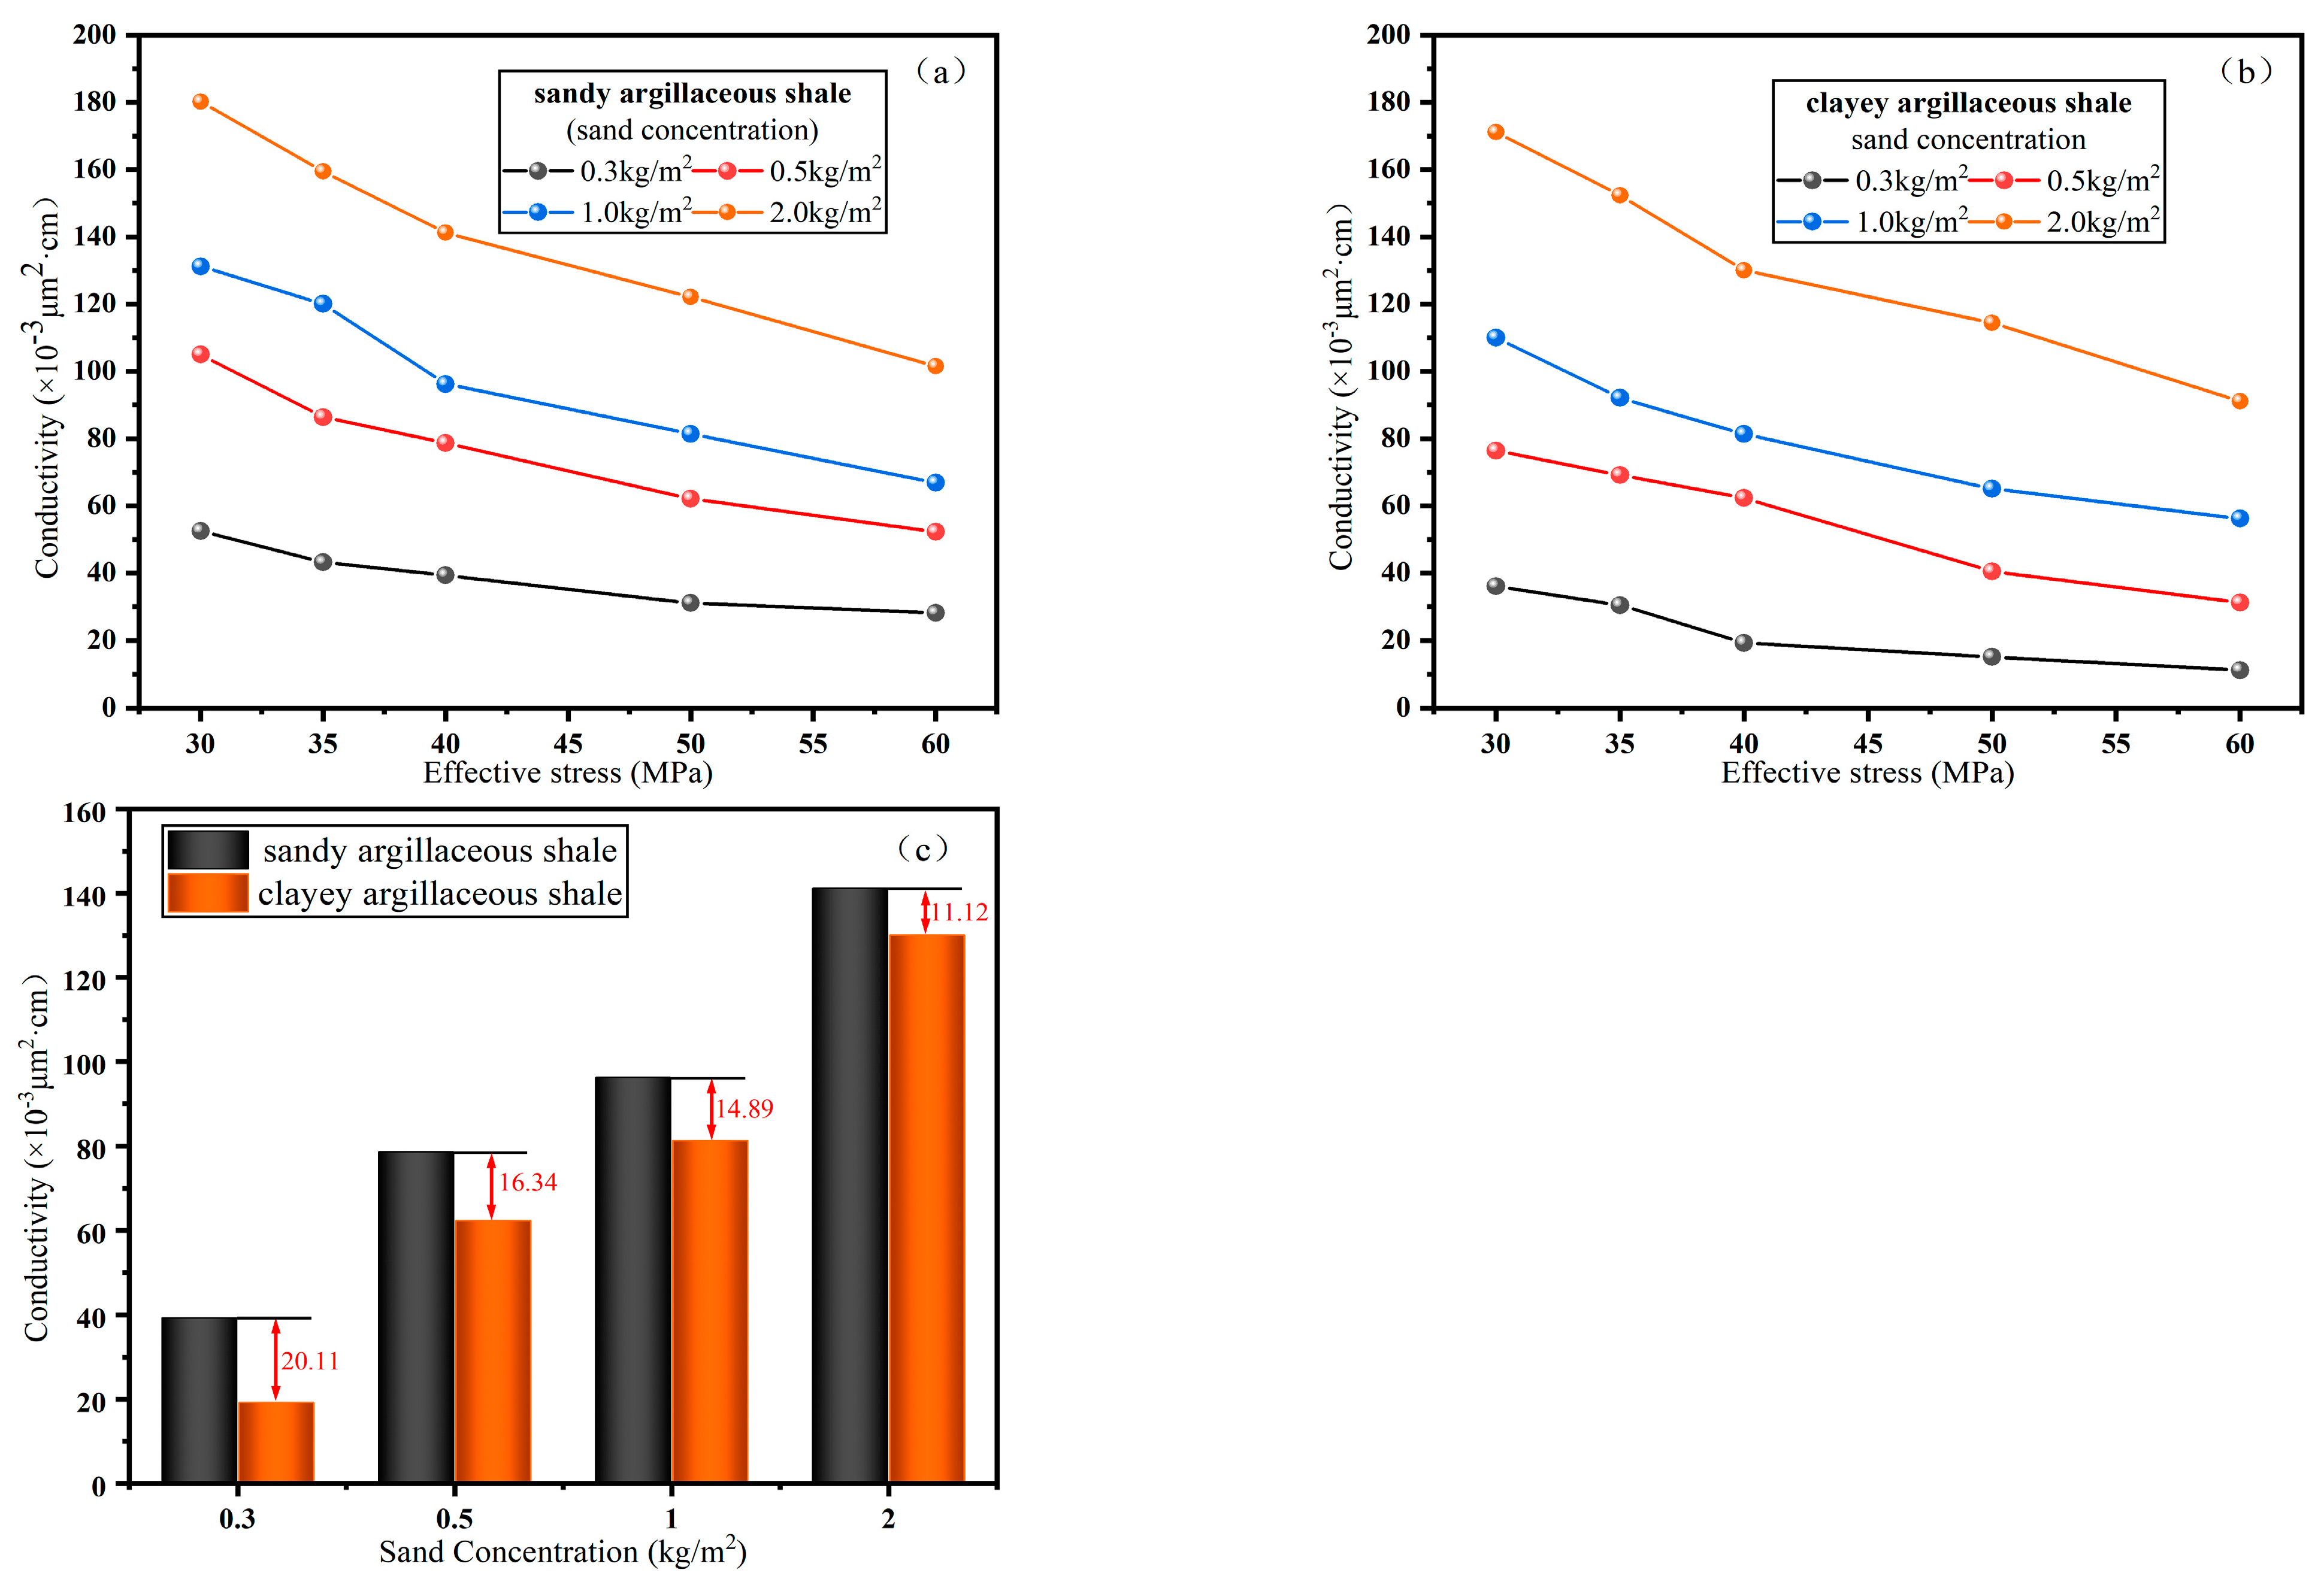
3.3.1. Influence of Proppant Concentration and Rock Mineral Composition on Core Conductivity

Zou et al. [40] investigated the conductive capacity of proppants under stress sensitivity using three different rough plates with varying concentrations and particle sizes. The study indicated that larger proppants contribute to enhancing the conductivity of fractured cores. However, due to gravitational settling, larger proppants tend to migrate shorter distances with the carrying fluid. Field experiments have shown that smaller proppants can increase the transport distance of proppants, thereby providing effective support to hydraulic fracturing fractures.
At present, as regards this research, medium-sized proppants (40–70 mesh) are primarily employed as the main proppants. Therefore, in examining the influence of various proppant placement concentrations on conductivity, 40–70 mesh quartz sand proppant was chosen. The corresponding mass of quartz sand was weighed, and fractured core samples were created for proppant filling. Proppant concentrations were set at 0.3, 0.50, 1.0, and 2.0 kg/m2, denoted Case 1–4s and 10–13. In these two sets of experiments, proppant concentrations were the same, with the only difference being the rock type of the fractured core used. Specifically, Cases 1–4 utilized fractured cores of sandy argillaceous shale, while Cases 10–13 utilized fractured cores of clayey argillaceous shale. The experimental results are illustrated in Figure 7.
From Figure 7a,b, it can be observed that on one hand, with the increase in effective stress, the conductivity of both types of rock cores gradually decreases. As the concentration of proppant increases, the conductivity of the cores gradually increases. When the proppant concentration is 0.5 kg/m2, with the effective stress increasing from 30 MPa to 60 MPa, the change in rock core conductivity is 37.22%. When the proppant concentration reaches 2.0 kg/m2, with the effective stress increasing from 30 MPa to 60 MPa, the change in rock core conductivity is 29.15%. This indicates that increasing the proppant concentration is beneficial for enhancing the flow conductivity of fractures.
On the other hand, under the same proppant concentration, there are differences in the conductivity of cores between the two types of rocks. The conductivity of cores filled with proppants in sandy argillaceous shale is higher than that in clayey argillaceous shale. This is primarily because clayey argillaceous shale contains a higher proportion of clay minerals. Previous studies by scholars have shown that support agents tend to exhibit more pronounced embedding in rocks with higher clay content [41,42]. As effective stress increases, the degree of crack closure also increases, ultimately reducing the crack conductivity.
In Figure 7c, the comparison of conductivity between the two types of rock cores at an effective stress of 40 MPa is presented. It can be observed that as the concentration of proppant increases, the difference in conductivity between the two types of rock cores decreases. When the proppant concentration is 0.3 kg/m2, the conductivity of the sandy argillaceous shale core is 20.11 (×10−3 μm2·cm) times that of the clayey argillaceous shale core. However, when the proppant concentration increases to 2 kg/m2, the conductivity of the sandy argillaceous shale is only 11.12 (×10−3 μm2·cm) times that of the clayey argillaceous shale. This phenomenon arises because at lower proppant concentrations, the proppant behaves similar to a single-layer support within the fracture plane, exerting a significant influence on the conductivity of the fracture. As the proppant concentration increases, it behaves more like a multilayered stack support within the fracture, and the impact of proppant embedding on the flow conductivity of the fracture gradually diminishes. At this point, the concentration of proppant plays a predominant role in affecting the flow conductivity of the fracture.

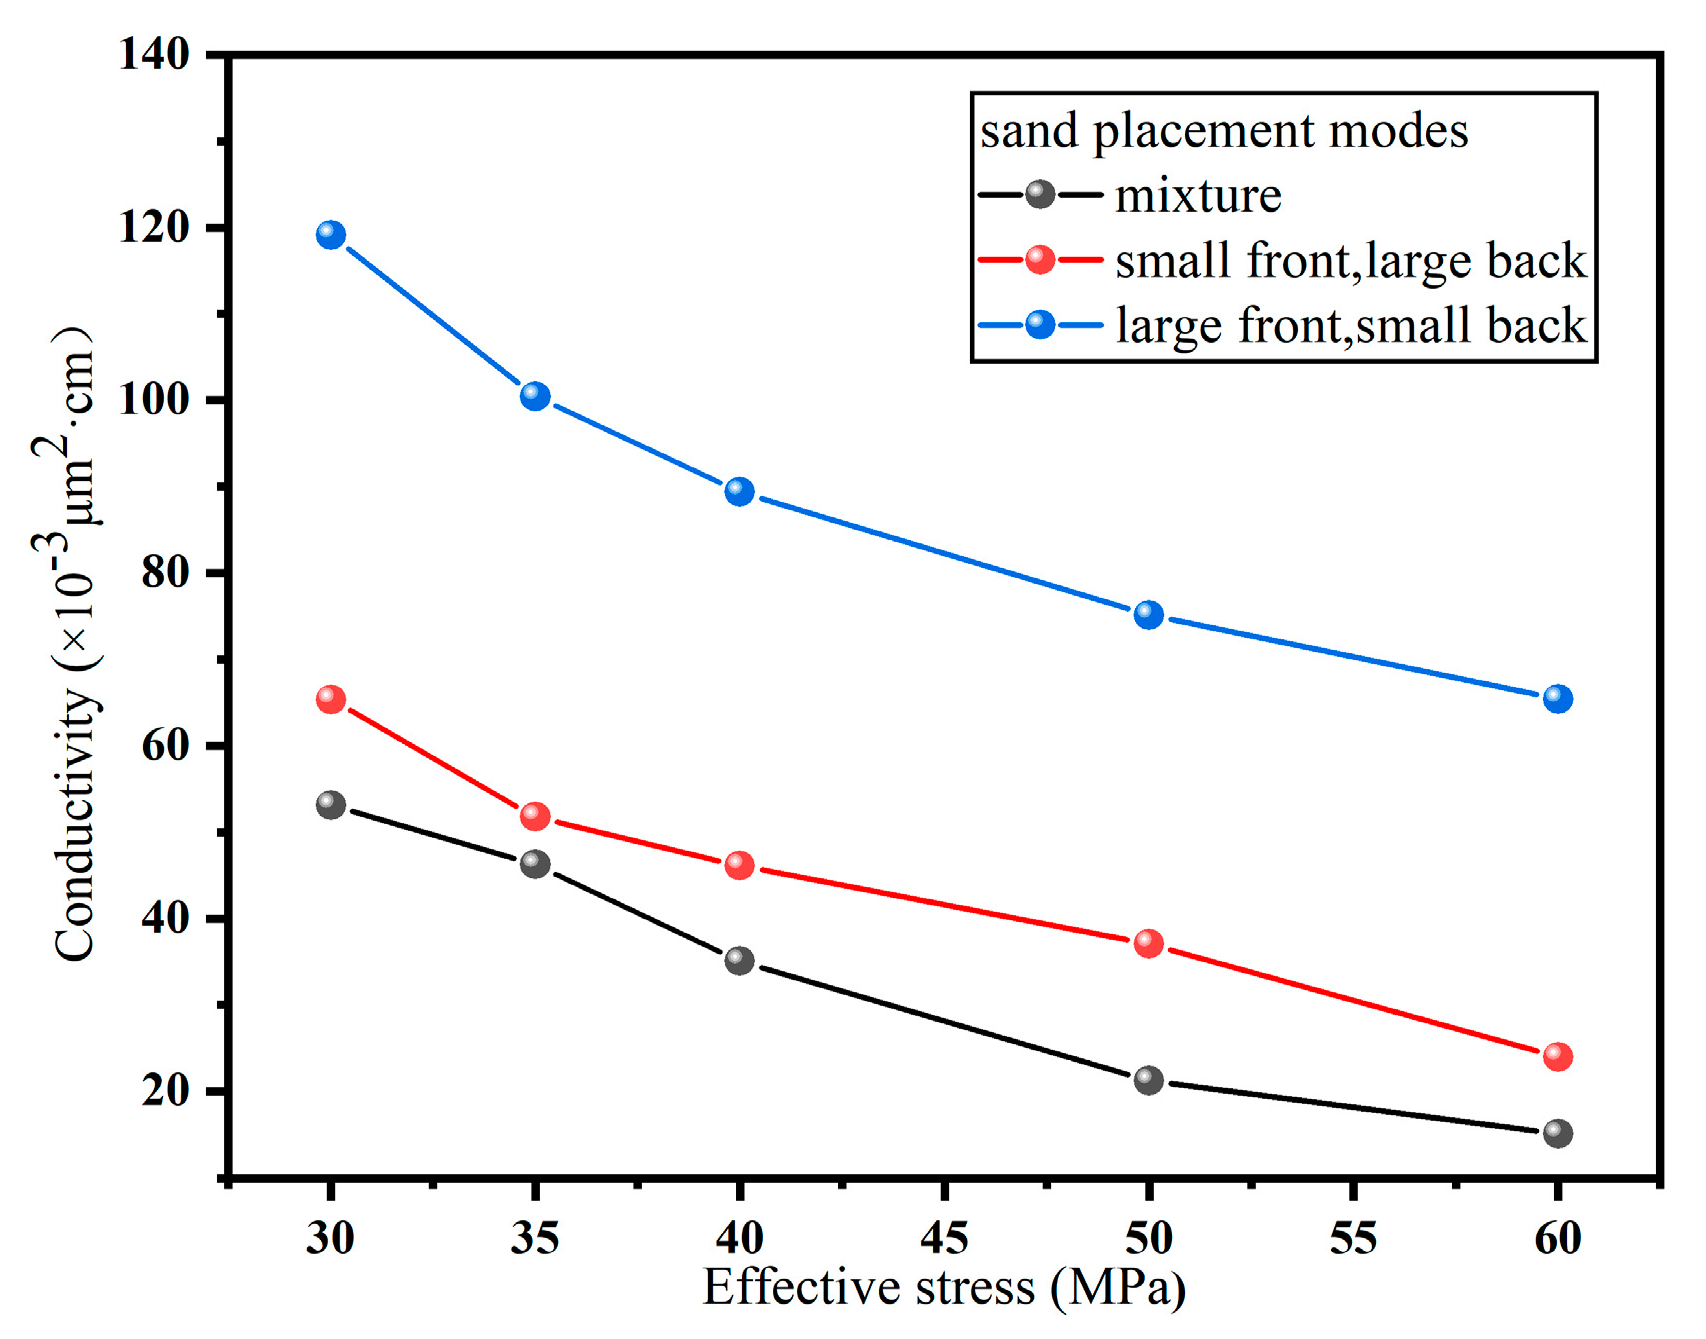
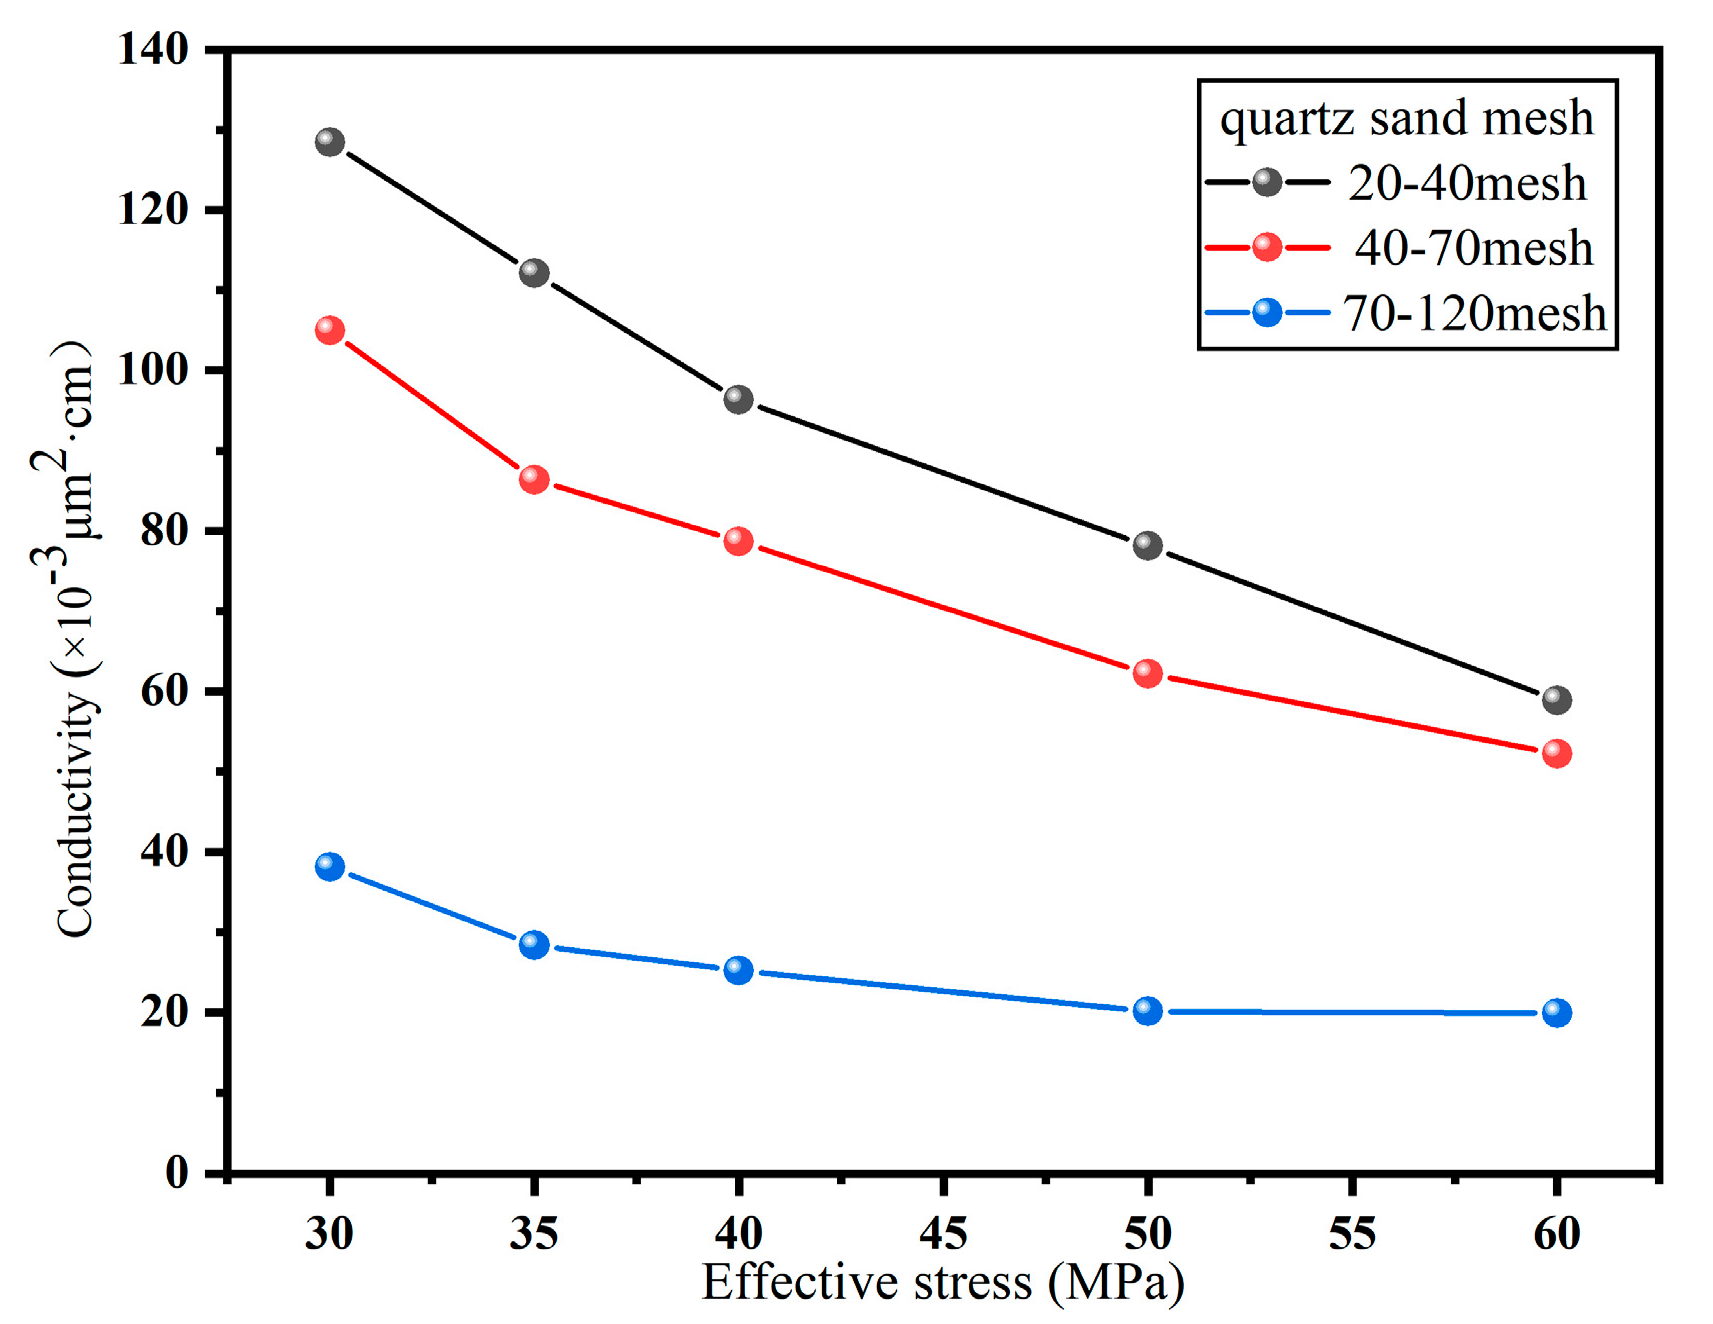
3.3.2. Impact of Proppant Particle Size and Proppant Filling Patterns on Rock Core Conductivity

This section compares the effects of proppant particle size and proppant filling patterns on the conductivity of rock cores. The rock cores utilized in this study are all of sandy argillaceous shale. Under a proppant concentration of 0.5 kg/m2, comparative experimental tests were conducted using 20–40 mesh, 40–70 mesh, and 70–110 mesh quartz sand proppants, corresponding to Cases 2, 5, and 6 in Table 2. It is worth noting that under the same operating conditions, different types of proppant exhibit varying effects on the conductivity of fractured cores. Advanced proppants such as ceramic proppant and resin-coated sand demonstrate superior propping effects to traditional quartz sand, but they also come with higher usage costs [26,43]. The experimental results on the impact of proppant particle size on conductivity are depicted in Figure 8.
Overall, as the mesh size of the proppant increases, the conductivity of the fractures significantly decreases. Additionally, as the effective stress increases, the conductivity decreases as well. Within the experimental testing range, the conductivity of the 20–40 mesh quartz sand is the highest, ranging from 66.78 × 10⁻³ to 132.43 × 10⁻³ μm2·cm. The second highest conductivity is observed with the 40–70 mesh quartz sand, ranging from 52.24 × 10⁻³ to 105.02 × 10⁻³ μm2·cm. The 70–120 mesh quartz sand exhibits the lowest conductivity, ranging from 10.88 × 10⁻³ to 42.07 × 10⁻³ μm2·cm. The experimental results indicate that larger proppant particles result in higher conductivity. This is because the porous medium composed of larger proppant particles has higher porosity. Smaller particle proppants tend to pack more tightly, thereby reducing conductivity. It is noteworthy that when the net stress increases from 30 MPa to 60 MPa, the conductivity of the 20–40 mesh proppant experiences the greatest decrease, with a total decrease of 54.2%. Elsarawy et al. [44]. conducted tests on the fragmentation rates of quartz sand proppants of different particle sizes under the same stress. Their results indicate that smaller proppants exhibit lower fragmentation rates compared to larger proppants under equivalent stress conditions. Consequently, as the effective stress gradually increases, a fraction of the quartz sand fractures into several smaller particles, obstructing effective flow channels, reducing original pore space, and ultimately results in decreased conductivity. The observed differences in conductivity decreases among proppants of various sizes suggest that larger proppants may imply poorer hardness and greater stress sensitivity.
Three different proppant filling patterns were tested for conductivity using 40–70 mesh quartz sand (50%) and 70–120 mesh quartz sand (50%), as shown in Cases 7–9 in Table 2. In Case 7, both proppant sizes were thoroughly mixed and laid out. In Case 8, the 40–70 mesh proppant was placed near the fluid inlet, while the 70–120 mesh proppant was placed near the fluid outlet. In Case 9, the 70–120 mesh proppant was arranged near the fluid inlet, while the 40–70 mesh proppant was arranged near the fluid outlet. The experimental results are shown in Figure 9.
It can be observed that the conductivity of fractures decreases with increasing effective stress. Under the same effective stress, there is significant variation in conductivity among the three different filling methods. Among them, Case 7 has the lowest conductivity, followed by Case 9, while Case 8 has the highest conductivity. For instance, at effective stress of 60 MPa, the conductivity for Case 7 is 15.12×10⁻³ μm2·cm, while for Case 9 it is 23.98×10⁻³ μm2·cm. The conductivity of Case 9 is 1.59 times that of Case 7. The conductivity for Case 8 is 65.43×10⁻³ μm2·cm, which is 4.33 times that of Case 7. This is because when different sizes of proppants are mixed and filled into the fractures of the core, the small proppants block the pores between the large proppant particles. With the increase in effective stress, the contact between the large and small proppants becomes tighter, making the flow channels more prone to compression. Compared to the small proppants, the large proppants provide better support. Placing the large proppants near the fluid inlet end of the core can precisely maintain the flow space of the fracture channels. Therefore, the filling method has a significant impact on conductivity. When using proppants to support fracturing cracks in oilfield operations, adjusting the proportion and filling method of the proppants can improve the conductivity of the fractures.

4. Conclusions

Through conducting simulated experiments on the stress sensitivity of the Jimsar shale in Xinjiang, China, this study investigated the influence of shale mineral composition and proppant filling patterns on the stress sensitivity of shale reservoirs. The following conclusions were drawn.
(1)
The natural Jimsar shale cores in Xinjiang are dense with low permeability. The stress sensitivity of pore-type shale cores is weaker, with stress sensitivity coefficients below 0.03, significantly lower than that of fracture-type cores.
(2)
The mineral composition of shale also has a significant impact on its stress sensitivity. Clayey argillaceous porous cores exhibit a stronger stress sensitivity compared to sandy argillaceous porous cores. However, due to the propensity of sandy argillaceous cores for particle detachment and clogging of fracture flow channels upon compression of fracture surfaces, the stress sensitivity difference between these two lithologies is not significant in fractured shale core samples.
(3)
The increase in electrical conductivity of shale cores due to the filling of proppants is significant. There are differences in the electrical conductivity of cores filled with proppants of different lithologies. At the same proppant concentration, the conductivity of cores from sandy argillaceous shale is higher than that of cores from clayey argillaceous shale. However, as the proppant concentration increases, this difference gradually diminishes.
(4)
The larger the particles of the proppants, the stronger their stress sensitivity in terms of electrical conductivity. Proppant concentration also significantly impacts the conductivity of the cores, with higher concentrations resulting in greater conductivity in the fractures. At an effective stress of 60 MPa, the electrical conductivity of cores with a proppant concentration of 2 kg/m2 is 3.61 times that of cores with a proppant concentration of 0.3 kg/m2.
(5)
The filling pattern of proppants also has a significant impact on the electrical conductivity of core fractures. When the smaller-grain proppants (70–120 mesh) are placed near the outlet end and the larger-grain proppants (40–70 mesh) near the inlet end, the conductivity is maximized, being 4.33 times that of mixed filling at an effective stress of 60 MPa.

Author Contributions

Conceptualization, H.G. and Z.W.; methodology, Z.W.; validation, Z.L. and Y.L.; formal analysis, Y.Z.; investigation, Y.S.; resources, Z.L.; data curation, Y.L.; writing—original draft preparation, H.G.; writing—review and editing, H.G.; visualization, S.L.; supervision, S.Z.; project administration, S.Y. and S.Z.; funding acquisition, Z.W. All authors have read and agreed to the published version of the manuscript.

Funding

This research was funded by the National Natural Science Foundation of China (grant 51574257) and the National Key Research and Development Program of China (grant 2015CB250904).

Data Availability Statement

Data are available on request from the authors.

Acknowledgments

The authors would like to thank the National Fund Commission of China for providing financial support.

Conflicts of Interest

Huiying Guo, Ziqiang Wang, Yuankai Zhang, Yating Sun, Sai Liu, and Zhen Li are employed by the Research Institute of Experiment and Detection, Xinjiang Oilfield Company. The remaining authors declare that the research was conducted in the absence of any commercial or financial relationships that could be construed as a potential conflict of interest.

References

  1. Muther, T.; Qureshi, H.A.; Syed, F.I.; Aziz, H.; Siyal, A.; Dahaghi, A.K.; Negahban, S. Unconventional hydrocarbon resources: Geological statistics, petrophysical characterization, and field development strategies. J. Pet. Explor. Prod. Technol. 2022, 12, 1463–1488. [Google Scholar] [CrossRef]
  2. Zhao, W.; Hu, S.; Hou, L.; Yang, T.; Li, X.; Guo, B.; Yang, Z. Types and resource potential of continental shale oil in China and its boundary with tight oil. Pet. Explor. Dev. 2020, 47, 1–11. [Google Scholar] [CrossRef]
  3. Zhang, L.; Pan, L.; Zou, Y.; Wang, J.; Li, M.; Feng, W. Recent Advances in Reservoir Stimulation and Enhanced Oil Recovery Technology in Unconventional Reservoirs. Processes 2024, 12, 234. [Google Scholar] [CrossRef]
  4. Zhou, F.; Su, H.; Liang, X.; Meng, L.; Yuan, L.; Li, X.; Liang, T. Integrated hydraulic fracturing techniques to enhance oil recovery from tight rocks. Pet. Explor. Dev. 2019, 46, 1065–1072. [Google Scholar] [CrossRef]
  5. Wang, W.; Shahvali, M.; Su, Y. A semi-analytical fractal model for production from tight oil reservoirs with hydraulically fractured horizontal wells. Fuel 2015, 158, 612–618. [Google Scholar] [CrossRef]
  6. Xu, L.; Zhang, S.; Wang, F.; Ma, X. Study on the productivity of the multi-stage fractured horizontal wells in tight oil reservoirs. Int. J. Oil Gas Coal Technol. 2019, 20, 243. [Google Scholar] [CrossRef]
  7. Nasehi, M.J.; Mortazavi, A. Effects of in-situ stress regime and intact rock strength parameters on the hydraulic fracturing. J. Pet. Sci. Eng. 2013, 108, 211–221. [Google Scholar] [CrossRef]
  8. Wu, K.; Olson, J.E. Mechanisms of Simultaneous Hydraulic-Fracture Propagation from Multiple Perforation Clusters in Horizontal Wells. SPE J. 2016, 21, 1000–1008. [Google Scholar] [CrossRef]
  9. Rhine, T.D.; Loayza, M.P.; Kirkham, B.; Oussoltsev, D.; Altman, R.M.; Viswanathan, A.; Peña, A.; Indriati, S.; Grant, D.; Hanzik, C.; et al. Channel Fracturing in Horizontal Wellbores: The New Edge of Stimulation Techniques in the Eagle Ford Formation. In Proceedings of the SPE Annual Technical Conference and Exhibition, Denver, CO, USA, 30 October–2 November 2011. [Google Scholar]
  10. Haimson, B.C. The state of stress in the Earth’s crust. Rev. Geophys. 1975, 13, 350–352. [Google Scholar] [CrossRef]
  11. Dormieux, L.; Jeannin, L.; Gland, N. Homogenized models of stress-sensitive reservoir rocks. Int. J. Eng. Sci. 2011, 49, 386–396. [Google Scholar] [CrossRef]
  12. Li, X.; Gu, K.; Xu, W.; Song, J.; Pan, H.; Dong, Y.; Yang, X.; You, H.; Wang, L.; Fu, Z.; et al. Effects of Pore Water Content on Stress Sensitivity of Tight Sandstone Oil Reservoirs: A Study of the Mahu Block (Xinjiang Province, China). Processes 2023, 11, 3153. [Google Scholar] [CrossRef]
  13. Curtis, M.E.; Cardott, B.J.; Sondergeld, C.H.; Rai, C.S. Development of organic porosity in the Woodford Shale with increasing thermal maturity. Int. J. Coal Geol. 2012, 103, 26–31. [Google Scholar] [CrossRef]
  14. Yang, R.; Jia, A.; He, S.; Wang, T.; Hu, Q. Pore Structure Characterization and Reservoir Quality Evaluation of Analcite-Rich Shale Oil Reservoir from the Bohai Bay Basin. Energy Fuels 2021, 35, 9349–9368. [Google Scholar] [CrossRef]
  15. He, S.; Li, H.; Qin, Q.; Long, S. Influence of Mineral Compositions on Shale Pore Development of Longmaxi Formation in the Dingshan Area, Southeastern Sichuan Basin, China. Energy Fuels 2021, 35, 10551–10561. [Google Scholar] [CrossRef]
  16. Xian, S.H.I.; Shu, J.; Shuangfang, L.U.; Zhiliang, H.E.; Dongjie, L.I.; Zhixuan, W.; Dianshi, X. Investigation of mechanical properties of bedded shale by nanoindentation tests: A case study on Lower Silurian Longmaxi Formation of Youyang area in southeast Chongqing, China. Pet. Explor. Dev. 2019, 46, 163–172. [Google Scholar]
  17. Du, J.; Whittle, A.J.; Hu, L.; Divoux, T.; Meegoda, J.N. Coupling grid nanoindentation and surface chemical analysis to infer the mechanical properties of shale mineral phases. Eng. Geol. 2023, 325, 107304. [Google Scholar] [CrossRef]
  18. Li, W.; Cao, J.; Shi, C.; Xu, T.; Zhang, H.; Zhang, Y. Shale oil in saline lacustrine systems: A perspective of complex lithologies of fine-grained rocks. Mar. Pet. Geol. 2020, 116, 104351. [Google Scholar] [CrossRef]
  19. Pang, X.-J.; Wang, G.-W.; Kuang, L.-C.; Lai, J.; Gao, Y.; Zhao, Y.-D.; Li, H.-B.; Wang, S.; Bao, M.; Liu, S.-C.; et al. Prediction of multiscale laminae structure and reservoir quality in fine-grained sedimentary rocks: The Permian Lucaogou Formation in Jimusar Sag, Junggar Basin. Pet. Sci. 2022, 19, 2549–2571. [Google Scholar] [CrossRef]
  20. Dong, J.-J.; Hsu, J.-Y.; Wu, W.-J.; Shimamoto, T.; Hung, J.-H.; Yeh, E.-C.; Wu, Y.-H.; Sone, H. Stress-dependence of the permeability and porosity of sandstone and shale from TCDP Hole-A. Int. J. Rock Mech. Min. Sci. 2010, 47, 1141–1157. [Google Scholar] [CrossRef]
  21. Dahl, J.; Nguyen, P.; Dusterhoft, R.; Calvin, J.; Siddiqui, S. Application of Micro-Proppant to Enhance Well Production in Unconventional Reservoirs: Laboratory and Field Results. In Proceedings of the SPE Western Regional Meeting, Garden Grove, CA, USA, 27–30 April 2015. [Google Scholar]
  22. Ahamed, M.A.A.; Perera, M.S.A.; Elsworth, D.; Ranjith, P.G.; Matthai, S.K.M.; Dong-yin, L. Effective application of proppants during the hydraulic fracturing of coal seam gas reservoirs: Implications from laboratory testings of propped and unpropped coal fractures. Fuel 2021, 304, 121394. [Google Scholar] [CrossRef]
  23. Yue, M.; Zhu, W.-Y.; Gou, F.-F.; Song, T.-R.; You, Y.-C.; Zhang, Q.-T. Impacts of proppant distribution on development of tight oil reservoirs with threshold pressure gradient. Pet. Sci. 2024, 21, 445–457. [Google Scholar] [CrossRef]
  24. Mueller, M.; Amro, M. Indentaion Hardness for Improved Proppant Embedment Prediction in Shale Formations. In Proceedings of the SPE European Formation Damage Conference and Exhibition, Budapest, Hungary, 3–5 June 2015. [Google Scholar]
  25. Arshadi, M.; Zolfaghari, A.; Piri, M.; Al-Muntasheri, G.A.; Sayed, M. The effect of deformation on two-phase flow through proppant-packed fractured shale samples: A micro-scale experimental investigation. Adv. Water Resour. 2017, 105, 108–131. [Google Scholar] [CrossRef]
  26. Bandara, K.M.A.S.; Ranjith, P.G.; Rathnaweera, T.D.; Wanniarachchi, W.A.M.; Yang, S.Q. Crushing and embedment of proppant packs under cyclic loading: An insight to enhanced unconventional oil/gas recovery. Geosci. Front. 2021, 12, 100970. [Google Scholar] [CrossRef]
  27. Zhong, Y.; Kuru, E.; Zhang, H.; Kuang, J.; She, J. Effect of Fracturing Fluid/Shale Rock Interaction on the Rock Physical and Mechanical Properties, the Proppant Embedment Depth and the Fracture Conductivity. Rock Mech. Rock Eng. 2019, 52, 1011–1022. [Google Scholar] [CrossRef]
  28. Guo, S.; Wang, B.; Li, Y.; Hao, H.; Zhang, M.; Liang, T. Impacts of Proppant Flowback on Fracture Conductivity in Different Fracturing Fluids and Flowback Conditions. ACS Omega 2022, 7, 6682–6690. [Google Scholar] [CrossRef]
  29. Suri, Y.; Islam, S.Z.; Hossain, M. Effect of fracture roughness on the hydrodynamics of proppant transport in hydraulic fractures. J. Nat. Gas Sci. Eng. 2020, 80, 103401. [Google Scholar] [CrossRef]
  30. Raimbay, A.; Babadagli, T.; Kuru, E.; Develi, K. Quantitative and visual analysis of proppant transport in rough fractures. J. Nat. Gas Sci. Eng. 2016, 33, 1291–1307. [Google Scholar] [CrossRef]
  31. Arshadi, M.; Piri, M.; Sayed, M. Proppant-packed fractures in shale gas reservoirs: An in-situ investigation of deformation, wettability, and multiphase flow effects. J. Nat. Gas Sci. Eng. 2018, 59, 387–405. [Google Scholar] [CrossRef]
  32. Kassis, S.; Sondergeld, C.H. Fracture Permeability of Gas Shale: Effects of Roughness, Fracture Offset, Proppant, and Effective Stress. In Proceedings of the International Oil and Gas Conference and Exhibition in China, Beijing, China, 8–10 June 2010. [Google Scholar]
  33. GB/T 29172-2012; Practices for Core Analysis. Standardization Administration: Beijing, China, 2012.
  34. Cao, N.; Lei, G. Stress sensitivity of tight reservoirs during pressure loading and unloading process. Pet. Explor. Dev. 2019, 46, 138–144. [Google Scholar] [CrossRef]
  35. Geng, Y.; Tang, D.; Xu, H.; Tao, S.; Tang, S.; Ma, L.; Zhu, X. Experimental study on permeability stress sensitivity of reconstituted granular coal with different lithotypes. Fuel 2017, 202, 12–22. [Google Scholar] [CrossRef]
  36. Wang, J.; Hu, Q.; Cai, Z.; Sun, X.; Sun, M.; Zhang, C.; Wei, W.; Cui, Z. Distribution of Retained Oil in Shales from the Lucaogou Formation, Jimusar Sag, Northwest China: Insights from Mineralogy and Pore Structure. Energy Fuels 2023, 37, 11097–11112. [Google Scholar] [CrossRef]
  37. Louis, C. Rock Hydraulics. In Rock Mechanics; Müller, L., Ed.; Springer: Vienna, Austria, 1972; pp. 299–387. [Google Scholar]
  38. Wu, J.-B.; Yang, S.-L.; Li, Q.; Yang, K.; Huang, C.; Lin, G.; Lv, D.-P.; Zhou, W.; Colledge, M. Micromechanism and mathematical model of stress sensitivity in tight reservoirs of binary granular medium. Pet. Sci. 2024. [Google Scholar] [CrossRef]
  39. Duan, X.G.; An, W.G.; Hu, Z.M.; Gao, S.S.; Ye, L.Y. Experimental study on fracture stress sensitivity of Silurian Longmaxi shale formation, Sichuan Basin. Nat. Gas Geosci. 2017, 28, 1416–1424. [Google Scholar]
  40. Zou, Y.; Shi, S.; Zhang, S.; Yu, T.; Tian, G.; Ma, X.; Zhang, Z. Experimental modeling of sanding fracturing and conductivity of propped fractures in conglomerate: A case study of tight conglomerate of Mahu sag in Junggar Basin, NW China. Pet. Explor. Dev. 2021, 48, 1383–1392. [Google Scholar] [CrossRef]
  41. Zhang, J.; Ouyang, L.; Hill, A.D.; Zhu, D. Experimental and Numerical Studies of Reduced Fracture Conductivity due to Proppant Embedment in Shale Reservoirs. J. Pet. Sci. Eng. 2015, 130, 37–45. [Google Scholar] [CrossRef]
  42. Alramahi, B.; Sundberg, M.I. Proppant Embedment and Conductivity of Hydraulic Fractures in Shales. In Proceedings of the 46th U.S. Rock Mechanics/Geomechanics Symposium, Chicago, IL, USA, 24–27 June 2012. [Google Scholar]
  43. Zheng, W.; Silva, S.C.; Tannant, D.D. Crushing characteristics of four different proppants and implications for fracture conductivity. J. Nat. Gas Sci. Eng. 2018, 53, 125–138. [Google Scholar] [CrossRef]
  44. Elsarawy, A.M.; Nasr-El-Din, H.A. A new method to measure propped fracture width and proppant porosity in shale fractures. J. Pet. Sci. Eng. 2019, 181, 106162. [Google Scholar] [CrossRef]
Figure 1. Schematic diagram of proppant-packed core preparation process. (i) Breaking shale sample 1 along the length and parallel to its bedding; (ii) fractured shale sample 2; (iii) placing the resin-coated proppant grains within the fracture in sample 1; (iv) placing the white sand grains within the fracture in sample 2; (v) fully assembled sample 1; and (vi) fully assembled sample 2 [31].
Processes 12 00789 g001
Figure 2. Petrological analysis experiment workflow.
Processes 12 00789 g002
Figure 3. CT scan images of different sections of fractured rock core with proppant fill.
Processes 12 00789 g003
Figure 4. Schematic diagram of TC-180 cylindrical rock core stress sensitivity testing system.
Processes 12 00789 g004
Figure 5. Comparative analysis of CTS and SEM images of different lithological shale. (a,b) CTS images of clayey argillaceous shale, with visible microfracture development in (b). (c) CTS image of argillaceous shale. (d) SEM image of clayey argillaceous shale, showing the presence of illite/smectite mixed-layer minerals. (e,f) SEM images of argillaceous shale, with developed dissolution pores visible in (e) and intergranular pores visible in (f).
Processes 12 00789 g005
Figure 6. (a) Variation in the permeability of the samples with effective stress during pressurization and depressurization. (b) Variation in the permeability ratio of the samples with effective stress during pressurization and depressurization. (c) Stress sensitivity coefficients were obtained by exponential fitting (exponential term coefficients) of the permeability and effective stress of the compression process. (d) Comparison of irreversible permeability damage rate for four core samples.
Processes 12 00789 g006
Figure 7. (a,b) Variation in conductivity with effective stress under different concentrations of proppants for sandy argillaceous shale and clayey argillaceous cores, respectively. (c) Conductivity comparison under an effective stress of 60 MPa for sandy argillaceous shale and clayey argillaceous cores with varying concentrations of proppants.
Processes 12 00789 g007
Figure 8. Variation in conductivity with effective stress for fractured rock cores filled with proppants of different sizes at a proppant concentration of 0.5 kg/m2.
Processes 12 00789 g008
Figure 9. Variation in conductivity with effective stress for fractured rock cores under different proppant filling patterns at a proppant concentration of 0.76 kg/m2.
Processes 12 00789 g009
Table 1. Petrophysical property parameters of the samples.
LabelD/cmL/cmφ/%k/mdLithology
SA12.534.1615.400.069Sandy Argillaceous Shale
SA22.514.6716.181.383Sandy Argillaceous Shale
SA32.524.5415.400.072Sandy Argillaceous Shale
SA42.574.0214.600.067Sandy Argillaceous Shale
SA52.584.1715.400.069Sandy Argillaceous Shale
SA62.524.4914.180.030Sandy Argillaceous Shale
SA72.495.0716.320.041Sandy Argillaceous Shale
SA82.504.4913.110.030Sandy Argillaceous Shale
SA92.544.8712.140.034Sandy Argillaceous Shale
SA102.485.3213.780.052Sandy Argillaceous Shale
SA112.544.8913.890.045Sandy Argillaceous Shale
CA12.574.3810.290.032Clayey Argillaceous Shale
CA22.494.9916.380.430Clayey Argillaceous Shale
CA32.475.1114.380.041Clayey Argillaceous Shale
CA42.494.5211.320.047Clayey Argillaceous Shale
CA52.514.7814.230.035Clayey Argillaceous Shale
CA62.504.3011.120.046Clayey Argillaceous Shale
Table 2. Design of fractured core filled with proppant.
CaseCoreProppantMeshProportionSand Concentration, kg/m2
1SA3Quartz sand40–70100%0.3
2SA4Quartz sand40–70100%0.5
3SA5Quartz sand40–70100%1.0
4SA6Quartz sand40–70100%2.0
5SA7Quartz sand20–40100%0.5
6SA8Quartz sand70–120100%0.5
7SA9Quartz sand40–70 (mix)
70–120 (mix)
50%
50%
0.76
8SA10Quartz sand40–70 (front)
70–120 (back)
50%
50%
0.76
9SA11Quartz sand70–120 (front)
40–70 (back)
50%
50%
0.76
10CA3Quartz sand40–70100%0.3
11CA4Quartz sand40–70100%0.5
12CA5Quartz sand40–70100%1.0
13CA64.9940–70100%2.0
Table 3. Mineral composition distribution of Jimsar shale from Xinjiang.
LabelClayQtzKfsPlCalDolAnk
SA16.317.823.96.645.4
SA24.112.913.414.88.646.2
SA37.521.233.737.6
SA45.823.120.638.312.2
SA56.218.423.730.98.911.9
SA64.323.946.811.913.1
SA75.228.941.313.111.5
SA86.119.89.928.819.615.8
SA94.321.536.88.828.6
SA105.813.46.531.24.838.3
SA114.314.810.127.68.713.221.3
CA116.919.49.929.712.811.3
CA217.821.0 13.829.512.35.6
CA314.923.312.0 31.211.27.4
CA419.817.921.215.8 17.18.2
CA516.514.723.830.24.110.7
CA619.320.414.828.57.89.2
Disclaimer/Publisher’s Note: The statements, opinions and data contained in all publications are solely those of the individual author(s) and contributor(s) and not of MDPI and/or the editor(s). MDPI and/or the editor(s) disclaim responsibility for any injury to people or property resulting from any ideas, methods, instructions or products referred to in the content.

