Article

The Physicochemical Basis for the Production of Rapeseed Oil Fatty Acid Esters in a Plug Flow Reactor

Scientific Center “Issues of Processing Mineral and Technogenic Resources”, Empress Catherine II Saint Petersburg Mining University, Saint Petersburg 199106, Russia
*
Author to whom correspondence should be addressed.
Processes 2024, 12(4), 788; https://doi.org/10.3390/pr12040788
Submission received: 9 February 2024 / Revised: 22 March 2024 / Accepted: 27 March 2024 / Published: 14 April 2024
(This article belongs to the Special Issue Processes in Biofuel Production and Biomass Valorization)

Abstract

:
This article describes the results of a comprehensive comparative study of the production of fatty acid ethyl esters (FAEEs) for use as biodiesel in perfect mixing reactors (PMRs) and plug flow reactors (PFRs). The products obtained on a laboratory scale at all stages of the separation and purification of the FAEE phase were analyzed using the FTIR, XRF and GC-MS methods. We compared distillation methods for the separation of stoichiometrically excessive ethanol from the reaction mixture. Neutralization methods with H2SO4 solution and carbonation with CO2 were applied for FAEE phase purification from the catalyst. Emulsions formed during the water flushing stage were analyzed via the optical microscopy method. The optimal conditions of stirring speed and temperature were selected to maintain a high level of FAEE–water phase contact area with minimum phase separation time. The efficiency of the carbonation method for catalyst neutralization in the FAEE phase has been proven, allowing us to consider this method as an alternative to the traditional acid neutralization method. According to the results of experimental studies, we have developed a new high-performance technological scheme for the production of fatty acid esters in PFRs. The synthesis of FAEEs in a stoichiometric excess of ethanol of about 1:50 allowed us to increase the reaction rate and productivity of the synthesis unit after the transition from a PMR to a PFR. The yield of the product amounted to 86.7%. The purified FAEE fraction complied with most EN14214 specifications.

1. Introduction

Fatty acid ethyl esters (FAEEs) are in demand in various industries, including medicine, cosmetology, fuel, and energy complex and hydrocarbon output. In medical practice, ethyl esters of polyunsaturated fatty acids are used to combat health problems associated with heart failure. Ethyl esters of eicosapentaenoic acid (EPA) and docosahexaenoic acid (DHA) have received the most interest concerning this issue [1,2]. The anti-inflammatory properties of ethyl esters of linoleic and oleic acids are being studied and used in cosmetology to inhibit acne formation [1].
The main features of fatty acid esters that make this group of chemicals appealing to researchers from different industry sectors are their lubricating and emulsifying properties. For instance, fatty acid esters have found application as lubricants and surfactants in drilling fluids [3,4,5,6,7].
In addition to the above, the fuel and energy sector remains a common area of application relating to the use of FAEs in the 21st century, which is explained by the prerequisites of historical development [8,9,10]. On the one hand, sustainable global energy developments are now on the international agenda in the context of the transition to renewable energy technologies [11,12,13,14]. On the other hand, there is still a high exploitation level of internal combustion engines in the world [13,15,16,17], the abandonment of which is not yet possible [18,19,20,21,22].
Due to the fact that most of the physical and chemical parameters of biodiesel are close to petroleum diesel fuel, the use of biodiesel allows us to maintain the design of the internal combustion engine without special changes. This has become the main argument for the use of biodiesel as a step change between the consumption of petroleum-based fuels and renewable energy sources [23,24,25,26].
Worldwide, technologies based on the processing of first- and second-generation raw materials (or, according to the authors’ classification [27]—second- and third-generation), which mainly include triacylglycerides (TAGs) of fatty acids from non-food and waste oils, have become more widespread. Rapeseed oil is an acceptable biodiesel feedstock for the Russian market due to its high production volume and low domestic consumption [28,29]. Alkaline transesterification and acid esterification in the presence of a molar excess of methanol or ethanol remain the most common methods for processing these materials [27,30,31].
It is generally known that under the current conditions, the production and promotion of fatty acid esters depends largely on subsidies and the policies of the states [32,33,34,35]. Subsidization can be explained by high competition with the petroleum fuel market and the complexity of the process of obtaining pure fatty acid esters [36,37,38], which affects their production cost [39,40,41].
Influencing the competitiveness of fatty acid esters as liquid biofuels by reducing their production costs is feasible. This issue is technological in scope. Different directions of scientific research can be observed in the search for a solution to the issue at hand. While some investigations form a scientific layer devoted to the search for alternative raw materials and synthesis methods [27,42,43,44], others are aimed at improving the process of triglyceride transesterification [45,46,47].
In the field of catalyst investigations, both homogeneous and heterogeneous catalysts have received research attention for biodiesel production. In an article devoted to the systematization of modern biodiesel catalysts, the most common homogeneous catalysts were alkaline catalysts such as NaOH, KOH or sodium methoxide and acid catalysts such as sulfuric, sulfonic and hydrochloric acids [48].
Alkaline catalysts are the most efficient but are highly sensitive to the presence of free fatty acids (FFAs) in the feedstock [49,50]. Moreover, the presence of water in the reaction system can lead to saponification and decreased product yield during and after synthesis. For this reason, the process includes a feedstock preparation stage as well as neutralization and removal of the homogeneous catalyst [51].
The use of heterogeneous catalysts can greatly simplify the separation of reaction products, but this type of catalyst is less efficient. Most works are devoted to the study of calcium oxide due to its relatively low price [52,53,54,55]. Processes using zeolite catalysts are still under development [56,57]. They often require very high temperatures (around 200 °C) [48,58]. There are also reports on the use of agricultural waste ashes as heterogeneous catalysts [59]. Nanocatalysts combine the advantages of both homogeneous and heterogeneous catalysts, but their use in industry is limited due to their high cost. Currently, nanocatalysts are being developed at the laboratory scale [48,58,60].
Enzyme-based biocatalysts are identified as a separate research group apart from heterogeneous and homogeneous catalysts [27]. Enzyme catalysts, represented mainly by lipases, may be useful in converting oil containing high FFA and water content. In addition, the reaction proceeds under mild conditions and does not require catalyst utilization. The main disadvantages of enzymatic catalysts are expensiveness, long synthesis time (8–60 h) and wide variation in yield [61].
Regarding the apparatus design process, the simplest and most common method used in the industry is the batch reactor of ideal mixing, which is a vessel with a heating element [62,63] and a stirring device [54,64]. Continuous reactors are also widely used in industry—flow-through apparatuses that enable a constant supply of reagents and product withdrawal [64,65,66]. A promising direction for improving reactor design is the development and introduction of membrane reactors that combine the chemical conversion process with a membrane separation process for adding reactants or removing reaction products [67]. There are reports on the use of fixed-bed catalyst reactors and continuous tubular reactors, which provide consistently high yields of the target product, meeting the BD100 standard [64,68,69].
Oscillatory Baffled Reactors (OBRs) are an advanced version of the continuous tube reactor. The main changes involve the tube reaction space. The technology includes annular baffles in the tubular reactor frame to create swirls for more intense stirring of the reaction mixture [70]. The analog of the continuous tubular reactor is the microchannel reactor, which provides a similar degree of conversion in less time. However, the introduction of such reactors in industry will significantly increase the metal intensity of production and, consequently, the final price of the product [55,71].
Another technology used in biodiesel production is reaction distillation [71,72,73]. This method of biodiesel production can be considered an alternative to ideal displacement reactors, since the distillation apparatuses used in the process maintain continuous synthesis due to the counter multistage flow of alcohol and oil [74].
Research exists on the use of continuous catalytic–plasma reactors. The use of plasma was found to increase the conversion rate during the heterogeneous catalysis of the transesterification reaction, with a biodiesel yield of 77.2% [75].
Non-catalytic synthesis technology under the conditions of supercritical parameters is being actively developed. This technology was designed to solve the problem of waste utilization and reduce the cost of the final product due to the elimination of the catalyst. However, the introduction of this technology into industrial production is a difficult task due to the high cost of equipment and increased requirements for personnel qualification. In an article devoted to the transesterification of palm kernel oil with supercritical methanol, the optimal synthesis conditions were as follows: a temperature of 325 ± 5 °C, a pressure of 18.0 ± 0.5 MPa, and a molar ratio of methanol and oil of 42 ± 2:1. The yield of the product was 93.7 ± 2.1% [76].
The works in the field of vegetable raw materials transesterification are united by one goal—reducing the reaction time while maintaining high conversion rates—since alkaline methanolysis and ethanolysis of triacylglycerides under conditions of alcohol molar excess takes from 1 to 6 h [27,40]. Among them, we can conditionally distinguish several directions [60,77]:
  • Search and development of new homogeneous and heterogeneous catalysts;
  • Modification of the synthesis reactor;
  • Change in technological synthesis conditions.
In this work, we decided to consider the modification of the synthesis reactor in order to develop a process scheme that satisfies the reaction rate under ethanol excess (1:50) conditions. The aim of this research work is to establish the particularities of the process steps of FAEE production in the case of excess ethanol (1:50) and select the optimal reactor between PMR and PFR.

2. Experimental Section

2.1. Materials and Reagents

Unrefined rapeseed oil was selected as the raw material. Oleic acid (Pur.) was used as a raw material in the etherification reaction. Potassium hydroxide was used as an alkaline homogeneous catalyst due to its availability and cheapness. Absolute technical ethanol with <0.5% water content was used as the reaction alcohol. Zeolite 3A molecular sieves for ethanol drying were obtained from SORBIS GROUP (Hong Kong).
The acid value and acidity of the oil were analyzed according to ISO 660-83 via the titrimetric method. The fatty acid composition was determined according to GOST 30418-96. The mass fraction of moisture in oils was analyzed according to ISO 662-2019.

2.2. Alcohol Drying

Absolute ethanol was obtained from industrial-grade ethanol containing up to 6% percent water. The molecular sieve method was used to dehydrate the ethanol. Zeolite KA (3A), granulated into particles of 1.6–2.5 mm diameter, was used as molecular sieves.
Technical ethanol from the tank (1) is pumped by the peristaltic pump (2) into the main filter housing (3) filled with molecular sieves (4) (Supplementary Materials, Figure S1). The ethanol is pumped in from the top through connection A. Due to the vertical tube inside the housing, the alcohol enters the base of the housing and fills the filter from the bottom to the top. As the peristaltic pump operates, the liquid level in the filter housing rises and reaches connection B, from where the absolute alcohol is discharged. Gaskets are installed in connections A and B with a mesh to prevent the zeolite granules from being carried away with the flow and facilitate the unloading of the installation.
A fine mesh filter for alcohol purification from zeolite dust is installed before the tank, which is the absolute alcohol receiver.

2.3. Synthesis of Fatty Acid Esters in Perfect Mixing Reactor

Fatty acid esters were synthesized in a system of parallel HEL reactors (Supplementary Materials, Figure S2). Rapeseed oil in a volume of 10 mL was loaded into a 250 mL steel reactor and heated to 80 °C to quickly achieve the temperature regime of the process when mixing reagents.
While mixing at 250 rpm, 30 mL of 0.5% wt KOH solution in ethanol was poured into the reactor at room temperature. By preheating the oil, we were able to achieve a fast 70 °C temperature rise at <30 s. The synthesis was carried out at a temperature of 70 °C for 5 min (since the alcohol was added), and then the steel reactor was disconnected from the system and immersed in a cold bath to stop the process with a temperature drop.

2.4. Synthesis of Fatty Acid Esters in Plug Flow Reactor

Analogous to the synthesis of fatty acid esters in the ideal mixing reactor, the following process conditions were used: the volume ratio of oil to ethanol was 1:3, and the concentration of potassium hydroxide in the reaction ethanol was 0.5%.
A laboratory unit was assembled for the synthesis of fatty acid esters in a plug flow reactor (Supplementary Materials, Figure S3). The installation consists of a 1 L tank, where the reaction mixture of oil and ethanol with a dissolved catalyst is dispersed at room temperature using an overhead stirrer. With the help of a peristaltic pump, the reaction mixture is fed into a flow reactor and lowered into a water thermostat. The temperature in the thermostat is 77 °C. As the mixture flows through the reactor, a transesterification reaction takes place. Then, the homogeneous reaction mixture enters the receiving container through the refrigerator.
A silicone hose with a length of 10 m and a working cross-section diameter of 10 mm was used as the reactor. The speed of the shaft of the peristaltic pump was fixed at 10 rpm. The residence time in the reactor was measured from the moment the reaction mixture entered the thermostat to the moment the reaction mixture entered the refrigerator.

2.5. Synthesis of Ethyl Oleate via Acid Etherification

The synthesis of ethyl oleate was carried out in a perfect mixing reactor based on the HEL Auto MATE Reactor System (Supplementary Materials, Figure S2). For the synthesis, 200 mL of oleic acid, 100 mL of ethanol, 0.94 mL of catalyst (H2SO4), and 10 mL of benzene were placed in a 500 mL glass reactor. The reaction mixture was stirred for 4 h at a bath temperature of 100 °C. In the process, the triple azeotrope benzene–water–ethanol was boiled, which condensed into a Dean–Stark apparatus.
At the end of the synthesis, the homogeneous mixture became turbid and divided into two phases. The upper phase contained ethyl oleate, alcohol, and an admixture of benzene. The lower phase contained the remains of the unreacted oleic acid, a catalyst, and benzene with an admixture of ethanol. The upper phase with the reaction product was purified from alcohol and benzene via atmospheric distillation and the evaporation of the solvent residues. An admixture of oleic acid was removed from the resulting ethyloleate via crystallization. To achieve this, the mixture was placed in a freezer until a cloudy solution formed. The solution was subjected to vacuum filtration. The experiment was repeated until the transparency of the solution was preserved. The qualitative composition of ethyl oleate was checked using FTIR Analysis. The degree of purity was also checked through the use of gas chromatography.

2.6. Analysis of FAEE Composition

The composition of the mixture of fatty acid ethyl esters was determined using a gas chromate–mass spectrometer equipped with an RTX HP-5MS (30 m × 0.25 mm) column and a flame ionization detector (FID). Helium was used as the mobile phase. The sample was injected at a flow rate of 0.5 mL/min. The temperature of the injector was 280 °C, and the temperature of the detector was 260 °C. The starting oven temperature was 120 °C for 2 min and then increased at a rate of 5 °C/min to 250 °C, followed by holding for 10 min. The internal standard method was used to determine the yield of the target product. A sample of the ether fraction with a volume of 10 µL was added into 1 mL of a solvent containing a known amount of the internal standard. Dodecane was used as an internal standard (C12H26). The concentration of the target product was calculated according to (1)
  C F A E = S F A E S s t · C s t · f F A E
where C F A E and C s t represent the ether and internal standard concentrations; S F A E S s t represents the ratio of the ether peak area to the internal standard peak area; and f F A E represents the calibration factor required to achieve a compound relative to a standard substance.
Calibration factor f F A E was determined experimentally. The prepared alcohol solution of dodecane and the purified mixture of FAEE was used for this purpose. The fraction obtained after vacuum distillation was used as a sample of the FAEE mixture. f F A E was calculated according to (2)
f F A E = C F A E S s t C s t S F A E
The conversion rate in the reaction mixture was calculated as the ratio of the number of moles of synthesized product to the theoretical amount of product obtained at 100% conversion:
α F A E = ϑ e x p ϑ 100 % · 100 = ϑ e x p 3 · ϑ o i l · 100
where α F A E represents the conversion rate of the FAEE; ϑ e x p represents the number of synthesized product moles; ϑ 100 % represents the product moles received at full product conversion; and ϑ o i l represents the number of feedstock moles.
The product yield after FAEE phase separation was calculated as the ratio of the FAEE fraction mass to the mass of the feedstock [78,79,80]:
γ F A E = m F A E · M o i l M F A E · m o i l · 3 · 100 = 0.95 · m F A E m o i l · 100
where m F A E represents the FAEE phase mass, g; M F A E represents the molecular mass of FAEE, 309.0 g/mol; ϑ 100 % represents the product moles received at full product conversion;   M o i l represents the molecular mass of rapeseed oil, 884.4 g/mol; and m o i l represents the rapeseed oil mass.
The molecular weight of rapeseed oil and the product were calculated based on the fatty acid composition of the oil and the composition of FAEE:
M o i l / F A E s =   ( M n · w n )
where M n represents the molecular mass of triglyceride (TAG) or FAEE, and w n represents the TGA or FAEE mole fraction content.

2.7. Analysis of the Precipitate in the Reaction Mixture

The homogeneous reaction mixture was subjected to vacuum filtration after synthesis. To identify the qualitative composition of the precipitated substance, energy-dispersive X-ray fluorescence spectrometry and FTIR spectroscopy methods were used. X-ray fluorescence spectrometry was performed on a Shimadzu EDX 7000 (Shimadzu Corporation, 1. Nishinokyo Kuwabara-cho, Nakagyo-ku, Kyoto, Japan).

2.8. Removal of Excess Alcohol

The filtered homogeneous mixture of fatty acid esters contains not only the target product but also a secondary glycerin fraction. For the further purification of fatty acid esters, three different schemes for removing excess ethanol were tested.
In the first scheme, excess ethanol was distilled at atmospheric pressure in a laboratory installation assembled on the basis of the HEL Parallel Reactor System (Supplementary Materials, Figure S2). The rarefaction created by a stirring device—a magnetic anchor stirrer—acted as a boiling center. During the distillation process, as the alcohol was distilled, the temperature of the bath was raised from 100 to 120 °C.
In the second scheme, after distilling ethanol, a mixture of purified fatty acid esters was separated via vacuum distillation. For this purpose, the Automated Vacuum Distillation Analyzer Herzog HDV 623 was used. Distillation was carried out at a working pressure of 1.3 kPa.
In the third scheme, ethanol was vacuum-distilled in a laboratory unit (Supplementary Materials, Figure S4). A maximum residual pressure of no more than 20 kPa was achieved using a vacuum diaphragm pump NIRA NVM 2 × 2. The distillation process was controlled so that the temperature of the liquid in the distillation cube did not exceed 60 °C.

2.9. Removal of the Catalyst from the Ether Fraction

2.9.1. Neutralization with Sulfuric Acid

To neutralize the KOH impurity, sulfuric acid solutions with concentrations of 50, 100, 150, and 250 g/L were passed through the FAEE mixture. To automate the process, a laboratory setup consisting of a separating funnel and a peristaltic pump was assembled (Supplementary Materials, Figure S5). The flushing solution was fed into the separating funnel at a flow rate of 2.8 mL/min. Excess wash solution collecting in the lower phase was decanted through the drain valve of the separating funnel.

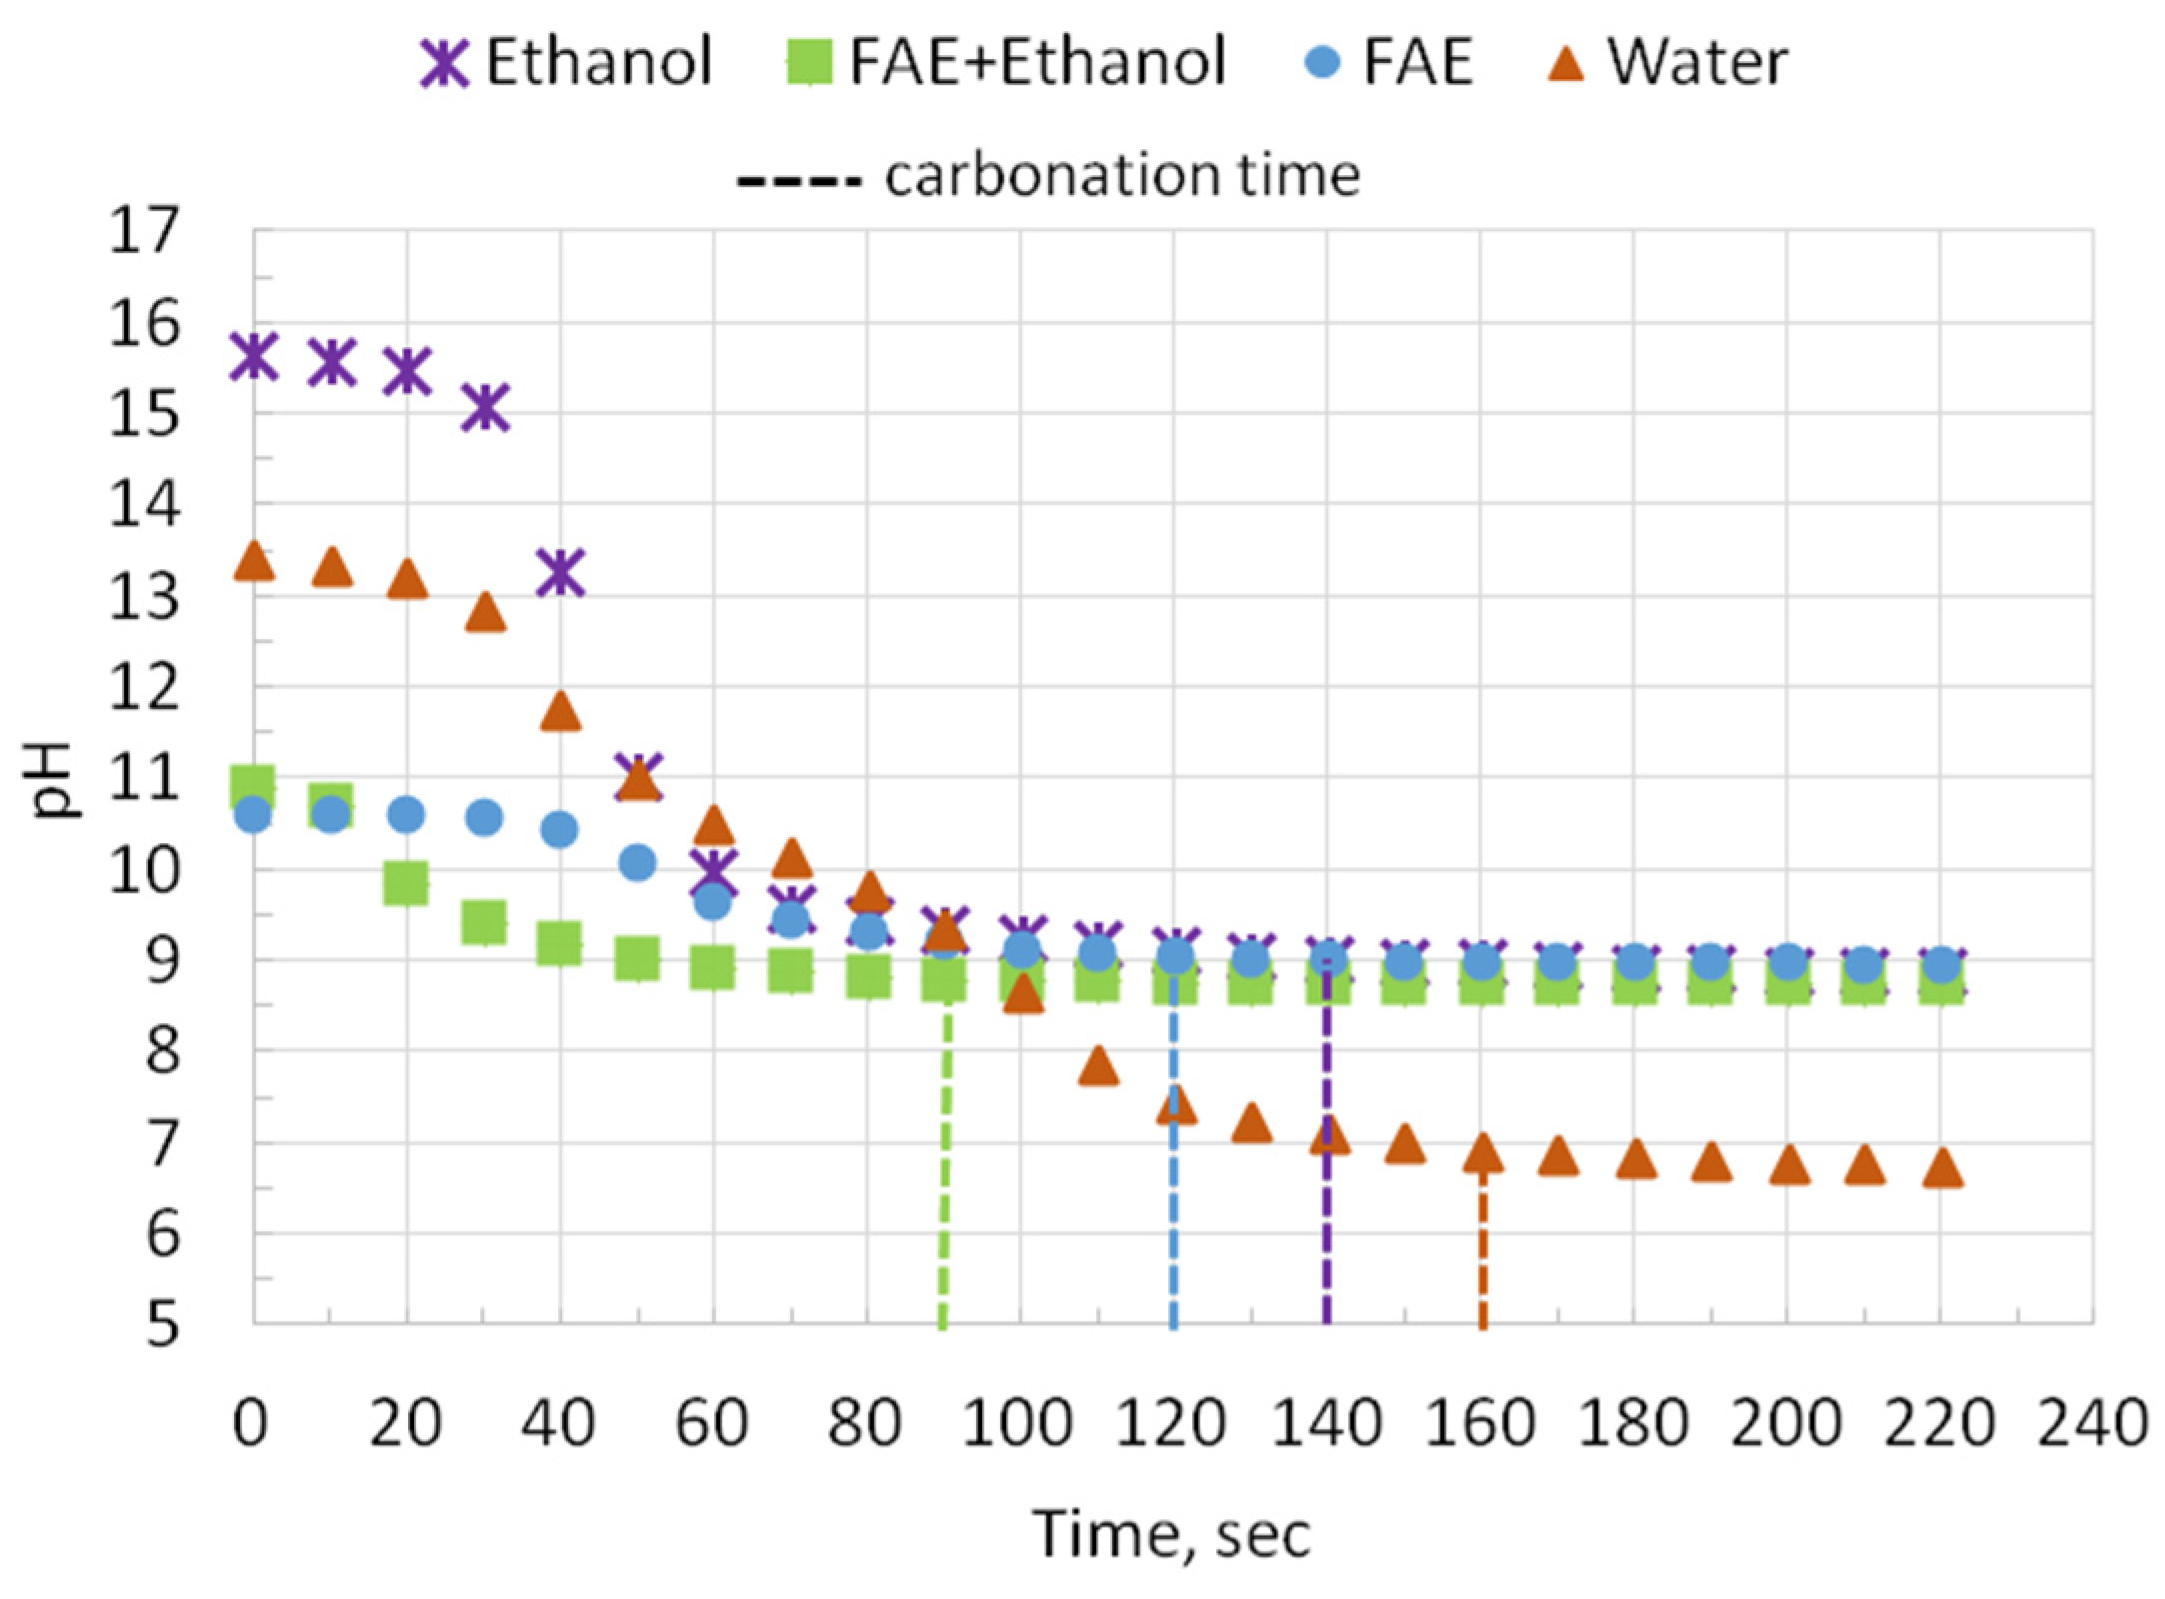
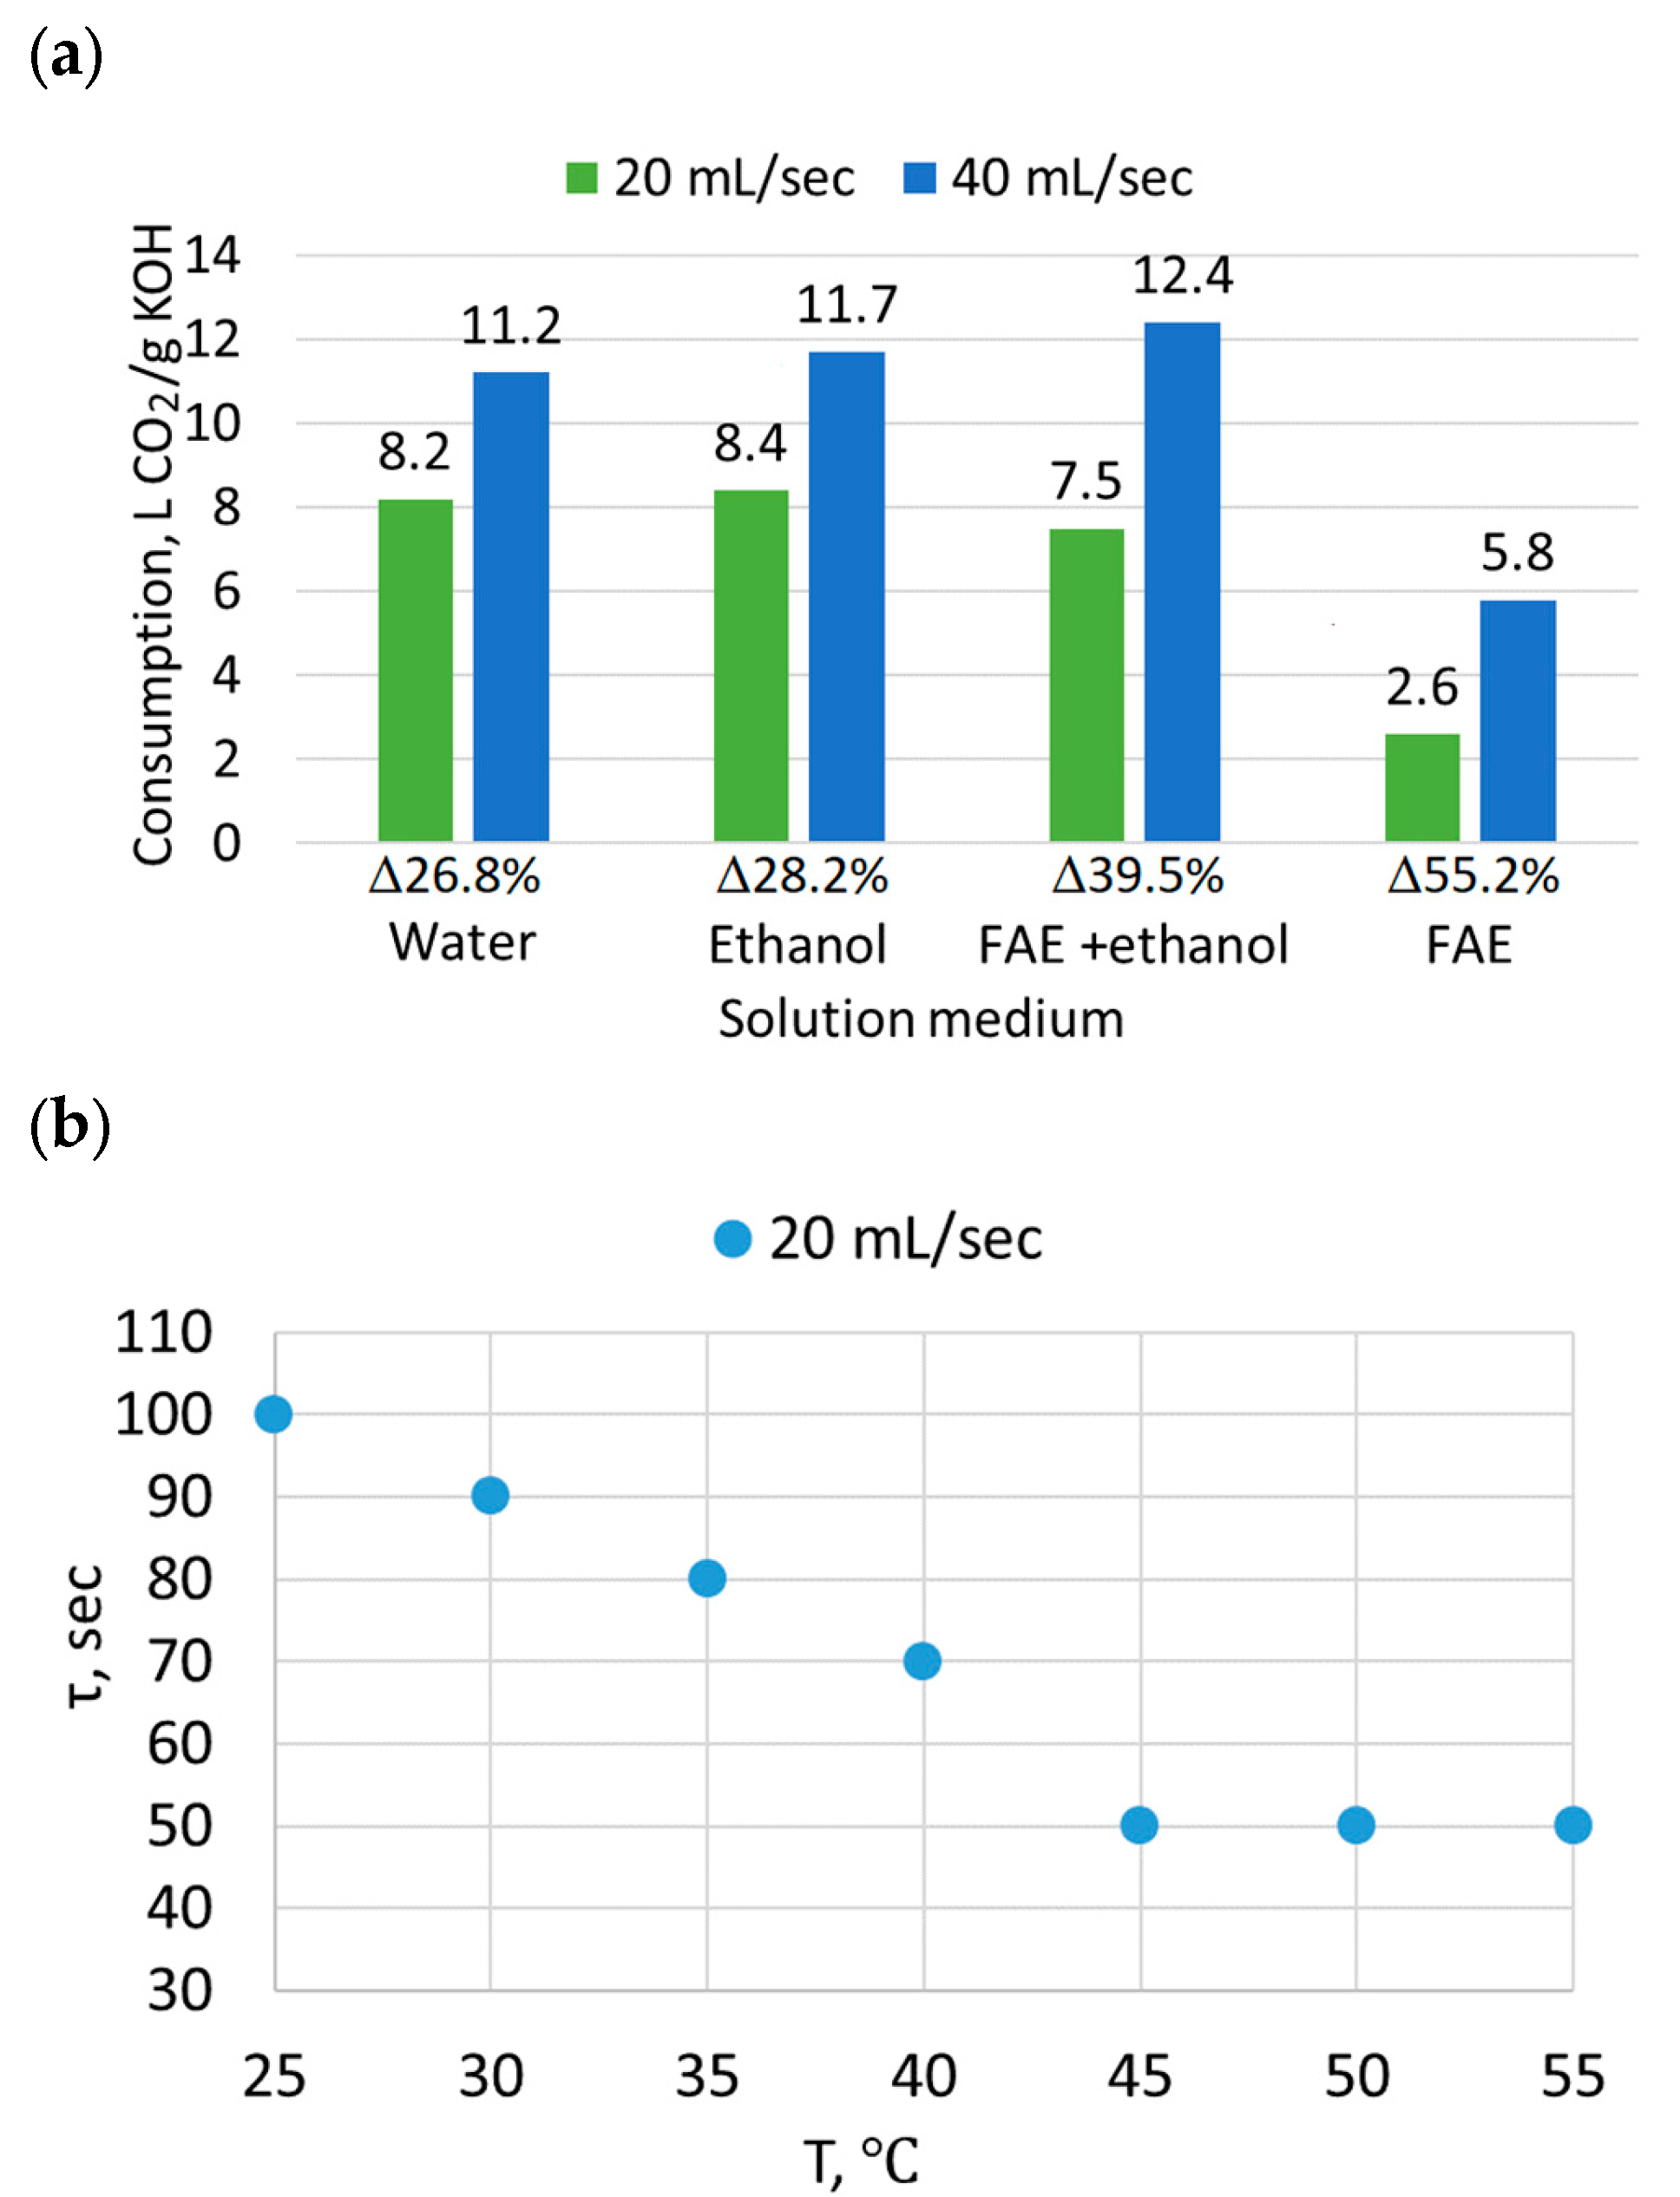
2.9.2. Neutralization via CO2 Barbotage

A laboratory barbotage unit was used to carbonize potassium hydroxide (Supplementary Materials, Figure S6). The unit is a glass beaker filled that was filled with the KOH solution so that the electrode of the pH meter (2) was freely immersed in it. For the accuracy of the study, the same level of liquid in the beaker was maintained in all experiments.
The barbotage of the liquid phase with carbon dioxide was carried out through the gas washer (4). The gas supply is regulated by means of a flow meter. The pH change of the solution during carbonation is recorded using a pH meter.
Barbotage was performed using model solutions (water and alcohol) and FAEE samples before and after ethanol separation in a temperature range of 45–55 °C.
Specific carbon dioxide consumption per gram of catalyst was calculated according to (6)
W C O 2 = w C O 2 · τ m K O H · 1000
where w C O 2 represents the gas flow rate, mL/sec; τ represents the carbonation time, s; m K O H represents the mass of KOH in solution, g.

2.10. Removal of Potassium Salts from the Ether Fraction

After neutralization and carbonation, the obtained FAEE samples were subjected to dynamic flushing with distilled water for 2 h at a water flow rate of 2.3–2.8 mL/min and dehydration from moisture residues at a temperature of 60 °C. For this purpose, we used an automated laboratory, replacing the H2SO4 solution with water (Supplementary Materials, Figure S5). After water flashing, we heated the FAEE samples at 60 °C until the turbidity of the solution disappeared.
The efficiency of purification was analyzed by examining the potassium content in the samples, which was determined via X-ray fluorescence analysis on a Shimadzu EDX 7000 spectrometer [81].

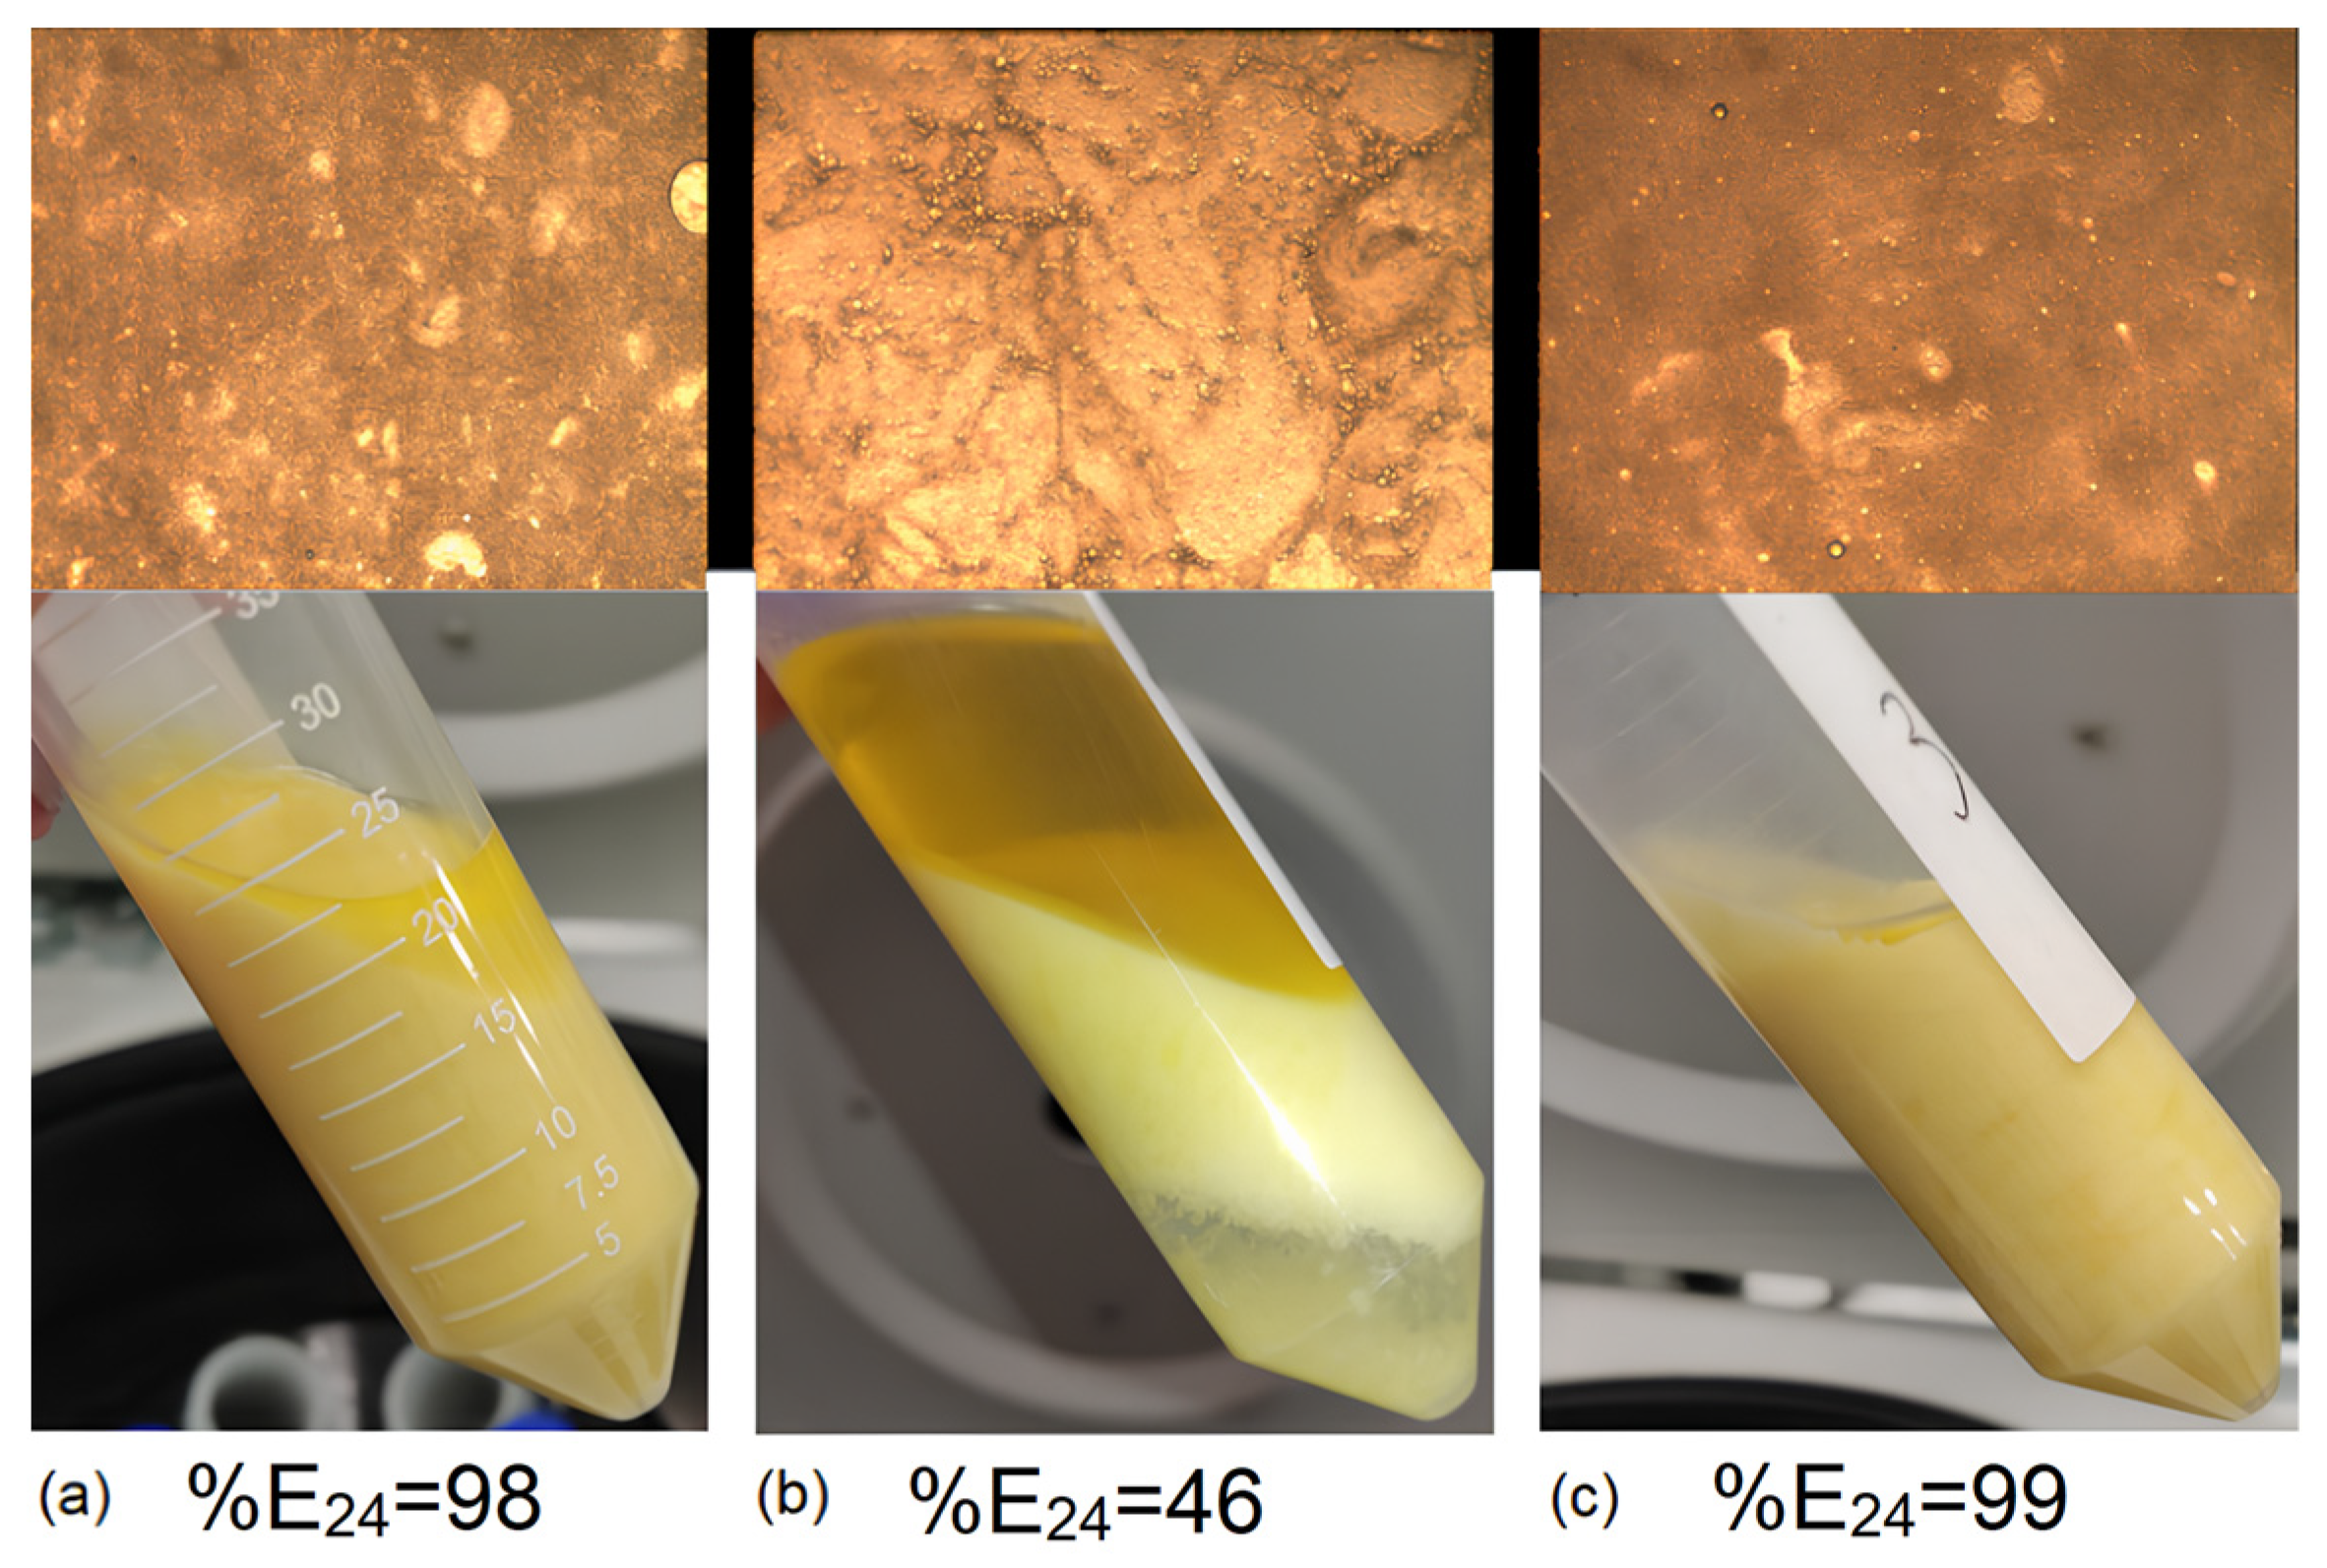
2.11. Analysis of the Emulsion Properties of the Ester Fraction in the Purification Stage

2.11.1. Analysis of Emulsion Layer Height and Stratification Time

It is known that the sedimentation rate of particles in the laminar sedimentation regime is described by the Stokes equation, as follows:
ϑ = d 2 g Δ ρ 18 μ
where d represents the precipitated particle diameter, m;
Δρ represents the density difference of the dispersed phase and dispersion medium, kg/m3;
G represents gravitational acceleration, m/s2;
µ represents the dynamic viscosity of the medium, Pa·s.
Based on Equation (7), the dependence of the globule deposition rate on their diameter can be represented in the following form:
ϑ ~ k d 2
The deposition rate of dispersed phase globules can also be represented as the ratio of the average distance traveled by each globule to the time it took the globule to reach the phase. In practice, it is difficult to obtain the values of the diameter of the globules to be deposited and to estimate their deposition velocity. Based on this concept of velocity, it can be said that the globule deposition rate υ will be directly proportional to the ratio of the emulsion layer height hem to the stratification time τsep:
ϑ ~ h e m τ s e p
Increasing the stirring speed will lead to a decrease in the size of emulsion droplets, i.e., the stirring speed is inversely proportional to the diameter of emulsion globules:
d ~ 1 ω
where ω represents the stirring speed.
Then, the time of component stratification will have the following dependence on the stirring speed and height of the emulsion layer:
τ s e p ~ k h e m ω 2
where k represents the proportionality factor.
To study the emulsion properties of fatty acid esters, two series of experiments were carried out with purified ethyl oleate, and ether and glycerol fractions were decanted from each other after ethanol separation. After distillation, the homogenous mixture containing the co-dissolved ester and glycerol fractions due to the low concentration of FAEE was also involved in the experiment.
The essence of the experiment consisted of mixing organic samples with water in a volume ratio of 1:1 at different temperatures and further fixing the height of the emulsion layer and the time of separation. These experiments were designed to consider the influence of mixing speed, temperature, and the composition of the ether fraction on the stability of the obtained emulsion of the “water-in-oil” type.
After barbotage, the FAEE samples and ethyl oleate were thermostatted at 30 to 50 °C, after which prepared water at a given temperature was added and stirred for 3–4 min at a speed of 250–500 rpm in increments of 50 rpm. This resulted in the formation of an unstable emulsion (Figure 1).
After mixing, the height of the water layer h1, emulsion phase and water h2, and the total height of the mixture h3 were registered, as well as the stratification time of the emulsion layer (Figure 1). The emulsion layer height hem and ester layer height hFAEE were calculated from the obtained data:
h e m = h 2 h 1
h F A E E = h 3 h 2
After measuring the height of the emulsion layer, the time to the complete separation of the emulsions was measured. The emulsification index was calculated for pure ethyl oleate and different FAEE mixtures obtained from the ethanol removal and separation steps.
% E 24 = h e m h 3 · 100

2.11.2. Microscopic Emulsion Analysis

Globules of emulsion formed during flushing of ethyl esters of fatty acids were studied using a stereoscopic microscope “LOMO” MSP-2. The emulsion was also viewed in the lumen. The magnification range of the microscope varies from 21 to 135.

2.12. Analysis of FAEE

The Fourier Transform Infrared (FTIR) spectra of FAEE were determined by using the FTIR spectrophotometer Nicolet 6700 (Thermo Fisher Scientific, 5225 Verona Road Madison, Fitchburg, WI, USA). For this purpose, a zinc selenide cell was used. The FTIR spectrum was measured in the range of 600–4000 cm−1 with a resolution of 4 cm−1.
XRF and ICP OES methods were used to identify the inorganic impurity content of the FAEE mixtures. To avoid matrix effects in the XRF analysis, a blank FAEE sample obtained via the deep vacuum distillation of FAEE on a Herzog HDV 623 was used.

2.13. Analysis of Biodiesel Quality

The qualitative characteristics of the purified FAEE were analyzed and compared with European Standard EN 14214. The density at 15 °C was determined according to the ISO 3675 «Crude petroleum and liquid petroleum products—Laboratory determination of density—Hydrometer method (IDT)». The kinematic viscosity at 40 °C was determined on an Automated Multi-Range Viscometer HVM 472 according to the ISO 3104 «Petroleum products Transparent and opaque liquids Determination of kinematic viscosity and calculation of dynamic viscosity». The water content was determined according to the ISO 12,937:2000 «Petroleum products. Determination of water. Coulometric Karl Fischer titration method». The content of group I metals (Na, K), group II metals (Ca, Mg), sulfur, and phosphorous was determined according to EN 14214.

2.14. Statistical Analysis

The amount of FAEE synthesis replication in PFR and PMR was up to 10 times. Experiments devoted to the purification and separation of the FAEE phase were replicated at least 3 times. The population standard deviation was calculated according to (15)
σ = 1 n i = 1 n ( x i μ ) 2
where n represents the size of the population consisting of x1, x2xn;
μ represents the amount of population .
For synthesis in the PMR population, the standard deviation was 2.59%, and for synthesis in PMR, it was 2.62%.

3. Results and Discussions

The results of the analysis are presented below (Table 1 and Table 2).
It can be deduced from the presented results that the raw material used in the work is oleic-type oil.
In previous work, a change in the technological parameters of the transesterification process was carried out using a perfect mixing reactor. For this purpose, the molar ratio of oil to alcohol was increased, leading to excess ethanol [82]. Based on the results of the previous work, an assumption was made that it is possible to realize a plug flow reactor operating under optimal conditions without resorting to reducing the channel cross-section to the size of a microreactor.

3.1. Perfect Mixing (PMR) and Plug Flow (PFR) Reactors

For the plug flow reactor, the fundamental value in the design issue is the residence time of the reaction mixture in the reactor. Tests of FAEE synthesis in a plug flow reactor have shown that the maximum conversion of feedstock can be achieved in 5 min [82]. The most difficult task in the work on the PFR unit was to match this value with the pump capacity, length, and cross-section of the reactor. As a heterogeneous system consisting of oil and a KOH alcohol solution that enters the reactor at the beginning of the process, it is important to maintain a turbulent flow regime to prevent the stratification of the mixture.
In some works, this problem is solved by adding static mixers [69]. If pump power is sufficient, it is also possible to create turbulent flow due to the velocity of the liquid flow; however, this will lead to an increase in the length of the reactor. Such solutions require more space and volumes of initial reagents; therefore, it is difficult to realize them in laboratory practice.
With a passage section diameter of 10 mm and a reactor length of 10 m, the power of the peristaltic pump was sufficient to keep the residence time of the reaction mixture at the level of 5 min. In this case, the reaction liquid overcame the part of the reactor immersed in the thermostat in 6 min with the peristaltic pump running at 10 rpm. However, this power was insufficient to establish a turbulent regime in the reactor. To solve this problem, phase mixing was carried out in tank 1, which was installed in front of the reactor.
The capacity of the unit was 5 L/h or 4.07 kg/h, and the conversion of rapeseed oil was 86.7%.
In the case of the perfect mixing reactor, it was more difficult to achieve the same performance. Under optimal synthesis conditions, the total volume of the reaction mixture in one experiment is only 40 mL. Using four parallel reactors, it is possible to produce 160 mL of the reaction mixture in one run, but considering the cost of experiment preparation, the productivity of this synthesis method will remain low.
In comparison to a PFR, scaling up the process in a PMR involves some difficulties. As the volume of the reactor and the volume of the reaction mixture increase, more stirring and heating costs will be required. Thus, by increasing the volume of the reaction mixture to 120 mL (30 mL of oil to 90 mL of alcohol), a decrease in feedstock conversion was observed. The histogram shows the results of FAEE synthesis at different stirring speeds when using 120 mL of reaction mixture at 70 °C for 1.5 h (Figure 2). With the increase in stirring speed, a linear increase in conversion was observed, and it reached 71% at 500 rpm. Nevertheless, this result was achieved with the prolonged stirring of the mixture, which contradicts our original goal of accelerating the process.

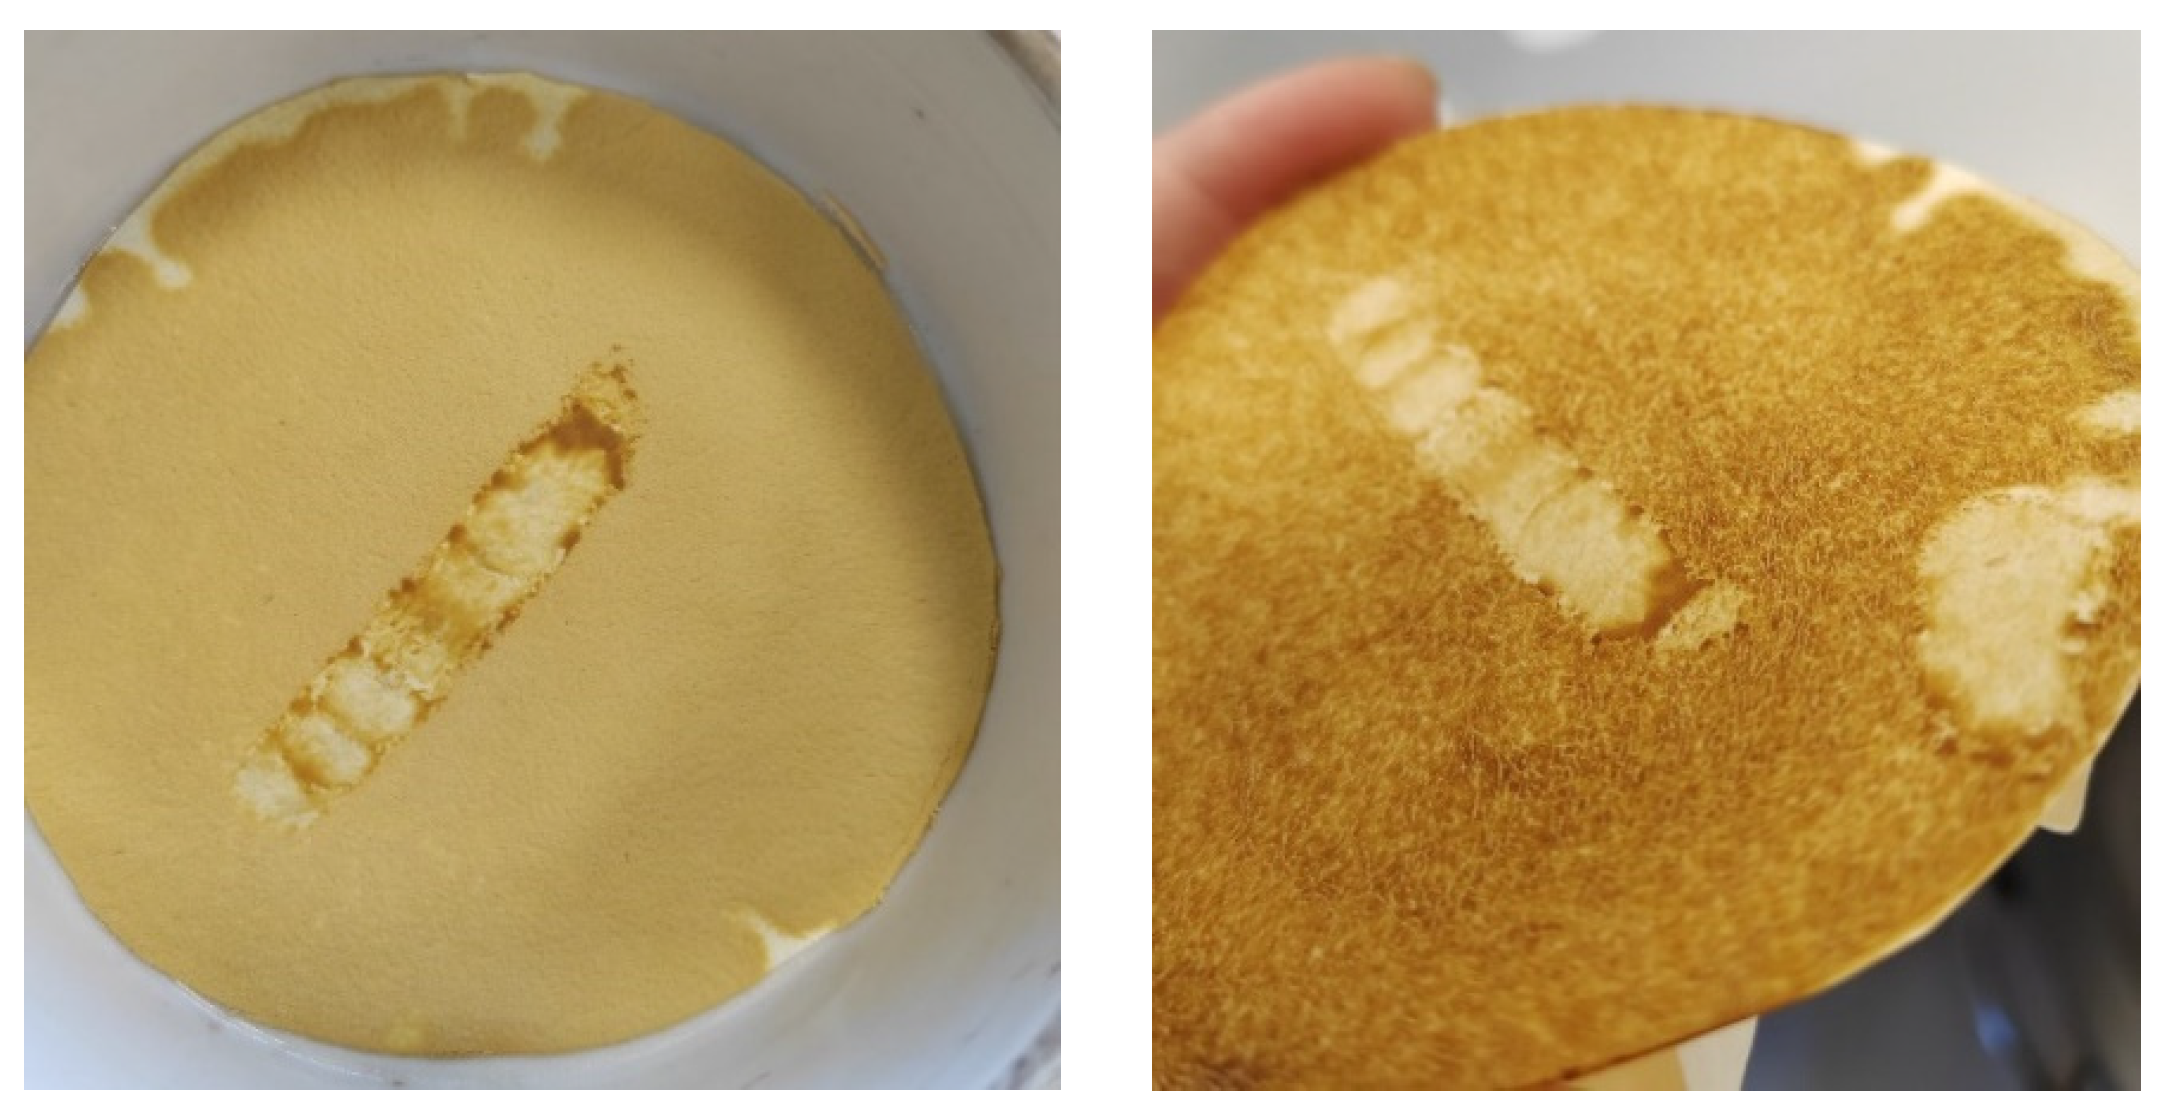
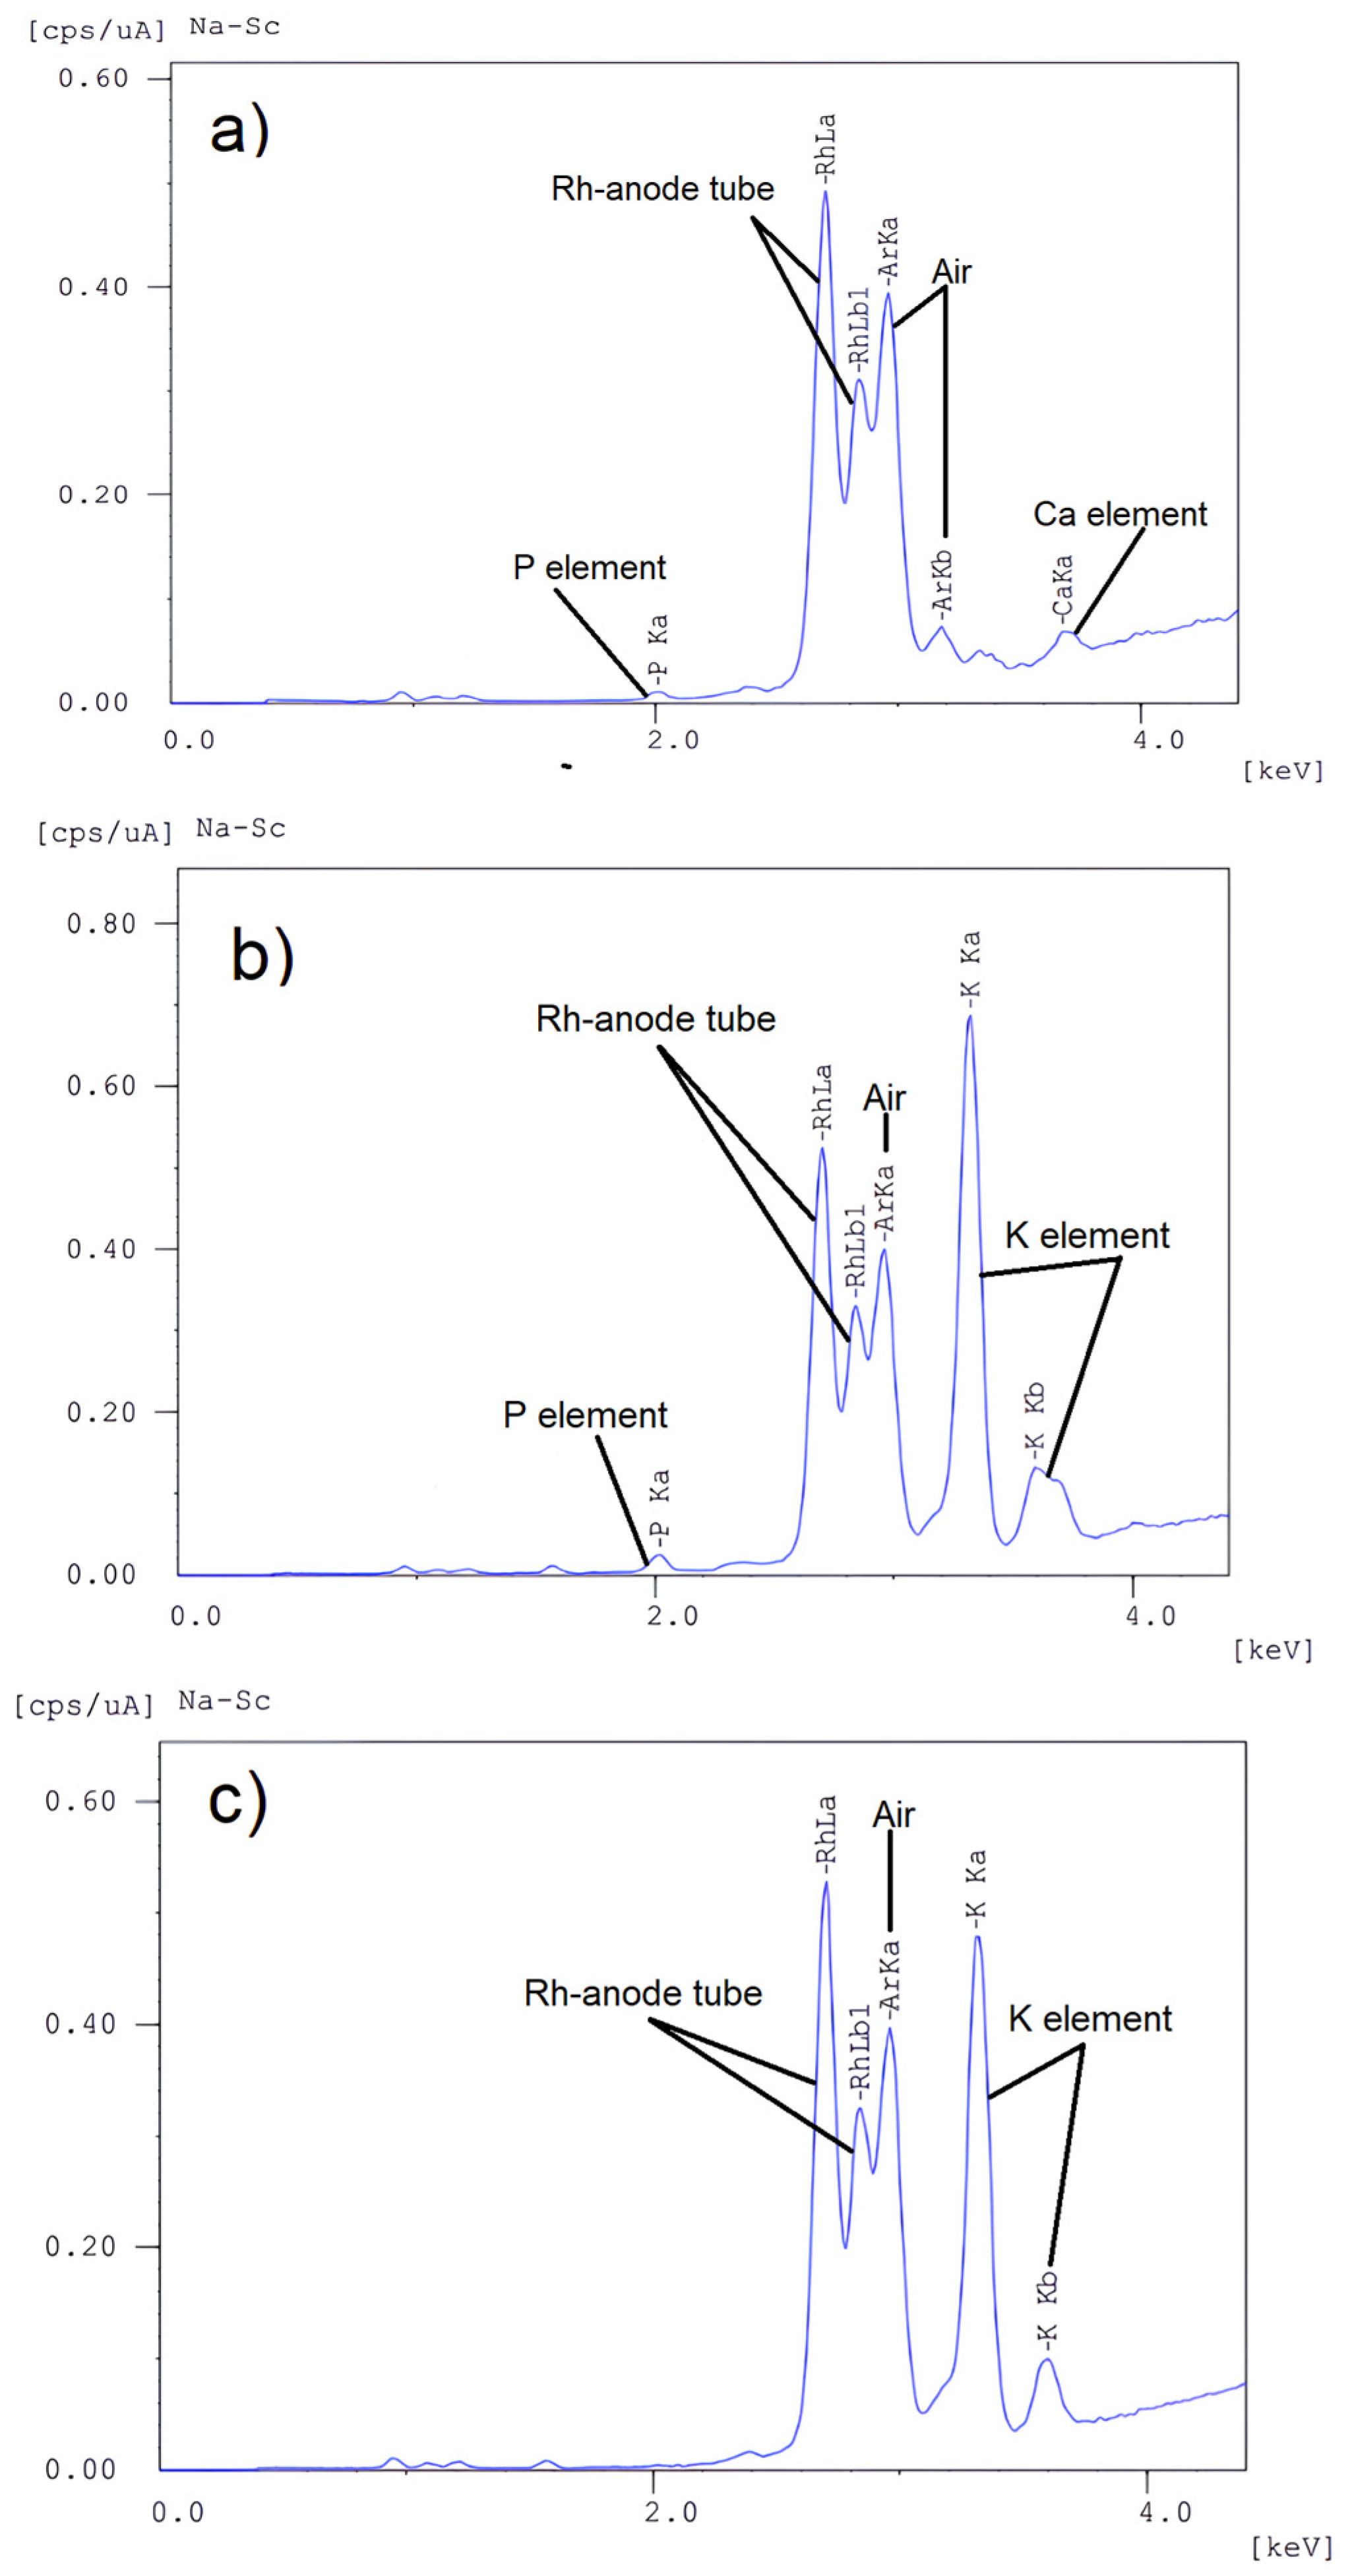
3.2. Qualitative Analysis of the Precipitate after Synthesis

The precipitate formed during the synthesis process is yellow in color and has an oily consistency (Figure 3).
The results of XRF and FTIR analyses of the feedstock, the reaction mixture before and after filtration, and the separated precipitate are presented in Figure 4 and Figure 5 and Table 2. Based on these results, we assume the phospholipidic nature of the precipitate formed since unrefined oil was used in the synthesis process. The findings concerning the phospholipids in rapeseed oil are evidenced by the detection of phosphorus, potassium, and calcium present in it via the XRF method (Table 2). It is known that phospholipids can include metals such as calcium and potassium [83].
The transition of phospholipids to the precipitate is also indicated by the disappearance of the P peak in the XRF spectrogram of the FAEE mixture after filtration (Figure 4c).
It was not possible to determine the vibrations of the P-O groups on the FTIR spectra since their vibrational ranges coincide with the vibrations of the C−O groups, which are also present in the structure of triacylglycerides and fatty acid esters [84]. We can only note the presence of −OH groups in the spectrogram of the precipitate, as well as the shift of the spectral band of valence vibrations of the −C=O bond, which is attributed to the characteristic vibrations of the carbonyl group in the compounds under consideration. In general, the shifts of characteristic spectral bands of oxygen-containing groups in the spectrum of the precipitate remain close to the spectrogram of rapeseed oil (Table 2).
The XRF analysis of the FAEE reaction mixture before and after filtration shows a significant decrease in potassium, which is difficult to attribute to the potassium contained in the phospholipids of the oil (Table 3). Partial precipitation of the catalyst through the participation of KOH in phospholipids hydrolysis or dialysis can be assumed [85]. Additional studies are required to correctly interpret this phenomenon. Nevertheless, the absence of phosphorus and calcium in FAEE is encouraged, as these impurities in fuel will negatively affect ash content and emissions composition. According to European standard EN 14214, the content of P and Ca in FAEE is normalized not more than 10 and 5 mg/kg.

3.3. Ethanol Separation

The removal of excess alcohol from the homogeneous reaction mixture is one of the longest and most important stages of the FAEE production process. The separation efficiency and quality of the ester fraction, as well as the recycling of alcohol to the synthesis unit, will depend on this stage.
Excess ethanol, together with fatty acid esters, promotes co-dissolution of the ester and glycerol phases; therefore, the complete removal of ethanol from the system should lead to their separation [68]. Nevertheless, the atmospheric distillation of ethanol was observed to maintain the homogeneous state of the mixture (Supplementary Materials, Figure S7). This result can be explained by the fact that the intensification of atmospheric distillation requires heating the reaction mixture to temperatures above 78 °C. Strong heating, coupled with a decrease in the concentration of one of the reactants, leads to a shift in the reaction equilibrium toward the starting substances, and as a result, product loss occurs. The concentration of FAEE becomes insufficient to separate the product into a separate phase.
It is possible to isolate esters from such a mixture by creating a deep vacuum; otherwise, the fatty acid esters would undergo decomposition. Distillation at 1.3 kPa enabled the isolation of a fraction of fatty acid esters from the homogeneous mixture after ethanol distillation, but the distillation residue presumably underwent polymerization in the presence of alkali. This conclusion can be drawn from the increase in the gelatinization point of the distillation residue and the change in consistency from a liquid to a gel-like consistency.
At lower vacuum, it becomes possible to create mild distillation temperature conditions. Thus, at a residual pressure of 20 kPa, the vapor temperature of ethanol was kept in the range of 30 to 40 °C, and the liquid temperature did not rise above 56 °C. As a result of distillation, the separation of the distillation residue into glycerol and ether phases was observed (Supplementary Materials, Figure S7).
Based on the results obtained, it can be concluded that the vacuum distillation of ethanol is the most efficient of the considered separation methods. Separation under atmospheric pressure is possible under mild temperature conditions, but this process will take much longer than the vacuum distillation method. The extraction of the ester fraction via a deep vacuum may be effective due to the lack of need for the further purification of FAEE from the catalyst; however, the chemistry of the changes in the distillation residue requires further research and subsequent technological solutions for the processing of this material.
The vacuum distillation of alcohol may be economically viable. This option supports high distillation rates and efficient separation at low mixture heating costs and lower vacuum compared to FAEE distillation. The atmospheric vaporization of ethanol can be an alternative to using a vacuum, but this option will be slower and will affect unit performance.
It is also worth noting that during the vacuum distillation of ethanol, most of the catalyst passes into the glycerol phase. Thus, XRF and ICP OES analysis of the FAEE phase showed the content of KOH to be 0.06%.

3.4. Material Balance

The material balance of synthesis and separation units for plug flow and ideal mixing reactors is presented in Table 4 and Table 5. The largest mass losses are observed at the separation unit, which can be explained by the evaporation and entrainment of ethanol vapor in the receiver tank, which is unavoidable under laboratory practice conditions.
The FAEE phase output in PFR exceeded PMR by 1.23 times, with a small difference in the sum of losses (0.3%) (Table 4). It is worth noting that unrefined rapeseed oil containing 2.57% FFA was used in the work. Since the oil was not subjected to any purification, the yield values are lower compared to alkaline transesterification in other studies [27,50,61]. Nevertheless, the yield in PFR falls within the statistical range of 85 to 99% [61]. This result can be improved by choosing a different catalyst, such as alkoxides, or by improving the quality of the feedstock.

3.5. Catalyst Removal

Tests of KOH carbonation on different media gave the following pH change dynamics (Figure 6).
In the experiment with an aqueous solution of potassium hydroxide, two pH jumps to plateau values of neutral medium were observed on the graph. This is explained by the formation of potassium hydrogen carbonate in an aqueous medium. In the experiments with organic medium, such a result was not observed due to the almost complete absence of water in the component system.
The constancy of the hydrogen index values at the end of the experiments in all three cases indicates the successful progress of the carbonation reaction. It is worth noting that in the FAEE medium, the pH drop was slowed down, and the start of the pH jump coincided in time with the results of pure aqueous and alcoholic KOH solutions. In the mixture of FAEE before ethanol distillation, this jump occurs earlier.
Using the data on reaction time, gas flow rate, and catalyst concentration in solution, we calculated the carbon dioxide flow rate per gram of catalyst (Figure 7a) and plotted the temperature dependence of the process time (Figure 7b).
Due to the removal of excess ethanol from the reaction mixture, the carbonation of the FAEE phase proceeds with less CO2 consumption (Figure 7a). However, it was difficult to carry out experiments in the FAEE phase medium because the surface of the glass membrane of the pH meter quickly clogged. For this reason, we carried out further tests in an alcohol ether medium (FAEE+ethanol).
Figure 7b shows that heating the solution to a temperature above 45 °C is of no practical value, as the carbonation time fluctuates around one value.
Figure 7a reflects the frugality of the KOH neutralization process in different solvent mediums with a decreasing CO2 flow rate. Compared to purely aqueous and alcoholic media, FAEE mixtures show a marked decrease in the consumption of LCO2/g KOH when the gas flow rate was reduced to 20 mL/sec. However, it is difficult to determine the optimal CO2 rate for the process from histogram Figure 7a. To answer this question, we performed additional experiments at gas flow rates of 5 and 10 mL/s. Comparing the specific flow rate and carbonation time on histograms Figure 8a,b, it can be seen that when the gas flow rate decreases to 5 mL/s, the carbonation time remains almost unchanged.
The increase in the specific consumption of CO2 for the neutralization of KOH with increasing gas flow rate can be justified by the fact that gas losses increase. Since the carbonation reaction takes place on the surface of the gas globule, the increase in gas flow leads to a decrease in the time of globule passage through the solution layer.
These details suggest that the optimal gas consumption is still outside the range under consideration.
In the process of FAEE phase purification via neutralization in the presence of H2SO4 solution, an intermediate layer of stable emulsion was formed at the interface (Supplementary Materials, Figure S8). This effect was repeated during the subsequent flushing of the FAEE phase with water to purify it from sulfuric acid impurities.
One could explain this effect by the presence of the glycerol phase, the release of which from the homogeneous medium is observed in the illustrated example (Supplementary Materials, Figure S8). However, in subsequent repetitions of the experiment with purified FAEE phases, the same effect was observed, and it persisted when the FAEEs were washed with water (Supplementary Materials, Figure S9).
It should be noted that in the process of flushing with water, emulsion formation was also observed after the carbonation of the FAEE phase. However, in contrast to the sulphuric acid purification method, here, the emulsion phase was more easily separated and completely disappeared as the process progressed (Supplementary Materials, Figure S9).

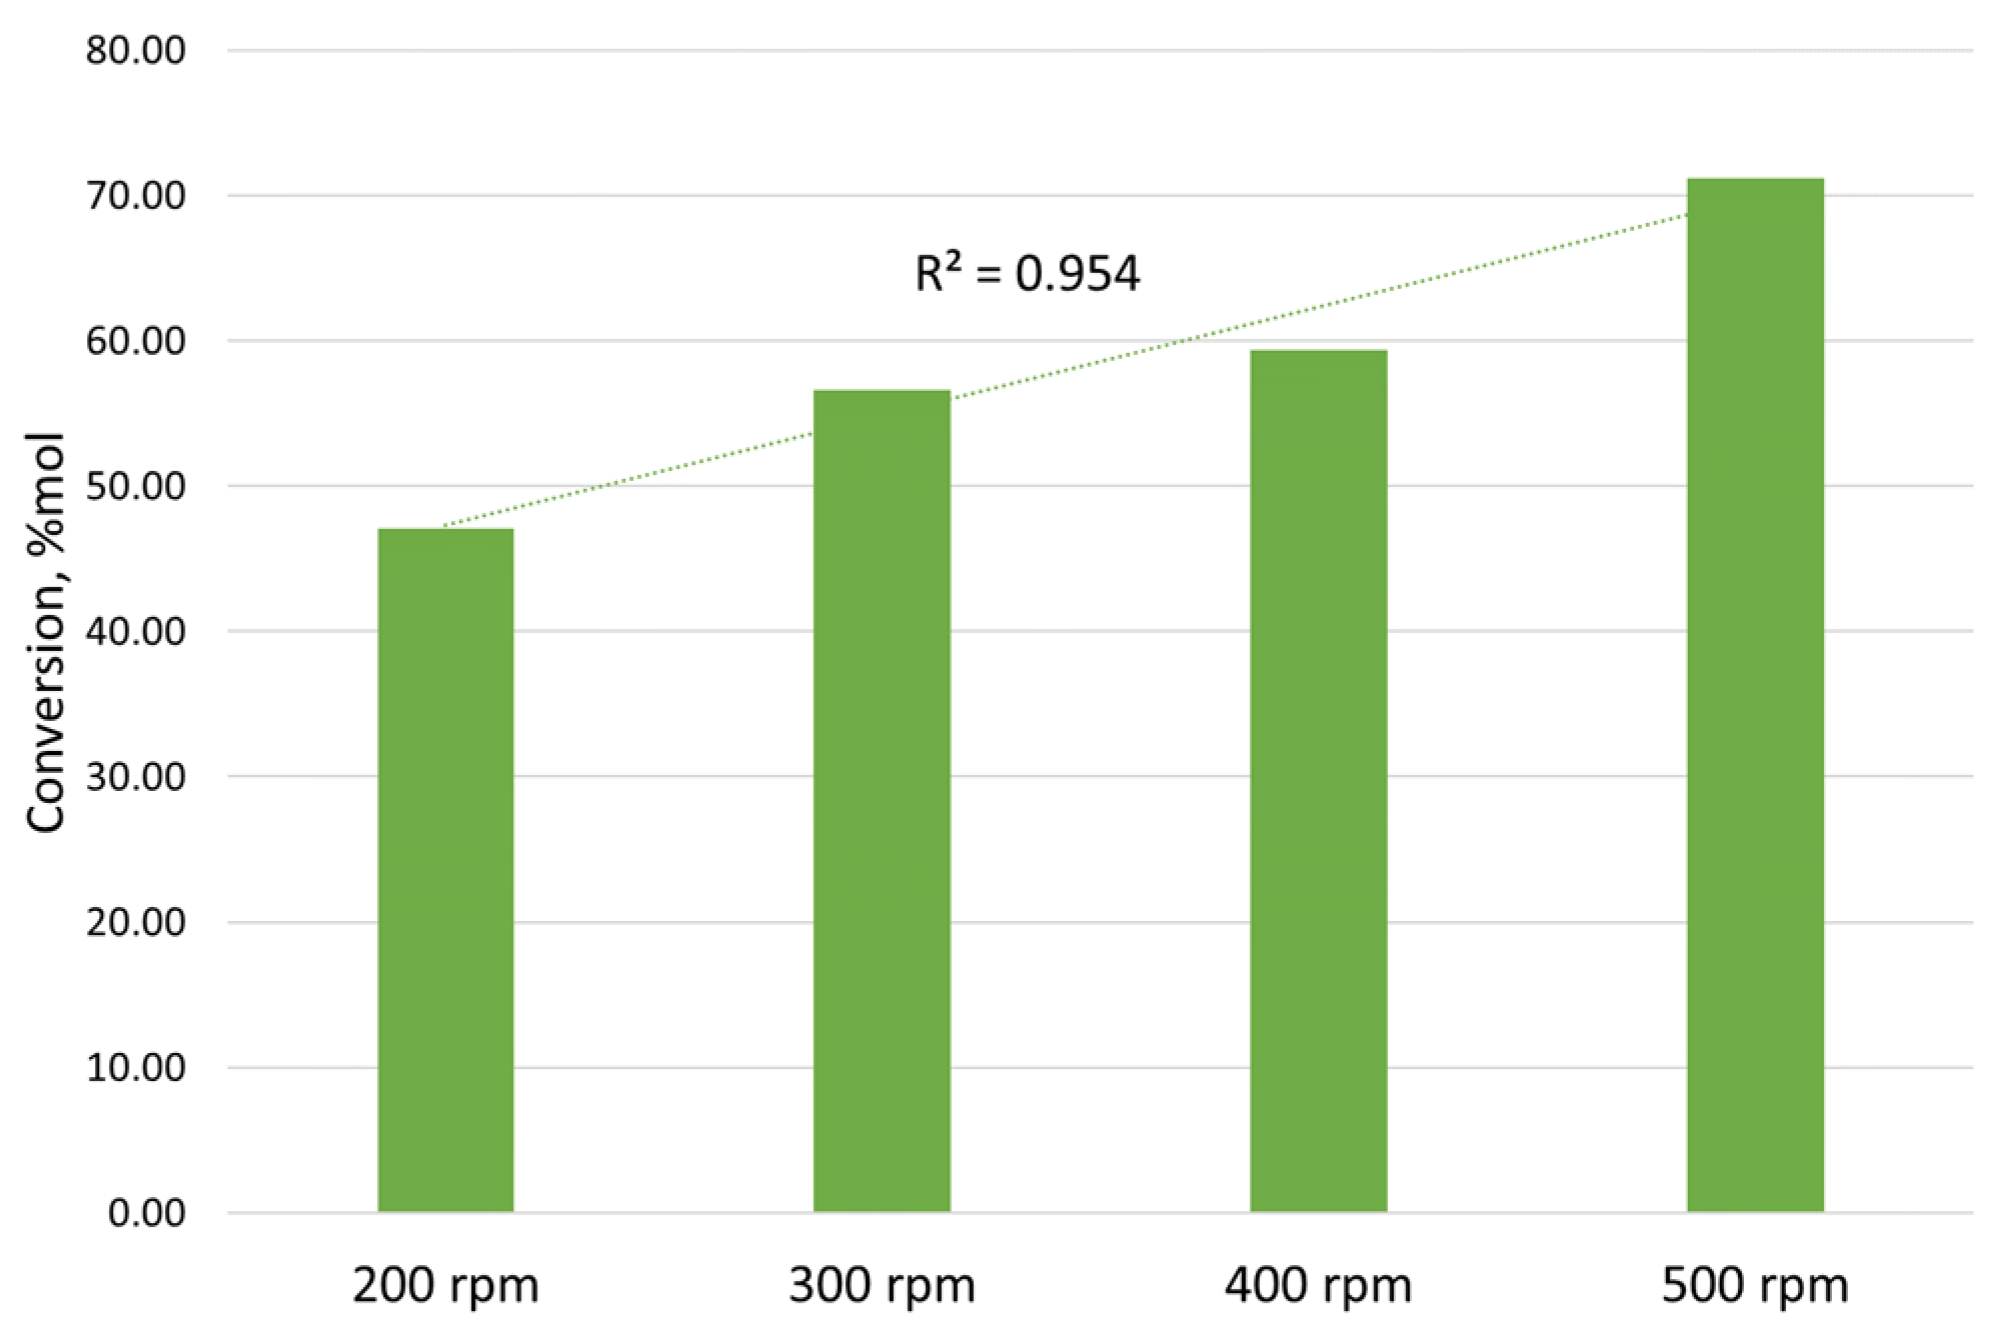
3.6. Emulsion Properties of Esters

The results of mixing and centrifugation of different FAEE-containing fractions with water, as well as their microscopic analysis, are shown in Figure 9. In all three cases, a stable emulsion was formed in the systems containing active KOH, which did not separate completely even when the centrifuge speed was increased to 6000 rpm.
In the case of the FAEE phase, it was possible to partially partition the system, but the emulsion layer was still preserved and concentrated in the interface. This result indicates the necessity of pre-neutralizing KOH in the FAEE phase.
The most stable emulsion was formed with the glycerol phase, as confirmed by the smallest diameter of emulsion layer globules, with an average diameter of 0.20 um. The content of the glycerol phase also influenced the increase in emulsion stability (Figure 9a). This may indicate the presence of reaction intermediates in the glycerol phase, which are good emulsifiers.
The result presented in Figure 9b can be explained by the presence of alkali in the system. Thus, the experiments with emulsion height and stratification time involved purified ethyl oleate and FAEE phase that underwent carbonation. In this series of experiments, the phenomenon of a stable emulsion was not observed. This assumption correlates with the results obtained by washing the FAEE phase with sulfuric acid solutions. It can be assumed that the formation of the emulsion layer in the experiments with sulfuric acid was due to the reaction of the solvent water with the alkaline medium of FAEE-containing KOH. The point is that the use of aqueous H2SO4 solutions does not preclude water contact with the FAEE mixture, which maintains an alkaline pH (~10) due to KOH. Perhaps, this effect can be compensated by increasing the concentration of H2SO4 to the optimum value. For example, at an acid concentration of 250 g/L, the intermediate emulsion layer was practically absent. Nevertheless, whether the observed effect is purely physicochemical or whether there are side reactions of saponification and hydrolysis is a question of future research.

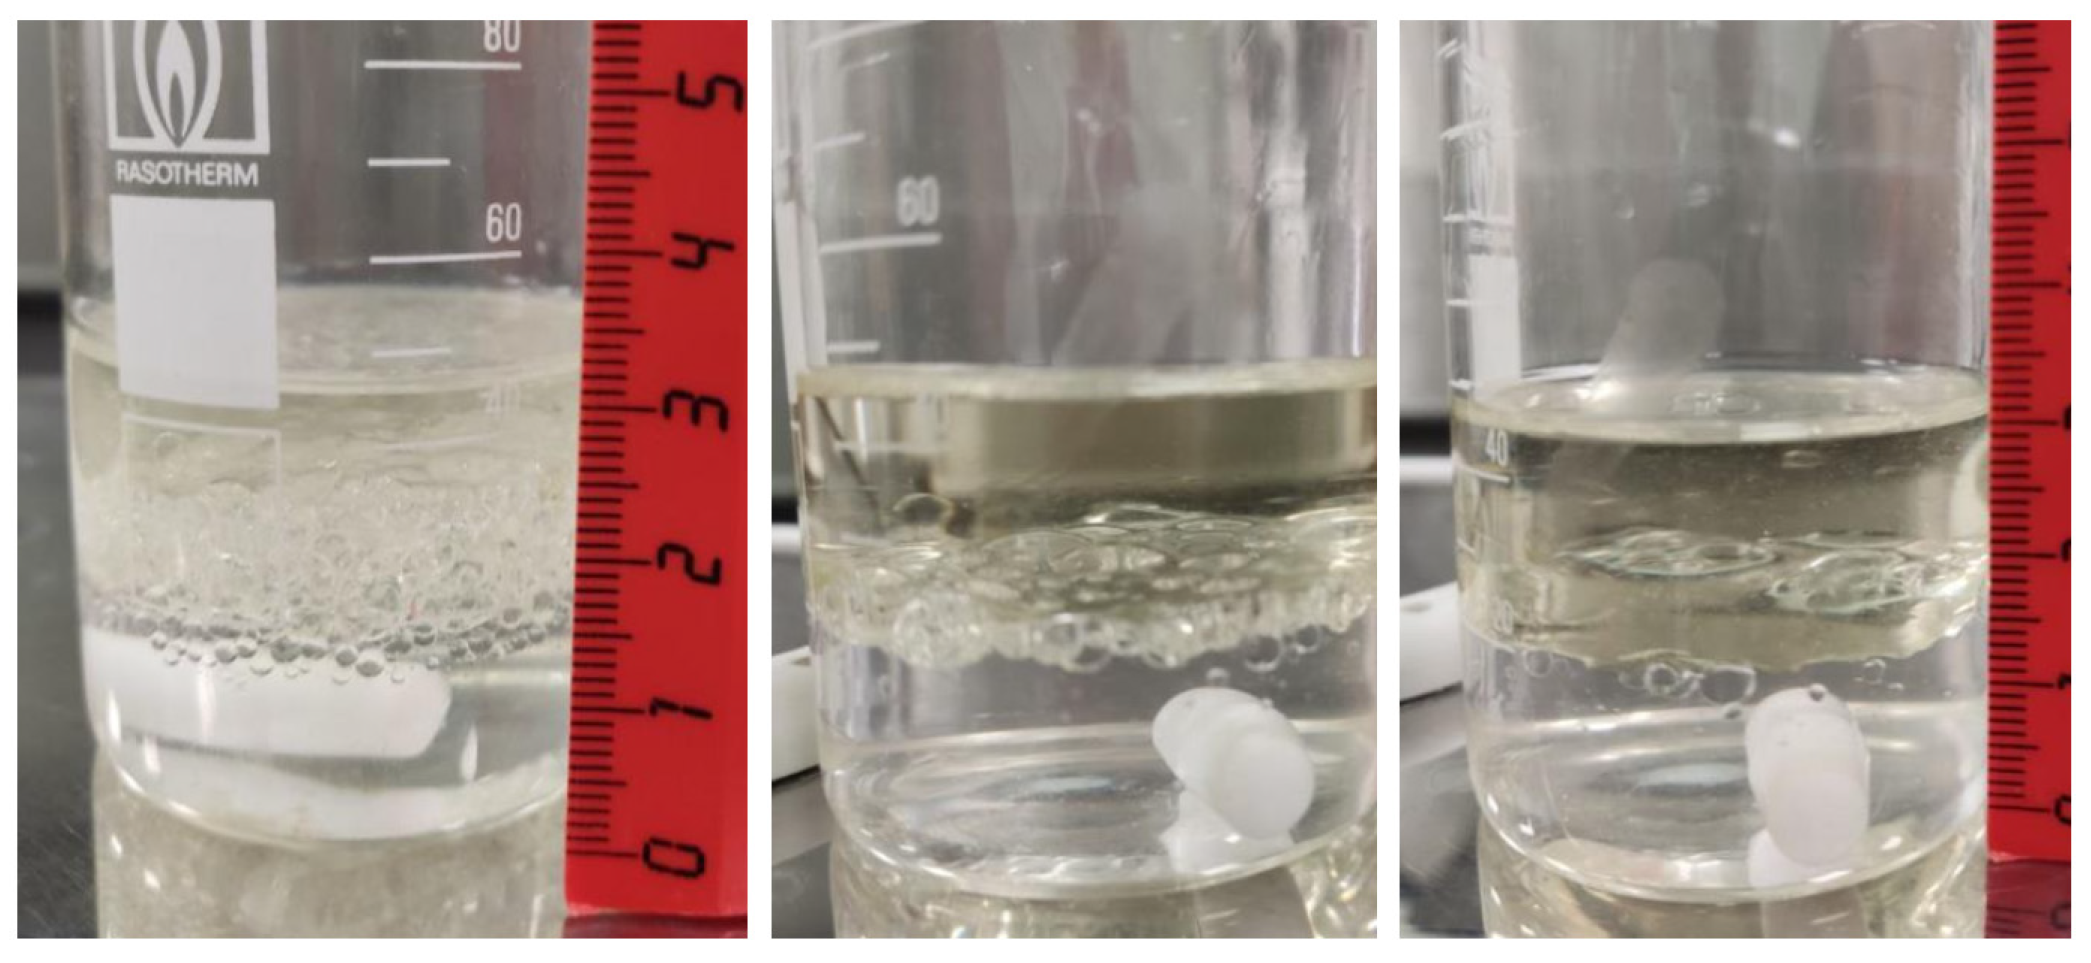
3.7. Delamination Time and Temperature

The isotherms of the stratification time variation for ethyl oleate–water and FAEE–water systems (Supplementary Materials, Figures S10b and S11b) correlate with a quadratic function, which can be compared with the dependence obtained in (13). It should be noted that this dependence holds only in the considered range of stirring speeds. At further increases of this index, a linear equilibrium will be established, at which the separation time will be equal to the maximum.
The isotherms of the emulsion layer height change have a less obvious dependence, which can be considered as a quadratic function or as two linear segments with different angular coefficients. The data obtained during the experiments are not sufficient to form definite conclusions. We can assume that the quadratic relationship will persist until the extremum point is reached. After this value, further increasing the stirring speed will not lead to a decrease or increase in separation time. This assumption is supported by the extreme points after 450 rpm.
It can be seen that heating promotes emulsion breaking, but with increasing temperature, the influence of heating decreases and heating the mixture above 40–45 °C can be considered inexpedient (Supplementary Materials Figures S10 and S11). As the temperature increases, the influence of stirring speed on the emulsion stratification time decreases. Thus, the selection of the optimum temperature minimizes the influence of the mixing speed on emulsion formation.
Analysis of the obtained FAEE–water isotherm graphs showed that temperature has a less active influence on emulsion formation compared to the model system ethyl oleate–water. For FAEEs, mixing in the speed range of 400–450 rpm is optimal since a further increase in mixing speed has little effect on the height of the emulsion layer and stratification time.
Combining the conclusions based on the above graphs suggests that for a range of speeds of 400–450 rpm, providing the required phase contact area for extraction, heating the mixture to a temperature of 40–45 °C would be appropriate.
It is also worth noting that the stirring speed had a greater effect on the carbonized FAEE mixture than on pure ethyl oleate. The hem in FAEE–water system at optimum temperature and stirring speed was 1.5 times higher than the hem in ethyl oleate–water system. Moreover, the FAEE–water emulsion showed much greater time stability under the same conditions. Whereas the ethyl oleate–water system took 25 s to separate, the FAEE–water system took 20 min to separate. Reducing the stirring speed could reduce this value, but in such a case, the contact surface area of the phases would be reduced. Such a result, in comparison with pure ethyl oleate, indicates the presence of emulsifier impurities in the carbonized FAEE phase. These may include saponification products of free fatty acids, as evidenced by FTIR spectrometry (Figure 10).
The selection of a suitable demulsifier may be appropriate to facilitate the separation of the FAEE–water system, which is a separate research vector.

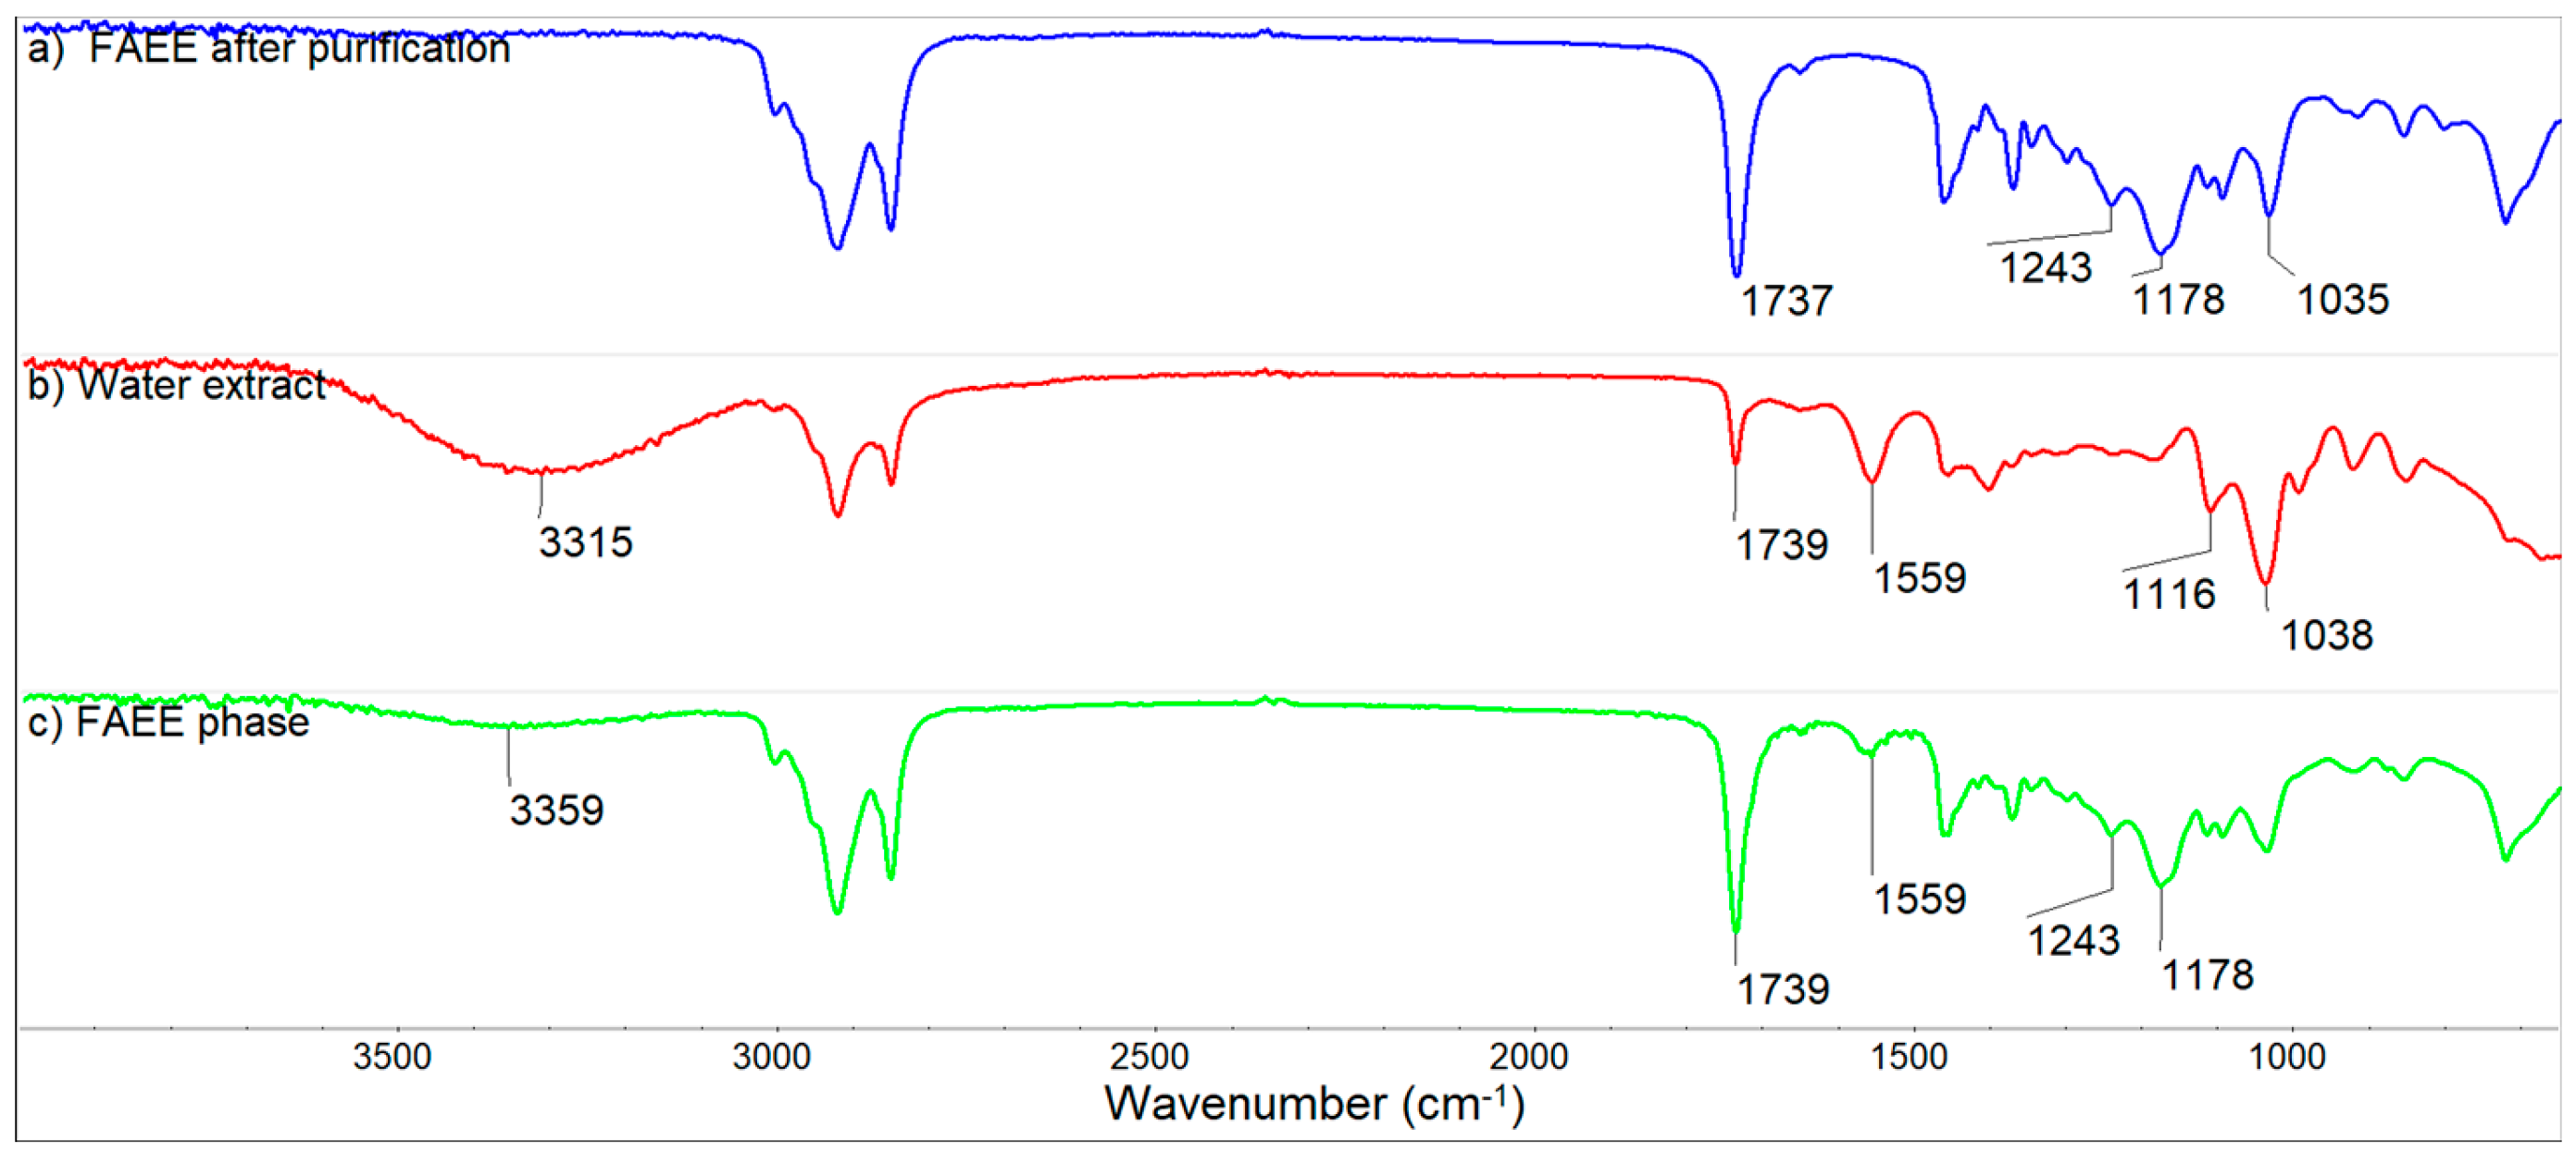
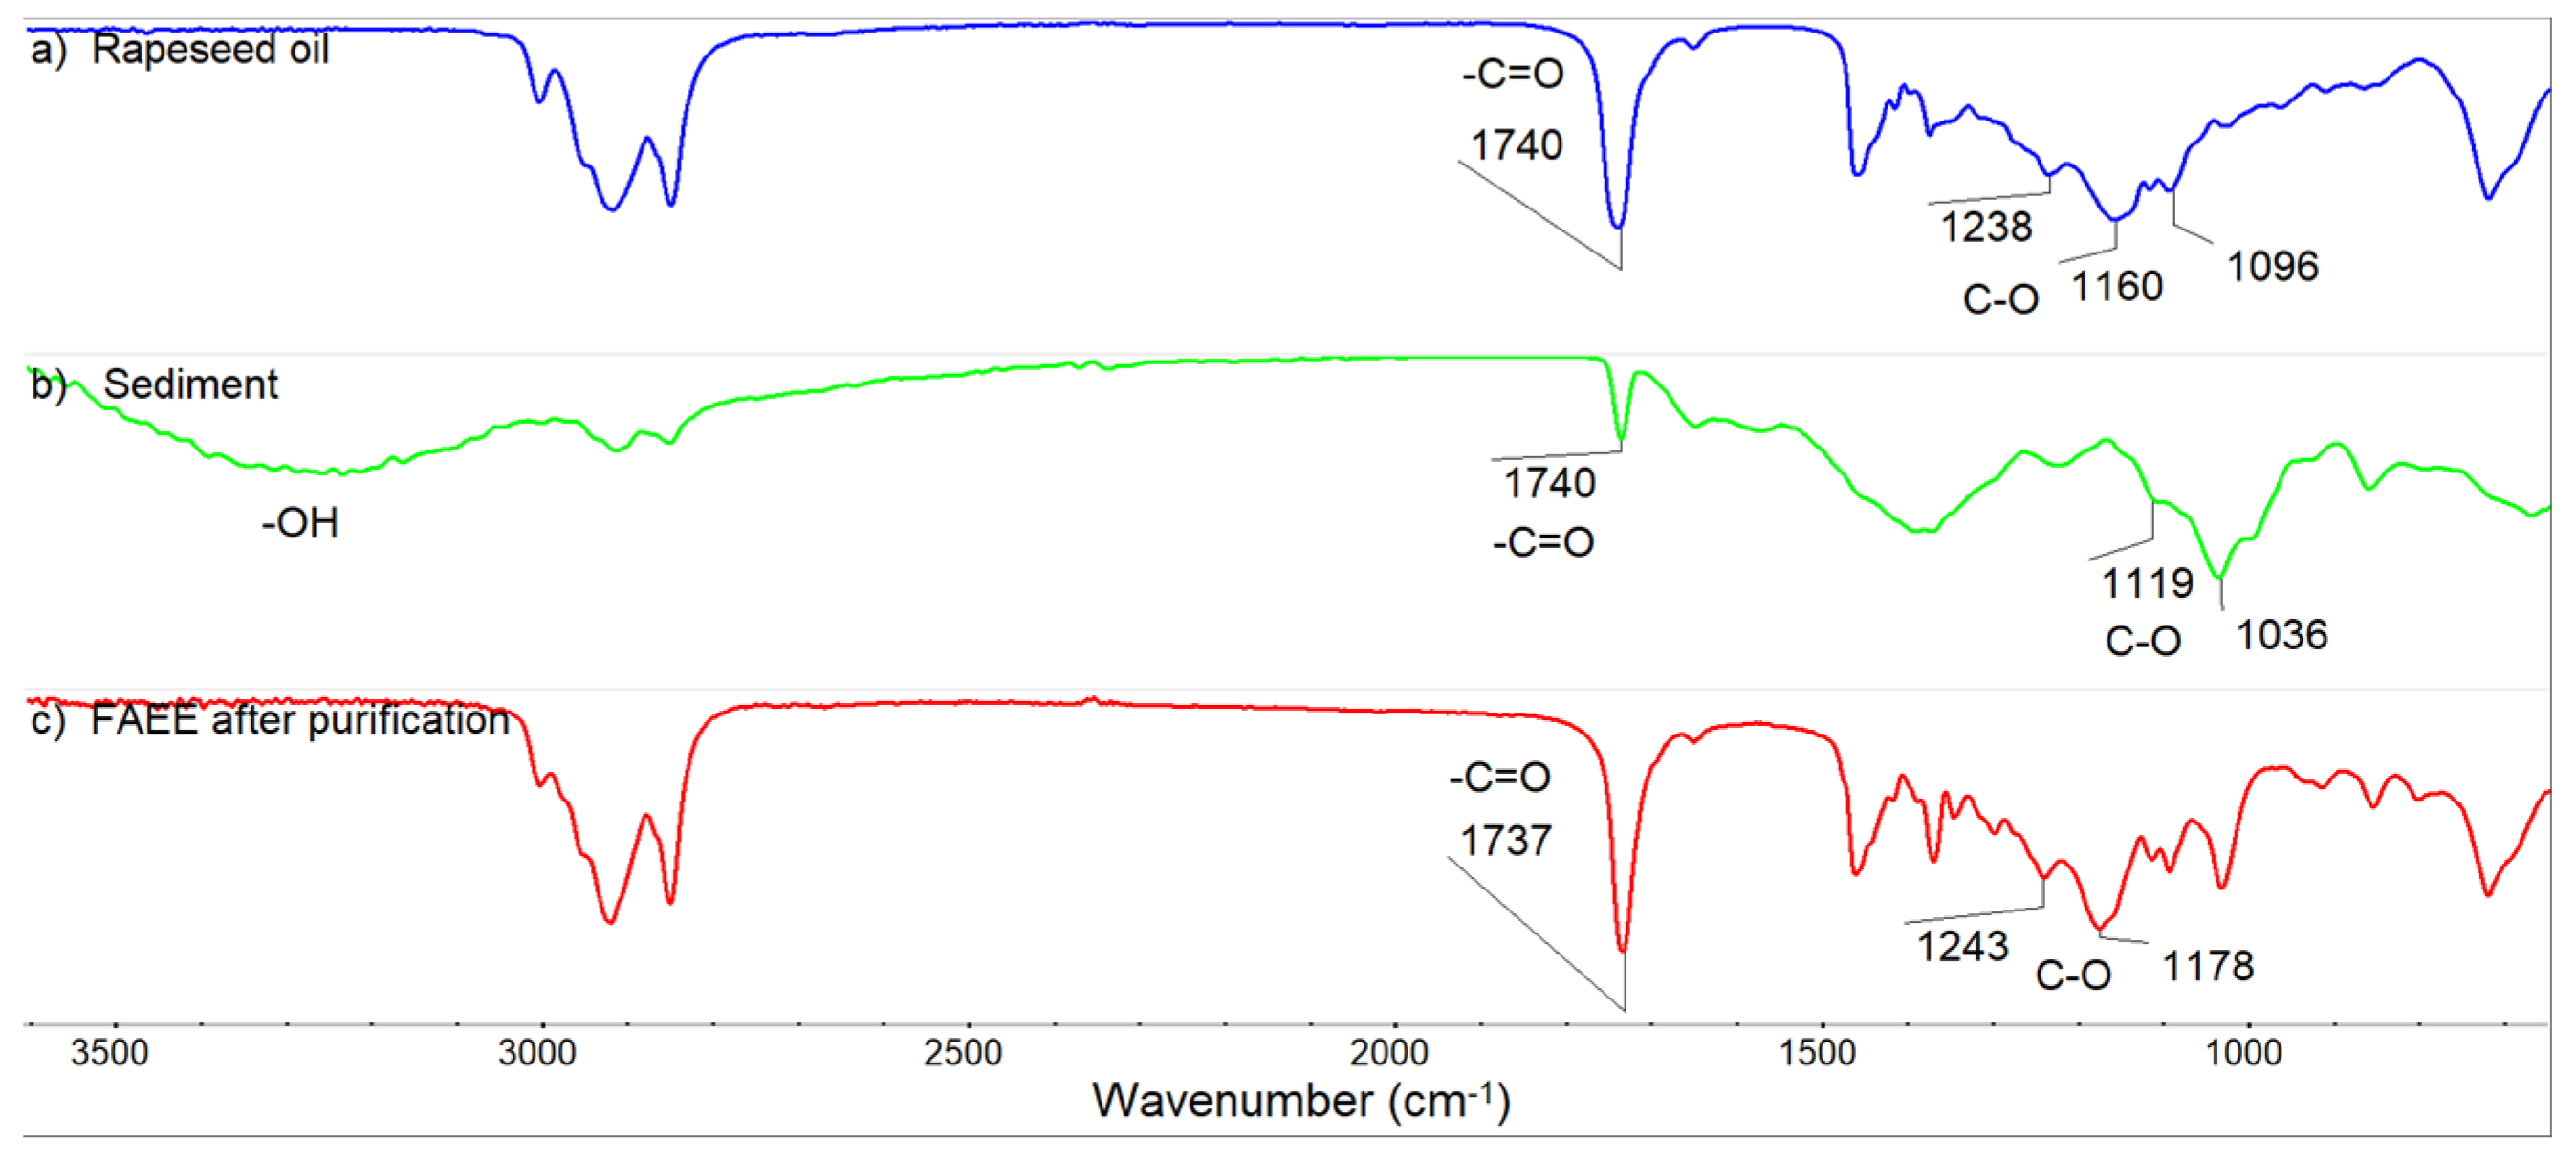
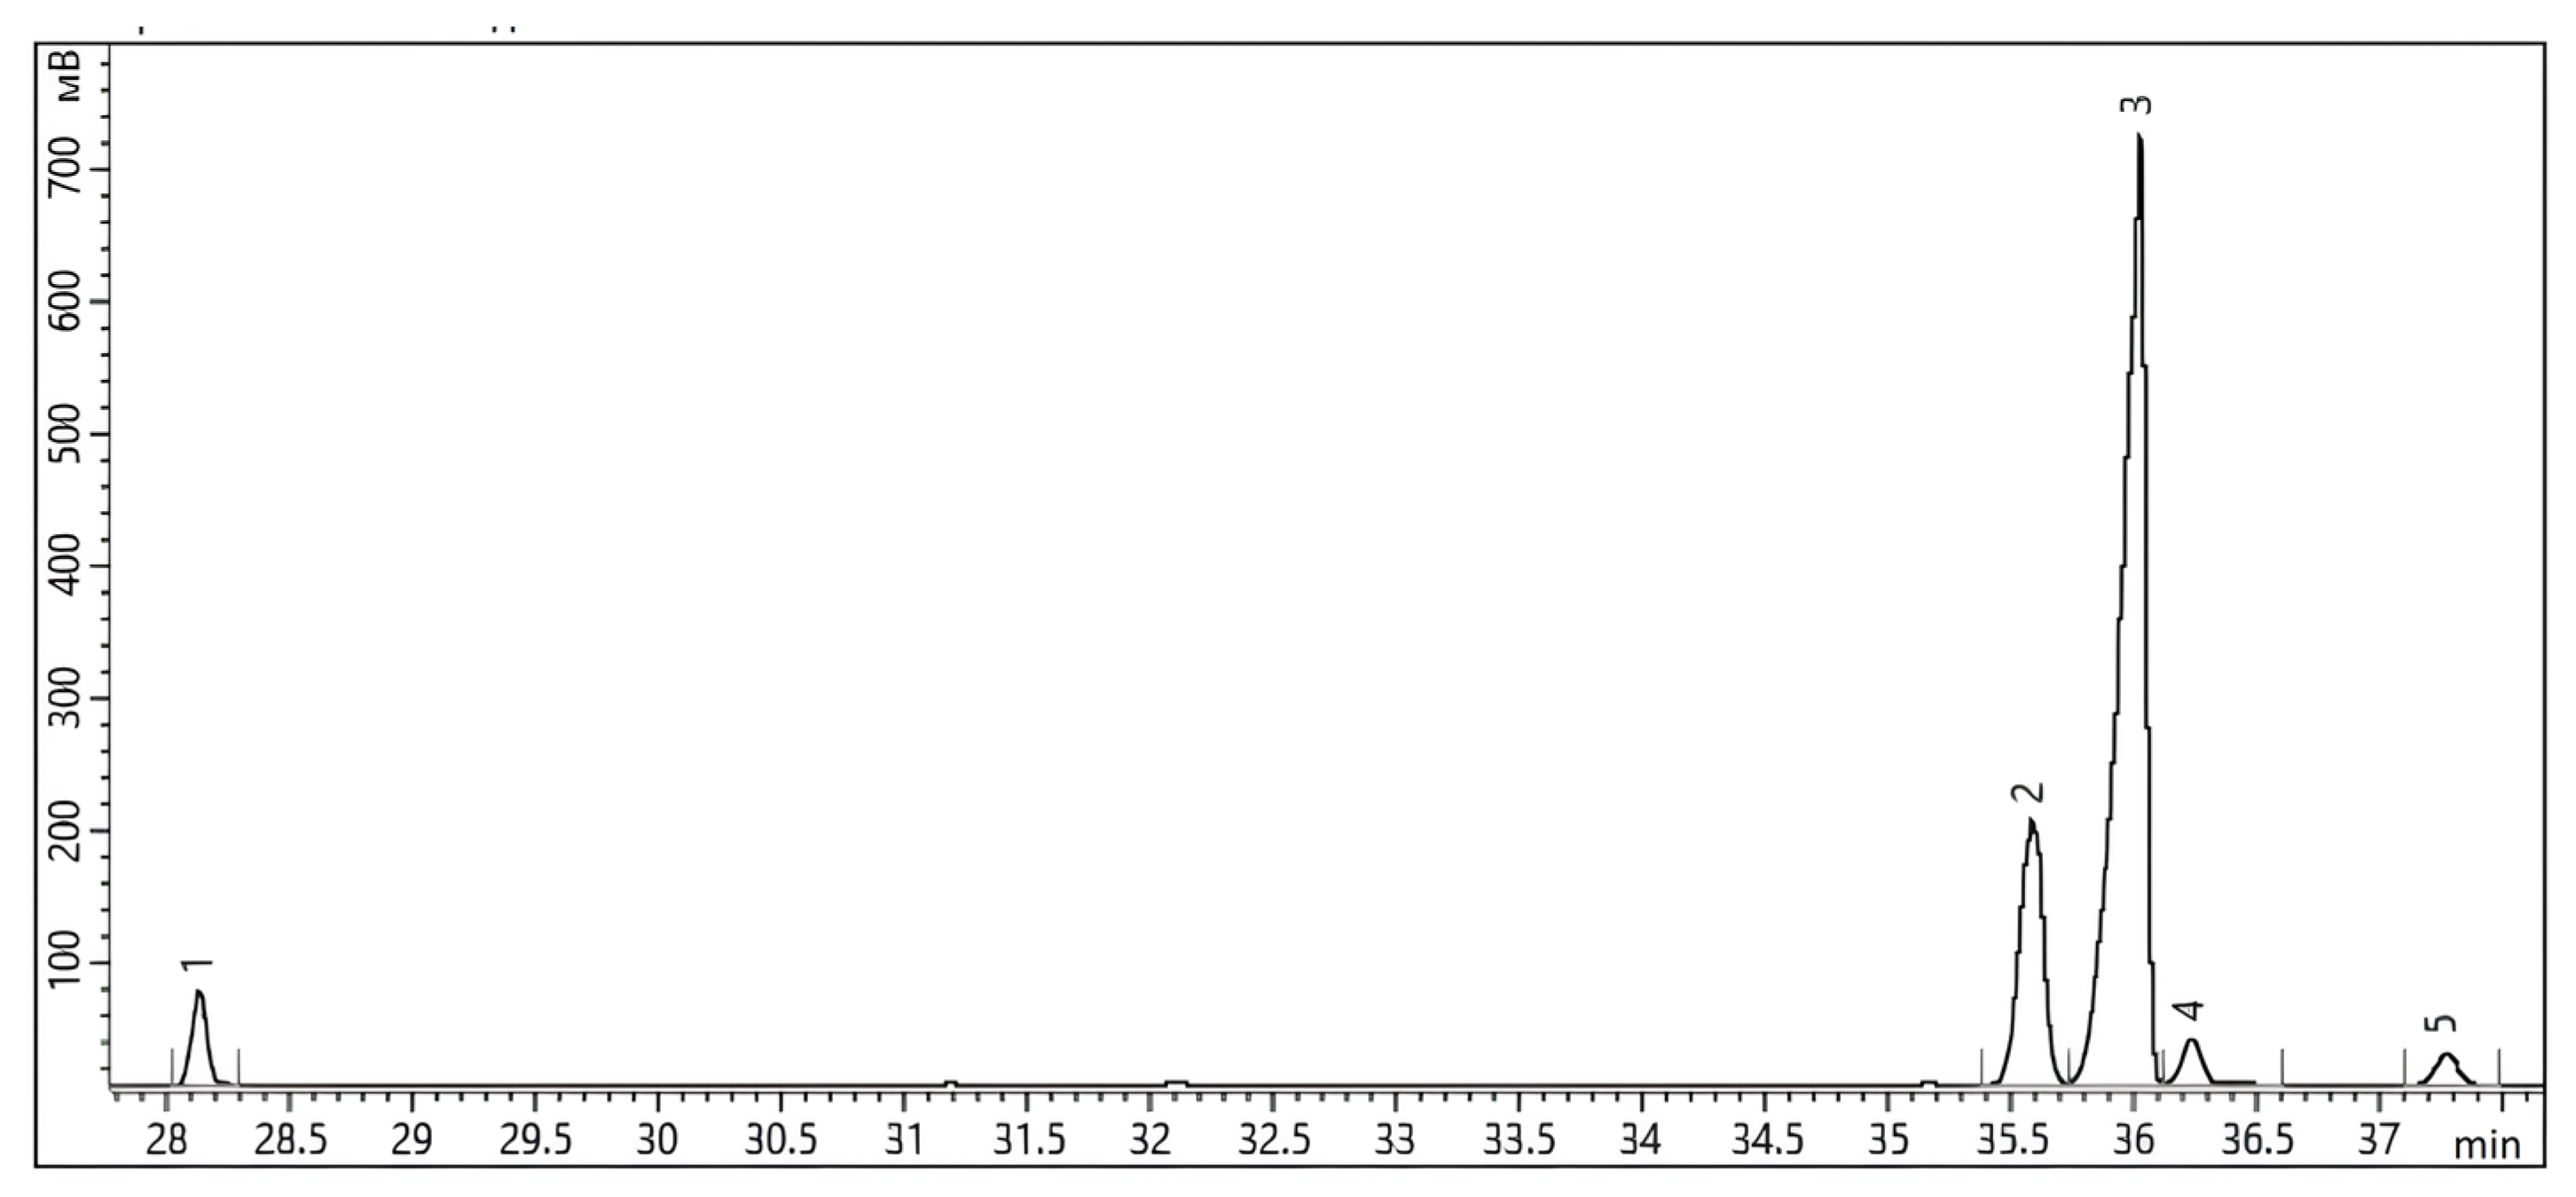
3.8. FT IR and GCMS Analysis of FAEE

When analyzing the IR spectrum of the FAEE mixture obtained as a result of synthesis and purification, characteristic spectral bands confirming the qualitative composition of the mixture can be distinguished (Figure 10). First of all, it is the band of valence vibrations of the carbonyl group (1737 cm−1), the shift of which coincides with the narrow range for esters of long-chain fatty acids (1736–1744 cm−1). Additionally, the spectral bands of valence vibrations of the C-O bond are characteristic of FAEEs. The most intense band is around 1170 cm−1 (1178 cm−1), and a less strong band is present around 1245 cm−1 (1243 cm−1). In the IR spectra of vegetable oil triacylglycerides, these bands are shifted and located around 1164 cm−1, 1236 cm−1, and 1100 cm−1 [86].
The vibration band of the -OH groups with a spectral band at 3359 cm−1 present in the spectrum of the crude mixture of FAEE indicates the presence of potassium hydroxide and the presence of glycerol since the spectrum contains the bands of C-O bond vibrations characteristic of alcohols at about 1116 cm−1 and 1038 cm−1 (Figure 10). In the IR spectrum of the evaporated aqueous extract obtained at the flushing stage, the intensity of these bands increases, while in the IR spectrum of the purified FAEE mixture, the band of the -OH groups disappears, and the bands of the C-O bond shift to the range corresponding to fatty acid esters.
It is also worth noting the presence of a 1559 cm−1 spectral band in the spectra of the initial mixture and the aqueous extract, confirming the presence of carboxide ions in the analyzed mixture (Figure 10b,c). This indicates the presence of impurities of potassium salts of fatty acids, which are also removed from the FAEE mixture at the flushing stage [87].
The GC FID spectra of the FAEEs are presented in Figure 11.
The resulting composition of the FAEE mixture corresponds to the fatty acid composition of the feedstock (Table 2).
From the GC FID spectra we can see that the main component of the resulting FAEE mixture is the ethyl ester of oleic acid. The molecular mass of FAEE calculated from GC MS results is 309 g/mol.

3.9. Biodiesel Quality

The results of the properties analysis of the purified FAEE are summarized in Table 6. The table shows that the physical and chemical properties and composition of the obtained biodiesel meet the requirements of the European standard EN 14214.

3.10. Process Flow

Despite a large number of research works devoted to the modernization of the transesterification process, few of the existing developments are practically implemented in production [25]. In part, this could be due to the complex implementation of the proposed solutions or the lack of elaboration of the full technological cycle.
Summarizing the results of the conducted research, we can draw up a technological flowchart of the FAEE production process in a plug flow reactor (Supplementary Materials, Figure S12).
This block diagram is based on the experience of using a laboratory unit, in which the block of preliminary mixing of reagents was involved (Supplementary Materials, Figure S3), but we do not deny the possibility of technological solutions that would allow excluding this block from the scheme, for example—static mixers.
Depending on the quality of the recovered ethanol from the distillation block, the recycle stream can be directed to the ethanol pretreatment block or directly to the blending block with the KOH catalyst.
The efficiency of the presented scheme will largely depend on matching the capacity of the synthesis, separation and purification units so that the separation and purification units keep pace with the synthesis rate in the plug flow reactor. To optimize the scheme, one could hypothesize combining the distillation unit with carbonization by supplying CO2 instead of air to the column. However, this hypothesis requires additional experiments since it is not known how potassium carbonate can affect the potassium distribution between the glycerol and FAEE phase [88].

4. Conclusions

According to the results of this work, the regularities of changes in the physicochemical properties of FAEE were established while conducting comparative studies on synthesis in PMRs and PFRs:
(1)
Synthesis of fatty acid esters in a plug flow reactor showed positive results when unrefined rapeseed oil was used as a feedstock. At the oil/ethanol volume ratio of 1:3, KOH concentration of 0.5% and reactor residence time of 6 minutes, a product yield of 86.7%mol were achieved. In this case, the synthesis unit productivity was 5.0 L/h or 4.07 kg/h in laboratory conditions, which in terms of FAEE phase equals 1.0 kg/h. The scaling of the process in PMR did not give such a result, which becomes a strong argument in favor of PFR application.
(2)
Vacuum distillation of ethanol at residual pressure up to 20 kPa, as well as atmospheric evaporation in a mild temperature regime can be identified as rational methods of separation of excess ethanol within the investigated technological scheme.
(3)
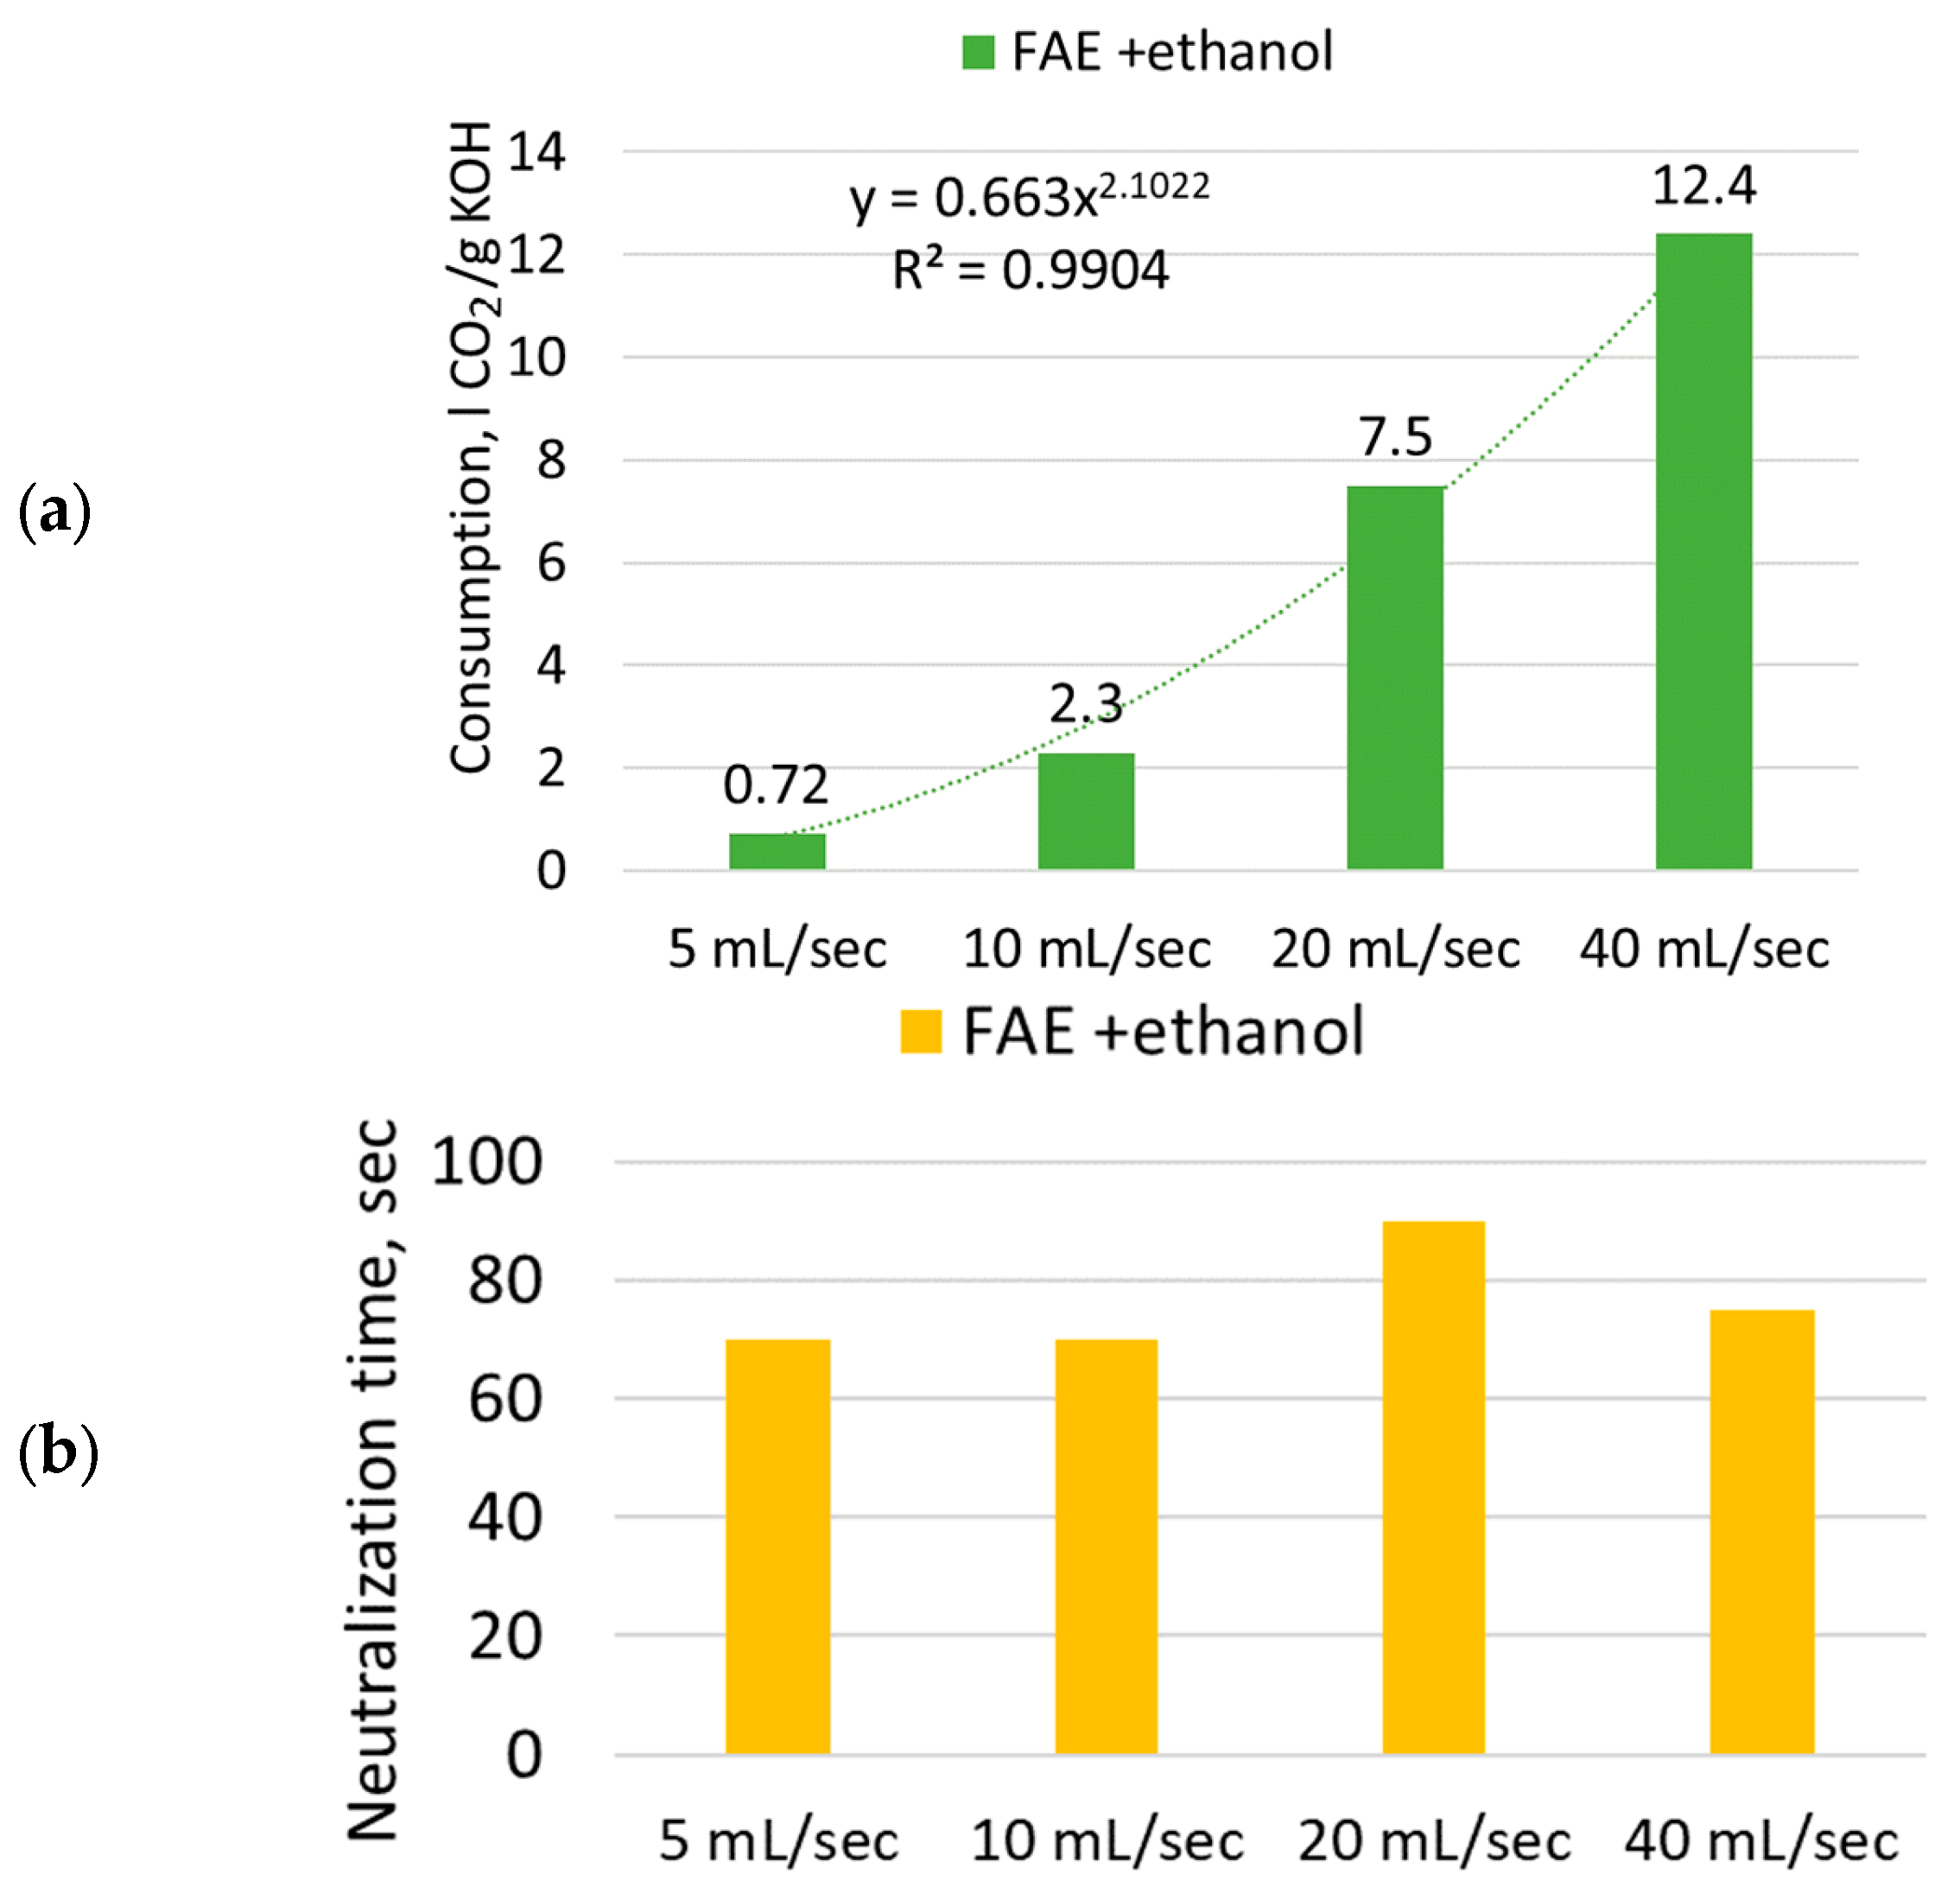
Neutralization of the catalyst in FAEE phase by CO2 carbonization is considered as an alternative to the wet method of neutralization with acid solutions. On the one hand, this method eliminates the need to utilize acid waste water in the production process scheme. On the other hand, the use of carbonization in the FAEE purification process will increase CO2 consumption in the biodiesel production chain.
(4)
For the speed range of 400–450 rpm, providing the necessary phase contact area for extraction, heating the mixture to a temperature of 40–45 °C would be reasonable.
(5)
FTIR analysis of FAEE phase before and after purification testifies to successful purification of FAEE from impurities of catalyst and soap.
The phenomenon of stable emulsion phase in FAEE–water systems is considered in this article from the position of a physicochemical phenomenon caused only by the surface tension of substances. However, this point requires alternative consideration from the position of chemical interaction of fatty acid esters with the water phase in order to identify the risk of product loss to hydrolysis and saponification.

Supplementary Materials

The following supporting information can be downloaded at: https://www.mdpi.com/article/10.3390/pr12040788/s1, FigureS1: Laboratory unit for continuous ethanol drying on zeolite; Figure S2: Auto-MATE Reactor System with perfect-mixing reactors; Figure S3: Laboratory unit for the synthesis of FAEE in the PFR; Figure S4: Ethanol separation unit; Figure S5: FAEE flushing unit; Figure S6: Laboratory barbotage unit; Figure S7: The ethanol separation results; Figure S8: H2SO4 flushing results; Figure S9: Water flushing results; Figure S10: Dependences of emulsion height and separation time on the stirring speed in ethyloleate-water system; Figure S11: Dependences of emulsion height and separation time on the stirring speed in FAEE phase-water system; Figure S12: Principal technological scheme of FAEE production in PFR.

Author Contributions

Conceptualization, S.M.K. and I.N.P.; Methodology, I.N.P.; Software, M.S.S.; Formal analysis, S.M.K. and V.A.R.; Investigation, S.M.K., M.S.S. and V.A.R.; Writing—original draft, S.M.K. and M.S.S.; Writing—review & editing, V.A.R.; Visualization, S.M.K.; Project administration, I.N.P. All authors have read and agreed to the published version of the manuscript.

Funding

The authors declare that no funds, grants, or other support were received during the preparation of this manuscript.

Data Availability Statement

The original contributions presented in the article/Supplementary Matireal, futher inquiries can be directed to the corresponding author/s.

Acknowledgments

The authors express their deep gratitude to the team of students and graduates of Saint Petersburg Mining University for the practical and moral support in achieving the objectives of this scientific work: Maria S. Zavadskaya, Yulia M. Kachina, Alexandra A. Kazachenko, Ksenia M. Grai.

Conflicts of Interest

The authors have no relevant financial or non-financial interests to disclose.

References

  1. Swindell, W.R.; Bojanowski, K.; Singh, P.; Randhawa, M.; Chaudhuri, R.K. Bakuchiol and Ethyl (Linoleate/Oleate) Synergistically Modulate Endocannabinoid Tone in Keratinocytes and Repress Inflammatory Pathway MRNAs. JID Innov. 2023, 3, 100178. [Google Scholar] [CrossRef] [PubMed]
  2. Kislyak, O.A.; Starodubova, A.V. Modern Views on the Possibility of Using Ethyl Esters of Ω3 Polyunsaturated Fatty Acids 90% in the Treatment and Prevention of Cardiovascular Diseases and CHF. Atmos. Cardiol. News 2011, 3, 28–32. [Google Scholar]
  3. Gautam, S.; Guria, C.; Rajak, V.K. A State of the Art Review on the Performance of High-Pressure and High-Temperature Drilling Fluids: Towards Understanding the Structure-Property Relationship of Drilling Fluid Additives. J. Pet. Sci. Eng. 2022, 213, 110318. [Google Scholar] [CrossRef]
  4. Ahmed, A.; Elkatatny, S.; Al-Afnan, S. Applications of Biodiesel in Drilling Fluids. Geofluids 2021, 2021, 5565897. [Google Scholar] [CrossRef]
  5. Tóth, Á.D.; Mike-Kaszás, N.; Bartus, G.; Hargitai, H.; Szabó, Á.I. Surface Modification of Silica Nanoparticles with Ethyl Oleate for the Purpose of Stabilizing Nanolubricants Used for Tribological Tests. Ceramics 2023, 6, 980–993. [Google Scholar] [CrossRef]
  6. Zulkifli, N.W.M.; Azman, S.S.N.; Kalam, M.A.; Masjuki, H.H.; Yunus, R.; Gulzar, M. Lubricity of Bio-Based Lubricant Derived from Different Chemically Modified Fatty Acid Methyl Ester. Tribol. Int. 2016, 93, 555–562. [Google Scholar] [CrossRef]
  7. Sverguzova, S.; Sapronova, Z.; Zubkova, O.; Svyatchenko, A.; Shaikhieva, K.; Voronina, Y. Electric Steelmaking Dust as a Raw Material for Coagulant Production. J. Min. Inst. 2023, 260, 279–288. [Google Scholar] [CrossRef]
  8. Zubkova, O.; Alexeev, A.; Polyanskiy, A.; Karapetyan, K.; Kononchuk, O.; Reinmöller, M. Complex Processing of Saponite Waste from a Diamond-Mining Enterprise. Appl. Sci. 2021, 11, 6615. [Google Scholar] [CrossRef]
  9. Kondrasheva, N.; Eremeeva, A. Production of Biodiesel Fuel from Vegetable Raw Materials. J. Min. Inst. 2023, 260, 248–256. [Google Scholar] [CrossRef]
  10. Bolobov, V.I.; Latipov, I.U.; Zhukov, V.S.; Popov, G.G. Using the Magnetic Anisotropy Method to Determine Hydrogenated Sections of a Steel Pipeline. Energies 2023, 16, 5585. [Google Scholar] [CrossRef]
  11. Tayana, E.; Litvinova, D.V.S. Lightweight Ash-Based Concrete Production as a Promising Way of Technogenic Product Utilization (on the Example of Sewage Treatment Waste). J. Min. 2023, 264, 906–918. [Google Scholar]
  12. Litvinova, T.E.; Suchkov, D.V. Comprehensive Approach to the Utilisation of Technogenic Waste from the Mineral Resource Complex. Min. Informational Anal. Bull. 2022, 6, 331–348. [Google Scholar] [CrossRef]
  13. Cheremisina, O.; Litvinova, T.; Sergeev, V.; Ponomareva, M.; Mashukova, J. Application of the Organic Waste-Based Sorbent for the Purification of Aqueous Solutions. Water 2021, 13, 3101. [Google Scholar] [CrossRef]
  14. Korshunov, G.I.; Eremeeva, A.M.; Drebenstedt, C. Justification of the Use of a Vegetal Additive to Diesel Fuel as a Method of Protecting Underground Personnel of Coal Mines from the Impact of Harmful Emissions of Diesel-Hydraulic Locomotives. J. Min. Inst. 2021, 247, 39–47. [Google Scholar] [CrossRef]
  15. Tcvetkov, P. Engagement of Resource-Based Economies in the Fight against Rising Carbon Emissions. Energy Rep. 2022, 8, 874–883. [Google Scholar] [CrossRef]
  16. Kovalskaya, K.V.; Gorlanov, E.S. Al–Ti–B Master Alloys: Structure Formation in Modified Alloys. Tsvetnye Met. 2022, 57–64. [Google Scholar] [CrossRef]
  17. Vinogradova, A.; Gogolinskii, K.; Umanskii, A.; Alekhnovich, V.; Tarasova, A.; Melnikova, A. Method of the Mechanical Properties Evaluation of Polyethylene Gas Pipelines with Portable Hardness Testers. Inventions 2022, 7, 125. [Google Scholar] [CrossRef]
  18. Litvinenko, V.; Bowbrick, I.; Naumov, I.; Zaitseva, Z. Global Guidelines and Requirements for Professional Competencies of Natural Resource Extraction Engineers: Implications for ESG Principles and Sustainable Development Goals. J. Clean. Prod. 2022, 338, 130530. [Google Scholar] [CrossRef]
  19. Buslaev, G.; Lavrik, A.; Lavrik, A.; Tcvetkov, P. Hybrid System of Hydrogen Generation by Water Electrolysis and Methane Partial Oxidation. Int. J. Hydrogen. Energy 2023, 48, 24166–24179. [Google Scholar] [CrossRef]
  20. Litvinenko, V.; Petrov, E.; Vasilevskaya, D.; Yakovenko, A.; Naumov, I.; Ratnikov, M. Assessment of the Role of the State in the Management of Mineral Resources. J. Min. Inst. 2022, 259, 95–111. [Google Scholar] [CrossRef]
  21. Povarov, V.; Efimov, I. Use of the UNIFAC Model in the Calculation of Physicochemical Properties of Ecotoxicants for Technological and Ecoanalytical Purposes. J. Min. Inst. 2023, 260, 238–247. [Google Scholar] [CrossRef]
  22. Vasilyeva, M.A.; Volchikhina, A.A.; Kuskildin, R.B. Improvement of Water Segregation in Backfilling. Min. Informational Anal. Bull. 2023, 4, 125–139. [Google Scholar] [CrossRef]
  23. Iusovskii, A.; Boldushevskii, R.; Mozhaev, A.; Shmelkova, O.; Pavlycheva, E.; Koklyukhin, A.; Nikulshin, P. Tailoring NiMo-Based Catalysts for Production of Low-Viscosity Sustainable Hydrocarbon Bases for Drilling Muds from Secondary Gas Oils. Energies 2023, 16, 5859. [Google Scholar] [CrossRef]
  24. Iuzmukhametova, R.; Boldushevskii, R.; Shmelkova, O.; Khamzin, Y.; Minaev, A.; Nikulshin, P. Adsorptive Treatment of Residues on Macroporous Adsorbent for Marine Fuel Production Scheme on Refinery. J. Mar. Sci. Eng. 2023, 11, 525. [Google Scholar] [CrossRef]
  25. Permyakova, I.A.; Vol’khin, V.V.; Kazakov, D.A.; Kaczmarski, K.; Kudryashova, O.S.; Sukhoplecheva, E.A. Phase Equilibria in Triacylglycerols—Ethanol—Oleic Acid—Athyl Oleate Quasi-Quaternary System. Eurasian Chem.-Technol. J. 2014, 16, 257–264. [Google Scholar] [CrossRef]
  26. Permyakova, I.A.; Vol’khin, V.V.; Medvedeva, O.S. Extraction in Emulsion Mode of Higher Fatty Acids from Vegetable Oils by Methanol or Ethanol in Esters Production. Russ. J. Appl. Chem. 2020, 93, 437–448. [Google Scholar] [CrossRef]
  27. Bashir, M.A.; Wu, S.; Zhu, J.; Krosuri, A.; Khan, M.U.; Ndeddy Aka, R.J. Recent Development of Advanced Processing Technologies for Biodiesel Production: A Critical Review. Fuel Process. Technol. 2022, 227, 107120. [Google Scholar] [CrossRef]
  28. Charykova, O.G.; Otinova, M.E.; Tiutiunikov, A.A. Key Directions of Agricultural Export Development in Russian Regions. Econ. Reg. 2022, 18, 193–207. [Google Scholar] [CrossRef]
  29. Susanu, I. Regulation of Liquid Biofuel Market in Russia and World. Trade Policy 2019, 1, 60–88. [Google Scholar] [CrossRef]
  30. Sergeev, V.; Balandinsky, D.; Romanov, G.; Rukin, G. Sorption Treatment of Water from Chromium Using Biochar Material. Arab. J. Basic Appl. Sci. 2023, 30, 299–306. [Google Scholar] [CrossRef]
  31. Petrov, D.S.; Korotaeva, A.E.; Pashkevich, M.A.; Chukaeva, M.A. Assessment of Heavy Metal Accumulation Potential of Aquatic Plants for Bioindication and Bioremediation of Aquatic Environment. Environ. Monit. Assess 2023, 195, 122. [Google Scholar] [CrossRef]
  32. Wu, H.; Colson, G.; Escalante, C.; Wetzstein, M. An Optimal U.S. Biodiesel Fuel Subsidy. Energy Policy 2012, 48, 601–610. [Google Scholar] [CrossRef]
  33. Phomsoda, K.; Puttanapong, N.; Piantanakulchai, M. Assessing Economic Impacts of Thailand’s Fiscal Reallocation between Biofuel Subsidy and Transportation Investment: Application of Recursive Dynamic General Equilibrium Model. Energies 2021, 14, 4248. [Google Scholar] [CrossRef]
  34. Riayatsyah, T.M.I.; Ong, H.C.; Chong, W.T.; Aditya, L.; Hermansyah, H.; Mahlia, T.M.I. Life Cycle Cost and Sensitivity Analysis of Reutealis Trisperma as Non-Edible Feedstock for Future Biodiesel Production. Energies 2017, 10, 877. [Google Scholar] [CrossRef]
  35. Polyakov, A.A.; Gorlanov, E.S.; Mushihin, E.A. Analytical Modeling of Current and Potential Distribution over Carbon and Low-Consumable Anodes during Aluminum Reduction Process. J. Electrochem. Soc. 2022, 169, 053502. [Google Scholar] [CrossRef]
  36. Ershov, M.A.; Savelenko, V.D.; Makhova, U.A.; Makhmudova, A.E.; Zuikov, A.V.; Kapustin, V.M.; Abdellatief, T.M.M.; Burov, N.O.; Geng, T.; Abdelkareem, M.A.; et al. Current Challenge and Innovative Progress for Producing HVO and FAME Biodiesel Fuels and Their Applications. Waste Biomass Valorization 2023, 14, 505–521. [Google Scholar] [CrossRef]
  37. Ershov, M.A.; Savelenko, V.D.; Makhmudova, A.E.; Rekhletskaya, E.S.; Makhova, U.A.; Kapustin, V.M.; Mukhina, D.Y.; Abdellatief, T.M.M. Technological Potential Analysis and Vacant Technology Forecasting in Properties and Composition of Low-Sulfur Marine Fuel Oil (VLSFO and ULSFO) Bunkered in Key World Ports. J. Mar. Sci. Eng. 2022, 10, 1828. [Google Scholar] [CrossRef]
  38. Sultanbekov, R.; Schipachev, A. Manifestation of Incompatibility of Marine Residual Fuels: A Method for Determining Compatibility, Studying Composition of Fuels and Sediment. J. Min. Inst. 2022, 257, 843–852. [Google Scholar] [CrossRef]
  39. Sultanbekov, R.; Denisov, K.; Zhurkevich, A.; Islamov, S. Reduction of Sulphur in Marine Residual Fuels by Deasphalting to Produce VLSFO. J. Mar. Sci. Eng. 2022, 10, 1765. [Google Scholar] [CrossRef]
  40. Kulkarni, S.J. Transesterification for Biodiesel-a Review. Int. J. Adv. Trends Comput. Sci. Eng. 2019, 8, 46–50. [Google Scholar] [CrossRef]
  41. Deng, X.; Han, J.; Yin, F. Net Energy, CO2 Emission and Land-Based Cost-Benefit Analyses of Jatropha Biodiesel: A Case Study of the Panzhihua Region of Sichuan Province in China. Energies 2012, 5, 2150–2164. [Google Scholar] [CrossRef]
  42. Eremeeva, A.M.; Kondrasheva, N.K.; Khasanov, A.F.; Oleynik, I.L. Environmentally Friendly Diesel Fuel Obtained from Vegetable Raw Materials and Hydrocarbon Crude. Energies 2023, 16, 2121. [Google Scholar] [CrossRef]
  43. Loktionova, E.V.; Sysa, O.K.; Loktionov, V.A. Extraction of Methylene Blue Coloring Agent from Model Solutions with a Plant-Origin Sorbent. J. Phys. Conf. Ser. 2021, 1926, 012018. [Google Scholar] [CrossRef]
  44. Duryagin, V.; Nguyen Van, T.; Onegov, N.; Shamsutdinova, G. Investigation of the Selectivity of the Water Shutoff Technology. Energies 2022, 16, 366. [Google Scholar] [CrossRef]
  45. Petukhova, Y.V.; Kudinova, A.A.; Bobrysheva, N.P.; Osmolowsky, M.G.; Alekseeva, E.V.; Levin, O.V.; Osmolovskaya, O.M. Capping Agents as a Novel Approach to Control VO2 Nanoparticles Morphology in Hydrothermal Process: Mechanism of Morphology Control and Influence on Functional Properties. Mater. Sci. Eng. B 2020, 255, 114519. [Google Scholar] [CrossRef]
  46. Feshchenko, R.Y.; Erokhina, O.O.; Litavrin, I.O.; Ryaboshuk, S.V. Improvement of Oxidation Resistance of Arc Furnace Graphite Electrodes. Chernye Met. 2023, 31–36. [Google Scholar] [CrossRef]
  47. Joshi, J.R.; Bhanderi, K.K.; Patel, J.V. Waste Cooking Oil as a Promising Source for Bio Lubricants- A Review. J. Indian Chem. Soc. 2023, 100, 100820. [Google Scholar] [CrossRef]
  48. Rizwanul Fattah, I.M.; Ong, H.C.; Mahlia, T.M.I.; Mofijur, M.; Silitonga, A.S.; Ashrafur Rahman, S.M.; Ahmad, A. State of the Art of Catalysts for Biodiesel Production. Front. Energy Res. 2020, 8, 101. [Google Scholar] [CrossRef]
  49. Eze, V.C.; Harvey, A.P.; Phan, A.N. Determination of the Kinetics of Biodiesel Saponification in Alcoholic Hydroxide Solutions. Fuel 2015, 140, 724–730. [Google Scholar] [CrossRef]
  50. Athar, M.; Zaidi, S. A Review of the Feedstocks, Catalysts, and Intensification Techniques for Sustainable Biodiesel Production. J. Environ. Chem. Eng. 2020, 8, 104523. [Google Scholar] [CrossRef]
  51. Atadashi, I.M.; Aroua, M.K.; Aziz, A.A. Biodiesel Separation and Purification: A Review. Renew. Energy 2011, 36, 437–443. [Google Scholar] [CrossRef]
  52. Colombo, K.; Ender, L.; Santos, M.M.; Chivanga Barros, A.A. Production of Biodiesel from Soybean Oil and Methanol, Catalyzed by Calcium Oxide in a Recycle Reactor. S Afr. J. Chem. Eng. 2019, 28, 19–25. [Google Scholar] [CrossRef]
  53. Liu, X.; He, H.; Wang, Y.; Zhu, S.; Piao, X. Transesterification of Soybean Oil to Biodiesel Using CaO as a Solid Base Catalyst. Fuel 2008, 87, 216–221. [Google Scholar] [CrossRef]
  54. Gupta, J.; Agarwal, M.; Dalai, A.K. An Overview on the Recent Advancements of Sustainable Heterogeneous Catalysts and Prominent Continuous Reactor for Biodiesel Production. J. Ind. Eng. Chem. 2020, 88, 58–77. [Google Scholar] [CrossRef]
  55. Chueluecha, N.; Kaewchada, A.; Jaree, A. Enhancement of Biodiesel Synthesis Using Co-Solvent in a Packed-Microchannel. J. Ind. Eng. Chem. 2017, 51, 162–171. [Google Scholar] [CrossRef]
  56. Yusuf, B.O.; Oladepo, S.A.; Ganiyu, S.A. Biodiesel Production from Waste Cooking Oil via β-Zeolite-Supported Sulfated Metal Oxide Catalyst Systems. ACS Omega 2023, 8, 23720–23732. [Google Scholar] [CrossRef]
  57. Spetsov, E.A.; Artyushevskiy, D.I.; Konoplin, R.R.; Sizyakov, V.M. Phase Composition of Aluminium Hydroxides and Its Calculation Based on Thermal Analysis Data. Tsvetnye Met. 2023, 37–44. [Google Scholar] [CrossRef]
  58. Monika; Banga, S.; Pathak, V.V. Biodiesel Production from Waste Cooking Oil: A Comprehensive Review on the Application of Heterogenous Catalysts. Energy Nexus 2023, 10, 100209. [Google Scholar] [CrossRef]
  59. Oloyede, C.T.; Jekayinfa, S.O.; Alade, A.O.; Ogunkunle, O.; Otung, N.A.U.; Laseinde, O.T. Exploration of Agricultural Residue Ash as a Solid Green Heterogeneous Base Catalyst for Biodiesel Production. Eng. Rep. 2023, 5, e12585. [Google Scholar] [CrossRef]
  60. Ghosh, N.; Halder, G. Current Progress and Perspective of Heterogeneous Nanocatalytic Transesterification towards Biodiesel Production from Edible and Inedible Feedstock: A Review. Energy Convers Manag. 2022, 270, 116292. [Google Scholar] [CrossRef]
  61. Wancura, J.H.C.; Brondani, M.; dos Santos, M.S.N.; Oro, C.E.D.; Wancura, G.C.; Tres, M.V.; Oliveira, J.V. Demystifying the Enzymatic Biodiesel: How Lipases Are Contributing to Its Technological Advances. Renew. Energy 2023, 216, 119085. [Google Scholar] [CrossRef]
  62. Lebedev, A.B.; Shuiskaya, V.S. Influence of Composition and Cooling Rate of Alumocalcium Slag on Its Crumblability. Izvestiya Ferrous Metall. 2022, 65, 806–813. [Google Scholar] [CrossRef]
  63. Rekhletskaya, E.S.; Ershov, M.A.; Savelenko, V.D.; Makhmudova, A.E.; Kapustin, V.M.; Abdellatief, T.M.M.; Potanin, D.A.; Smirnov, V.A.; Geng, T.; Abdelkareem, M.A.; et al. Unraveling the Superior Role of Characterizing Methyl Ester of Isohexene as an Innovative High-Octane Gasoline Mixing Component. Energy Fuels 2022, 36, 11829–11838. [Google Scholar] [CrossRef]
  64. Akubude, V.C.; Jaiyeoba, K.F.; Oyewusi, T.F.; Abbah, E.C.; Oyedokun, J.A.; Okafor, V.C. Overview on Different Reactors for Biodiesel Production; John Wiley & Sons: Hoboken, NJ, USA, 2021. [Google Scholar]
  65. Díaz, L.; Escalante, D.; Rodríguez, K.E.; Kuzmina, Y.; González, L.A. Response Surface Methodology for Continuous Biodiesel Production from Jatropha Curcas Oil Using Li/Pumice as Catalyst in a Packed-Bed Reactor Assisted with Diethyl Ether as Cosolvent. Chem. Eng. Process. Process Intensif. 2022, 179, 109065. [Google Scholar] [CrossRef]
  66. Sergeev, V.V.; Cheremisina, O.V.; Fedorov, A.T.; Gorbacheva, A.A.; Balandinsky, D.A. Interaction Features of Sodium Oleate and Oxyethylated Phosphoric Acid Esters with the Apatite Surface. ACS Omega 2022, 7, 3016–3023. [Google Scholar] [CrossRef] [PubMed]
  67. Moyo, L.B.; Iyuke, S.E.; Muvhiiwa, R.F.; Simate, G.S.; Hlabangana, N. Application of Response Surface Methodology for Optimization of Biodiesel Production Parameters from Waste Cooking Oil Using a Membrane Reactor. S Afr. J. Chem. Eng. 2021, 35, 1–7. [Google Scholar] [CrossRef]
  68. Lu, P.; Yuan, Z.; Li, L.; Wang, Z.; Luo, W. Biodiesel from Different Oil Using Fixed-Bed and Plug-Flow Reactors. Renew. Energy 2010, 35, 283–287. [Google Scholar] [CrossRef]
  69. Likozar, B.; Pohar, A.; Levec, J. Transesterification of Oil to Biodiesel in a Continuous Tubular Reactor with Static Mixers: Modelling Reaction Kinetics, Mass Transfer, Scale-up and Optimization Considering Fatty Acid Composition. Fuel Process. Technol. 2016, 142, 326–336. [Google Scholar] [CrossRef]
  70. Ali, M.M.; Gheni, S.A.; Ahmed, S.M.R.; Hmood, H.M.; Hassan, A.A.; Mohammed, H.R.; Mohammed, S.T.; Karakullukcu, N.T. Catalytic Production of Biodiesel from Waste Cooking Oil in a Two-Phase Oscillatory Baffled Reactor: Deactivation Kinetics and ANN Modeling Study. Energy Convers. Manag. X 2023, 19, 100383. [Google Scholar] [CrossRef]
  71. Galusnyak, S.C.; Petrescu, L.; Cormos, C.C. Classical vs. Reactive Distillation Technologies for Biodiesel Production: An Environmental Comparison Using LCA Methodology. Renew. Energy 2022, 192, 289–299. [Google Scholar] [CrossRef]
  72. Mondal, B.; Jana, A.K. Optimal Reflux Splitting Reactive Distillation for Algal Biodiesel Production: Waste Heat Recovery through Vapor Recompression and Organic Rankine Cycle. Sep. Purif. Technol. 2022, 292, 121007. [Google Scholar] [CrossRef]
  73. Gaurav, A.; Ng, F.T.T.; Rempel, G.L. A New Green Process for Biodiesel Production from Waste Oils via Catalytic Distillation Using a Solid Acid Catalyst—Modeling, Economic and Environmental Analysis. Green Energy Environ. 2016, 1, 62–74. [Google Scholar] [CrossRef]
  74. Mondal, B.; Rangaiah, G.P.; Jana, A.K. Optimizing Algal Biodiesel Production from a Novel Reactive Distillation Based Unit: Reducing CO2 Emission and Cost. Chem. Eng. Process. Process Intensif. 2022, 176, 108948. [Google Scholar] [CrossRef]
  75. Purwanto, P.; Buchori, L.; Istadi, I. Reaction Rate Law Model and Reaction Mechanism Covering Effect of Plasma Role on the Transesterification of Triglyceride and Methanol to Biodiesel over a Continuous Flow Hybrid Catalytic-Plasma Reactor. Heliyon 2020, 6, e05164. [Google Scholar] [CrossRef]
  76. Sawangkeaw, R.; Bunyakiat, K.; Ngamprasertsith, S. Continuous Production of Biodiesel with Supercritical Methanol: Optimization of a Scale-up Plug Flow Reactor by Response Surface Methodology. Fuel Process. Technol. 2011, 92, 2285–2292. [Google Scholar] [CrossRef]
  77. Madhawan, A.; Arora, A.; Das, J.; Kuila, A.; Sharma, V. Microreactor Technology for Biodiesel Production: A Review. Biomass Convers Biorefin. 2018, 8, 485–496. [Google Scholar] [CrossRef]
  78. Chimezie, E.C.; Wang, Z.; Yu, Y.; Nonso, U.C.; Duan, P.G.; Kapusta, K. Yield Optimization and Fuel Properties Evaluation of the Biodiesel Derived from Avocado Pear Waste. Ind. Crops. Prod. 2023, 191, 115884. [Google Scholar] [CrossRef]
  79. Khelafi, M.; Djaafri, M.; Kalloum, S.; Atelge, M.R.; Abut, S.; Dahbi, A.; Bekirogullari, M.; Atabani, A.E. Effect of Stirring Speeds on Biodiesel Yield Using an Innovative Oscillatory Reactor and Conventional STR (A Comparative Study). Fuel 2022, 325, 124856. [Google Scholar] [CrossRef]
  80. Vellaiyan, S.; Kandasamy, M.; Devarajan, Y. Optimization of Bauhinia Parviflora Biodiesel Production for Higher Yield and Its Compatibility Assessment with Water and Di-Tert-Butyl Peroxide Emulsion. Waste Manag. 2023, 162, 63–71. [Google Scholar] [CrossRef]
  81. Sverchkov, I.P.; Gembitskaya, I.M.; Povarov, V.G.; Chukaeva, M.A. Method of Reference Samples Preparation for X-Ray Fluorescence Analysis. Talanta 2023, 252, 123820. [Google Scholar] [CrossRef]
  82. Kosolapova, S.M.; Smal, M.S.; Rudko, V.A.; Pyagay, I.N. A New Approach for Synthesizing Fatty Acid Esters from Linoleic-Type Vegetable Oil. Processes 2023, 11, 1534. [Google Scholar] [CrossRef]
  83. Moskvina, E.N.; Cornena, E.P.; Zolochevsky, V.T.; Timofeenko, T.I. Metal Composition of Phospholipids of Rapeseed Oils. News Universities. Food Technol. 1990, 76–77. [Google Scholar]
  84. Tarasevich, B.N.; IR Spectra of Main Classes.Reference Materials. Lomonosov Moscow State University; 2012. Available online: https://www.chem.msu.su/rus/teaching/tarasevich/Tarasevich_IR_tables_29-02-2012.pdf (accessed on 10 April 2022).
  85. Harutyunyan, N.S.; Kornena, E.P. Phospholipids of Vegetable Oils; Shcherbakov, V.G., Nechaev, A.P., Eds.; Agropromizdat: Moscow, Russia, 1986; Volume 256. [Google Scholar]
  86. Knerelman, E.I. Comparative Features of the Infrared Spectra C18-Carboxic Acids, Their Methyl Esters (Biodiesel) and Triglycerides (Vegetable Oils). Bull. Kazan Technol. Univ. 2008, 6, 68–78. [Google Scholar]
  87. Sultanova, G.I.; Sayfetdinova, G.A.; Rakhmatullina, A.P.; Akhmedyanova, R.A.; Liakumovich, A.G. Effect of Potassium Salts of Stearic and Oleic Acids on the Emulsion Copolymerization of Styrene and Alpha-Methylstyrene. Bull. Kazan Technol. Univ. 2006, 2, 67–71. [Google Scholar]
  88. Evdokimov, A.N.; Kurzin, A.V.; Sivakov, A.A.; Golikova, V.S. Solubility in Alcohols and Alcoholysis Reactions of Carbonates, Sulfides, Cyanides, and Phosphates of Alkali Metals. ChemChemTech 2018, 61, 14–23. [Google Scholar] [CrossRef]
Figure 1. The figure shows emulsion formation and separation.
Processes 12 00788 g001
Figure 2. The figure shows raw material conversion at different stirring speeds.
Processes 12 00788 g002
Figure 3. The figure shows the precipitate after synthesis.
Processes 12 00788 g003
Figure 4. XRF spectra: (a) rapeseed oil; (b) FAEE reaction mixture before filtration; (c) FAEE reaction mixture after filtration.
Processes 12 00788 g004
Figure 5. FTIR spectra: (a) rapeseed oil; (b) sediment; (c) FAEE after purification.
Processes 12 00788 g005
Figure 6. The figure shows graphs of pH change during carbonization in different media at 20 mL/s.
Processes 12 00788 g006
Figure 7. (a) CO2 consumption in different media; (b) carbonation time dependence on temperature in the FAEE+ethanol system.
Processes 12 00788 g007
Figure 8. (a) Dependence of CO2 consumption on gas flow rates; (b) dependence of carbonation time on gas flow rates.
Processes 12 00788 g008
Figure 9. The figure shows the emulsions after centrifugation and their emulsification index: (a) homogeneous mixture—water, 5.68% K; (b) FAEE phase—water, 0.45% K; (c) glycerol phase—water, 1.36% K.
Processes 12 00788 g009
Figure 10. FTIR spectra: (a) FAEE after purification; (b) water extract; (c) FAEE before purification.
Processes 12 00788 g010
Figure 11. GC FID spectra of FAEE: 1—palmitic acid ethyl ester; 2—linoleic acid ethyl ester; 3—ethyl oleate; 4—stearic acid ethyl ester; 5—arachidic acid ethyl ester.
Processes 12 00788 g011
Table 1. The table shows the characteristics of rapeseed oil.
PropertyResultUnitsMethod
Acid value5.28mg KOH/g OilISO 660-83
Acid content2.57%wtISO 660-83
Moisture0.063%wtISO 662-2019
Table 2. The table shows the fatty acid profile and molar mass of rapeseed oil.
Fatty AcidConventional Designation%molM (FAT), g/mol
Myristic acidC14:00.08723.1
Pentadecanoic acidC15:00.03765.2
7,10-Hexadecadienoic acidC16:20.09795.2
Palmitoleic acidC16:10.41801.2
Palmitic acidC16:07.69807.2
cis-10-Heptadecenoic acidC17:10.11843.3
Margaric acidC17:00.08849.3
Linoleic acidC18:27.60879.3
Oleic acidC18:175.25885.3
Stearic acidC18:03.67891.4
Gondoic acidC20:12.45969.5
Arachidic acidC20:00.97975.5
Erucic acidC22:10.691053.6
Behenic acidC22:00.491059.7
Nervonic acidC24:10.181137.8
Lignoceric acidC24:00.211143.8
Total 100.00884.4
Table 3. The table shows the results of the XRF and FTIR analysis.
Components, %
KPCa
Rapeseed oil0.0070.0510.009
Unfiltered FAEE0.5360.0470.033
Filtered FAEE0.369bdlbdl
Table 4. The table shows the material balance of the synthesis block.
ReactorInput, %wt Output, %wt
OilEthanolTotal
Input
Reaction
Mix
SedimentLosesTotal
Output
PFR28.072.010098.10.11.7100
PMR28.171.910096.00.33.7100
Table 5. The table shows the material balance of the separation block.
ReactorInput, %wtOutput, %wt
Distillation Residue
Total
Input
EthanolFAEE
Phase
Glycerol PhaseLosesTotal OutputFAEE Yield
PFR10058.724.45.711.210086.7
PMR10060.519.810.88.910073.2
Table 6. The table shows the qualitative characteristics of the purified FAEEs.
PropertyResultEN 14214 LimitsUnits
Ester content97.8396.5 min% (mol/mol)
Density, 15 °C877860–900kg/m3
Kinematic viscosity, 40 °C3.93.5–5.0mm2/s
Sulfur contentbdl *10 maxmg/kg
Water content254500 maxmg/kg
Linolenic acid ester contentbdl12 max% (mol/mol)
Group I metals (Na, K)bdl5 maxmg/kg
Group II metals (Ca, Mg)bdl5 maxmg/kg
Phosphorous contentbdl10 maxmg/kg
* bdl—below detection limit.
Disclaimer/Publisher’s Note: The statements, opinions and data contained in all publications are solely those of the individual author(s) and contributor(s) and not of MDPI and/or the editor(s). MDPI and/or the editor(s) disclaim responsibility for any injury to people or property resulting from any ideas, methods, instructions or products referred to in the content.

