Article

Erosion Resistance of Casing with Resin and Metallic Coatings in Liquid–Solid Two-Phase Flow

1
CNPC Tubular Goods Research Institute, Xi’an 710077, China
2
Sichuan Shale Gas Exploration and Development Co., Ltd., Chengdu 610051, China
3
Engineering Technology Research Institute, PetroChina Southwest Oil and Gas Field Branch, Chengdu 610017, China
4
College of New Energy, Xi’an Shiyou University, Xi’an 710065, China
5
Engineering Research Center of Smart Energy and Carbon Neutral in Oil & Gas Field, Xi’an 710065, China
*
Authors to whom correspondence should be addressed.
Processes 2024, 12(4), 790; https://doi.org/10.3390/pr12040790
Submission received: 4 March 2024 / Revised: 4 April 2024 / Accepted: 11 April 2024 / Published: 14 April 2024

Abstract

:
Protective coatings are typically applied to enhance their resistance to corrosion. There is considerable research on the corrosion resistance of coated casings. However, few research studies have focused on the erosion resistance on coated casings. In this work, the erosion resistance of resin- and metallic-coated casings in liquid–solid two-phase fluids were investigated using a self-made erosion facility. The results show that the resin coating tends to peel off the material base in the form of brittle spalling or coating bulge in the high-speed sand-carrying liquid. Both resin and metallic coatings were broken through within 20 min in a liquid–solid two-phase flow environment. Compared to resin coatings, metallic coatings exhibit weaker erosion resistance in similar liquid–solid flow. Through the analysis of experimental results and fitted curves, empirical constants for materials and sand content influencing factors were determined using non-dimensional processing. The erosion prediction model of metallic coatings and resin coatings was established based on the ECRC/Zhang model with the change in flow rate, angle, and sand content. This research contributes to a better understanding of the erosion resistance performance of casings used in oil and gas fields, thereby contributing to potential improvements in their production.

1. Introduction

Erosion, corrosion, and wear are the primary factors leading to equipment failure in the petroleum and marine industries [1,2,3,4]. Factors such as erosion angle [5,6], erosion velocity [7], sand concentration [8,9], particle size [10,11], and sand type [12] are critical influencers of material erosion and wear. The combination of solid particles and fluid forms a liquid–solid two-phase flow, which impacts the surface of components, resulting in local damage. This damage reduces operational efficiency, increases operating costs, accelerates premature component failure, and poses potential safety hazards [13,14,15].
The erosion performance of materials is significantly affected by their surface properties, including factors such as hardness, plasticity, and toughness. Regarding the impact of hardness on erosion rate, it is widely believed that when the hardness ratio of eroding particles to the target material surface exceeds 1.2, the target material experiences a higher erosion rate. Conversely, when the hardness ratio is below 1.2, the erosion rate decreases as the hardness ratio of the particles to the material surface diminishes [16]. At lower erosion angles, the erosion rate of brittle materials is lower than that of ductile materials. Conversely, at higher erosion angles, the erosion rate of brittle materials exceeds that of ductile materials.
In recent years, several research institutions have conducted studies on erosion-resistant coatings to meet various engineering requirements, focusing on performance optimization, mechanism investigation, and test standards. Zhang et al. [17] summarized the impact of particle angle, elbow direction, and elbow angle on the erosion resistance of materials by calculating the spatial distribution of particle collision with the bend pipe. The Air Force Equipment Research Institute and the Beijing Institute of Aeronautical Materials [18] have conducted extensive research on sand and dust environments based on practical applications of equipment. They have proposed that specific test parameters and procedures should be selected according to the actual application environment and technical conditions. This aims to provide a basis for the independent development of military sand and dust environment test equipment in China, thereby enhancing the adaptability and reliability of our military weapons and equipment to environmental conditions.
In the fundamental aspects of preparing and testing erosion-resistant coatings, researchers have investigated the erosion behavior of single-layer, multi-layer, gradient, and composite-treated surface coatings [19]. The ZrN coating, prepared using vacuum cathode arc technology by the Beijing Institute of Aeronautical Materials, demonstrates good erosion resistance at a 45° attack angle [18]. Liu Daoxin et al. [20] utilized ion-assisted arc deposition technology to prepare a ZrN coating and studied its solid particle erosion performance. The results indicated that to achieve good erosion resistance at a 90° erosion angle, it is necessary to increase the rational ratio of bonding strength and toughness in the coating, ensuring excellent resistance to impact fatigue and plastic flow properties. Additionally, both excessively thin and thick coatings are detrimental to erosion resistance, emphasizing the importance of controlling thickness within a reasonable range.
Currently, internal-coated casings have garnered attention due to their outstanding insulation, impermeability, and impact resistance. This paper focuses on conducting erosion tests on coated casings and 125 V materials under the mixed fluid of liquid–solid and gas–solid flow, respectively. Since metallic and resin coating impacts are plastic and brittle materials, respectively, and both materials have relatively good properties, the question of the mechanism of coating spalling can be revealed. The objective is to investigate their erosion rates, select appropriate erosion prediction models, and subsequently predict the erosion rates of coated casings under different conditions. This research holds significant importance for the study of erosion in coated casings.

2. Experimental Process of Liquid–Solid Two-Phase Flow Erosion

2.1. Test Material

In this study, resin and metallic coatings were selected as the test materials. The main chemical components are shown in Table 1 and Table 2.
The erosion test was conducted on a coated casing sample, the original surface of which is shown in Figure 1. The abrasive particles consisted of 80–120 mesh quartz sand particles with a diameter of 0.125–0.18 mm and a density of 2650 kg/m3. Figure 2 illustrates a scanning electron microscope image of the quartz sand particles prior to erosion, which shows the sharp edges of the particles. Typical abrasives have sharpness coefficients ranging from 0.2 to 1.0 (full circle to sharp) and sphericity ranging from 0.5 to 1.0 (highly non-spherical equidistant particles to spherical particles) [21].

2.2. Test Scheme

The erosion test was carried out in a sand-carrying liquid mixed with water and quartz sand. In the experiment, it was assumed that the velocity of sand particles and clear water was equal, that is, the followability of particles and fluid was good. The parameters selected for the experiment are shown in Table 3.

2.3. Test Steps

2.3.1. Specimen Preparation

To prepare the erosion sample, the coated casing was first processed into a rectangular body with a size of 30 mm × 30 mm × 10 mm, and then 360#, 600#, 800#, and 1200# water abrasive paper was used to grind the surface of the sample step by step until the surface was smooth and bright, reaching the standard of the erosion test [22]. Finally, the polished sample was rinsed with anhydrous alcohol, dried, and placed in a drying vessel below 50 °C for over 12 h.

2.3.2. Test Process

The erosion test device utilized a self-made apparatus, with its system structure illustrated in Figure 3. The liquid–solid two-phase flow of quartz sand was prepared by mixing quartz sand particles with distilled water (1:9 ratio). The configured liquid–solid two-phase fluid was poured into the stirred tank, and the sample was installed on the gripper. The distance between the sample and the nozzle was 10.5 mm, and the gripper was immersed in the prepared liquid–solid two-phase fluid. After that, the stirrer was started, and the centrifugal pump was started once the liquid–solid two-phase fluid was evenly stirred. The fluid was then ejected from the nozzle to impact the surface of the sample. The test began once the flow rate stabilized, with the flow rate set at 15 m/s. The total erosion time was 90 min, and the sample was taken out every 10 min to dry and measure its weight. Following this, the sample was reinstalled on the gripper to undergo further erosion until the test concluded after 90 min.

2.4. Test Method

After the completion of the test, the jet velocity v was calculated using the continuity equation:
V = Q ρ A
In the above formula, Q is slurry flow rate, kg/s; ρ is slurry density, kg/m3; A is the nozzle outlet area, m2. The sand carrying rate W is the ratio of the abrasive carried by the slurry to the total added abrasive:
W = m p m a b r a s i v e × 100 %
In the above formula, mp is the mass of abrasive particles carried out with the slurry, kg; m a b r a s i v e is the total mass of abrasive particles added, kg.
E R = m 1 m 2 A s p c · t
In the above formula, ER is erosion rate, g/(m2⋅s); m0 is the mass of the sample before erosion, g; m1 is the mass of the sample after erosion, g; m2 is the mass of the sample after erosion, g; A s p c is the erosion area of the sample, m2; t is the erosion time, s.

3. Test Results and Analysis

After 10 min of erosion, the samples were taken out and observed. Both coatings showed no signs of erosion. However, after 20 min of testing, it was observed that both the metallic coating and the resin coating had peeled off. This indicates that the thinner metallic coating exhibits poor erosion resistance in the liquid–solid two-phase flow environment, emphasizing the need to control the coating thickness within a certain range. The resin coating tended to peel off in the form of plastic deformation and bulge, indicating that improving the bonding strength between the coating and the substrate material is the key process to improve the erosion resistance of the coated casing material.

3.1. Material Hardness Analysis

It can be seen from Table 4 that under the load of 50 gf (0.49 N) and 500 gf (4.9 N), the surface microhardness was measured at five different positions on the top of the surface of 125 V carbon steel, resin coating, and metallic coating, and the average value was recorded. As can be seen from Table 4, the Vickers hardness of the 125 V, resin coating, and metallic coating is about 320–330, 20–25, and 290–300. The hardness of the 125 V material is the highest, and the hardness of the resin coating material is the lowest. Because the coating material is a plastic material, elastic deformation will occur after the diamond is pressed. Therefore, the hardness value of the coating material is only analyzed as a reference value.

3.2. Macro-Topography

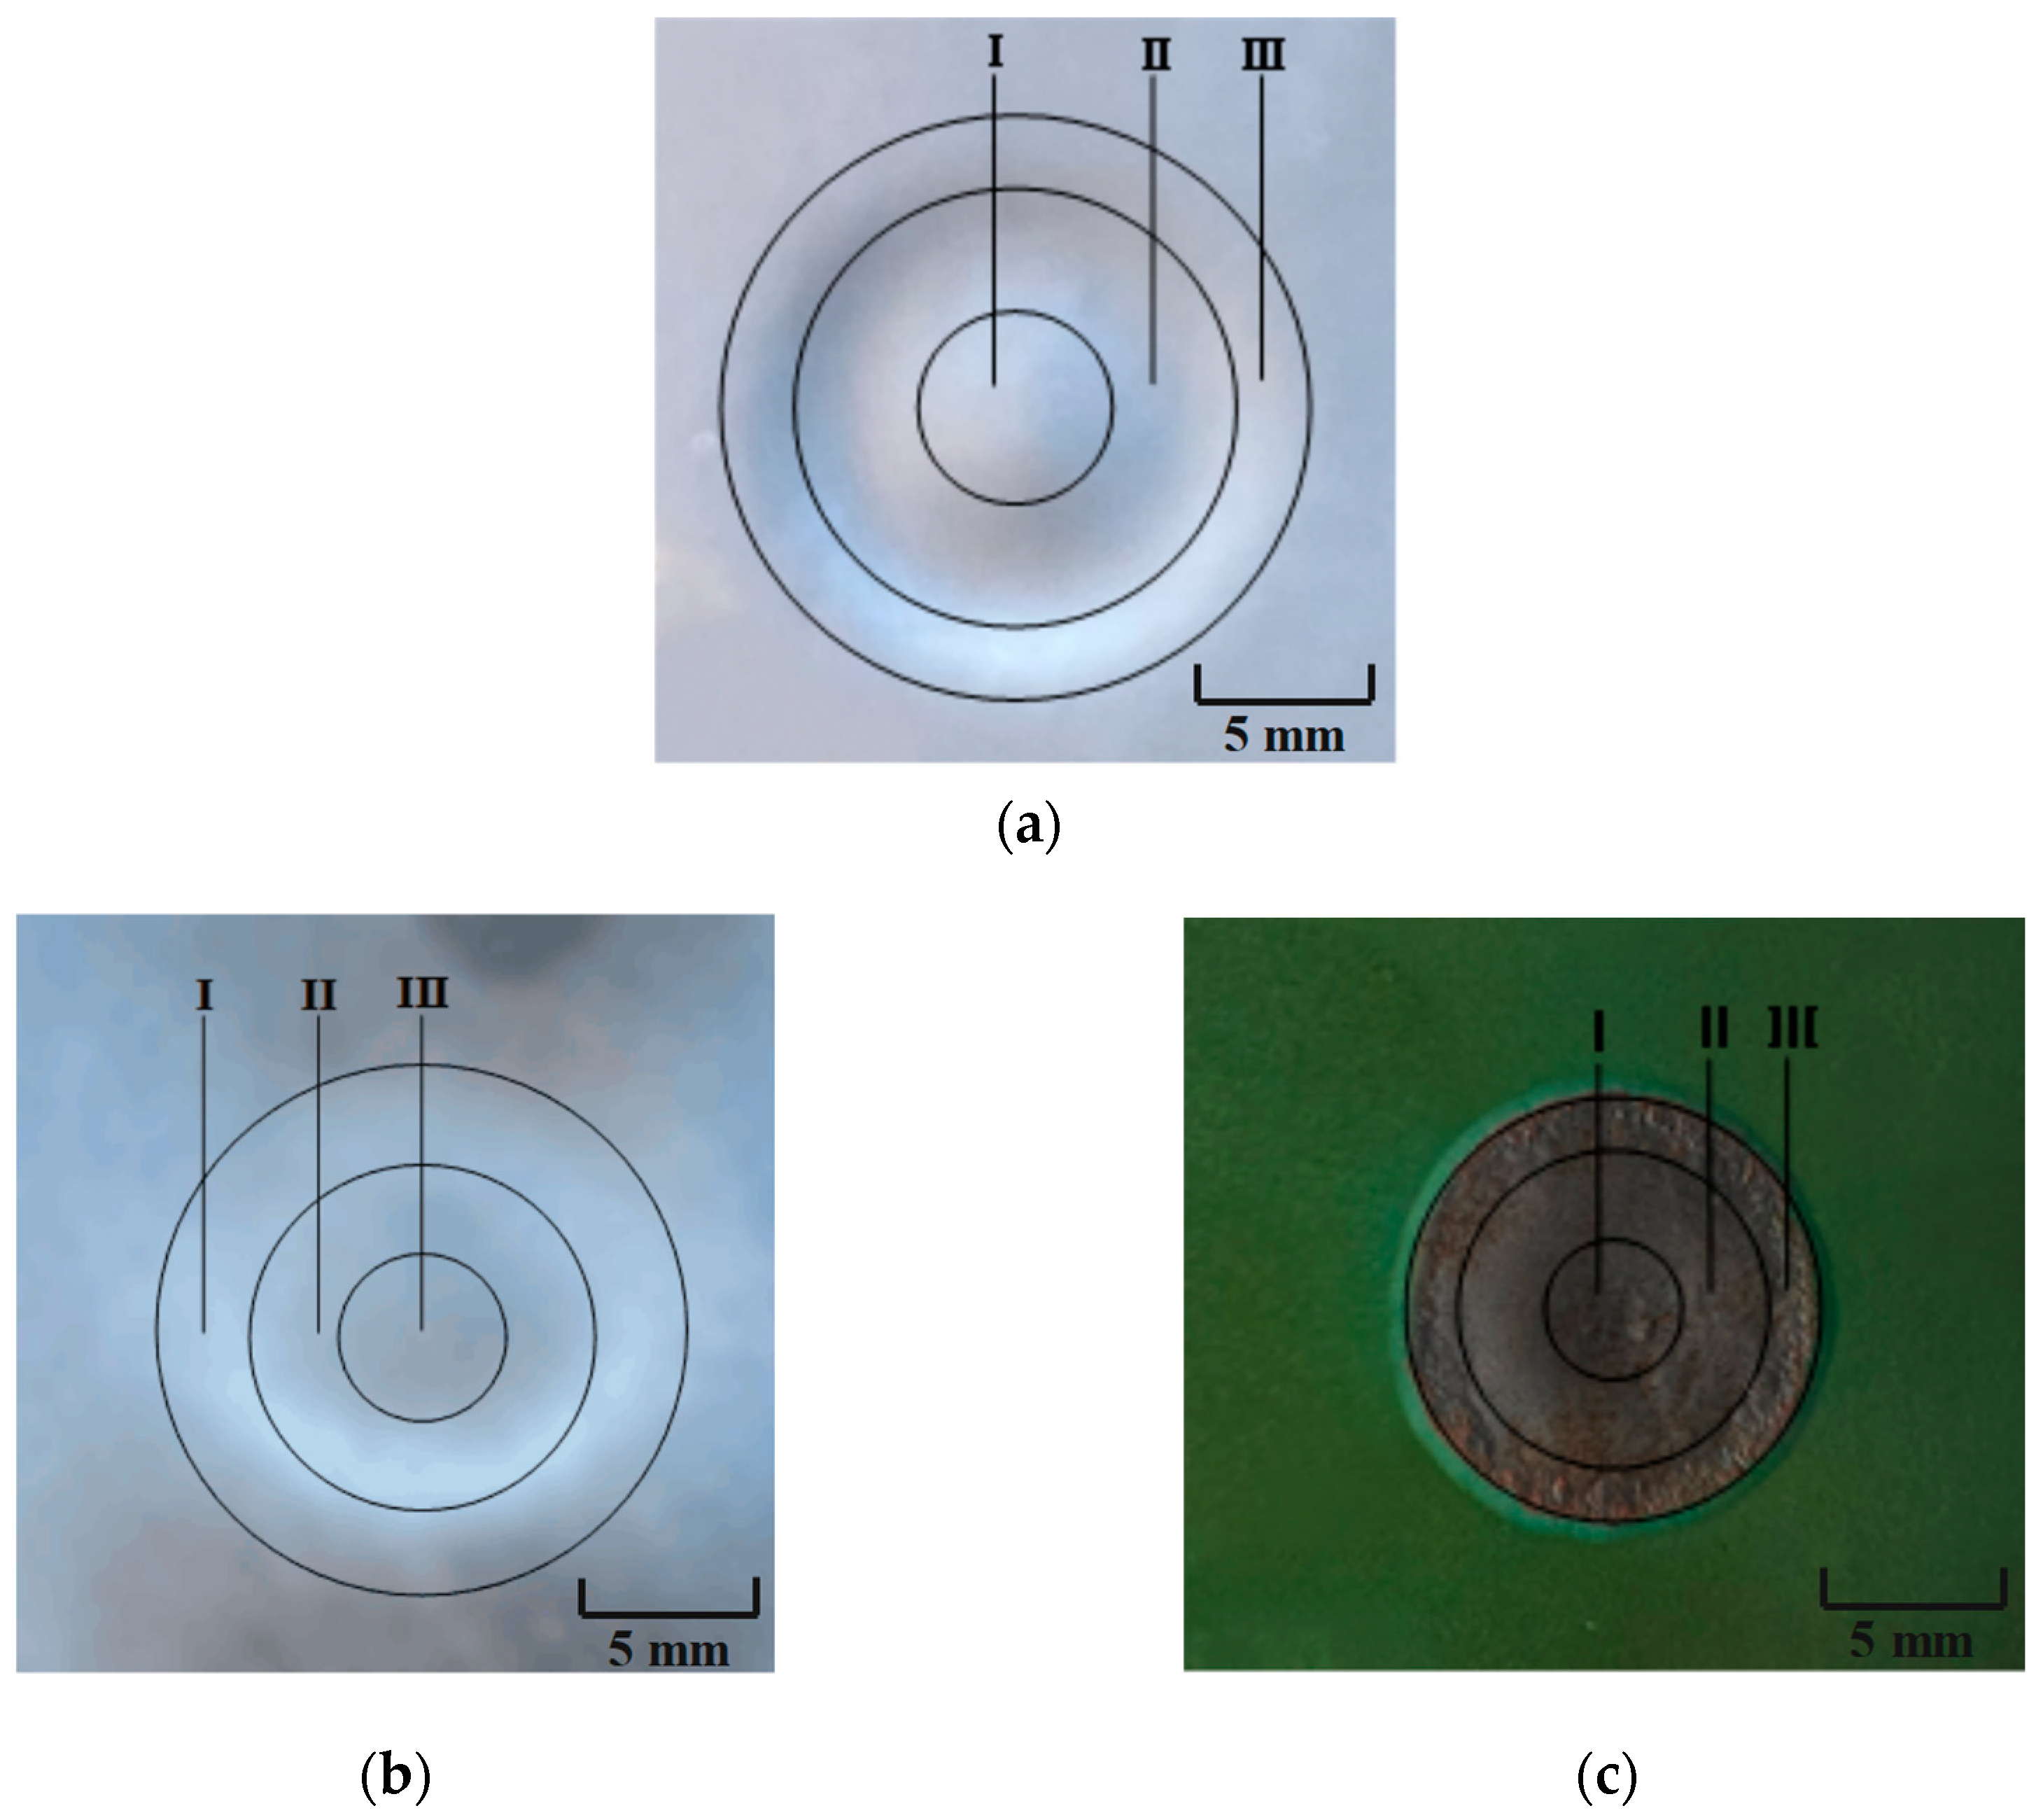
Figure 4 depicts the macroscopic topography of 125 V erosion in liquid–solid two-phase flow over 90 min, as well as the erosion of the resin and metallic coatings in liquid–solid two-phase flow over 20 min. From the figure, it is evident that both the metallic and resin coatings have completely peeled off, indicating that the particles impact the metallic and resin coating target walls at a high angle, nearly 90°, resulting in significant plastic deformation. In the jet erosion stagnation zone I, the sand-carrying fluid shoots the impact material from zone I. Particles collide with zone I due to inertia, and the fluid velocity in zone I is low. Consequently, the erosion of the material surface is minimal under the impact of a low flow rate and a high impact angle.
From the figure, it is evident that under the impact of the sand-carrying fluid, the depth of the pit in zone II is the deepest, indicating more severe erosion compared to zone I. This is due to the influence of high-speed turbulence, causing particles to diffuse from zone I to zone II and accumulate. Zone II experiences a strong ploughing effect as particles in this zone impact the material surface at higher speeds. In addition, due to the high turbulence in this zone, more particles target the material surface at a higher flow rate, reaching their maximum concentration in this zone. Consequently, particles in this zone repetitively and extensively impact the material surface, resulting in significant plastic or brittle deformation. This leads to the maximum depth of the pit and erosion rate in this zone. As the radial position increases, the impact angle of the particles gradually decreases. Therefore, the erosion in zone II is mainly caused by material deformation and ploughing that are caused by the high flow rate and low angle [23,24].
Zone III is situated at the periphery of the jet, where the fluid generates minimal slip, and a large number of particles are concentrated in zone II. Particles impacting zone II randomly enter zone III along the fluid streamlines, where they interact with each other, resulting in minimal micro-cutting. The normal component force of the particles in zone III is very small, and the tangential component force is nearly parallel to the material surface of the material for sliding and rolling, which do not significantly contribute to material erosion. Consequently, the erosion amount in zone III is very small and can be considered negligible.

3.3. Contour Topography

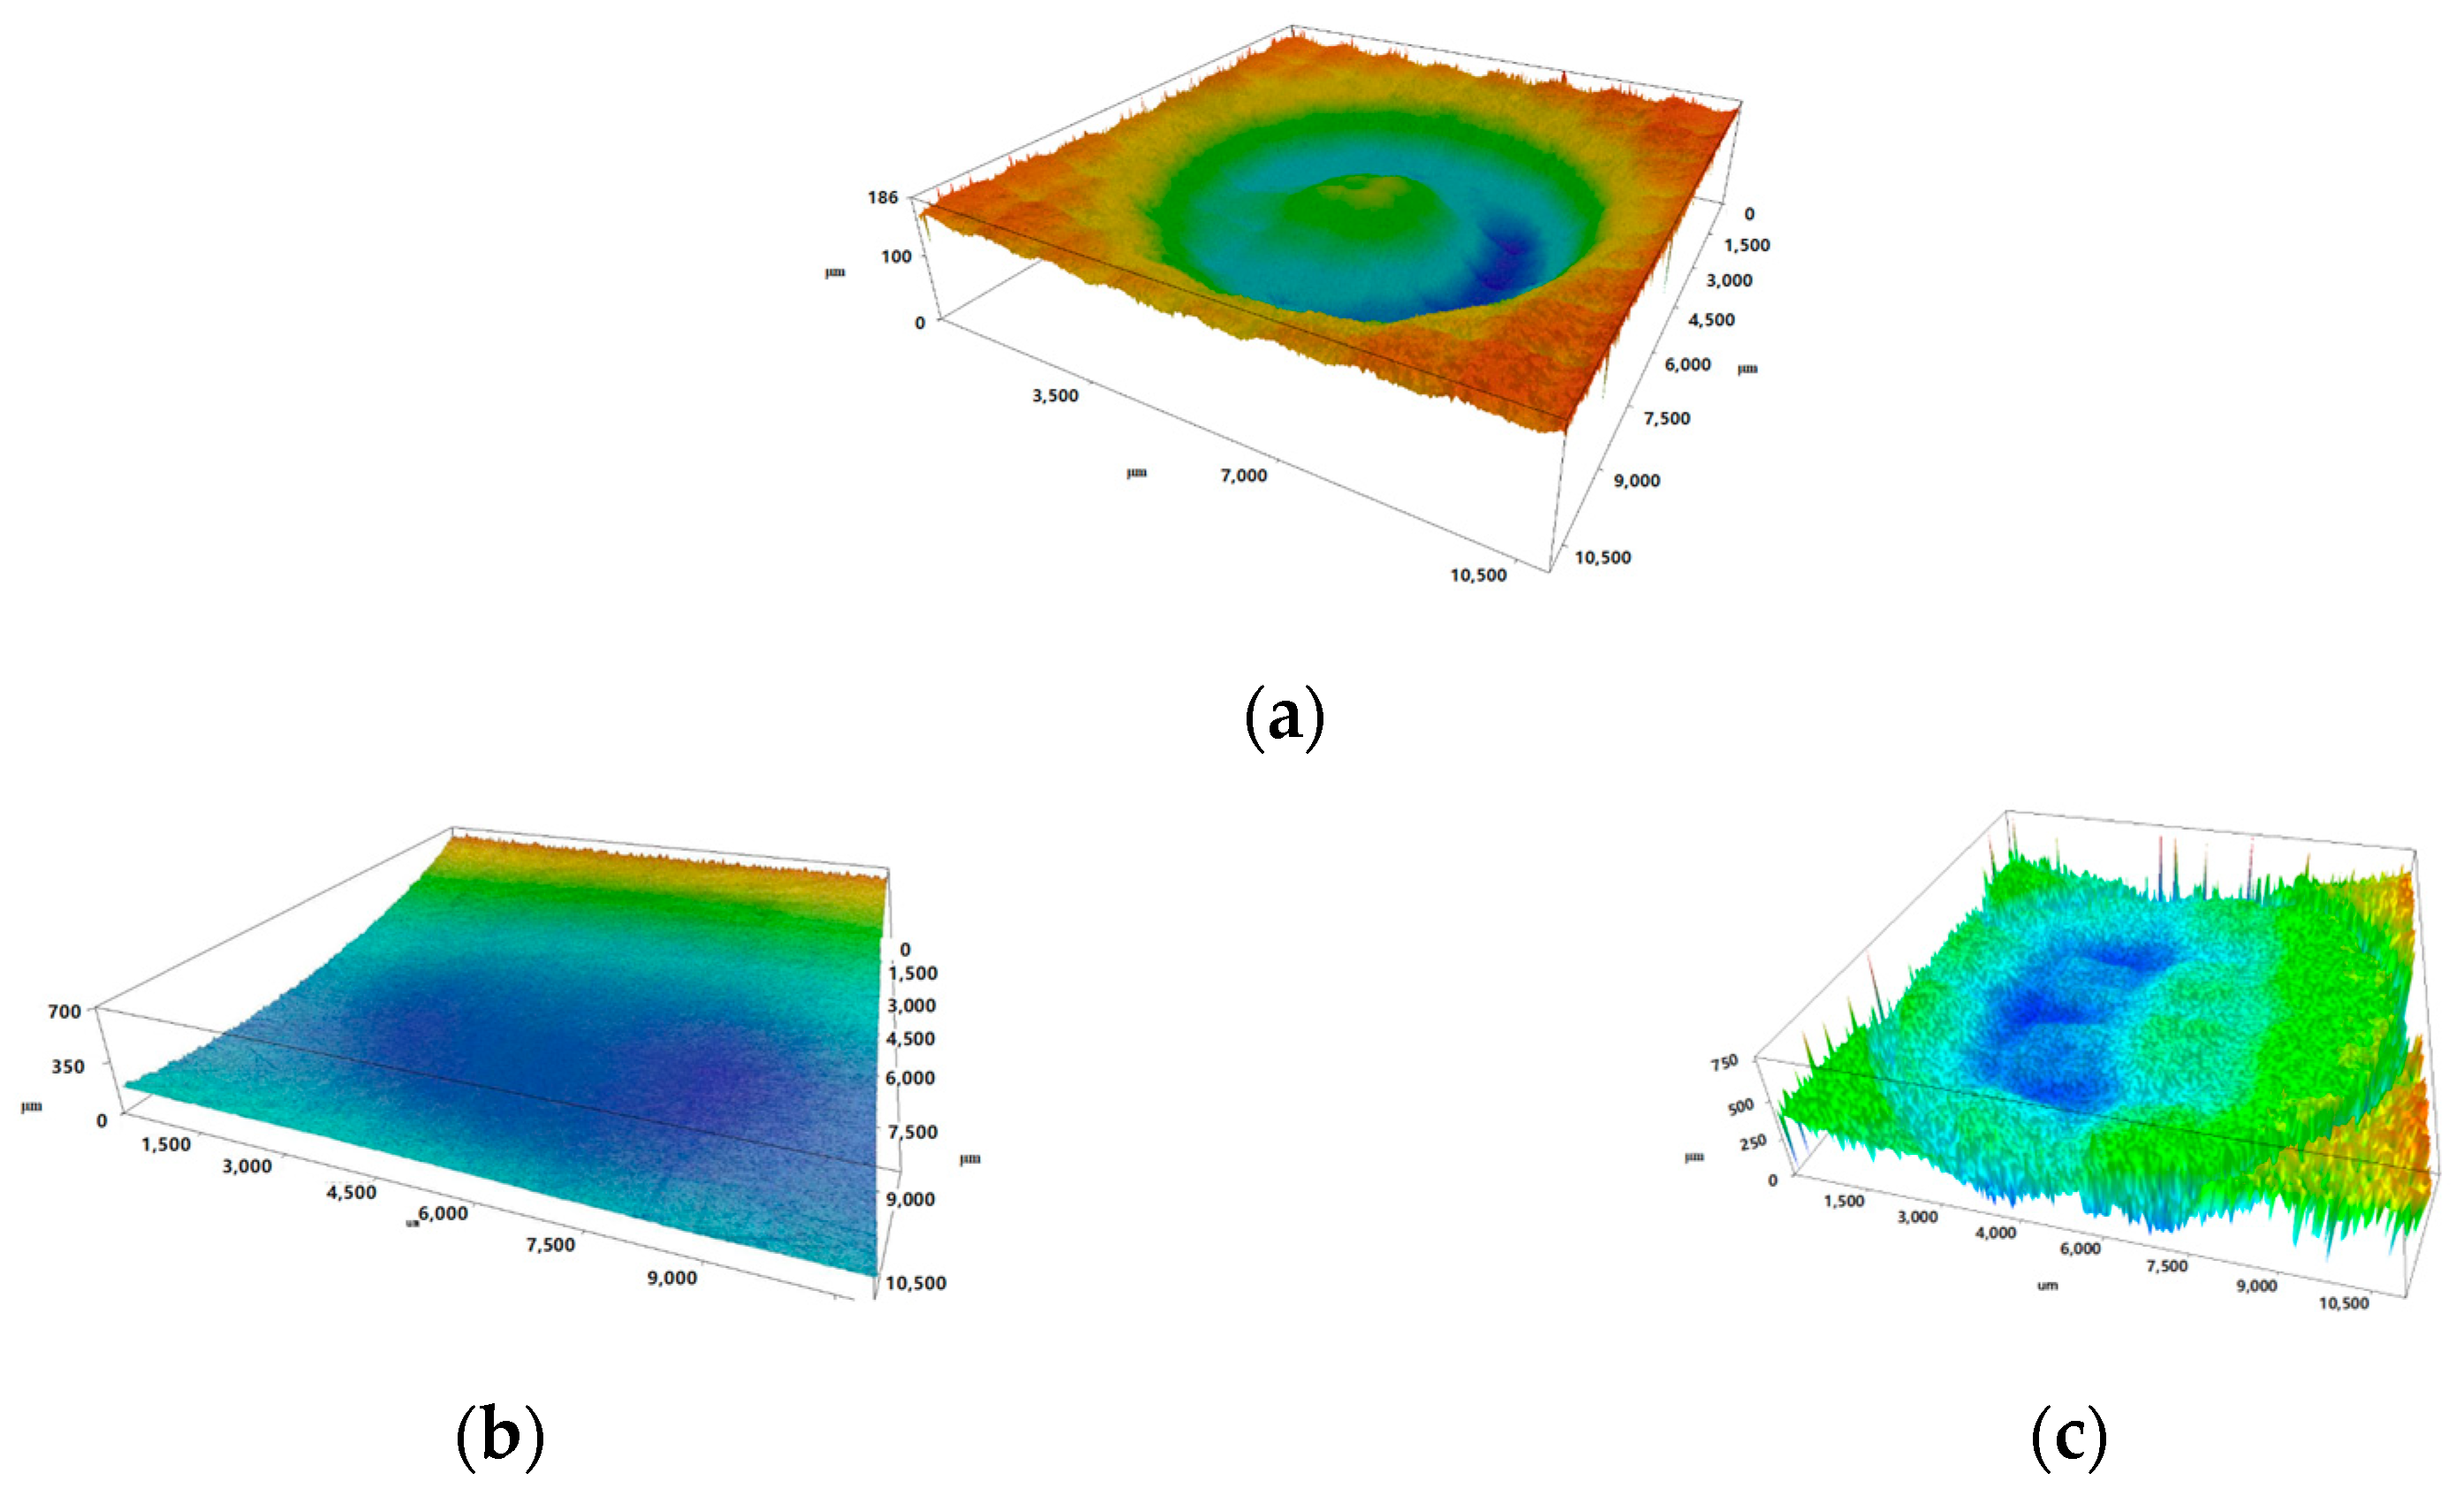
Figure 5 shows the erosion profile scanned by the profile scanner. The ordinate in Figure 5 shows the depth of the eroded specimen, and the horizontal axis is the distance along with the eroded specimen. From the 
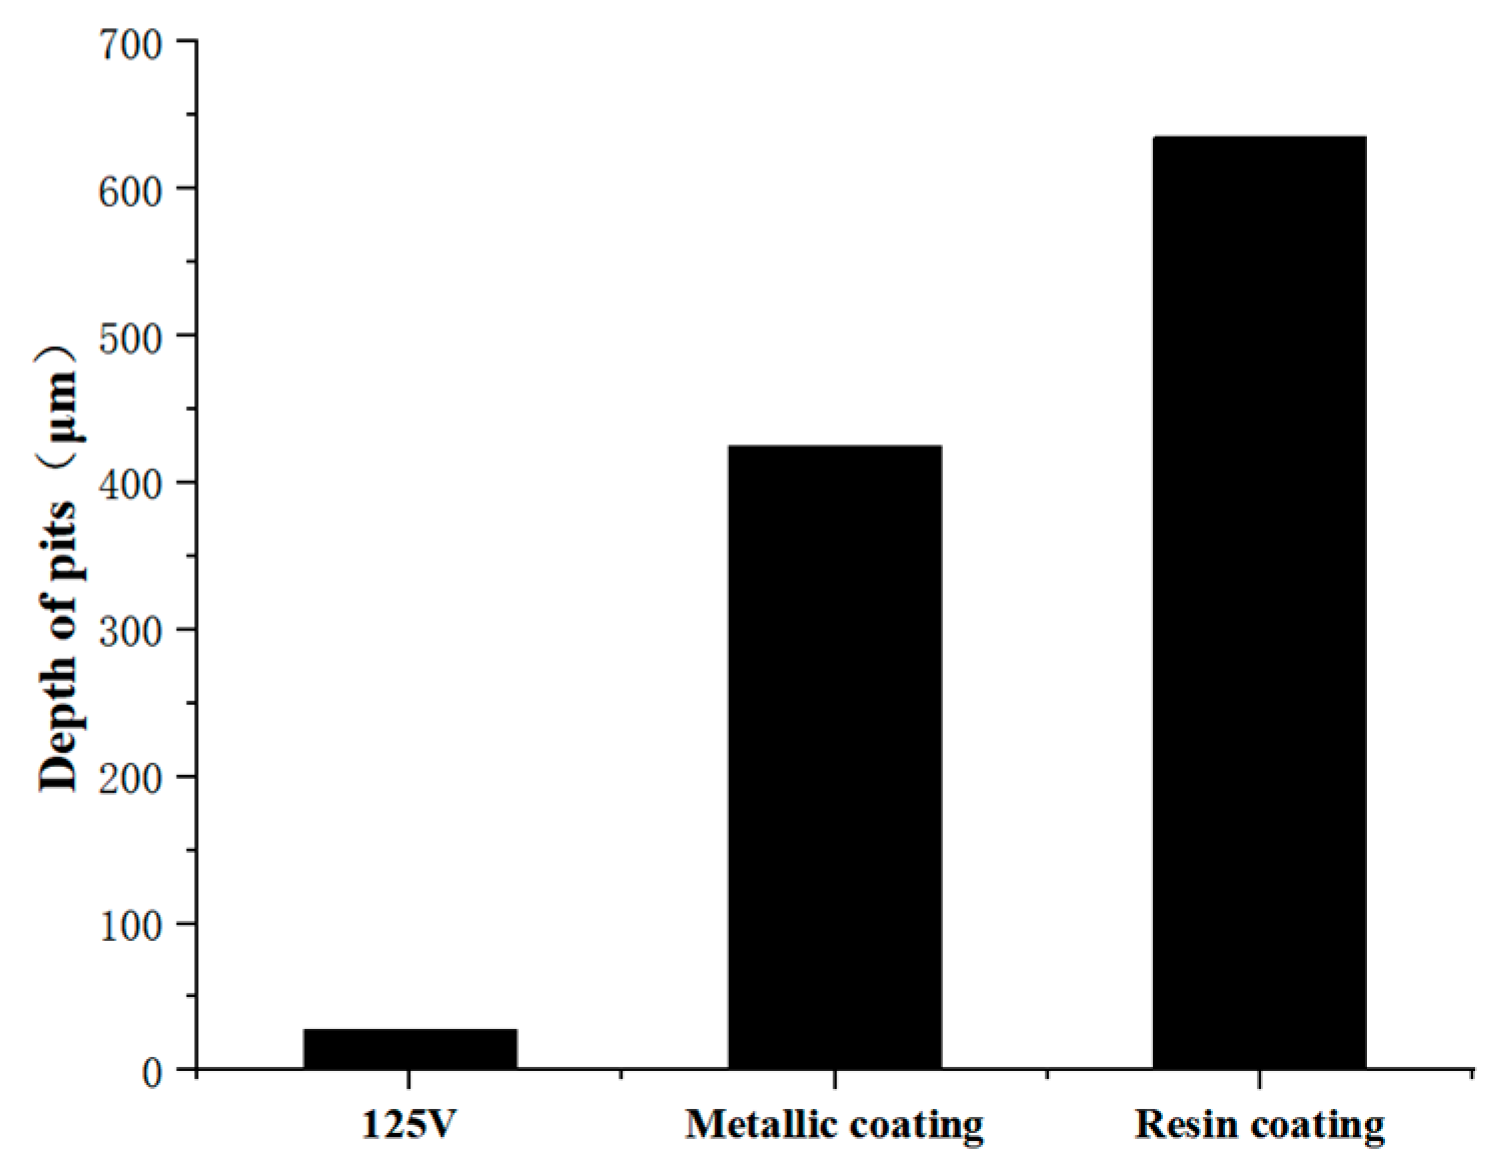
Figure 6, it can be observed that the pit depths of the resin-coated casing and the metallic-coated casing after 20 min are 435 μm and 650 μm, respectively. The erosion time of 125 V is 120 min, and the pit depth can be calculated to be 40 μm within 20 min. Comparing the pit depth of the material at the same time of the liquid–solid erosion test, it can be noted that the hardness of the material has a linear function relationship with the pit depth. The greater the hardness of the material, the smaller the pit depth, and the stronger the erosion resistance. Liu Daoxin’s [14] research has indicated that the erosion resistance of metallic coatings that are either too thick or too thin is not ideal. It is necessary to control the thickness of the coating within a reasonable range to achieve the best erosion resistance. Because the metallic coating is too thin, its erosion resistance decreases. Moreover, the resin coating material does not exhibit signs of peeling at 10 min but completely detaches at 20 min, suggesting that both coatings fall off from the substrate after 20 min.
The analysis of Figure 6 reveals that the single resin coating exhibits weak erosion resistance in the complex liquid–solid two-phase flow. After 10 min of erosion, the coating remains intact and connected with the substrate material. However, after 20 min of testing, both the coating and the substrate material have peeled off. This indicates that improving the bonding strength between the coating and the substrate material is the key process for enhancing the erosion resistance of the coated casing material. Secondly, because the metallic coating is too thin, this results in the poor erosion resistance of the material. Therefore, it is essential to control the coating thickness within a certain range to achieve optimal erosion resistance.

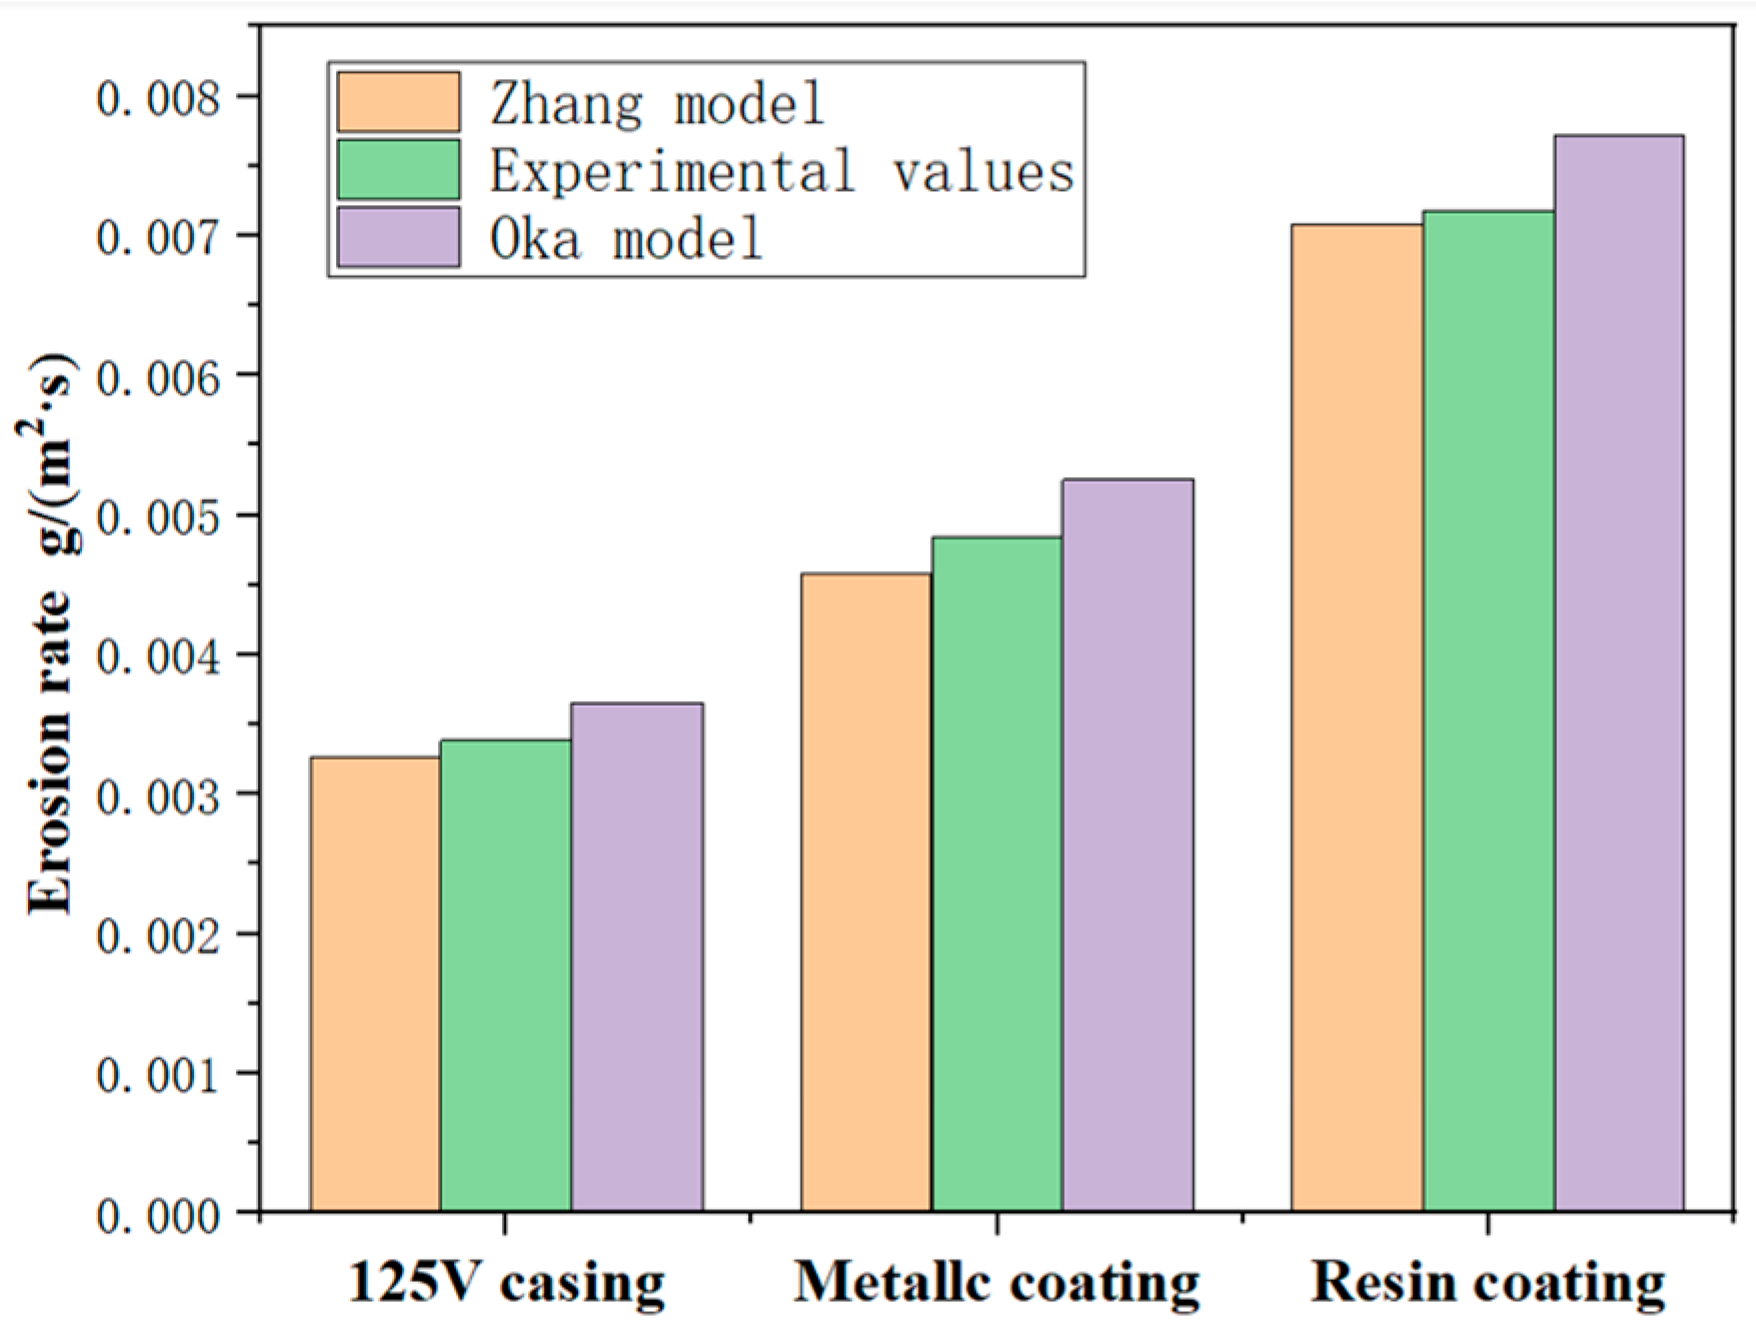
3.4. Erosion Test Results and Analysis

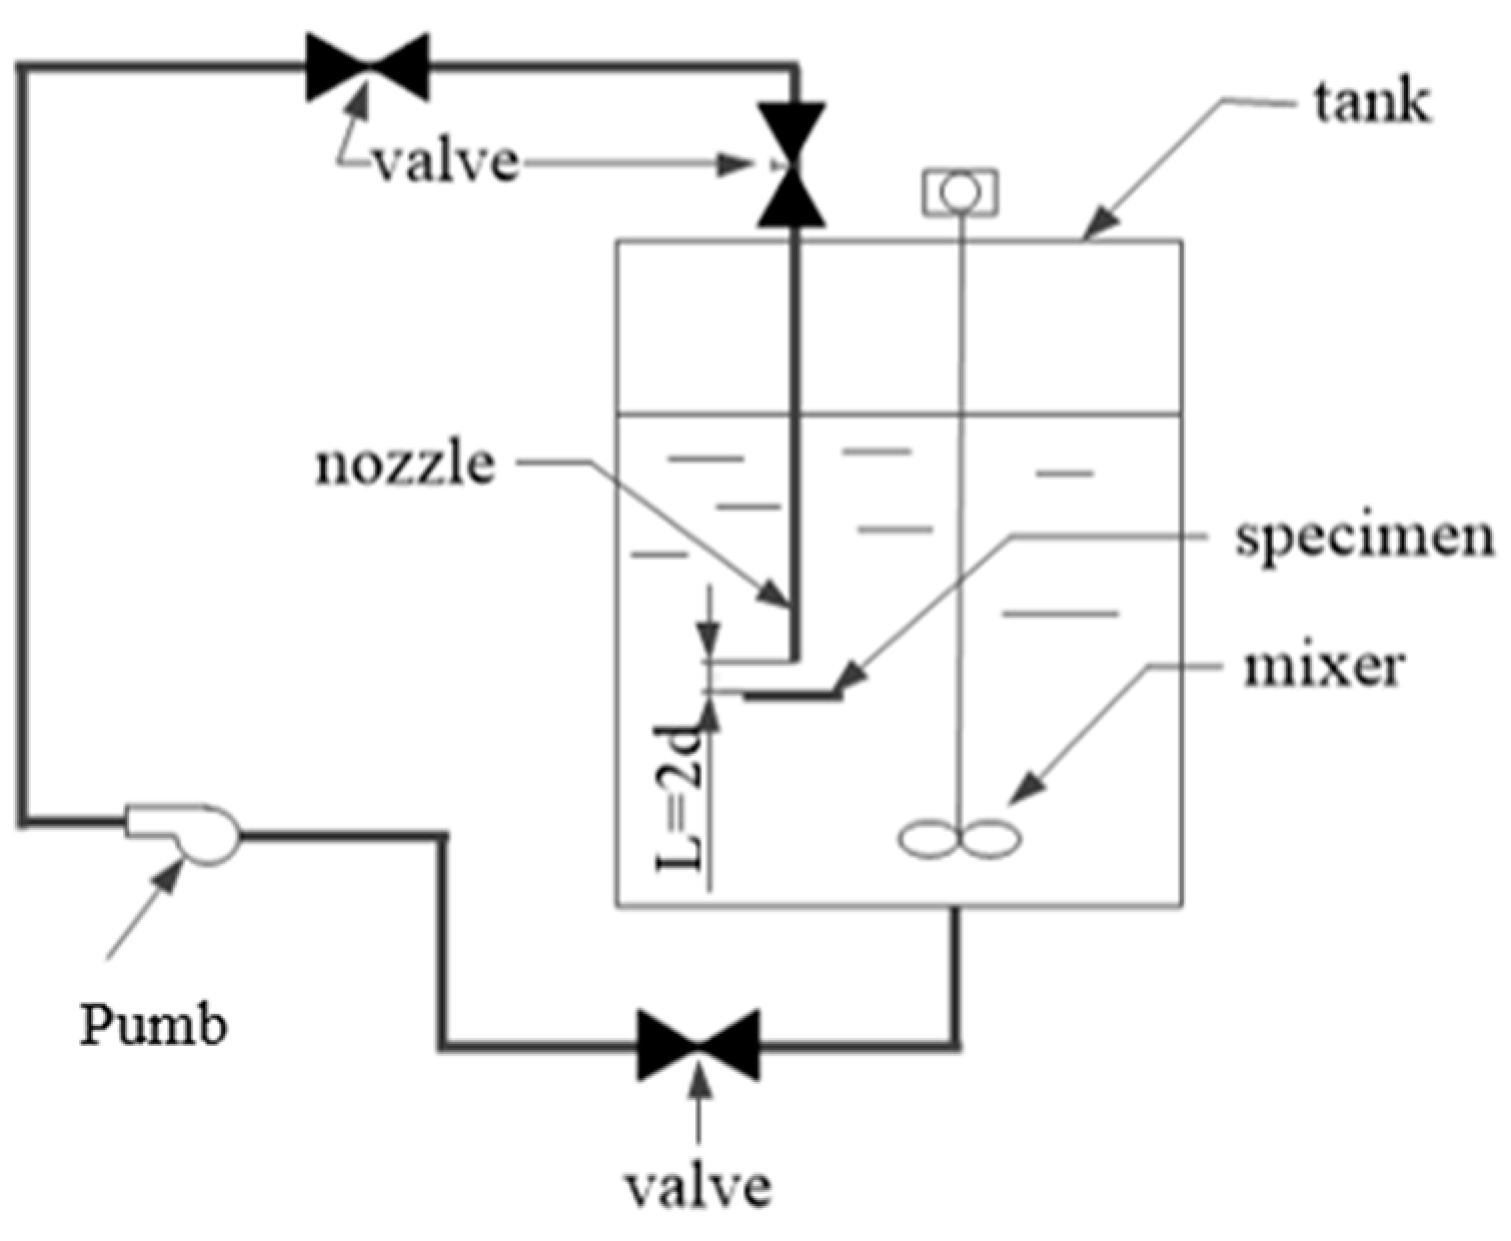
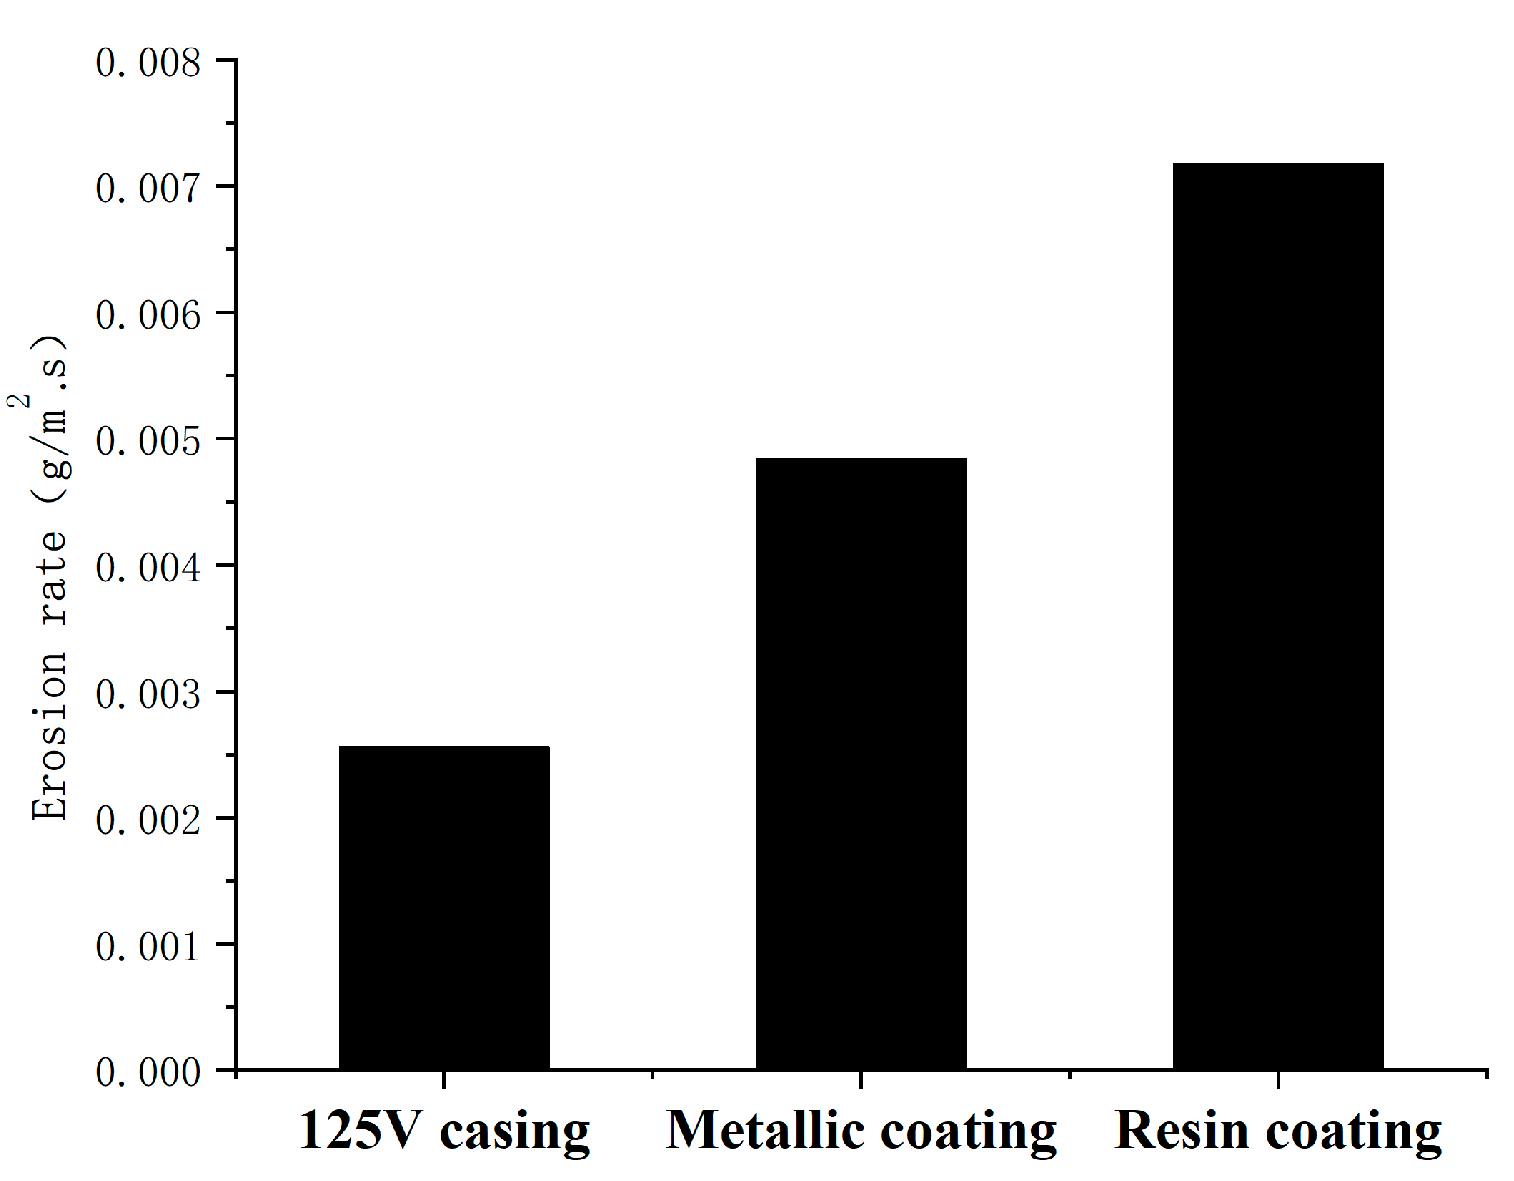
In the liquid–solid erosion test, the nozzle diameter is 7 mm, and the distance between the nozzle and the sample is 10.5 mm. The erosion time of the antibacterial casing and the 125 V sample was set to 1.5 h, and the erosion time of the resin- and metallic-coated casing was 20 min. The average flow rate of the nozzle was 15 m/s, and the sampling test shows that the average sand content of the nozzle was 0.4954%. The erosion test results of the three materials are shown in Figure 7. The erosion rates of 125 V, resin-coated casing, and metallic-coated casing are 0.002564, 0.002511, and 0.007179 g/(m2·s), respectively.
For the resin-coated casing, there is no change observed within the initial 10 min as the coating remains adhered to the metal surface. However, by the 20 min mark, the coating is completely detached, exposing the metal to erosion. It can be inferred that after 20 min of erosion, the expansion and adhesion of the coating diminish, which leads to the coating coming off. Comparing the two coating casing tests, the mass loss of the metallic coating is 1.5 times that of the non-metallic coating casing within 20 min, indicating the weak erosion resistance of the metallic coating under short-term erosion conditions. Because the material is entirely covered with a metallic coating, it can be concluded that the erosion resistance of a single-coated casing is generally low at a 90° angle. In contour scanning, the thickness of the metallic coating is roughly 40 μm, which is thin. Thinner coatings, when subjected to high-speed flows of sand-carrying liquid, typically experience brittle spalling or swelling of the plastic coating, resulting in a thin metallic coating with low hardness that is extremely susceptible to being washed away. Therefore, the erosion resistance of the coating is extremely poor when the thin coating is subjected to sand-carrying erosion in a liquid–solid environment.
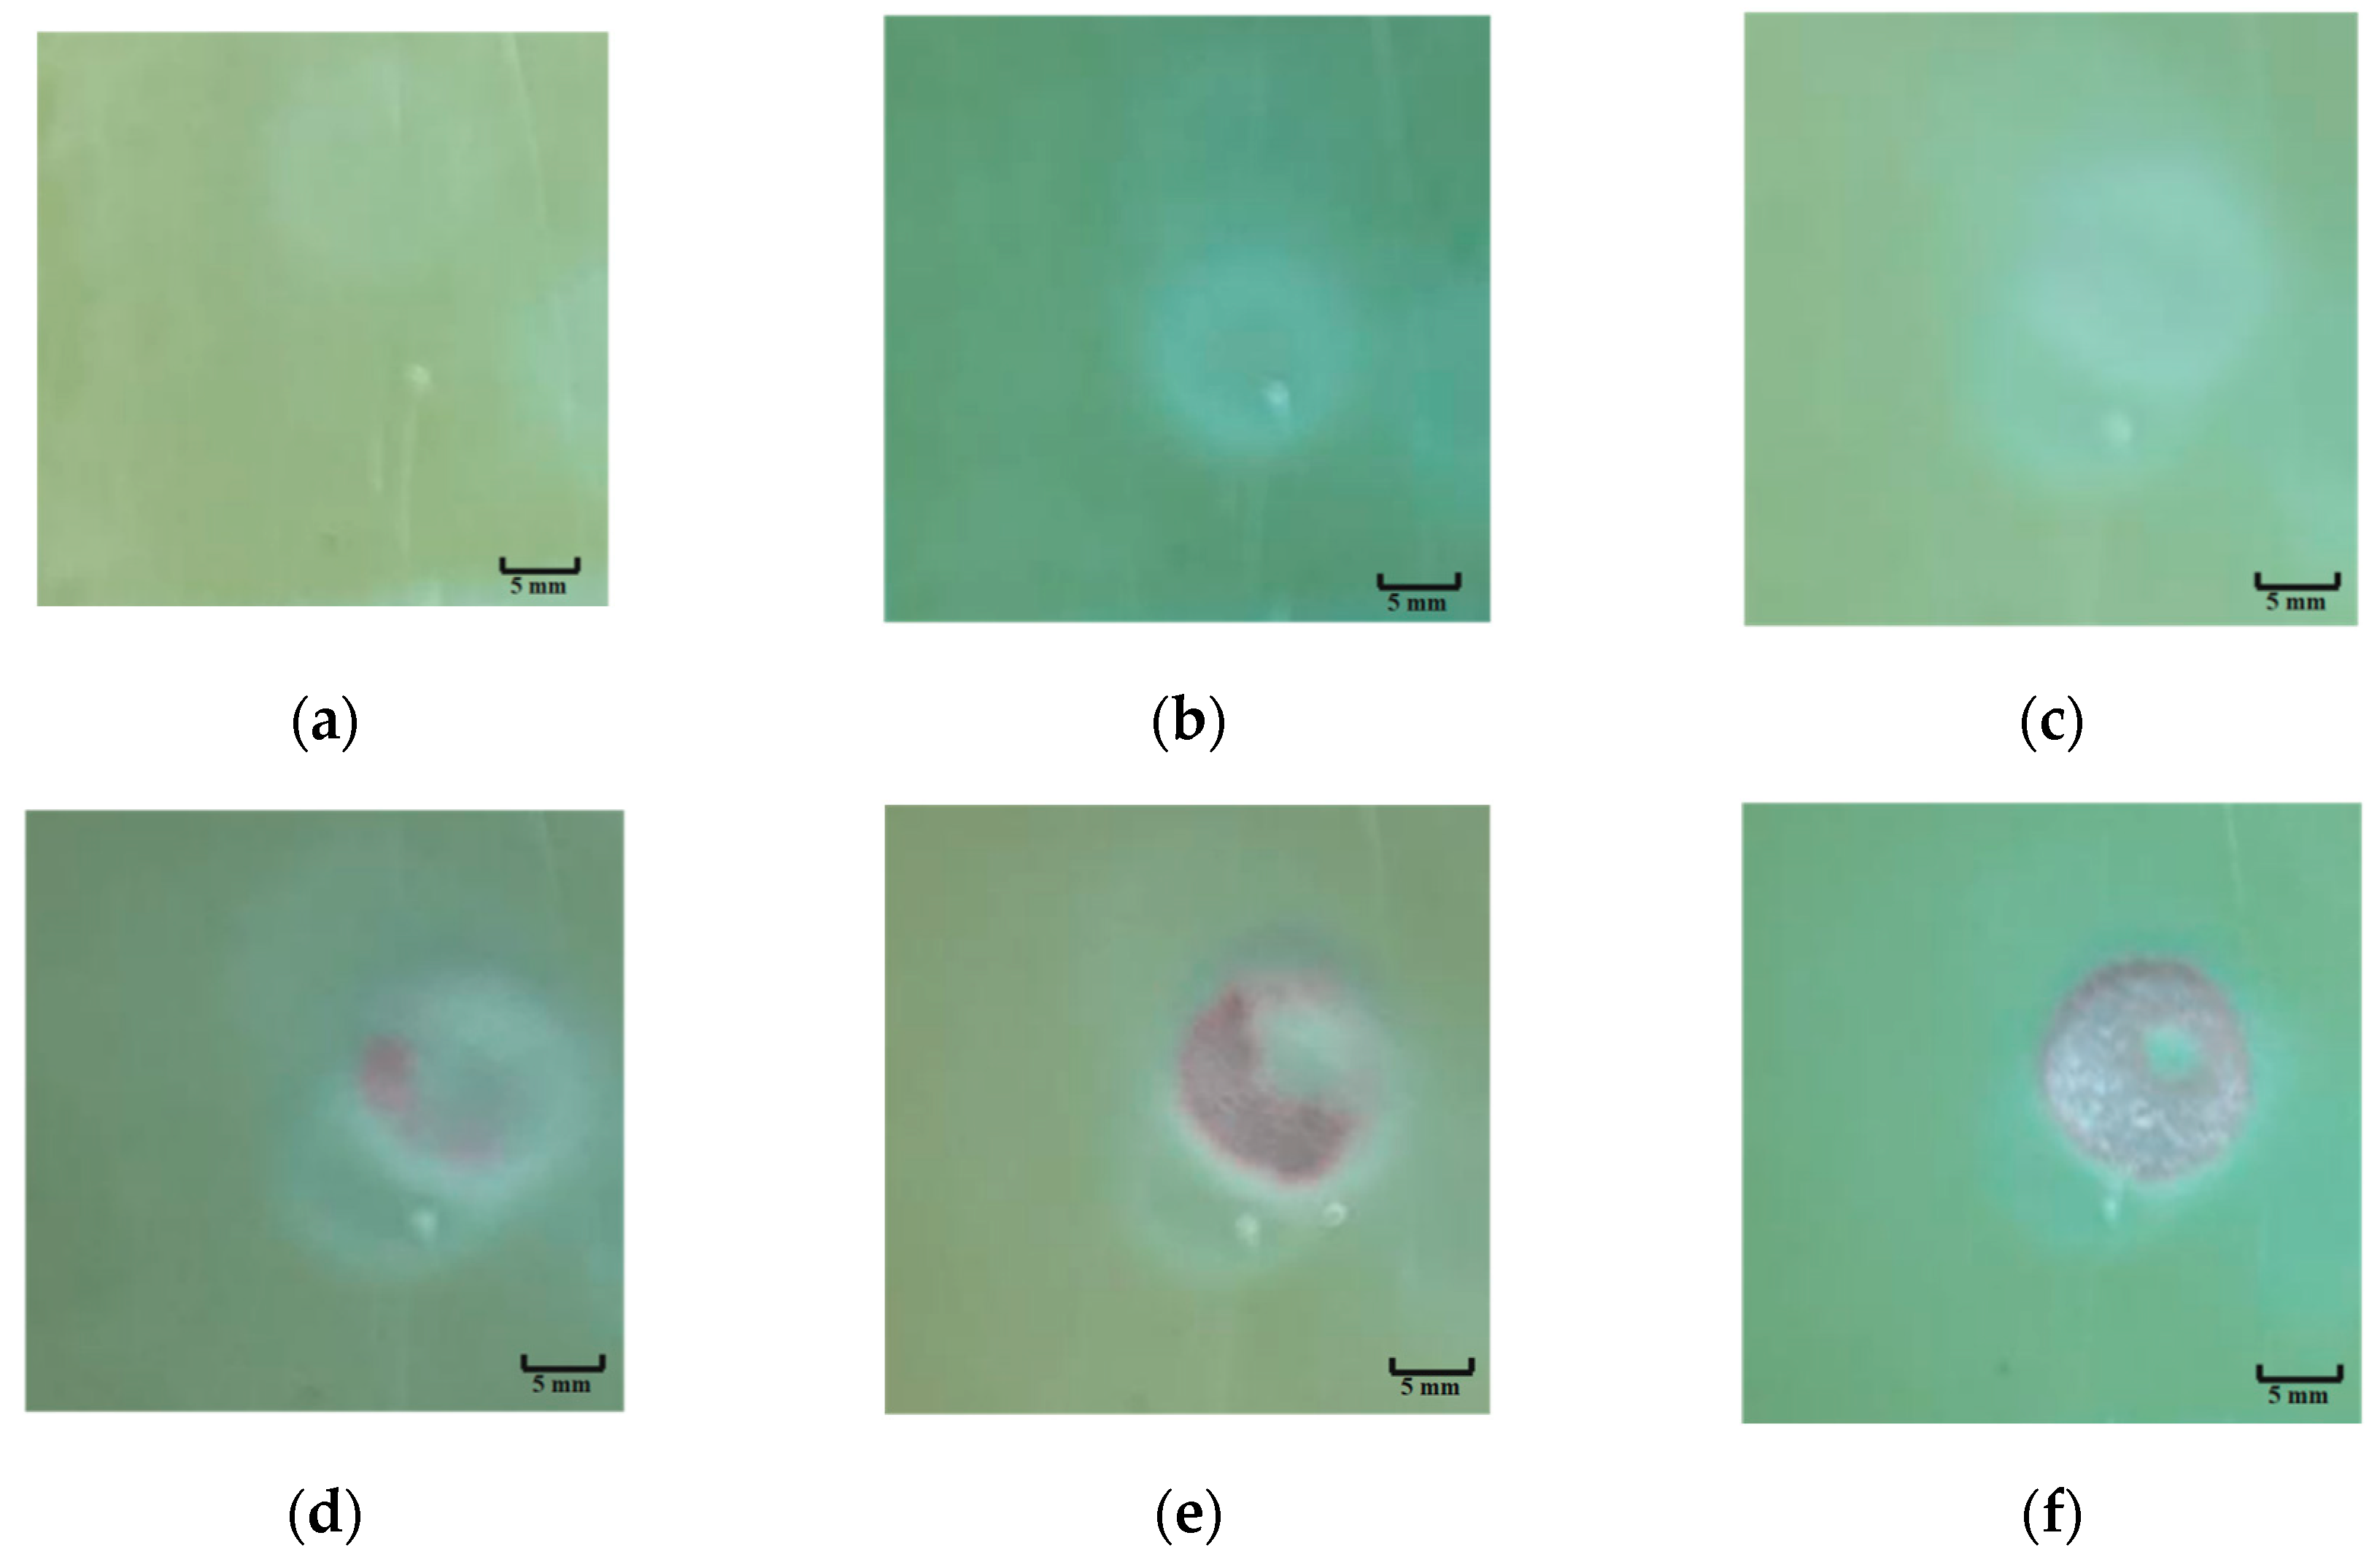
In order to better understand the failure mechanism of the Si resin coating material, the coating material was photographed and recorded at an interval of every 5 min, as shown in Figure 8, which shows the erosion images of the Si resin coating in the liquid–solid two-phase flow environment. Between 0 and 10 min, the circular pit on the surface of the Si resin coating was slightly darkened but not broken, and the material was reduced from the initial mass of 110.1867 g to 110.1827 g; therefore, the erosion rate was relatively low. Between 10 and 25 min, the coating dropped from partially to completely eroded, and the mass decreased from 110.1827 g to 110.1724 g. The erosion rate of the material increased sharply after breakage. In particular, between 15 and 20 min, the loss of material mass was large, and it can be inferred from the figure that after the breakage of the Si resin coating, part of the surface will expand, resulting in a decrease in the viscosity of the material, and then a large area of the coating material will be peeled off from the substrate material in a relatively short period of time.
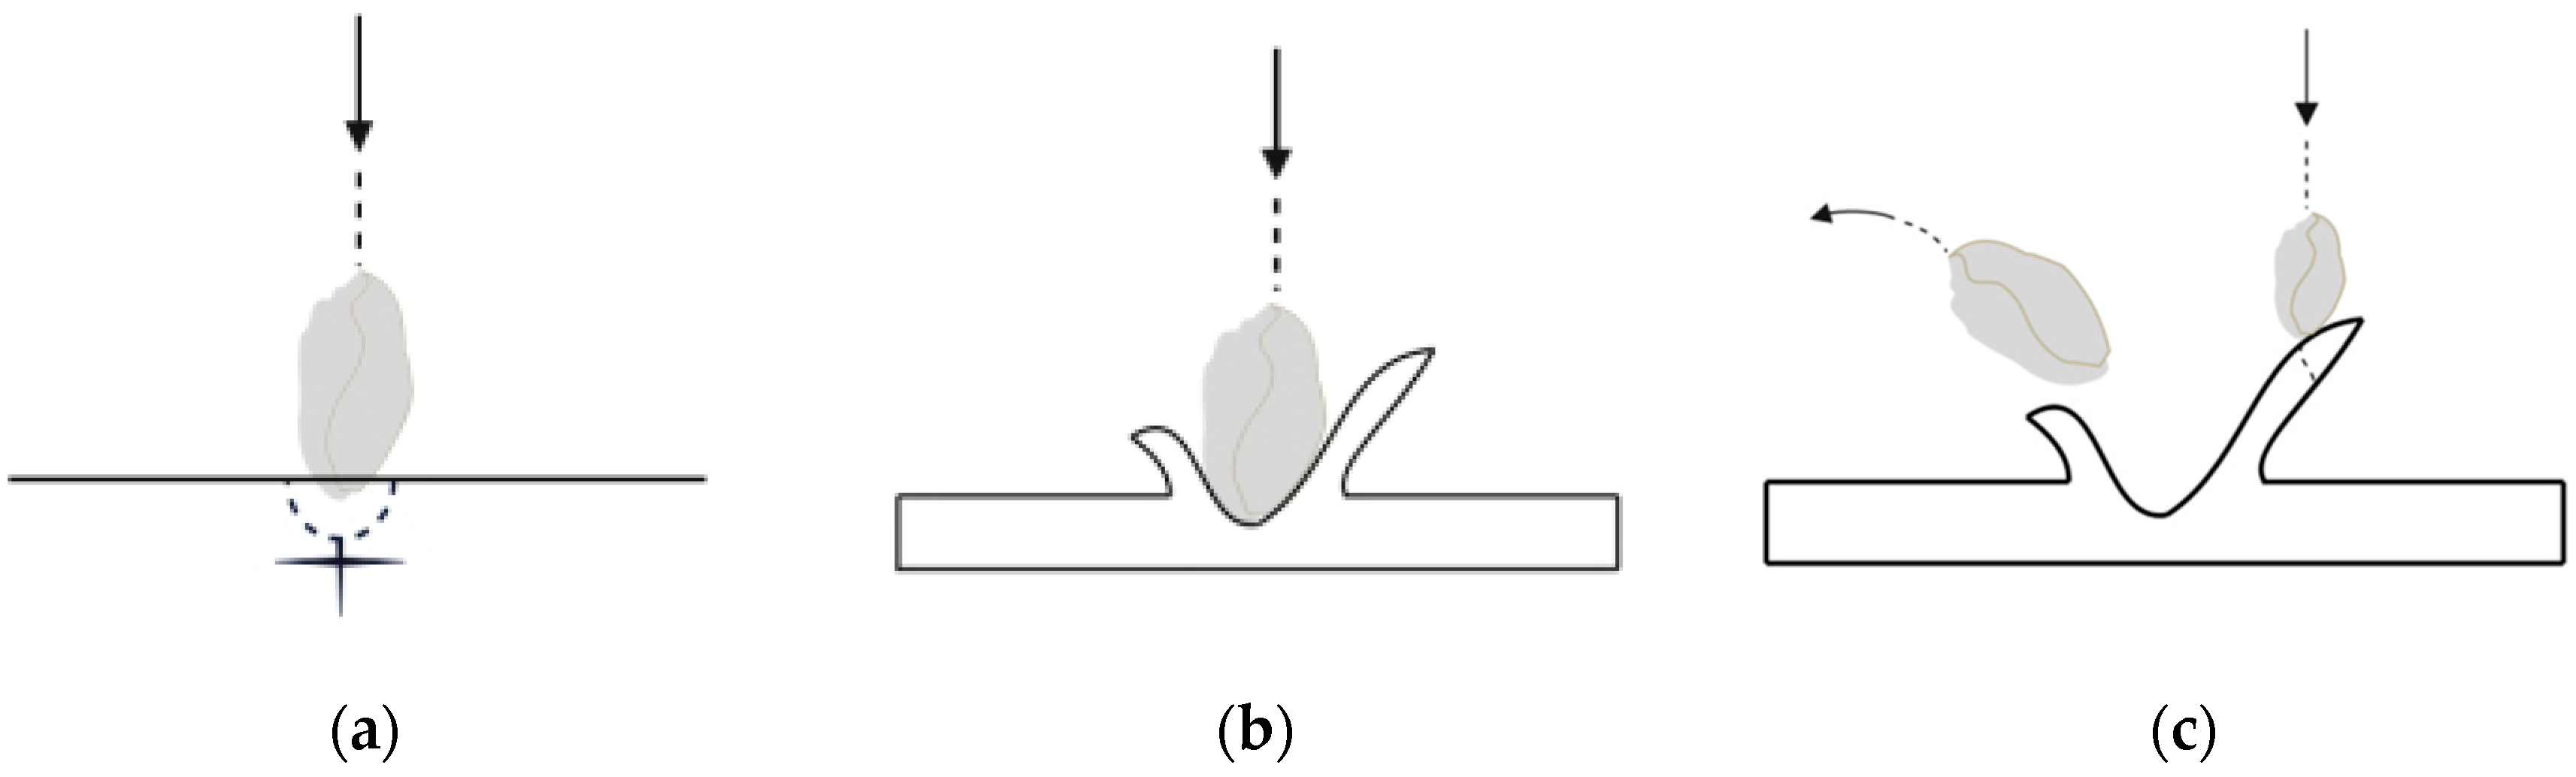
The peeling mechanism of the resin layer is shown in Figure 9. When the particles collide with the metallic coating material, lateral and radial cracks will occur on the surface of the target. As shown in Figure 9a, when the particles are easy to deform and the impact load is low, the surface of the target is prone to short cracks in the circumferential direction. As the impact load increases, the cracks will continue to form and grow, as shown in Figure 9b. If the contact load exceeds the hardness of the target, the particles will invade the target and break violently. When the particles bounce off the target, a plane crack is generated. As shown in Figure 9c, the surface target near the collision point is divided into many fragments by the horizontal and vertical cracks, which are taken away by subsequent particle collisions.
The damage to the resin-coated material is mainly caused by the impact of the particles. When the material is impacted by particles, plastic deformation will occur, which makes the elastic deformation energy of the coating itself increase sharply. When the elastic deformation of the coating material reaches a certain extent, the stress of the resin coating exceeds the fracture limit and cutting will occur. If the stress is lower than the fracture limit and higher than the plastic limit, the material will undergo plastic deformation, and finally cracks will cause the material to be damaged.

4. Erosion Numerical Simulation Method

4.1. Establishment of Casing Erosion Prediction Model

Common erosion models include the Oka model, E/CRC Zhang model, DNV model, and so on. It is important to find a new model that is more appropriate to the experimental values for comparison. These models are mostly used to explore the influence of parameters on particles (shape, density, velocity, particle size) and samples (hardness, density). The ECR/C Zhang model is widely used as a simple and more accurate empirical prediction model of erosion rate. Based on the E/CRC Zhang model, a sand content correction function f(w) is added to propose an empirical model of erosion rate for coated casings in the oil and gas field fracturing and production process. Its expression is:
E R = C B H 0.59 F s V P 2.41 F θ F w
F θ = 5.4 θ 10.11 θ 2 + 10.93 θ 3 6.33 θ 4 + 1.42 θ 5
F ω = A + B ω + C ω 2 + D ω 4
In the above formula, ER is the erosion rate, kg/kg, which represents the mass of the sample washed off per kilogram of sand; BH is the Brinell hardness of the target; Fs is the particle shape coefficient, in which the corner sand Fs = 1.0, hemispherical particles Fs = 0.53, spherical particles Fs = 0.2; vp is the particle velocity, m/s; θ is the impact angle of abrasive particles; C is an empirical constant; and w is the mass percentage of sand content, %. The hardness BH values of the four casings of this project are shown in Table 5. The coefficients in the sand content correction function are fitted by the least square method according to the numerical simulation results. The values are shown in Table 6, and Table 7 provides the values of the empirical constant C.

4.2. Model Error Analysis

On the basis of the ECR/C Zhang model, the correction factor of the sand content is considered. The latest fitting formula using the least squares method is used to comprehensively consider the influence of the material hardness, impact angle, and fluid velocity (which can be considered as particle velocity) on sand content. The erosion rate plots for both models are shown in Figure 10, and the error can be calculated using Equation (7). The average error between the predicted erosion rate and the experimental results is 4.6%, which is lower than the average error of 8.40% of the Oka model. This demonstrates that the modified ECR/C Zhang model can more accurately predict the erosion rate of the four casing materials. Furthermore, the model’s input parameters are relatively simple and thus more suitable for practical application in oil field engineering. Table 8 shows the results of four kinds of material error analysis.
i n a c c u r a c i e s = M o d e l e d   e r o s i o n   r a t e E x p e r i m e n t a l   e r o s i o n   r a t e E x p e r i m e n t a l   e r o s i o n   r a t e

5. Conclusions

(1)
The erosion resistance of the two coated casings, as determined by the experimental study, is low. According to the results of the jet erosion test, 125 V exhibits strong resistance to erosion in both the liquid–solid and gas–solid erosion environments. However, the erosion rate of the coated casings in the liquid–solid environment is high, indicating weak erosion resistance. In comparison with non-metallic coatings, metallic coatings are easier to peel off in a short time under the liquid–solid two-phase flow environment.
(2)
In addition to the characteristics of solid particles, flow rate, sand content, and target hardness are the primary controlling factors affecting erosion. As the flow velocity increases, the erosion rate of all three casing materials sharply increases. Similarly, as the sand content increases, the erosion rate of all three casing materials also increases. However, this increasing trend is less significant compared to the influence of flow rate. When comparing the three materials, an increase in hardness results in a decreasing trend in erosion rate.
(3)
Based on the relatively simple ECRC Zhang model, a sand content correction is added. Therefore, an erosion prediction model which is more suitable for oil and gas field fracturing and production engineering is proposed. The model prediction results are closer to the test values than those of the Oka model.

Author Contributions

Conceptualization, L.Z. (Lixia Zhu) and Z.W.; Methodology, J.L., C.H., L.Z. (Lang Zhou), L.L. and Y.L. All authors have read and agreed to the published version of the manuscript.

Funding

This work was supported by the Key Research and Development Program of Shaanxi (No. 2023KXJ–172). The authors wish to acknowledge the fund of Basic Research and Strategic Reserve Technology Research of China National Petroleum Corporation (2023DQ03-13) and the Research on Risk Assessment and Control Technology of Gas Storage Wells and Surface Facilities in Petrochina Company Limited Project (2023YQX106-4).

Data Availability Statement

Data are contained within the article.

Conflicts of Interest

Author Chencheng Huang was employed by the Sichuan Shale Gas Exploration and Development Co., Ltd. Author Lang Zhou was employed by the Engineering Technology Research Institute, PetroChina Southwest Oil and Gas Field Branch. The remaining authors declare that the research was conducted in the absence of any commercial or financial relationships that could be construed as a potential conflict of interest.

References

  1. Zhuo, R.; Ma, X.; Li, J.; Ren, L.; Cheng, N.; Ma, J.; Zhang, S. Effect of Limited Entry Fracturing for Horizontal Wells on Perforation Erosion. Drill. Prod. Technol. 2023, 46, 77–82. [Google Scholar]
  2. Fowler, S.H.; Lindsay, S.; Smith, R. Coiled-Tubing Technologies Improve Shale-Play Development Efficiencies. In Proceedings of the SPE Offshore Europe Oil and Gas Conference and Exhibition, Aberdeen, UK, 6–8 September 2011. [Google Scholar]
  3. Finnie, I.; Stevick, G.R.; Ridgely, J.R. The influence of impingement angle on the erosion of ductile metals by angular abrasive particles. Wear 1992, 152, 91–98. [Google Scholar] [CrossRef]
  4. Wangz, G.; Dou, Y.; Luo, J. Experimental study on influence of impact angle and jet velocity on erosion rate of super 13Cr tubing steel. J. Xi’an Shiyou Univ. 2016, 31, 100–105. [Google Scholar]
  5. Wang, Z.; Zhang, J.; Shirazi, S.A.; Dou, Y. Predicting erosion in a non-Newtonian shear-thinning jet flow with validated CFD models from PIV and PTV measurements. Wear 2019, 426–427, 501–506. [Google Scholar] [CrossRef]
  6. Wongpanya, P.; Saramas, Y.; Chumkratoke, C.; Wannakomol, A. Erosion-corrosion behaviors of 1045 and J55 steels in crude oil. J. Pet. Sci. Eng. 2020, 189, 106965. [Google Scholar] [CrossRef]
  7. Zhao, Y.L.; Tang, C.Y.; Yao, J.; Zeng, Z.H.; Dong, S.G. Investigation of erosion behavior of 304 stainless steel under solid–liquid jet flow impinging at 30. Pet. Sci. 2020, 17, 1135–1150. [Google Scholar] [CrossRef]
  8. Liu, Y.; Zhao, Y.; Yao, J. Synergistic erosion–corrosion behavior of X80 pipeline steel at various impingement angles in two-phase flow impingement. Wear 2021, 466, 203572. [Google Scholar] [CrossRef]
  9. Molina, N.; Walczak, M.; Michalczewski, R. Erosion under turbulent slurry flow: An experimental determination of particle impact angle, impact direction, and distribution thereof by image processing. Wear 2020, 454, 203302. [Google Scholar] [CrossRef]
  10. Yao, J.; Zhou, F.; Zhao, Y.; Yin, H.; Li, N. Investigation of erosion of stainless steel by two-phase jet impingement. Appl. Therm. Eng. 2015, 88, 353–362. [Google Scholar] [CrossRef]
  11. Zhang, E.; Zeng, D.; Li, S. Erosion Resistance of Gas Production Tree during Emergent Trial Production of High-pressure and High-output Gas Wells. Surf. Technol. 2018, 47, 183–190. [Google Scholar]
  12. Elemuren, R.; Tamsaki, A.; Evitts, R.; Oguocha, I.N.; Kennell, G.; Gerspacher, R.; Odeshi, A. Erosion-corrosion of 90 AISI 1018 steel elbows in potash slurry: Effect of particle concentration on surface roughness. Wear 2019, 430, 37–49. [Google Scholar] [CrossRef]
  13. Li, H.; Liu, Y.H.; Wang, Y.Z.; Ma, J.M.; Cai, B.P.; Ji, R.J.; Zhang, Y.Z. Corrosion–erosion wear of N80 carbon steel and 316L stainless steel in saline–quartz slurry. Mater. Corros. 2011, 62, 1051–1060. [Google Scholar] [CrossRef]
  14. Molina, N.; Walczak, M.; Kalbarczyk, M.; Celentano, D. Erosion under turbulent slurry flow: Effect of particle size in determining impact velocity and wear correlation by inverse analysis. Wear 2021, 474, 203651. [Google Scholar] [CrossRef]
  15. Wang, F.J.; Shan, W.W. Research of hydraulic fracture for Low-Permeability Gas Reservoirs. Nat. Gas Ind. 1999, 19, 61–63. [Google Scholar]
  16. Zhang, J.; Fan, J.; Zhan, X. Research on the Erosion Wear Characteristics of 42CrMo Steel in Hydraulic Fracture Conditions. China Pet. Mach. 2012, 40, 100–103. [Google Scholar]
  17. Zhang, H.; Tan, Y.; Yang, D.; Trias, F.X.; Jiang, S.; Sheng, Y.; Oliva, A. Numerical investigation of the location of maximum erosive wear damage in elbow: Effect of slurry velocity, bend orientation and angle of elbow. Powder Technol. 2012, 217, 467–476. [Google Scholar] [CrossRef]
  18. Wu, X.-M.; Li, W.-G. ZrN coated titanium alloy for erosion resistance. Equip. Environ. Eng. 2005, 2, 41–44. [Google Scholar] [CrossRef]
  19. He, G.Y.; Li, Y.H.; Wang, J.; Chai, Y.; He, W.F. Anti-erosion Coating Technique Based on Plasma and Its Application in Helicopter Aero-engines. High Volt. Eng. 2014, 40, 2133–2139. [Google Scholar] [CrossRef]
  20. Liu, D.; Xi, Y.; Han, D.; Zhang, X. Study on Solid Particle Erosion Behaviors of ZrN Gradient Coatings Prepared by Ion Assisting Arc Deposition. J. Aeronaut. Mater. 2010, 30, 31–37. [Google Scholar] [CrossRef]
  21. McLaury, B.S.; Shirazi, S.A. An Alternate Method to API RP 14E for Predicting Solids Erosion in Multiphase Flow. J. Energy Resour. Technol. 2000, 122, 115–122. [Google Scholar] [CrossRef]
  22. ASTM G73-98; Standard Practice for Liquid Impingement Erosion Testing. ASTM International: West Conshohocken, PA, USA, 1998.
  23. Wang, Z.; Qu, H.; Dou, Y.; Wang, W.; Cao, K. Comparison of Abrasive Jet Erosion Behavior in Water and Non-Newtonian Hydroxypropylguar Gum Solution. Surf. Technol. 2021, 50, 160–167. [Google Scholar]
  24. Wang, Z.; Zhang, J.; Shirazi, S.A.; Dou, Y. Experimental and Numerical Study of Erosion in a Non-Newtonian Hydraulic Fracturing Fluid. Wear 2019, 422–423, 1–8. [Google Scholar]
Figure 1. Three original surfaces, (a) is 125 V casing, (b) is the metallic coating and (c) is the resin coating.
Processes 12 00790 g001
Figure 2. Scanning electron microscopy of SiO2 particles.
Processes 12 00790 g002
Figure 3. Schematic diagram of the test setup.
Processes 12 00790 g003
Figure 4. Liquid–solid two-phase flow erosion of three casings. (a) is 125 V casing, (b) is the metallic coating and (c) is the resin coating. And the I, II and III is the stagnation zone, the turbulence zone and the boundary zone of jetting flow, respectively.
Processes 12 00790 g004
Figure 5. Three-dimensional surface profile of the sample after erosion, (a) is 125 V casing, (b) is the metallic coating and (c) is the resin coating.
Processes 12 00790 g005
Figure 6. Comparison of pit depth after erosion of three kinds of casing.
Processes 12 00790 g006
Figure 7. Comparison of liquid–solid erosion rate of different materials.
Processes 12 00790 g007
Figure 8. Macrogram of resin coating erosion over time, (a) is the initial surface, (b) is the surface after eroding 5 min, (c) is 10 min, (d) is 15 min, (e) is 20 min and (f) is 25 min.
Processes 12 00790 g008
Figure 9. Coating spalling mechanism with increases in the contact loading, (a) short cracks; (b) forming and growing cracks; (c) expanding cracks take a beating.
Processes 12 00790 g009
Figure 10. Comparison of erosion prediction model with OK model prediction value and experimental value.
Processes 12 00790 g010
Table 1. Chemical composition mass fraction of resin coating (Wt. %).
CSiOBaCr
81.511.75.80.50.4
Table 2. Chemical composition mass fraction of metallic coating (Wt. %).
CCuNiOFeW
36.427.723.25.85.21.3
Table 3. Test parameters.
MaterialThree Kinds of Casing Samples
scouring time (h)0.3 (Resin, metallic coating), 1.5 (125 V)
scouring velocity (m/s)15
scouring angle (°)90
sand type120 mesh natural quartz sand
sand concentration (kg/m3)45
Table 4. Material hardness analysis.
Testing MaterialHardness
125 VHV = 325
Resin coatingHV = 23.5
Metallic coatingHV = 294
Table 5. Material hardness.
MaterialVickers Hardness (HV)Brinell Hardness (BH)
125 V325316
Resin-coated casing23.519
Metallic- casing294286
Table 6. Values of various coefficients of sand content correction coefficient f(w).
Four MaterialsABCD
Numerical value9.84 × 10−17.93 × 10−43.52 × 10−4−5.70 × 10⁻⁵
Table 7. Material empirical constants.
MaterialC Value
125 V4.6248 × 10−7
Resin-coated casing1.7278 × 10−6
Metallic-coated casing8.928 × 10−7
Table 8. Table of four kinds of material error analysis.
MaterialPrediction Error of Oka Model (%)Model Predictions for This Project
Error (%)
125 V7.923.86
Resin-coated casing8.555.47
Metallic-coated casing7.477.25
Average error8.404.68
Disclaimer/Publisher’s Note: The statements, opinions and data contained in all publications are solely those of the individual author(s) and contributor(s) and not of MDPI and/or the editor(s). MDPI and/or the editor(s) disclaim responsibility for any injury to people or property resulting from any ideas, methods, instructions or products referred to in the content.

