1. Introduction
China’s low-permeability bottom-water reservoirs have abundant reserves and great potential for exploitation. However, it is difficult to achieve industrial oil and gas flow in these reservoirs through conventional perforation alone. To achieve efficient production, large-scale volume fracturing transformation is generally required [
1,
2,
3,
4]. The widespread application of volume fracturing has significantly increased oil and gas production, and in recent years, it has made remarkable progress in the fields of tight oil and gas, coalbed methane, and shale oil and gas [
5,
6,
7,
8,
9,
10,
11].
In recent years, domestic scholars have conducted extensive research on production techniques for low-permeability reservoirs, factors affecting fracture height caused by thin-layer fracturing, and techniques for controlling fracture height. The factors that influence fracture height include the crustal stress difference between the barrier and the production layer, the scale of construction, the construction displacement, the viscosity of the fracturing fluid, the Young’s modulus difference between the barrier and the production layer, the formation permeability, and the fracture toughness difference. It is more advantageous to control fracture height when there is a greater crustal stress difference between the interlayer and the production layer. Reducing construction displacement and fracturing fluid viscosity can decrease the net pressure in the fracture, which is conducive to controlling fracture height [
12,
13]. In the fracture process, when the fracture conductivity is small, the longer the fracture length, the larger the decay coefficient of the fracture conductivity and the lower the trap yield. Conversely, the shorter the fracture length, the smaller the attenuation coefficient of the fracture conductivity and the higher the production of the oil well [
14,
15]. The fracture initiates at the point where the horizontal principal stress value of the fracture layer is at a minimum. The extension of fracture height is also affected by the change in the minimum horizontal principal stress of the formation near the target layer. If the net pressure value in a fracture exceeds the minimum horizontal principal stress of the adjacent formation, the fracture will propagate through the layer; otherwise, the layer will act as a barrier [
16,
17]. Overall, China’s low-permeability bottom-water reservoirs have significant potential, and with the application of volume fracturing and the improvement of production techniques, oil and gas production in these reservoirs can be greatly enhanced. Through a better understanding of the factors affecting fracture height and the techniques for controlling it, more efficient and effective exploitation of these reservoirs can be achieved.
The low porosity and permeability of the subsurface gas reservoir in the Moxi block of the Gorgonize structure limits single-well production. To increase production, the use of acid fracturing is necessary. However, the development of high-angle fractures within the gas layer, small differences in stress between segments, and the proximity of the gas–water interface make it difficult to control the height of the acid fracture. This is because acid fracture can easily communicate with the underlying water layer. In this paper, we will develop a model to analyze the propagation of fractures within the reservoir. This will provide a theoretical basis for the use of highly acid-fracturing techniques to control fractures in a gas reservoir with bottom water in a second member of the Dengying formation.
2. Reservoir Characteristics of the Second Member of the Dengying Formation
2.1. Reservoir Characteristics
The second section of the Dengying formation exhibits a generally low porosity and permeability. However, there is a locally developed profile with high porosity and permeability, indicating the presence of dissolution pores in the reservoir. The full-diameter physical properties analysis shows that the porosity of the reservoir ranges from 2.02% to 10.32%, with an average of 3.35% based on the statistics of the plunger samples in the core-reservoir profile. The permeability is predominantly concentrated between 0.01 mD and 10 mD, with an average of 1.16 mD. In the reservoir cross-section, the full-diameter core sample revealed porosity ranging from 2.02% to 9.88%, with an average of 3.73%. The permeability in this section is mainly concentrated between 1 mD and 10 mD, with an average of 2.26 mD.
2.2. Reservoir Space
Based on the analysis of core and thin-section data, the storage space of the second member of the Dengying formation consists mainly of karst caves, karst pores, and different types of fractures.
Karst caves are mainly developed in algal aggregates and algal sand dolomites. Through core observations, it was found that small and medium-sized karst caves, with diameters ranging from 2.0 to 5.0 mm, dominate, while large karst caves are less developed.
Dissolved pores include intergranular and intragranular pores. Among them, intergranular dissolved pores are mainly developed in pinhole sandstones with a pore size of 2.0 mm. Needle-shaped pores are observed in the core, mostly formed by the superposition of primary intergranular pores through a diagenetic transition controlled by sedimentation and closely related to shoal systems.
Fractures include structural joints, fusion joints, and line joints. According to core observations, fractures generally develop in the second segment of the Dengying formation, and the fracture density is unevenly distributed in both the vertical and horizontal directions. The fracture density varies significantly from well to well, with both low-angle horizontal and high-angle vertical fractures developing. The frequency of structural fractures is relatively high, and when viewed microscopically, the fractures are often filled with dolomite, bitumen, quartz, etc. Fractures connect to pores and small karst caves. The combination of pores and fractures can significantly enhance the permeability of the reservoir.
2.3. Rock Mechanics Parameter Testing
The rock mechanics parameters of the second reservoir of the GS1-X well in the block under study were obtained by performing an experimental study based on a triaxial experiment to test the rock mechanics parameters. The average compressive strength was 555.39 MPa, and the average Young’s modulus was 4.027 × 10
4 MPa, with an average Poisson ratio of 0.21, as is shown in
Table 1.
3. Experiments and Methods
3.1. Basic Assumptions of the Model
The working fluid is an incompressible Newtonian fluid.
The minimum horizontal principal stress of each layer follows the direction of the horizontal well, without considering its variation within the layer.
The geometric shape of the crack is a symmetrical double-wing slot.
The filtration of working fluid can be described by Carter’s filtration formula.
3.2. Geological and Mechanical Parameters of the Model
Triaxial compressive testing was performed on rock samples from well Gaoshi X, a 2nd member of the Dengying formation. The results showed that the compressive strength of the reservoir rock was 572.76 MPa, with a Young’s modulus of 3.876 × 10
4 MPa and a Poisson’s ratio of 0.17. The plasticity of the rock layers is not taken into account in the simulations. The main computational parameters are given in
Table 2. The aquifer will adopt the same mechanical parameters as the reservoir, and the stress difference will not be effective if the fracture does not penetrate into the aquifer.
The deterministic parameters in
Table 1 and
Table 2 mainly come from the geological understanding of single wells. Due to the strong heterogeneity of the reservoir, there is a certain error in the values taken, which will amplify the uncertainty of the model parameters.
3.3. Assumptions in the Model
The computational model will be based on the following main assumptions.
Each layer satisfies the assumption of linear elastic deformation, each layer has a Poisson ratio of 0.25, and the interlayer Young’s modulus is higher than the reservoir. The assumed data in the model come from the reservoir characteristic parameters of the block, as shown in
Section 2.
Leakage of the fracturing fluid occurs only in the reservoir, and the filtration coefficient is given by the following equation.
Among them, the pressure difference is = 105 − 57 MPa. The viscosity of water is = 1 mPa·s, and the compressibility of rock is 2.9 × 10⁻⁹ Pa−1.
The density of the fracturing fluid and the rock can induce changes in their respective gravitational forces. The gravity of a fluid can affects pressure changes. Given the significant thickness of each layer and the relatively small net pressure, this effect will be substantial. The calculations assume a density of 1000 Kg/m3 for the fracture fluid and 2700 Kg/m3 for the carbonate rock of the second section of the Dengying layer.
Different water avoidance heights were chosen, with the thickness of the lower partition layer equal to the water avoidance height. Water avoidance heights are considered ineffective if the expanding fracture reaches the aquifer.
The overlying layer experiences significant stress, resulting in a deficiency in the upwelling capacity of the fracture. The minimum horizontal principal stress of the cap is 109 MPa, resulting in a stress difference of 4 MPa between the cap and the reservoir layer.
Overall, fluid–rock interactions can have a notable effect on the pressure and stress profiles in the subsurface. It is critical to consider these factors in the design and analysis of fracturing operations.
The pressure is reduced if the effect of increasing the fracture width by acidification is taken into account, without regard to acid etching. Thus, the injection pressure to reach the same fracture length and height will be reduced by considering the effect of acid. Therefore, an estimate of whether the fracture has reached the upper limit of the aquifer is provided. The results will be biased towards safety.
3.4. Principles and Characteristics of the Model
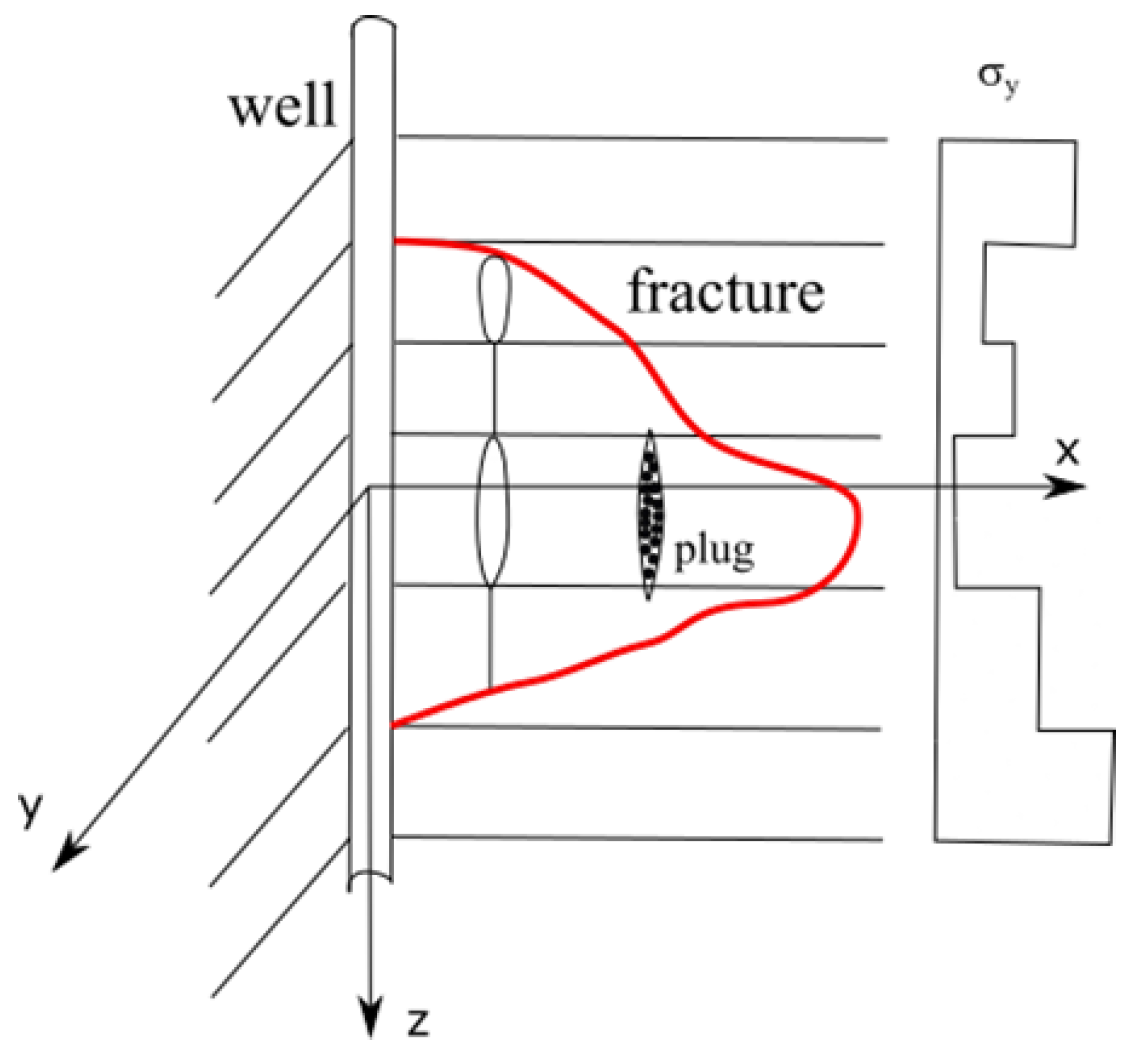
A quasi-3D hydraulic fracturing model was used in this study to calculate whether the fracture would reach the aquifer, taking into account rock heterogeneity. The main feature of the model is the explicit consideration of different elastic constants for each layer. Due to the large size of the model, it is necessary to account for the effects of rock gravity and fracturing fluid. Since the fracture is below 5000 m, ground-based effects are not included. However, the varying magnitudes of the gravitational modes and their relative variations are accounted for exactly in the calculations. In this paper, we introduce a quasi-3D model widely used in petroleum engineering. When the depth is significant, the largest compressive stress is the vertical stress due to the gravity of the rock. The fracture propagates vertically in the plane and is affected by adjacent fractures during horizontal well mining. However, the spacing between the fractures is larger than ten meters, and this interaction does not destructively affect the vertical in-plane expansion pattern. Thus, it can be argued that the pattern of vertical in-plane expansion still holds. The fracture propagation problem is presented in
Figure 1, where the horizontal lines represent the interfaces between different rocks. The fracture propagates in the vertical plane, and its expansion is affected by the minimum horizontal compressive principal stress perpendicular to the plane, as indicated by the stress on the right in
Figure 1. Due to the fact that the fracture passes through many horizontal layers, the stress values vary from layer to layer.
3.5. Mechanical Control Equation
3.5.1. Equations for the Elastic Mechanics of Rock Deformation
In the equation, is the static pressure, is the Green’s function, and w is the opening displacement. is the mixed density, and g is the gravitational acceleration (=9.8 m/s2).
3.5.2. Fluid Flow Equation in Fractures
In the equation, represents the flow rate, represents the time when the fracture reaches a certain location, represents the rock filtration coefficient, and the values of each layer are given by Equation (1).
The flow rate of the fluid at any point within the fracture should obey the so-called cubic law, yielding
3.5.3. The Propagation Conditions of Fractures
Criteria from linear fracture mechanics are used to judge the fracture motion. For a type I fracture, its fracture toughness is used to determine whether the fracture will expand. The expansion condition along the vertical direction is the following:
Due to the expansion of the hydraulic fracture, a portion of the energy is used for viscous dissipation of the fluid, and its role should be included in the fracture energy. Therefore, the value of the fracture toughness is revised. The form of it is as follows:
In the equation, .
The expansion along the horizontal direction adopts a form similar to Equation (5). However, the value of the modified fracture toughness is given by the following equation:
The solution of the above differential equation depends on the initial value condition at the boundary. At the beginning, both the length and the height of the fracture were 5 m, and the fracture was in a stationary state. The acid-fracturing fluid is injected into the fracture at a certain displacement from the borehole. Therefore, the following injection conditions should be satisfied at the fracture entrance.
3.6. Numerical Method
Considering the plane deformation and one-dimensional flow assumptions used in the quasi-3D model, the equation can be redefined using the average variables of each cross-section. These average variables are defined as:
By the above transformation, it follows that the cubic law is
Mass conservation equation:
The total-fluid mass conservation equation is
The fluid–solid coupling equations for the extent of fracture opening are calculated by discretizing the elastic mechanics equations using the boundary element method and the fluid flow equations using the finite-volume method. The fluid–solid coupling equations are solved implicitly to obtain the degree of fracture opening at a certain time step. The position of the fracture tip is calculated using explicit time steps. By checking whether a change in the position of the fracture tip causes a significant change in the opening displacement, a recalculation is performed if the change exceeds the allowed range.
3.7. Verification of the Feasibility of Numerical Models
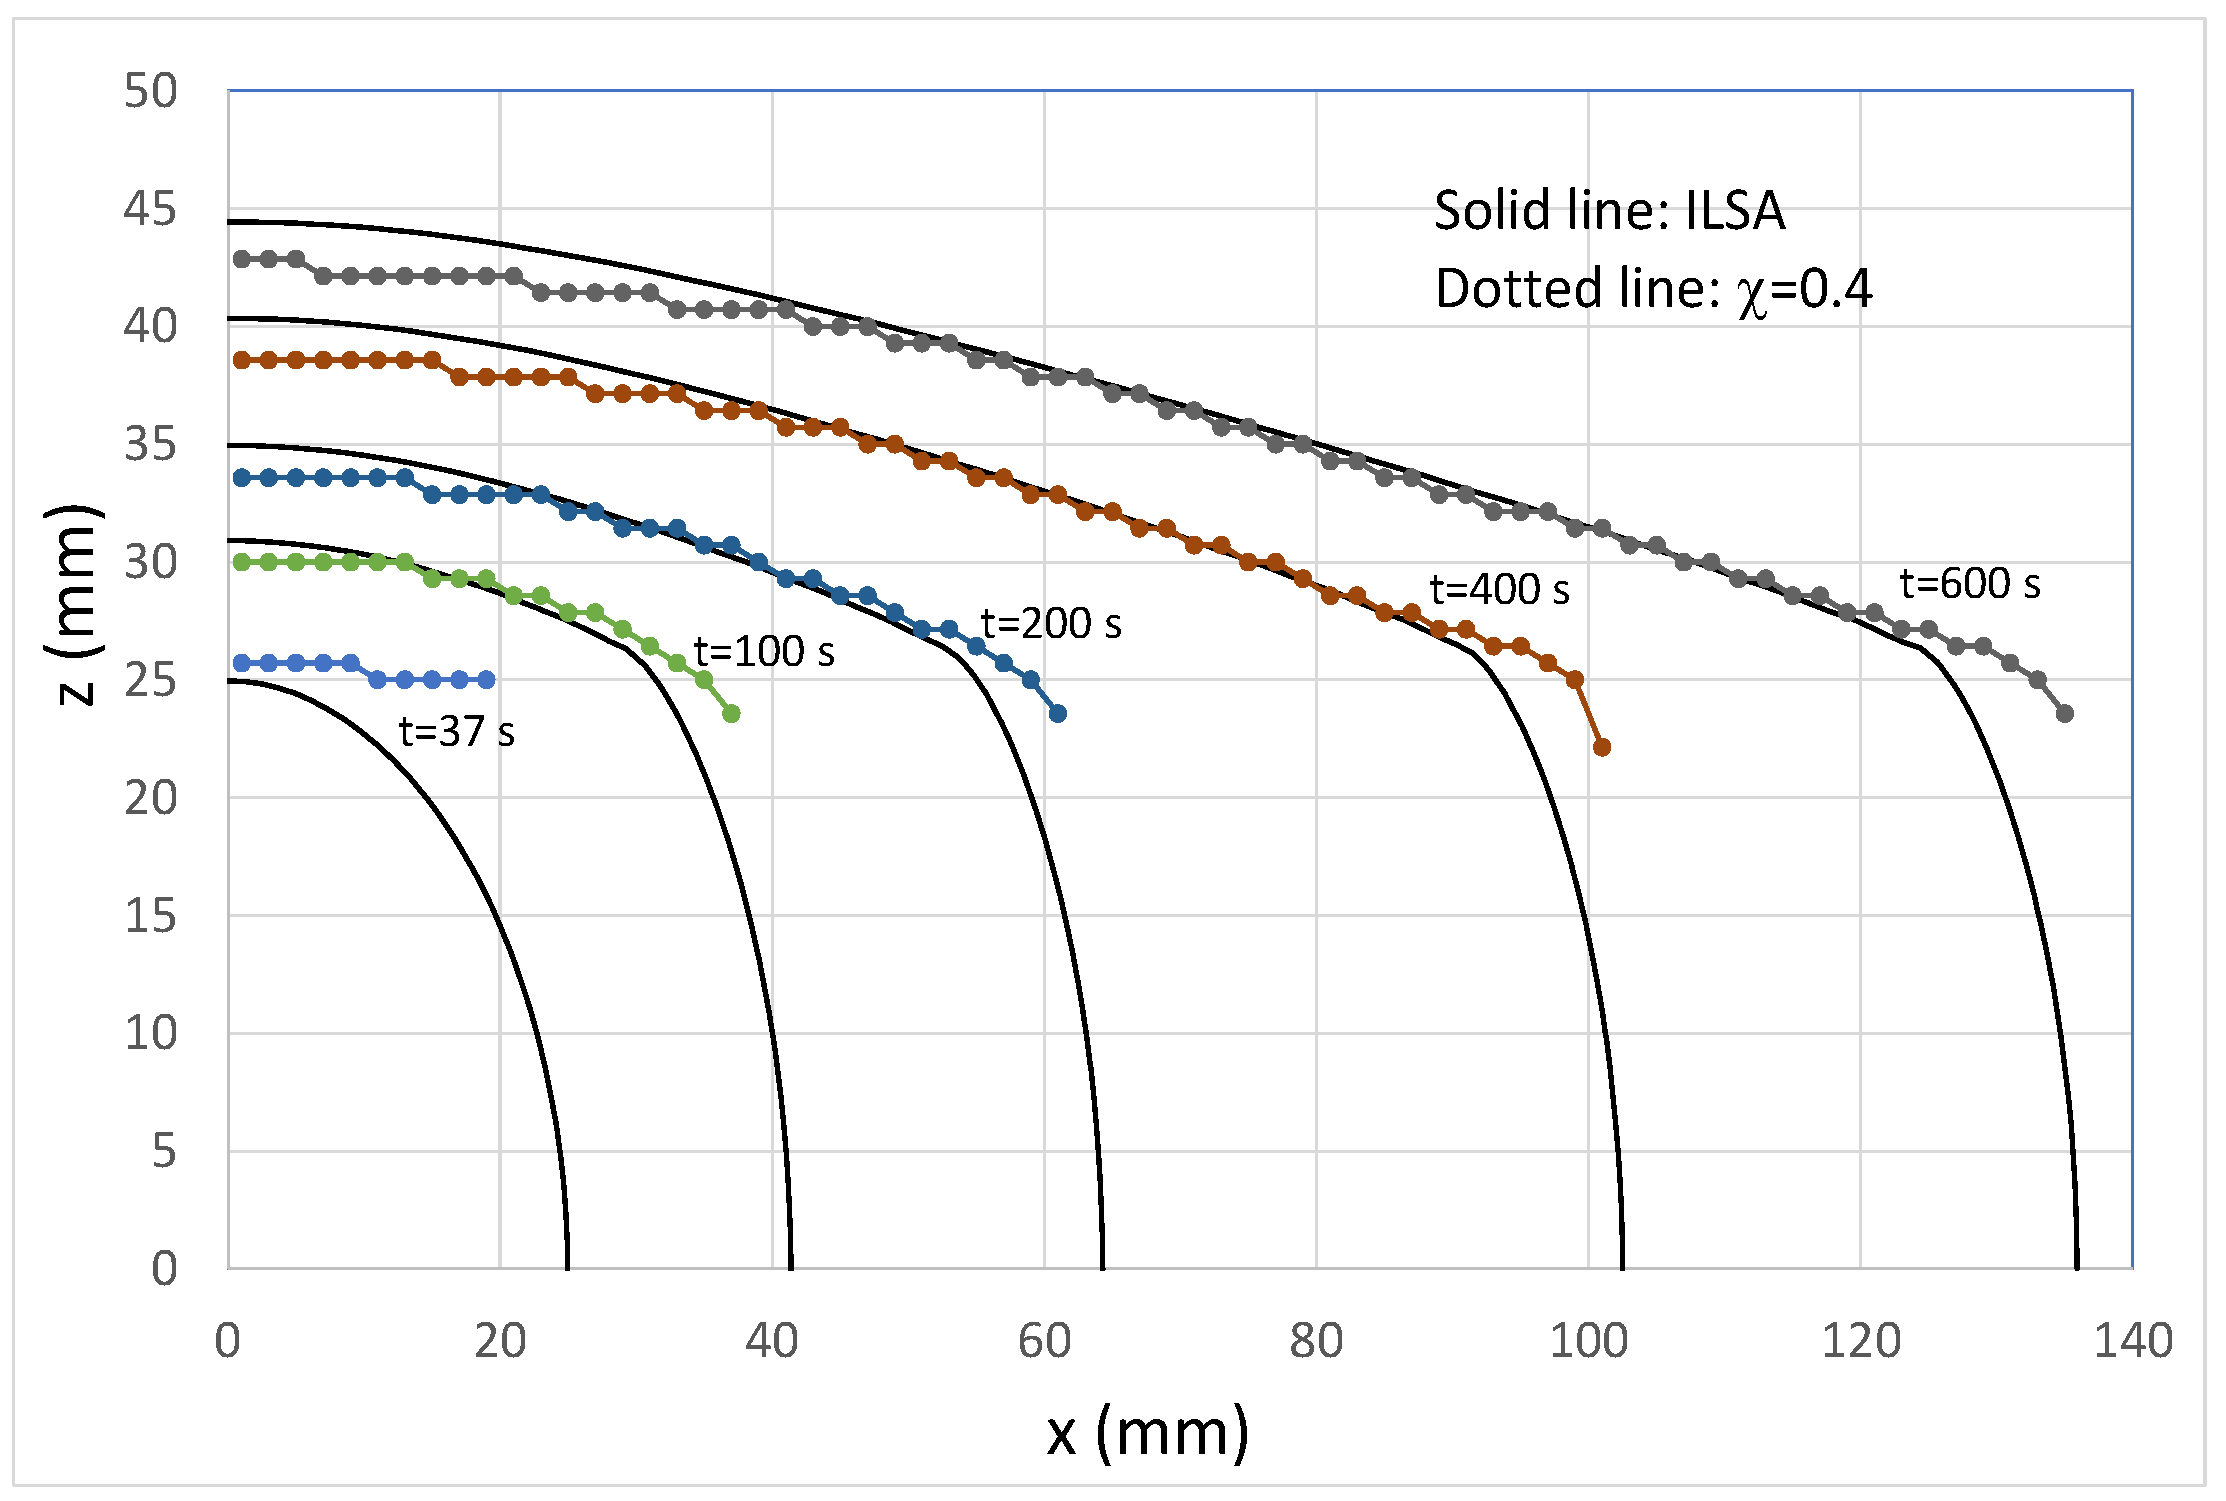
The results of any numerical calculations must be compared with experiments or other models to determine whether they are correct. This model is able to reproduce the circular fracture shape at the initial stage of fracture propagation and the PKN analytical solution under equal height conditions. When there are different minimum compressive stresses along the depth in the same rock mass, the propagation of fractures in the vertical direction will vary in length due to the different stresses. To describe this phenomenon, academics from the University of British Columbia (UBC) in Canada developed a stereoscopic hydraulic fracturing procedure called ILSA.
Figure 2 shows a comparison between the numerical results calculated with the model in this paper and those calculated with ILSA. The fracture propagates within a rock mass with three layers of stress differences. The thickness of the middle layer is 50 m and the pressure difference between the upper and lower layers is 4.3 MPa. However, it can be seen that the results of this model are consistent with those of the rigorous 3D model. In summary, the main features of this computational simulation method are the following:
(1) The influence of different Young’s moduli of each layer on fracture deformation was considered. Even under the same fracture conditions, the immediate consequence is that the fracture surface is not symmetric along the fracture centerline. Moreover, the fracture opening displacement is proportional to the Young’s modulus. Weak rocks undergo significant deformation, which reduces the pressure and flow rate of the fracturing fluid.
(2) The influence of gravity on rocks and fracturing fluids was considered. In this way, the buoyancy effect of the fluid can be calculated. The calculation of the fracture height is more precise.
The influence of fluid viscosity dissipation on the horizontal and vertical propagation of fractures was incorporated into the classic hydraulic fracturing pseudo-three-dimensional model. The inclusion of this energy makes the calculation of the fracture length more precise.
4. Results and Discussion
In the absence of certain parameters (such as the mechanical parameters of the overlying strata), the trend given by the simulated calculation results is still useful. At the same time, in response to these missing mechanical parameters, this paper will provide a wide range of parameter values, providing designers with a variety of possibilities and options.
Note: L1 in the table represents the overlying layer, L2 represents the reservoir, and L3 represents the interlayer. The rightmost column of data indicates whether long-term injection of acid-fracturing fluid will cause fractures to reach the aquifer when the water avoidance heights are 40 m and 60 m. Yes “indicates yes”, no “indicates no”, and yes at large time “indicates a trend towards reaching the aquifer”.
The problem of tuning the values of the parameters in the calculations is presented in
Table 3. The effects of different input parameters are taken into account, which mainly include stress difference per layer, Young’s modulus ratio, different displacements, and fluid viscosity. The first three columns of the data after the trap number in
Table 2 indicate the magnitude of the compressive stress in each layer, while the next three columns indicate the Young’s modulus in each layer.
4.1. The Shape and Width of Fractures
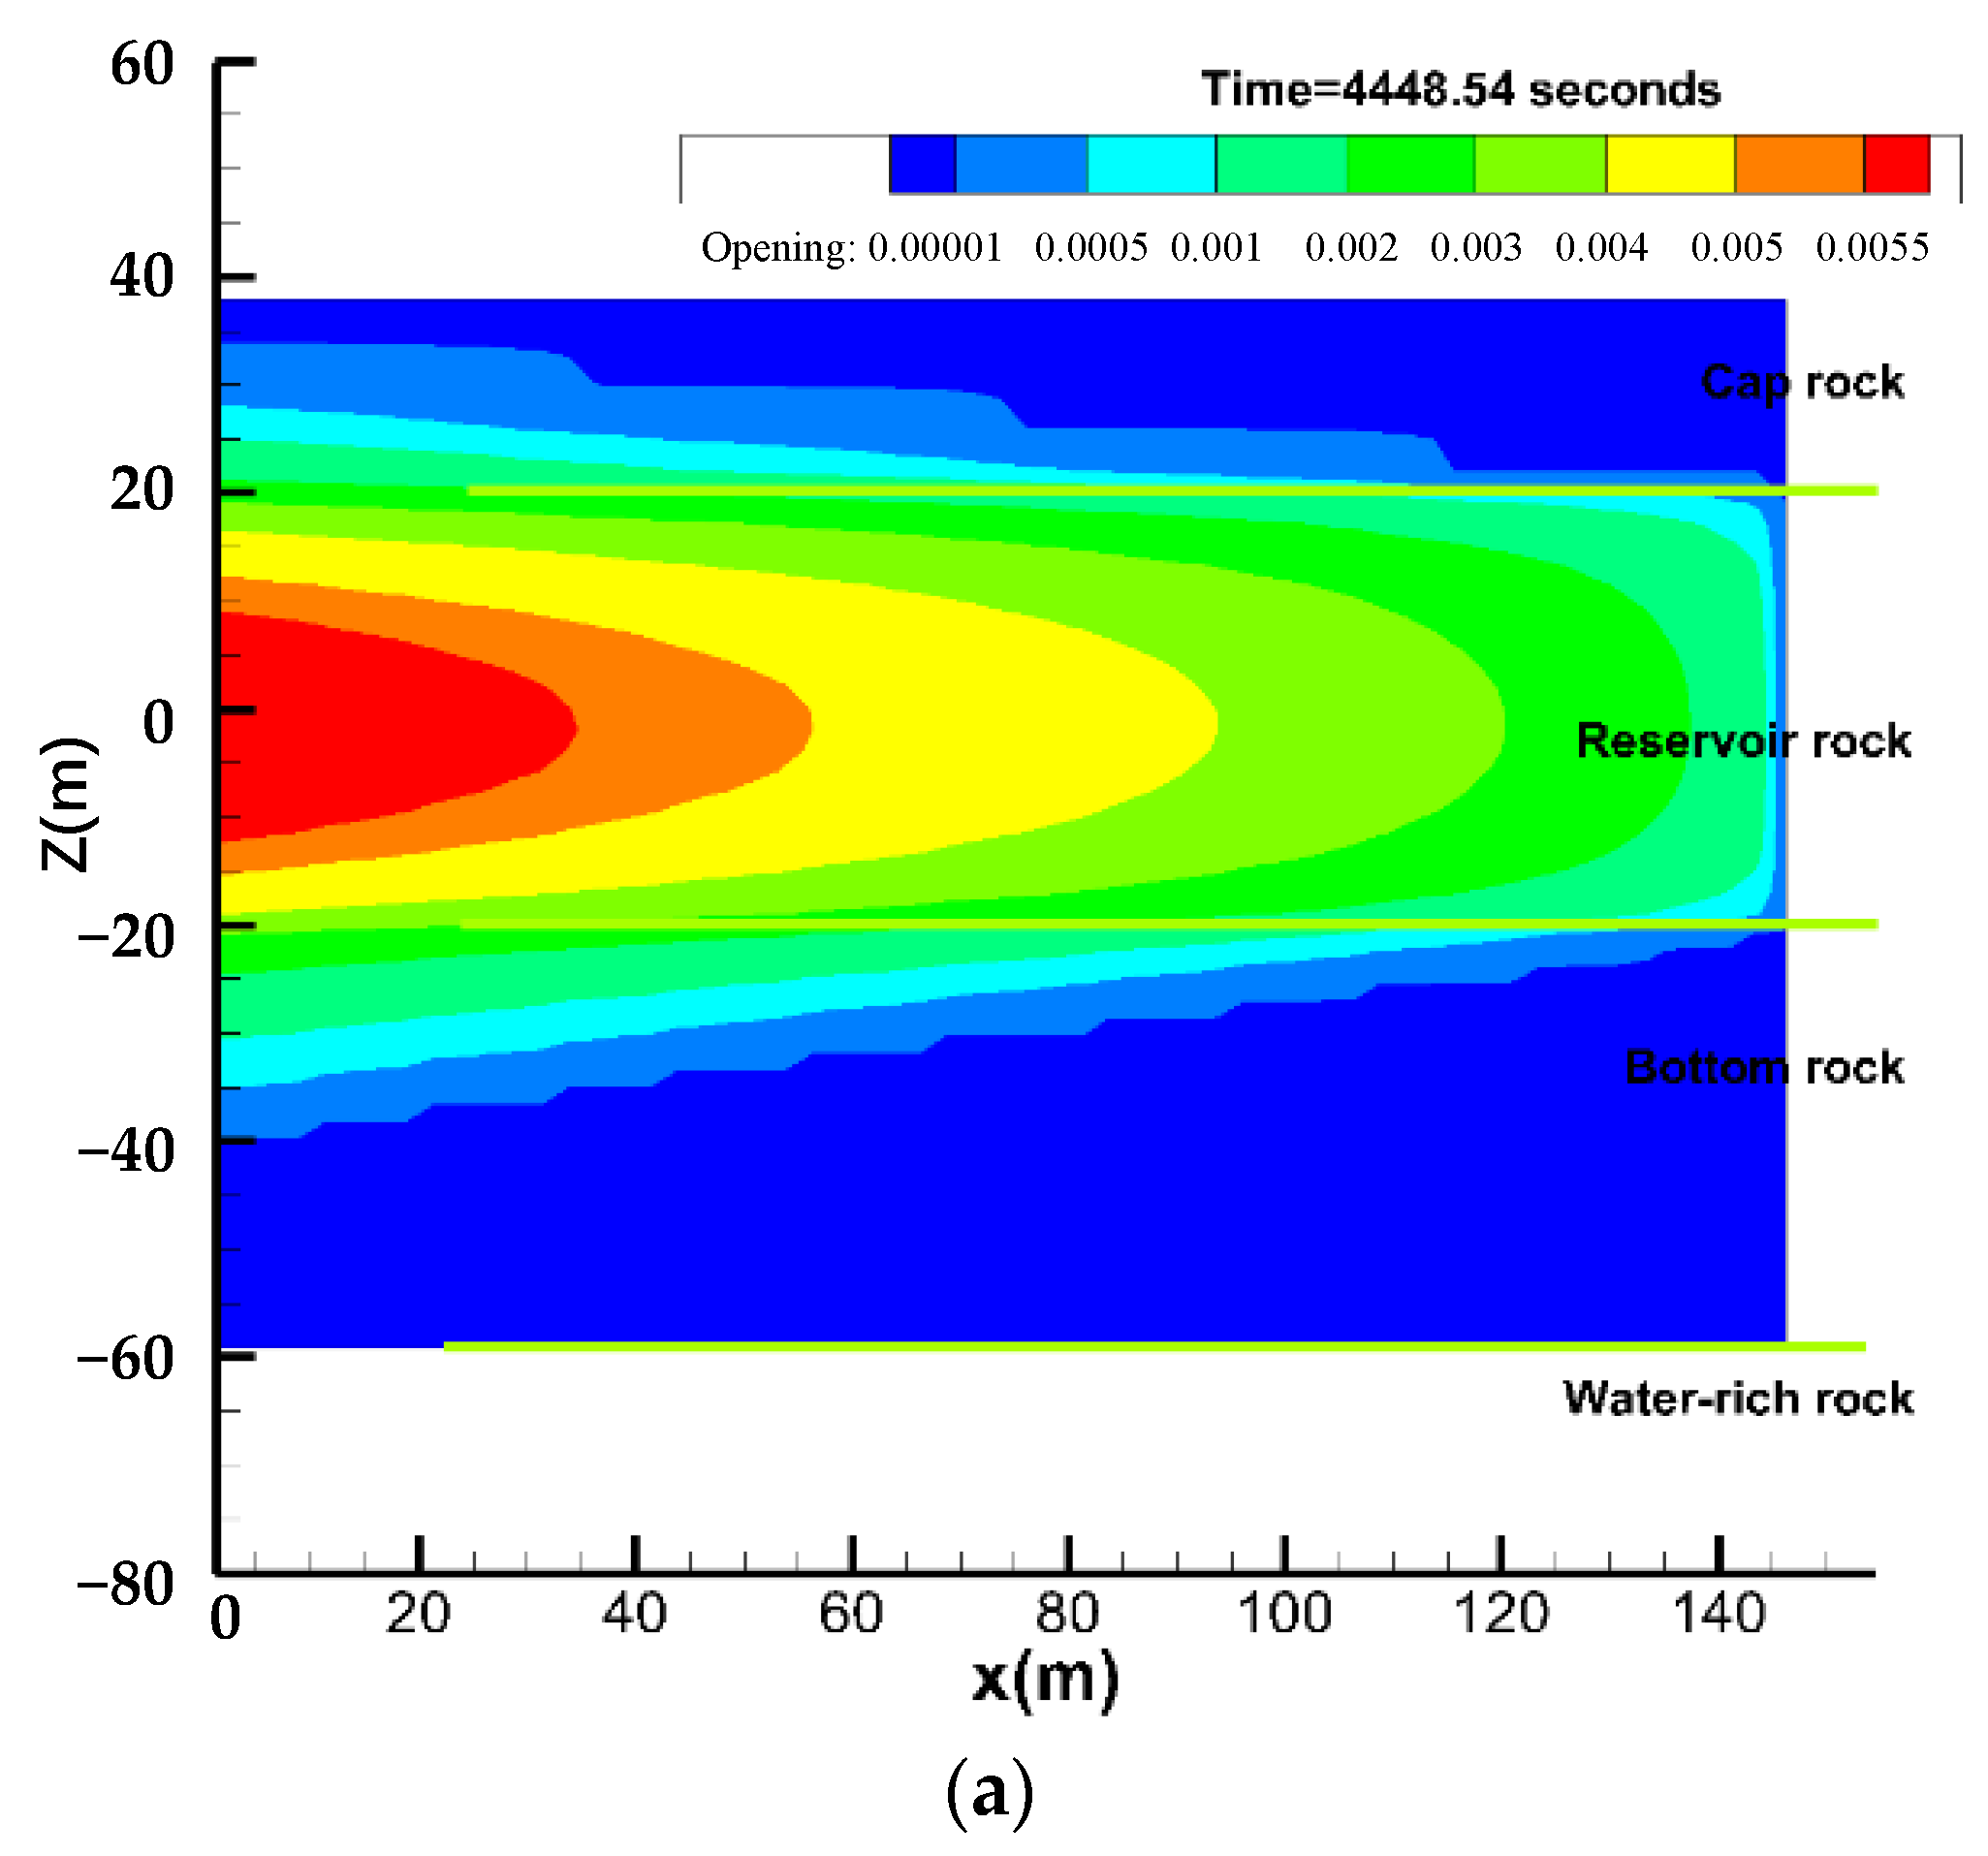
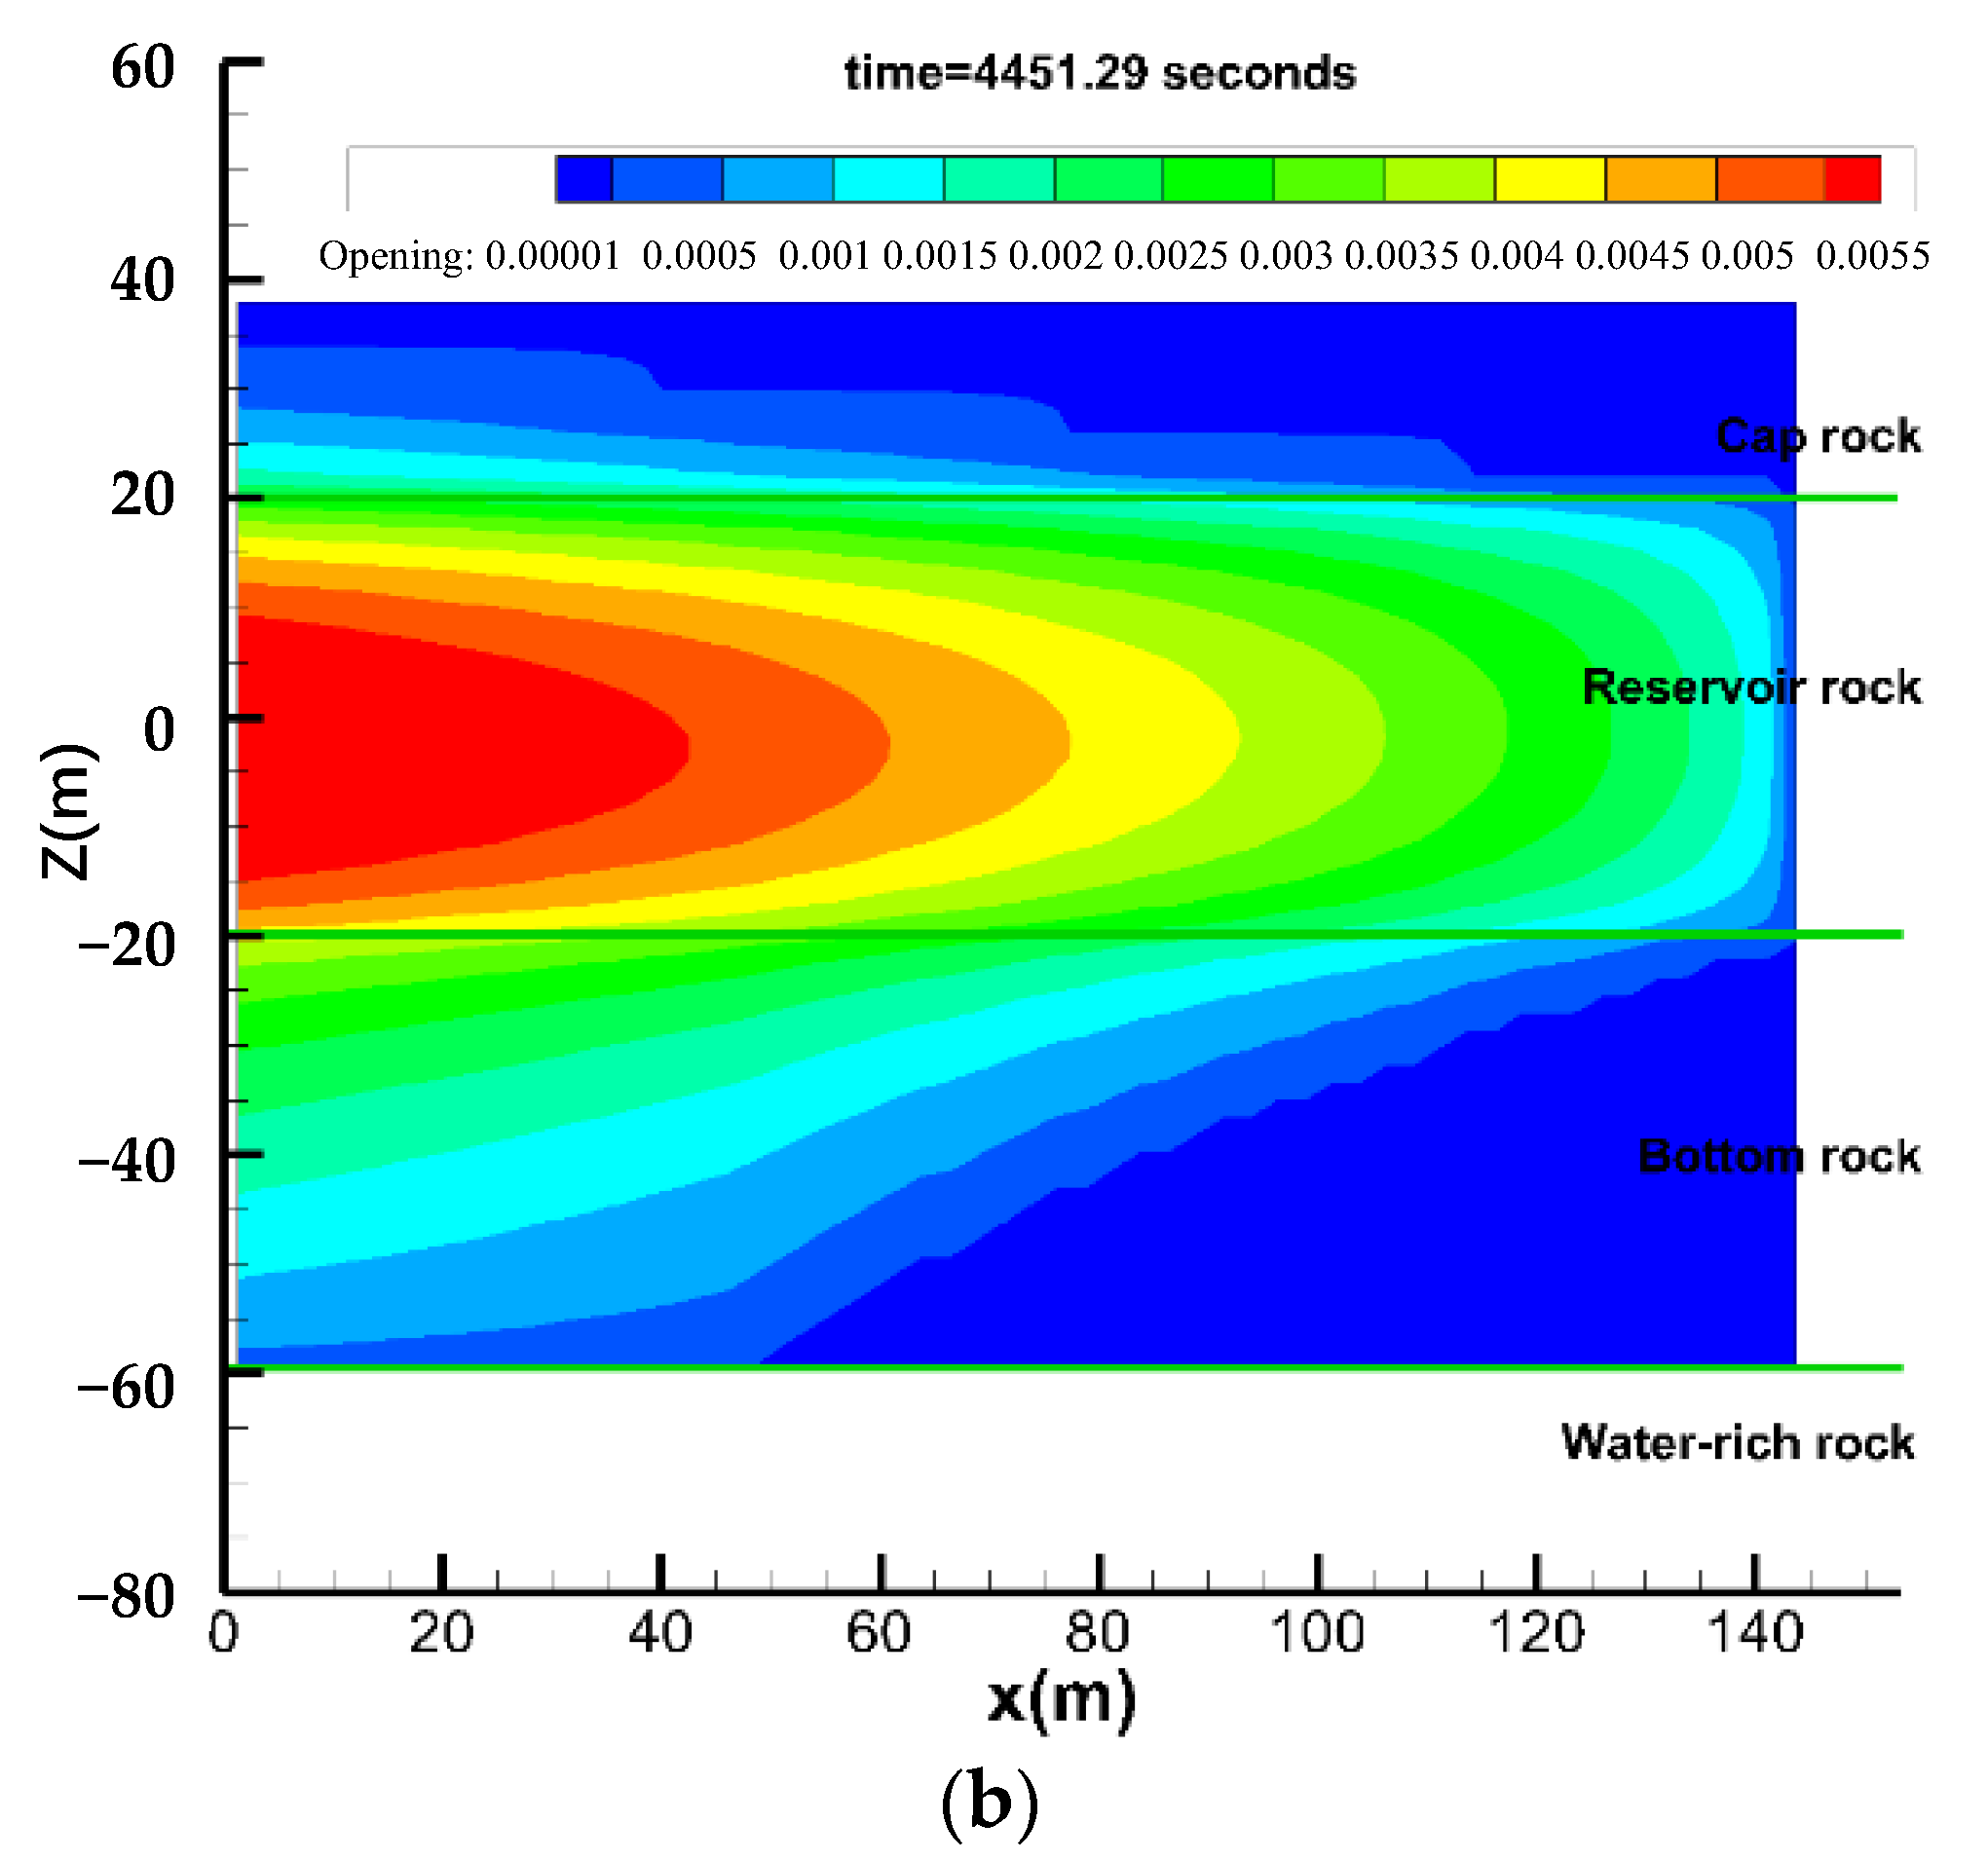
Figure 3 shows the fracture propagation and opening changes during acid fracturing. The green line indicates the interface between the layers. The interface between the dark-blue and light-blue lines gives the geometry of the fracture. Cap rock refers to the cap rock, reservoir rock refers to the reservoir, bottom rock refers to the interlayer, and water-rich rock refers to the aquifer. As shown in the simulation results in
Figure 3a, for the given computational parameters, the acid fracture does not reach the aquifer at a distance of 40 m below the reservoir. As shown in the simulation results in
Figure 3b, when the stress in the interlayer is reduced, the acid fracture communicates with the aquifer at a distance of 40 m below the reservoir.
4.2. The Influence of Mechanical Parameters
4.2.1. Stress Difference between Reservoir and Interlayer
When the stress difference between the simulated reservoir and the interlayer is 4 MPa and the construction is carried out for 80 min with a displacement of 5.0 m3/min, the height of the fracture expands by 20 m. At a stress difference of 3 MPa between the reservoir and the interlayer, the fracture height reaches 40 m after 50 min of construction under the same displacement conditions. The stress difference between the reservoir and the interlayer has a significant effect on the propagation of the fracture height. The larger the stress difference, the smaller the propagation of the fracture height.
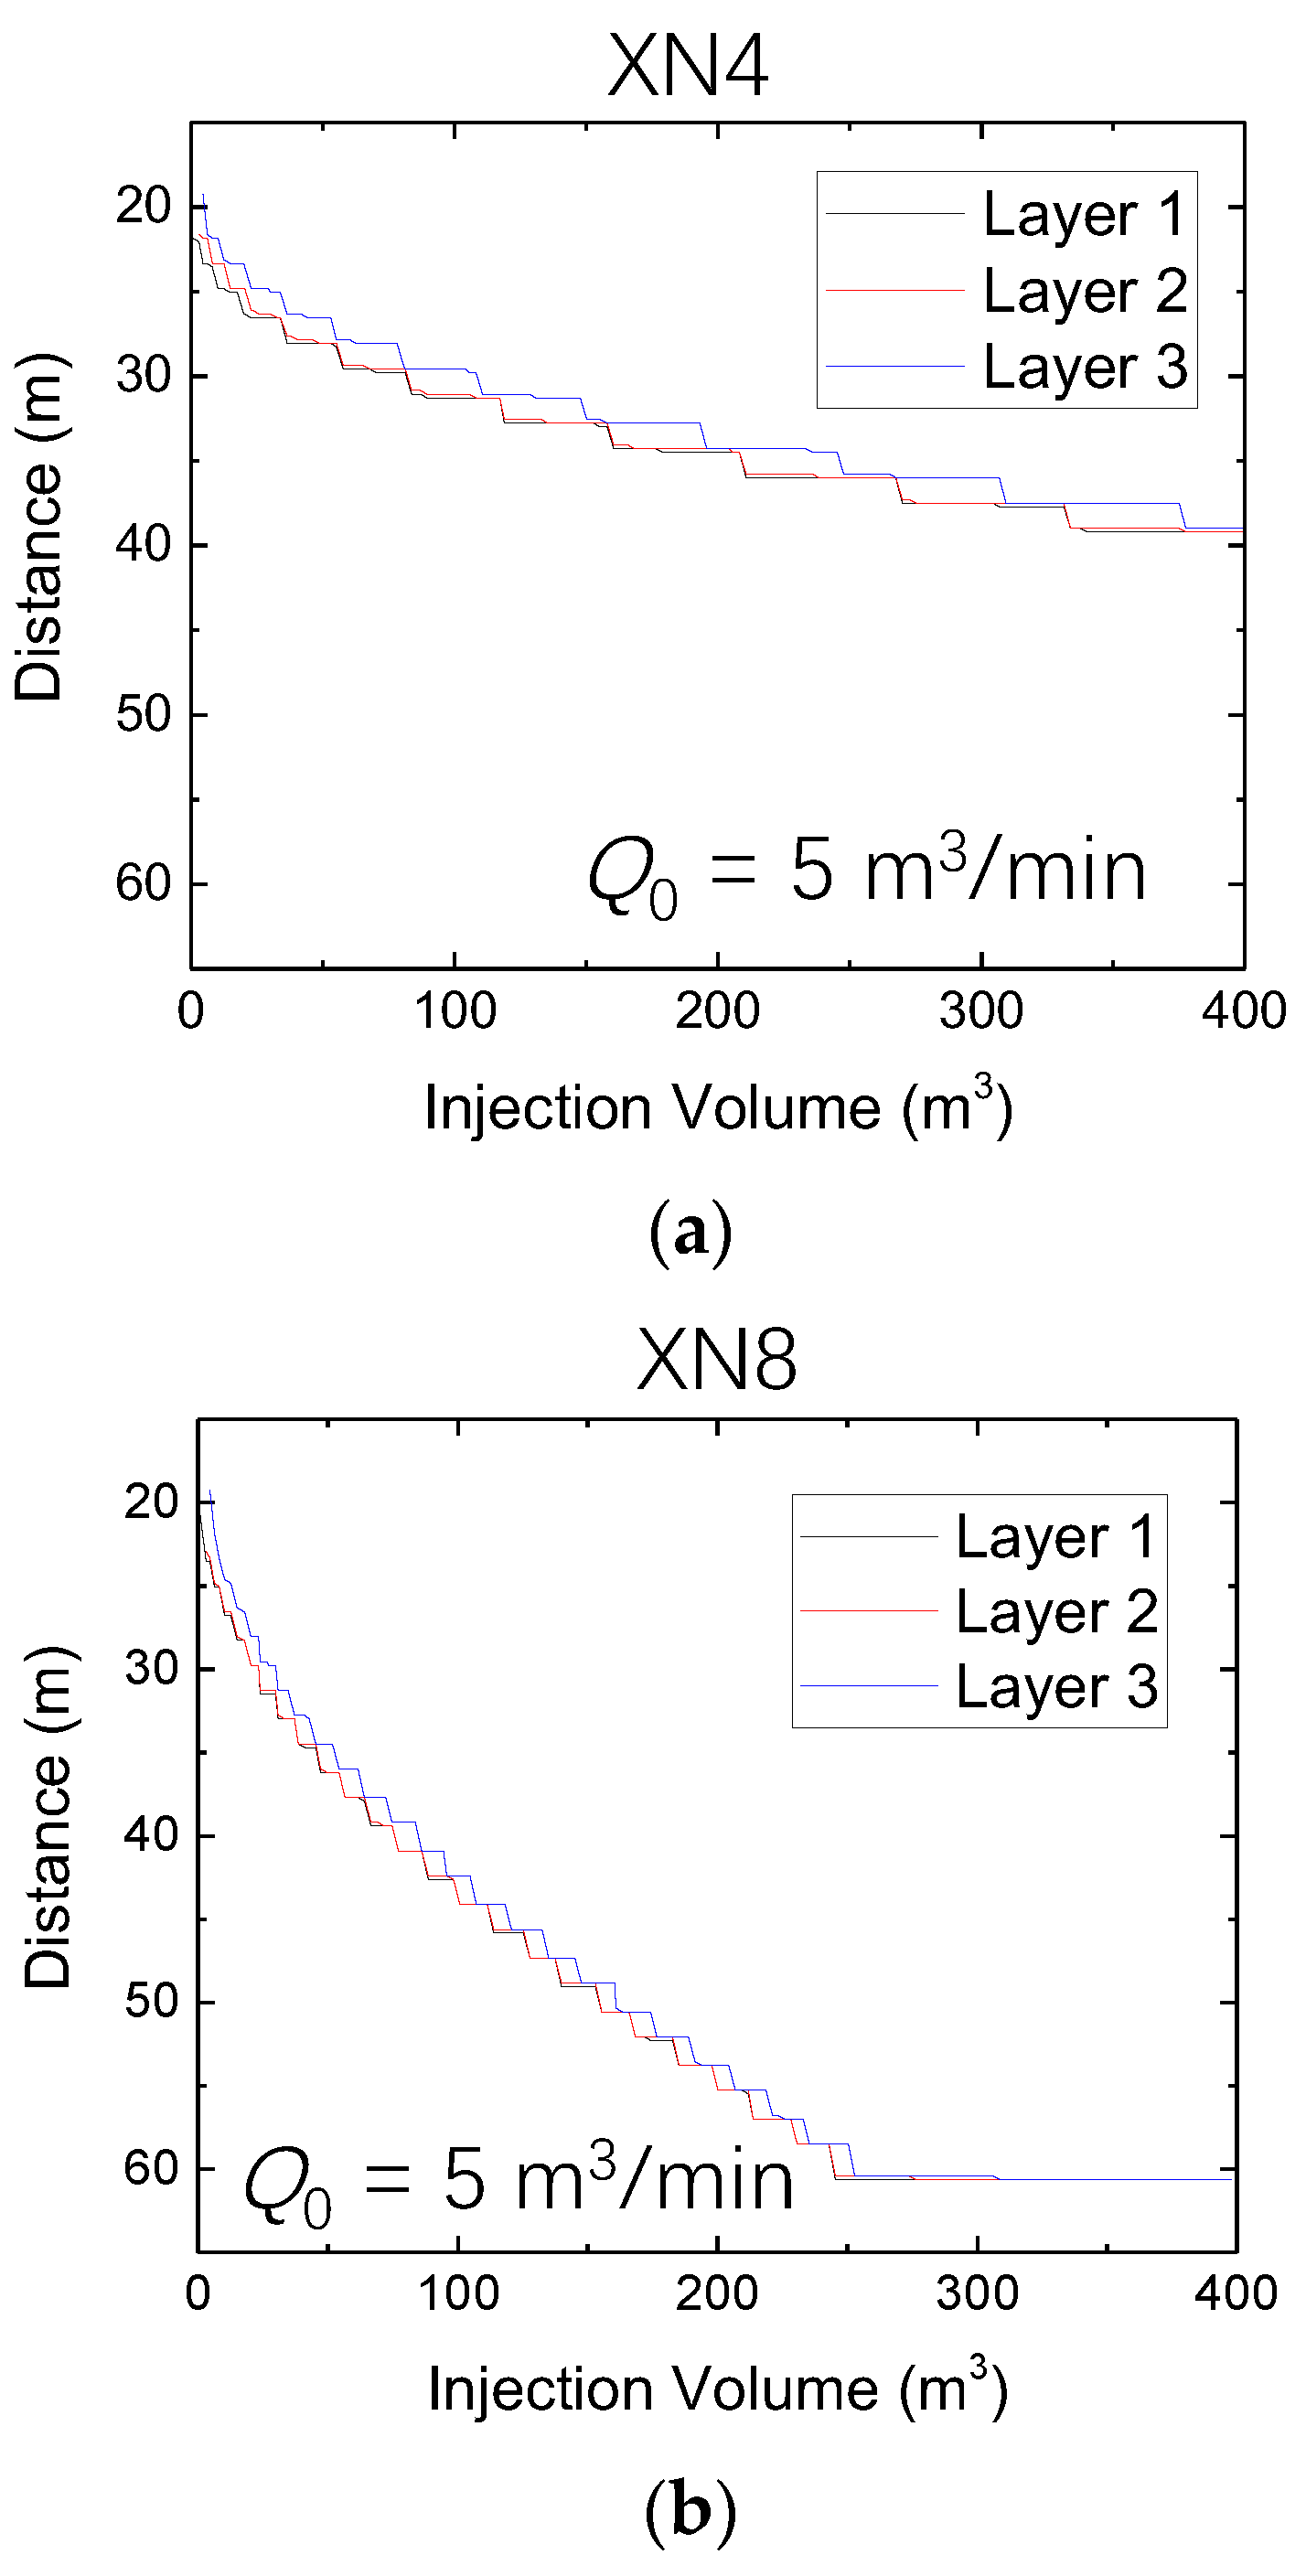
Figure 4 shows various cases of whether the fracture has reached the aquifer. The distance between the bottom of the fracture and the midpoint of the reservoir is used as a criterion for discrimination. When the distance between the base of the fracture and the midpoint of the reservoir is greater than 60 m, the fracture has reached the aquifer. In
Figure 2, layers 1, 2, and 3 represent the positions of vertical planes at horizontal distances of 1.25 m, 6.25 m, and 11.25 m from the wellhead, respectively. An injection displacement of 5.0 m
3/min and an acid viscosity of 0.035 Pa·s were applied to each layer with the same elastic modulus. The smaller s is, the smaller the stress difference between the reservoir and the interlayer and the larger the required water avoidance height. When the stress difference between the reservoir and the interlayer is 2 MPa, the spreading of the fracture height penetrates the water avoidance height. When the stress difference between the reservoir and the interlayer is 3 MPa, 4 MPa, and 5 MPa, the water avoidance height needs to be 30 m, 20 m, and 10 m, respectively, to avoid the propagation of the fracture height to the gas–water interface.
4.2.2. Reservoir Heterogeneity
The effect of the Young’s modulus of the different reservoirs and interlayer on the propagation of the fracture height was simulated under four different conditions, namely, a stress difference of 3 MPa between the reservoirs and interlayer, an injection rate of 5.0 m3/min, and an acid solution viscosity of 0.035 Pa·s. Simulations show that the higher the Young’s modulus ratio between the reservoir and the interlayer, the higher the fracture height. When the water avoidance height is less than 30 m, the volume of injected liquid is required to be less than 100 m3.
4.3. The Influence of Acid-Fracturing Parameters
4.3.1. Injection Displacement
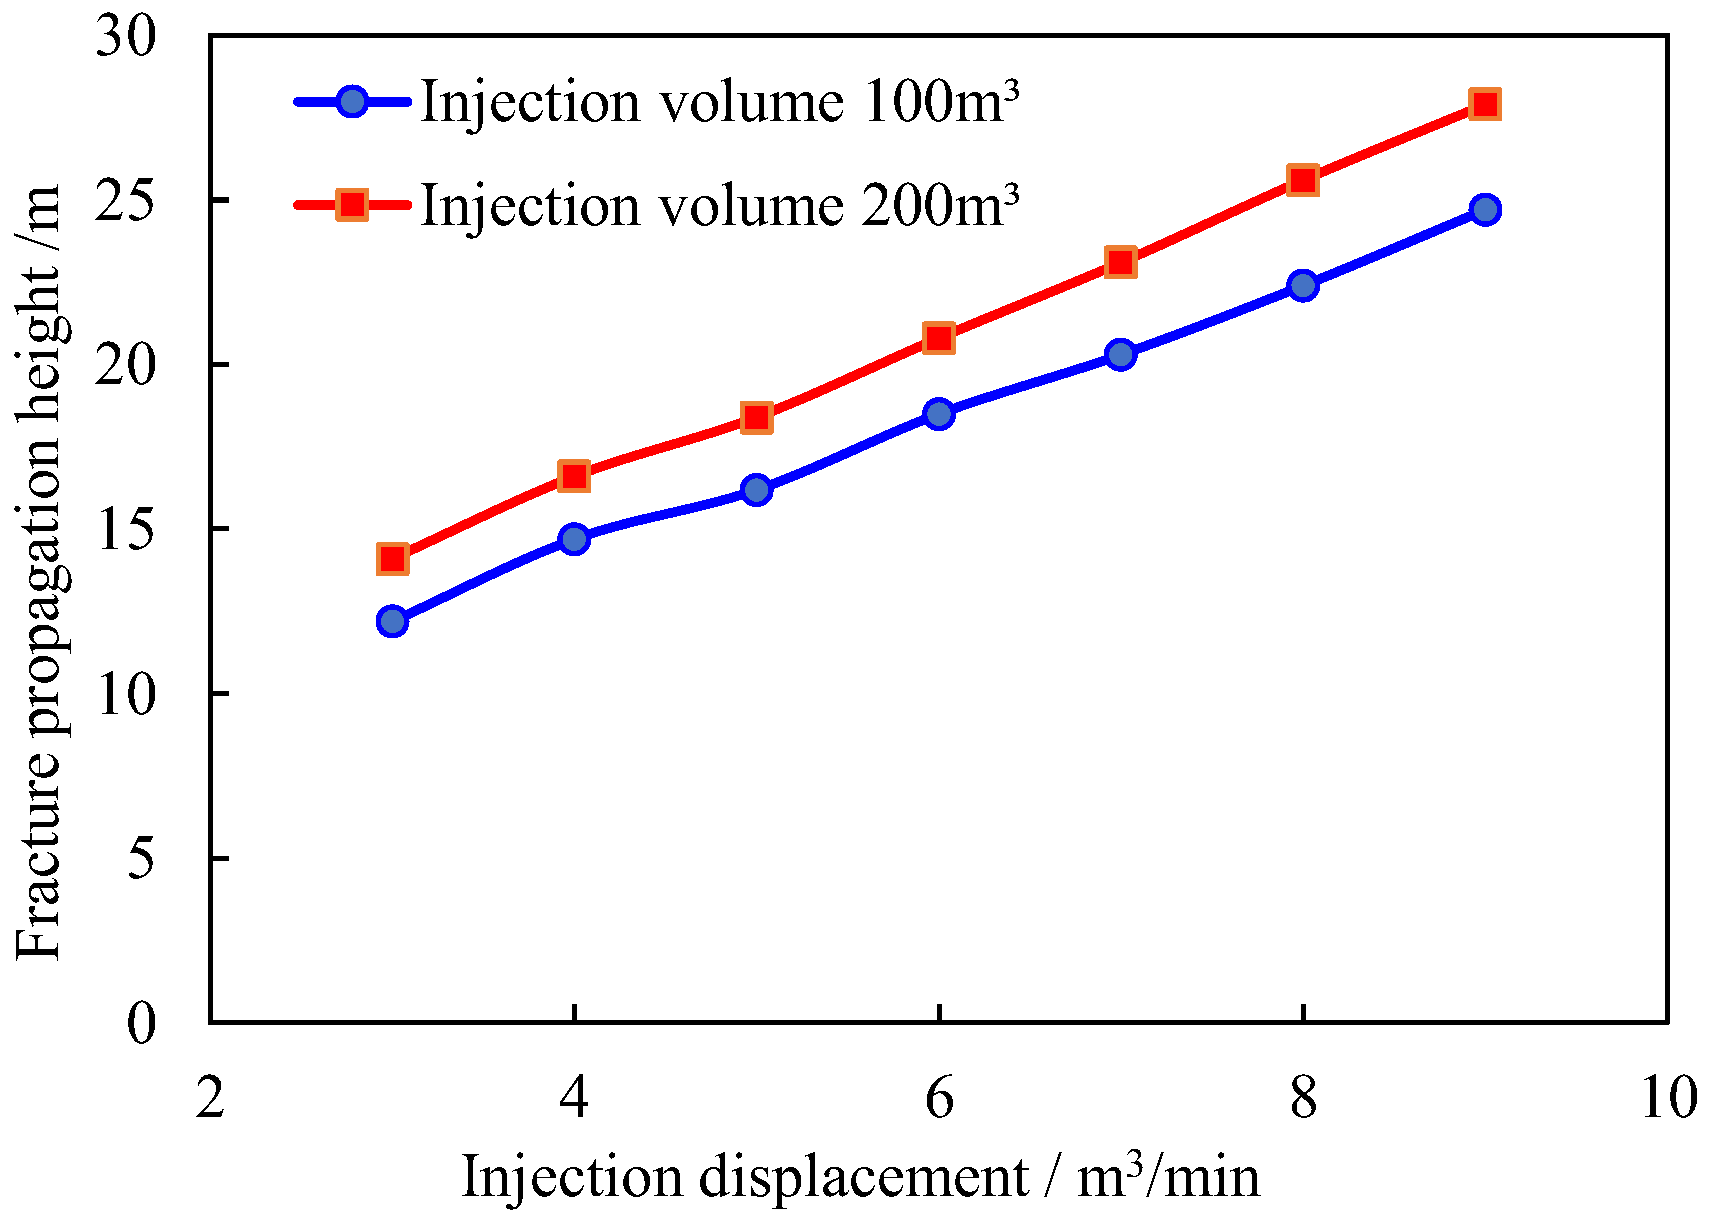
The viscosity of the acid solution is 0.035 Pa·s for a stress difference of 4 MPa between the reservoir and the interlayer. The elastic modulus of each layer is 38.7 Gpa, and the effect of injection displacement on fracture height is simulated. The larger the injection displacement, the larger the expansion of the fracture height and the higher the required water avoidance height. At injection displacements of 3.5 m
3/min, 5.0 m
3/min, 7.0 m
3/min, and 9.0 m
3/min, the water avoidance height needs to reach 10 m, 20 m, 30 m, and 30 m, respectively, in order to avoid the spreading of the fracture height towards the gas–water interface (
Figure 5).
4.3.2. The Viscosity of Acid Solution
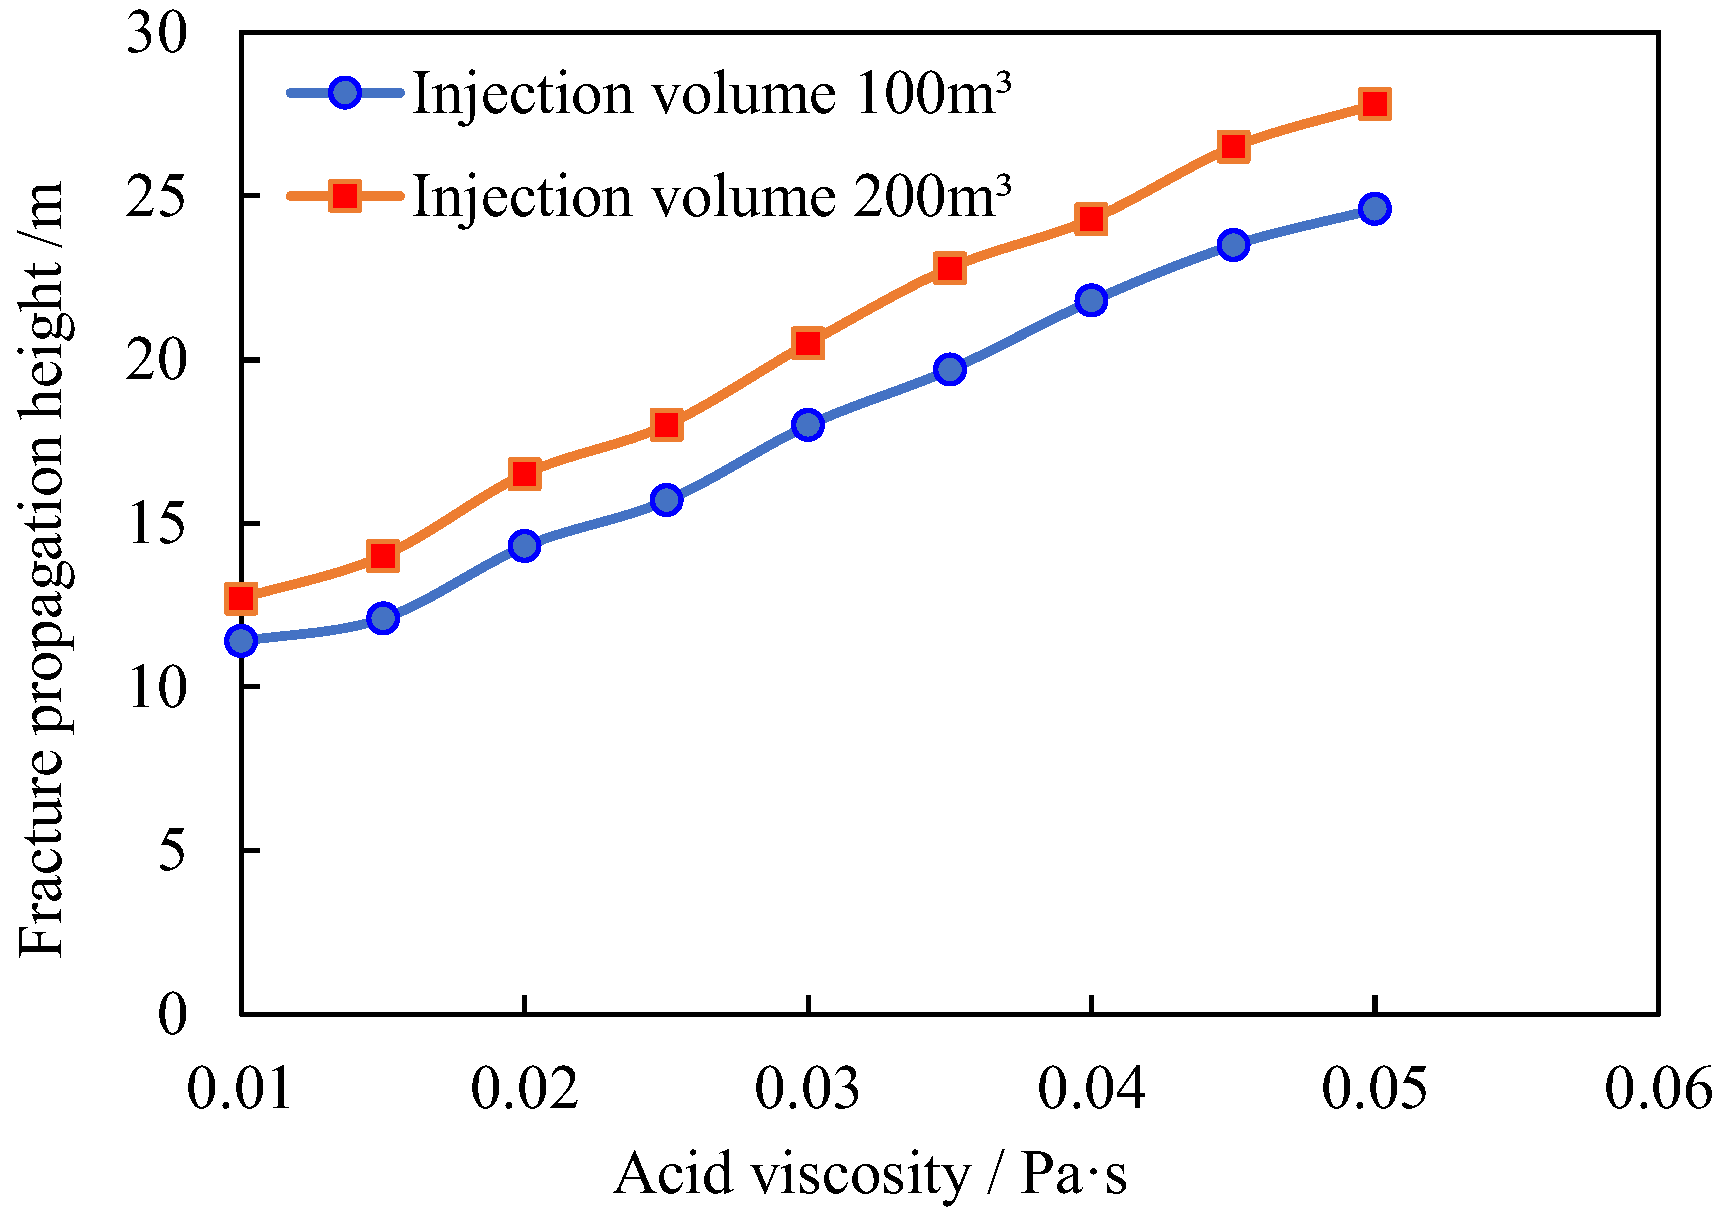
If the stress difference between the interlayer and the reservoir is equal to 4 MPa, and the injection rate is 5.0 m
3/min, the elastic modulus of the reservoir is 38.7 GPa, and the elastic modulus of the interlayer is 43.7 GPa; the variation in the height of the fracture bottom with the viscosity of the acid-fracturing liquid is shown in
Figure 6 under the conditions of injection volumes equal to 100 m
3 and 200 m
3, respectively. As the viscosity of the acid solution increases, the height of the acid fracture increases, requiring an increase in the height of the water avoidance at this time. Under fixed parameters, if the water avoidance height is less than 30 m, the volume of injected acid pressure liquid is less than 200 m
3. During construction, the impact of the aquifer may not be considered. If the viscosity of the acid is high, it is necessary to reduce the scale and ejection rate of the acid to avoid excessive extension of the fracture height, as is shown in
Figure 6.
4.3.3. Scale of Acid Solution
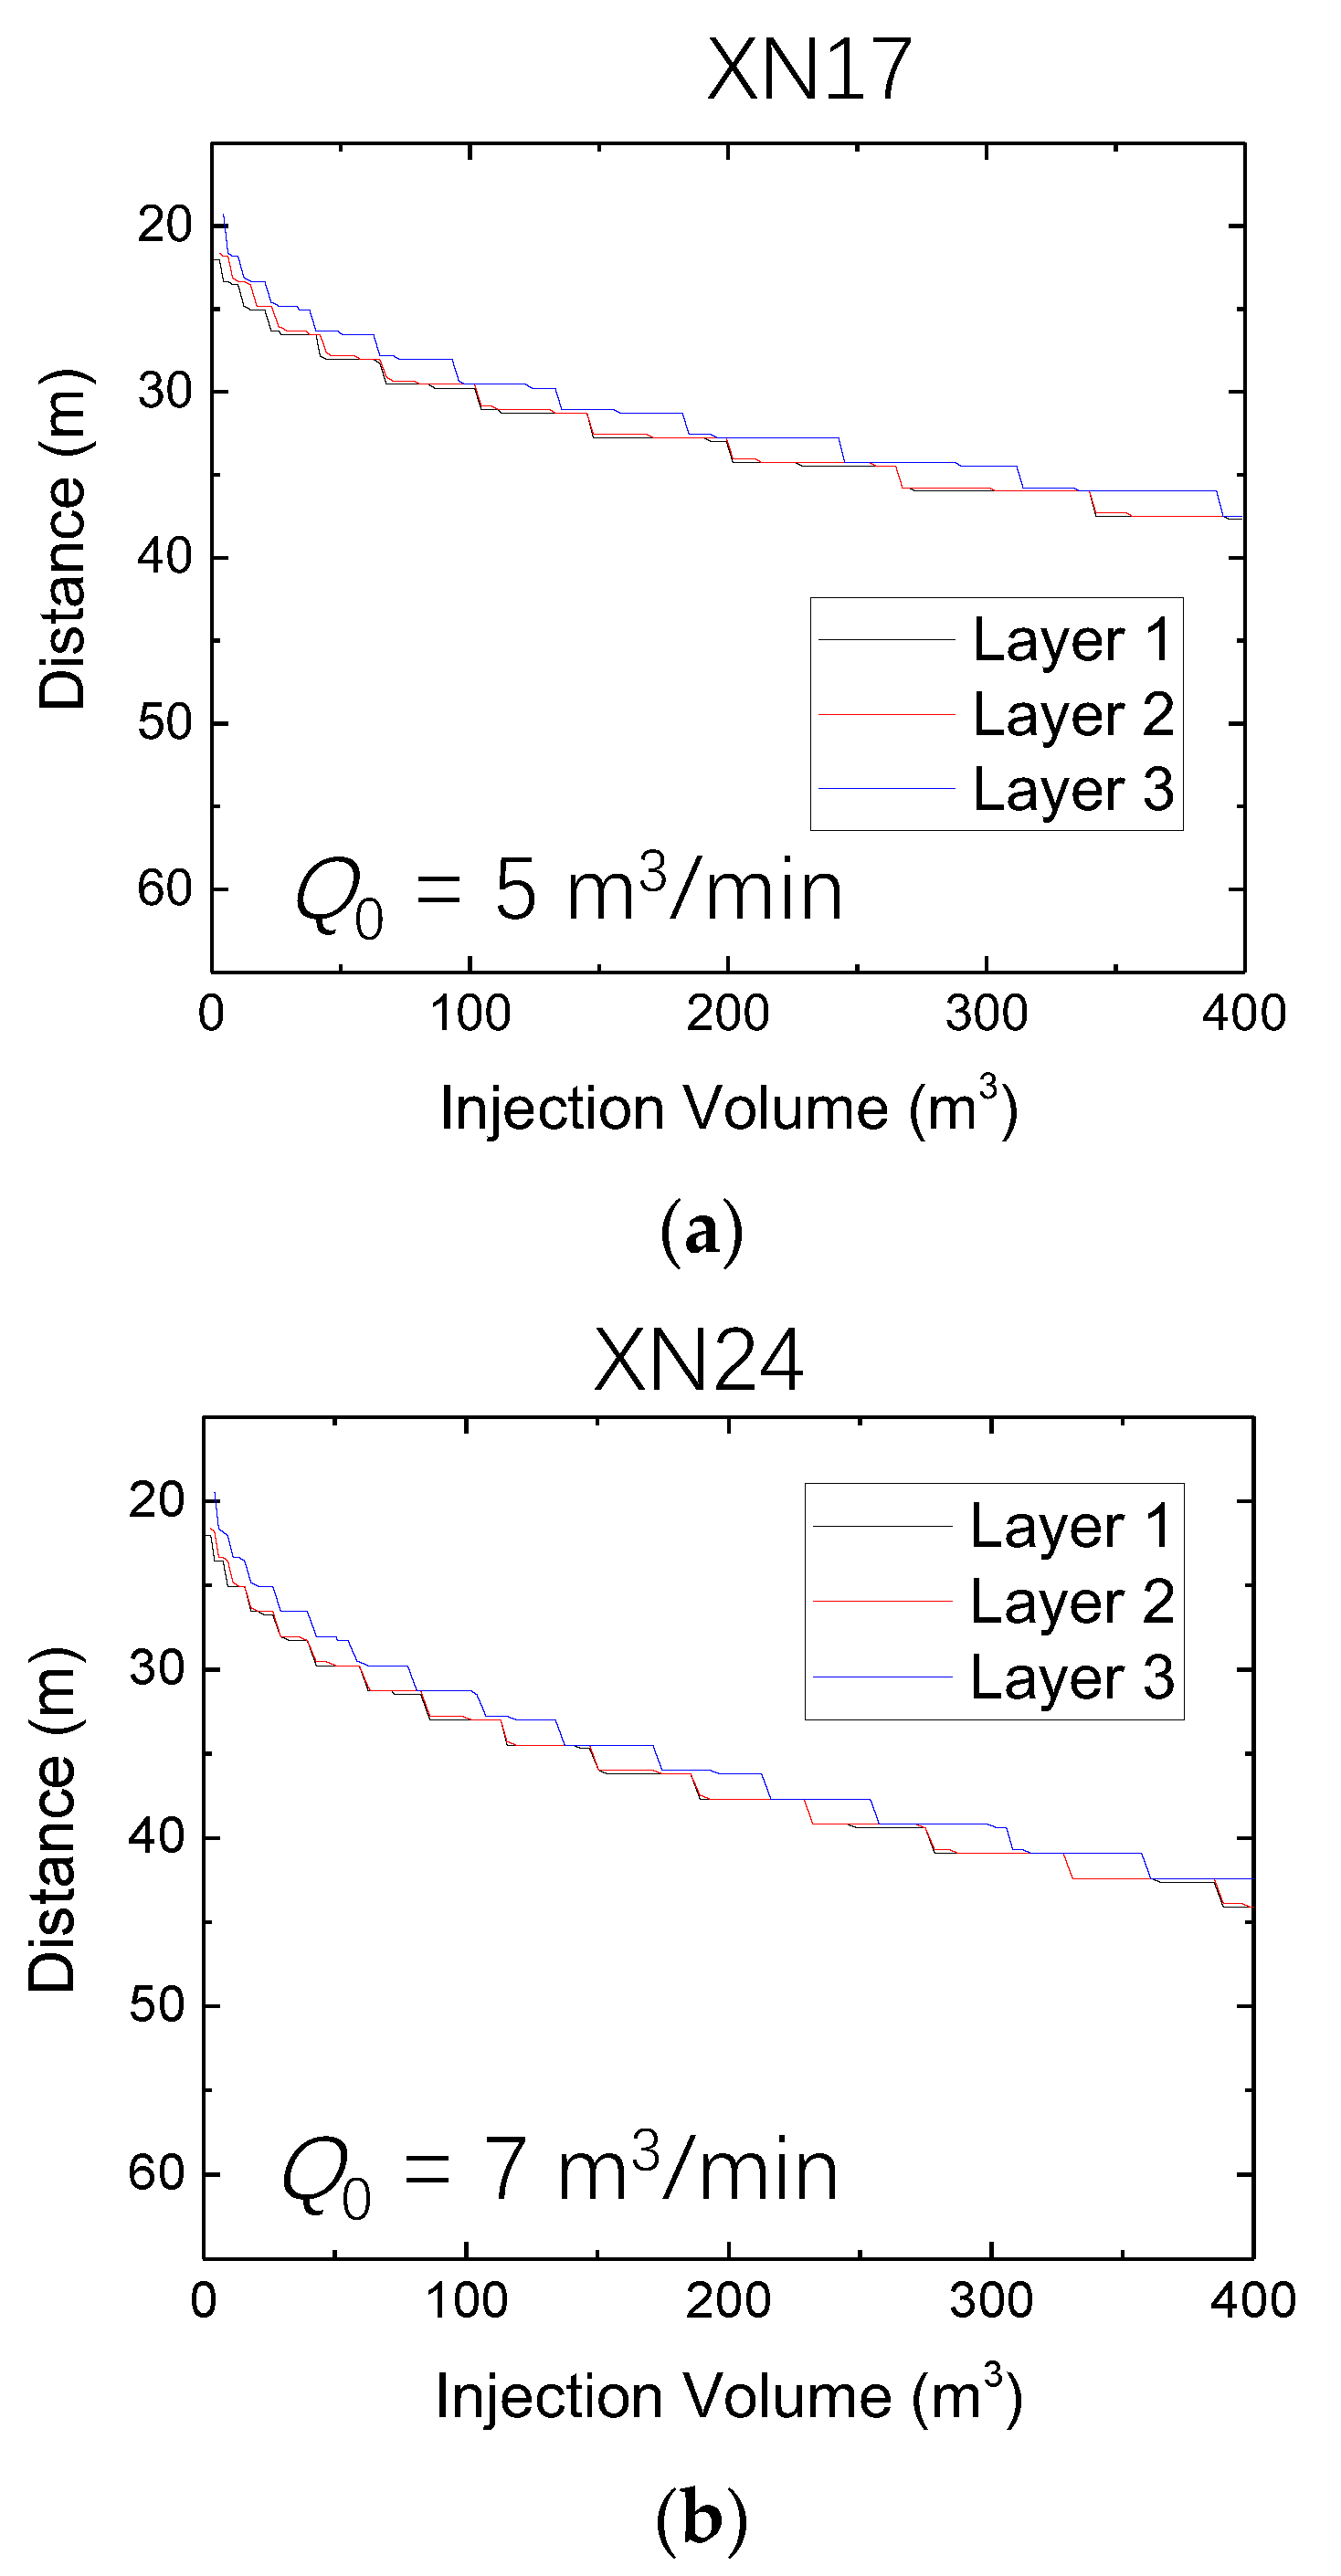
If the stress difference between the interlayer and the reservoir is 4 MPa, the injection rates are 5.0 and 7.0 m
3/min, the elastic modulus of the reservoir is 38.7 GPa, and the elastic modulus of the interlayer is 43.7 GPa, then the height of the bottom of the fracturing fracture changes with the injection scale of the acid under the condition of increasing the acid scale, as shown in
Figure 7. As the acid increases in size, the height of the acid break increases. Under fixed parameters, if the water avoidance height is less than 30 m, the scale of the acid solution should be controlled at 200 m
3 within, and the pumping displacement should be less than 5.0 m
3/min to avoid excessive extension of fractures.
4.4. Control Measures for the Height of Acid Fractures
Based on the simulation results of the distribution of ground stress field in the second section of the lamp and the analysis of factors affecting the height extension of acid-fracturing fractures, the height prediction of acid-fracturing fractures under different acid-fracturing design parameters was carried out. Based on the distance between the modified layers of the bottom-water gas reservoir and the gas–water interface, the acid-fracturing design parameters were optimized, and the high-acid-fracturing technology for controlling fractures under different geological characteristics and its optimized design parameters were obtained.
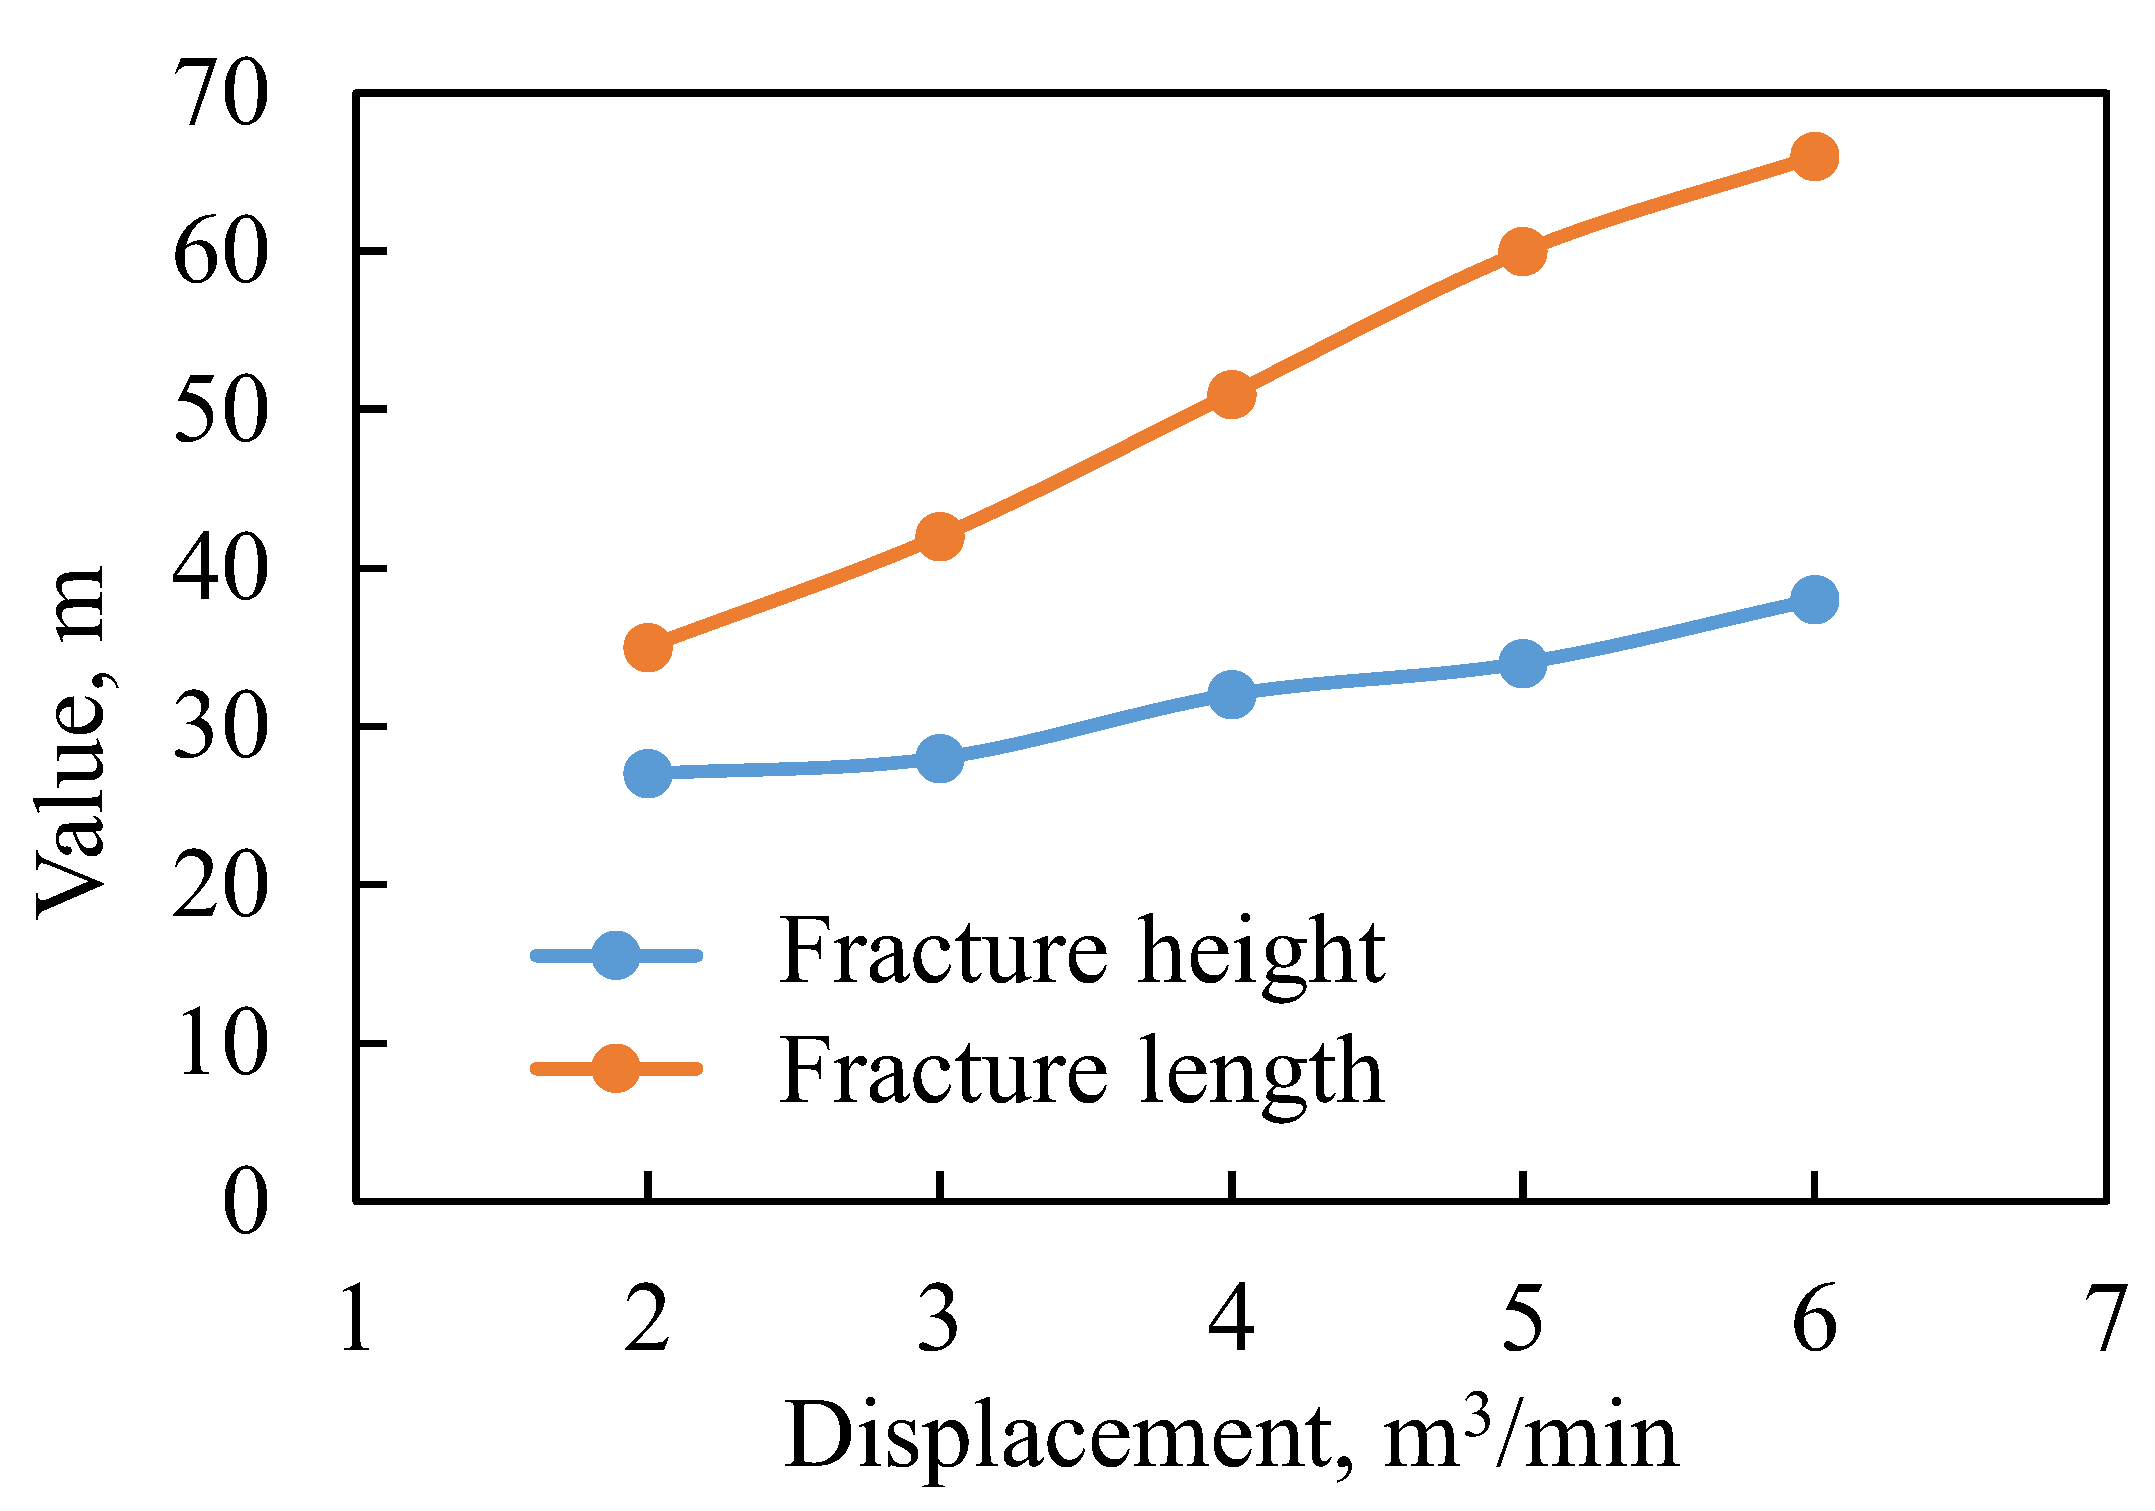
Based on rock mechanics experimental data, the relationship between construction displacement and joint height is simulated through software. Set a scale of 200 m
3 and a displacement of 2.0–6.0 m
3/min to obtain a distance of more than 30 m from the gas–water interface, without considering the impact of displacement (
Figure 8).
Based on the results of numerical simulations, we have optimized the design parameters for acid fracture to achieve a specific height for water avoidance, as shown in
Table 4.
When the stress difference between the reservoir and the interlayer is 2 MPa and the acid volume is 100 m3, the fracture height can expand up to 40 m. When the stress difference between the reservoir and the interlayer is less than 2 MPa, acid fracturing is not recommended. For a stress difference between the reservoir and the interlayer of 2–3 MPa and an acid volume of 200 m3, increasing the injection rate and viscosity leads to an increase in fracture height. Using an acid volume of less than 100 m3 is recommended. When the pressure difference between the reservoir and the interlayer is between 3 and 4 MPa, the acid solution should be limited to a scale of 100 m3 to control the fracture height. The excessive expansion of the fracture height can be controlled by decreasing the injection displacement and using a lower acid viscosity. The fracture height should not exceed 40 m when the pressure difference between the reservoir and the interlayer is 4–5 MPa, the injection displacement is 9.0 m3/min, and the acid volume is 200 m3. Deep acid fracturing is recommended when the stress difference between the reservoir and the interlayer is greater than 5 MPa.
5. Conclusions
The results presented in this paper explore the control of fracture opening and seam height from a geological design perspective. A partial safety estimate can determine whether the fracture has reached the aquifer in cases where acid etching has increased the fracture opening. Controlling the slit height can be achieved by reducing the volume of injected water and adjusting the scale appropriately.
It has also been shown that the interlayer modulus affects the deflection and expansion of the fracture. With a larger interlayer modulus, the expansion of the fracture toward the aquifer accelerates as the fracture width decreases. Conversely, if the interlayer modulus is smaller (but still larger than the modulus of the reservoir), the required amount of fluid injection will increase accordingly. This holds under the same conditions of displacement, time, filtration rate, and fracture toughness.
When the injection volume of the acid-fracturing fluid is 200 m3 and the maximum stress difference between the interlayer and reservoir is 4 MPa, the choice of water avoidance height should be based on the consideration of various parameters including the variation characteristics of injection time and wellhead injection pressure, as well as the product of Q0 and μ. If the injection rate Q0 is relatively high (such as 7.0–9.0 m3/min), fractures may reach the aquifer.
In order to improve future work in this area, it is important to describe the relationship between different parameters more explicitly. It is also important to identify the applicability and limitations of the method and possible future research directions. In addition, for layers with a water avoidance height less than 10 m and good natural crack development, this technology cannot meet the requirement that acid-fracturing cracks do not communicate with the lower water layer. Therefore, it is necessary to carry out new research to overcome the acid-fracturing technology of controlling crack height under more stringent geological conditions.
Author Contributions
Y.F.: Conceptualization, funding acquisition, project administration, resources, and software. S.L.: Data curation, formal analysis, methodology, writing—original draft, and writing—review and editing. Y.G.: Data curation and writing—review and editing. Y.W.: Project administration and resources. T.H.: Investigation, methodology, software, and visualization. H.Z. and X.Z.: Conceptualization, funding acquisition, and methodology. J.Y. and W.C.: Investigation, methodology, and project administration. All authors have read and agreed to the published version of the manuscript.
Funding
This work was supported by the 2022 PetroChina Gas Reservoir Evaluation Project “Research on Reservoir Reconstruction Technology of the Second Bottom Water Gas Reservoir of Lamp in Anyue Gas Field”.
Data Availability Statement
Data are contained within the article.
Acknowledgments
The authors are grateful for the support of the National Natural Science Foundation of China. Thanks to the reviewers and editors for their careful review of this manuscript.
Conflicts of Interest
Authors Song Li, Yu Fan, Yang Wang, Tingting He, Jiexiao Ye and Weihua Chen were employed by the Engineering Research Institute of Petrochina Southwest Oil and Gas Field Company; Author Yujie Guo was employed by the PetroChina Changqing Oilfield Company; Author Hua Zhang was employed by the Development Division of Petrochina Southwest Oil and Gas Field Company. The remaining authors declare that the research was conducted in the absence of any commercial or financial relationships that could be construed as a potential conflict of interest.
References
- Warpinski, N.; Mayerhofer, M.; Vincent, M.; Cipolla, C.; Lolon, E. Stimulating unconventional reservoirs: Maximizing network growth while optimizing fracture conductivity. J. Can. Pet. Technol. 2009, 48, 39–51. [Google Scholar] [CrossRef]
- Zhang, L.; Wang, H.; Zhou, F.; Mou, J. Numerical Simulation of Wormhole Propagation with Foamed-Viscoelastic-Surfactant Acid in Carbonate Acidizing. Processes 2023, 11, 1839. [Google Scholar] [CrossRef]
- Xiao, Y.; Wang, H.; Guo, J.; Lu, L.; Cheng, Y.; Chen, M.; Fan, F.; Xue, H. Acid fracturing was selected to stimulate the potential production in low permeability reservoirs in Ahdeb Oilfield, Iraq. In Proceedings of the SPE Middle East Oil and Gas Show and Conference, Manama, Bahrain, 18–21 March 2019; OnePetro: Richardson, TX, USA, 2019. [Google Scholar]
- Zou, J.; Zhang, Y.; Zhang, L.; Jing, J.; Fu, Y.; Wang, Y.; Zhang, G.; Zhou, F. Numerical simulation research on the effect of artificial barrier properties on fracture height. Processes 2023, 11, 310. [Google Scholar] [CrossRef]
- Guo, T.; Gong, F.; Lin, X.; Lin, Q.; Wang, X. Experimental investigation on damage mechanism of guar gum fracturing fluid to low-permeability reservoir based on nuclear magnetic resonance. J. Energy Resour. Technol. 2018, 140, 072906. [Google Scholar] [CrossRef]
- Jia, Y.; Lu, Z.; Xiong, Q.; Hampton, J.C.; Zhang, Y.; He, P. Laboratory characterization of cyclic hydraulic fracturing for deep shale application in Southwest China. Int. J. Rock Mech. Min. Sci. 2021, 148, 104945. [Google Scholar] [CrossRef]
- Wei, W.; Varavei, A.; Sepehrnoori, K. Modeling and analysis on the effect of two-phase flow on wormhole propagation in carbonate acidizing. SPE J. 2017, 22, 2067–2083. [Google Scholar] [CrossRef]
- Hao, T.; Qu, Z.; Guo, T.; Chen, M.; Qi, N.; Ge, J.; Mu, S.; Zhang, X. A novel fracturing technology with significant downward propagation of fracture in ultra-deep reservoir. In Proceedings of the ARMA/DGS/SEG International Geomechanics Symposium (pp. ARMA-IGS), Virtual, 1–4 November 2021; ARMA: Overland Park, KS, USA, 2021. [Google Scholar]
- Yudin, A.; El Sebaee, M.; Stashevskiy, V.; Al Baik, A.; AlJanahi, A.; Abdelrady, S.; Darwish, S.; Al Askari, N. Fracturing height growth restriction technique successfully extended into horizontal wells in Ostracod formation. In Proceedings of the SPE International Hydraulic Fracturing Technology Conference and Exhibition, Muscat, Oman, 11–13 January 2022; p. D021S006R003. [Google Scholar]
- Luo, S.; Zhao, Y.; Zhang, L.; Chen, Z.; Zhang, X. Integrated simulation for hydraulic fracturing, productivity prediction, and optimization in tight conglomerate reservoirs. Energy Fuels 2021, 35, 14658–14670. [Google Scholar] [CrossRef]
- Settgast, R.R.; Johnson, S.; Fu, P.; Walsh, S.; White, J. Simulation of hydraulic fracture networks in three dimensions. In Proceedings of the Thirty Seventh Workshop on Geothermal Reservoir Engineering, Stanford, CA, USA, 30 January–1 February 2012. [Google Scholar]
- Alekseenko, O.P.; Potapenko, D.I.; Cherny, S.G.; Esipov, D.V.; Kuranakov, D.; Lapin, V. 3D Modeling of fracture initiation from perforated non cemented wellbore. SPE J. 2012, 18, 589–600. [Google Scholar] [CrossRef]
- Tan, P.; Pang, H.; Zhang, R.; Jin, Y.; Zhou, Y.; Kao, J.; Fan, M. Experimental investigation into hydraulic fracture geometry and proppant migration characteristics for southeastern Sichuan deep shale reservoirs. J. Pet. Sci. Eng. 2020, 184, 106517. [Google Scholar] [CrossRef]
- Tan, P.; Jin, Y.; Pang, H.W. Hydraulic fracture vertical propagation behavior in transversely isotropic layered shale formation with transition zone using XFEM-based CZM method. Eng. Fract. Mech. 2021, 248, 107707. [Google Scholar] [CrossRef]
- Hou, B.; Chen, M.; Diao, C.; Li, L.C.; Cheng, M.J. True Triaxial experimental study of hydraulic Fracture penetrating sand and mud interbedding in deviated wellbore. Sci. Technol. Eng. 2015, 15, 54–59. [Google Scholar]
- Hou, B.; Chen, M.; Li, Z.; Wang, Y.; Diao, C. Propagation area evaluation of hydraulic fracture networks in shale gas reservoirs. Pet. Explor. Dev. 2014, 41, 833–838. [Google Scholar] [CrossRef]
- Fu, H.F.; Cai, B.; Xiu, N.L.; Wang, X.; Liang, T.; Liu, Y.; Yan, Y. The study of hydraulic fracture vertical propagation in unconventional reservoir with beddings and field monitoring. Nat. Gas Geosci. 2021, 32, 1610–1621. [Google Scholar]
| Disclaimer/Publisher’s Note: The statements, opinions and data contained in all publications are solely those of the individual author(s) and contributor(s) and not of MDPI and/or the editor(s). MDPI and/or the editor(s) disclaim responsibility for any injury to people or property resulting from any ideas, methods, instructions or products referred to in the content. |
© 2024 by the authors. Licensee MDPI, Basel, Switzerland. This article is an open access article distributed under the terms and conditions of the Creative Commons Attribution (CC BY) license (https://creativecommons.org/licenses/by/4.0/).

 ,
, 


