Article

Study of Acid Fracturing Strategy with Integrated Modeling in Naturally Fractured Carbonate Reservoirs

1
Petroleum Engineering Technology Research Institute, Northwest Oilfield Branch Company—Sinopec, Urumqi 830011, China
2
National Key Laboratory of Fractured Reservoirs Developing and Exploiting, Northwest Oilfield Branch Company—Sinopec, Urumqi 830011, China
3
School of Petroleum Engineering, Southwest Petroleum University, Chengdu 610500, China
4
National Key Laboratory of Oil and Gas Reservoir Geology and Exploitation, Southwest Petroleum University, Chengdu 610500, China
*
Author to whom correspondence should be addressed.
Processes 2024, 12(4), 808; https://doi.org/10.3390/pr12040808
Submission received: 10 March 2024 / Revised: 10 April 2024 / Accepted: 15 April 2024 / Published: 17 April 2024
(This article belongs to the Special Issue Advanced Fracturing Technology for Oil and Gas Reservoir Stimulation)

Abstract

:
Natural fractures and wormholes strongly influence the performance of acid fracturing in naturally fractured carbonate reservoirs. This work uses an integrated model to study the effects of treatment parameters in acid fracturing in different reservoir conditions. Hydraulic fracture propagation, wormhole propagation, complex fluid leak-off mediums, and heat transfer are considered in the modeling. The model is validated in several steps by analytical solutions. The simulation results indicated that natural fractures and wormholes critically impact acid fracturing and can change the predicted outcomes dramatically. The high permeability reservoirs with conductive natural fractures or low permeability reservoirs with natural fracture networks showed the highest stimulation potential in applying acid fracturing technology. The optimal acid injection rate depends on natural fracture geometry and reservoir permeability. This study also observed that obtaining a high production index is difficult because natural fractures and wormholes reduce the acid efficiency during acid fracturing. Building an acid-etched fracture system consisting of acid-etched natural fractures and hydraulic fractures may help us better stimulate the naturally fractured carbonate reservoirs. The paper illustrates a better understanding of the effects of the treatment design parameters on productivity. It paves a path for the optimal design of acid fracturing treatment for heterogeneous carbonate reservoirs.

1. Introduction

Carbonate reservoirs play a critical role in global hydrocarbon resources. Approximately 70% of the world’s oil and gas resources are associated with carbonate reservoirs. These reservoirs are predominantly composed of carbonate rock. The main carbonate oil and gas production areas are distributed across regions, including the Middle East, North America, and Central Asia. These regions hold 96.8% of the world’s recoverable carbonate rock oil and gas reserves (Li et al., 2018) [1]. Natural fractures are widely developed within these reservoirs, significantly influencing the flow capacity of the reservoirs [2,3,4,5]. However, they also lead to extensive filtration during the stimulation process, making hydraulic fracturing in such reservoirs prone to sand blockage, leading to construction failure. So, acid fracturing has become the common well stimulation technique mainly applied to these reservoirs.
After years of development, the current acid fracturing technique has evolved into a modified process system composed of multiple working fluids and technical measures. Usually, a non-reactive viscous fluid (i.e., pad) is injected at high pressure to break the formation and create the fracture. Then, acid is injected after the pad fluid or as the first stage to etch the fracture walls in non-uniform patterns (Figure 1). Finally, slick water is injected as a final post-flush stage to reduce corrosion on downhole equipment and push the acid further into the fracture. After injection shutdown, the fracture faces do not entirely close because channels and asperities are created at the fracture faces. This provides a conductive path along which the reservoir fluid flows to the wellbore (Aljawad et al., 2019) [6].
During acid fracturing, the reactivity of the acid can lead to excessive fluid loss by creating wormholes and activating natural fractures, resulting in a significant decrease in the effective acid-etched fracture length and conductivity. However, at the same time, the acid filtrates into the natural fractures, which will also etch the walls of the natural fractures, increase the conductivity of the natural fractures, and form a relatively complex fracture network with the acid-etched artificial fracture. Under the influence of the above two processes, how to optimize acid fracturing parameters to obtain better simulation results is a very interesting question.
However, there is only a limited number of publications on acid fracturing simulation in naturally fractured carbonate reservoirs. Mou et al. (2012) [7] developed a mathematical model that assumed several natural fractures intersected with a fixed hydraulic fracture. The acid filtrated into the matrix through hydraulic fracture surfaces, and natural fractures were both considered. They revealed that the natural fracture width and density increased the acid leak-off. However, the effects of natural fracture leak-off on the acid etching were not studied. Recently, Ugursal et al. (2019) [8] presented a model that predicted acid fracturing performance in naturally fractured carbonate reservoirs. The fixed hydraulic fracture, which intersected by several transverse symmetric natural fractures, was also adopted in this model. Acid transport and acid/rock reaction in hydraulic and natural fractures were considered. This study revealed that the initial natural fracture width had a negligible effect on hydraulic fracture conductivity. Still, a higher initial natural fracture width led to stronger acid etching in natural fractures. Meanwhile, hydraulic and natural fracture conductivities increased as the acid injection rate increased. However, the effect of natural fractures on the hydraulic fracture geometry has yet to be fully understood, and the temperature is not considered in this model. To accurately assess the role of natural fractures during acid fracture, it is essential to investigate the effect of natural fracture properties on hydraulic fracture geometry.
When acid filtrates into the matrix, it dissolves the rock near fracture surfaces and creates wormholes. Early research (Hawkins, 1956) [9] showed that the length of the wormhole region is the most critical parameter that affects the acid leak-off. Until now, several models have been developed to predict wormhole propagation in carbonate reservoirs. However, only a few publications have considered wormholes during acid fracturing simulation. A recent review (Akanni et al., 2015) [10] listed seven different models, among which the two-scale continuous model is the most promising one to predict the propagation of wormholes [11,12,13,14,15], but it is also too computationally expensive to be used in the acid fracturing design. Dang et al. (2018) [16] presented a model that coupled a fixed hydraulic fracture with a two-scale continuous model. A simulation was carried out in a small reservoir domain with a width of less than 0.5 m. The results showed that the considering wormholes led to an uneven leak-off velocity profile caused by porosity heterogeneity and significantly reduced the acid penetration distance. However, parametric analysis was not carried out in this research. The semi-empirical model is a much better choice in field practice. This model predicts the propagation rate of the wormhole region instead of individual wormhole characteristics. The most famous ones include the volumetric model (Economides et al., 1993) [17], the Buijse and Glasbergen model (Buijse et al., 2005) [18], and the Furui model (Furui et al., 2012) [19]. Hill et al. (1995) [20] presented a leak-off model with a wormhole effect by combining Carter’s leak-off model and the volumetric model. The results showed that the impact of wormholes on the overall fluid-loss coefficient is significant during acid fracturing in limestone reservoirs. These authors illustrate that it is essential to consider wormholes in acid fracturing simulation to obtain a more accurate conductivity profile.
Therefore, an integrated acid fracturing model for naturally fractured carbonate reservoirs was established in this study. An efficient and stable P3D fracture propagation model was adopted to calculate the hydraulic fracture geometry. A semi-empirical model was combined to calculate the leak-off change caused by wormholing. This model also accounts for acid flow, energy transfer, acid/rock reaction, and width change for hydraulic and natural fractures. With this model, we studied the fluid loss characteristics of natural fractures and acid-etched wormholes during the acid fracturing process, as well as the influence of hydraulic fracture geometric characteristics, etching morphology, and natural fracture etching morphology under different fluid loss conditions (permeability, natural fracture parameters). Based on the parameters of hydraulic fractures and natural fractures calculated by the model, an acid fracturing parameter optimization method that simultaneously considers the dissolution of hydraulic and natural fractures was established. This study revealed the mechanism of how acid fracturing worked in naturally fractured carbonate reservoirs and provided an important basis for the acid fracturing design in naturally fractured carbonate reservoirs.

2. Mathematical Model
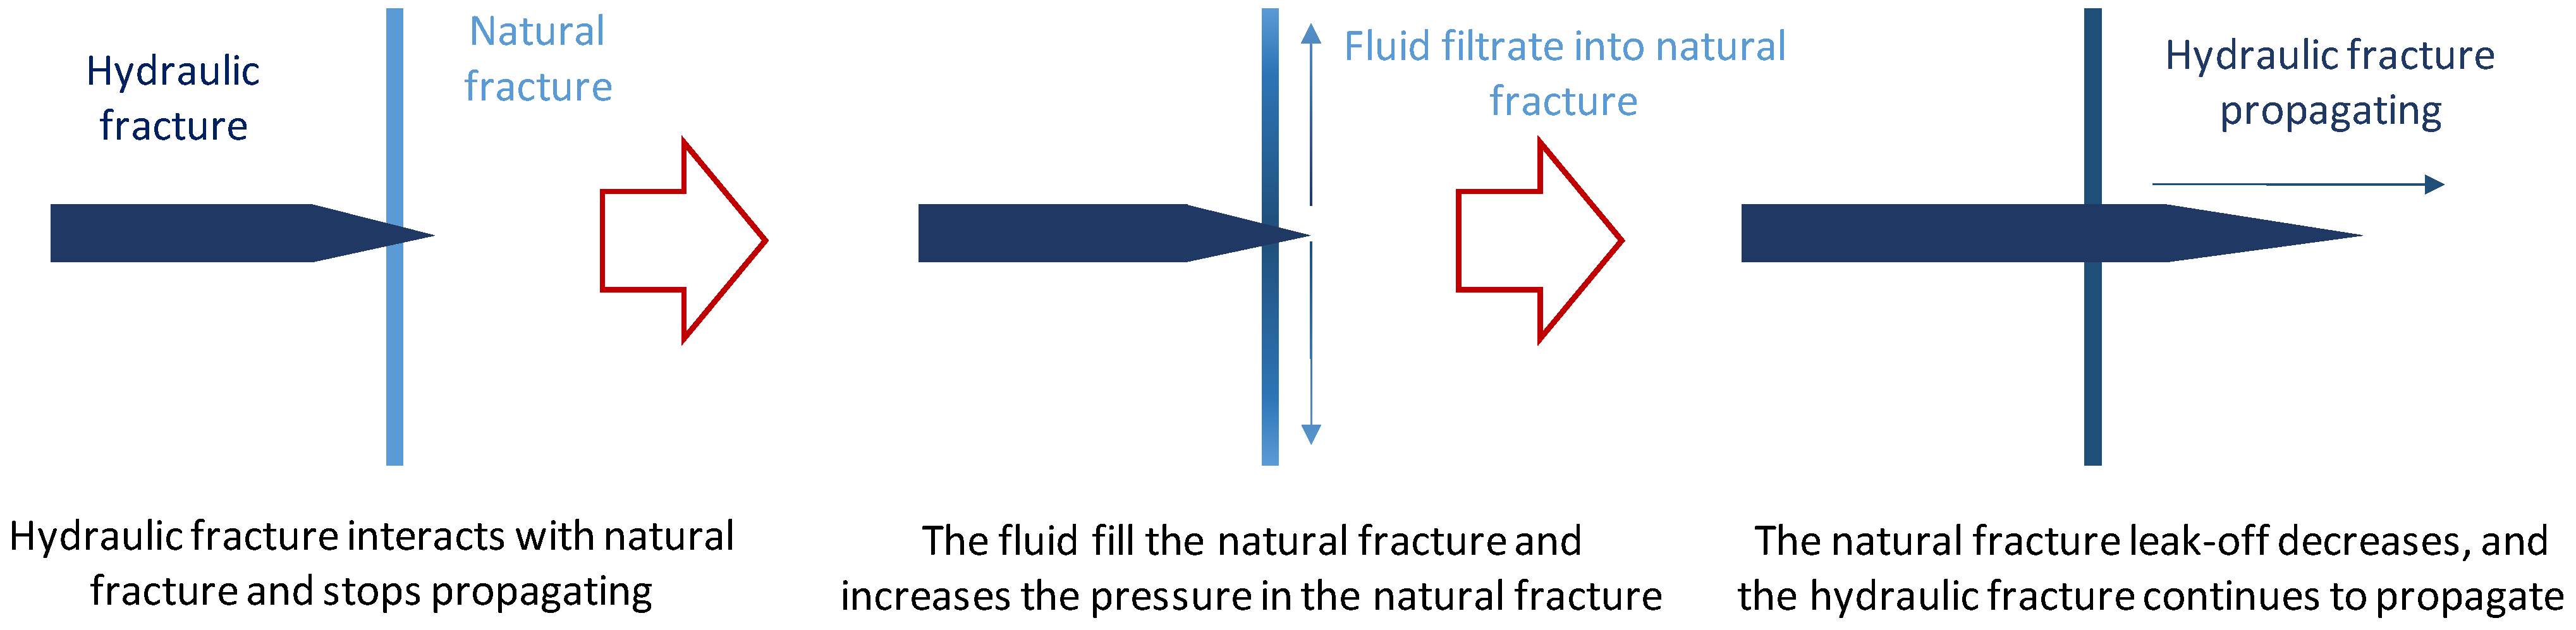
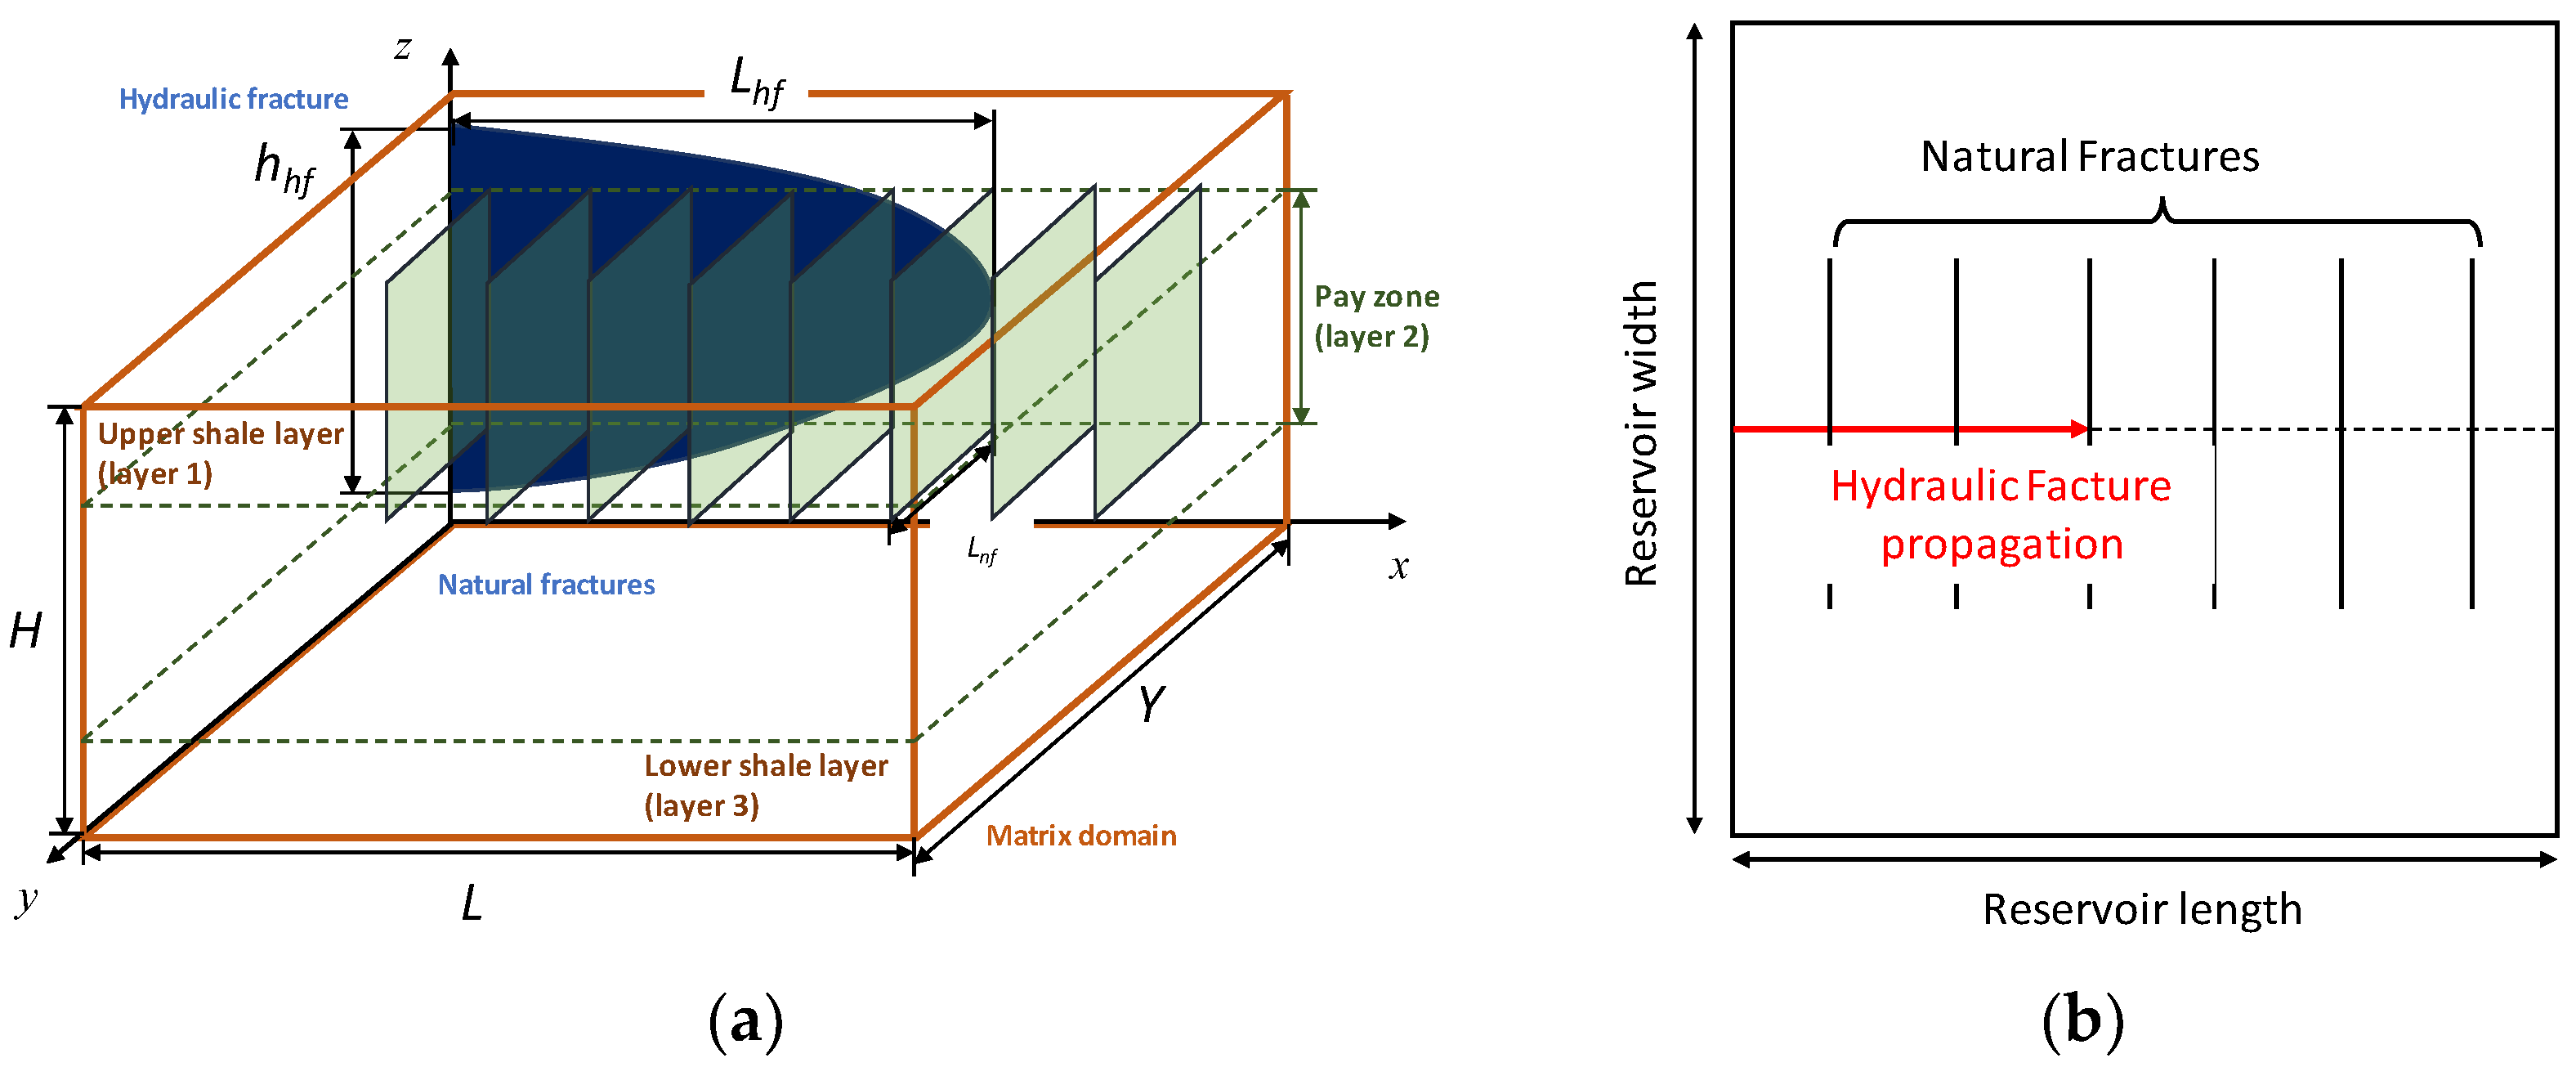
The acid fracturing process of naturally fractured carbonate reservoirs is a combined result of fracture propagation, fluid flow, heat transfer, and acid transport and reaction, a complicated physic-chemical process. The multi-field coupling process among various physical fields is shown in Figure 2. In this model, the fluid is considered incompressible Newtonian fluid and stays in a laminar flow state for the acid injection rates typically for an acid fracturing treatment. A cell-based P3D fracture propagation model is implemented to calculate the fracture geometry during the treatment. A set of symmetric transverse natural fractures intersect the hydraulic fracture propagation plane vertically, and their height is considered equal to the pay zone (Figure 3). The hydraulic fracture and natural fracture interaction is regarded as “interact–fluid fill–cross” (Figure 4).
To precisely simulate the flow progress among hydraulic fractures, natural fractures, and matrix rock, individual models have been established for each of them. The matrix domain is a rectangular solid of length L, height H, and width W, which parallels the hydraulic fracture propagation plane in the length direction. The hydraulic geometry is approximated as an elliptical channel based on the P3D fracture propagation model, and the natural fracture geometry is approximated as a channel between two parallel plates. The reservoir is simplified as a symmetrical three-layer case, and the effect of gravity on fracture propagation and fluid flow is neglected.

2.1. Geometry Model

In the P3D fracture propagation model, a hydraulic fracture is considered to propagate within a barrier–reservoir–compartment formation and is divided into multiple units along the length; fluid flow is assumed to be essentially horizontal along the length of the fracture by ignoring the flow of fluid in the height direction. The pressure distribution within the hydraulic fracture during the fluid injection process is calculated based on the material balance equation (Equation (1)), which further calculates the fracture expansion position. Then, an analytical formula (Equation (2)) is adopted to calculate the crack width distribution (Economides et al., 1989) [21]. The mass balance in the hydraulic fracture is described by the equation:
A h f u x ¯ x + 2 h h f v L , h f + A h f t = 0
where Ahf is the cross-sectional area of hydraulic fracture, m2; u x ¯ is the average flow velocity through the hydraulic fracture cross-section, m/s; hhf is the hydraulic fracture height, m; vL,hf is the fluid leak-off velocity in the hydraulic fracture, m/s.
In a symmetrical case, the stress intensity factors at the top and bottom tips (KIu and KIl) are equal. They can be simplified and written in terms of the pressure at the centerline of the hydraulic fracture pcp and the closure stresses of pay zone σpay as follows:
K I u = K I l = π h h f 2 p c p σ p a y 2 Δ σ π cos 1 h p a y h h f
where hpay is the pay zone height, m; Δσ is the stress difference between the pay zone and shale layer; pcp is the fluid pressure at the centerline of the hydraulic fracture, Pa; σpay is the closure stress of pay zone, Pa; KIu and KIl are the stress intensity factors of the top and bottom tips of the hydraulic fracture, Pa·m1/2. The width profile associated with pcp is obtained as follows:
w h f z = 4 G P cp σ 3 y h h f z + 4 π G i = 1 2 σ i + 1 σ i h i z cosh 1 z z h i h h f 2 h i h h f + h i z h i + z h h f z cos 1 h h f 2 h i h h f
where G is the shear modulus, Pa; hi is the hydraulic fracture height in the ith layer, m; σi is the closure stresses in the ith layer. When the hydraulic fracture interacts with a natural fracture, to obtain the criterion of fracture propagation, the critical stress intensity factor KIc needs to be calculated. Olson (2007) [22] provided the expressions of stress intensity factors as follows:
K I c = 0.806 E π 4 ( 1 v 2 ) Δ x w t i p
where E is Young’s modulus, Pa; wtip is the width at the tip element of the hydraulic fracture, m; v is Poisson’s ratio, dimensionless; KIc is the critical stress intensity factor, Pa·m1/2.

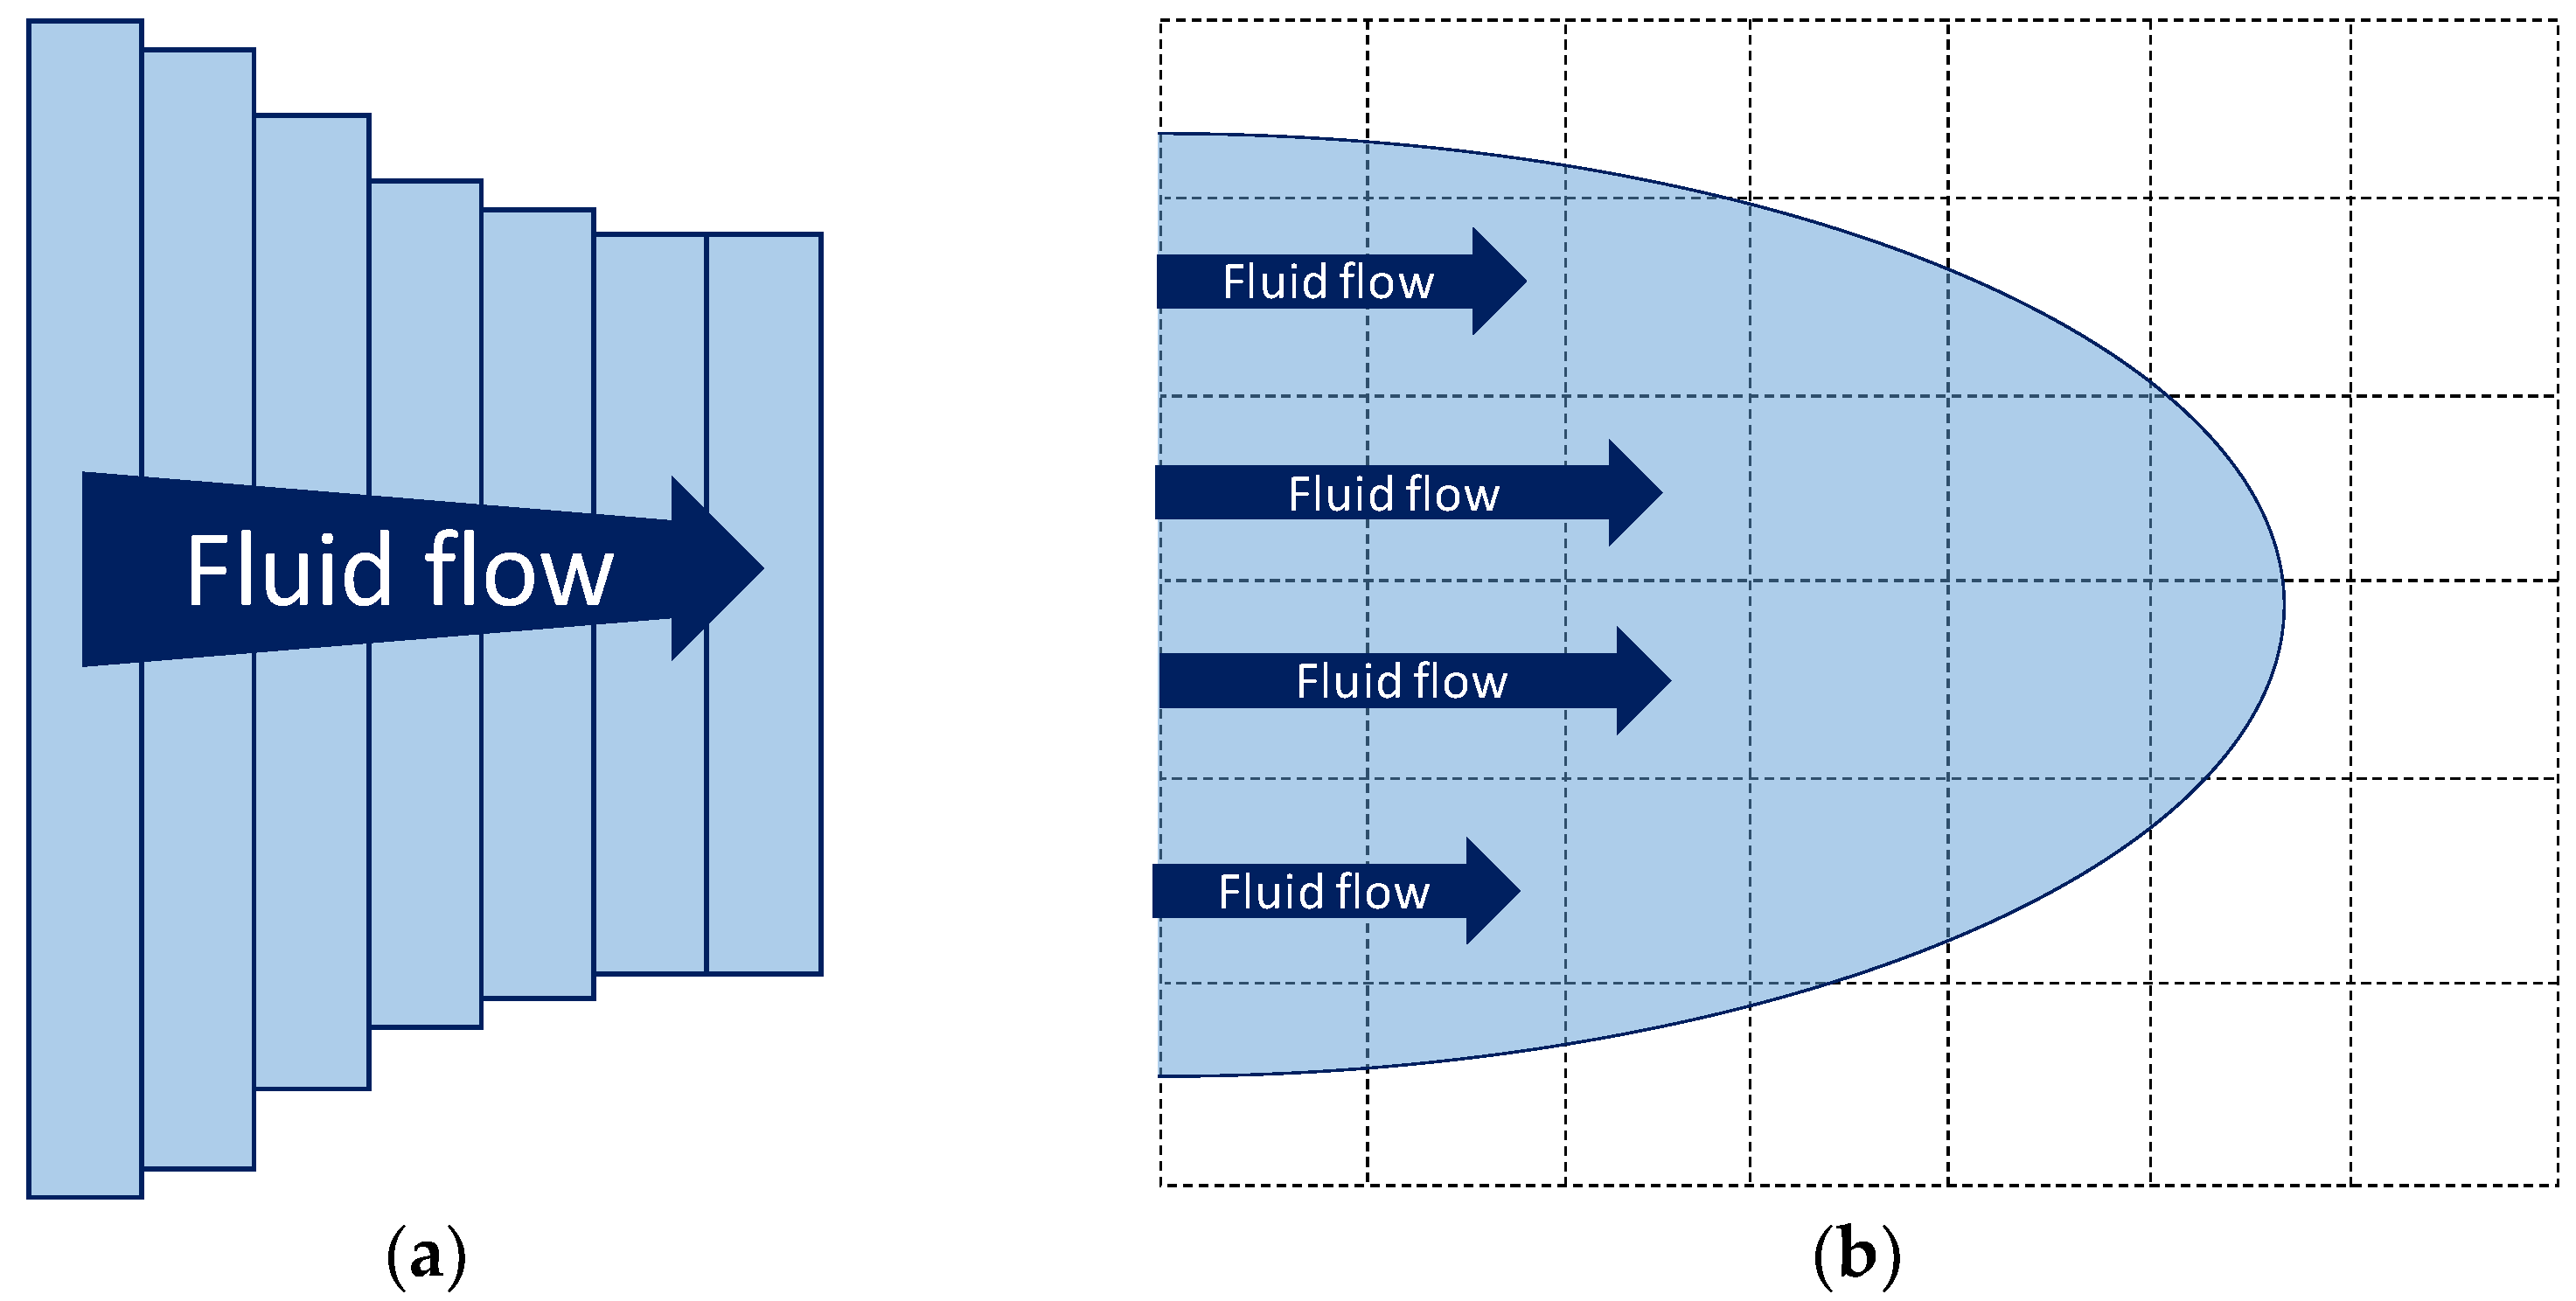
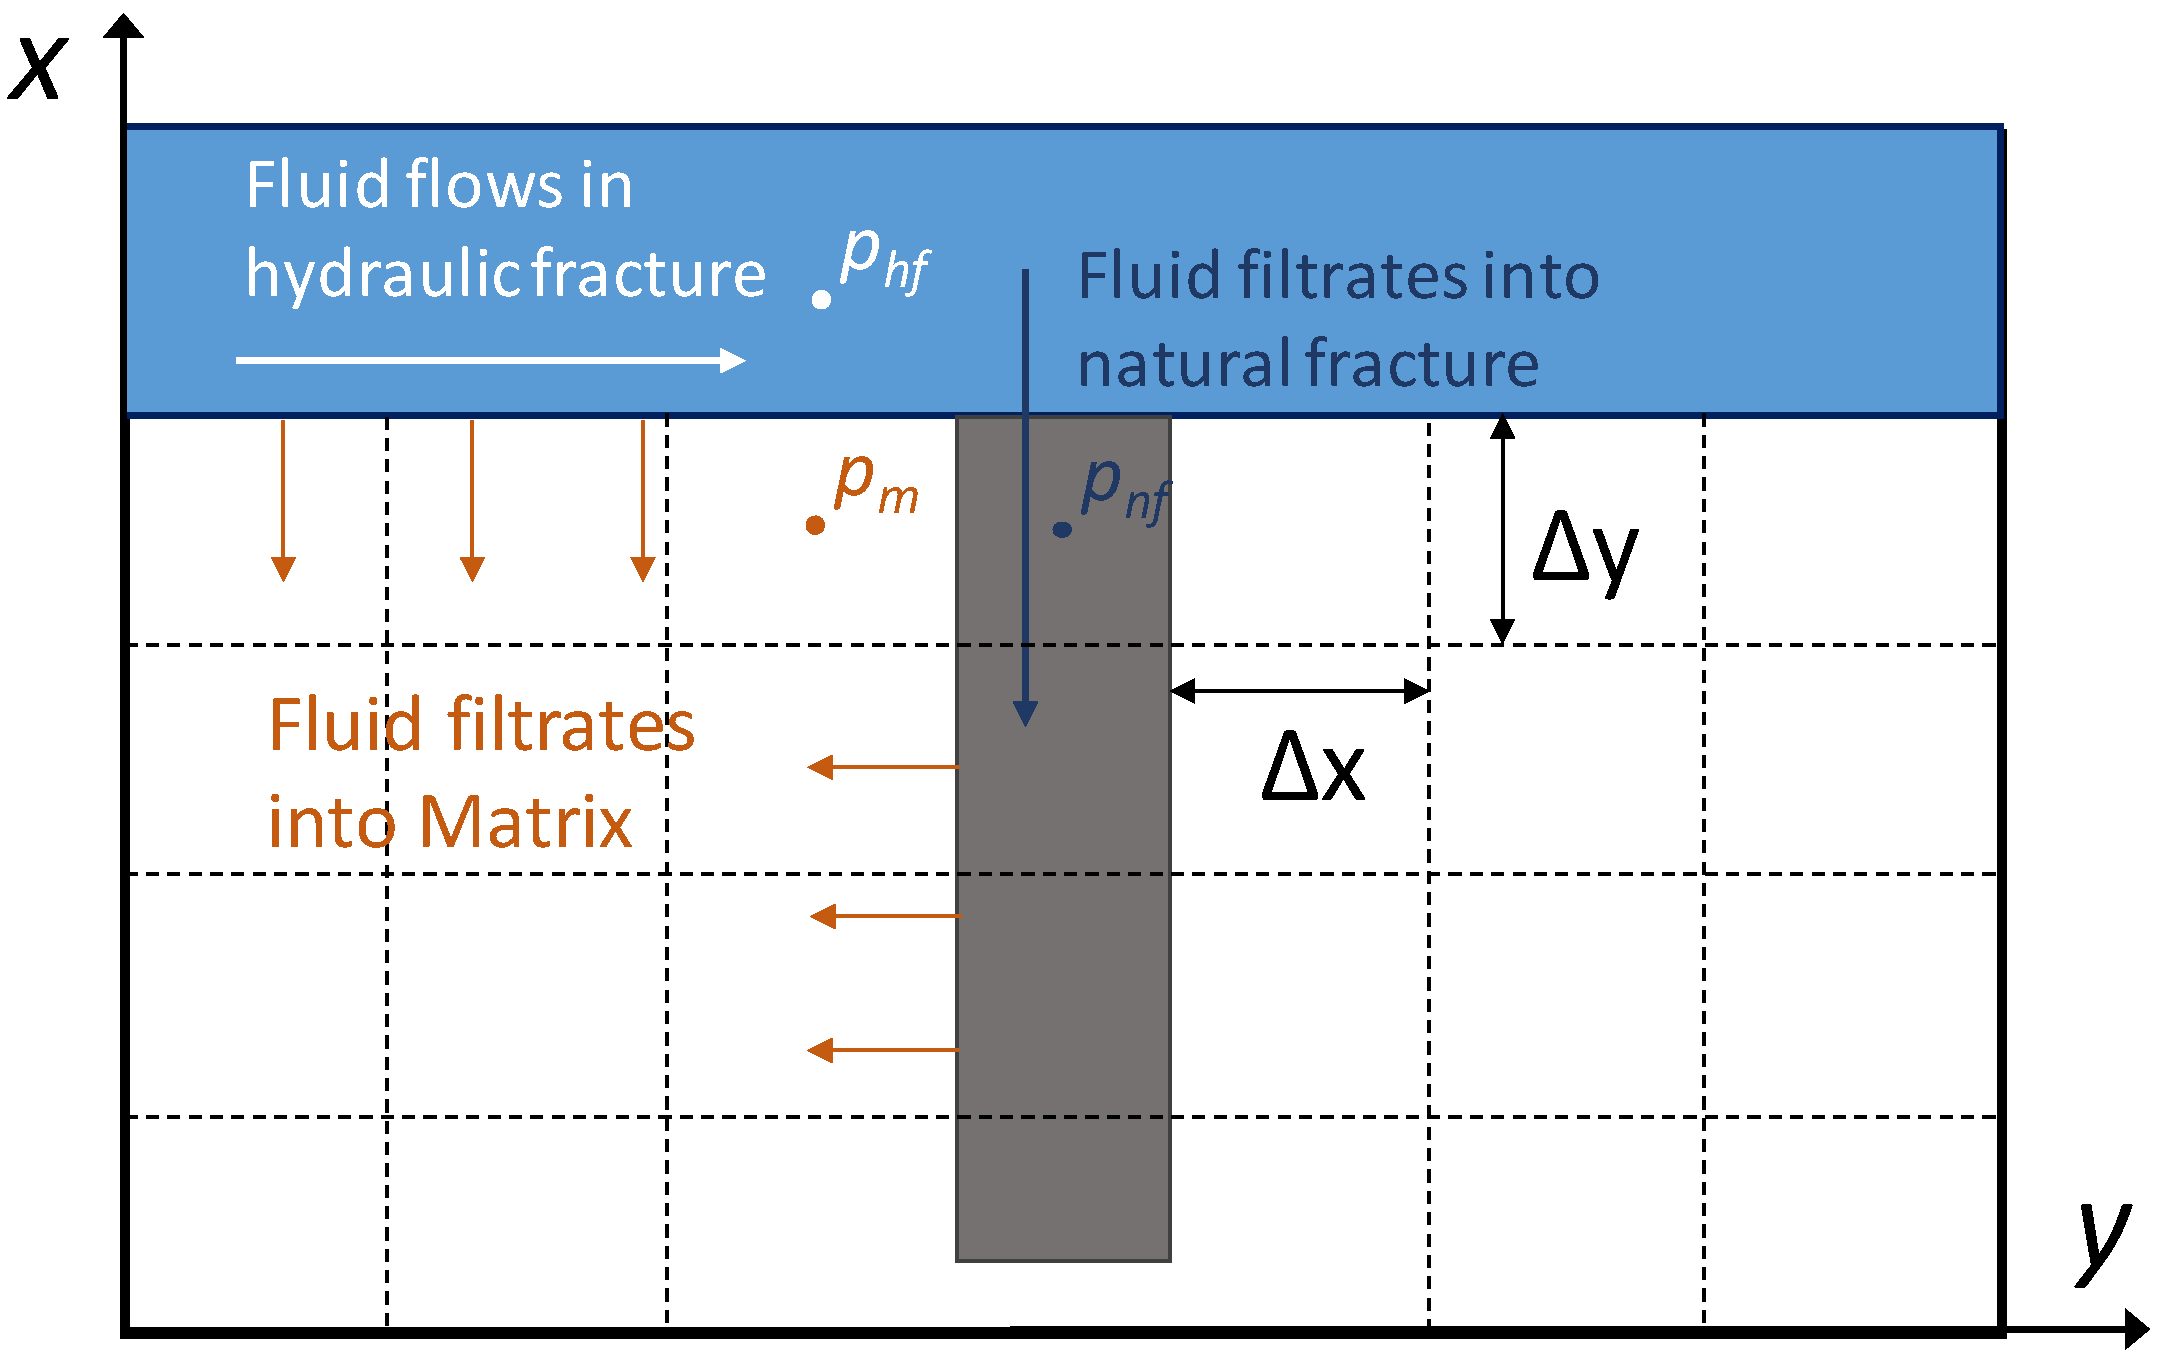
2.2. Fluid Flow and Leak-Off Model

The P3D fracture propagation model gridding along the hydraulic fracture length direction uses the average flow velocity to calculate the mass balance (Figure 5). However, this velocity could not be used to calculate the heat transfer and reaction because the hydraulic fracture has a non-uniform geometry instead of a parallel plate. This will lead to changes in local heat flow and reaction characteristics. A 2-D flow field that can simulate fluid flow in a non-uniform fracture is needed to model the heat transfer and reaction correctly.
The fracture propagation model provides the geometry and pressure for the fluid flow solution at each time step. The hydraulic fracture domain can be re-gridding in the height direction with a grid that matches the matrix domain gridding, and the grid in the length direction remains the same as the fracture propagation model (Figure 5). According to the assumption of the P3D fracture propagation model, the fluid does not flow in the height direction. Therefore, considering the flow in the hydraulic fracture as multiple 1-D flows in the height direction, the mass balance is described using the equation (Dong et al., 2002) [23]:
x w h f 3 12 μ p h f x + v L , h f = w h f t .
The natural fractures are considered parallel plates, and the following equation describes the mass balance inside:
y w n f 3 12 μ p n f y + z w n f 3 12 μ p n f z + v L , n f = w n f t
where phf and pnf represent the fluid pressures in hydraulic facture and natural fracture, Pa; whf and wnf are the width of hydraulic fracture and natural fracture, m; μ is the fluid viscosity, mPa·s; vL,nf is the fluid leak-off velocity in the natural fracture, m/s.
Meanwhile, the fluid flow in the matrix domain is a three-dimensional seepage in porous media. Based on Darcy’s law, the mass balance equation is written as follows:
ρ l x k mx μ p m x + ρ l y k my μ p m y + ρ l z k mz μ p m z = ρ l ϕ C t p m t + q f
where kmx, kmy, and kmz are the matrix permeability in x, y, and z direction, m2; pm is the fluid pressure in the matrix, Pa; ϕ is the rock porosity, dimensionless; Ct is the total compress coefficient, Pa−1; ρl is the fluid density, kg/m3; qf is the fluid leak-off source term, kg·m−3·s−1.
During acid fracturing, acid leaks off into the matrix through natural fractures and hydraulic fracture walls (Figure 6). However, the dynamic hydraulic fracture geometry and wormhole propagation make the leak-off profile need to be calculated in every fracture propagation step. A small time step is required to maintain the calculation accuracy and stability of fracture propagation. On the other hand, calculating global fluid flow and heat transfer in the three-dimensional matrix domain in such a small time step is unaffordable. Therefore, two sets of time steps are adopted in this study: Δtp is used to calculate hydraulic fracture propagation and leak-off from hydraulic fracture, set as 0.01–0.1 s. Δt calculates the global flow, heat transfer, and acid reaction, set as 5–60 s.
Therefore, the pressure-dependent velocity profile of leak-off through the hydraulic fracture wall is obtained in each fracture propagation time step:
v L , h f , m ( x , z , t p ) = k m y ( x , z , t p ) μ p ( x , t p ) y .
The leak-off velocity from hydraulic fracture to natural fractures is calculated based on the mass balance, which includes natural fracture volume change and fluid leak-off through natural fracture to the matrix:
q L , h f , n f = 0 Δ t 0 h p a y 0 L n f v L , n f ( y , z , t p ) d y d z d t + 0 Δ t 0 h p a y 0 L n f w n f y , z , t p t d y d z d t .
The leak-off through natural fracture walls is calculated as follows:
v L , n f ( y , z , t p ) = k m x μ p n f ( y , z , t p ) x x = 0 + k m x μ p n f ( y , z , t p ) x x = w n f
where qL,nf is natural fracture leak-off volume, m3; Lnf is natural fracture length, m. Therefore, the accumulative leak-off volume in a hydraulic fracture grid in time step Δt can be calculated using the equation:
q L , h f ( x ) = 0 Δ t 0 h h f ( x ) v L , h f , m ( x , z , t p ) d z d t + q L , h f , n f .

2.3. Heat Transfer Model

The fracture etching profile can only be predicted if the temperature is known because the temperature strongly affects the in situ acid/rock reaction and mass transfer (Nolte and Economides, 2000) [24]. During the injection process, fluid will flow through the wellbore, hydraulic fractures, natural fractures, and finally, into the reservoir rock. During this process, the acid fracturing fluid will exchange energy with the reservoir rock, cooling the rock while heated. This process is the primary goal of acid fracturing temperature field simulation. To simulate the above procedure, a finite difference method developed by Eickmeier et al. (1970) [25] is implemented to calculate the wellbore heat transfer in this study. The temperature profile can be predicted once we obtain the velocity profiles in fractures and matrix. The heat transfer in the hydraulic and natural fractures is described by the following equations:
ρ l c l u x w h f T h f x + 2 ρ l c l T h f v L , h f + 2 y λ l w h f T h f y = ρ l c l w h f T h f t
ρ l c l u y w n f T n f y + ρ l c l u z w n f T n f z + 2 ρ l c l T n f v L , n f + 2 x λ l w n f T n f x = ρ l c l w n f T n f t
where Thf and Tnf represent the average temperatures across the fracture width, K; cl is the specific heat of fluid, J/(kg·K); λl is the thermal conductance of fluid, W/(m·K). ux, uy, and uz are the flow velocities in the x, y, and z directions, m/s. It is considered that the temperature in the matrix domain obeys the assumption of local thermal equilibrium (Kaviany, 2012) [26]. Therefore, within the same matrix grid, Tf = Ts = Tm. Then, the heat transfer control equation in the matrix domain is as follows:
ρ m c m T m t + ρ m c m u x T m x + u y T m y + u z T m z = λ m 2 T m x 2 + λ m 2 T m y 2 + λ m 2 T m z 2 + q h , m
where Tm is the temperature of porous medium, K; ρm is the density of porous medium, kg/m3; cm is the specific heat of porous medium, J/(kg·K); λm is the thermal conductance of porous medium, W/(m·K); qh,m is the energy source term, J/(m3·s).

2.4. Acid Model

After obtaining the temperature profiles in hydraulic and natural fractures, we can calculate the acid reaction parameters based on the Arrhenius equations. Then, combining the calculated velocities, acid mass balance in fractures is described by the convection–diffusion equation, and the mass transfer coefficient proposed by Robert (1975) [27] is combined with the acid rock reaction constant to construct the mass transfer reaction boundary conditions:
( u x w h f C h f ) x 2 k c k g k c + k g C h f 2 C h f v L , h f + w h f C h f t = 0
( u y w n f C n f ) y + ( u z w n f C n f ) z 2 k c k g k c + k g C n f 2 C n f v L , n f + w n f C n f t = 0
where Chf and Cnf are the average acid concentrations across the fracture width, mol/m3; kc is the acid reaction constant, m/s; kg is the mass transfer coefficient, m/s.
During acid fracturing, the acid un-uniformly dissolves a fractured surface and forms wormholes, which lead to considerable acid leak-off. Due to the limitation of simulation scale and computing power, the global wormhole model is the best choice for simulating the wormhole growth during acid fracturing. This study adopts a semi-empirical wormhole model presented by Furui (2012) [19].
It is considered that the wormhole lengths (Lwh) in one grid are equal (Figure 7a), and the wormhole growth velocity can be predicted as follows:
v w h = v i , t i p N A c × v i , t i p P V b t , o p t N A C v i , o p t γ × 1 exp 4 v i , t i p P V b t , o p t N A C L w h v i , o p t L c o r e 2 2
where NAC is the acid capacity number; vwh is the wormhole growth velocity, m/s; vi,tip is the average interstitial velocity in the wormhole front, m/s; PVbt,opt is the optimal breakthrough volume, dimensionless; vi,opt is the optimal injection velocity, m/s; Lwh is the wormhole length, m; Lcore is the core length, m; γ is the coefficient that represents the effect of the fluid loss limiting the wormholing; in this study, it equals to 1/3.
Acid flow through the hydraulic fracture walls is considered as laminar flow, and vi,tip is calculated as follows:
v i , t i p = q ϕ A w h .
where Awh is the cross-sectional area perpendicular to the wormhole front, m2; q is the acid flow rate, m3/s.
Because the flow capacity of wormholes is extremely strong compared to the matrix, the pressure drop in wormholes is considered to be zero (Figure 7b). Therefore, the permeability at the wormhole growth direction in the wormhole region should be set as infinite. However, this may cause calculation problems in numerical simulation; so the permeability of the elements in the wormhole region is set as a significantly larger value:
k w h = 1 e 4 k m y .
For the grids at the tip of the wormhole region, their permeability is calculated as follows:
k w h = k m y Δ y t i p Δ y t i p L w h , t i p , k m y Δ y t i p Δ y t i p L w h , t i p 1 e 4 k m y k w h = 1 e 4 k m y , k m y Δ y t i p Δ y t i p L w h , t i p > 1 e 4 k m y
where kwh is the permeability of the matrix grid with wormholes at the y direction, m2; Δytip is the length of the grid where the wormhole tip is located, m; Lwh,tip is the wormhole length at the element where the wormhole tip is located, m.
The etching distribution along the fractures can be calculated with the obtained acid concentration profile. This study considers that all acid filtrates through hydraulic fracture walls contribute to wormhole growth. Therefore, the change in the fracture width is calculated by the following equation:
w h f t = 2 β M k c k g k c + k g C h f ρ r 1 ϕ .
The wormholes on natural fracture walls are not considered. Therefore, the acid leak-off into the matrix is considered to contribute to the natural fracture width increase:
w n f t = β M η v L , n f C n f + k c k g k c + k g C n f ρ r 1 ϕ
where β is the dissolving power of acid on rock, kg rock/kg acid; M is the mole weight of the rock, kg/mol; ρr is the density of rock, kg/m3; η is the fraction of the leaking acid that reacts at the fracture surfaces. In this study, the acid-etched conductivity is calculated by the correlations presented by Deng et al. (2012) [28], in which the geostatistical and rock mechanical parameters are considered.

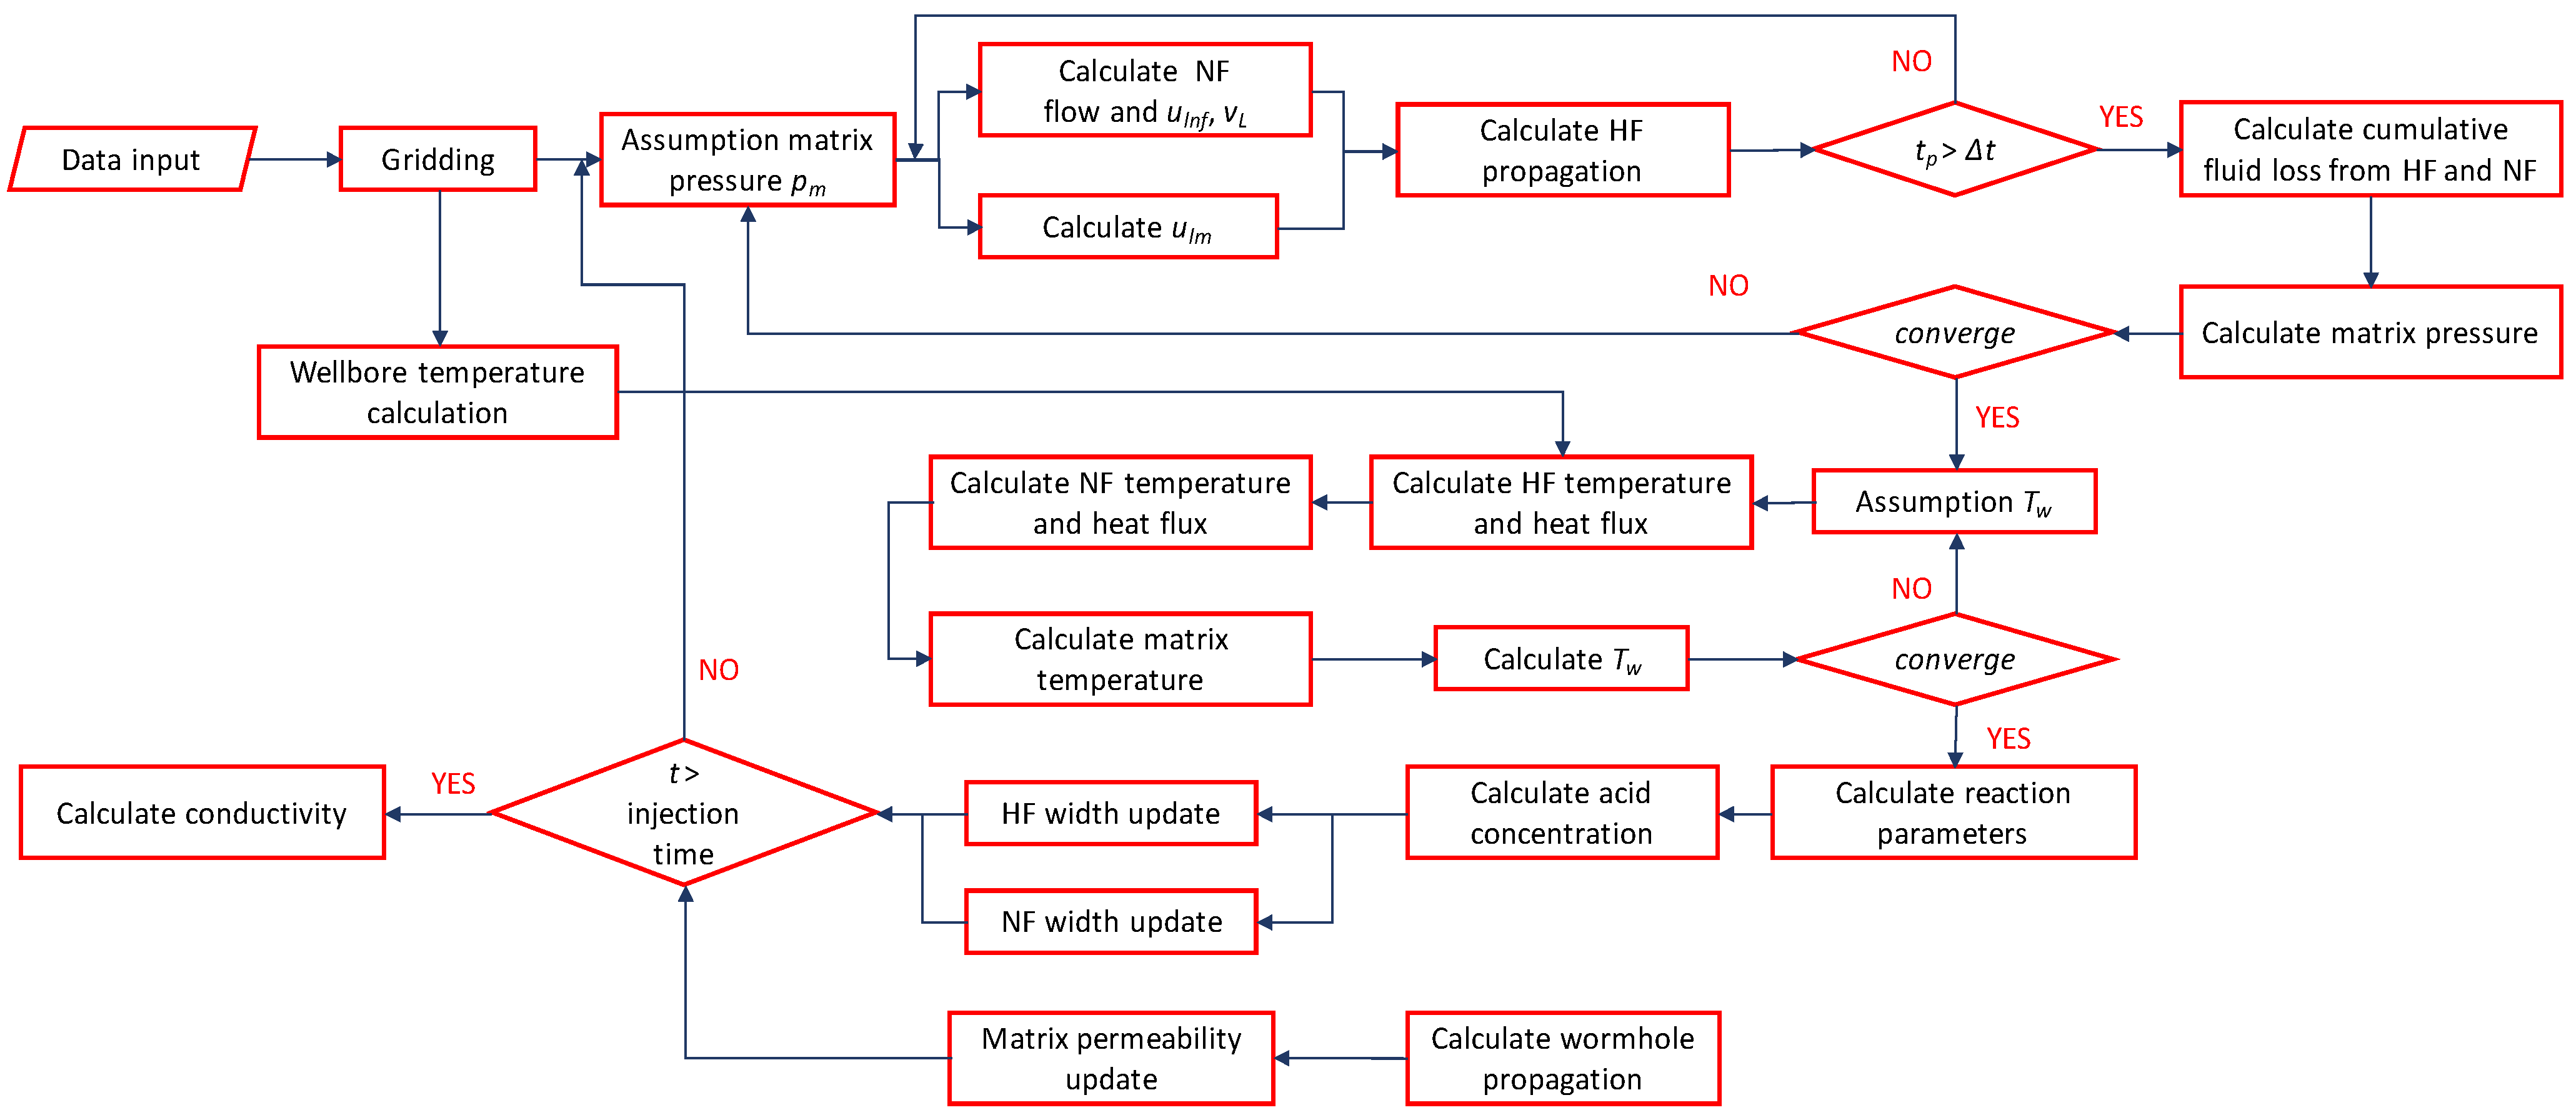
3. Calculation Approach
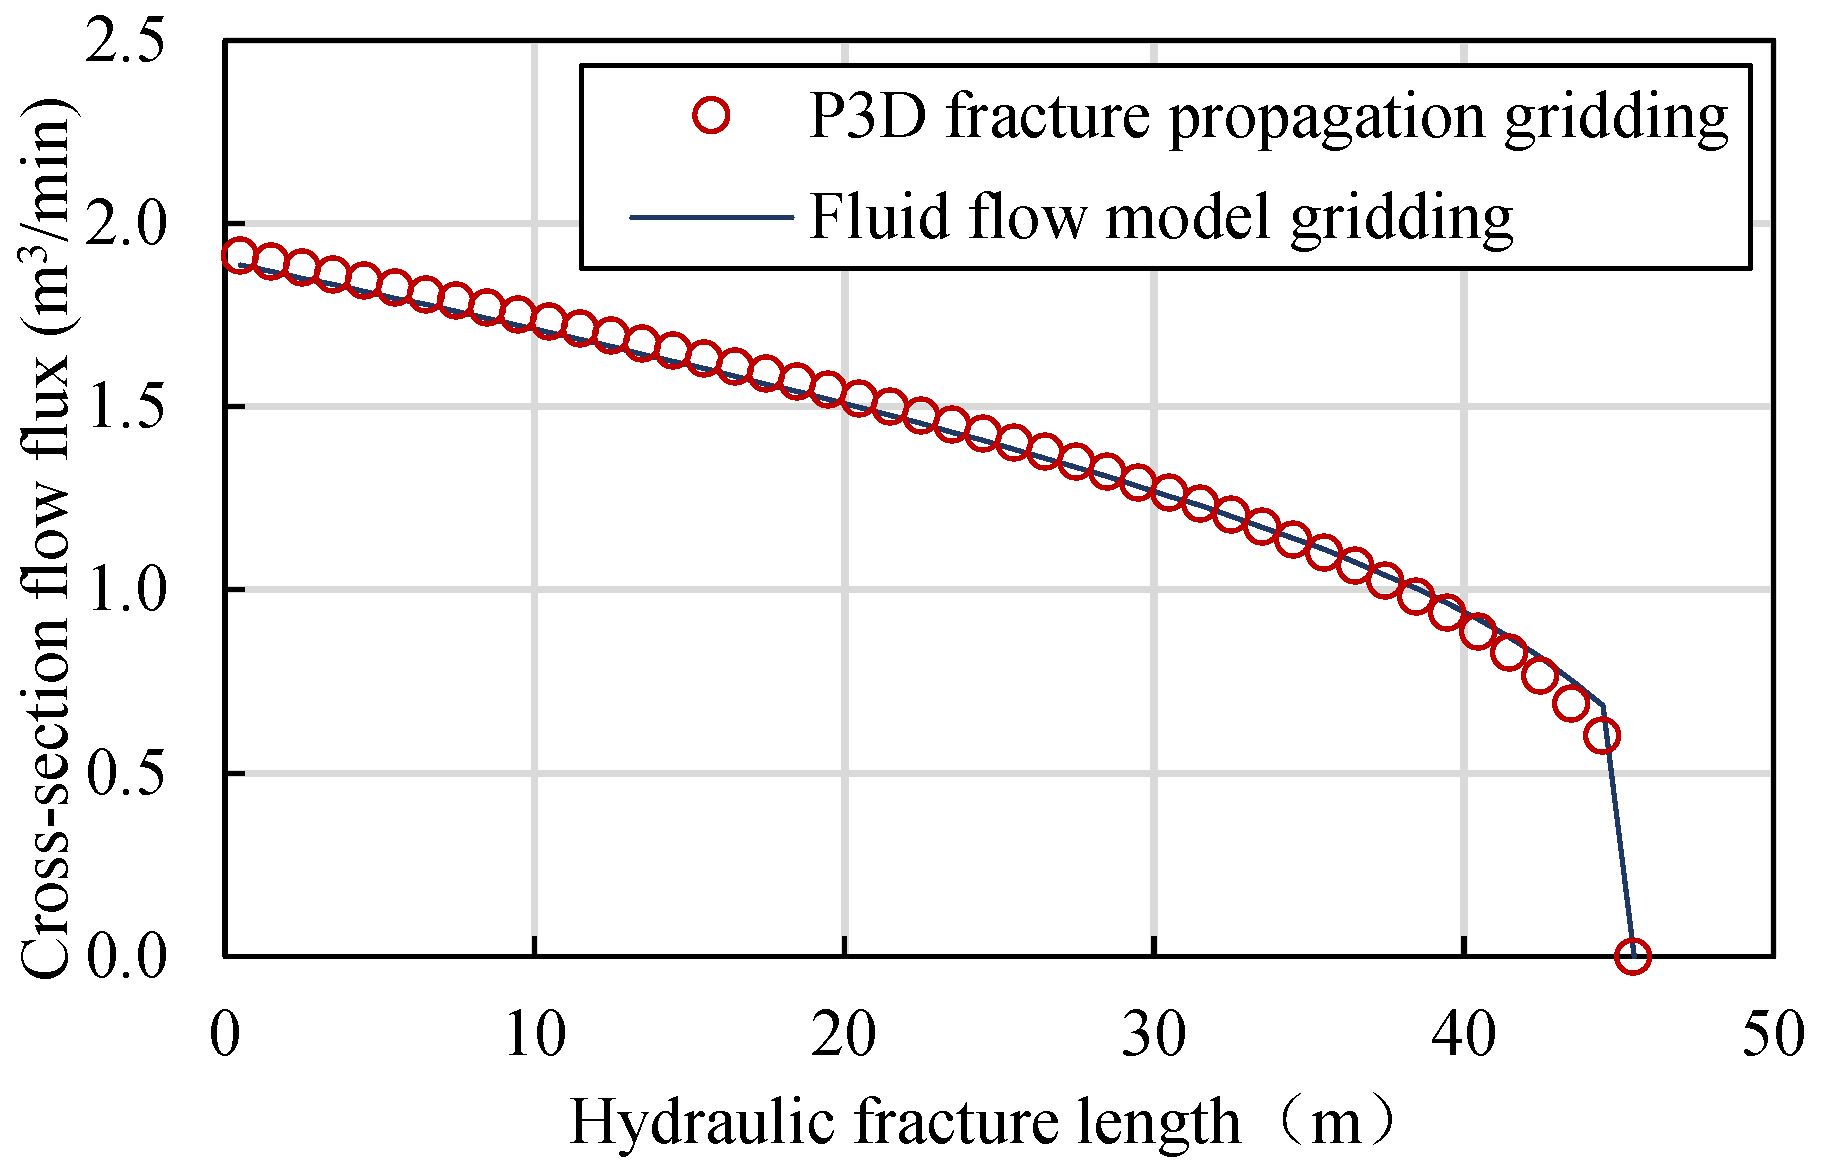
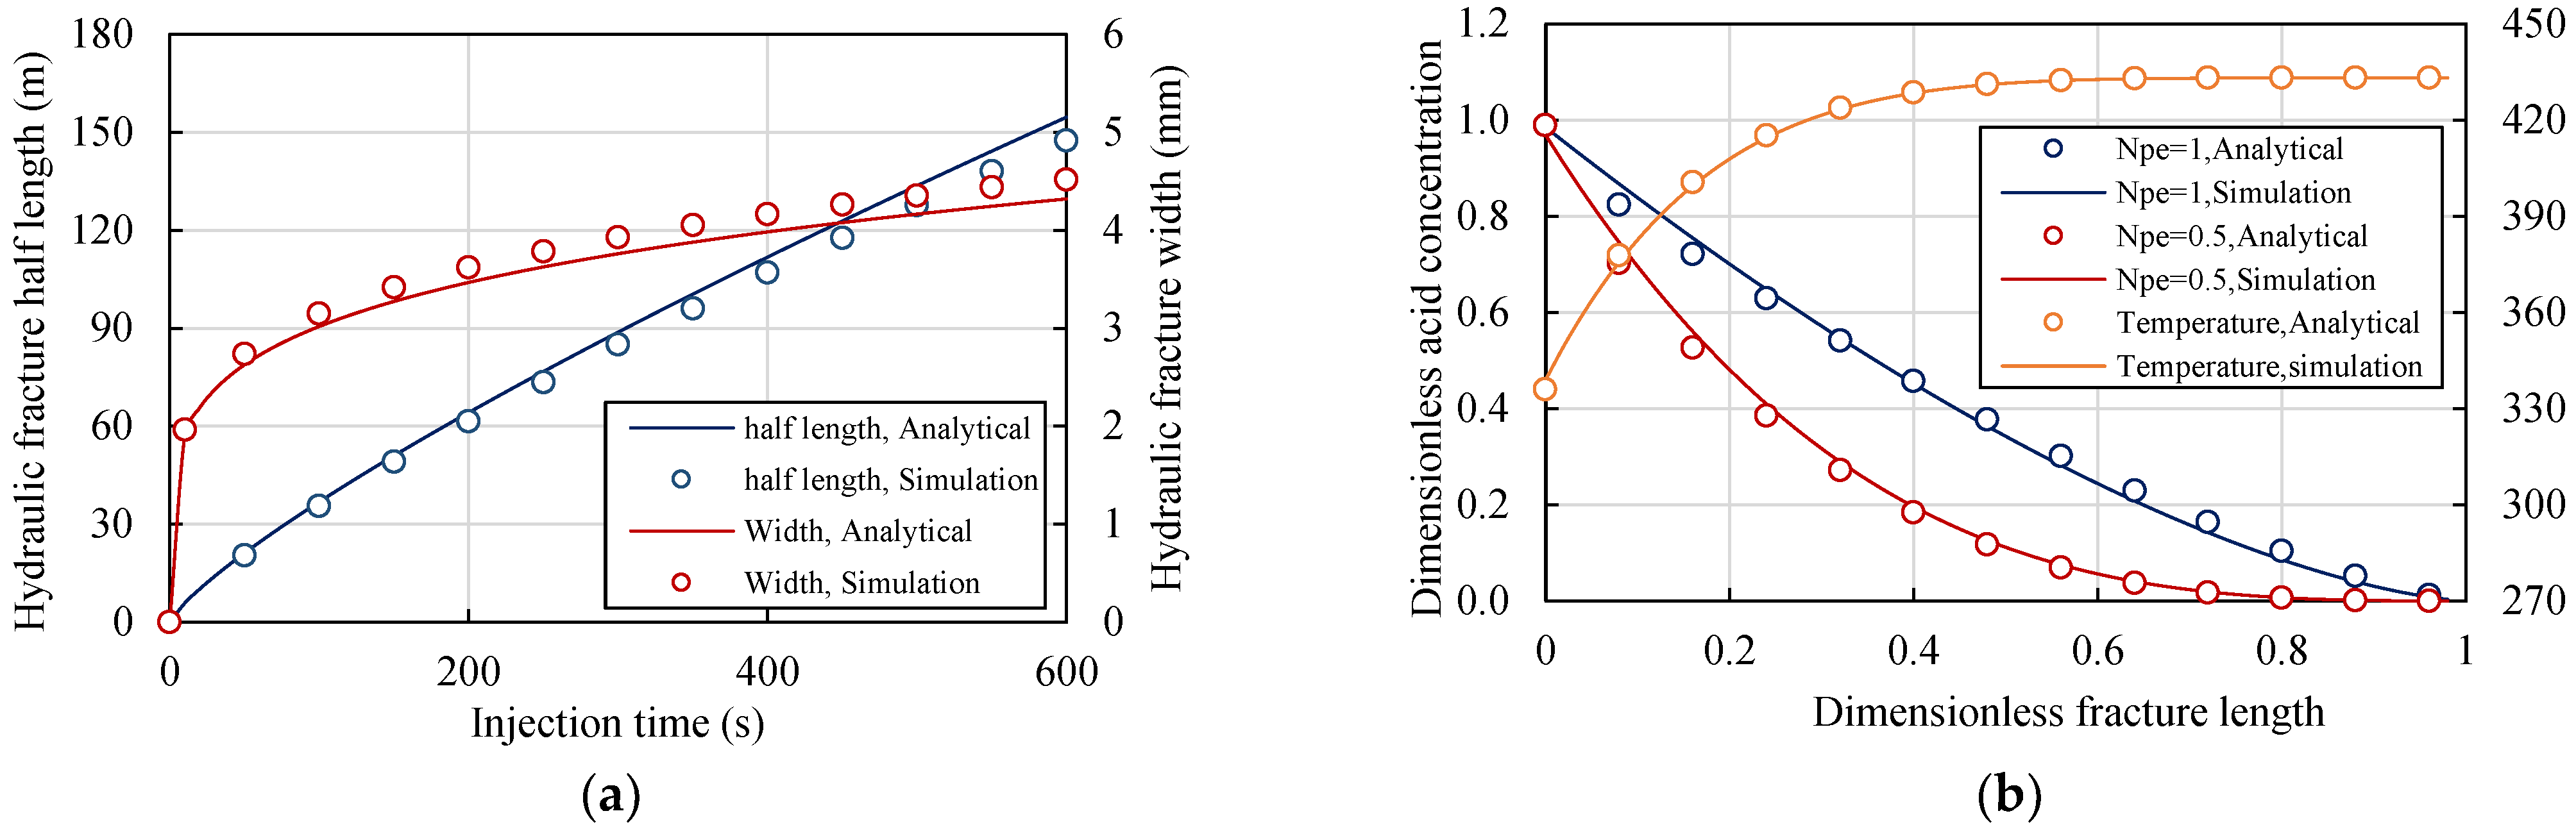
The integrated acid fracturing model is developed in-house, with MatLab (2023a, academic version, MathWorks, Inc., Natick, MA, USA), preventing the need to transfer data to or from other commercial software. The procedures for calculating the fracture conductivity are as follows: After reading the input data, a calculated average leak-off velocity profile is adopted to calculate the hydraulic fracture geometry. Iterations between the fracture geometry and leak-off velocity are performed until convergence. After that, the temperature was first calculated based on an assumed temperature profile on the fracture wall, then updated according to the new wall temperature calculated from the matrix until convergence. The acid balance equations are solved using the calculated velocity and temperature profiles to obtain the acid concentration profile in hydraulic and natural fractures. After that, the etched-width and the wormhole region length are estimated, and then the fracture width and matrix permeability are updated. At last, the acid-etched conductivities of the overall fractures are obtained based on the etched-width when the acid injection is finished. The more detailed workflow is shown in Figure 8.

4. Model Validation

In this study, because the problem modeled is complicated, the presented model was simplified into several steps and validated with available analytical solutions. First, the fracture propagation model was validated with a PKN analytical solution derived by Nordgren (1972) [29] at a fixed height and with no leak-off conditions. Meanwhile, the analytical solution of the acid flow reaction (Schechter, 1992) [30] and the heat transfer (Terrill, 1964) [31] between two porous parallel plates were adopted to validate the acid concentration solution and the temperature solution of the model. As shown in Figure 9, the numerical simulation results matched well with the analytical solutions. Therefore, the validations were satisfactory.
During the fluid flow calculations, the fracture geometry and fluid pressure continue to be used while changing the grid. Therefore, fluid flow solutions need to be validated to ensure the conservation of mass during the calculation process. Figure 10 shows the calculation results in different grid systems. The match between the two models is within a 1% difference, and changing the grid only slightly influences calculation results.
The model was also validated against the acid fracturing model for the fractured carbonate reservoir established by Ugursal (2018) [32]. The validating case contains a constant hydraulic fracture and three natural fractures that intersect vertically and uniformly with hydraulic fractures. This model does not consider hydraulic fracture propagation but takes the acid flow front as the fluid loss range, and no temperature calculation is involved in this model. Furthermore, more natural fractures are planted in the established model to compare the dynamic leak-off between constant and propagating hydraulic fractures.
The two models showed the same characteristic in the dynamic change of leak-off with injection time (Figure 11). When a hydraulic fracture interacts with a natural fracture, the acid will flow into and fill the natural fractures. It will cause a large amount of leak-off, which reduces the leak-off from the hydraulic fracture walls. As natural fracture is filled with fluid and its leak-off decreases, the leak-off through hydraulic fracture walls will gradually increase. This process continues circulating as hydraulic fracture propagates and interacts with new natural fractures. This results in leak-off in naturally fractured reservoirs exhibiting a jagged characteristic, which differs from the leak-off predicted by the classic Carter model.
Since Ugursal only planted three natural fractures in this simulation, the leak-off rate injection decreased with the increase in acid injection time after 6 min. However, in the established model, as the acid injection time increases, the leak-off rate presents a periodic change. This is because the wall area of hydraulic fractures continues to increase during the propagation, constantly interacting with new natural fractures, and the total fluid loss and injection volume are in a dynamic balance.
Due to the low flow capacity of hydraulic fractures at the initial propagation stage, it is difficult to build a high fluid pressure. Therefore, the leak-off rate of the first natural fracture is significantly lower than the results calculated by Ugursal’s model. This leads to a faster interaction speed between hydraulic and natural fractures (Figure 12).
In both models, as the distance between the natural fracture and the entrance of the hydraulic fracture increases, the maximum leak-off rate of the natural fracture decreases, and the interaction interval increases. However, in the established model, the leak-off rate of the more distant natural fracture is more significant than that of Ugursal’s model, although the speed of reaching the maximum leak-off slows down. This is because, compared to the constant hydraulic fracture, the width of the propagating hydraulic fractures continuously increases. This leads to a decrease in the flow pressure consumption, finally increases the fluid pressure at the entrance of the distant natural fractures, and a longer flow distance will slow down this process.
In summary, the results of the established model are consistent with those of existing models. By further considering hydraulic fracture propagation, the established model provided a more complete and acceptable description of the dynamic leak-off process in fractured reservoirs.

5. Results

Based on the model proposed in the previous sections, we first studied the leak-off behavior of wormholes and natural fractures. Then, parametric studies were carried out to investigate how wormholes and natural fractures affect hydraulic fracture propagation and acid etching under various reservoir parameters. Then, the dimensionless production indexes under various treatment parameters were calculated based on four designed cases with different reservoir conditions. This led us to find the optimal treatment parameters and obtain the acid stimulation strategy under different reservoir situations. The input parameters for this study are given in Table 1.

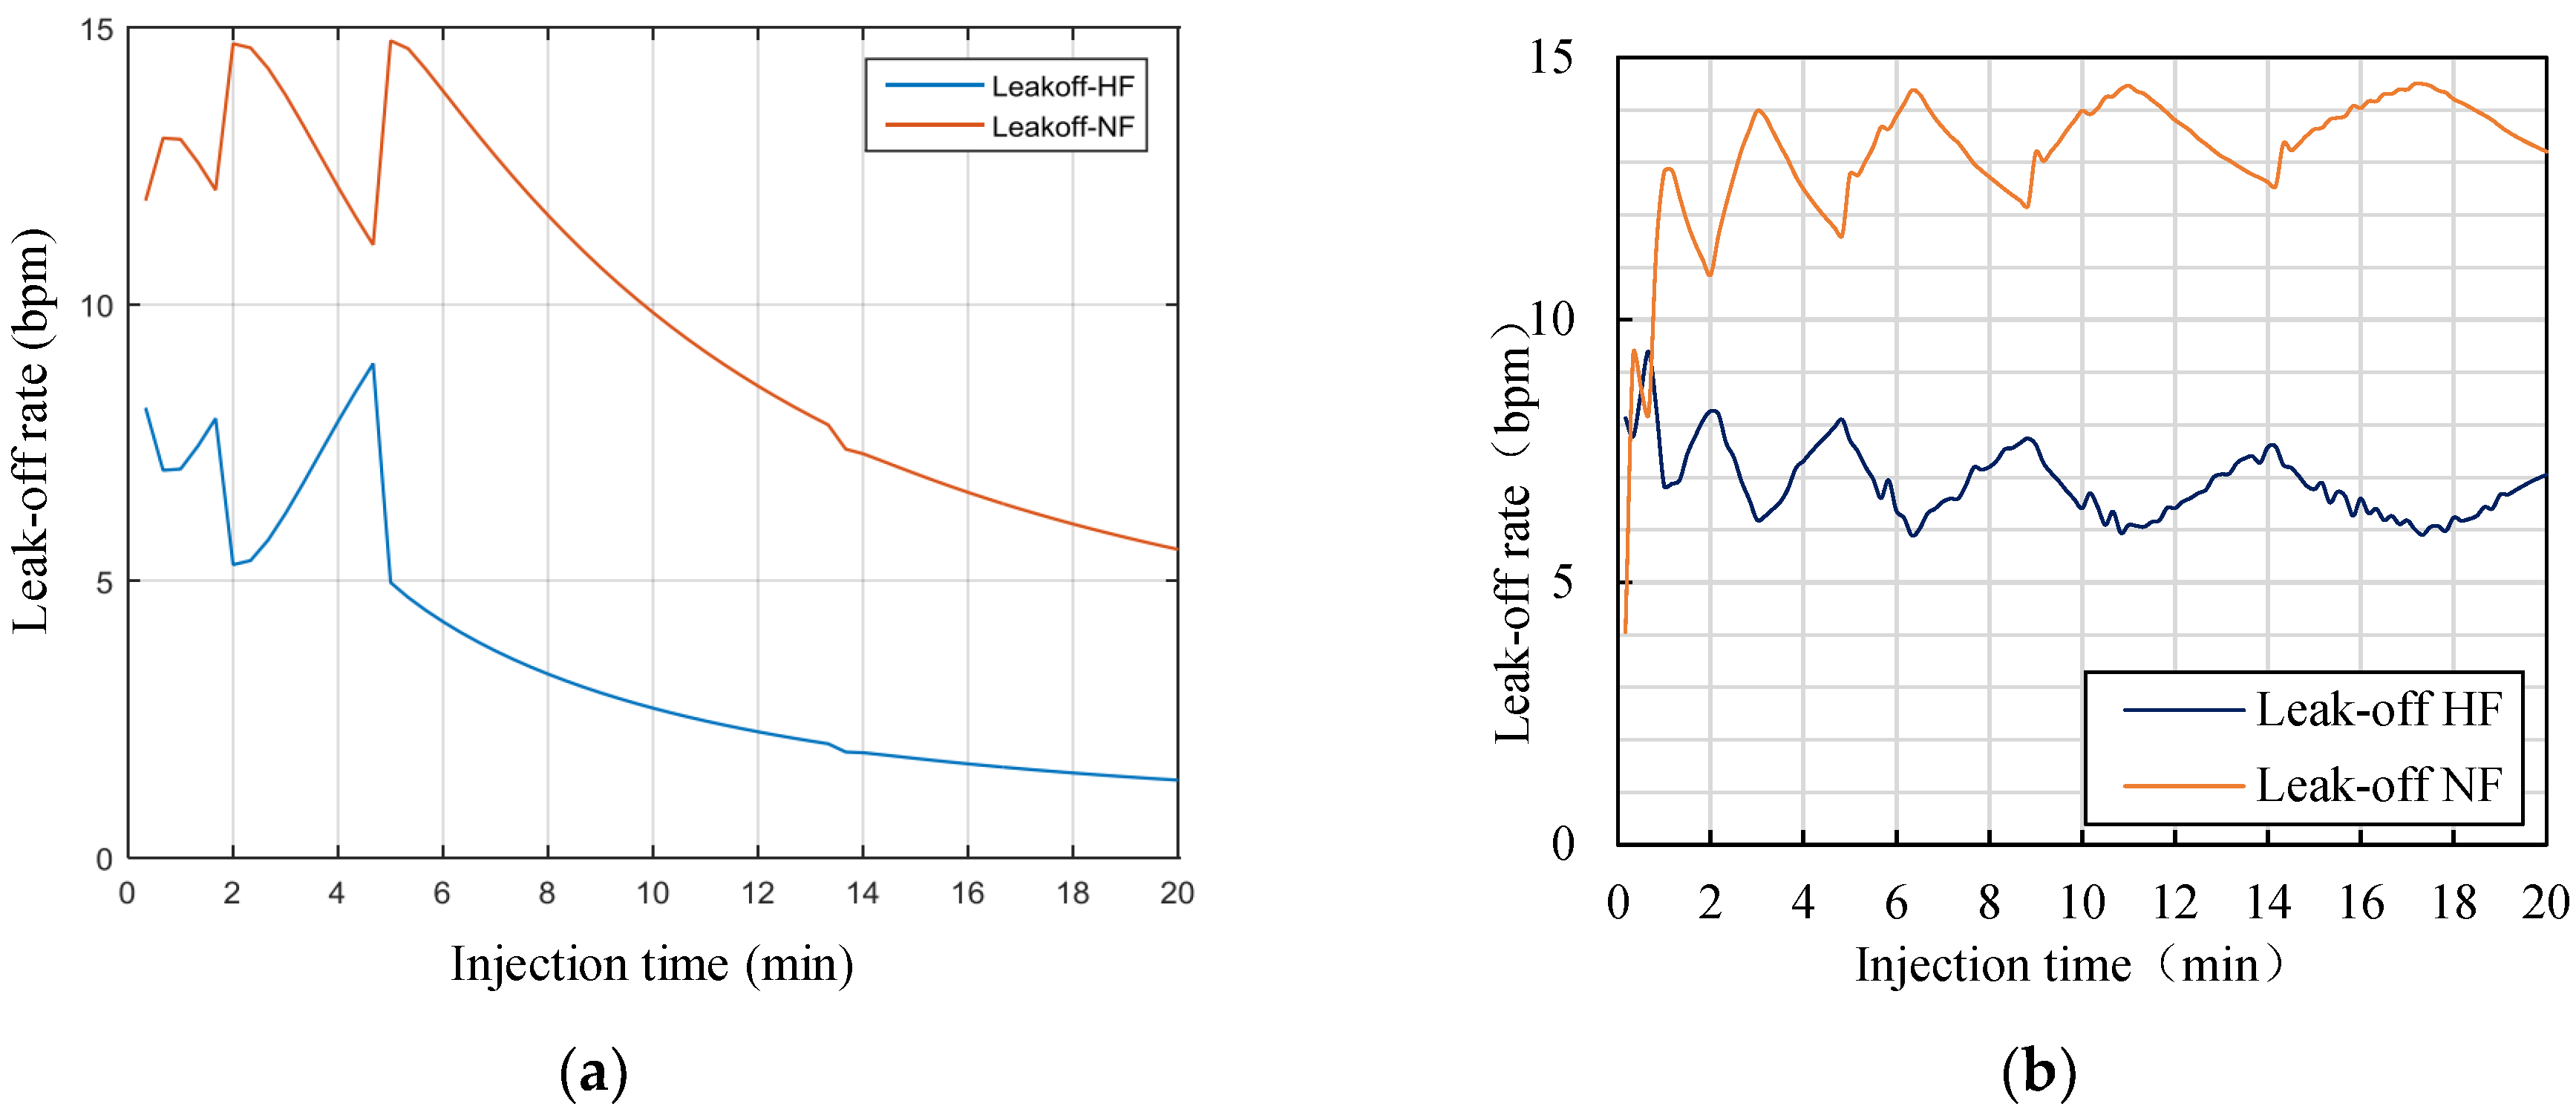
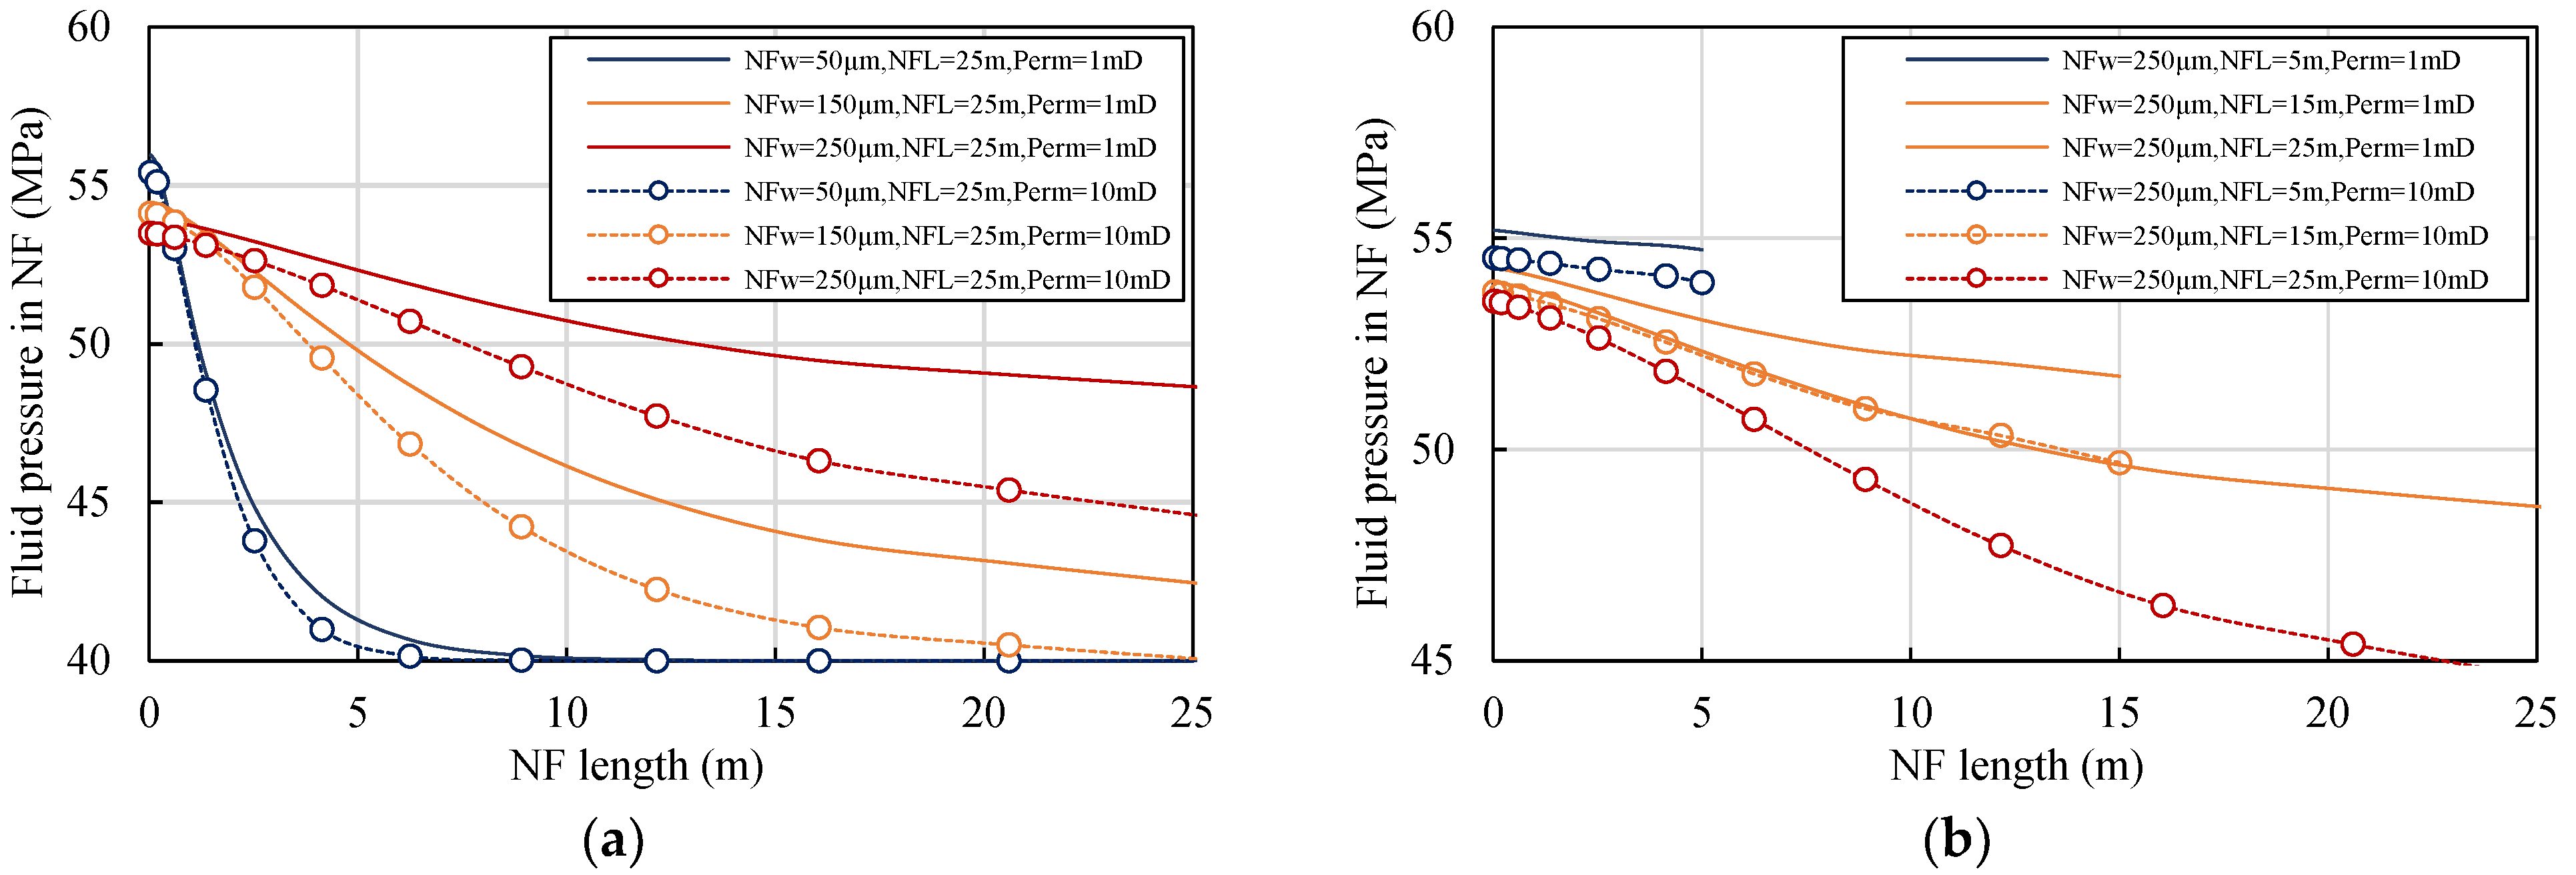
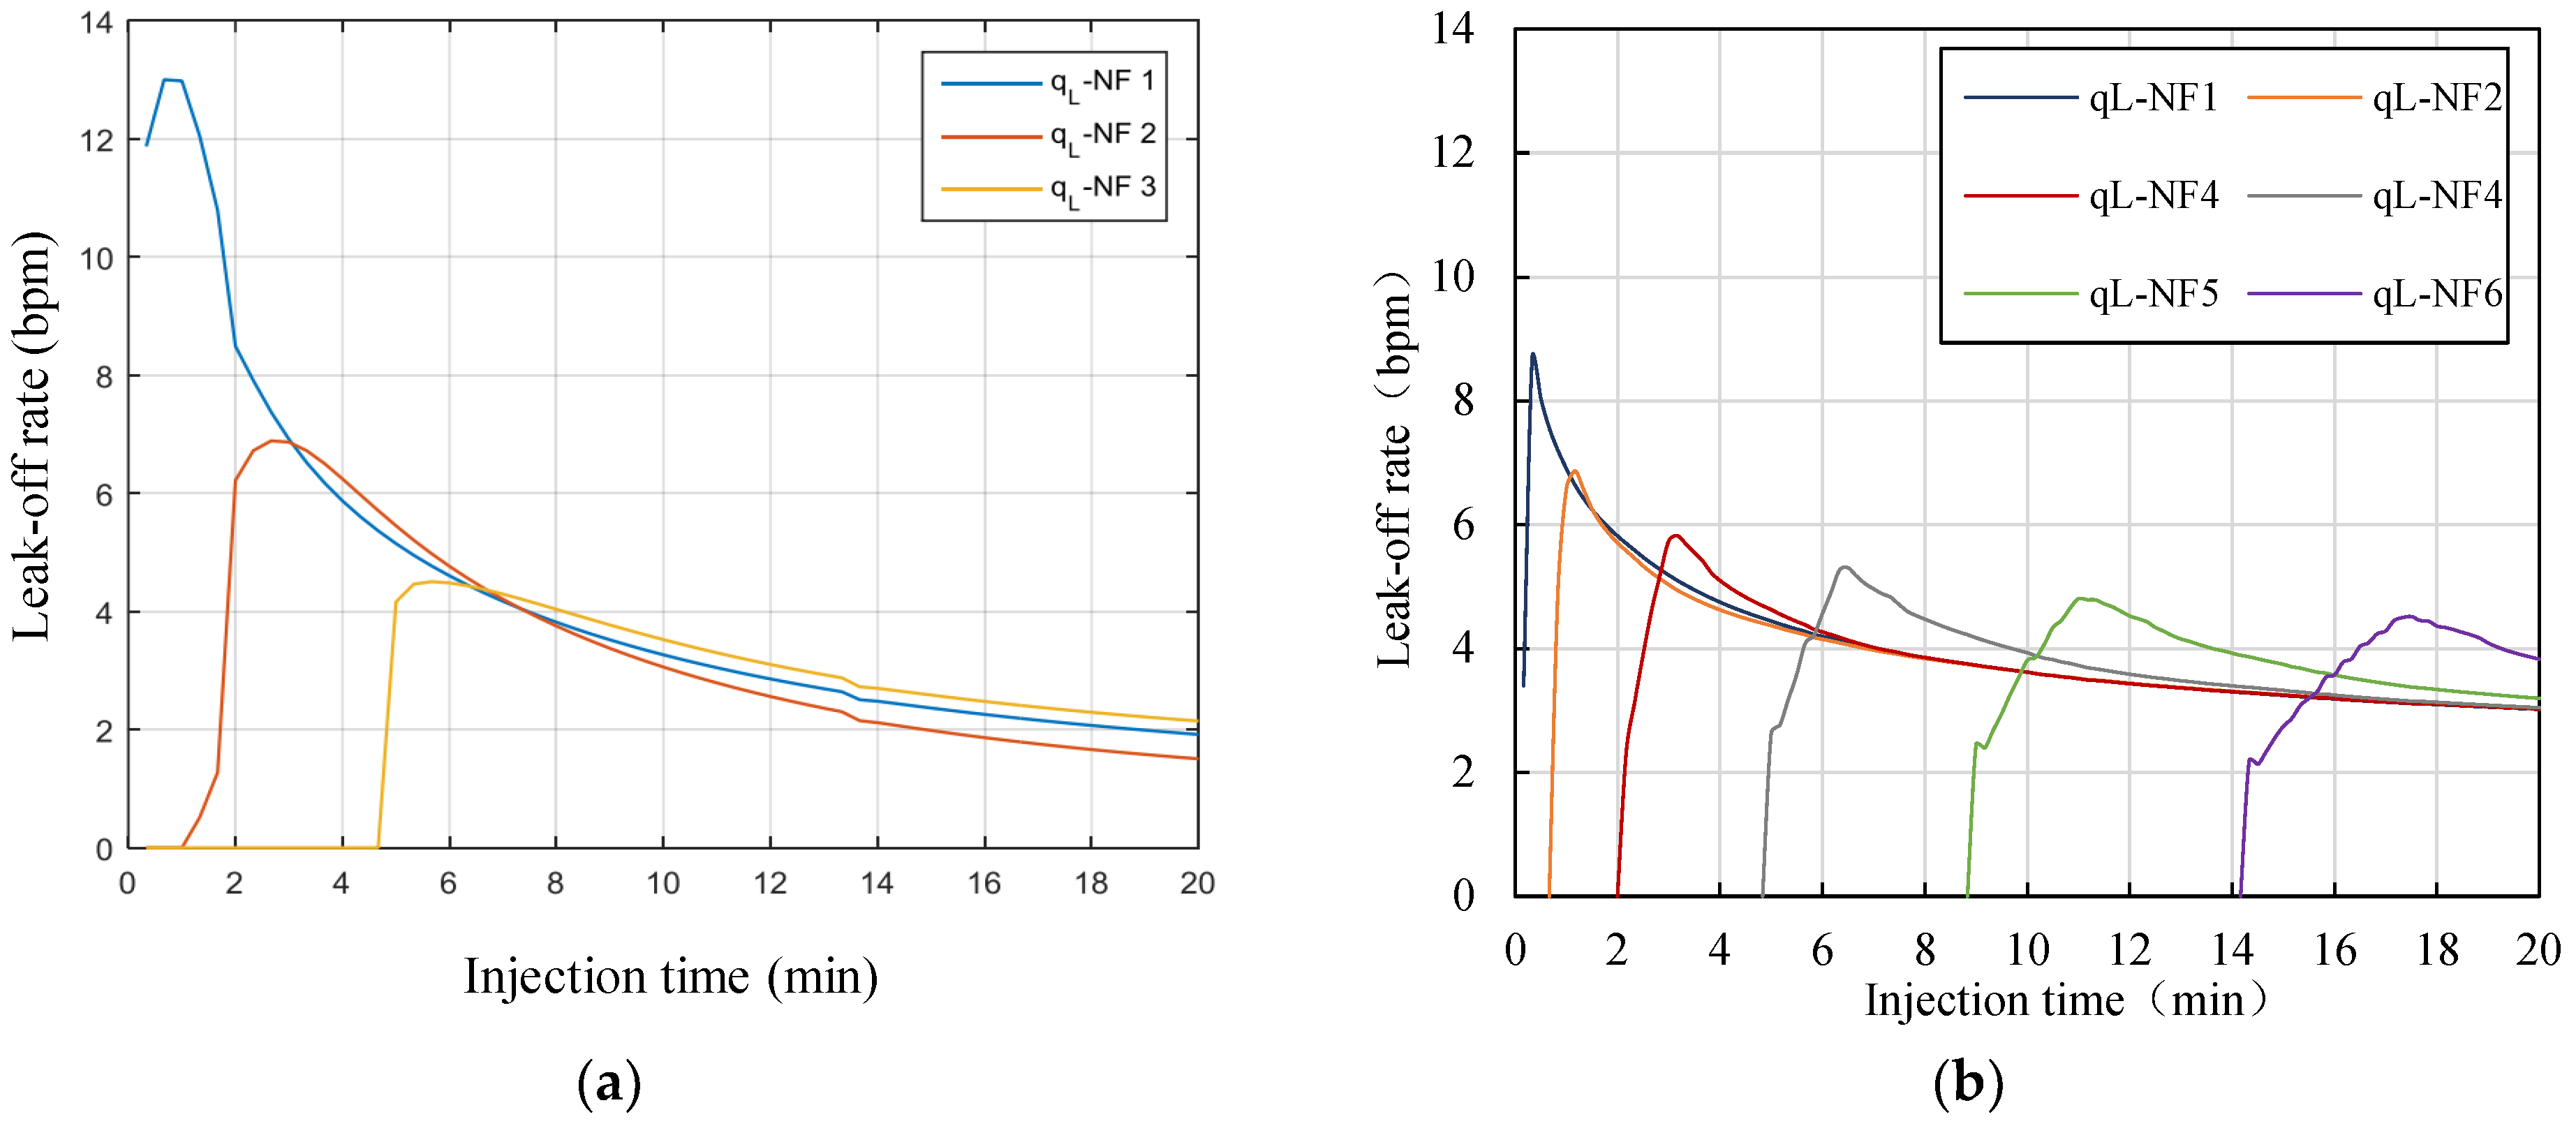
5.1. Natural Fracture Leak-Off Behavior

First, the leak-off behavior of natural fracture in different geometric parameters (50–250 μm width, 5–25 m length) and reservoir permeability (1, 10 mD) is simulated. During the simulation, the natural fracture spacing was considered equal to 1 m while maintaining a 6 m3/min injection rate and 600 s injection time. Wormholes were not considered in this section, and the other input parameters are given in Table 1.
Figure 13 shows that the accumulative leak-off volume of a natural fracture does not always grow with a unilateral increase in width, length, or matrix permeability. It is observed that increasing the length of a natural fracture with a small width hardly improves its leak-off capacity. However, the magnitude of this effect grows as the width increases, and it shows a significant effect when the width exceeds 150 μm. On the contrary, an increase in the natural fracture width greatly improves the accumulative fluid loss volume under all natural fracture lengths. It is also observed that matrix permeability has a more obvious effect on fluid leak-off, with larger natural fracture widths and lengths. The effects of these three parameters on the fluid leak-off show a mutually constrained and non-linear characteristic.
The pressure profile in natural fractures was analyzed to further understand the mechanism of these parameters’ influence on fluid leak-off. Figure 14 reveals that only a part of the natural fracture length plays a role in leak-off when the natural fracture width is small (Figure 14a). As the width increases, the pressure drop in the natural fracture decreases, and the effective leak-off length extends to the whole natural fracture when the width exceeds 150 μm. Furthermore, suppose we change the length of natural fractures with a large width. In that case, it can be seen that the pressure drop rate increases as the length gets longer (Figure 14b). It can be observed that the natural fracture width controls the inflow rate at the entrance and the pressure drop along the length. In contrast, the natural fracture length and matrix permeability determined the leak-off area and flow capacity from the natural fracture to the matrix. Therefore, only when the width, length, and matrix permeability increase, the accumulative fluid loss volume of natural fracture increases significantly.

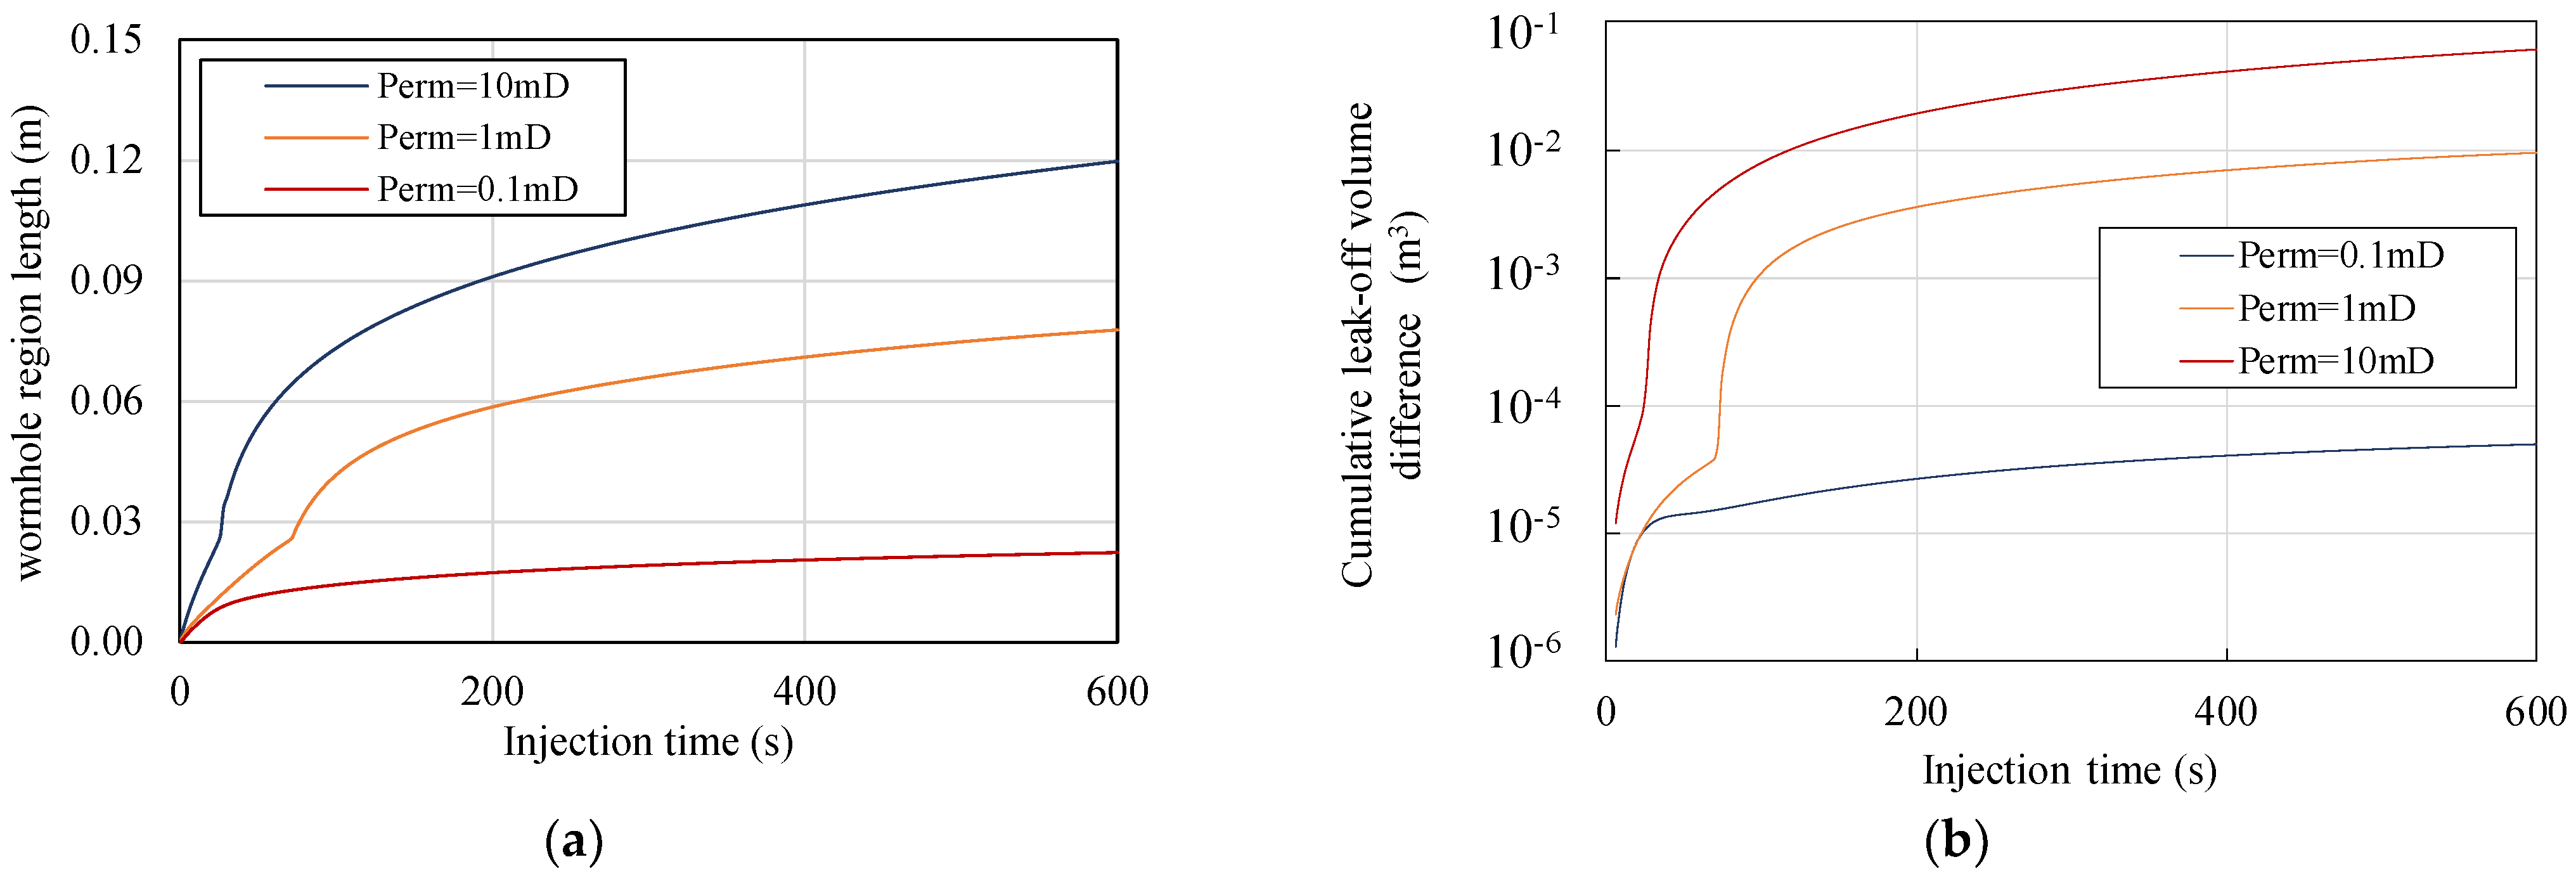
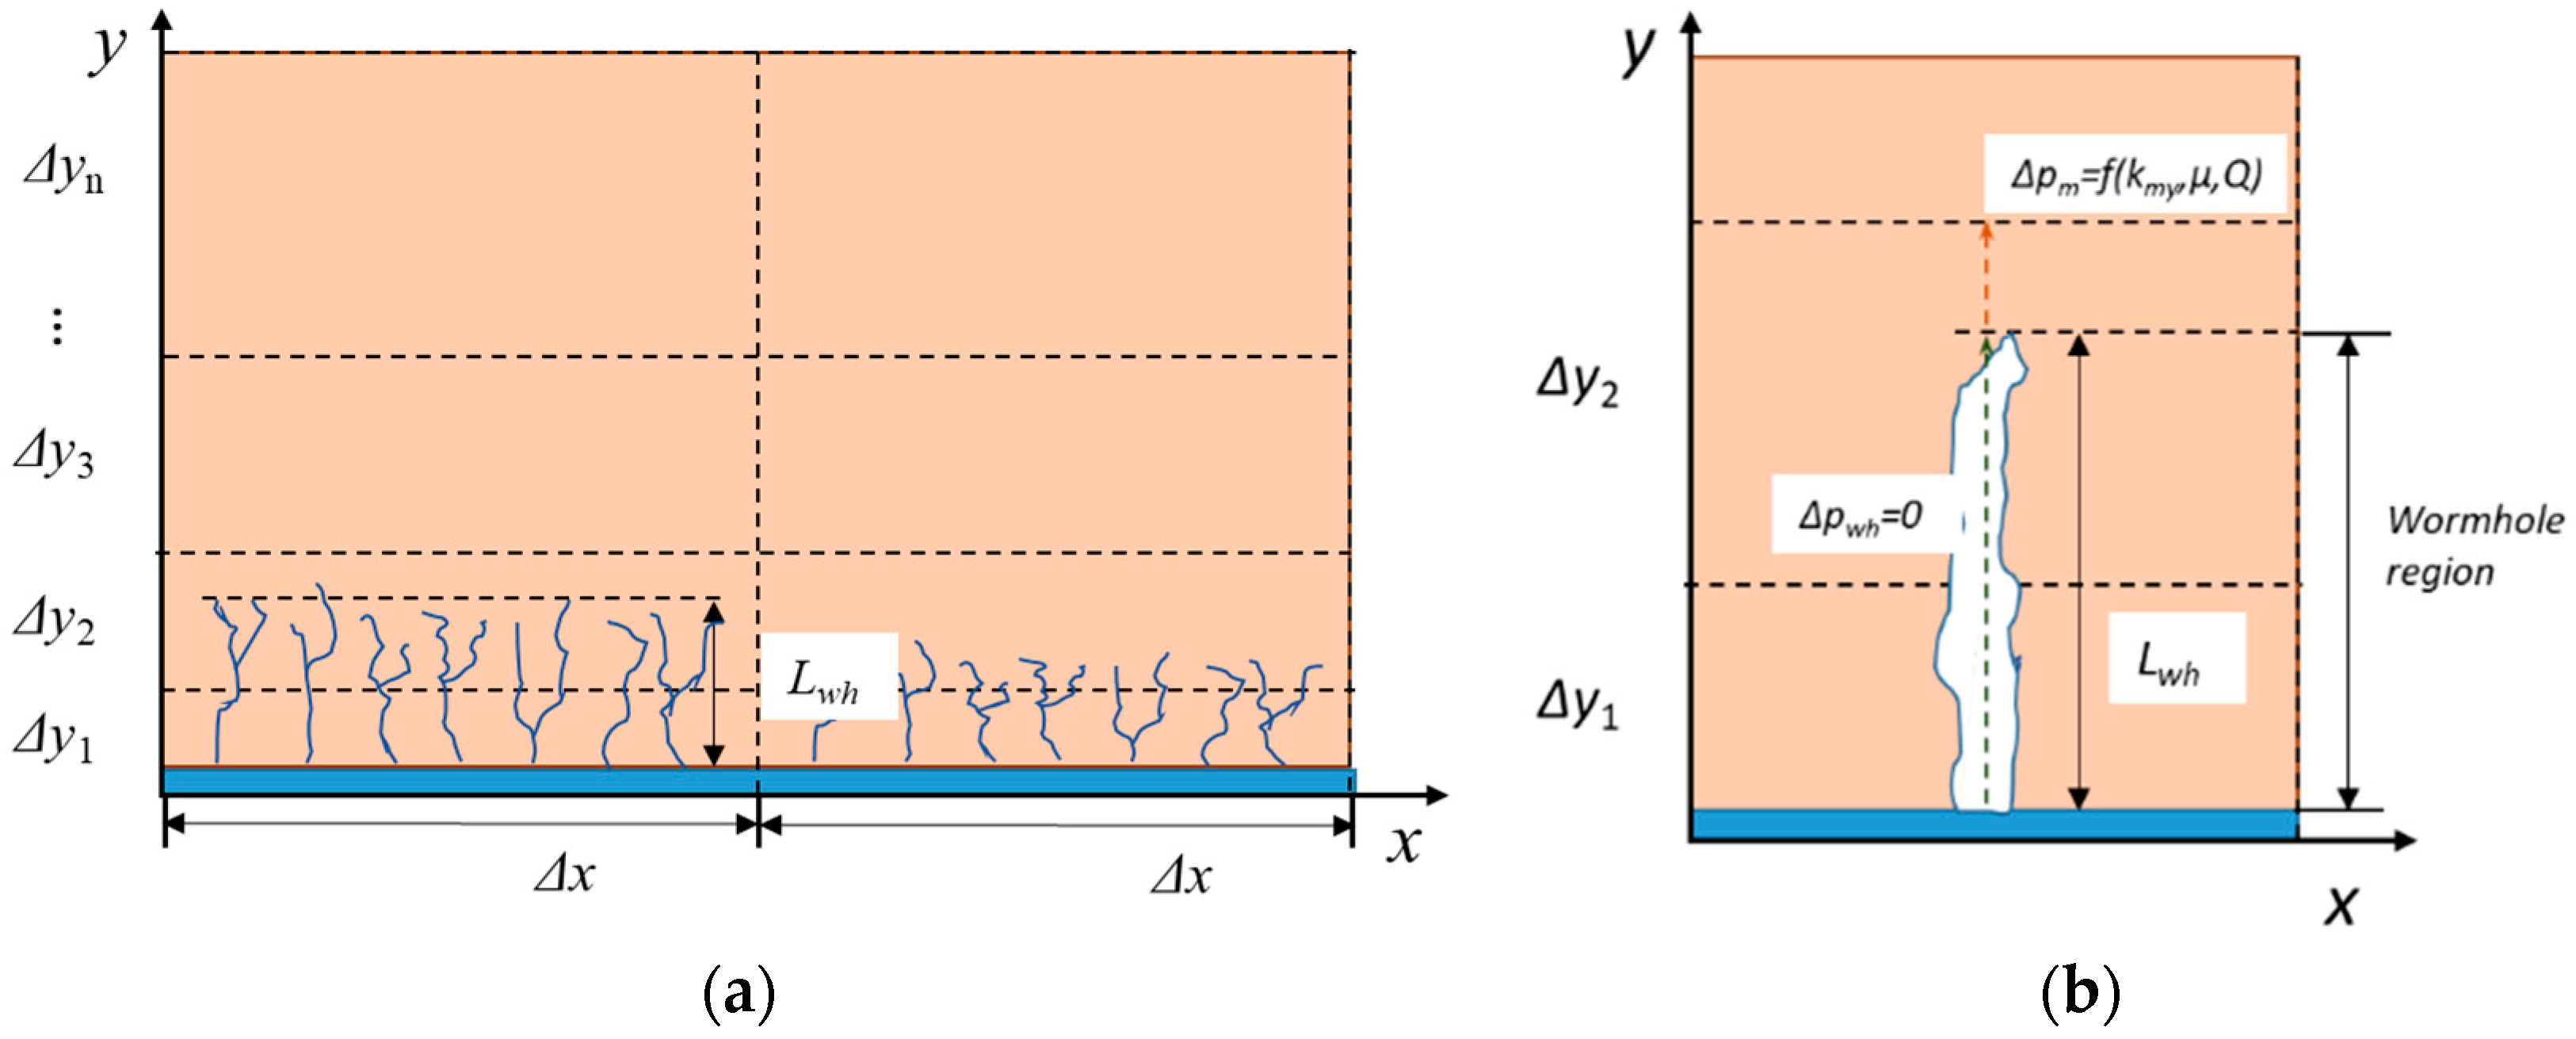
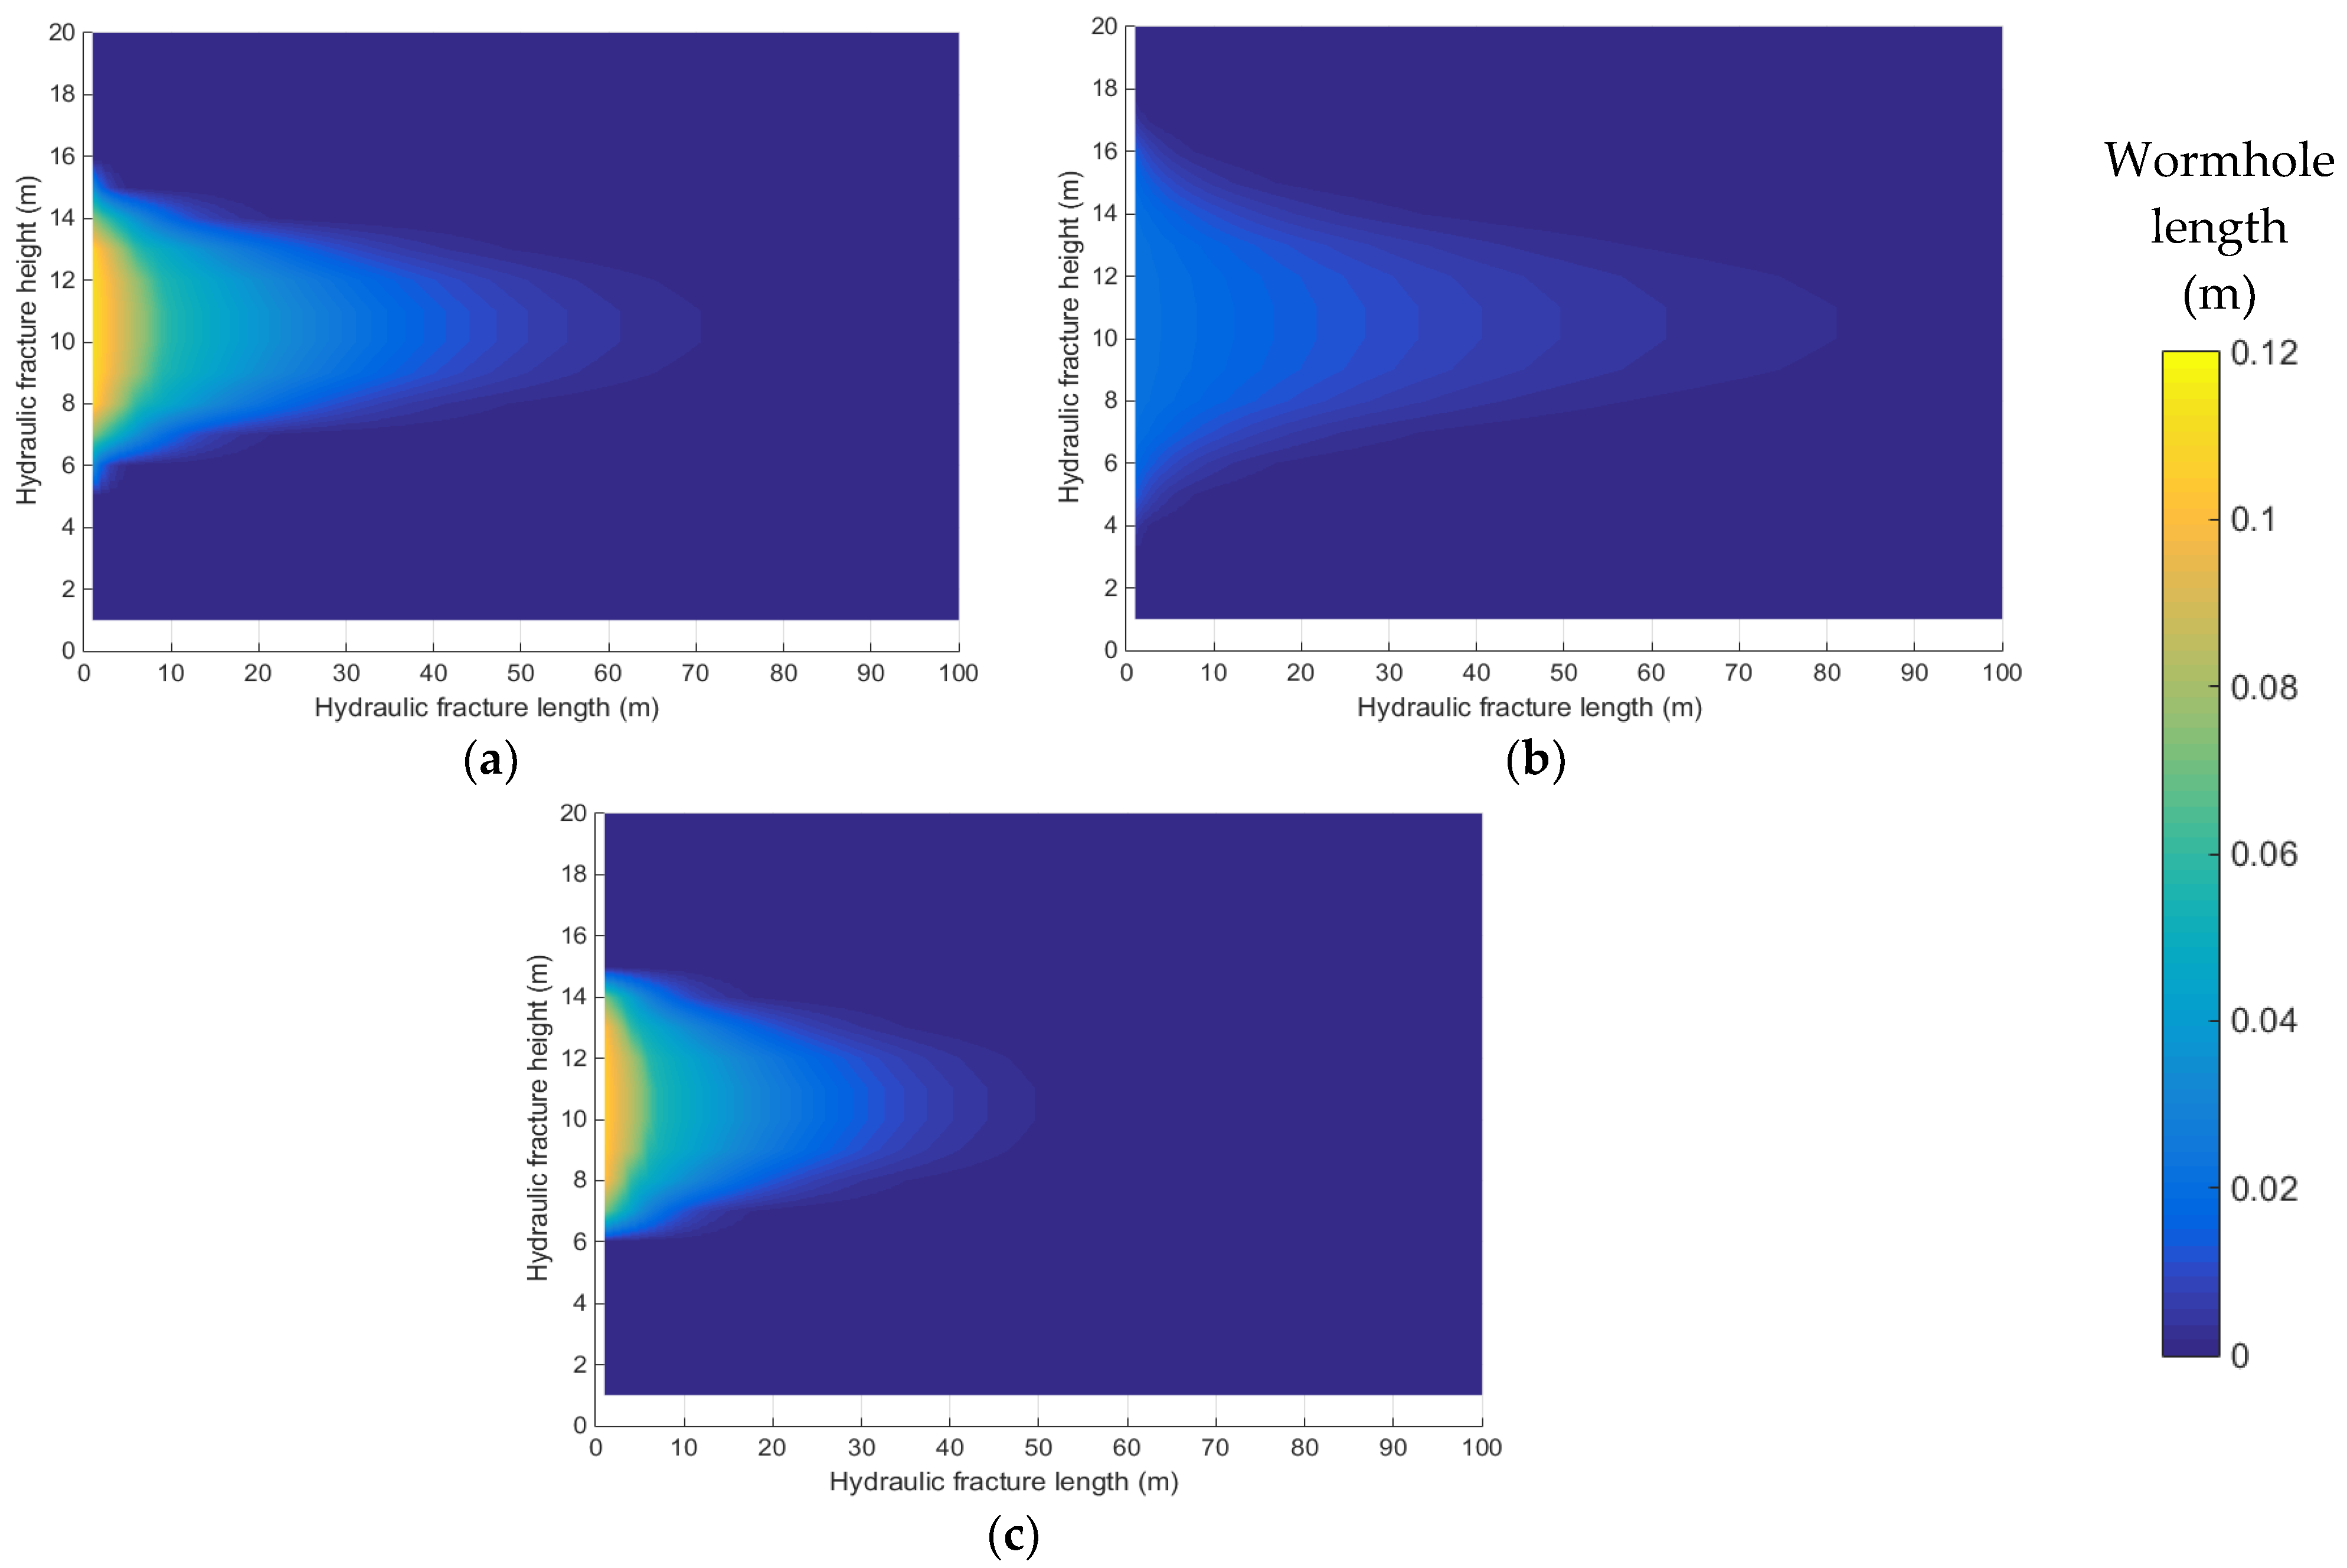
5.2. Wormhole Leak-Off Behavior

This section studied the effects of matrix permeability (1, 10 mD) on wormhole propagation and distribution. The former research showed that PVbt,opt is reduced with reservoir permeability, while there is no apparent relationship between vi,opt and reservoir permeability (Etten, 2009) [33]. Therefore, several cases were simulated with PVbt,opt varying from 0.048 to 0.026 to 0.005 with the matrix permeability ranging from 10 mD to mD 1 to 0.1 mD while vi,opt considered equal to 2.3 × 10⁻⁴ m/s. The injection rate and time are the same as in the last section, and other input parameters are given in Table 1.
Figure 15 reveals that the wormhole region length increases as the matrix permeability increases. Furthermore, Figure 15b also shows that the influence of wormhole propagation quickly becomes substantial at the first 200 s of the acid injection, where the cumulative leak-off volume difference (the cumulative leak-off volume considering wormholes minus cumulative leak-off volume without considering wormholes) increases sharply with a quick increasing grid permeability.
It is also observed from Figure 16 that the wormhole length distribution is affected by both the matrix permeability and natural fractures. The case with lower matrix permeability has a shorter wormhole length and more extensive wormhole distribution than the cases with higher permeability. At the same time, the distribution length decreases with the increasing leak-off caused by the natural fractures.

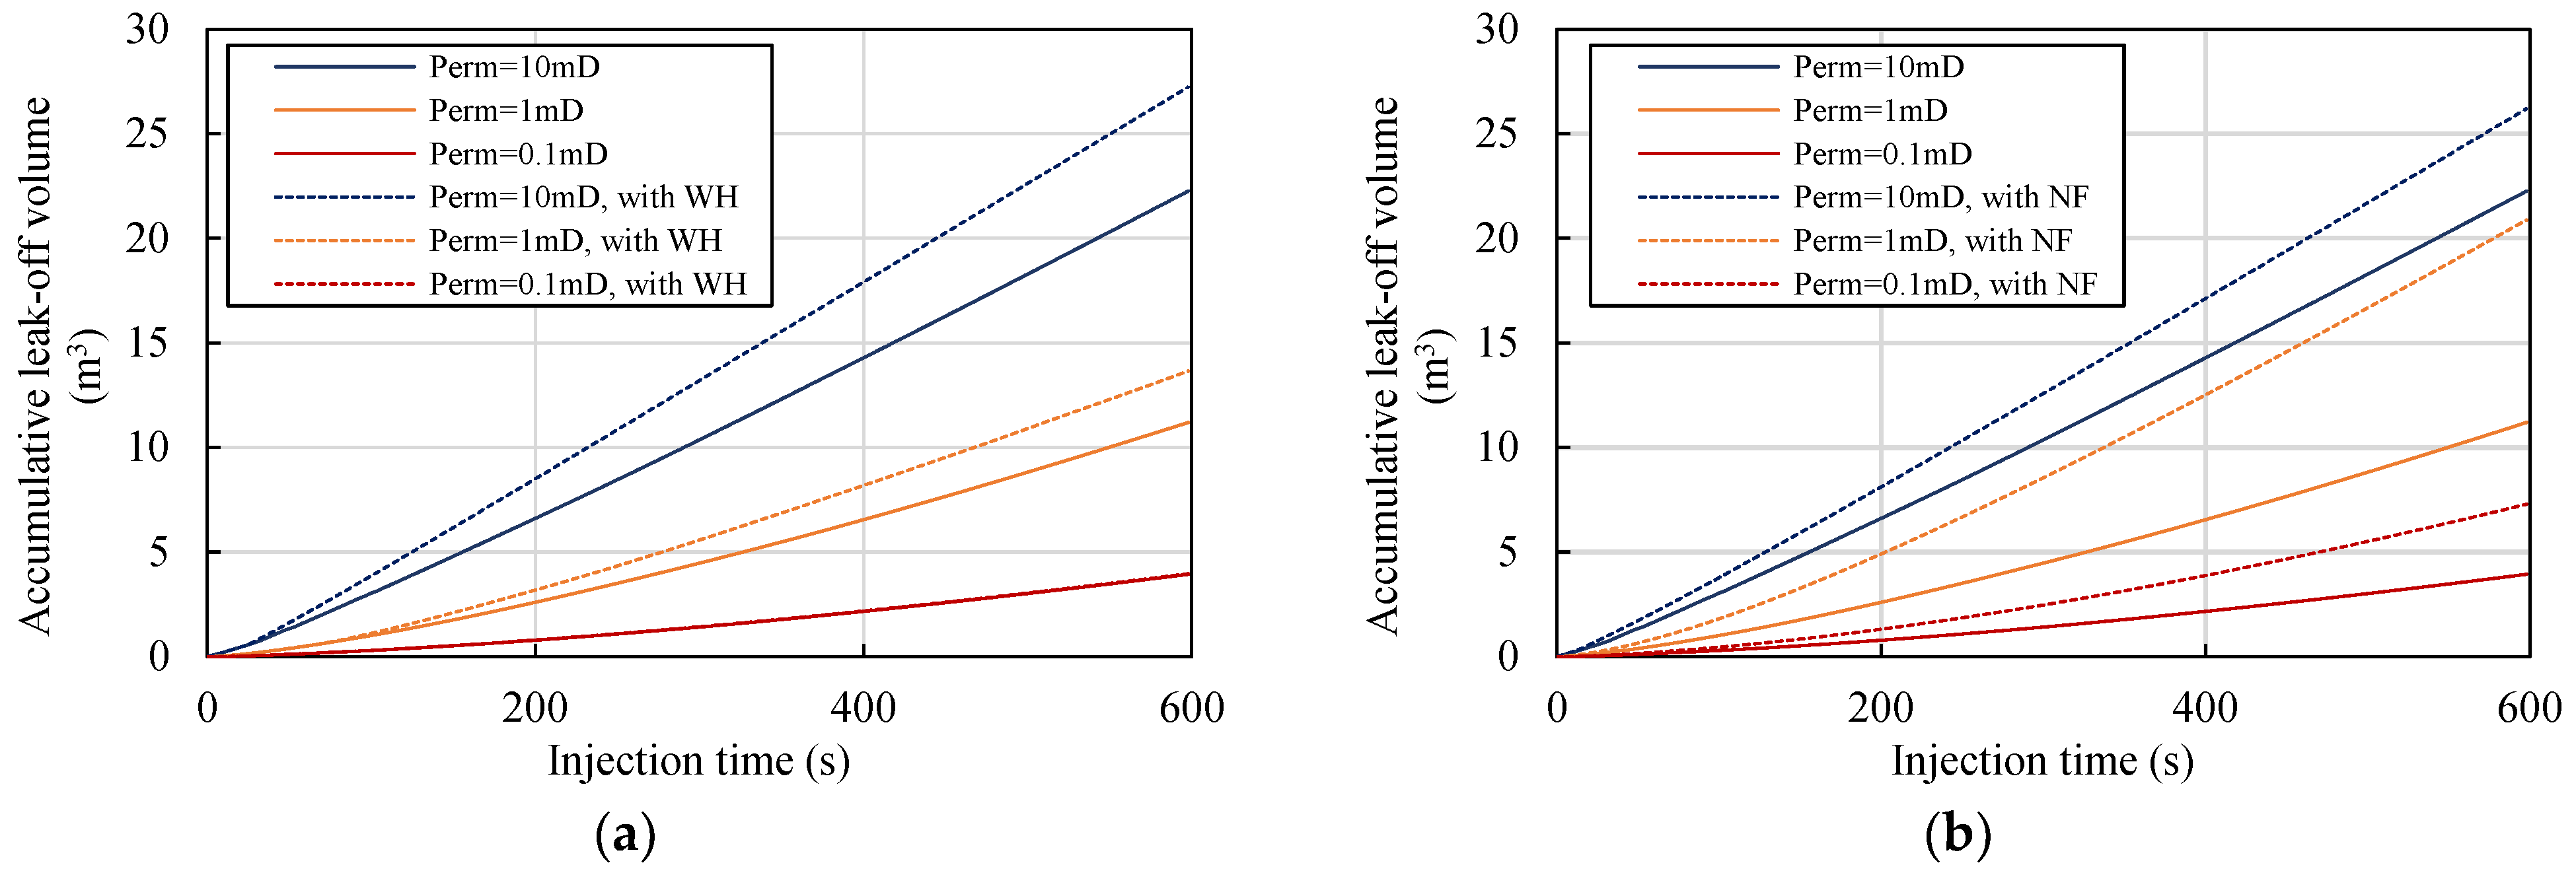
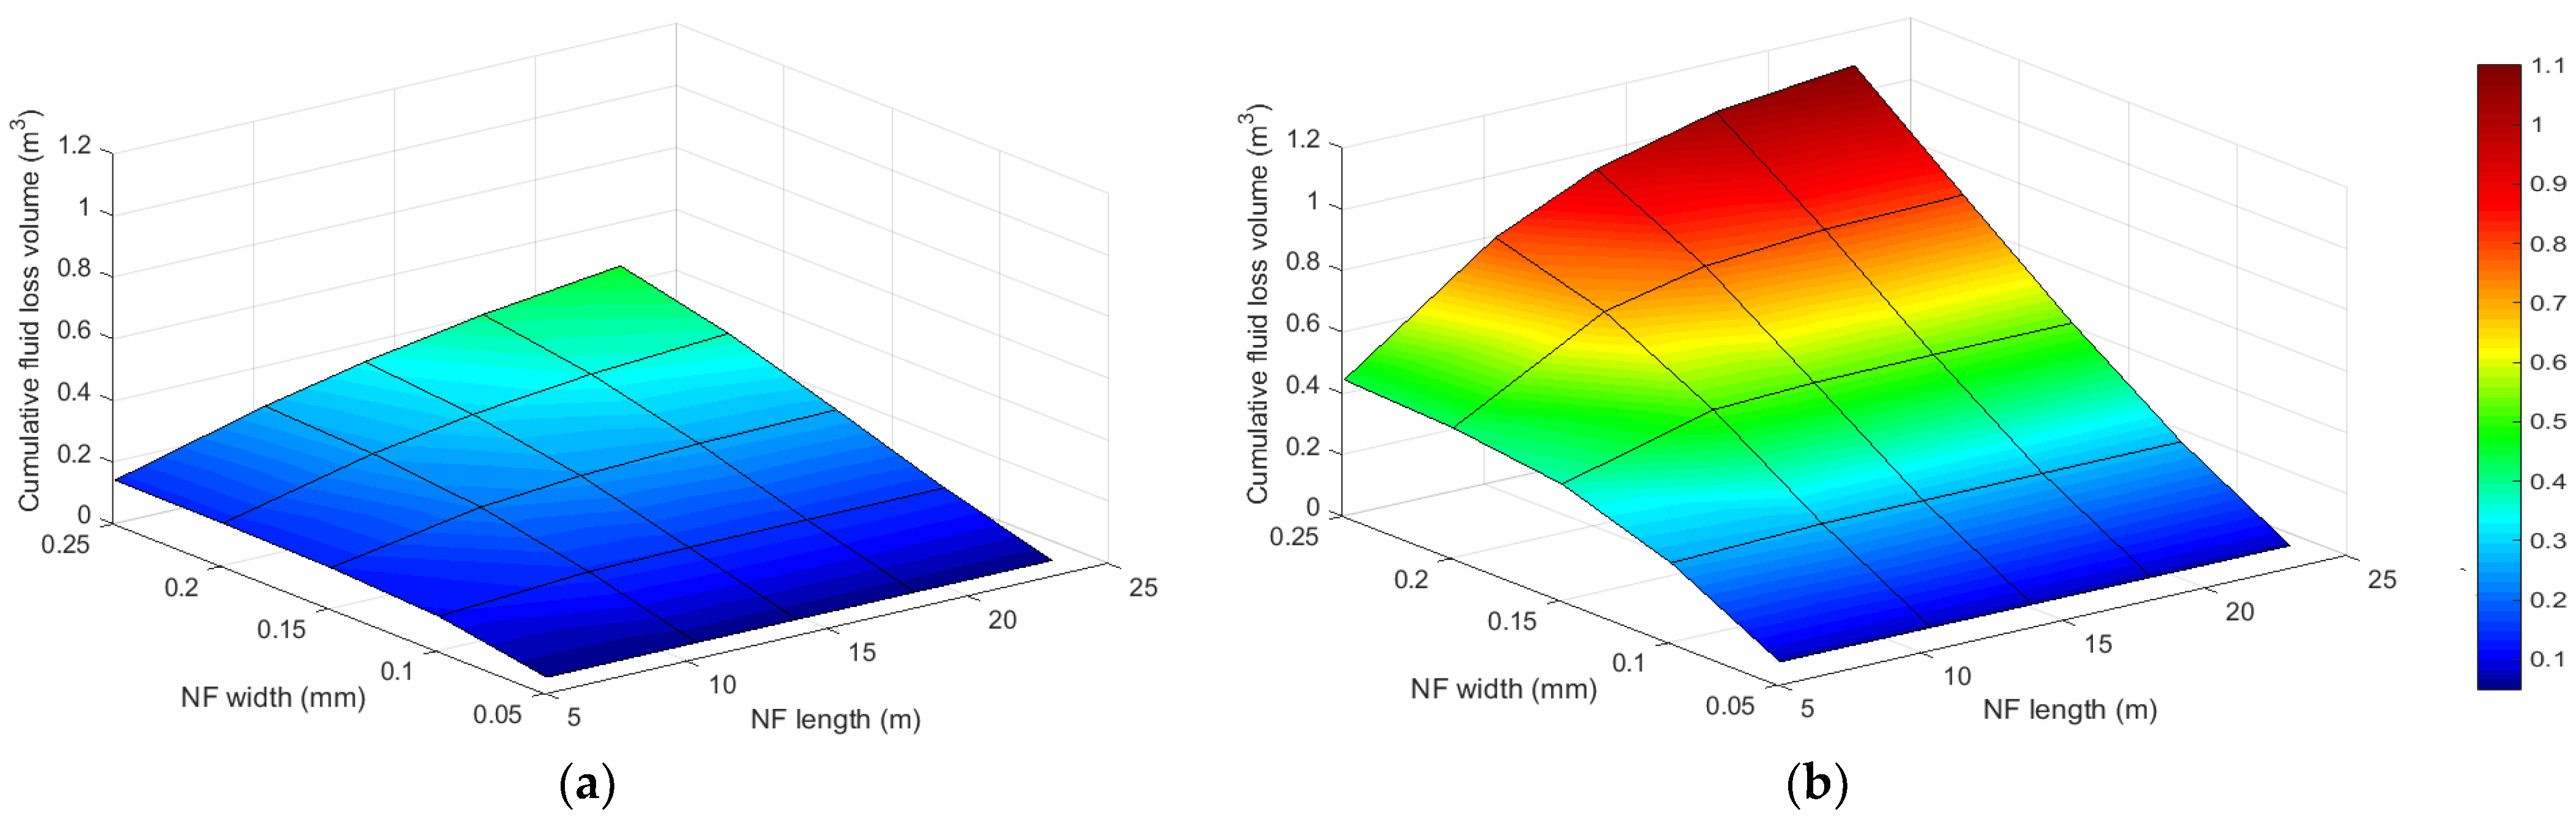
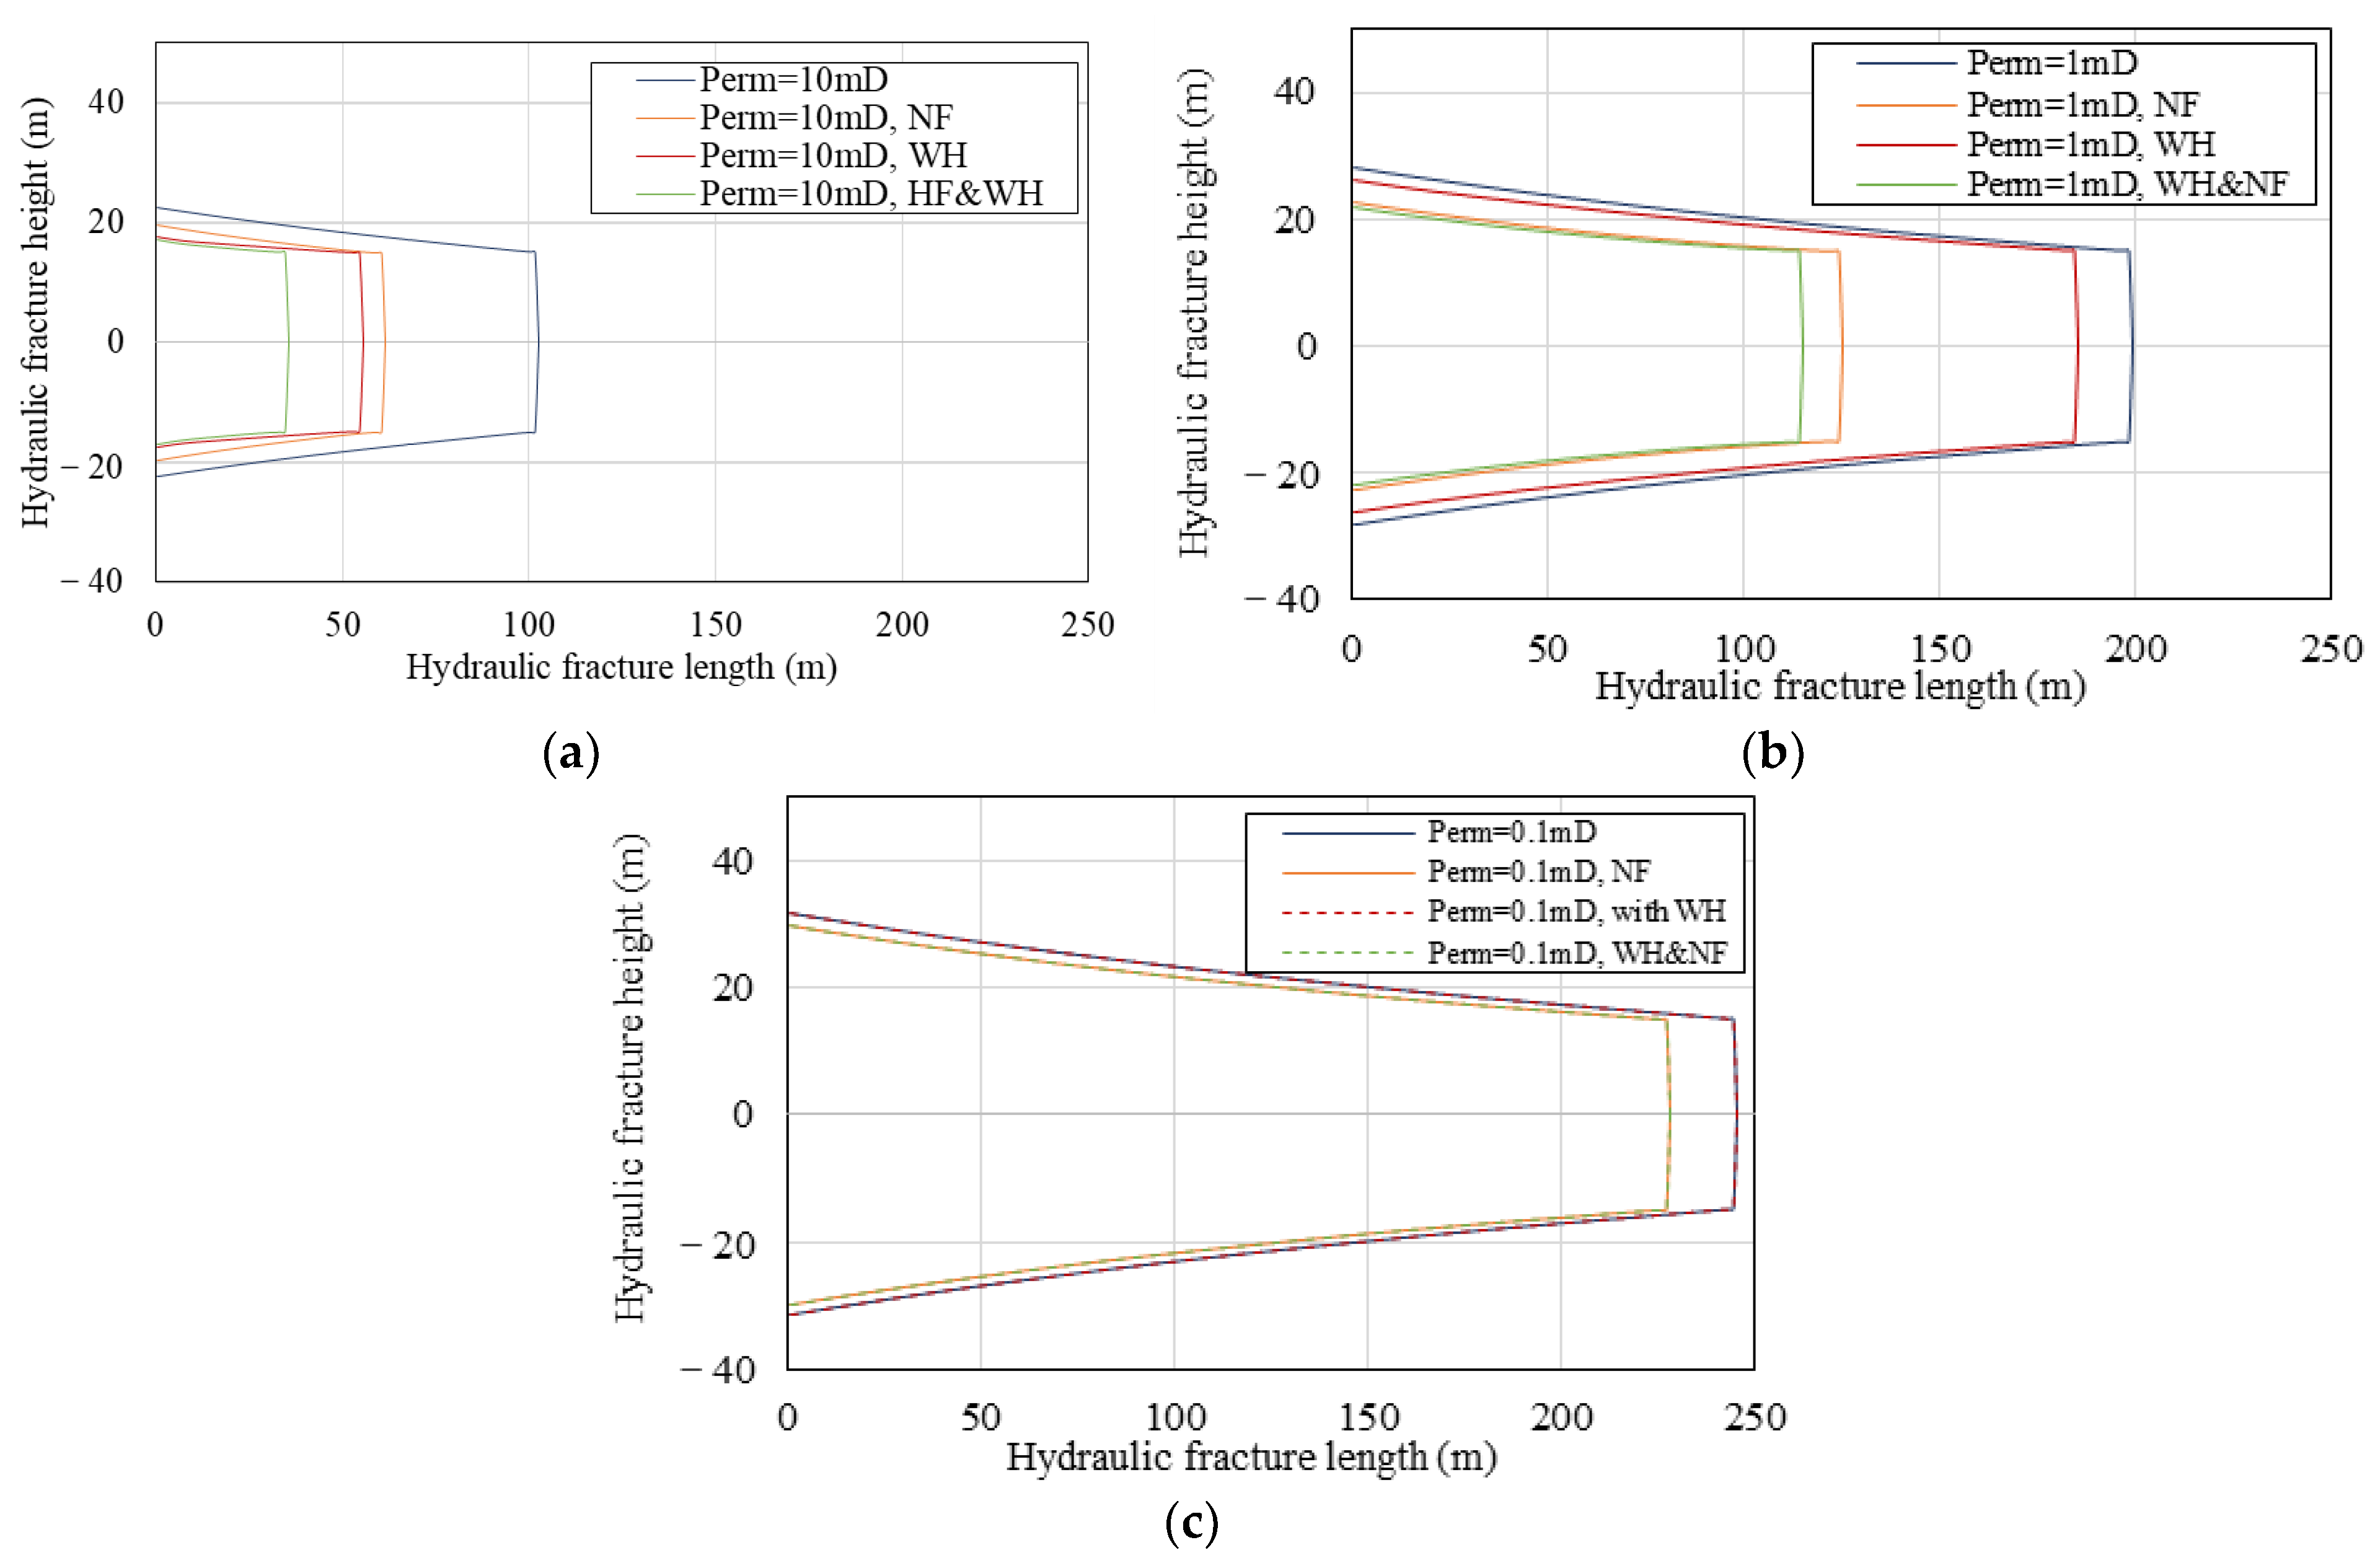
5.3. Cumulative Leak-Off Volume and Hydraulic Fracture Propagation

We can see that the matrix permeability affects the leak-off behavior of both wormholes and natural fractures. So, the effects of wormhole and natural fractures on cumulative leak-off volume and hydraulic fracture propagation were investigated by simulating the cases with matrix permeability varying from 0.1 mD to 1 mD to 10 mD. The natural fractures were considered constant width and length of 100 μm and 10 m. Other treatment and reservoir conditions were the same as in the last section.
It is observed that the cumulative leak-off volume increases when considering wormholes and natural fractures but in different regularity. For the wormhole case, there is only a slight increase with 0.1 mD permeability (Figure 17a). As the permeability increases, the increase becomes substantial, and the influence becomes even more significant than the simulated natural fractures when the matrix permeability is 10 mD. The results also show that as the matrix permeability increases, the most considerable leak-off increment of natural fracture cases appears at 1 mD (Figure 17b). This is because, with the simulated reservoir condition, the leak-off through natural fractures is limited by the leak-off capacity in the 0.1 mD cases, but restricted by the number of natural fractures intersected in the 10 mD cases.
It is observed that the increased acid leak-off caused by the natural fractures and wormholes limits the hydraulic fracture growth (Figure 18). When the permeability is 0.1 mD, the impact of natural fractures is relatively small on the hydraulic fracture geometry. When the permeability increases to 1 mD, the influence of natural fractures and wormholes on fracture geometry increases. At this time, the impact of natural fractures is more significant than that of wormholes, and the length of hydraulic fractures is dominated by natural fracture leak-off. When the permeability increases to 10 mD, the dynamic length of hydraulic fractures is shortened by 65% compared with the 1 mD case. When the reservoir permeability is relatively high, the leak-off seriously affects the propagation of hydraulic fractures. At this time, the effects of wormholes and natural fractures on hydraulic fracture geometry are similar. The hydraulic fracture propagation mechanism has changed from natural fracture leak-off control to competitive control by natural fracture and wormhole leak-off.

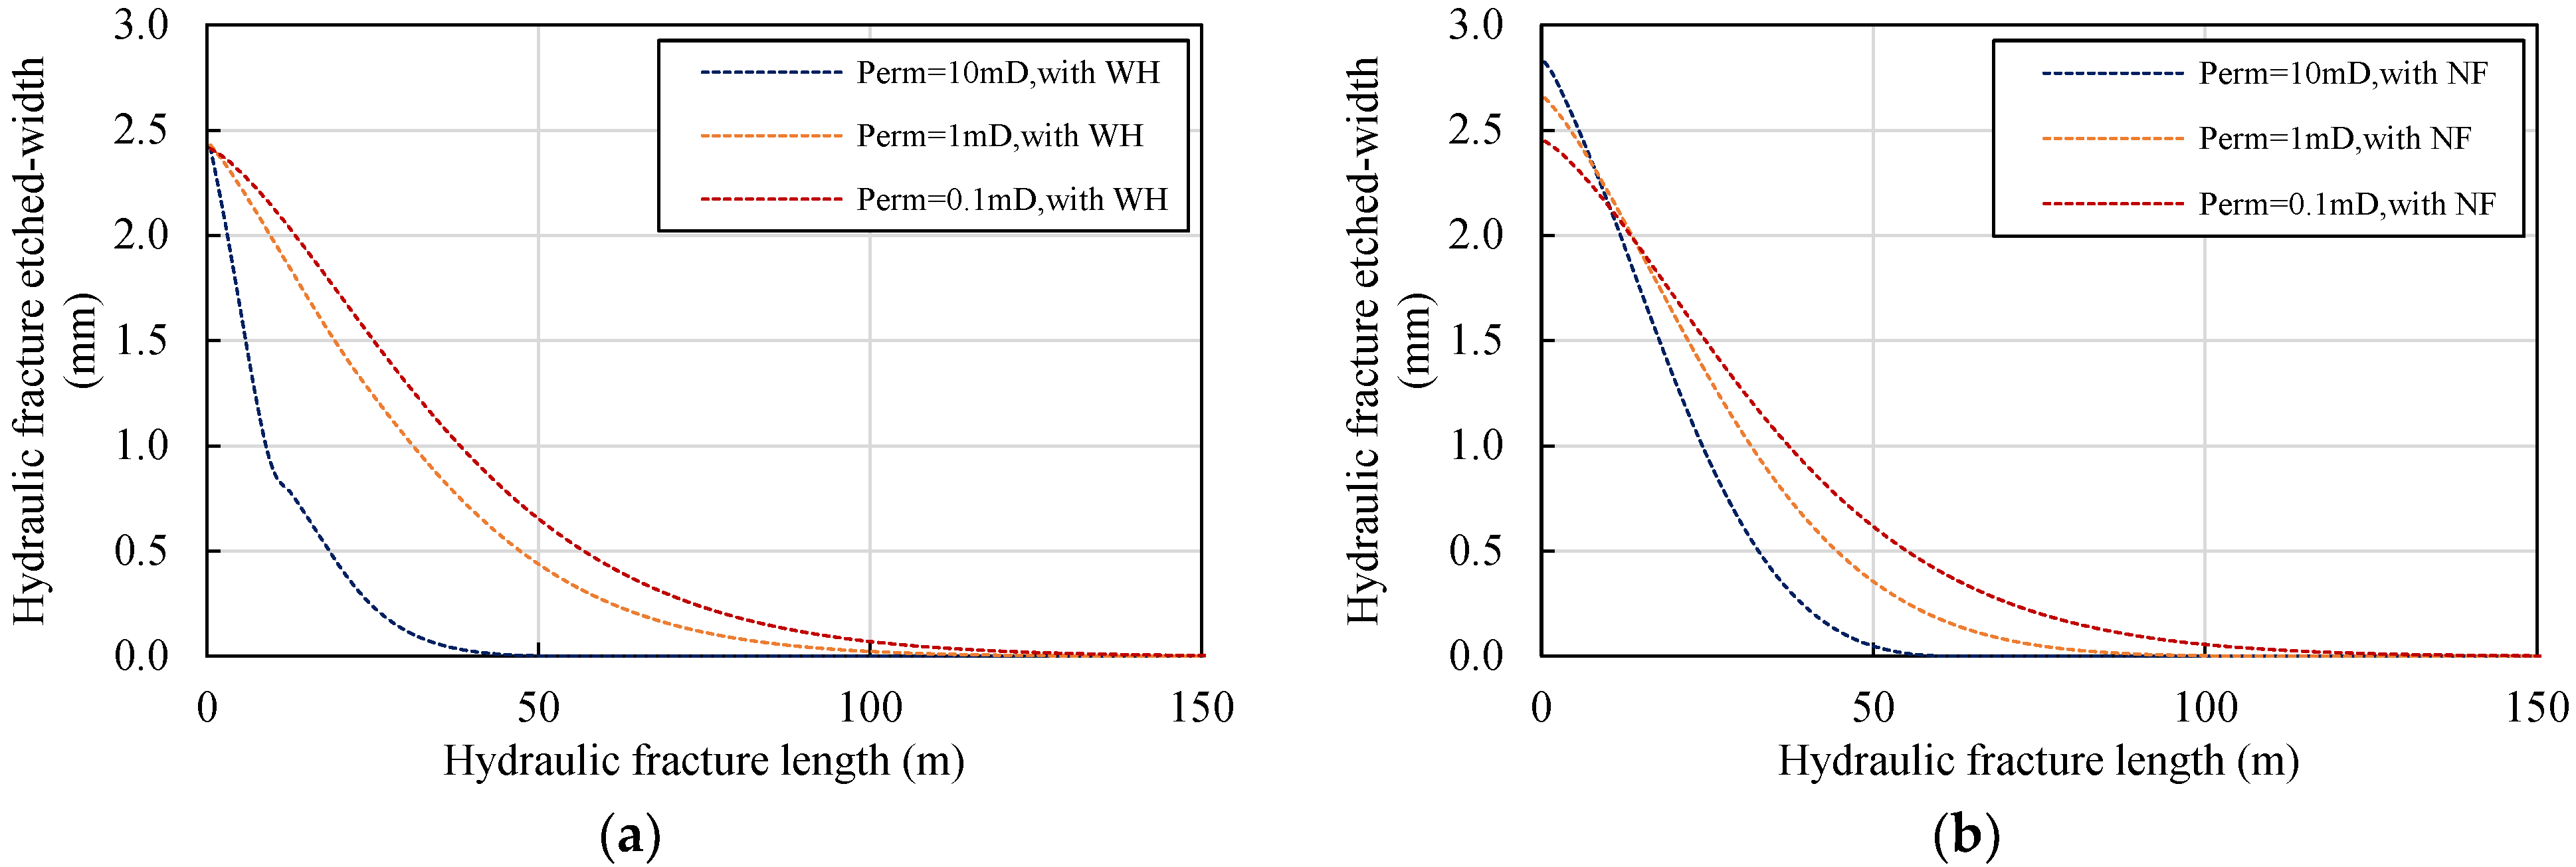
5.4. Acid Etching in Hydraulic Fracture

The effects of wormholes and natural fractures under different matrix permeability on the acid-etched width profile are studied by simulations with matrix permeability varying from 0.1 mD to 1 mD to 10 mD. Other treatment and reservoir conditions were the same as in the last section.
It can be seen from Figure 19 that the impact of natural fractures and wormholes on the etching pattern of hydraulic fractures are quite different. Since wormholes are mainly developed at the entrance of hydraulic fractures (Figure 19a), the leak-off caused by them is also concentrated in the same place. Therefore, it greatly changes the slope of the front section of the etching width curve, which leads to a rapid etching width decrease near the entrance of the hydraulic fracture in the 10 mD case. On the contrary, the natural fractures are evenly distributed throughout the reservoir, and the leak-off of natural fractures tends to change the slope of the profile curve across the entire fracture length (Figure 19b).
It is observed that when the matrix permeability is 0.1 mD, wormholes and natural fractures only slightly affect the acid penetration distance and the maximum dissolution width. With the increase in permeability, the influence of leak-off on etching gradually becomes stronger. It shows different characteristics (Figure 20). Since the chemical leak-off ability of wormholes increases by orders of magnitude with the increase in permeability (Figure 20b). When the permeability increases, the acid penetration distance decreases in the case of wormholes. While the permeability increases to 10 mD, the effective etching length is reduced to 19.3 m, which significantly limits the length of the etched hydraulic fractures (Figure 20a).
On the contrary, since the leak-off of natural fracture is controlled by the length, width, and permeability, increasing the permeability decreases the acid penetration distance. In the meantime, changes in leak-off will affect the propagation of hydraulic fracture, thereby affecting the number of natural fractures it encounters. Therefore, when the matrix permeability increases from 0.1 mD to 10 mD, the effective etching length shows a relatively stable downward trend. As the leak-off increases, net pressure in the hydraulic fracture decreases, leading to a smaller fracture width. A smaller hydraulic fracture width will increase the flow velocity in the fracture, leading to an increase in the mass transfer coefficient. Therefore, the maximum etching width of the fracture increases slightly with the increase in matrix permeability.

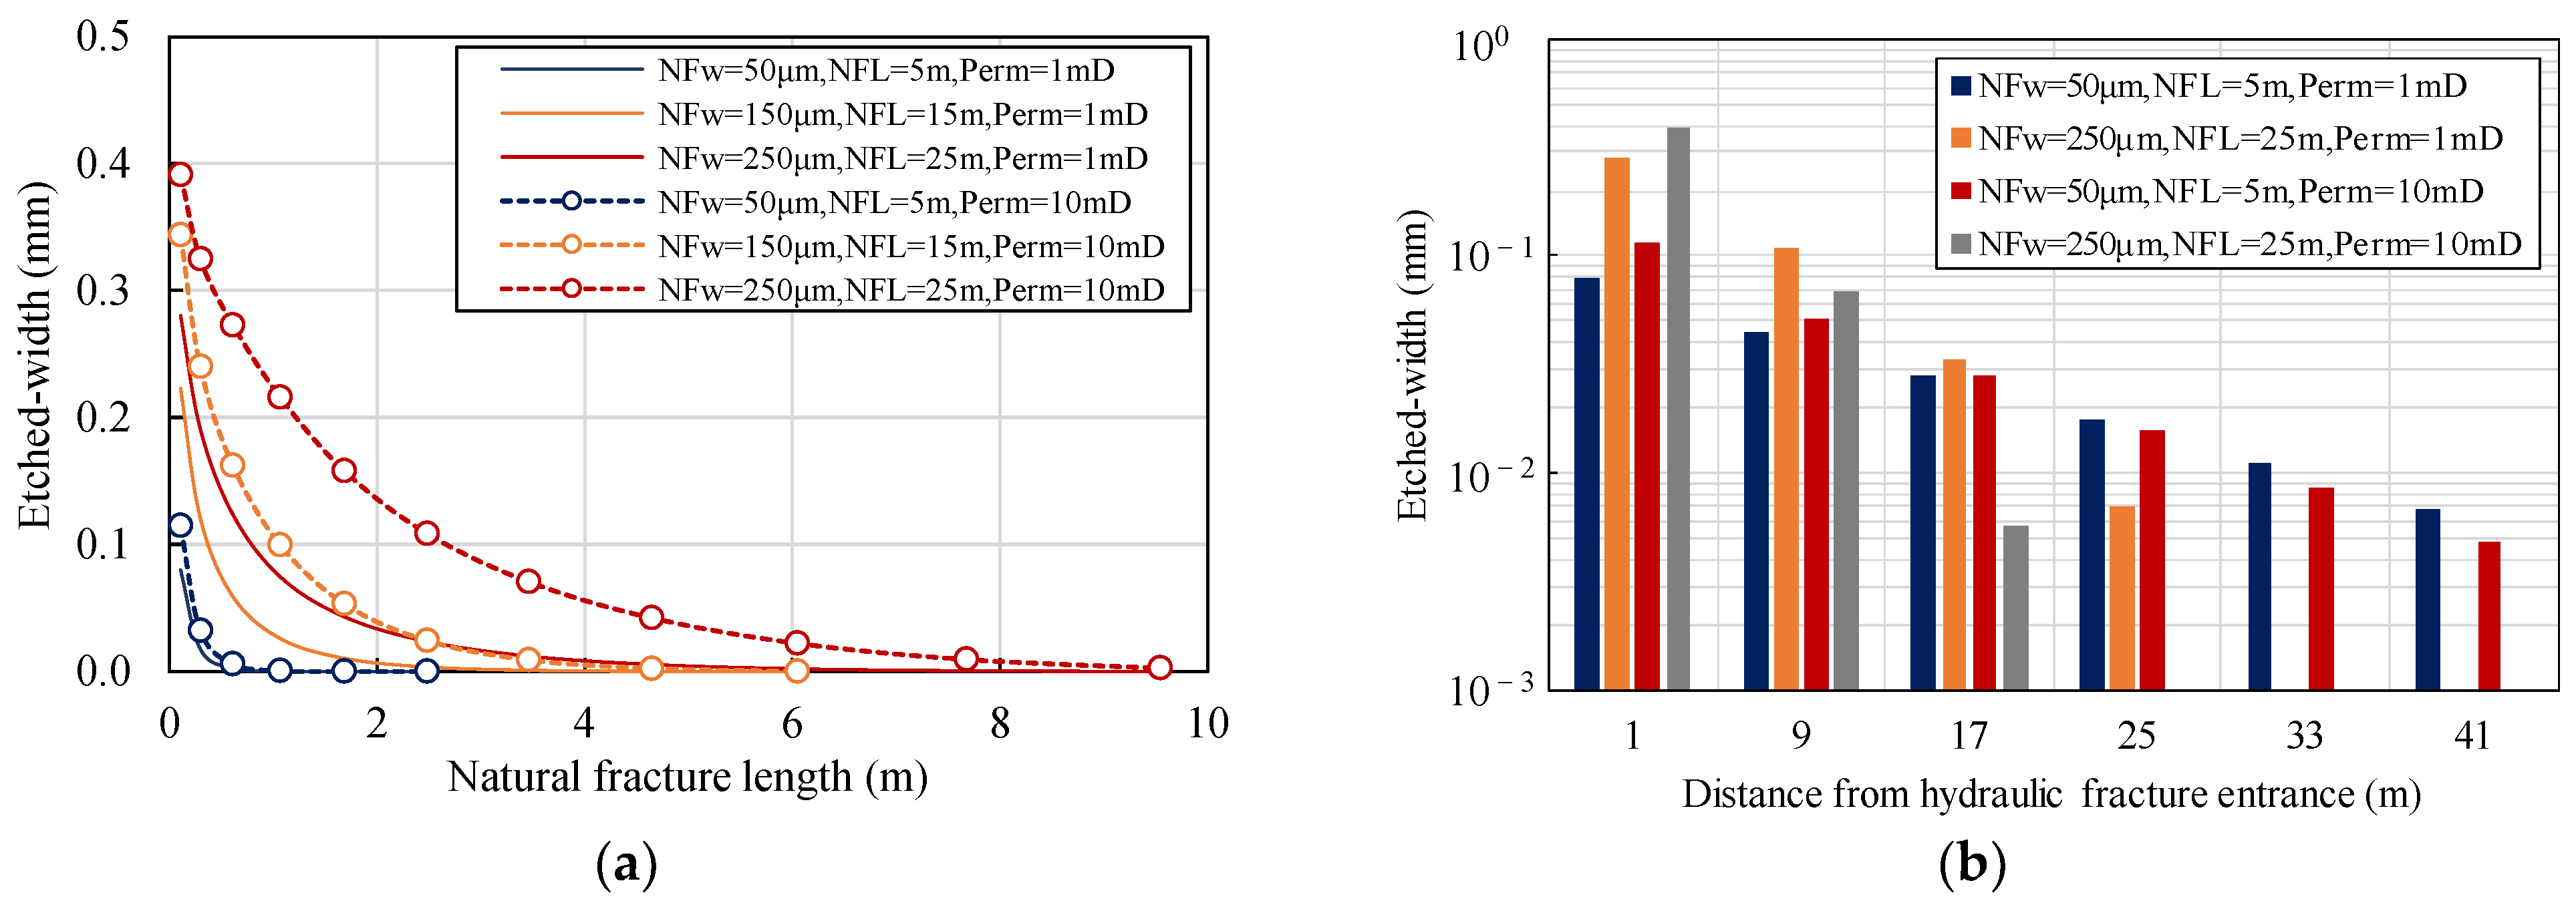
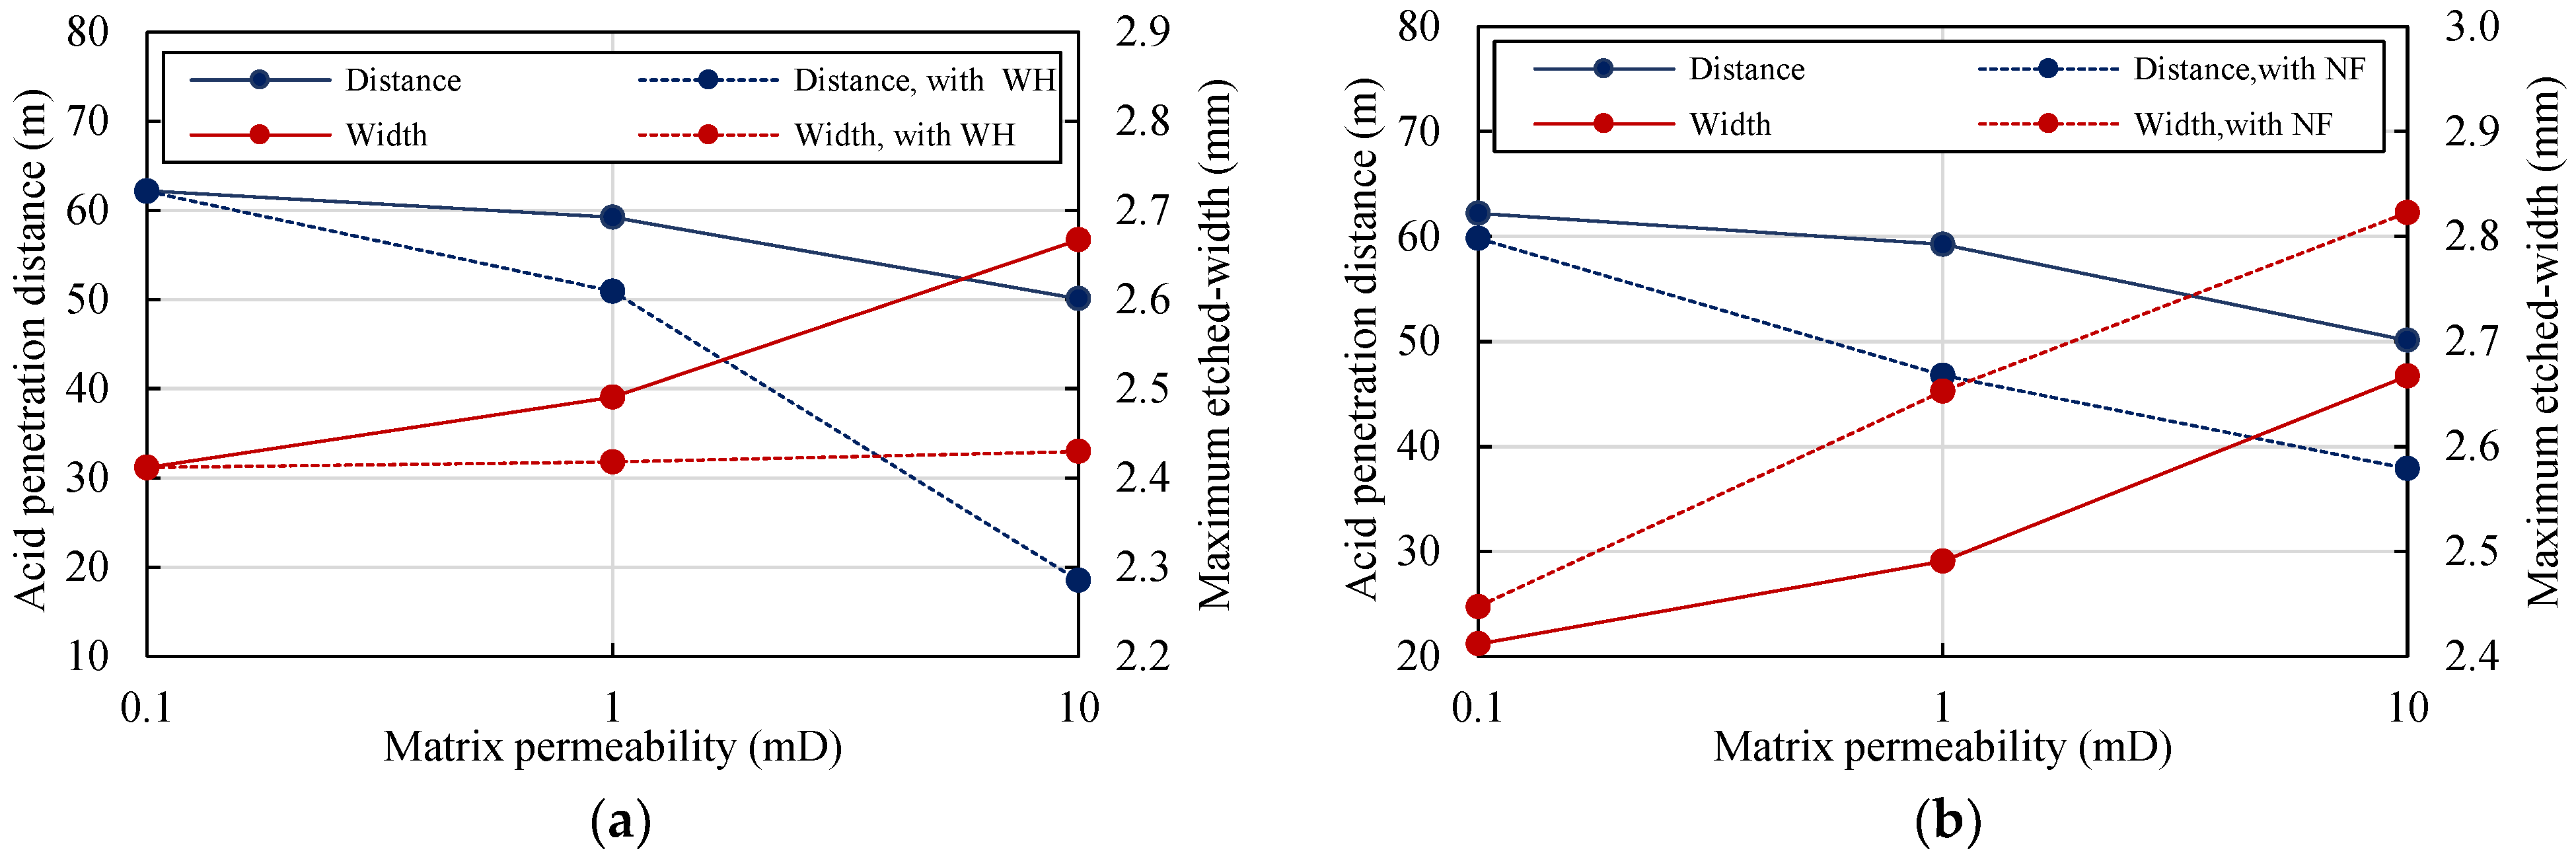
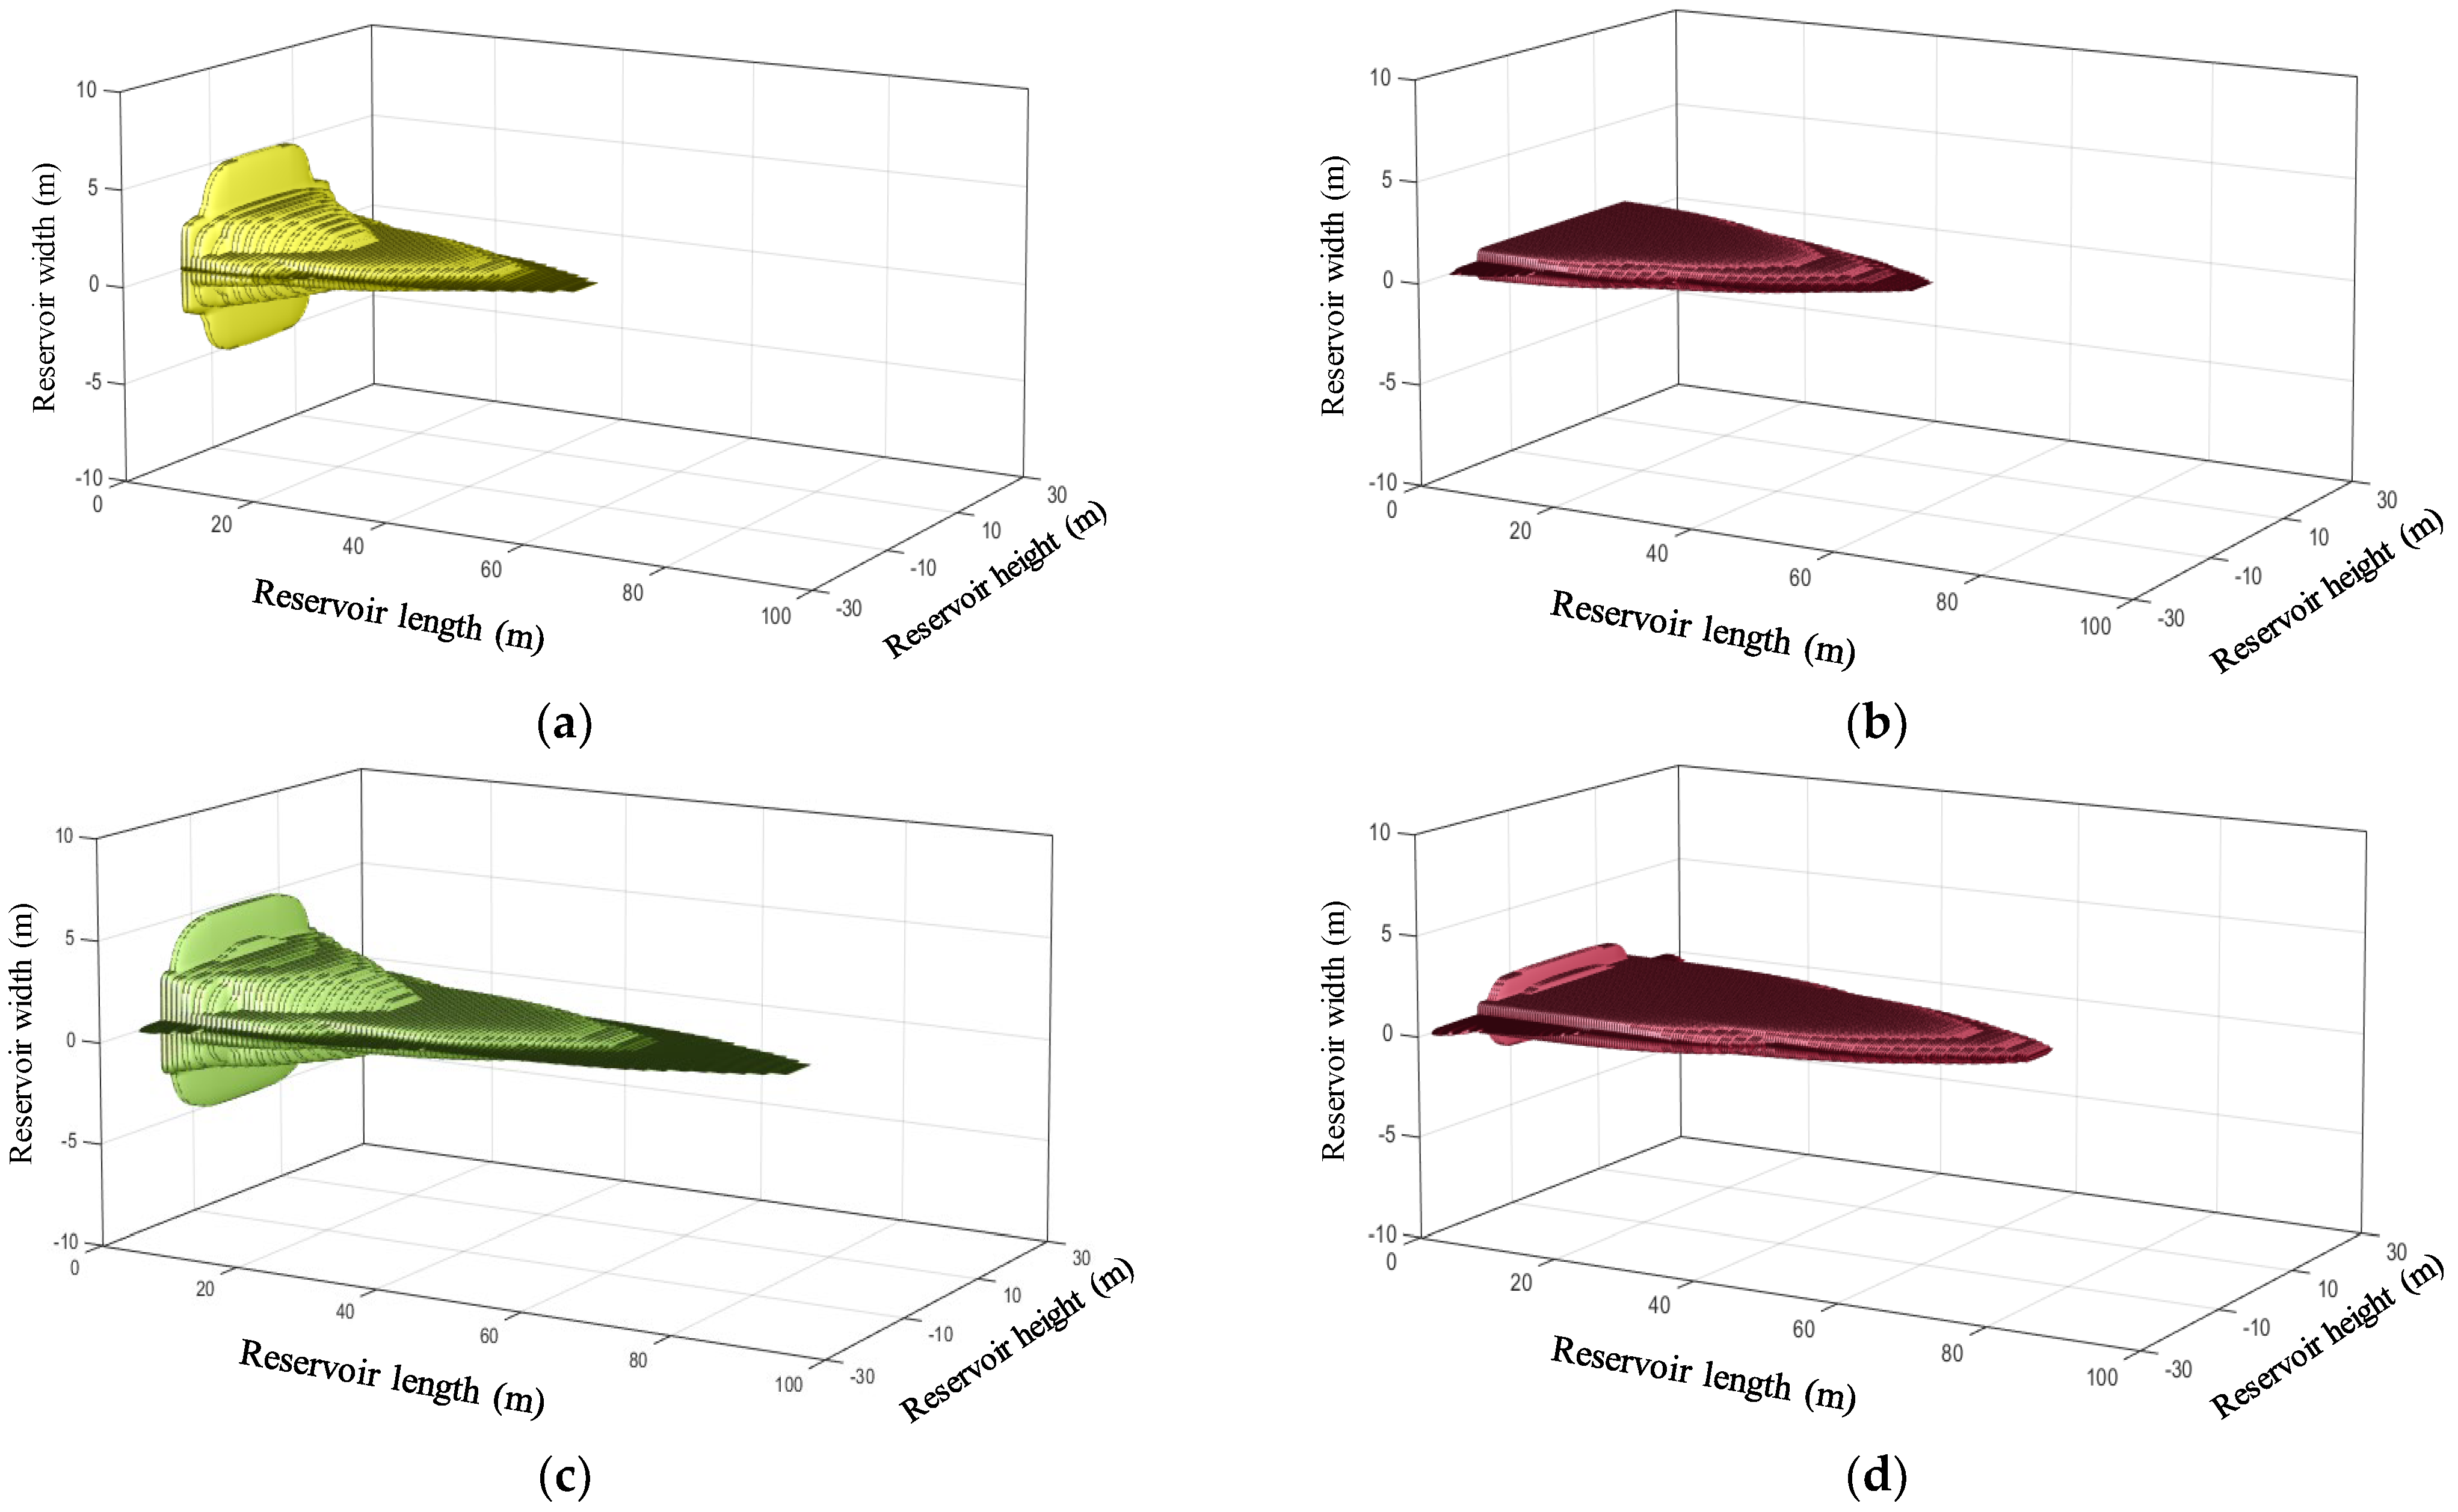
5.5. Acid Etching in Natural Fractures

The results presented in Figure 21 reveal that the natural fracture geometry and matrix permeability also substantially influence the acid etching in natural fractures. The etched-width in the natural fractures decreases sharply along the natural fracture length. It is observed that natural fractures with larger initial widths and longer lengths have both larger etched-width and longer effective etched-length compared to the natural fractures with smaller initial widths and shorter lengths because of the higher cumulative leak-off volume and flow velocity (Figure 21a).
Figure 21b reveals that the etched-width is larger for the natural fractures near the hydraulic entrance than the natural fractures farther from the hydraulic fracture inlet. The acid etching in natural fractures highly depends on the acid concentration profile in the hydraulic fracture. It is also observed that as the leak-off capacity of natural fractures decreases, the etching pattern of natural fractures developed from etching several natural fractures near the hydraulic fracture entrance to more homogeneous etching over a longer distance.

5.6. Acid Fracturing Strategy Study

The geological parameters that affect the acid fracturing results mainly include reservoir permeability, natural fracture geometry, and distribution. To analyze the optimal treatment parameters in different reservoir situations, four cases were designed to represent different conditions (Table 2). Case 1 represented an extremely high leak-off condition caused by both high matrix permeability and conductive natural fractures. Case 2 replaced the conductive natural fractures in Case 1 with natural fracture networks with natural fractures of small width but high density. Case 3 represents the reservoir with less matrix permeability and less conductive natural fractures compared to case 1, which is used to study the acid fracturing performance in a poorer reservoir. Finally, Case 4, which had low matrix permeability and natural fracture networks with the highest natural fracture density, was proposed. Treatment parameters, including injection rate and volume, were set to 3–10 m3/min and 100–400 m3. The values of other parameters were adopted, as shown in Table 1.
To properly evaluate the effect of treatment parameters on productivity, a production model for naturally fractured carbonate reservoirs, which was presented by Ugursal et al. (2018) [32], was adopted in this study to calculate the dimensionless production index. The calculated wormhole permeability and conductivities of hydraulic and natural fractures were adopted to solve this model. The results presented in this study used the constant flow rate boundary at the wellbore and no-flow at the outer boundaries, and the production in the index is calculated in a pseudo-steady state.

5.7. 10 mD Permeability: Case 1 and Case 2

Figure 22 shows the calculation results of the dimensionless productivity index of Case 1 and Case 2 under different acid injection rates and acid volumes. As the acid volume increases, the dimensionless productivity index increases. Moreover, each given acid volume corresponds to an optimal acid injection rate controlled by reservoir characteristics. For example, in Case 1, the optimal acid injection rates under all acid volumes are 3 m3/min, and increasing the acid injection rate will decrease productivity (Figure 22a). This is due to the extremely low acid efficiency caused by the strong leak-off. It is difficult to increase the effective etched-length of hydraulic fractures by increasing the acid injection rate.
However, under the conditions of Case 2, the width of natural fractures (50 μm) limits the leak-off of natural fractures, the acid efficiency increases, and the natural fractures are less conductive than in Case 1. Therefore, when the acid injection volume reaches 300 m3 and 400 m3, it is recommended to increase the acid injection rate to 4 m3/min and 5 m3/min (Figure 22b).
It can be seen from the comparison of the acid etched-width, obtained by the optimal acid injection rate with 400 m3 injection volume in Case 1 and Case 2, that Case 1 needs higher fracture conductivity (Figure 23), which shows that under the condition of 10 mD permeability, compared with natural fracture network, natural fractures with higher fluidity have a higher contribution to productivity.

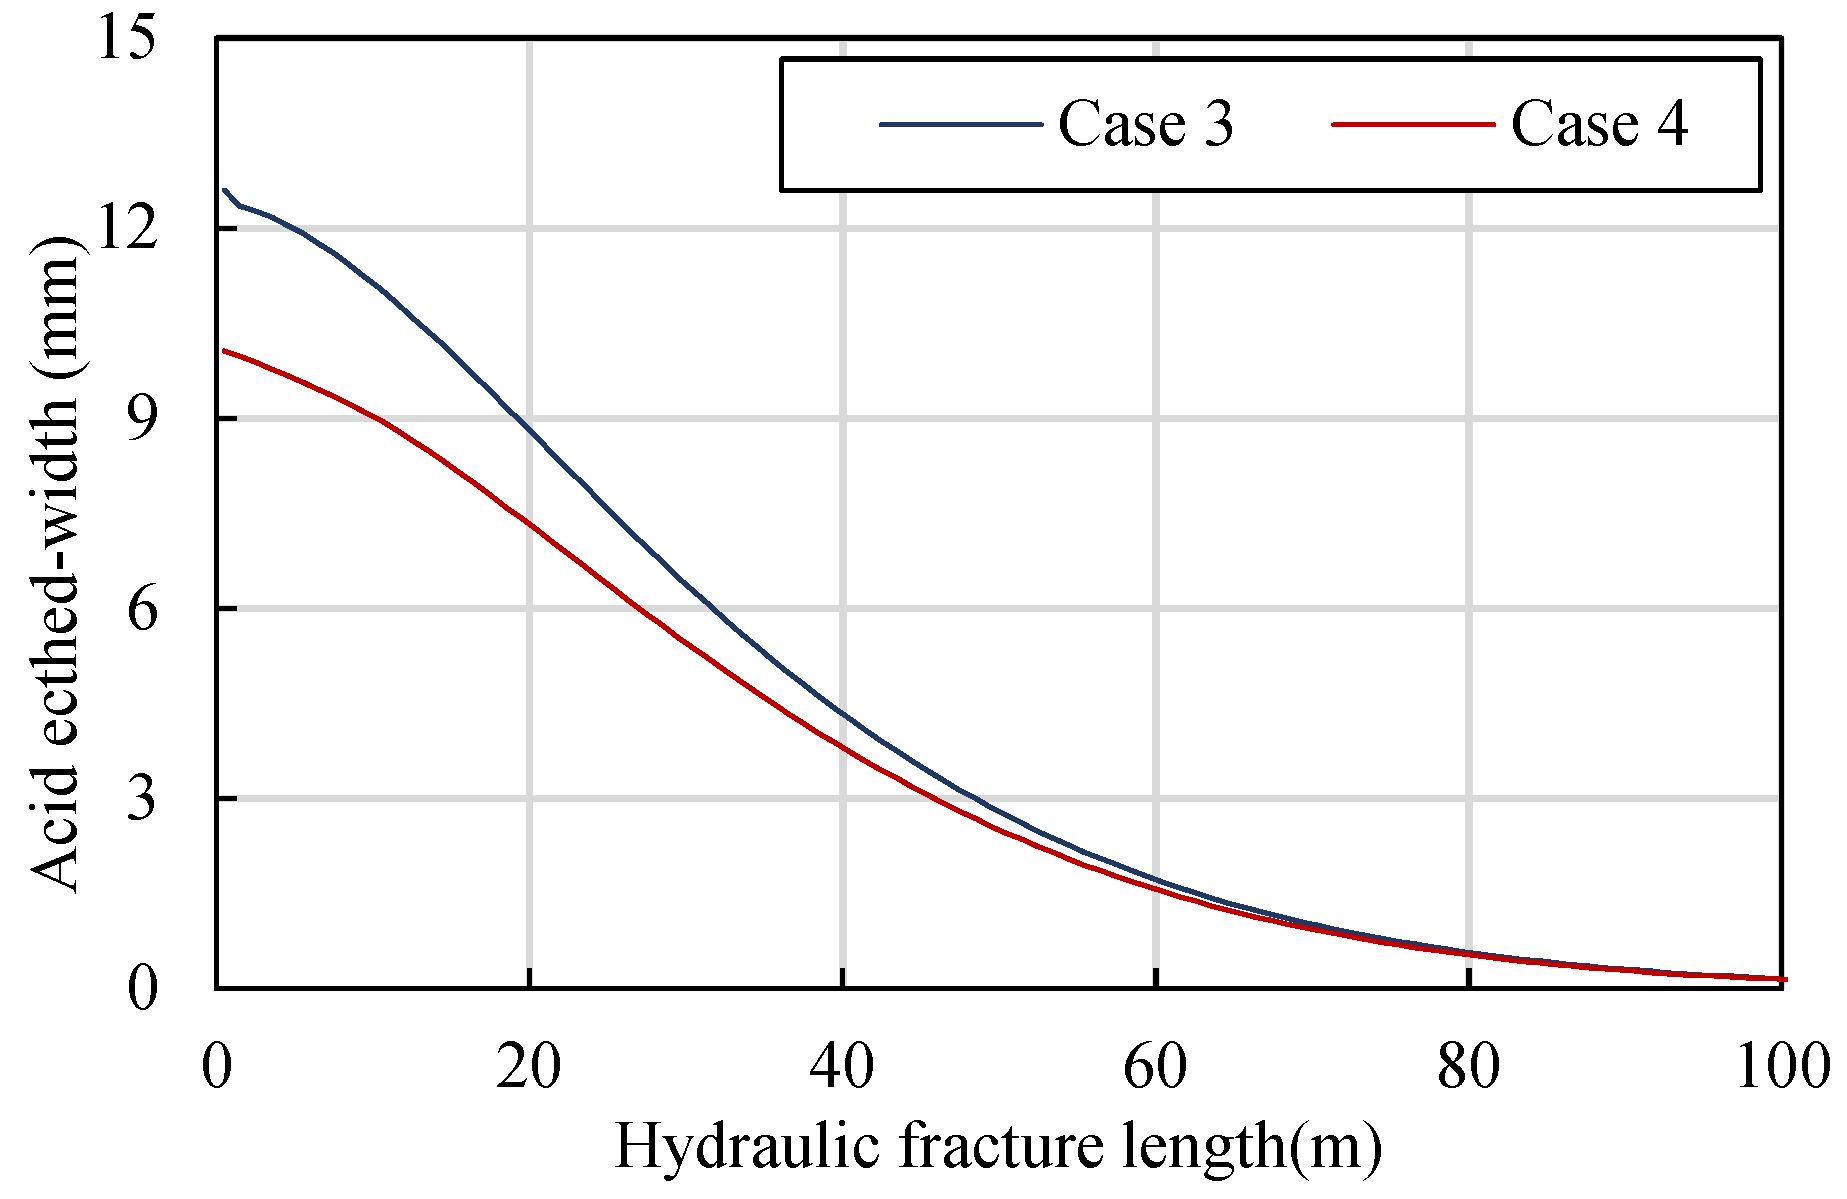
5.8. 1 mD Permeability: Case 3 and Case 4

Figure 24 shows the calculation results of the dimensionless productivity index of Case 3 and Case 4 under different acid injection rates and acid volumes. Under the 1 mD permeability condition, the optimal acid injection rate increases as the acid volume increases. However, the dimensionless productivity index shows a trend of first increasing and then decreasing. This is because the relatively low matrix permeability limits the leak-off of natural fractures and decreases the acid-etched width and length of the natural fractures, resulting in a decrease in their flow capacity after acid fracturing. A longer but less conductive hydraulic fracture is needed in such reservoirs compared to Case 1.
In Case 4, the acid volume and acid injection rate have the same effect on the dimensionless productivity index as in Case 3. However, the optimal acid injection rate continuously increases with the increased volume. It shows lower requirements for the flow ability of acid-etched hydraulic fracture. This is because the higher density (10 strips/m) and lower width (50 μm) of the natural fracture network limit the leak-off of natural fractures. Therefore, the acid could barely dissolve the natural fractures, which leads to a poor contribution during the production.
By comparing the acid-etched fracture width obtained by the optimal acid injection rate with the 400 m3 acid volume in Case 3 and Case 4 (Figure 25), it can be seen that Case 3 requires higher fracture conductivity. This indicates that under the condition of low matrix permeability, natural fractures with high fluidity contribute more to productivity during production than natural fracture networks.

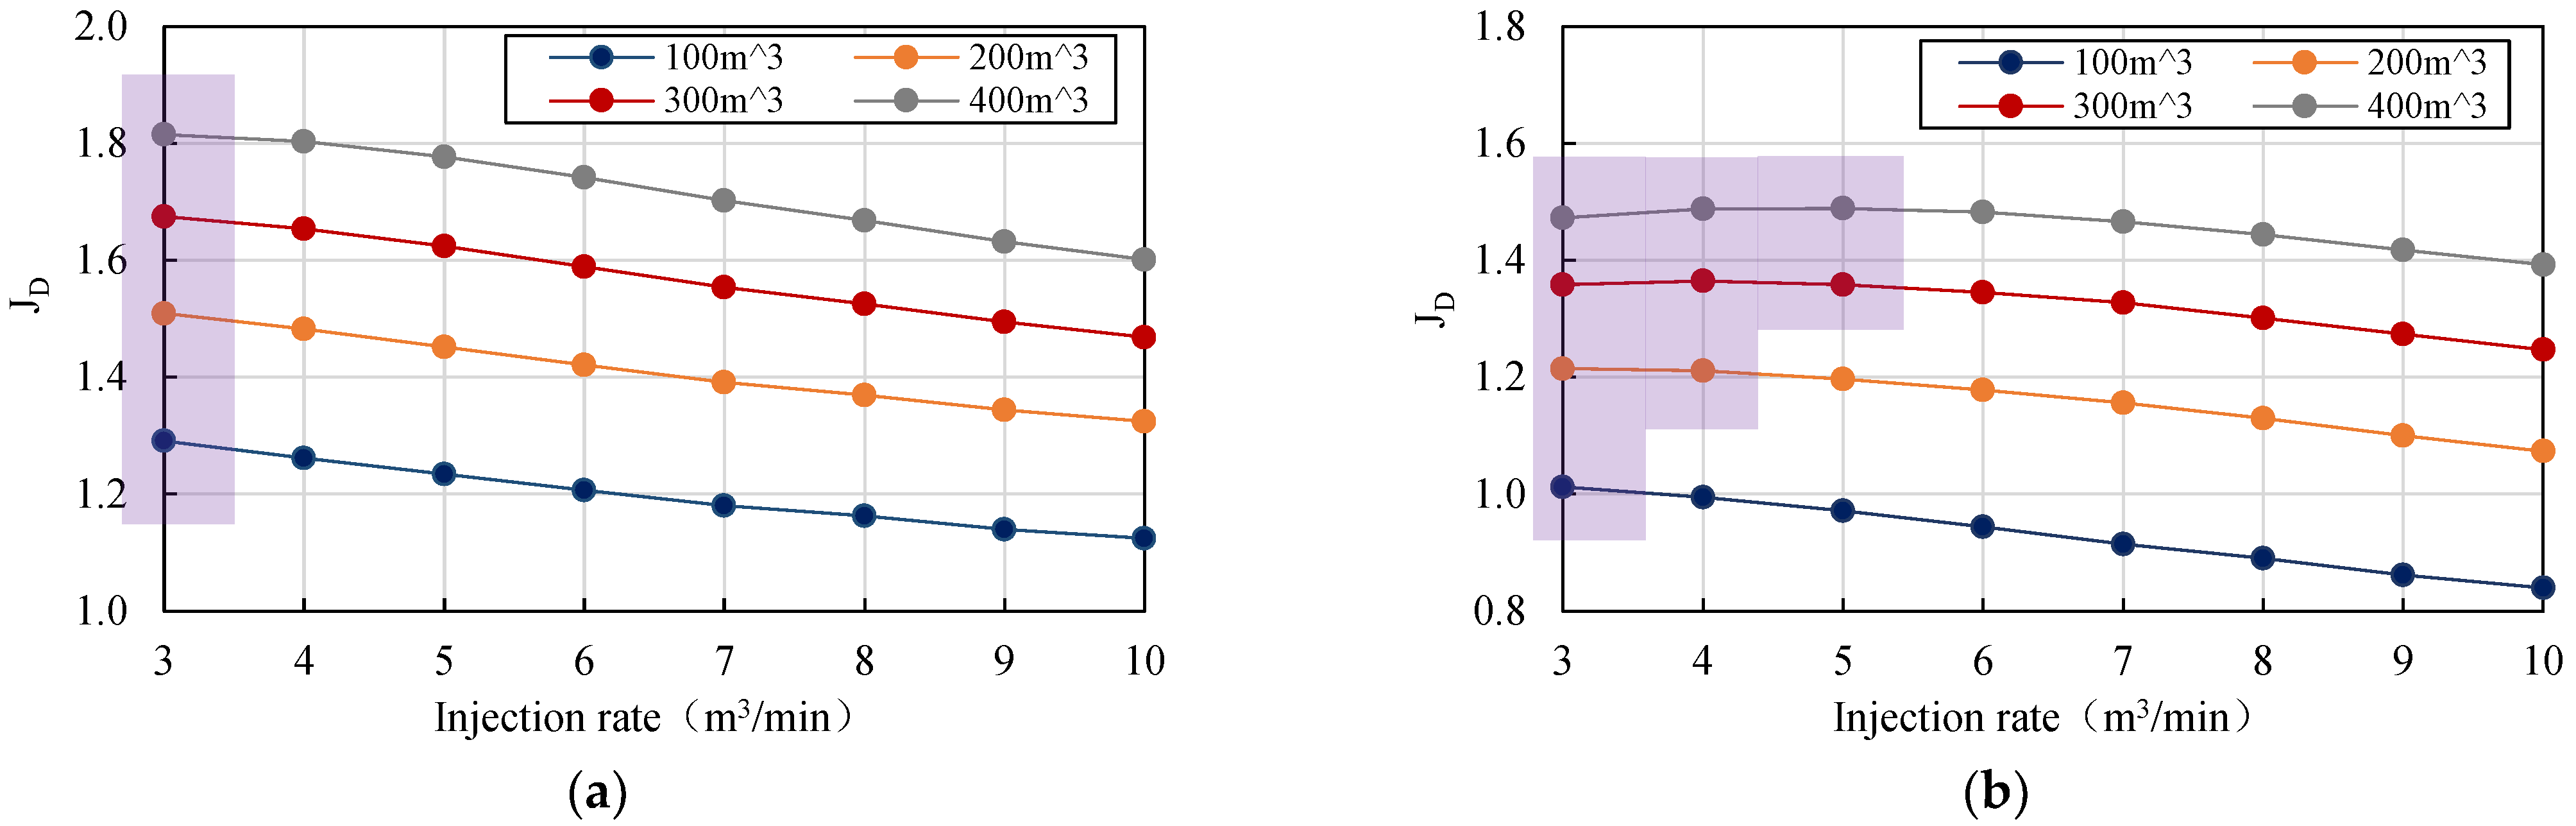
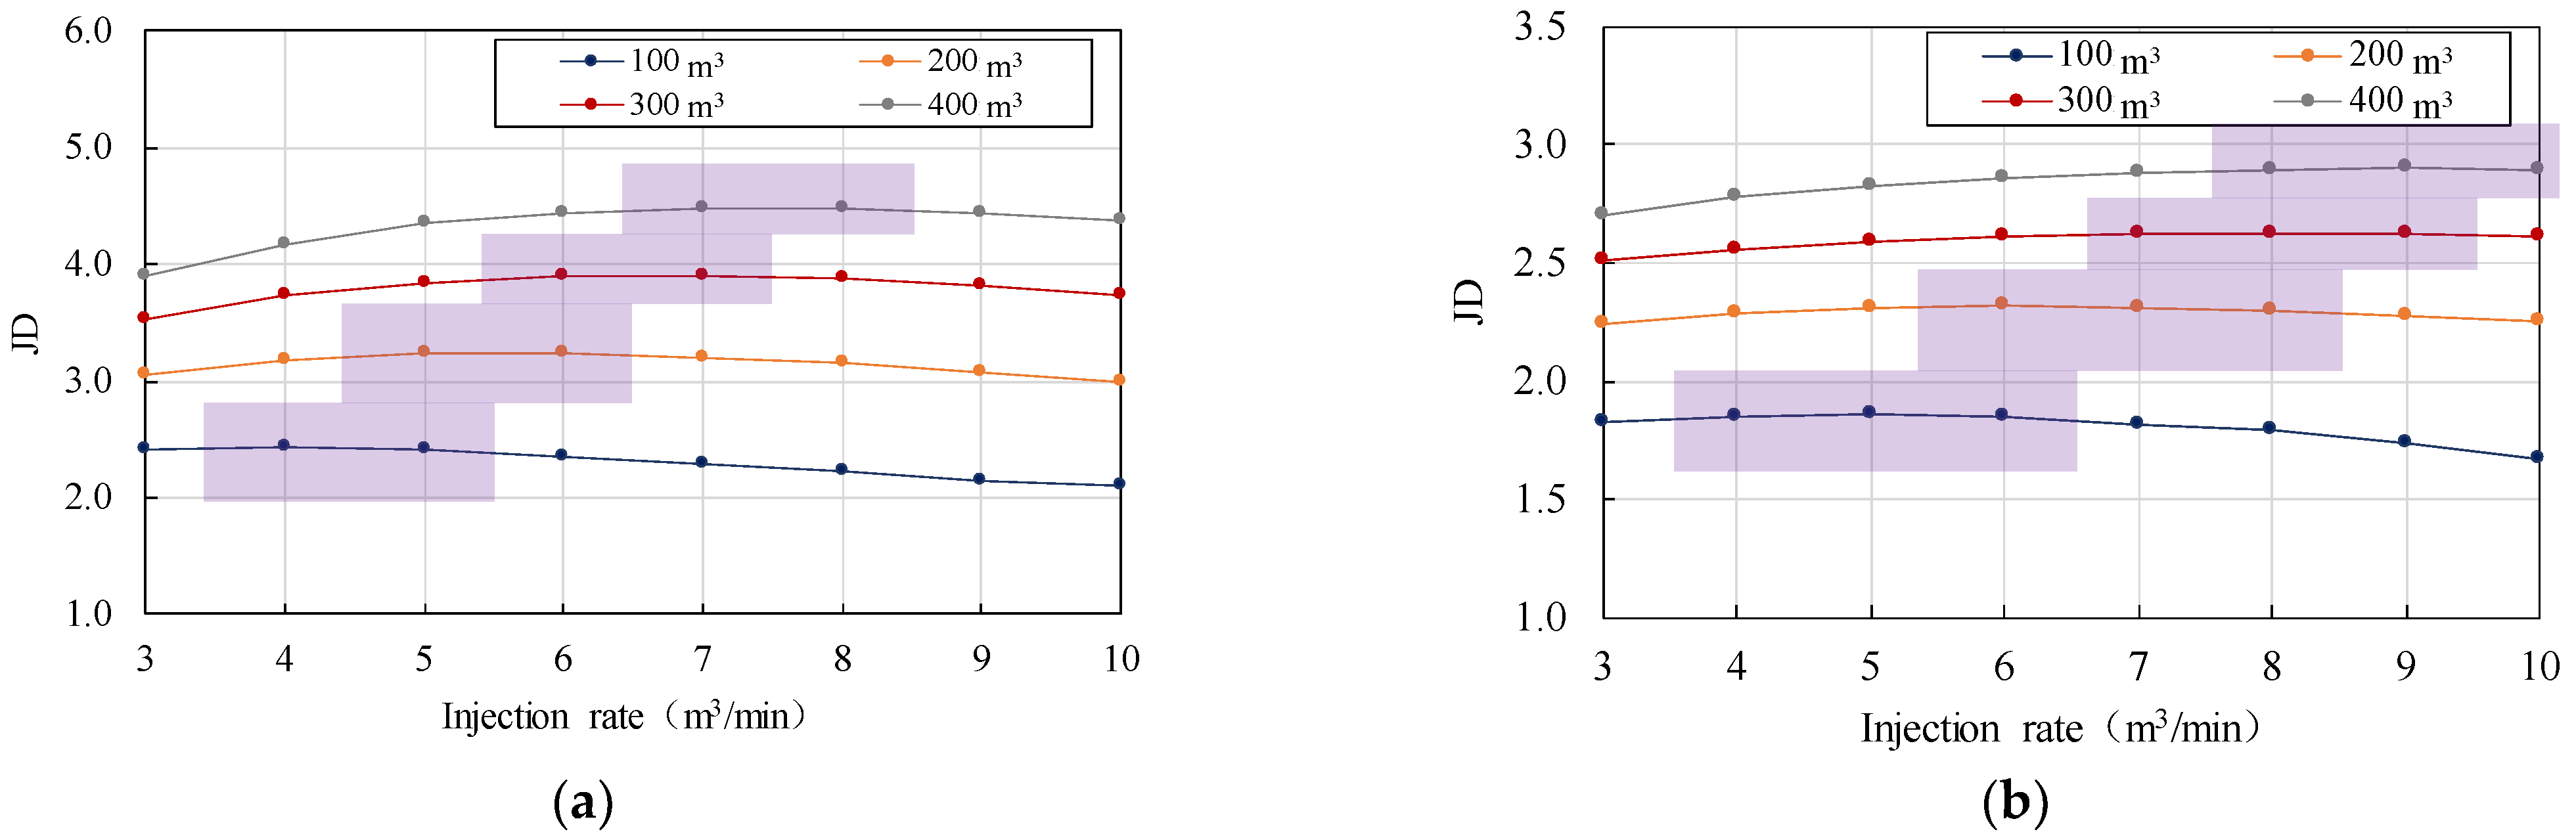
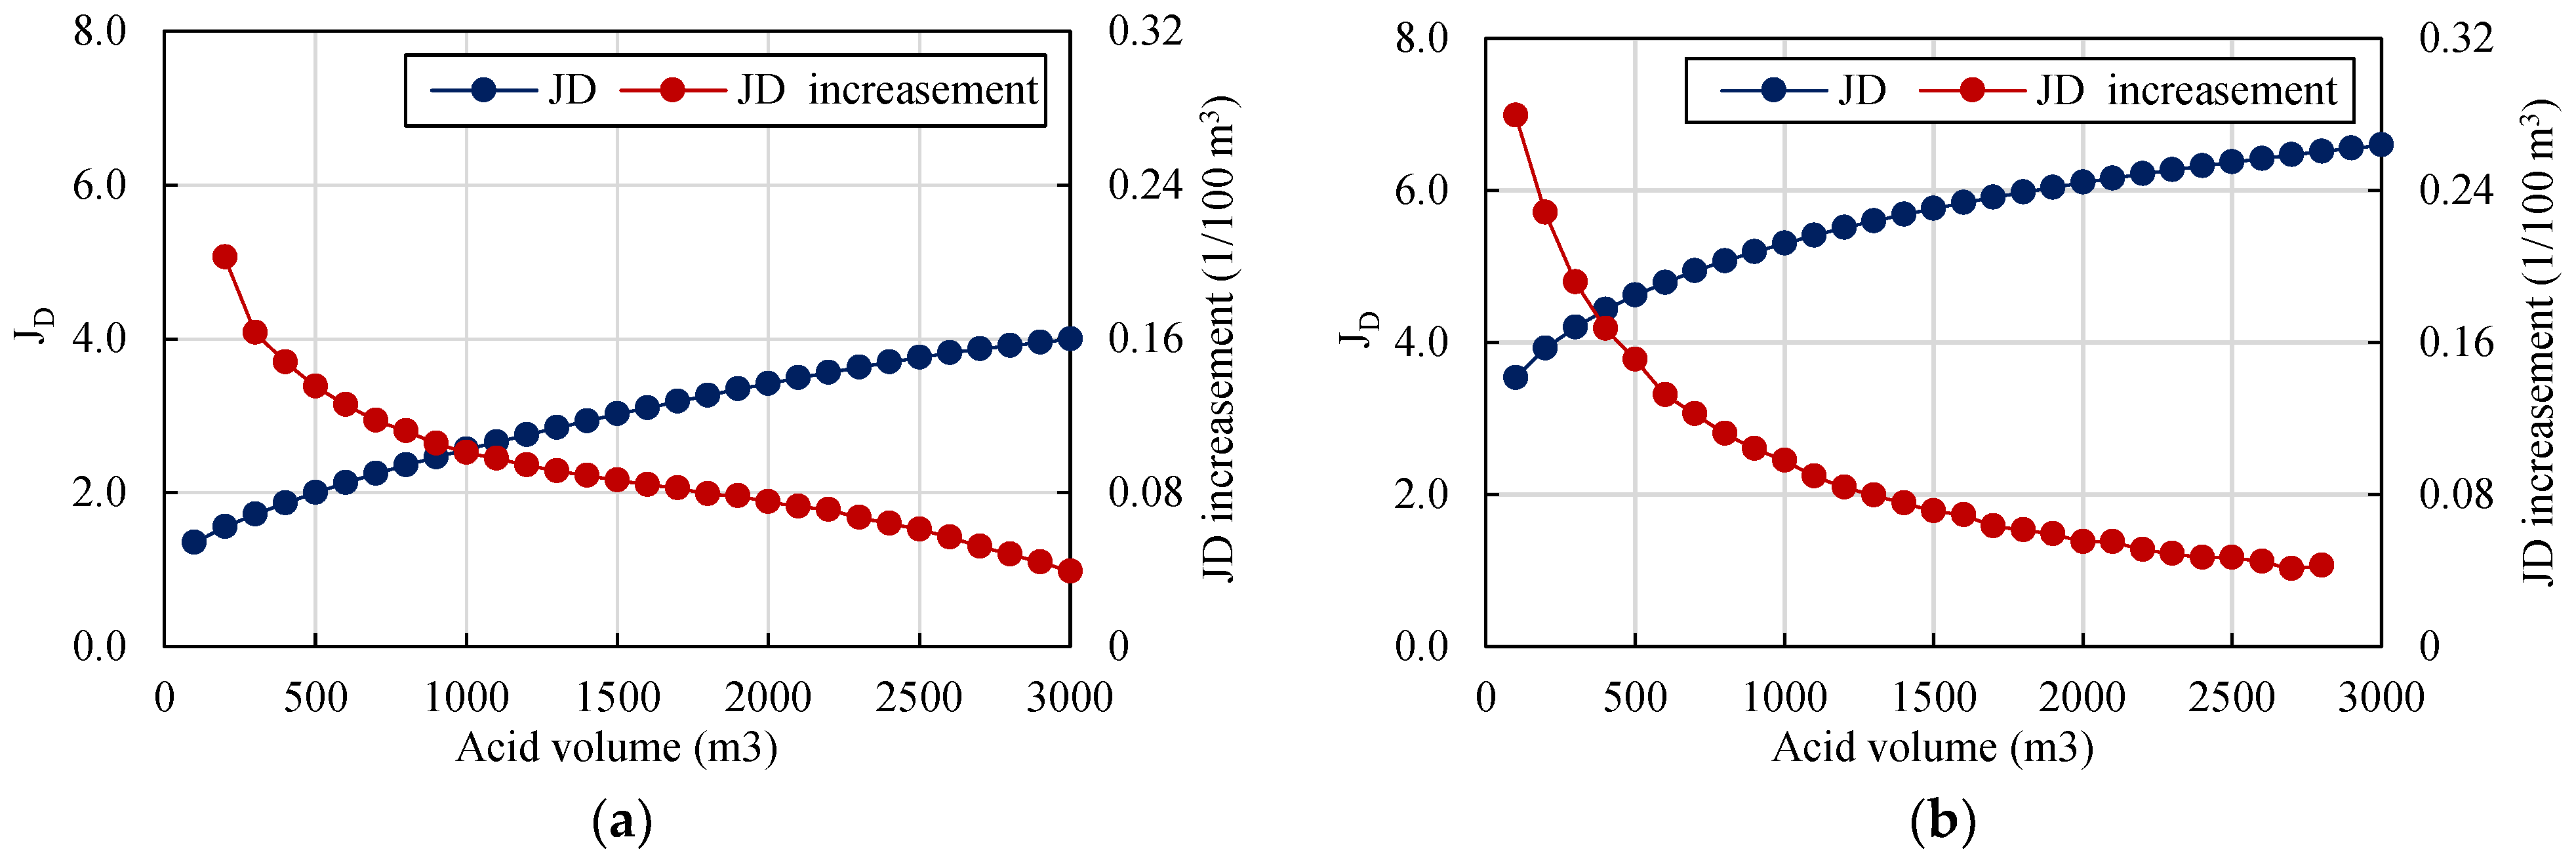
5.9. Effects of Treatment Volume on Dimensionless Production Index

It can be seen that the acid-etched fractures still cannot achieve the conductivity that fully matches the reservoir flow capacity under the 400 m3 acid volume. The low acid efficiency caused by leak-off leads to higher requirements of acid volume. In order to study the influence of the acid volume on productivity, the modeling parameters in Case 1 and Case 3 are adopted to simulate 100–3000 m3 acid volume.
The results show that the dimensionless productivity Index increases with the increase in acid volume, but the relationship between them is non-linear. Moreover, the two cases show the same regularity: As the acid volume increases, the increase in dimensionless productivity index shows a rapid decline initially (acid injection volume < 1000 m3) and then a trend of stability (Figure 26). However, due to the low reservoir permeability, Case 3’s dimensionless productivity index is more significant than Case 1’s in terms of value and growth rate, injecting more acid can get better earnings in such a reservoir. Therefore, the low permeability reservoir with developed natural fractures has more stimulation potential for acid fracturing.
Theoretically, the injection of more acid can improve the acid fracturing effect. According to the simulation results, more than 2000 m3 of acid is required to obtain more satisfying productivity. However, engineering problems such as tubing corrosion and over-dissolution near the wellbore cannot be considered in the model, optimizing acid injection volume based on the results is challenging. Therefore, when optimizing the design on-site, comprehensive consideration should be given to factors such as economy and safety.

6. Discussions

It can be seen that the cases with more conductive natural fractures obtain higher optimal dimensionless productivity index in the same treatment conditions (Case 1, 1.81; Case 3, 4.43; versus Case 2, 1.48; Case 4, 2.82). This is because the acid can better dissolve the more conductive natural fractures and combine them with the acid-etched hydraulic fracture; they constitute a “tree” shape acid-etched fracture system and realize the volumetric control of the reservoir. The stronger the flow capacity of natural fractures, the longer the lateral control distance can be achieved (Figure 27).
Therefore, we can conclude that when acid fracturing naturally fractured carbonate reservoirs, preventing the acid leak-off from the natural fractures is not fully necessary. With the thoughts of obtaining an acid-etched fracture system and building volume control of the reservoir, we may first inject low-viscosity acid to deeply dissolve the natural fractures after the hydraulic fracture is created. Limited by the accumulative leak-off capacity of the natural, acid cannot keep entering the natural fracture; therefore, after stimulating the natural fractures, acid with high viscosity and low reaction rate can be injected to build a long and conductive acid-etched hydraulic fracture. This acid-etched fracture system may help us better stimulate the naturally fractured carbonate reservoirs.
Furthermore, due to the adoption of a simplified fracture model in the calculation process, the interconnected fractures are simplified to equivalent lengths, and the fracture network formed by the expansion of natural fractures is not considered. Consequently, the findings may not be directly applicable to reservoirs characterized by fracture networks resulting from acid stimulation under low in situ stress conditions.

7. Conclusions

This study presented an integrated acid fracturing simulation model for naturally fractured reservoirs, and the parametric analysis and productivity evaluation were performed under different reservoir parameters and treatment parameters. The following conclusions were made based on the results of this study:
1.
Both geometric parameters and matrix permeability govern the acid leak-off of natural fractures, and it only increases significantly while all three parameters grow together. Therefore, natural fractures significantly affect the hydraulic geometry and acid-etching profile. It is necessary to take natural fractures into the simulation in naturally fractured reservoirs.
2.
Wormholes significantly influence leak-off behavior and hydraulic fracture propagation. They also substantially change the etched-width profile near the hydraulic entrance where the wormholes are well developed. Therefore, wormholes must be considered in the acid fracturing simulation, especially in a high-permeability reservoir (≥1 mD).
3.
For all the simulated cases, there is an optimal acid injection rate that can obtain the highest productivity under various treatment volumes. The optimal parameters strongly depend on natural fracture geometry and reservoir permeability.
4.
In high-permeability fractured reservoirs, creating a more conductive fracture is preferable. The optimal injection rate does not always increase with treatment volume but depends on natural fracture. The conductive natural fracture case shows the highest stimulation potential by acid fracturing, and a lower injection rate should be adopted to obtain better productivity.
5.
In low-permeability fractured reservoirs, a higher injection rate is recommended to create a longer acid-etched fracture, and the optimal injection rate increases with treatment volume. The natural fracture network case shows the highest stimulation potential by acid fracturing, and the highest injection rate should be adopted to obtain better productivity.

Author Contributions

Conceptualization, B.Z.; Methodology, J.R.; Software, J.R.; Investigation, X.C., S.X. and B.Z.; Data curation, P.X.; Writing—original draft, J.R.; Writing—review & editing, C.G.; Project administration, X.C. All authors have read and agreed to the published version of the manuscript.

Funding

This research was funded by Youth Fund of the National Natural Science Foundation of China (52304047).

Data Availability Statement

The data presented in this study are available on request from the corresponding author. The data are not publicly available due to it involves the data from oil company.

Conflicts of Interest

Authors Xusheng Cao, Shunyuan Xin and Bing Zhao were employed by the company Northwest Oilfield Branch—Sinopec. The remaining authors declare that the research was conducted in the absence of any commercial or financial relationships that could be construed as a potential conflict of interest. The company Northwest Oilfield Branch—Sinopec had no role in the design of the study; in the collection, analyses, or interpretation of data; in the writing of the manuscript, or in the decision to publish the results.

Nomenclature

Ahfcross-sectional area of hydraulic fracture, m2;
Cttotal compress coefficient, Pa−1;
Chf, Cnfaverage acid concentration across the fracture width, mol/m3;
clspecific heat of fluid, J/(kg·K);
cmspecific heat of porous medium, J/(kg·K);
EYoung’s modulus, Pa;
Gshear modulus, Pa;
hhfhydraulic fracture height, m;
hpaypay zone height, m;
hihydraulic fracture height in the ith layer, m;
KIu and KIlstress intensity factors of the top and bottom tips of the hydraulic fracture, Pa·m1/2;
KIcstress intensity factor, Pa·m1/2;
kcacid reaction constant, m/s; kg is the mass transfer coefficient, m/s;
kmx, kmy, and kmzmatrix permeability in x, y, and z directions, m2;
kwhpermeability of the matrix grid with wormholes at the y direction, m2;
Lnfnatural fracture length, m;
Lwhwormhole length, m;
Lwh, tipwormhole length at the element where the wormhole tip is located, m.
Mmole weight of the rock, kg/mol;
NACacid capacity number;
phffluid pressure in hydraulic fracture, Pa;
pnffluid pressure in natural fracture, Pa;
pcpfluid pressure at the centerline of the hydraulic fracture, Pa;
pmfluid pressure in matrix, Pa;
PVbt,optoptimal breakthrough volume, dimensionless;
qffluid leak-off source term, kg·m−3·s−1;
qL,nfnatural fracture leak-off volume, m3;
qh,menergy source term, J/(m3·s).
Thf, Tnfaverage temperature across the fracture width, K;
Tmtemperature of the porous medium, K;
u x ¯ average flow velocity through hydraulic fracture cross-section, m/s;
ux, uy, uzflow velocity in the x, y, z direction, m/s;
vPoisson’s ratio, dimensionless;
vL,hffluid leak-off velocity in the hydraulic fracture, m/s;
vwhwormhole growth velocity, m/s;
vi, tipaverage interstitial velocity in the wormhole front, m/s;
vi,optoptimal injection velocity, m/s;
whfhydraulic fracture width, m;
wtipwidth at the tip element of the hydraulic fracture, m;
μfluid viscosity, mPa·s;
βdissolving power of acid on rock, kg rock/kg acid;
σpayclosure stress of pay zone, Pa;
Δσstress difference between pay zone and shale layer, Pa;
σiclosure stresses in the ith layer;
ϕrock porosity, dimensionless;
ρlfluid density, kg/m3;
ρmdensity of porous medium, kg/m3;
ρrdensity of rock, kg/m3;
λlthermal conductance of fluid, W/(m·K);
λmthermal conductance of porous medium, W/(m·K);
ηfraction of the leaking acid that reacts at the fracture surfaces;
Δytiplength of the grid where the wormhole tip is located, m.

References

  1. Li, Y.; Kang, Z.; Xue, Z.; Zheng, S. Theories and practices of carbonate reservoirs development in China. Pet. Explor. Dev. 2018, 45, 669–678. [Google Scholar] [CrossRef]
  2. Brenda, A.; Aguilera, R. Buildup Evaluation of a Tight Overpressured Naturally Fractured Carbonate Reservoir with the Use of a Semi-Empirical Model. SPE Res. Eval. Eng. 2023, 26, 1498–1513. [Google Scholar]
  3. Chen, L.; Liu, F.; Yang, J. Horizontal well staged acid fracturing technology for deep and ultra-deep carbonate gas reservoirs in the Sichuan Basin. Nat. Gas. Ind. 2022, 42, 56–64. [Google Scholar]
  4. Farouk, S.; Sen, S.; Abuseda, H.; El-Shamly, Y.; Salam, A.; Elhossainy, M.M. Petrophysical Characterization of the Turonian and Cenomanian Intervals in the Abu Gharadig Field, Western Desert, Egypt: Inferences on Reservoir Quality and Resource Development. Nat. Resour. Res. 2022, 31, 1793–1824. [Google Scholar] [CrossRef]
  5. Yi, M.; Shen, X.; Jin, L.; Wang, J.; Huang, Z.; Shen, G. Forward Modeling of Natural Fractures within Carbonate Rock Formations with Continuum Damage Mechanics and Its Application in Fuman Oilfield. Energies 2022, 15, 6318. [Google Scholar] [CrossRef]
  6. Aljawad, M.; Aljulaih, H.; Mahmoud, M.; Desouky, M. Integration of field, laboratory, and modeling aspects of acid fracturing: A comprehensive review. J. Pet. Sci. Eng. 2019, 181, 106158. [Google Scholar] [CrossRef]
  7. Mou, J.; Zhang, S.; Zhang, Y. Acid leak-off mechanism in acid fracturing of naturally fractured carbonate oil reservoirs. Transp. Porous Media 2012, 91, 573–584. [Google Scholar] [CrossRef]
  8. Ugursal, A.; Zhu, D.; Hill, A.D. Development of Acid Fracturing Model for Naturally Fractured Reservoirs. SPE Prod. Oper. 2019, 34, 735–748. [Google Scholar] [CrossRef]
  9. Hawkins, M.F., Jr. A Note on the Skin Effect. J. Pet. Technol. 1956, 8, 65–66. [Google Scholar] [CrossRef]
  10. Akanni, O.O.; Nasr-El-Din, H.A. Modeling of Wormhole Propagation During Matrix Acidizing of Carbonate Reservoirs by Organic Acids and Chelating Agents. In Proceedings of the SPE Annual Technical Conference and Exhibition, Dubai, United Arab Emirates, 26–28 September 2016. [Google Scholar]
  11. De Oliveira, T.J.L.; De Melo, A.R.; Oliveira, J.A.A.; Pereira, A.Z. Numerical Simulation of the Acidizing Process and PVBT Extraction Methodology Including Porosity/Permeability and Mineralogy Heterogeneity. In Proceedings of the SPE International Symposium and Exhibition on Formation Damage Control, Lafayette, LA, USA, 15–17 February 2012. [Google Scholar]
  12. Kalia, N.; Balakotaiah, V. Effect of medium heterogeneities on reactive dissolution of carbonates. Chem. Eng. Sci. 2009, 64, 376–390. [Google Scholar] [CrossRef]
  13. Palharini, S.M.; Zhu, D.; Hill, A.D. Anisotropic-Wormhole-Network Generation in Carbonate Acidizing and Wormhole-Model Analysis through Averaged-Continuum Simulations. SPE Prod. Oper. 2019, 34, 90–108. [Google Scholar]
  14. Palharini, S.M.; Hill, A.D.; Zhu, D. A New Up-Scaled Wormhole Model Grounded on Experimental Results and in 2-Scale Continuum Simulations. In Proceedings of the SPE International Conference on Oilfield Chemistry, Galveston, TX, USA, 8–9 April 2019. [Google Scholar]
  15. Panga, M.K.R.; Ziauddin, M.; Balakotaiah, V. Two-Scale Continuum Model for Simulation of Wormholes in Carbonate Acidization. AIChE J. 2005, 51, 3231–3248. [Google Scholar] [CrossRef]
  16. Dang, L.; Zhou, C.; Huang, M.; Jiang, D. Simulation of effective fracture length of prepad acid fracturing considering multiple leak-off effect. Nat. Gas. Ind. B 2019, 6, 64–70. [Google Scholar] [CrossRef]
  17. Economides, M.J.; Zhu, D.; Hill, A.D.; Ehlig-Economides, C. Petroleum Production Systems, 2nd ed.; Prentice Hall: Upper Saddle River, NJ, USA, 2013. [Google Scholar]
  18. Buijse, M.A.; Glasbergen, G. A semi-empirical model to calculate wormhole growth in carbonate acidizing. In Proceedings of the SPE Annual Technical Conference and Exhibition, Dallas, TX, USA, 9–12 October 2005. [Google Scholar]
  19. Furui, K.; Burton, R.C.; Burkhead, D.W.; Abdelmalek, N.A.; Hill, A.D.; Zhu, D.; Nozaki, M. A Comprehensive Model of High-Rate Matrix-Acid Stimulation for Long Horizontal Wells in Carbonate Reservoirs: Part II—Wellbore/Reservoir Coupled-Flow Modeling and Field Application. SPE J. 2012, 17, 280–291. [Google Scholar] [CrossRef]
  20. Hill, A.D.; Zhu, D.; Wang, Y. The Effect of Wormholing on the Fluid Loss Coefficient in Acid Fracturing. SPE Prod. Oper. 1995, 10, 257–264. [Google Scholar] [CrossRef]
  21. Economides, M.J.; Nolte, K.G. Reservoir Stimulation, 3rd ed.; Prentice Hall: Englewood Cliffs, NJ, USA, 1989. [Google Scholar]
  22. Olson, J.E. Fracture Aperture, Length and Pattern Geometry Development under Biaxial Loading: A Numerical Study with Applications to Natural, Cross-Jointed Systems; Special Publications; Geological Society of London: London, UK, 2007; Volume 289, pp. 123–142. [Google Scholar]
  23. Dong, C.; Zhu, D.; Hill, A.D. Modeling of the Acidizing Process in Naturally Fractured Carbonates. SPE J. 2002, 7, 400–408. [Google Scholar] [CrossRef]
  24. Nolte, K.G.; Economides, M.J. (Eds.) Reservoir Stimulation; John Wiley and Sons: Chichester, NY, USA, 2000. [Google Scholar]
  25. Eickmeier, J.R.; Ersoy, D.; Ramey, H.J. Wellbore temperatures and heat losses during production or injection operations. J. Can. Pet. Technol. 1970, 9, 115–121. [Google Scholar] [CrossRef]
  26. Kaviany, M. Principles of Heat Transfer in Porous Media; Springer Science and Business Media: Berlin/Heidelberg, Germany, 2012. [Google Scholar]
  27. Roberts, L.D.; Guin, J.A. A New Method for Predicting Acid Penetration Distance. SPE J. 1975, 15, 277–286. [Google Scholar] [CrossRef]
  28. Deng, J.; Mou, J.; Hill, A.D.; Zhu, D. A New Correlation of Acid-Fracture Conductivity Subject to Closure Stress. SPE Prod. Oper. 2012, 27, 158–169. [Google Scholar] [CrossRef]
  29. Nordgren, R.P. Propagation of a vertical hydraulic fracture. SPE J. 1972, 12, 306–314. [Google Scholar] [CrossRef]
  30. Schechter, R.S. Oil Well Stimulation; Prentice-Hall, Inc.: Englewood Cliffs, NJ, USA, 1992. [Google Scholar]
  31. Terrill, R.M. Heat Transfer in Laminar Flow Between Parallel Porous Plates. Int. J. Heat. Mass. Transfer. 1965, 8, 1491–1497. [Google Scholar] [CrossRef]
  32. Ugursal, A.; Schwalbert, M.P.; Zhu, D.; Hill, A.D. Acid Fracturing Productivity Model for Naturally Fractured Carbonate Reservoirs. In Proceedings of the SPE International Hydraulic Fracturing Technology Conference and Exhibition, Muscat, Oman, 16–18 October 2018. [Google Scholar]
  33. Etten, J.; Zhu, D.; Hill, A.D. The Combined Effect of Permeability and Pore Structure on Carbonate Matrix Acidizing. In Proceedings of the EUROPEC 2015, Madrid, Spain, 1–4 June 2015. [Google Scholar]
Figure 1. Non-uniform etching morphology on rock sample surface after acid etching.
Processes 12 00808 g001
Figure 2. The schematic diagram of the multi-field coupling process.
Processes 12 00808 g002
Figure 3. The schematic diagram of the integrated acid fracturing model. (a) side view; (b) top view.
Processes 12 00808 g003
Figure 4. The schematic diagram of hydraulic fracture and natural fracture interaction.
Processes 12 00808 g004
Figure 5. Hydraulic fracture domain and gridding methodology. (a) Gridding in P3D fracture propagation model; (b) Gridding in the fluid flow model.
Processes 12 00808 g005
Figure 6. The schematic diagram of fluid leak-off.
Processes 12 00808 g006
Figure 7. The schematic diagram of the wormhole region. (a) Wormhole region; (b) Pressure drop in individual wormhole.
Processes 12 00808 g007
Figure 8. Workflow of acid fracturing simulation.
Processes 12 00808 g008
Figure 9. Comparison of solutions given by both the analytical solutions and numerical simulations. (a) Fracture geometry solutions; (b) Temperature and acid concentration solutions.
Processes 12 00808 g009
Figure 10. Flow flux solutions by different gridding.
Processes 12 00808 g010
Figure 11. Comparison of total leak-off results between Ugursal’s model and the established model. (a) Solutions from Ugursal’s model (2018) [32]; (b) Solutions from established model.
Processes 12 00808 g011
Figure 12. Comparison of leak-off in natural fractures between Ugursal’s model and the established model. (a) Solutions from Ugursal’s model (2018) [32]; (b) Solutions from established model.
Processes 12 00808 g012
Figure 13. The effects of natural fracture geometry and matrix permeability on leak-off (NF: natural fracture). (a) Matrix permeability is equal to 1 mD; (b) Matrix permeability is equal to 10 mD.
Processes 12 00808 g013
Figure 14. Natural fracture geometry and matrix permeability effects on pressure profile in natural fracture. NFw: natural fracture width; NFL: natural fracture length; Perm: matrix permeability. (a) 50–250 μm width, 25 m length; (b) 250 μm width, 5–25 m length.
Processes 12 00808 g014
Figure 15. Matrix permeability affects the length and leak-off of the wormhole region. (a) Wormhole region length at the hydraulic fracture inlet. (b) Cumulative leak-off volume difference of an inlet grid with and without considering wormhole. The grid is located in a hydraulic fracture inlet, and the grid size is 1 m in length and 4 m in height.
Processes 12 00808 g015
Figure 16. Matrix permeability and injection rate effect on wormhole distribution. (a) 10 mD permeability; (b) 0.1 mD permeability; (c) 10 mD permeability, with natural fractures.
Processes 12 00808 g016
Figure 17. Total cumulative leak-off volume for various matrix permeabilities. (a) Wormhole cases; (b) Natural fracture cases.
Processes 12 00808 g017
Figure 18. Wormholes and natural fractures affect hydraulic fracture propagation in different matrix permeabilities. (a) 10 mD permeability; (b) 1 mD permeability; (c) 0.1 mD permeability.
Processes 12 00808 g018
Figure 19. Acid-etched width profile for various matrix permeabilities. (a) Wormhole cases; (b) Natural fracture cases.
Processes 12 00808 g019
Figure 20. Comparison of acid-etching characteristics with different leak-off mediums. (a) Wormhole cases; (b) Natural fracture cases.
Processes 12 00808 g020
Figure 21. Natural fracture geometry, matrix permeability, and position effects on fluid natural fracture etched-width. (a) Acid etched-width in natural fracture; (b) Etched-width at the inlet of natural fractures.
Processes 12 00808 g021
Figure 22. Dimensionless productivity index obtained from different injection rates and treatment volumes. NFw: natural fracture width; NFl: natural fracture length; NFs: natural fracture spacing. (a) 10 mD, NFw 250 µm, NFl 25 m, NFs 1 (Case 1); (b) 10 mD, NFw 50 μm, NFl 25 m, NFs 0.2 (Case 2).
Processes 12 00808 g022
Figure 23. Acid etched-width profile at optimal injection rate and 400 m3 acid volume in Case 1 and Case 2.
Processes 12 00808 g023
Figure 24. Dimensionless productivity index obtained from different injection rates and treatment volumes. (a) 1 mD, NFw 150 μm, NFl 15 m, NFs 1 (Case 3); (b) 1 mD, NFw 50 μm, NFl 25 m, NFs 0.1 (Case 4).
Processes 12 00808 g024
Figure 25. Acid etched-width profile at optimal injection rate and 400 m3 acid volume in Cases 3 and 4.
Processes 12 00808 g025
Figure 26. Dimensionless productivity index obtained from different treatment volumes. (a) Case 1, 6 m3/min injection rate; (b) Case 3, 10 m3/min injection rate.
Processes 12 00808 g026
Figure 27. The schematic diagram of acid-etched fracture system in different cases. (a) 10 mD, NFw 250 μm, NFl 25 m, NFs 1; (b) 10 mD, NFw 50 μm, NFl 25 m, NFs 0.2; (c) 1 mD, NFw 150 μm, NFl 15 m, NFs 1 (Case 3); (d) 1 mD, NFw 50 μm, NFl 25 m, NFs 0.1 (Case 4).
Processes 12 00808 g027
Table 1. Input parameters for the simulation.
Input DataSI UnitInput DataSI Unit
Wellbore properties
Inner tube diameter, r00.062 mOuter casing diameter, r30.127 m
Outer tube diameter, r10.073 mGround surface temperature, TG25 °C
Inner casing diameter, r20.103 mSteel thermal conductance, λs45 W/(m·K)
Steel specific heat capacity, cs460 J/(kg·K)
Reservoir properties
Reservoir pressure, Pe4 × 107 PaMinimum horizontal stress in pay zone, σh5 × 107 Pa
Total compressibility, Ct2.2 × 10−9 Pa−1Minimum horizontal stress in shale layer, σhs5.8 × 107 Pa
Reservoir fluid viscosity, µo0.01 Pa·sReservoir fluid density, ρo850 kg/m3
Reservoir width, Ly500 mReservoir length, Lx500 m
Pay zone height, hpay30 mReservoir height, Lz200 m
Limestone-specific heat capacity, cr850 J/(kg·K)Reservoir temperature, Te439 K
Limestone thermal conductance, λr1.57 W/(m·K)Limestone density, ρr2600 kg/m3
Young’s modulus, E6 × 1010 PaPoisson’s ratio, v0.15
Acid properties
Acid density, ρl1100 kg/m3Acid initial concentration, C06020 mol/m3
Acid viscosity, µl0.03 Pa·sAcid-specific heat capacity, cl4200 J/(kg·K)
Acid thermal conductance, λl0.7 W/(m·K);Frequency factor, k0.003 m/s
Activation energy, Ea16,000 J/molReference diffusion coefficient, De05.6 × 10−9 m2/s
Reference temperature, T0323 K
Mou-Deng conductivity correlation parameters
Horizontal correlation length, λDx1Vertical correlation length, λDx0.05
Normalized permeability standard deviation, σD0.4Closure pressure, σc3 × 107 Pa
Table 2. Designed parameters for different reservoir conditions.
Permeability, mDNF Width, μmNF Length, mSpacing, m
Case 110250251
Case 21050250.2
Case 31150151
Case 4150250.1
Disclaimer/Publisher’s Note: The statements, opinions and data contained in all publications are solely those of the individual author(s) and contributor(s) and not of MDPI and/or the editor(s). MDPI and/or the editor(s) disclaim responsibility for any injury to people or property resulting from any ideas, methods, instructions or products referred to in the content.

