Article

Procedure for Aggregating Indicators of Quality and Life-Cycle Assessment (LCA) in the Product-Improvement Process

Faculty of Mechanical Engineering and Aeronautics, Rzeszow University of Technology, 35-959 Rzeszow, Poland
*
Author to whom correspondence should be addressed.
Processes 2024, 12(4), 811; https://doi.org/10.3390/pr12040811
Submission received: 14 March 2024 / Revised: 12 April 2024 / Accepted: 15 April 2024 / Published: 17 April 2024

Abstract

:
Sustainable product development requires combining aspects, including quality and environmental. This is a difficult task to accomplish. Therefore, procedures are being sought to combine these aspects in the process of product improvement. Therefore, the objective of the investigation was to develop a procedure that supports the integration of quality-level indicators and life-cycle assessment (LCA) to determine the direction of product improvement. The procedure involves determining the quality indicators based on the expectations of the customer, which are subsequently processed using the formalised scoring method (PS). A life-cycle assessment index is determined for the main environmental impact criterion. According to the proposed mathematical model, these indicators are aggregated, and this process takes into account their importance in terms of product usefulness and environmental friendliness. Interpretations of the results and the direction of product improvement are from the results obtained from the modified IPA model (importance–performance analysis). The procedure is used in the verification of product prototypes, wherein the proposed approach, and its test, was carried out for a self-cooling beverage can (and its alternatives) with a “chill-on-demand” system, which is a technology supporting rapid cooling on demand. The life-cycle assessment was carried out to assess the carbon footprint, which is crucial for activities to reduce greenhouse gases. The direction of improvement of this product was shown to concern the selection of transport means, the reduction of energy use in the production phase, or the change of the method of opening the can. What is original is the proposal of a procedure for integrating the quality indicator and the life-cycle assessment indicator, taking into account the key environmental burden. The procedure can be used in manufacturing companies when designing and improving products in terms of their sustainable development.

1. Introduction

Society faces many challenges, such as climate change and resource depletion, which are related to many challenges and opportunities for businesses [1]. To meet these challenges, various tools and methods are being sought to support product and process innovations. In general terms, this constitutes the development of so-called sustainable products [2], which concerns the design and improvement of products that satisfy customers and are environmentally friendly [3,4,5]. In this approach, companies should be “sensitive, smart and sustainable” (S-3) to cope with global changes resulting from market dynamics. This corresponds to activities for the sustainable design, redesign, and improvement of products [6] to ensure the generation of new products that offer satisfactory solutions to modern society, including those that respond to changes in customer expectations over time [7]. Despite this, various solutions supporting sustainable product development are still being sought.
For example, authors of articles, e.g., [8,9], proposed integrating quality function implementation (QFD—quality function deployment, developed in Japan beginning in 1966 by Yoji Akao) with product life-cycle assessment (LCA) for sustainable product design. The authors of the articles presented an extension of this connection to the TRIZ method (theory of inventive problem solving) [10,11]. The authors of article [12] implemented a quality function geared toward the product life cycle. This involved developing a procedure for identifying environmental requirements consistent with customer expectations. In turn, the authors of the article conducted a comparative analysis of the results obtained from the QFD method and the life-cycle assessment as part of the product design [13]. However, in [14], the classic LCA model is modified, taking into account the list of the quality requirements of building objects. In turn, eco-design was the basis for the research presented in [15,16], which included the implementation of the quality function. Furthermore, the authors of the article analysed the quality of the products and their durability in the life cycle [17], and a method was developed. In turn, the authors of article [18] developed a simplified model that supports decision making, taking into account the criteria of sustainable development, including life-cycle assessment criteria. However, in article [19], the product design process was improved in the product life-cycle assessment phase, including the assessment of the quality of the alternative products. Similar studies are presented in other studies, such as [20,21,22,23].
Although product quality levels and product life-cycle assessments were performed, no procedure was developed to support the combination of the results of these analyses into one indicator. The indicator mentioned would support determining the direction of product development and would be a response to the need to implement the idea of sustainable development. This was considered a research gap that was meant to be filled. Therefore, the objective of the research was to develop a procedure that supports the aggregation of quality-level indicators and life-cycle assessment (LCA) to determine the direction of improvement of the product. The following hypothesis was adopted as part of the research:
Hypothesis 1. 
In response to the idea of sustainable development, it is possible to aggregate quality indicators and a life-cycle assessment performed for one environmental load criterion as part of the product-improvement process.
The originality of the proposed procedure is the determination of (i) the quality indicator of the product and its design alternatives and (ii) the life-cycle environmental impact index (LCA) according to the environmental load criterion for the product and its design alternatives. Indicators are aggregated according to a simplified mathematical model in the form of one coherent quality and environmental indicator. Its interpretation concerns four areas of product solutions (the most advantageous, promising, poorly promising, and critical). The results obtained in the individual stages of the procedure support the general direction of product development according to alternative production solutions. This direction concerns the expected quality state and environmentally friendly state in the LCA.

2. Material and Method

The concept of the procedure consists of separately determining and sequentially aggregating the product quality-level indicator and the product’s environmental impact indicator throughout the entire life cycle (LCA). Quality level is the customer’s satisfaction with the usability of the product and is determined according to the main criteria (key) (attributes) of the product [24]. These criteria are evaluated by the customer on a Likert scale [25] in terms of their importance and quality, which are subsequently processed according to formalized scoring (PS) [26,27]. The product life-cycle assessment (LCA) is carried out on the basis of the ISO 14040 standard [28], which according to assumptions, concerns one criterion of environmental burden. The quality and environmental indicators are aggregated according to a simplified mathematical model based on which direction of product improvement is determined. As already mentioned, various methods were used at the individual stages of the procedure, including the SMARTER method [29], a survey with a Likert scale [25], the formalised scoring method (PS) [30], life-cycle assessment (LCA) according to ISO 14040 [28], and a modified IPA model (importance–performance analysis) [31,32,33]. The selection of methods was justified in individual stages of the procedure, the general procedure of which is shown in Figure 1.
Furthermore, as part of the development of the procedure, the main assumptions were adopted, which were selected based on a review of the literature on the subject, e.g., [34,35,36] and previous research results [37,38,39,40]. These assumptions were as follows:
  • the product to be verified is unlimited [38,39];
  • quality level refers to customer satisfaction with the use of the product [35,36];
  • the number of product quality criteria according to which the quality level is estimated is approximately 7 ± 2 [34,37];
  • life-cycle assessment is made on the basis of one criterion, which is considered environmental burden [40,41].
The validity of using these assumptions was indicated at the individual stages of the procedure, the characteristics of which are presented later in the study.

2.1. Selecting a Reference Product and Defining the Research Goal

The subject of the research is the so-called reference product, i.e., a generalisation of products of a given type, e.g., having the same purpose. The choice of product results from the needs of the expert (entity). At subsequent stages, the research object (product) is subject to a quality assessment and an environmental impact assessment throughout its life cycle. The analysis concerns the current state of the product and its prototype (alternative) design solutions.
Depending on the adopted product, the purpose of the research is defined. The goal should refer to determining the quality level of the product and its alternative solutions, and also for estimating the environmental impact throughout the life cycle of this product and its alternatives. The idea is to set a direction for improvement activities to increase customer satisfaction with the product’s quality and also, at the same time, to reduce environmental burdens in LCA. Depending on the needs, the research goal can be detailed. The goal can be determined according to the SMART(-ER) method, i.e., specific, measurable, achievable, relevant, based on a timeline [29].

2.2. Obtaining Customer Expectations

The customer’s expectations concern his requirements for the product, which are expressed by quality criteria [35,36]. This means that it is the level of customer satisfaction with the quality of the product in terms of its usability, which is presented by the product criteria (attributes). Due to the fact that there may be many such criteria, their standardised and reliable assessment should be limited to the main criteria (those having the greatest impact on the level of usability of the product). According to the principles of decision support, there should be approximately 7 ± 2 criteria [34,37]. The selection of criteria is made by the entity that performs the evaluation. The selection of criteria is made according to the product catalogue. Each criterion should be described according to the parameter that characterises it (value, range of values, etc.). These criteria will vary depending on the product and its alternatives. To obtain customer expectations about product quality, it is necessary to conduct an interview or a short survey with the customer [42]. The customer should evaluate the product and its alternatives according to these criteria. The ratings refer to (i) the importance and (ii) the quality of the product criteria (attributes). The grades are awarded on a popular Likert scale, which has been adapted to the formalised scoring method (used in the next stage of the procedure). The rating scale is presented in Table 1.
Based on the ratings awarded, an assessment is made of the quality of the product and its alternatives, as presented in the next step of the procedure.

2.3. Assessment of the Product Quality Level

The quality level is assessed according to a simplified formalized scoring method (PS, Czechowski method) [27,43]. The choice of this method was due to its simple methodology and the ability to determine the level of product quality based on customer assessments. The methodology can be based on the ratings expressed on a Likert scale [25], as presented in the previous step of the method. Formula (1) is used to calculate the quality index [27,43]:
Q = G H + K H C G H = R H 8 n R H = 9 a + 7 b + 4 c + 2 d + e n K H = c + 5 d + 10 e 200 n C = 0.05   for   normal   requirements C = 0.1   for   stricter   requirements
where: Q—quality index, G—main unit, K—correction member, C—constant, n—number of criteria, a, b, c, d, e—number of five-point grades awarded, respectively, four-point, three-point, two-point, single-point.
The value of the aggregated Q indicator should be in the range from 0 to 1, where 0 is the unacceptable and abstract level (the quality of the product does not satisfy the customer in general), 1 is the level of the highest possible customer satisfaction. Otherwise, repeat the step, and repeat until you get the correct result. The Q index is calculated for all alternatives to products. The value of the Q indicator will be integrated with the product life-cycle assessment at stage five of the procedure.

2.4. Product Life-Cycle Assessment (LCA)

Life-cycle assessment (LCA) was developed in the 1990s and is carried out according to the ISO 14040 standard [28]. It covers all phases of a product’s life “from cradle to grave”, i.e., material acquisition and extraction, production, use, and end of life (including recycling). In the proposed approach, it concerns the assessment of the product life cycle. However, LCA is a method that enables the quantitative and qualitative assessment of potential environmental loads not only for the product but also for the system or process. Following the ISO 14040 standard, LCA is a set of input data that must be cross-referenced with materials, energy, and other environmental impacts. The general flow of the life-cycle evaluation according to ISO 14040 applies to (1) determining the goal and scope, (2) the inventory analysis, (3) the impact assessment, and (4) the interpretation, as described in detail in the literature on the subject, for example, in [19,44]. Life-cycle assessment can be supported by computer programmes. The results of the life-cycle assessment can form the basis for taking appropriate actions to reduce the negative impact of the product on the environment. According to the proposed concept, the life-cycle assessment is performed for one selected impact criterion. The selection of the criterion results from the nature of the product’s potential environmental impact and the concentration of results that are later to be integrated with the quality-assessment results. The entity chooses the impact criterion. In the proposed procedure, the amount of environmental burden is integrated with the level of the quality of the product, as presented in the next step of the procedure.

2.5. Integration of Product Quality Level with Life-Cycle Environmental Impact (LCA) and Interpretation of Results

As part of determining the aggregate QE indicator, the expert (taking into account customer expectations) determines the ratio of importance (weights) of quality to the environment, in terms of the use of the product by the customer. Weights are given on a scale from <0;1>, where 0—not important, 1—absolutely important. Then, quality and environmental aspects are given importance in the context of defining product-improvement activities (2):
q i = w Q × Q i     for   the   quality   level   e i = w E × E i     for   environmental   load
where: wQ—importance (weight) of the quality level, w E —importance (weight) of the product’s environmental impact in LCA according to the environmental burden criterion, Q—quality level, E—environmental impact, and i—product and its alternative.
The aggregation and interpretation of the quality and environmental indicators are carried out according to the modified IPA model (importance-performance analysis) [45]. This model is universal and allows one to determine the direction of product development in terms of any aspects whose values have any scale of assessment. It was considered reasonable in this procedure because the quality-level values range from 0 to 1, while the environmental load values may vary (depending on the product type, system boundaries, functional unit, etc.). Detailed characteristics of IPA are presented in the literature on the subject, e.g., in [31]. Due to this fact, IPA is assumed to be created according to the value of the weighted quality level and the weighted environmental impact, as shown in Figure 2.
The layout of the lines depends on the entity using the proposed procedure. This results from the assumptions of the expected (satisfactory) level of quality and also the environmental impact that may be considered acceptable. Often, the matrix is created depending on the dispersion characteristics of the data. Therefore, it is not possible to clearly indicate the optimal and universal division.
The “concentrate here” area is the most favourable and indicates that the product quality and its environmental impact are satisfactory, i.e., high quality and low environmental impact. This area means that the product can be improved, but its current condition is satisfactory to the customer and has the lowest possible negative impact on the environment. The area of “keep up the good work” is a promising area but requires further improvement—mainly in the qualitative area. During the process of improving product quality, remember to maintain or, if possible, minimise the environmental impact. The “low-priority” area means that the product may be of high quality, but its environmental impact is high. Therefore, it is not desirable to achieve this in the era of sustainable product development. Similarly, the “possible overkill” area presents both a high negative environmental impact and a low level of quality. This indicates low customer satisfaction and environmental neglect.
Based on the results of the presented IPA model, the direction of product improvement in terms of quality and environment is determined. The basic conclusion that can be drawn after using the proposed method is to obtain a ranking list that can be used by the decisionmaker in selecting the prototype for production, which, in addition to providing customer satisfaction, will also practically implement the idea of sustainable development. This decisionmaker may be, for example, a manufacturer, a bidder, or a broker. Other implications of the results for the beverage-packaging industry in terms of improving product quality and reducing environmental impact also include (i) the possibility of specifying the direction of development of these packagings in terms of quality and environment (increased customer satisfaction and reducing the negative environmental impact), (ii) reducing the waste of resources by avoiding actions that are unnecessary or unexpected by customers, or that are less beneficial for the environment as a whole, and (iii) supporting the sustainable development of these products by not only selecting the most advantageous production solutions but also solutions that should be avoided and also have a development perspective in the future. This provides some flexibility of the proposed procedure and the possibility of adapting it to various products and products in various stages of development.

3. Results

The sustainable development of companies encourages them to take actions in line with customer expectations while limiting the negative impact on the environment. In recent years, there has been a decline in steel cans and a significant increase in the number of lightweight aluminium or plastic cans. In the development context, the largest source of use of this type of product is the food industry (95%) [37]. A certain product innovation of cans is the “chill-on-demand” system, which is a technology that supports rapid cooling on demand. This system is considered promising for reducing negative climate changes and, above all, reducing greenhouse gases. The main aspect that leads to these conclusions is the possibility of using this system in place of refrigerators and coolers, which are very popular in low-income countries, and often middle-income ones, and where their use is not excluded even in wealthy countries [47].
Therefore, it was considered reasonable to select the mentioned self-cooling beverage can (with the chill-on-demand system) for the test procedure. Due to the fact that its main advantage is the ability to reduce greenhouse gases, the life-cycle assessment was concerned with the carbon footprint, which is one of the most popular criteria in this type of analysis. The carbon footprint is the total amount of greenhouse gases emitted during the product’s life cycle. The conversion unit is the equivalent of CO2 (CO2e) [48,49]. The mentioned equivalent is understood as a way to measure and compare the impact of different greenhouse gases, presented in terms of the equivalent warming effect in relation to carbon dioxide over a specific time period, usually 100 years [50]. There are many methodologies and paths used to calculate the carbon footprint of both an organization and a product. For this reason, the article is not limited to a specific methodology. The selection of a specific methodology was left to the expert performing the assessment. As a competent person, he will select a method appropriate to the product, company, and environment. The most frequently used are international standards; the most popular of which is The Greenhouse Gas Protocol. The test procedure is presented in the five main steps adopted in the general approach.

3.1. Selecting a Reference Product and Defining the Research Goal

The subject of the research was a self-cooling beverage can, whose use is supported by the “chill-on-demand” system. A self-cooling beverage can consist of several main components: a steel outer can, the beverage, an inner aluminium can, a heat exchange unit (HEU), and a cooling button [47]. A simplified presentation of these elements is shown in Figure 3.
The system that supports the cooling of the beverage in the can causes endothermic desorption of carbon dioxide (CO2), which is previously adsorbed in the activated carbon (AC) beds. It is inside the can. The outer part of the box is made of galvanised steel, while the inner part is made of aluminium. The internal part constitutes the heat exchange unit (HEU) and is composed of activated carbon, which prevents the contact of the drink with the activated carbon. Furthermore, the use of HEU increases the size of the can compared to traditional cans. Cooling is started using the button located at the bottom of the can. Then the valve activates the pressure outside the HEU, and the CO2 ventilation process begins. It is assumed that ideal conditions will allow the drink to cool down to even 15 °C [51]. The technological process of self-cooling cans is shown in Figure 4.
In accordance with the adopted subject, the research goal was established: determining the current level of quality of a self-cooling beverage can and its environmental impact throughout the entire life cycle (LCA) in terms of carbon footprint. Consistent with this goal, the next stages of the procedure were started.

3.2. Obtaining Customer Expectations

As part of determining the customer’s expectations, it was necessary to select the main criteria (attributes) of the self-cooling beverage can, i.e., criteria that have a significant impact on the customer’s level of satisfaction with the usability of the can. The criteria for assessing quality reflect a functional and usable approach to meeting customer expectations. Their number has been adjusted to the selected methodology. Characteristics of the selected criteria are:
  • height (mm)—the height often determines how large of a box a can be stored in;
  • outer diameter (mm)—determines the firmness of the grip and the ease of holding the can by people with different grip sizes (child, adult);
  • base diameter (mm)—determines the stability of the box;
  • volume (mL)—should be adjusted to commonly desired can volumes;
  • opening method—must be easy to open under various conditions;
  • material—should meet food safety requirements;
  • self-cooling system—should provide the appropriate temperature at a specific time.
After consultation with the customer, it was assumed that he expected a can that is light, stable, easy to open, handy (comfortable to hold), protected against light, and maintains the expected temperature of the drink. The customer’s subjective expectations were translated into technical criteria (e.g., according to the product catalogue). There were five main criteria, i.e., height, external diameter, base diameter, volume, opening method, can material, and self-cooling system. These criteria are described by parameters and assessed by the customer (Table 2).
The most important criteria for the customer were the self-cooling system and the material from which the can was made. Then, the criteria were the total volume and how to open the can. The height and outer diameter of the can received lower ratings, and the base diameter was the least important. Based on the importance of the criteria, it is possible to rank the improvement activities. This is done in the last stage of the procedure. In turn, the customer’s ratings about the quality of the self-cooling can’s criteria were processed at the next stage of the procedure.

3.3. Assessment of the Product Quality Level

In accordance with the set of customer expectations regarding the quality of the self-cooling can criteria, calculations were carried out according to the formalised scoring method. It was assumed that the expected can level corresponds to the normal requirements (C = 0.05). Using Formula (1), it was estimated that the self-cooling quality level indicators can be the following: Q1 = 0.63, Q2 = 0.81, Q3 = 0.51, and Q4 = 0.79. It can be seen that variant 2 is characterized by the highest level of quality, with a slightly lower quality index achieved by variant 4. Subsequent to these were variant 1 (current) and variant 3. The final stage involves a further interpretation of the results with respect to the quality level.

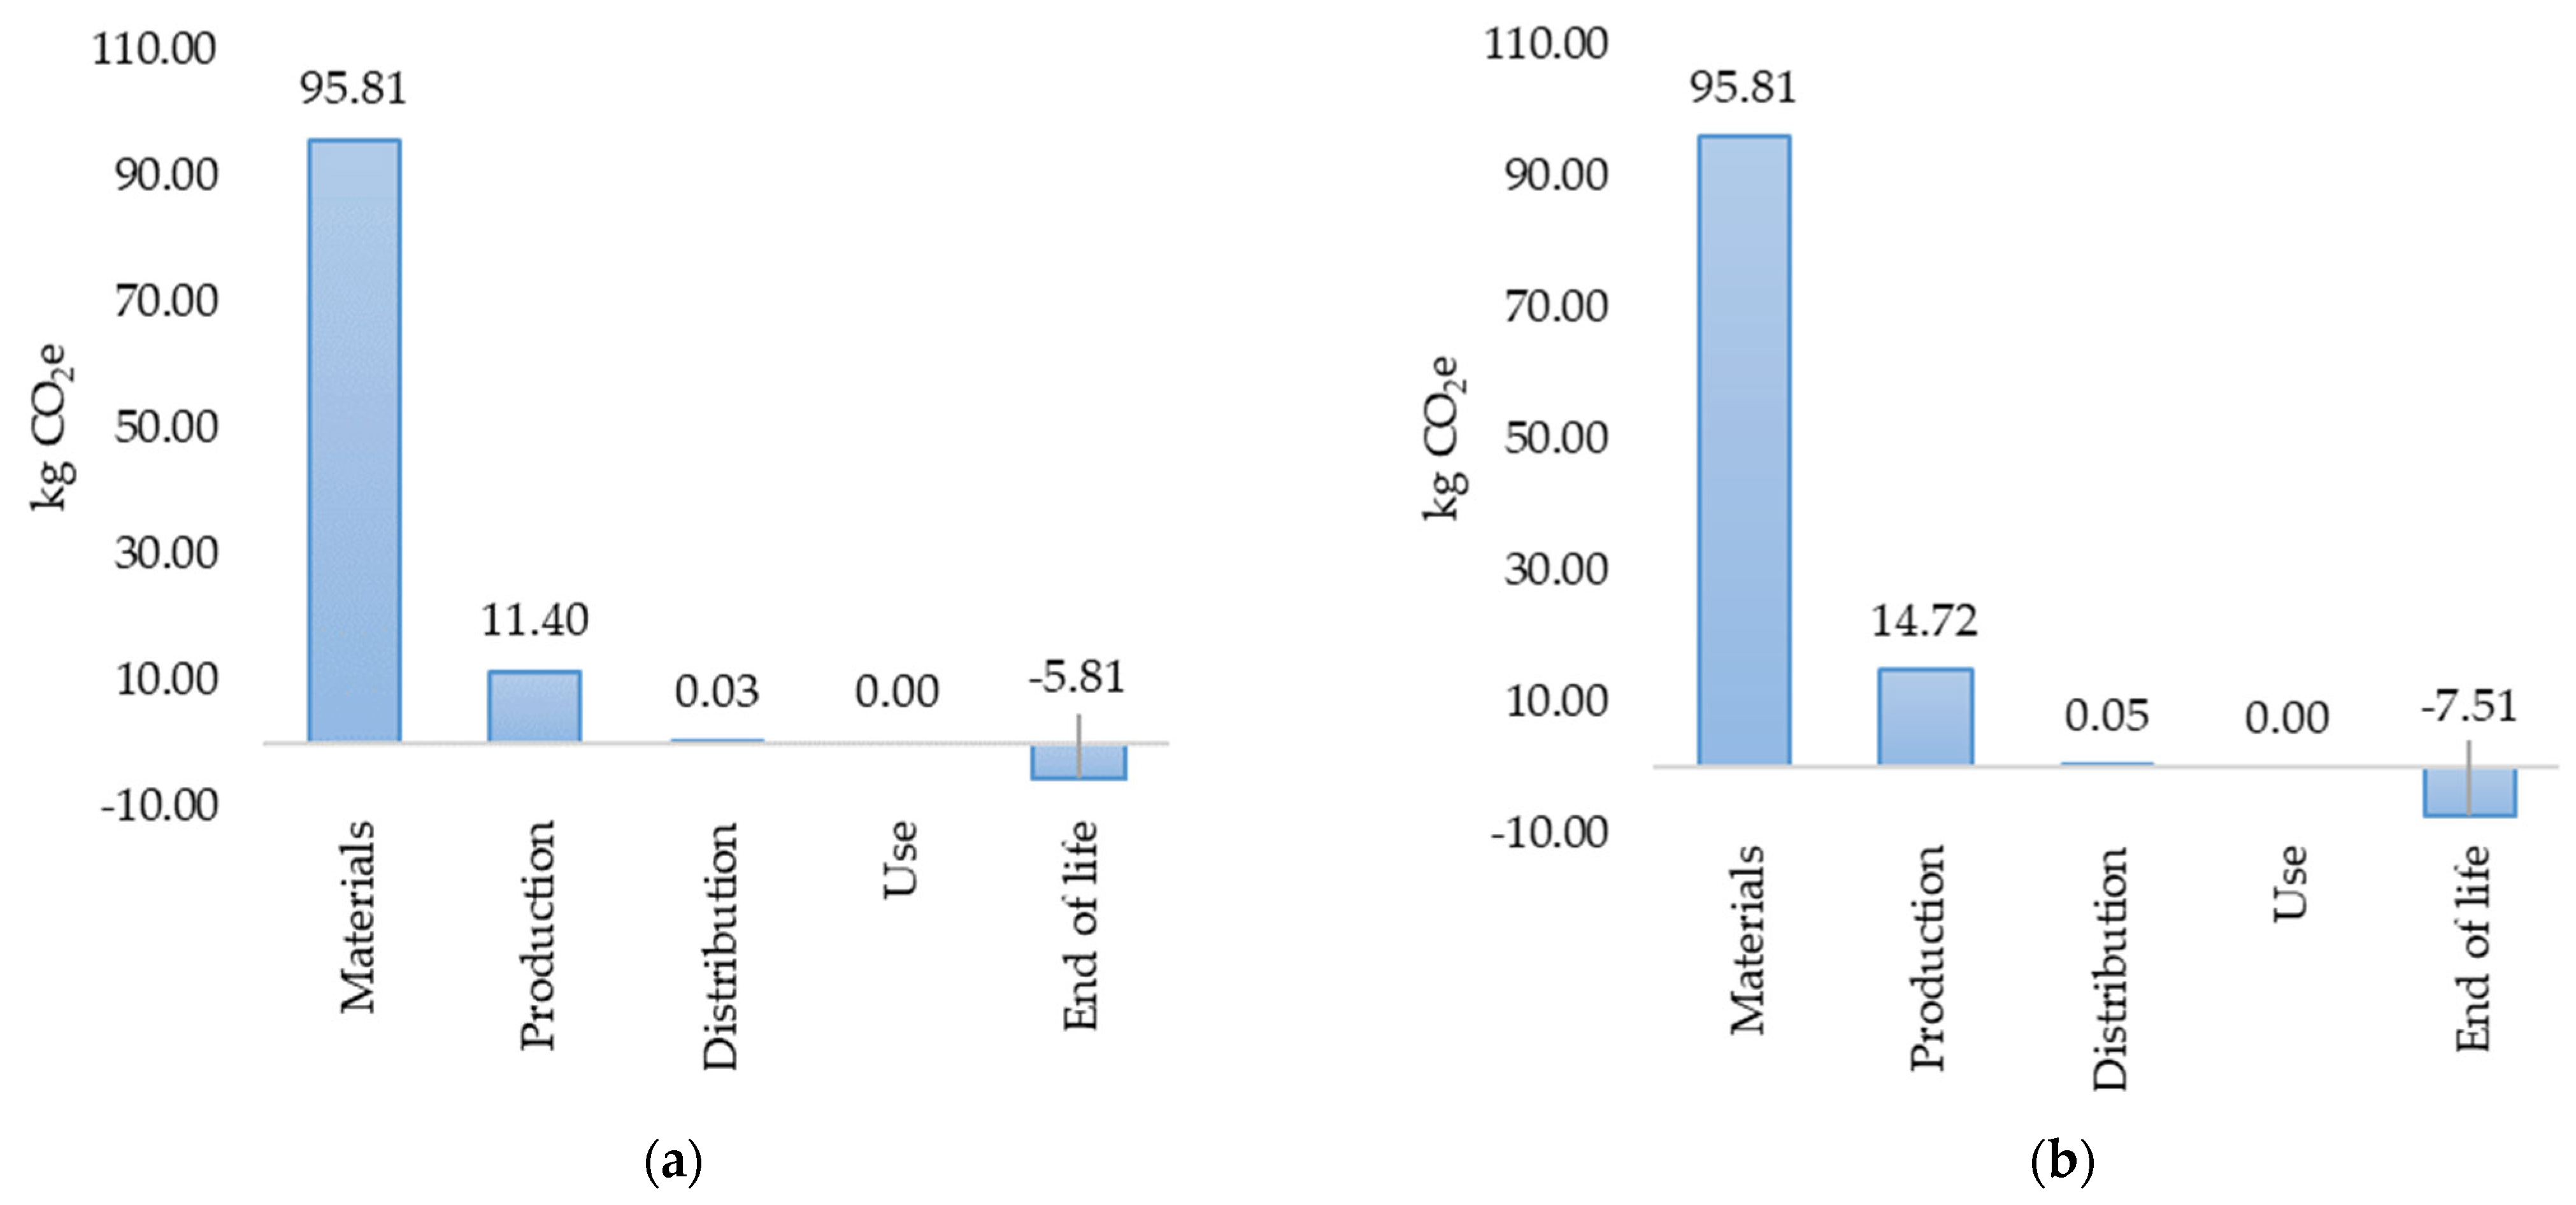
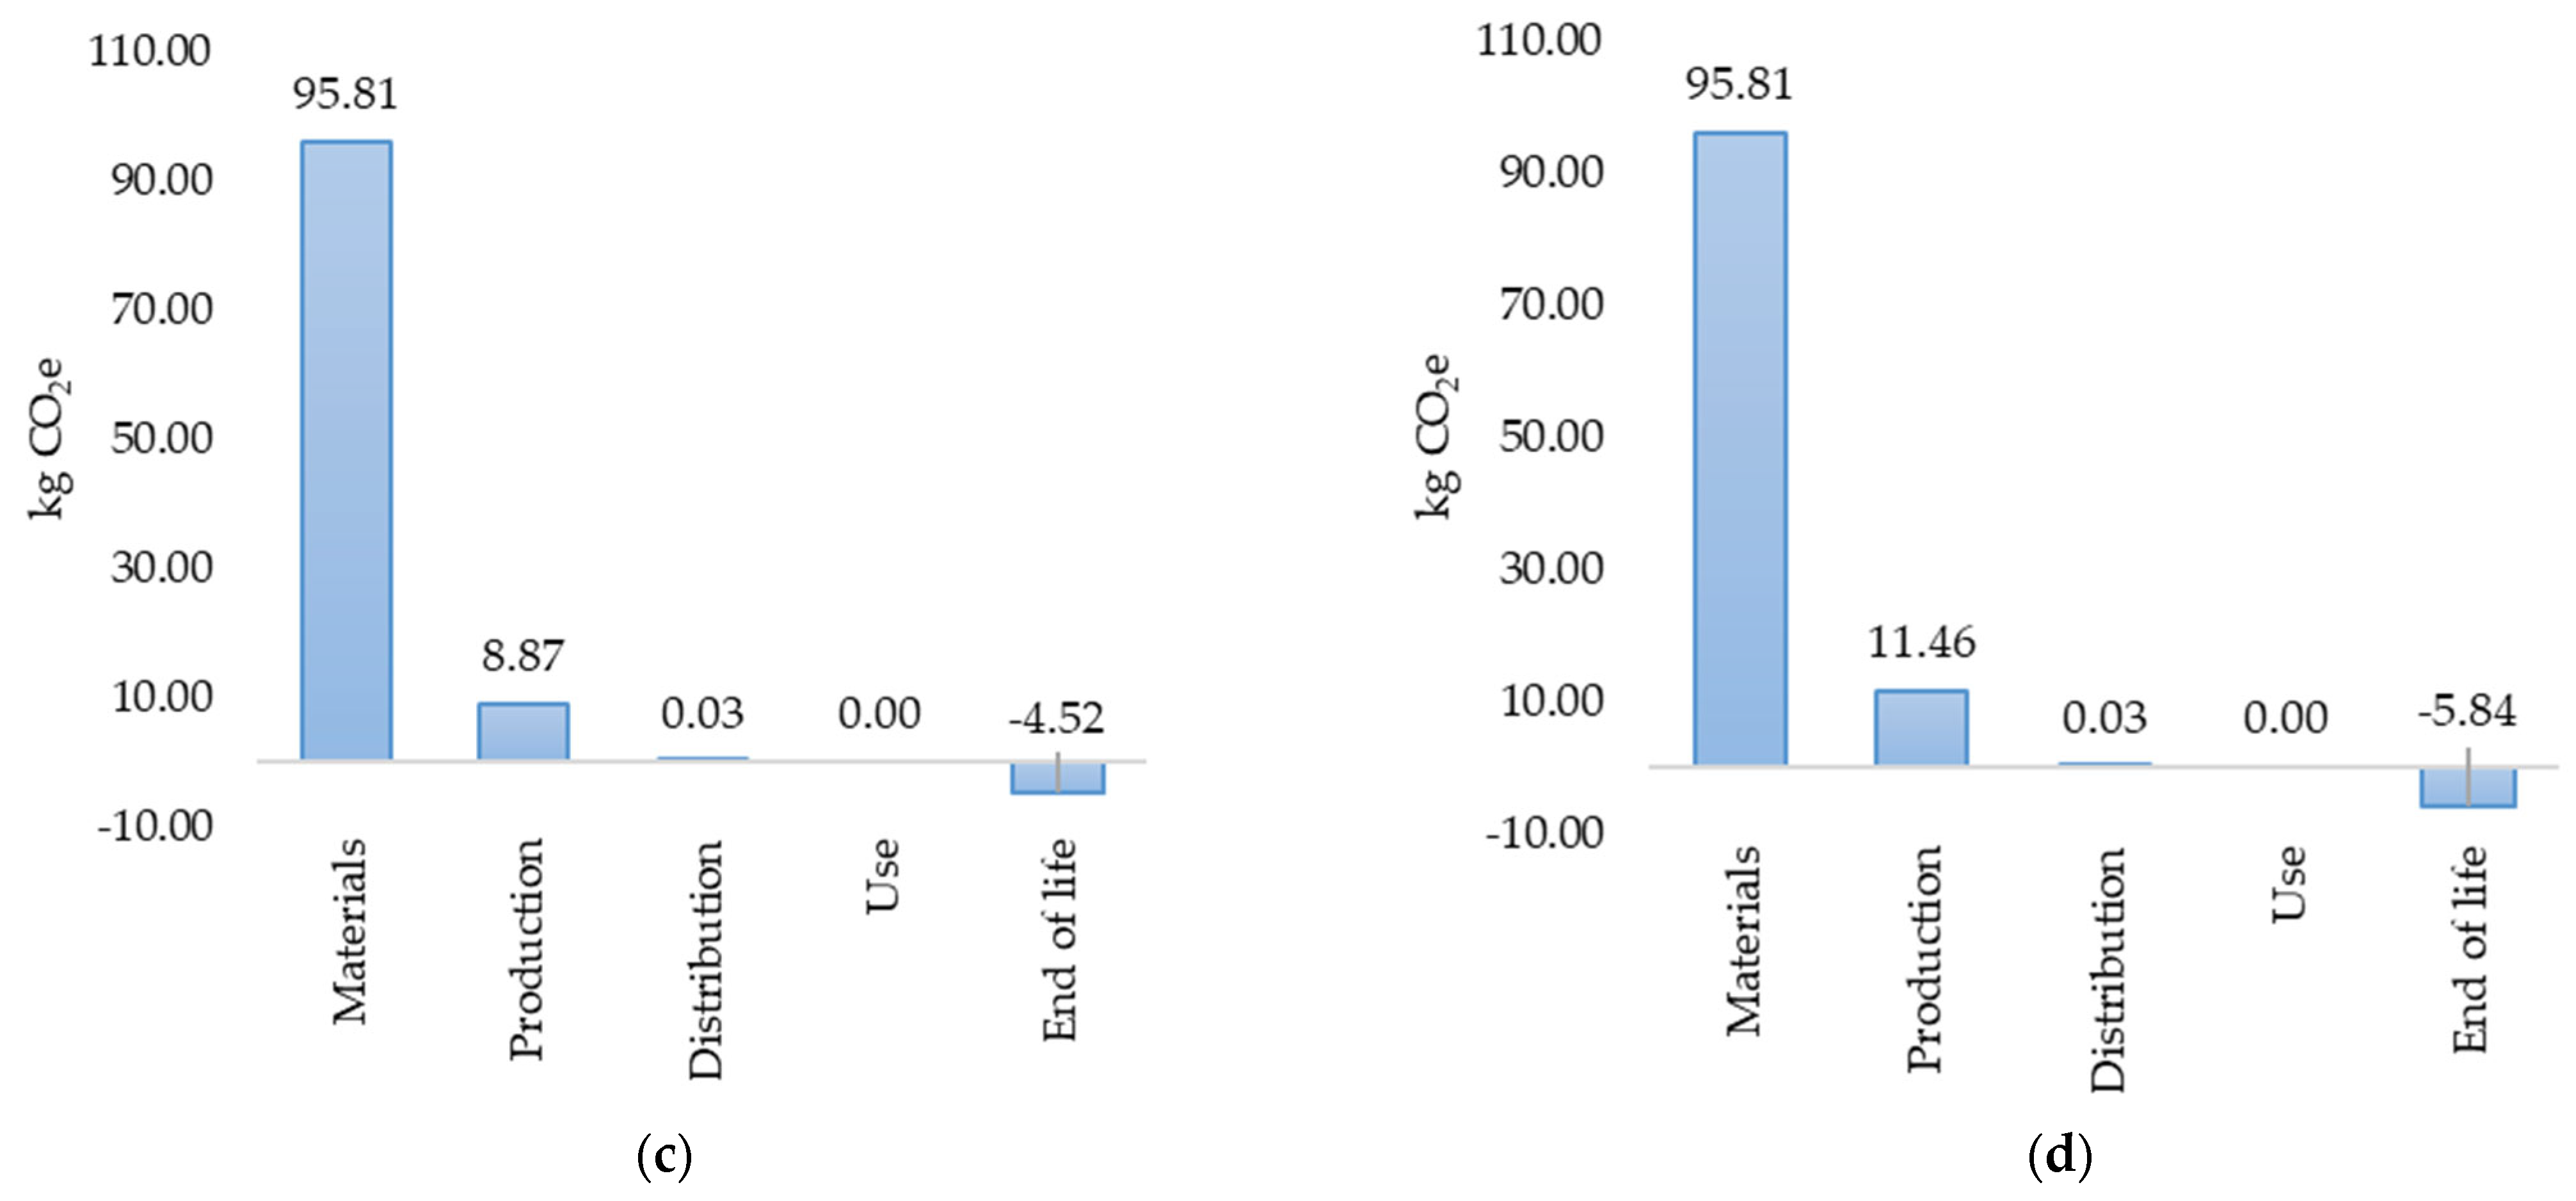
3.4. Product Life-Cycle Assessment (LCA)

A life-cycle assessment (LCA) of a self-cooling beverage can was performed according to the ISO 14040 standard. As intended, the life-cycle assessment was concerned with the impact criterion of carbon footprint. The analysis was supported by the FOOTPRINTCALC 1.2 calculator. Its use does not require detailed knowledge of individual calculation methods, and the use of this program is simple (it focuses on providing the input data presented in the article) and available to all interested parties. It is intended to measure and improve the environmental impact of products for the above-mentioned carbon-footprint criterion (the so-called environmental burden). The carbon footprint can be calculated using various methods and a description of all, or even only the main, methods would make the article a textbook that would not exhaust the topic anyway.
The total volume of the can is approximately 550 mL. This is due to the cooling element contained in it. However, the volume of the drink is similar to that in traditional drink cans, i.e., approximately 330 mL. Therefore, the functional unit was cooling 330 mL of the drink in a can with a total volume of 550 mL. It was assumed that the life of a can is its single use by a customer, which means drinking the drink. Therefore, it is important to pay special attention to the recycling of these types of products. Behind the authors of the work [47], it is necessary to separate the outer steel part and the inner aluminium part (HEU) so that they can be recycled or reused. When modelling data, it is assumed that cans are filled with beverages, but their demolition occurs near the can production site. The phase of use of the can by the customer is omitted in the life-cycle assessment due to the lack of sufficient data. At the same time, in this approach, it only involves emptying the can of the drink and using it once. The main self-cooling materials were adopted according to the authors of article [47], where variant 1 is the actual variant, while the others are proposed prototypes. The environmental burden of the carbon footprint for the prototypes was estimated based on the proportions according to variant 1 (real) based on the volume of the cans. The analyses were extended by calculating the change in value, in %, as the difference in the value of environmental load and the average value of these loads by their average value. It is then possible to observe that there are slight differences between variants 1 and 4 and between variants 2 and 3. Additionally, when analysing environmental loads in terms of statistical analysis, appropriate distributions of proportions between the conventionally modelled values were observed, as shown in Table 3.
The absorbent is assumed to be activated carbon. It is produced from coconut husks. They have a significant supply, which concerns their economic profitability as a production material, and at the same time, they are characterised by high density and purity. Coconut husk is considered waste in food, but in this type of application, it can be used in the production of activated carbon. Following the authors of [47], coconut shells generate an alternating current. Other materials with low weight were omitted from the analysis.
Due to the nature of recycling, it is assumed that HEU is used in a closed loop, as shown earlier in Figure 3. However, some materials cannot be included in the closed-loop process, such as metal, which varies depending on when recycled for reuse. Following the authors of the study [47], the focus was on the basic scenario, where recovery and reuse are carried out according to European standards. That is, 70% is recovered after use, while 30% is waste. Aluminium in HEU is reused, and 70% of HEU can be recovered by reloading it with activated carbon. The remaining 30% is activated carbon, regenerated in an economical furnace (energy consumption of 1 kWh/kg). The adopted scenario regarding the recycling of materials at the end of the can’s life was also considered for the current product (variant 1) and the anticipated prototypes (variant 2–4), which were modelled according to proportions based on the volume of the can. In addition, the presented data were supported by a statistical analysis, which consisted of calculating the change in value in % as the difference in the value of the environmental load and the average value of these loads by their average value. Similarity was observed between variants 1 and 4 and between variants 2 and 3. It was shown that there are small significant differences between the analysed loads for the given types of variants, as shown in Table 4.
The transport and storage possibilities can be assumed in the form of their transport over a distance of approximately 40 km by diesel trucks with a load capacity of 27 tons, the details of which are presented in the study [47]. According to the adopted assumptions, the carbon footprints in the life cycle of a self-cooling beverage can and its variants of production solutions were estimated. The FOOTPRINTCALC 1.2 programme was used for this purpose. The main result for individual prototypes is shown in Figure 5.
The largest amount of the carbon footprint (96 kg CO2e) is generated during the can distribution phase. This result is mainly due to modelling the data to include one piece of a beverage cooling can. These conclusions are confirmed by, among others, studies [48,52,53,54] that also state that the distribution phase of this type of product is associated with significant environmental burdens. However, if the number of cans transported was greater, a greater environmental impact would be observed in the remaining phases of the life cycle. Among other things, the greater amount of carbon footprint is in the production phase of the self-cooling beverage cans (from approximately 9 to 12 kg of CO2e) and, subsequently, in the acquisition and extraction of materials (from 0.03 to 0.05 kg of CO2e). It was also observed that, in the end-of-life phase (including recycling), these emissions range on average from −4.52 to −7.51 kg of CO2e. A detailed analysis of the carbon footprint in the life cycle of a self-cooling beverage can and its variants is presented in Table 5, which includes a statistical analysis consisting of calculating the change in value, in %, as the difference in the value of environmental load and the average value of these loads by their average value.
Both the results of the statistical analysis and the primary values for environmental loads showed that in the phase of obtaining and processing materials, the largest carbon footprint is created for virgin aluminium (from 0.056 to 0.113 kg CO2e), followed by virgin steel (0.011 to 0.021 kg CO2e). There is a negligible amount of carbon footprint for recycled materials of this type. In the case of the production phase, the largest amount of carbon footprint concerns energy from AC regeneration (from approximately 9 to approximately 15 kg CO2e). The energy for AC pressurising in HEU (from 0.009 to 0.015 kg CO2e) and the energy for CO2 processing (from 0.007 to 0.011 kg CO2e) have a relatively similar amount of carbon footprint. As mentioned earlier, the distribution phase is characterised by the highest level of carbon-footprint emissions (1080 tkm is almost 96 kg of CO2e). The end-of-life phase of a can includes, among others, a pre-use fraction of virgin aluminium (from about 3.5 to about 6 kg CO2e) and a pre-use fraction of virgin steel (from about 0.435 to about 0.721 kg CO2e). The remaining elements, that is the pre-use fraction of recycled steel, the fraction of recycled aluminium recycled, the pre-use fraction of recycled aluminium, or the fraction of recovered aluminium reused, are from −0.064 to −7.074 kg CO2e.
In accordance with the adopted assumptions and the system boundary, the total amount of carbon footprint for a self-cooling beverage can in its life cycle is 101.43 kg CO2e (variant 1), and for its prototypes, respectively, 103.071 kg CO2e (variant 2), 100.194 kg CO2e (variant 3), and 101,456 kg CO2e (variant 5).
It has been shown that, in order to reduce this environmental burden, it is necessary first to limit or change the use of the means of transport for transporting self-cooling cans. This is also confirmed by the authors of other studies, for example [48,54]. Then, it would be good to apply improvement activities to the production phase, mainly in the area of energy use. It has been observed that the material emitting the most significant amount of CO2 is aluminium, e.g., in the extraction and recycling phase. Therefore, even though it is a light and plastic material, in terms of the environment, it is worse than, for example, steel. Therefore, it is possible to use a more environmentally friendly substitute. Further interpretation takes place in the next stage of the procedure.

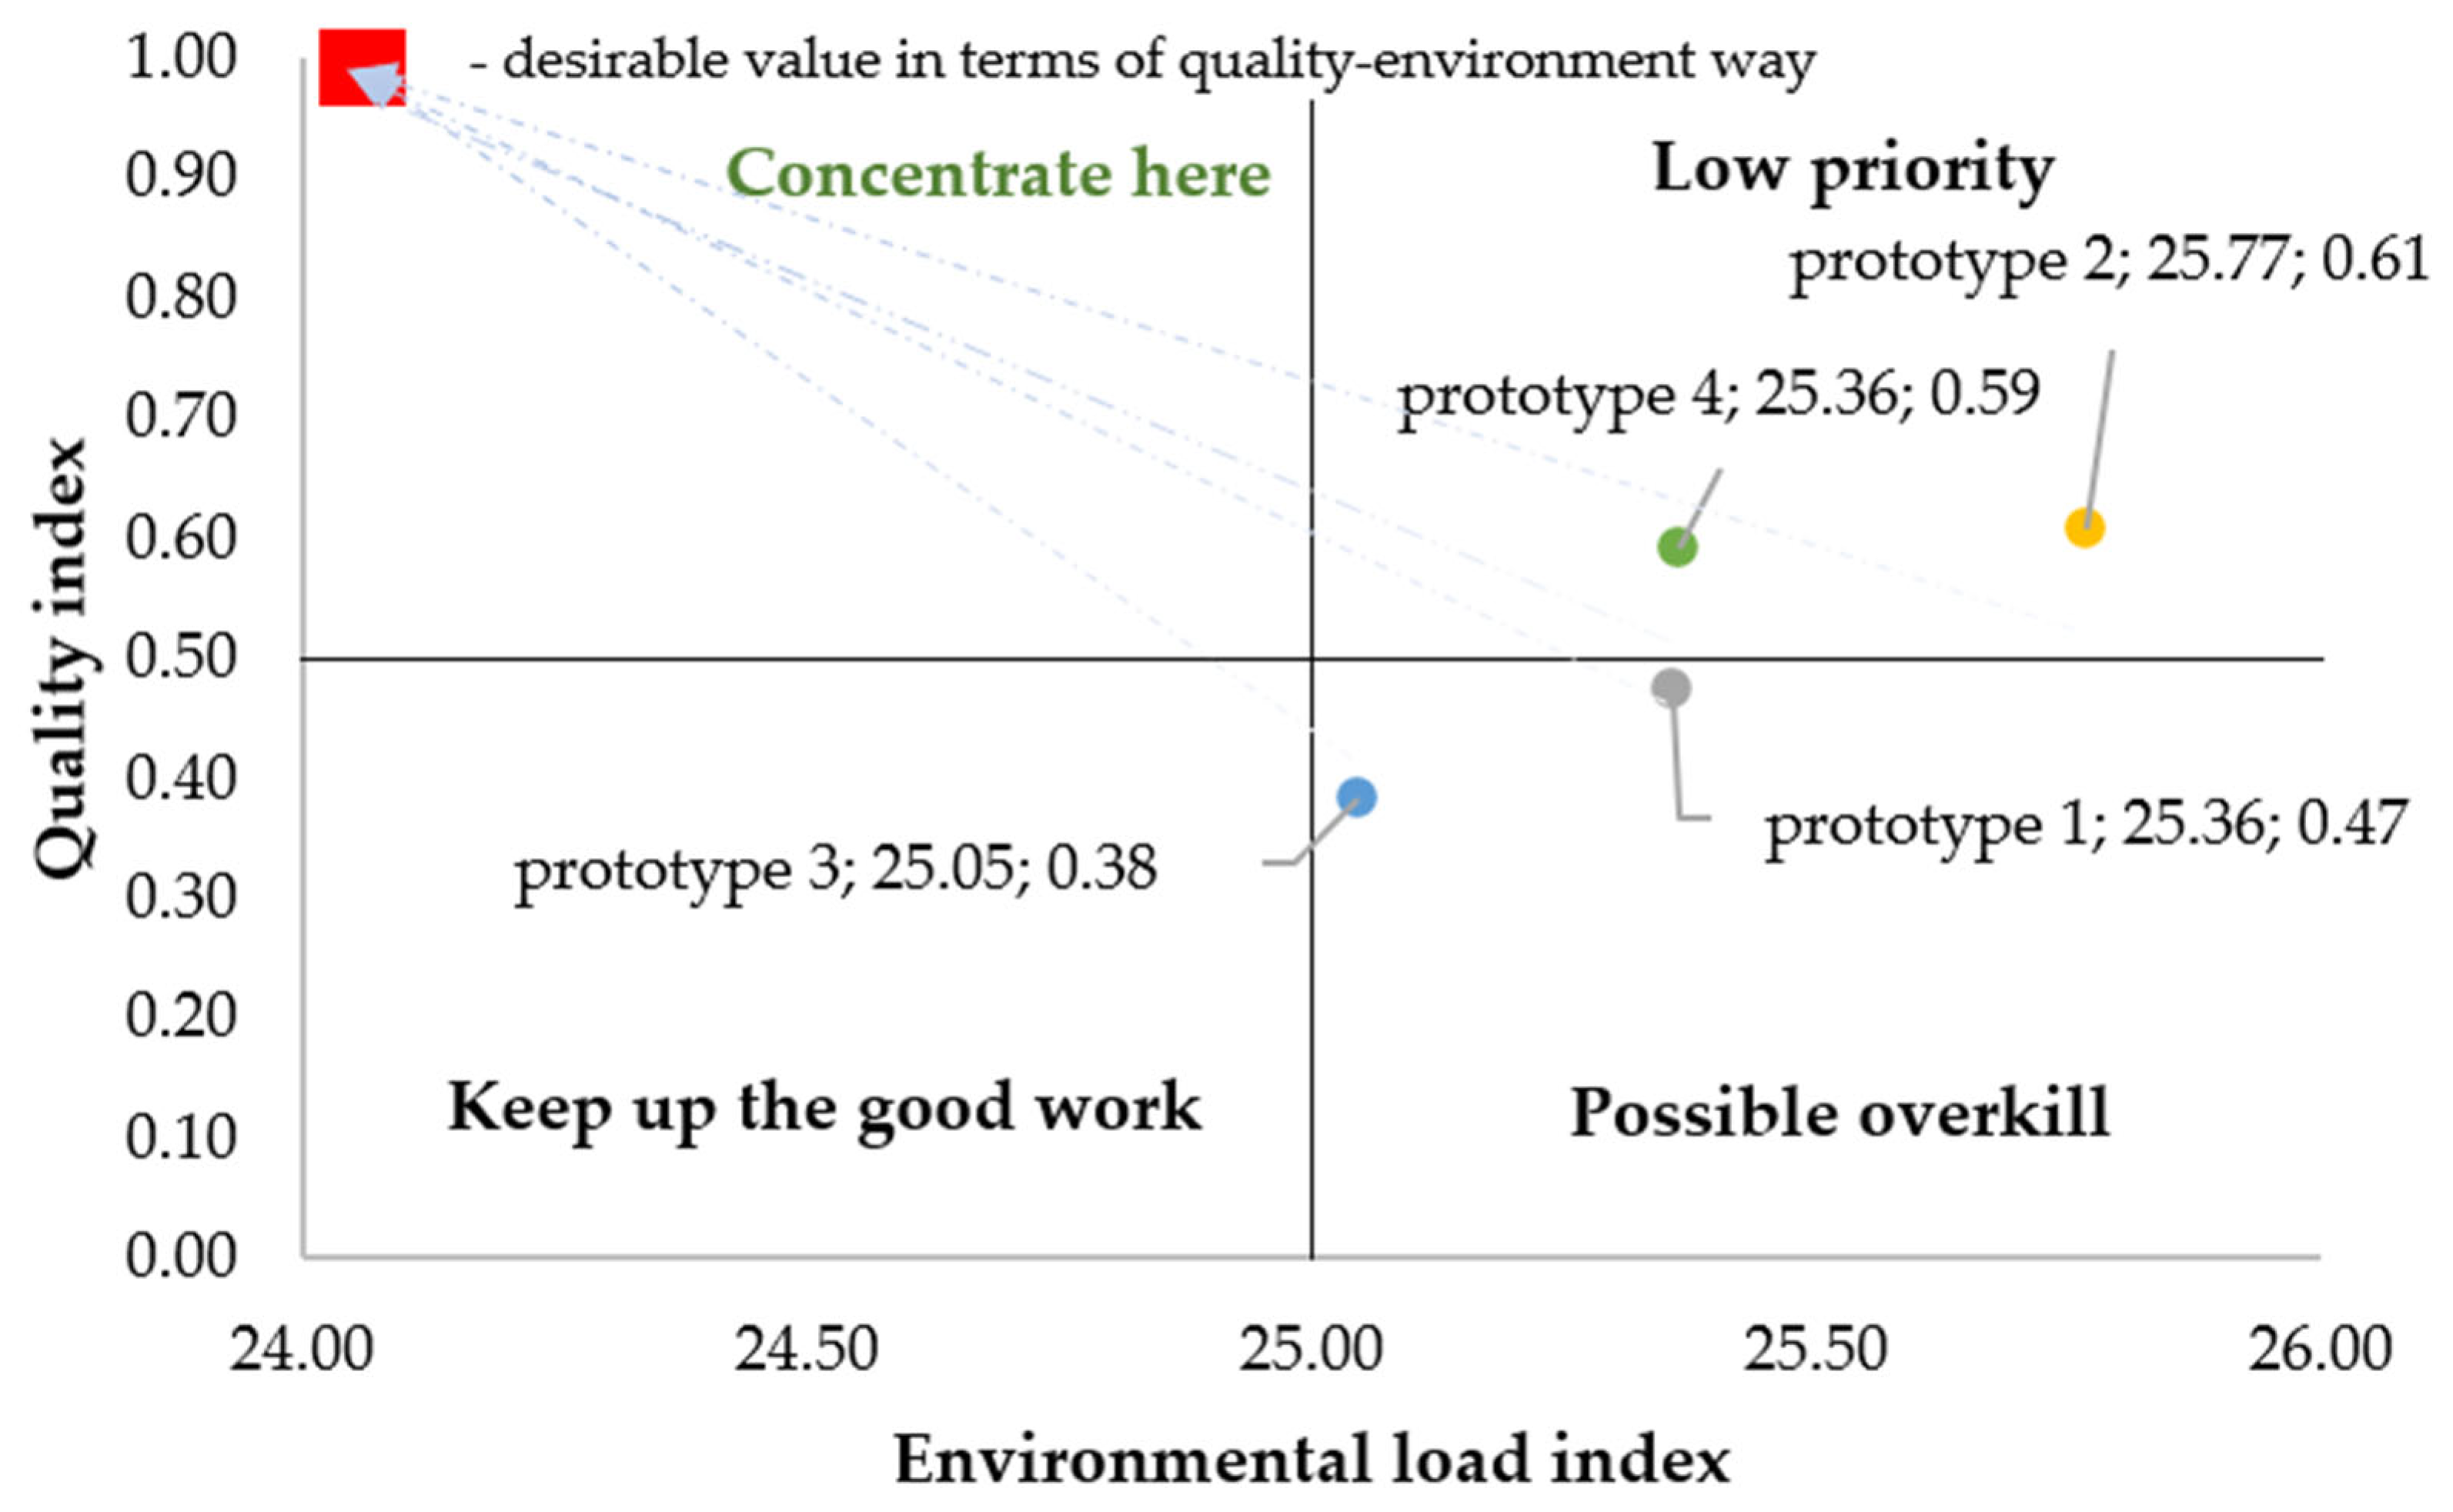
3.5. Integration of Product Quality Level with Life-Cycle Environmental Impact (LCA) and Interpretation of Results

At this stage, the value of the self-cooling beverage can quality indicator (Q) and the value of its environmental impact indicator in LCA were aggregated in terms of carbon-footprint emissions (E). The importance (weights) for quality and environmental aspects was assumed to be at the 0.75: 0.25 ratio for quality and, respectively, for environmental impact. Then, using Formula (2), the aggregated quality and environmental indicators were calculated and presented in the IPA model (Figure 6).
According to the modelled data, it was concluded that the analysed self-cooling beverage can is in the “possible overkill” area. This means that it is currently characterised by a relatively unsatisfactory level of quality and, at the same time, by an environmental impact on the life cycle. It was observed that, compared to the other prototypes (e.g., the second and fourth), it performed the worst. For this reason, it seems necessary to improve the self-cooling beverage can. The third prototype is closest to the “concentrate here” area. It has a relatively low quality level but has the lowest carbon footprint. Currently, it is in the “keep up the good work” area. This means that taking improvement actions for this prototype can contribute to improving quality and reducing the carbon footprint. The second and fourth prototypes are characterised by low priority in further development; they have a relatively high level of quality but a high burden due to carbon-footprint emissions. However, they should not be excluded from the future development of this product. It is essential to direct the development of the self-cooling beverage can to be in the “concentrate here” area. Based on the importance of the criteria for this product, as well as the results obtained from the IPA model, it was concluded that improvement activities should focus on:
  • selection of a means of transport for transporting self-cooling cans;
  • reducing energy use in the production phase of self-cooling cans;
  • the use of appropriate materials that emit less CO2 (e.g., aluminum substitute);
  • changing the way of opening the can;
  • change in can volume.
Taking improvement actions that take into account these proposals may contribute to an increase in the quality level and a smaller carbon footprint for a self-cooling beverage can. It is important to take these actions while also considering the increase in quality and the reduction of the carbon footprint throughout the life cycle of this product. Then, sustainable development of this product in terms of quality and the environment will be possible. However, it should be remembered that the analysis covers the expectations of an individual customer, and the results were modelled in accordance with the adopted system boundaries. Hence, the results may vary depending on the increase in sample size, including changes in the assumptions adopted. Sensitivity analyses will be performed in future studies.
The authors assumed that the procedure would be comparative for prototypes of the same product. Other assumptions can be introduced by decisionmakers/experts conducting these calculations in their enterprise in its specific conditions. Therefore, procedure validation is a separate issue. Since the procedure is intended to be comparative in nature, it is not necessary to have a high degree of confidence that this procedure will reproducibly lead to obtaining results that meet the specified acceptance criteria. Additionally, this procedure provides not only a ranking but also the selection of the area with the most favourable development direction (according to the IPA model), which is not intended to be decisive, only to support the decisionmaker’s decisions.

4. Discussion

Sustainable product development requires entrepreneurs to design and improve products in an environmentally friendly way [55,56,57]. However, this is not the only aspect. It is also important to adapt these products to customer expectations, which change dynamically over time [58,59]. Finding a way to simultaneously analyse product sustainability criteria is a challenge, mainly from the point of view of its entire life cycle [60]. Therefore, the objective of the investigation was to develop a procedure that supports the aggregation of quality-level indicators and life-cycle assessment (LCA) to determine the direction of product improvement. The procedure was tested for a self-cooling beverage can with the “chill-on-demand” system. It has been shown that it is possible to aggregate quality indicators and a life-cycle assessment performed for one environmental load criterion as part of the product-improvement process. Therefore, the adopted hypothesis was confirmed. Therefore, it was concluded that the main benefits of the proposed procedure include, among others,
  • assessment of the product life cycle and its alternatives in terms of any environmental burden criterion;
  • customer’s assessment of the current quality of the product and its alternatives;
  • aggregation of the product quality indicator with the life-cycle assessment indicator;
  • determination of the main environmental burdens in the product life cycle, including the estimation of expected environmental burdens;
  • Identifying the state of product development in terms of quality and the environment and directing it towards increasing product quality and minimising its negative environmental impact.
However, a certain limitation of the procedure is its adaptation of the results to the expectations of a customer and the limitation of the product life-cycle assessment analysis to one selected environmental load. It resulted from the fact that the proposed methodology at this stage is proposed to be used for prototypes of the same product, which particularly concerns adapting the analysis to customer expectations and one environmental load criterion. By comparing the results of different products (prototypes of different products), while quality-level calculations can take place, in the case of carbon-footprint calculations or even a larger number of other environmental load criteria, it is problematic and, from a logical point of view, is pointless. This is evidenced by the basic limitations of the LCA method, the results of which depend on the system boundaries or access to reliable data. In the form of prototypes, the load results for one environmental load criterion are modelled in accordance with the modelled quality level, and adapting the method to verify a larger number of criteria forces further assumptions that will be considered in further research, including method-sensitivity analyses. In the case of this article, it was limited only to the presentation of the method. It was assumed that prototypes of the same product would be compared. So, since the same method will be used in the same conditions by the same experts, the sensitivity of the method will not be significant. At the same time, the IPA model used in the method (applicable in the aggregation of quality and environmental impact indicators) has a universal application—where it is possible to adjust any comparability scales for two different indicators (having different values); hence, it is used in the proposed approach. Additionally, this methodological aspect eliminates the need to conduct a sensitivity analysis. Nevertheless, the problem is important not only from a scientific but also from a utilitarian point of view. Such an analysis will constitute the next stage of research.
Due to the nature of the procedure, it is impossible to predict all limitations for all customers and for all products, or rather their prototypes. Therefore, it seems advisable to focus only on the main limitation, which is the possible need to give up some satisfaction (quality) in order to care for the natural environment. A remedial method may be the use of awareness-raising activities. Marketing can be used for this purpose. This action will be effective because ecological education strategies are being implemented in countries, and young customers respond much better to the need to implement the idea of sustainable development.
Therefore, future research will consist of aggregating the quality indicator with life-cycle assessment indicators relating to a larger number of environmental impact criteria. Additionally, it is planned to expand the research sample and perform a sensitivity analysis of the proposed procedure. The methodology was limited to the main beneficiary, which is the customer. It is undoubtedly interesting, but also in line with the spirit of the times, to also take into account the expectations of other interested parties. However, this is a complex issue that may become the subject of the authors’ research in the future. Taking into account the expectations of other interested parties, it would be necessary to take into account the weight of their opinions. The question arises: to what extent the customer’s opinion is more important than the opinion of the state, the bank, an environmental organization, trade unions, etc.? Determining the matrix of mutual weights is a problem, but using this matrix later is obviously not. Therefore, among others, these should become the subject of separate considerations.

5. Conclusions

The pursuit of sustainable development requires companies to skilfully combine quality, environmental, and economic aspects in product development. This is still a challenge, mainly in terms of striving to increase customer satisfaction while limiting the negative environmental impact of products. Therefore, the objective of the investigation was to develop a procedure that supports the aggregation of quality-level indicators and life-cycle assessment (LCA) to determine the direction of product improvement. The procedure was developed in five main stages, which were tested for a self-cooling beverage can, the use of which is supported by the “chill-on-demand” system.
In accordance with the proposed procedure, the quality level of this can was estimated, taking into account customer expectations. The criteria taken into account in assessing the quality of the can were the height of the can, the external diameter of the can, the diameter of the can base, the volume, the method of opening, the can’s material, and the self-cooling system. The quality level was assessed using formalised scoring. The life cycle of a self-cooling beverage can (and its alternatives) was then assessed according to the carbon-footprint emission criterion. The analysis was supported by the FOOTPRINTCALC 1.2 calculator. The quality and environmental impact indicators were then aggregated according to a simplified mathematical model. The results were interpreted based on the modified IPA model. According to the modelled data, it was concluded that the analysed self-cooling beverage can is in the “possible overkill” area. This means that it is currently characterised by a relatively unsatisfactory level of quality and, at the same time, environmental impact during the life cycle. Based on the remaining alternative solutions and the results of the procedure, it was possible to determine the direction for improving this product. It was deemed necessary to carry out improvement activities, which should aim to select a means of transport for the transport of self-cooling cans, reducing energy use in the self-cooling can production phase, using appropriate materials that emit less CO2, changing the method of opening the can, and changing the volume of the can.
The proposed procedure supports the decisionmaker in choosing a can prototype that, in addition to the desired quality (the most common action so far), also takes into account the impact on the environment (through the carbon footprint of the prototypes). The article’s results regarding the environmental impact and quality of the can do not constitute a direct contribution to achieving sustainable development goals, but rather the way in which the analysis of its variants is carried out. The main contribution is the proposed procedure, which is part of the effort to create tools contributing to achieving sustainable development goals.
Using the described methodology, the sustainable development goals are implemented in a practical way. The undoubted expected benefit is the practicality of the operation, which consists of ensuring simultaneous analysis of the product quality and the environmental impact in the LCA as part of taking appropriate improvement actions. Assuming that enterprises begin to act at least partially pro-environmentally, achieving the sustainable development goals will become more realistic. To use this methodology so widely, it would need to be available, e.g., on a free internet platform. Of course, resources were needed for marketing. However, the most important potential barrier to the implementation of these activities on an industry scale should be the awareness of decisionmakers. If they want to act within the framework of sustainable development, they will find a way, either this method or even another one. But if they do not want to work for sustainable development, they will find a reason, and they will not act.
The proposed procedure is applicable to the qualitative and environmental analysis of any product. When used by manufacturing companies, it can support product development in terms of quality (satisfying customer expectations) and environmental aspects (reducing the key environmental burden in the product life cycle).

Author Contributions

Conceptualization, D.S. and A.P.; methodology, D.S. and A.P.; software, D.S. and A.P.; validation, D.S. and A.P.; formal analysis, D.S. and A.P.; investigation, D.S. and A.P.; resources, D.S. and A.P.; data curation, D.S. and A.P.; writing—original draft preparation, D.S. and A.P.; writing—review and editing, D.S. and A.P.; visualization, D.S. and A.P.; supervision, D.S. and A.P.; project administration, D.S. and A.P.; funding acquisition, D.S. and A.P. All authors have read and agreed to the published version of the manuscript.

Funding

This research received no external funding.

Data Availability Statement

The data will be available after sending a request to the corresponding author.

Conflicts of Interest

The authors declare no conflict of interest.

References

  1. Pacana, A.; Gazda, A.; Dušan, M.; Štefko, R. Study on Improving the Quality of Stretch Film by Shainin Method. Przem. Chem. 2014, 93, 243–245. [Google Scholar]
  2. Jaghbeer, Y.; Hallstedt, S.I.; Larsson, T.; Wall, J. Exploration of Simulation-Driven Support Tools for Sustainable Product Development. Procedia CIRP 2017, 64, 271–276. [Google Scholar] [CrossRef]
  3. Gajdzik, B.; Wolniak, R. Smart Production Workers in Terms of Creativity and Innovation: The Implication for Open Innovation. J. Open Innov. Technol. Mark. Complex. 2022, 8, 68. [Google Scholar] [CrossRef]
  4. Gajdzik, B.; Gawlik, R. Choosing the Production Function Model for an Optimal Measurement of the Restructuring Efficiency of the Polish Metallurgical Sector in Years 2000–2015. Metals 2017, 8, 23. [Google Scholar] [CrossRef]
  5. Gawlik, R. Methodological Aspects of Qualitative-Quantitative Analysis of Decision-Making Processes. Manag. Prod. Eng. Rev. 2016, 7, 3–11. [Google Scholar] [CrossRef]
  6. Ostasz, G.; Siwiec, D.; Pacana, A. Universal Model to Predict Expected Direction of Products Quality Improvement. Energies 2022, 15, 1751. [Google Scholar] [CrossRef]
  7. Miranda, J.; Pérez-Rodríguez, R.; Borja, V.; Wright, P.K.; Molina, A. Sensing, Smart and Sustainable Product Development (S3 Product) Reference Framework. Int. J. Prod. Res. 2019, 57, 4391–4412. [Google Scholar] [CrossRef]
  8. Vinodh, S.; Rathod, G. Integration of ECQFD and LCA for Sustainable Product Design. J. Clean. Prod. 2010, 18, 833–842. [Google Scholar] [CrossRef]
  9. Rathod, G.; Vinodh, S.; Madhyasta, U.R. Integration of ECQFD and LCA for Enabling Sustainable Product Design in an Electric Vehicle Manufacturing Organisation. Int. J. Sustain. Eng. 2011, 4, 202–214. [Google Scholar] [CrossRef]
  10. Sakao, T. A QFD-Centred Design Methodology for Environmentally Conscious Product Design. Int. J. Prod. Res. 2007, 45, 4143–4162. [Google Scholar] [CrossRef]
  11. Trappey, A.J.C.; Ou, J.J.R.; Lin, G.Y.P.; Chen, M.-Y. An Eco- and Inno-Product Design System Applying Integrated and Intelligent Qfde and Triz Methodology. J. Syst. Sci. Syst. Eng. 2011, 20, 443–459. [Google Scholar] [CrossRef]
  12. Neramballi, A.; Sakao, T.; Willskytt, S.; Tillman, A.-M. A Design Navigator to Guide the Transition towards Environmentally Benign Product/Service Systems Based on LCA Results. J. Clean. Prod. 2020, 277, 124074. [Google Scholar] [CrossRef]
  13. Sakao, T.; Kaneko, K.; Masui, K.; Tsubaki, H. Combinatorial Usage of QFDE and LCA for Environmentally Conscious Design. In The Grammar of Technology Development; Springer: Tokyo, Japan, 2008; pp. 45–59. [Google Scholar]
  14. Chevalier, J.L.; Le Téno, J.F. Requirements for an LCA-Based Model for the Evaluation of the Environmental Quality of Building Products. Build. Environ. 1996, 31, 487–491. [Google Scholar] [CrossRef]
  15. Romli, A.; Prickett, P.; Setchi, R.; Soe, S. Integrated Eco-Design Decision-Making for Sustainable Product Development. Int. J. Prod. Res. 2015, 53, 549–571. [Google Scholar] [CrossRef]
  16. Kobayashi, Y.; Kobayashi, H.; Hongu, A.; Sanehira, K. A Practical Method for Quantifying Eco-efficiency Using Eco-design Support Tools. J. Ind. Ecol. 2005, 9, 131–144. [Google Scholar] [CrossRef]
  17. Park, P.-J.; Tahara, K.; Inaba, A. Product Quality-Based Eco-Efficiency Applied to Digital Cameras. J. Environ. Manag. 2007, 83, 158–170. [Google Scholar] [CrossRef]
  18. Siwiec, D.; Pacana, A. Model of Choice Photovoltaic Panels Considering Customers’ Expectations. Energies 2021, 14, 5977. [Google Scholar] [CrossRef]
  19. Siwiec, D.; Pacana, A. A New Model Supporting Stability Quality of Materials and Industrial Products. Materials 2022, 15, 4440. [Google Scholar] [CrossRef]
  20. Hameed, A.Z.; Kandasamy, J.; Aravind Raj, S.; Baghdadi, M.A.; Shahzad, M.A. Sustainable Product Development Using FMEA ECQFD TRIZ and Fuzzy TOPSIS. Sustainability 2022, 14, 14345. [Google Scholar] [CrossRef]
  21. Haber, N.; Fargnoli, M. Sustainable Product-Service Systems Customization: A Case Study Research in the Medical Equipment Sector. Sustainability 2021, 13, 6624. [Google Scholar] [CrossRef]
  22. Vinodh, S.; Jayakrishna, K. Development of Integrated ECQFD, LCA and Sustainable Analysis Model. J. Eng. Des. Technol. 2014, 12, 102–127. [Google Scholar] [CrossRef]
  23. Zhang, Y. Green QFD-II: A Life Cycle Approach for Environmentally Conscious Manufacturing by Integrating LCA and LCC into QFD Matrices. Int. J. Prod. Res. 1999, 37, 1075–1091. [Google Scholar] [CrossRef]
  24. Ostasz, G.; Siwiec, D.; Pacana, A. Model to Determine the Best Modifications of Products with Consideration Customers’ Expectations. Energies 2022, 15, 8102. [Google Scholar] [CrossRef]
  25. Sullivan, G.M.; Artino, A.R. Analyzing and Interpreting Data From Likert-Type Scales. J. Grad. Med. Educ. 2013, 5, 541–542. [Google Scholar] [CrossRef] [PubMed]
  26. Pacana, A.; Siwiec, D. Analysis of the Possibility of Used of the Quality Management Techniques with Non-Destructive Testing. Tehicki Vjesn.-Tech. Gaz. 2021, 28, 45–51. [Google Scholar] [CrossRef]
  27. Wu, M.H.; Sadhukhan, J.; Mrphu, R.; Bharadwaj, U.; Cui, X.F. A novel life cycle assessment and life cycle costing framework for carbon fibre-reinforced composite materials in the aviation industry. Int. J. Life Cycle Assess. 2023, 28, 566–589. [Google Scholar] [CrossRef] [PubMed]
  28. Finkbeiner, M.; Inaba, A.; Tan, R.; Christiansen, K.; Klüppel, H.-J. The New International Standards for Life Cycle Assessment: ISO 14040 and ISO 14044. Int. J. Life Cycle Assess. 2006, 11, 80–85. [Google Scholar] [CrossRef]
  29. Edwards, W.; Barron, F.H. SMARTS and SMARTER: Improved Simple Methods for Multiattribute Utility Measurement. Organ. Behav. Hum. Decis. Process. 1994, 60, 306–325. [Google Scholar] [CrossRef]
  30. Samani, P. Synergies and gaps between circularity assessment and Life Cycle Assessment (LCA). Sci. Total Environ. 2023, 903, 166611. [Google Scholar] [CrossRef]
  31. Babalola, T.O. Adopting Importance-Performance Analysis (IPA) Model to Assess Land Governance in the Peri-Urban Areas of Ibadan, Nigeria. Land Use Policy 2023, 133, 106850. [Google Scholar] [CrossRef]
  32. Midilli Sarı, R.; Bekar, İ. Evaluation on Spatial Quality in Retail Stores through Importance-Performance Analysis (IPA). ICONARP Int. J. Archit. Plan. 2023, 11, 941–959. [Google Scholar] [CrossRef]
  33. Jin, C. Combining Thermodynamics with Architectural Design Concepts: Thermal Comfort and Sustainability of Railway Passenger Stations. Int. J. Heat Technol. 2023, 41, 1374–1382. [Google Scholar] [CrossRef]
  34. Mu, E.; Pereyra-Rojas, M. Practical Decision Making, 1st ed.; Springer International Publishing: Cham, Switzerland, 2017; Volume 1, ISBN 978-3-319-33860-6. [Google Scholar]
  35. Wolniak, R. The Use of QFD Method Advantages and Limitation. Prod. Eng. Arch. 2018, 18, 14–17. [Google Scholar] [CrossRef]
  36. Li, J.; Kim, K. Kano-QFD-Based Analysis of the Influence of User Experience on the Design of Handicraft Intangible Cultural Heritage Apps. Herit. Sci. 2023, 11, 59. [Google Scholar] [CrossRef] [PubMed]
  37. Marmol, C.; Martin-Marscal, A.; Picardo, A.; Peralta, E. Social life cycle assessment for industrial product development: A comprehensive review and analysis. Heliyon 2023, 9, e22861. [Google Scholar] [CrossRef] [PubMed]
  38. Doostdar, M.; Brock, J.; Ceraso, A.; Rapallo, A.M.; Kuchta, K. Comparative Life Cycle Assessment of Different Recycled Concrete Aggregates. Detritus 2023, 25, 65–70. [Google Scholar] [CrossRef]
  39. Wilson, A.R.; Vasile, M.; Maddock, C.; Baker, K. Implementing life cycle sustainability assessment for improved space mission design. Integr. Environ. Assess. Manag. 2023, 19, 1002–1022. [Google Scholar] [CrossRef]
  40. Martelli, S.; Mocera, F.; Soma, A. Carbon Footprint of an Orchard Tractor through a Life-Cycle Assessment Approach. Agriculture 2023, 13, 1210. [Google Scholar] [CrossRef]
  41. Zuliani, F.; Manzardo, A.; Marson, A.; Fedele, A. A life cycle assessment approach for nitrogen footpring quantification: The reactive nitrogen indicator. Sci. Total Environ. 2023, 882, 163579. [Google Scholar] [CrossRef]
  42. Graham, J.R.; Harvey, C.R.; Rajgopal, S. The Economic Implications of Corporate Financial Reporting. J. Account. Econ. 2005, 40, 3–73. [Google Scholar] [CrossRef]
  43. Boudreau, J.; Ehrlich, J.; Sanders, S.; Winn, A. Social Choice Violations in Rank Sum Scoring: A Formalization of Conditions and Corrective Probability Computations. Math. Soc. Sci. 2014, 71, 20–29. [Google Scholar] [CrossRef]
  44. Raugei, M.; Winfield, P. Prospective LCA of the Production and EoL Recycling of a Novel Type of Li-Ion Battery for Electric Vehicles. J. Clean. Prod. 2019, 213, 926–932. [Google Scholar] [CrossRef]
  45. Kim, B.-Y.; Oh, H. An Extended Application of Importance-Performance Analysis. J. Hosp. Leis. Mark. 2001, 9, 107–125. [Google Scholar] [CrossRef]
  46. Abalo, J.; Varela, J.; Manzano, V. Importance Values for Importance–Performance Analysis: A Formula for Spreading out Values Derived from Preference Rankings. J. Bus. Res. 2007, 60, 115–121. [Google Scholar] [CrossRef]
  47. Arena, N.; Sinclair, P.; Lee, J.; Clift, R. Life Cycle Engineering of Production, Use and Recovery of Self-Chilling Beverage Cans. J. Clean. Prod. 2017, 142, 1562–1570. [Google Scholar] [CrossRef]
  48. Witte, A.; Garg, N. Quantifying the Global Warming Potential of Low Carbon Concrete Mixes: Comparison of Existing Life Cycle Analysis Tools. Case Stud. Constr. Mater. 2024, 20, e02832. [Google Scholar] [CrossRef]
  49. Ledakowicz, S.; Ziemińska-Stolarska, A. The Role of Life Cycle Assessment in the Implementation of 1 Circular Economy in Sustainable Future. Chem. Process Eng. New Front. 2023, 44, 37. [Google Scholar] [CrossRef]
  50. Ibrahim, R.A.; Inan, H.; Fahim, I.S. A Comparative Cradle-to-Gate Life Cycle Assessment of Three Cotton Stalk Waste Sustainable Applications. Sci. Rep. 2023, 13, 20781. [Google Scholar] [CrossRef] [PubMed]
  51. Pacana, A.; Siwiec, D. Universal Model to Support the Quality Improvement of Industrial Products. Materials 2021, 14, 7872. [Google Scholar] [CrossRef]
  52. Keucken, A.; Heinicke, G.; Persson, K.; Köhler, S. Combined Coagulation and Ultrafiltration Process to Counteract Increasing NOM in Brown Surface Water. Water 2017, 9, 697. [Google Scholar] [CrossRef]
  53. Morgan, D.R.; Styles, D.; Thomas Lane, E. Packaging Choice and Coordinated Distribution Logistics to Reduce the Environmental Footprint of Small-Scale Beer Value Chains. J. Environ. Manag. 2022, 307, 114591. [Google Scholar] [CrossRef] [PubMed]
  54. Kulsoom, M.; Anita; Yadav, A.K.; Kumar, M.; Raw, K.P.; Chhavi, A.; Mishra, S.; Kumar, N. Fluoride Removal from Drinking Water Using Chemically Modified Biosorbent Prepared from Citrus Limetta: Chemical Characterization and Process Optimization. Water Air Soil Pollut. 2023, 234, 660. [Google Scholar] [CrossRef]
  55. Gilli, M.; Marin, G.; Mazzanti, M.; Nicolli, F. Sustainable Development and Industrial Development: Manufacturing Environmental Performance, Technology and Consumption/Production Perspectives. J. Environ. Econ. Policy 2017, 6, 183–203. [Google Scholar] [CrossRef]
  56. Bhasker, D. Sustainable Development: Role of Industrial Water Management. In National Research Council (US) Chemical Sciences Roundtable; Norling, P., Wood-Black, F., Masciangioli, T., Eds.; National Academies Press: Washington, DC, USA, 2004; Volume 9. [Google Scholar]
  57. Mazzucco, G.; Canepa, M.; Perini, K. Application of Social-Life Cycle Assessment in Urban Settings: Social Impact Assessment of Green Roofs. Buldings 2023, 13, 1659. [Google Scholar] [CrossRef]
  58. Tran, D.B.; Tran, V.; Pham, X.A.; Nguyen, V. A General Framework for Sustainability Assessment of Buildings: A Life-Cycle Thinking Approach. Sustainability 2023, 15, 10770. [Google Scholar] [CrossRef]
  59. Barbhuiya, S.; Das, B.B. Life Cycle Assessment of construction materials: Methodologies, applications and future directions for sustainable decision-making. Case Stud. Constr. Mater. 2023, 19, e02326. [Google Scholar] [CrossRef]
  60. Proske, M.; Finkbeiner, M. Obsolescence in LCA–Methodological Challenges and Solution Approaches. Int. J. Life Cycle Assess. 2020, 25, 495–507. [Google Scholar] [CrossRef]
Figure 1. Scheme of the procedure for aggregating indicators of quality level and environmental impact in the product life cycle. Own study based on [28].
Processes 12 00811 g001
Figure 2. Modified IPA model for simultaneous qualitative and environmental analysis. Own study based on [46].
Processes 12 00811 g002
Figure 3. Simplified presentation of the elements of a self-cooling can with their main materials and self-cooling element. Own study based on [47].
Processes 12 00811 g003
Figure 4. Technological process of self-cooling beverage cans. Own study based on [51].
Processes 12 00811 g004
Figure 5. Carbon footprint in the life cycle of a self-cooling beverage can for the following variants: (a) first (real), (b) second, (c) third, (d) fourth. Own study.
Processes 12 00811 g005aProcesses 12 00811 g005b
Figure 6. Direction of quality and environmental improvement of self-cooling beverage cans based on modified IPA model.
Processes 12 00811 g006
Table 1. Five-point grading scale adapted to formalized scoring (PS) [25].
Number of PointsRatingState
5 pointshighestvery beneficial
4 pointshighbeneficial
3 pointsmeanindirect
2 pointslowunfavourable
1 pointslowestvery unfavourable
Table 2. Customer ratings on the importance and quality of the main criteria of a self-cooling beverage can.
CriterionCriterion WeightsParameter
Variant 1Variant 2Variant 3Variant 4
Height (mm)3120 14090100
Outer diameter (mm)370 705040
Base diameter (mm)250 604040
Volume (mL)4550 710428553
Opening method4Lid with keyPress-on lidLid with keyPress-on lid
Can material5AluminiumAluminiumAluminiumAluminium
Self-cooling system5YesYesYesYes
CriterionCriterion weightsParameter quality assessment
Variant 1Variant 2Variant 3Variant 4
Height (mm)34425
Outer diameter (mm)34435
Base diameter (mm)24522
Volume (mL)43243
Opening method42525
Can material55555
Self-cooling system55555
Table 3. Selected direct loads in the life cycle of a self-cooling beverage can.
Input DataEnvironmental Burdens of Carbon Footprint
Variant 1Variant 2Variant 3Variant 4Average Value
ValueChange (%)ValueChange (%)ValueChange (%)ValueChange (%)
Carbon dioxide (kg)0.055−1.80.07126.80.043−23.20.055−1.80.056
Tin-plated steel (kg)0.029−1.70.03725.40.023−22.00.029−1.70.0295
Aluminium (kg)0.039−1.30.05026.60.030−24.10.039−1.30.0395
Activated carbon (kg)0.110−2.00.14226.50.086−23.40.111−1.10.11225
Virgin aluminium (kg)0.010−2.40.01326.80.008−22.00.010−2.40.01025
Recycled aluminium (kg)0.0102.60.01223.10.007−28.20.0102.60.00975
Virgin steel (kg)0.018−1.40.02326.00.014−23.30.018−1.40.01825
Recycled steel (tin-plated) (kg)0.0120.00.01525.00.009−25.00.0120.00.012
Energy for CO2 conversion (MJ)0.061−2.40.07926.40.048−23.20.062−0.80.0625
Energy for AC compression in HEU (MJ)0.086−2.30.11227.30.067−23.90.087−1.10.088
AC regeneration energy (MJ)83.200−1.8107.40426.764.745−23.683.654−1.384.75075
Transport (40 km return) (kgCO2eq)1.54 × 10−80.01.54 × 10−80.01.54 × 10−80.01.54 × 10−80.01.54 × 10−8
Table 4. Recovery processes of selected materials of a self-cooling beverage can and its design alternatives.
Process DescriptionVariant 1Variant 2Variant 3Variant 4Average
ValueChange %ValueChange %ValueChange %ValueChange %
Pre-use fraction of virgin aluminium (kg)0.520−1.840.67126.660.405−23.550.523−1.270.53
Pre-use fraction of recycled aluminium (kg)0.480−1.890.62026.720.374−23.560.483−1.280.49
Pre-use fraction of recycled steel (kg)0.400−1.780.51626.700.311−23.630.402−1.290.41
Pre-use fraction of virgin steel (kg)0.600−1.840.77526.790.467−23.600.603−1.350.61
Fraction of recovered aluminium recycled (kg)0.300−1.800.38726.680.233−23.730.302−1.150.31
Fraction of recovered aluminium reused (kg)0.800−1.841.03326.750.623−23.560.804−1.350.82
Table 5. Carbon footprint for the life cycle of a self-cooling beverage can and its variants of production solutions.
DescriptionCarbon Footprint (kgCO2e)
Variant 1Variant 2Variant 3Variant 4Average
ValueChange %ValueChange %ValueChange %ValueChange %
Recycled Steel (kg)−0.0020.000−0.0020.000−0.001−50.000−0.00350.000−0.002
Recycled Aluminium (kg)−0.04−32.773−0.08237.815−0.048−19.328−0.06814.286−0.060
Virgin Aluminium (kg)0.056−31.0770.11339.0770.069−15.0770.0877.0770.081
Virgin Steel (kg)0.0179.6770.02135.4840.013−16.1290.011−29.0320.016
Energy for AC pressurizing in HEU (MJ)0.0120.0000.01525.0000.009−25.0000.0120.0000.012
Energy for CO2 processing (MJ)0.008−5.8820.01129.4120.007−17.6470.008−5.8820.009
Energy for AC regeneration (MJ)11.380−1.83114.69126.7318.856−23.60411.442−1.29611.592
Transport (Return journey to Store, 40 km) (tkm)95.8120.00095.8120.00095.8120.00095.8120.00095.812
Pre-use fraction of virgin aluminium (kg)4.513−1.8385.82326.6563.515−23.5454.539−1.2724.598
Pre-use fraction of virgin steel (kg)0.558−1.8900.72126.7690.435−23.5160.561−1.3630.569
Pre-use fraction of recycled steel (kg)−0.064−353.465−0.082−424.7520.3111131.683−0.064−353.4650.025
Fraction of recovered aluminium recycled (kg)−2.05425.646−2.65062.1040.233−114.253−2.06826.503−1.635
Pre-use fraction of recycled aluminium (kg)−3.28725.626−4.24662.2780.374−114.294−3.30726.390−2.617
Fraction of recovered aluminium reused (kg)−5.47825.678−7.07462.2940.623−114.293−5.50626.321−4.359
Disclaimer/Publisher’s Note: The statements, opinions and data contained in all publications are solely those of the individual author(s) and contributor(s) and not of MDPI and/or the editor(s). MDPI and/or the editor(s) disclaim responsibility for any injury to people or property resulting from any ideas, methods, instructions or products referred to in the content.

