Abstract
In order to explore the wind load characteristics acting on solar photovoltaic panels under extreme severe weather conditions, based on the Shear Stress Transport (SST) κ-ω turbulence model, numerical calculations of three-dimensional incompressible viscous steady flow were performed for four installation angles and two extreme wind directions of the solar photovoltaic panels. The wind load characteristics on both sides of the photovoltaic panels were obtained, and the vortex structure characteristics were analyzed using the Q criterion. The results indicate that, under different installation angles, the windward side pressure of the solar photovoltaic panel is generally higher than the leeward side. The leeward side is prone to forming larger vortices, increasing the fatigue and damage risk of the material, which significantly impacts the solar photovoltaic panel. As the installation angle increases, the windward side pressure of the solar photovoltaic panel also gradually increases. Therefore, optimal installation methods include installing the panel facing the wind at angles of 30° and 45°, or installing it facing away from the wind at a 60° angle, to minimize the impact of wind load on the solar photovoltaic panel.
1. Introduction
Nowadays, solar energy has garnered increasing attention as an important resource, and solar converters have been widely used in various fields. Solar converters encompass devices such as solar arrays, floating solar panels, and solar collectors, with their structural parameters and environmental factors having a significant impact on their performance. These factors encompass spatial position, geometric structure, dust, temperature, and wind force. Among these devices are solar PV panels, which are a key constituent of solar energy converters; the steadiness of their supporting frameworks exerts a critical impact on the efficacy and reliability of solar energy conversion systems. However, in actual environments, solar photovoltaic panels face challenges from extremely high wind speeds under harsh weather conditions. Additionally, there are significant differences in wind loads on solar photovoltaic panels at different installation angles. Therefore, selecting the appropriate installation angle is crucial for optimizing the installation of solar photovoltaic panels. In response to these issues, numerous academicians have carried out a series of researches in this domain.
In theoretical research, Andreas Schellenberg et al. [1] have elucidated the structural analysis and application of wind loads on solar array systems, while V. Etyemezian et al. [2] have provided a preliminary interpretation of the influence of average airflow on solar facilities in practical-scale solar facilities. As for the study of wind loads on solar collectors, methods such as wind tunnel experiments, field measurements, and numerical simulations have been employed. In order to eliminate differences in factors such as model scale and inconsistent flow conditions in wind tunnel test results, Aly Mousaad Aly [3] investigated geometric scales and incoming turbulent characteristics as potential sources of high uncertainty to achieve accurate estimation of wind loads. Shu-Tsung Hsu et al. [4] have developed an analytical model for testing the method of mean equivalent wind load (MEWL). Hatem Alrawashdeh et al. [5] have outlined a set of experimental standards for evaluating the impact of geometric scales on the wind-induced pressure on rooftop solar panels under simulated atmospheric boundary layer conditions. Additionally, Aly Mousaad Aly et al. [6] have obtained the design wind loads for solar panels using Computational Fluid Dynamics (CFD) methods and Machine Learning (ML) techniques. Furthermore, Matthew T.L. Browne et al. [7] have proposed a concise method for determining the design wind loads for ground-mounted solar arrays, including static and dynamic wind load coefficients compatible with Minimum Design Loads and Associated Criteria for Buildings and Other Structures (ASCE 7), and based on a series of wind tunnel experiments conducted by Rowan Williams Davies & Irwin Incorporated (RWDI) using a rigid pressure model. Moreover, Jingxue Wang et al. [8] have discussed the average flow field and unsteady flow field around solar panel arrays to explain the corresponding wind pressure distribution.
In practical operations, researchers change factors such as wind direction, structural parameters, and environmental conditions, and combine various methods to study and evaluate the impact of wind loads on solar collectors. For example, Bo Gong et al. [9] conducted on-site measurements of the boundary layer wind characteristics and wind loads of arched trough solar collectors, and presented partial results of full-scale on-site measurements of wind loads and wind pressures on solar collectors. Jinxin Cao et al. [10] assessed the wind loads on flat roof solar panels through wind tunnel experiments, and concluded that increasing the installation angle and array spacing would increase the negative module force. B. Tansel et al. [11] studied the energy yield and wind load on solar panels on top and side slopes, providing detailed numerical estimates. Chowdhury Mohammad Jubayer et al. [12] performed numerical simulations of the wind effects on ground-mounted photovoltaic systems and found that 180° is a critical wind direction for maximum uplift force, while 45° and 135° are critical wind directions for overturning moment. Sarah E. Stenabaugh et al. [13] investigated the influence of geometric structures on the wind loads experienced by photovoltaic panel arrays. Ayodeji Abiola-Ogedengbe et al. [14] conducted experimental studies in a wind tunnel on the upper and lower surface pressure fields of a photovoltaic (PV) module composed of 24 individual PV panels for four different wind directions. The results indicated that the pressure distribution on the module surface is symmetric about its plane in the headwind directions (0° and 180°) and asymmetric in other wind directions. Moreover, the pressure magnitude on the module surface increases with the increase in the module installation angle. Chowdhury Mohammad Jubayer et al. [15] used the unsteady Reynolds-averaged Navier–Stokes (RANS) method to study the aerodynamic loads on and the surrounding airflow field over a ground-mounted solar photovoltaic (PV) panel array. Amir Naeiji et al. [16] studied the wind loads on residential-scale rooftop photovoltaic panels and identified the panel installation angle as the most crucial parameter for generating peak pressure coefficients. Ahmad Vasel [17] analyzed on-site data from Hadleigh Solar Farm in the UK to investigate the influence of wind direction on the overall performance of large-scale PV power plants.
Giovanni Paolo Reina et al. [18] used computational fluid dynamics to evaluate the average wind loads on ground-mounted solar photovoltaic panel arrays. Jingxue Wang et al. [19] studied the flow characteristics of solar arrays installed on flat-roofed buildings under two inclined wind directions (45° and 135°) using large eddy simulation (LES). Andrea Mignone et al. [20] conducted numerical simulations to investigate the wind load effects on floating solar panels. Onur Yemenici et al. [21] studied the wind effects on solar panels at different installation angles (25° and 45°) and wind directions (0° to 180° with 30° intervals) using experimental and numerical simulation methods. Their results showed significant influences of both factors on the flow structure, with larger installation angles leading to stronger vortex shedding fluctuations and higher frequency velocity region detachment. Seok Min Choi et al. [22] examined the impact of wind loads on floating photovoltaic systems by measuring the local pressure distribution on solar panel arrays through experiments. H.Y. Peng et al. [23] conducted a systematic study on the wind load characteristics of solar panels on square roofs of high-rise buildings under different panel lengths, installation angles, panel positions, panel spacing, and parapet heights using a wind tunnel test system. S.F. Dai et al. [24] systematically investigated wind load effects on solar panels on the roofs of high-rise buildings considering panel positions, installation angles (15°, 30°, and 45°), and building heights (24, 48, 72, and 96 m). Abdul Khaliq Khan et al. [25] used numerical evaluation methods to study the influence of wind loads on solar panel brackets. Jingbo Sun et al. [26] established different scenarios by varying wind speed, photovoltaic panel array arrangement (i.e., row–column spacing), and key structural parameters (i.e., panel tilt angle) to investigate the impact of wind loads on photovoltaic panels. They concluded that, as the ambient wind speed increases, the tilt angle should be reduced to improve power efficiency and avoid potential damage to the panels. H.Y. Peng et al. [27] investigated the effects of building height (24, 48, 72, and 96 m) and panel tilt angle on the wind load of pointed roof solar panel arrays through wind tunnel experiments. The study provided design wind load recommendations for solar panel arrays installed on roofs at different heights. Hatem Alrawashdeh et al. [28] studied the surface wind loads on a roof solar panel array composed of eight panels and evaluated the influence of geometric test ratios on experimental pressure coefficients. Md Shakil Ahmed et al. [29] investigated the performance impacts of wind conditions and other factors on solar photovoltaic systems and proposed improvement suggestions. Wenyong Ma et al. [30] examined the effects of installation angle and wind direction on the aerodynamic characteristics of single-axis solar tracker arrays. Supawit Homlakorn et al. [31] have developed novel Phase Change Material (PCM)-infused fin and mesh containers to reduce the thermal resistance of PCMs, thereby aiding in enhancing the cooling efficiency of photovoltaic (PV) systems. Karthikeyan Velmurugan et al. [32] have achieved non-contact surface inspection on PV modules and thermal changes integration with PCM matrices behind the PV modules. To adapt to tropical climate conditions, Poongavanam P. et al. [33] investigated various PCMs with melting points of 31 °C, 35 °C, 37 °C, and 42 °C, exploring their potential to enhance the power and efficiency of PV modules. Karthikeyan Velmurugan et al. [34] delved into the impact of phase change materials (PCMs) as cooling mediums on controlling temperature rise during the operation of PV modules. Velmurugan K et al. [35] extensively discussed the thermal properties of PCMs, identifying melting point (Tmelt) and thermal conductivity (KPCM) as crucial factors in lowering the temperature of PV modules.
Researchers have carried out in-depth studies on the wind effects of solar photovoltaic panels at different installation angles and wind directions using various methods and approaches. They evaluated the impact of wind loads on solar collectors through wind tunnel experiments, on-site measurements, and numerical simulations, and investigated the design wind loads of solar photovoltaic panels. Moreover, they took into account factors such as geometric scale and flow characteristics when assessing the influence of wind loads. These studies provide important references for the safe design and application of solar photovoltaic panels. However, existing research has mainly focused on photovoltaic panels in general environmental conditions. In extreme severe weather conditions, such as typhoons with extremely high wind speeds, photovoltaic panels will be subjected to extreme wind load effects. When the wind speed and direction change, the front and back surfaces of the photovoltaic panels will experience different wind loads. Currently, the wind load characteristics of solar photovoltaic panels under extreme weather conditions have not been systematically uncovered. Therefore, this study endeavors to comprehensively understand the wind load characteristics of solar photovoltaic panels in extreme weather conditions. Through this research, valuable insights can be provided for the installation design and application of solar photovoltaic panels.
2. Calculation Model and Methods
2.1. Physical Model
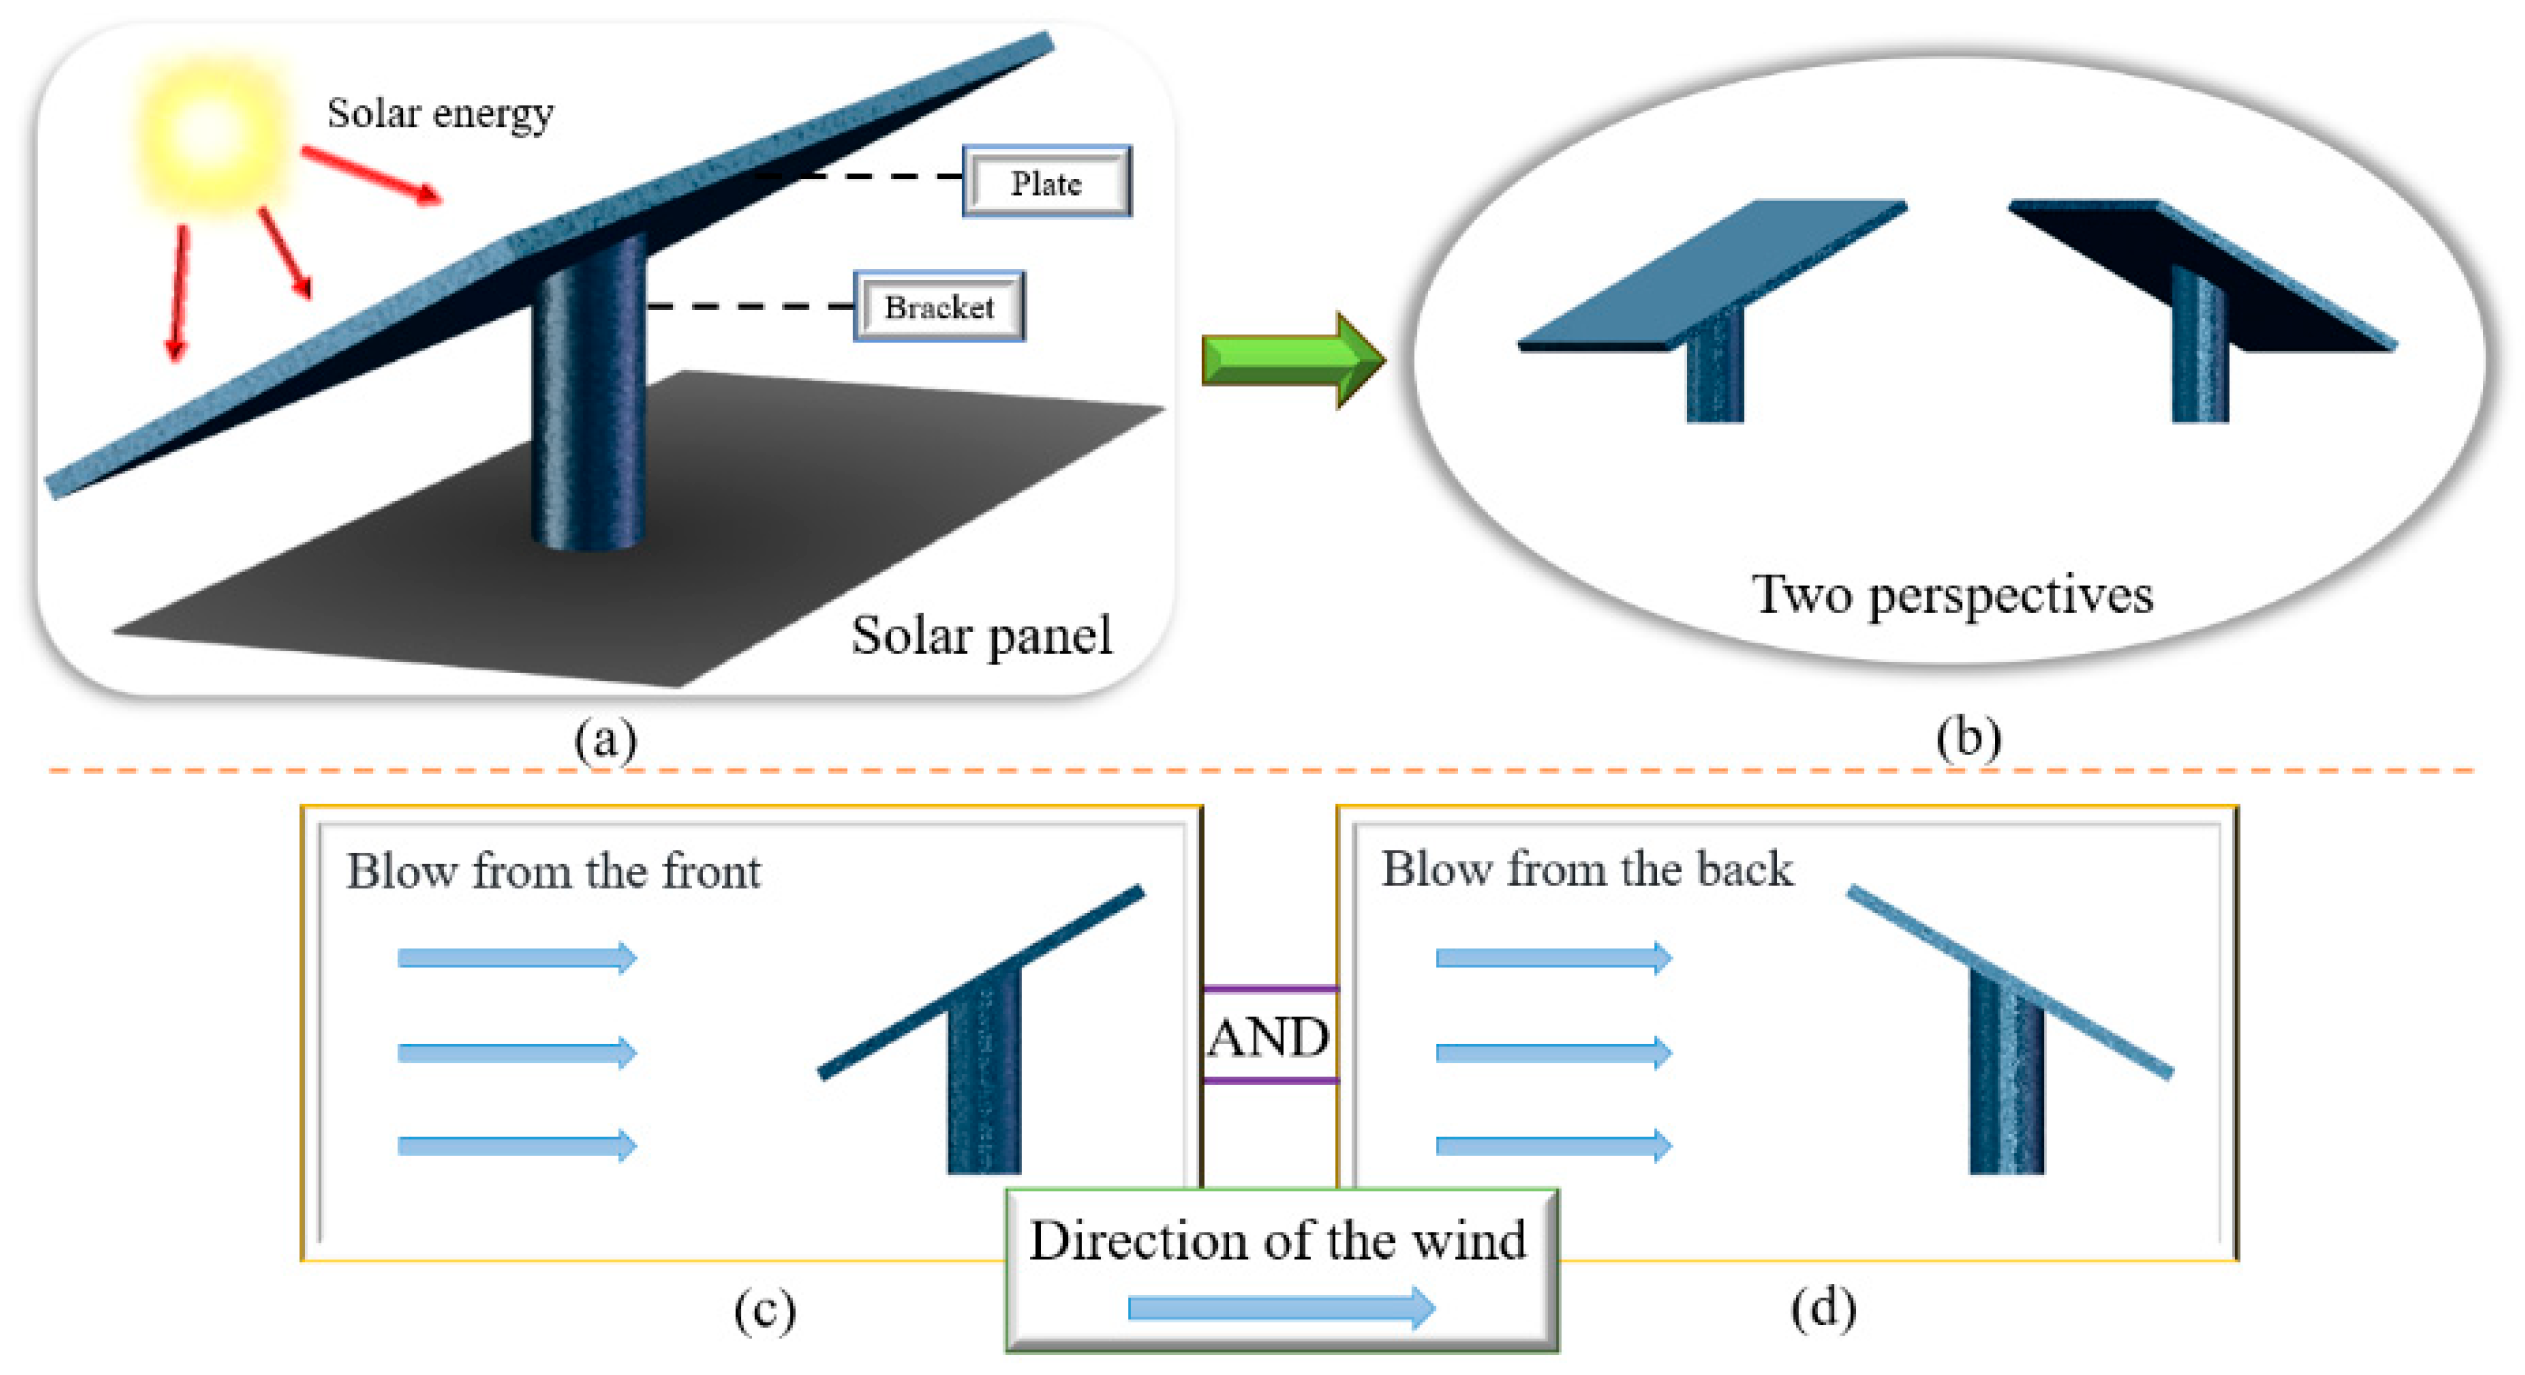
Figure 1a depicts the working principle of a solar photovoltaic panel. Figure 1b presents two perspectives of the solar panel, while Figure 1c,d depict the wind loads on the front and back surfaces of the solar panel, respectively. To simplify the analysis, the mounting bracket of the solar photovoltaic panel is regarded as a cylinder. In Figure 1, the installation angle of the photovoltaic panel is set at 30°, with the side in contact with the bracket considered as the back surface and the opposite side as the front surface.
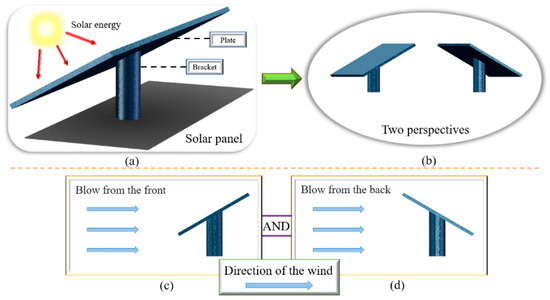
Figure 1.
Illustration of the working principle of solar photovoltaic panels and research methods. (a) Operating Principle; (b) Two Perspectives (c) Front Against the Wind; (d) Back Against the Wind.
2.2. Computational Domain Grid
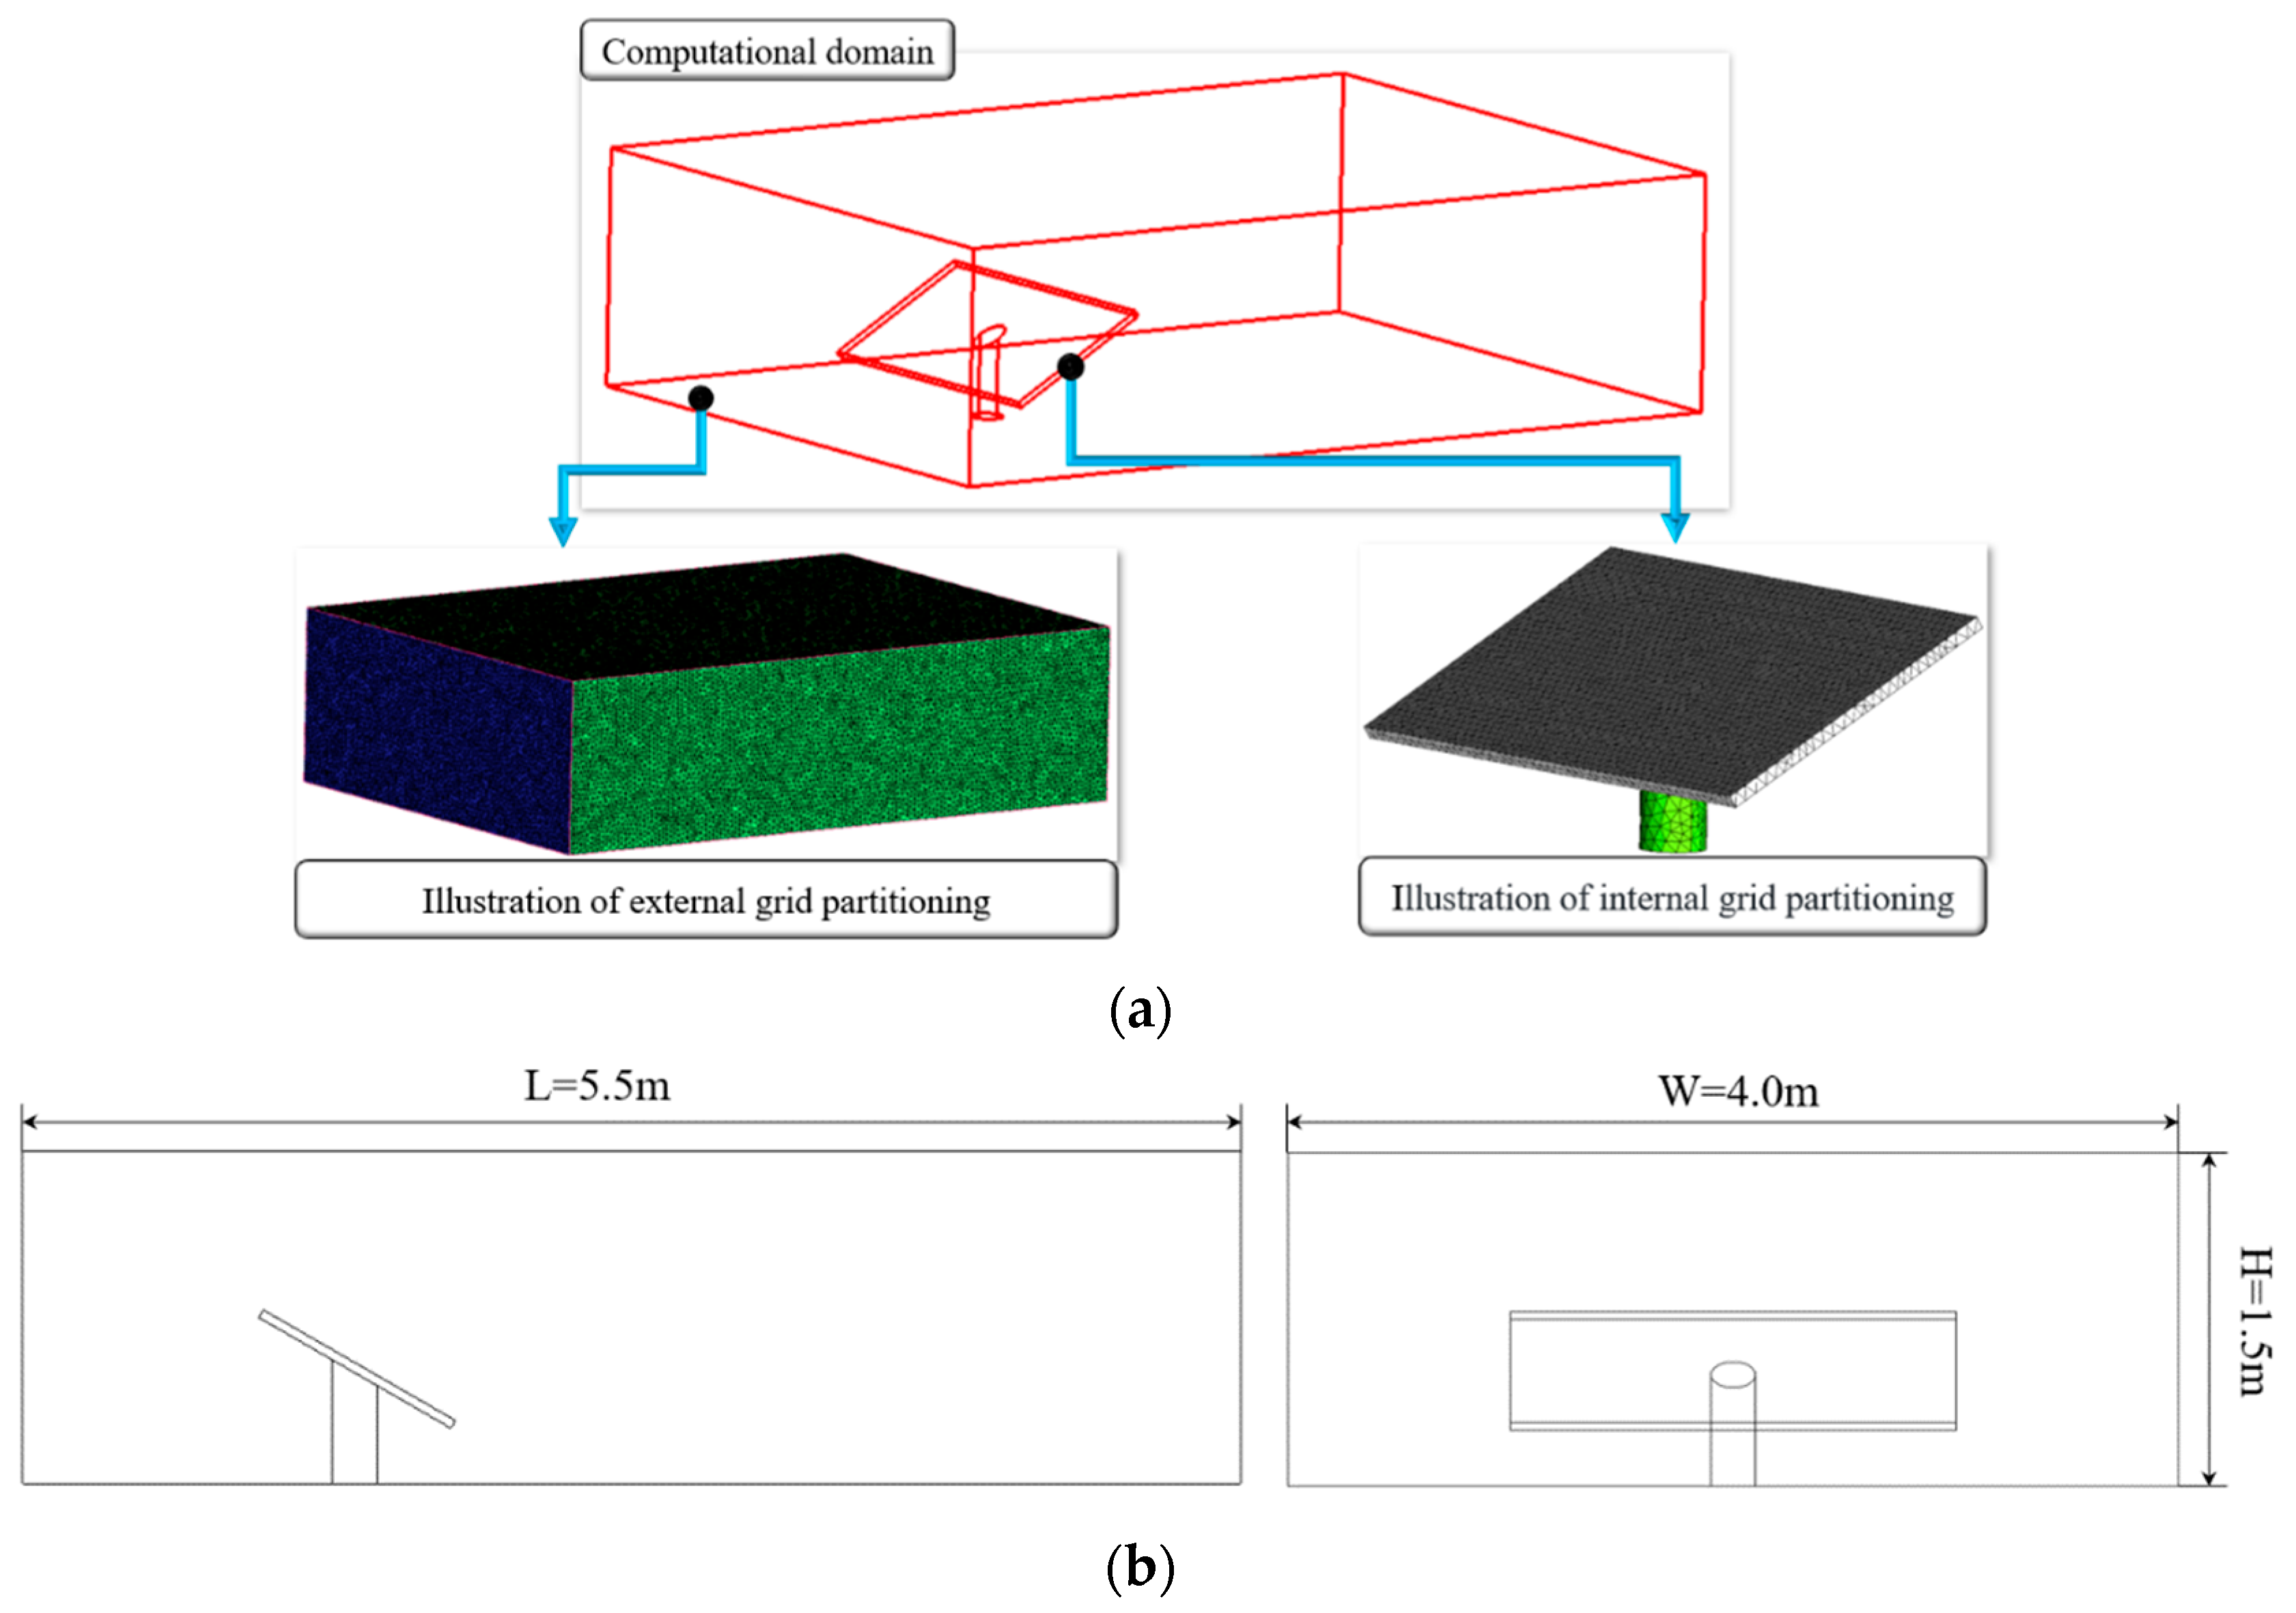
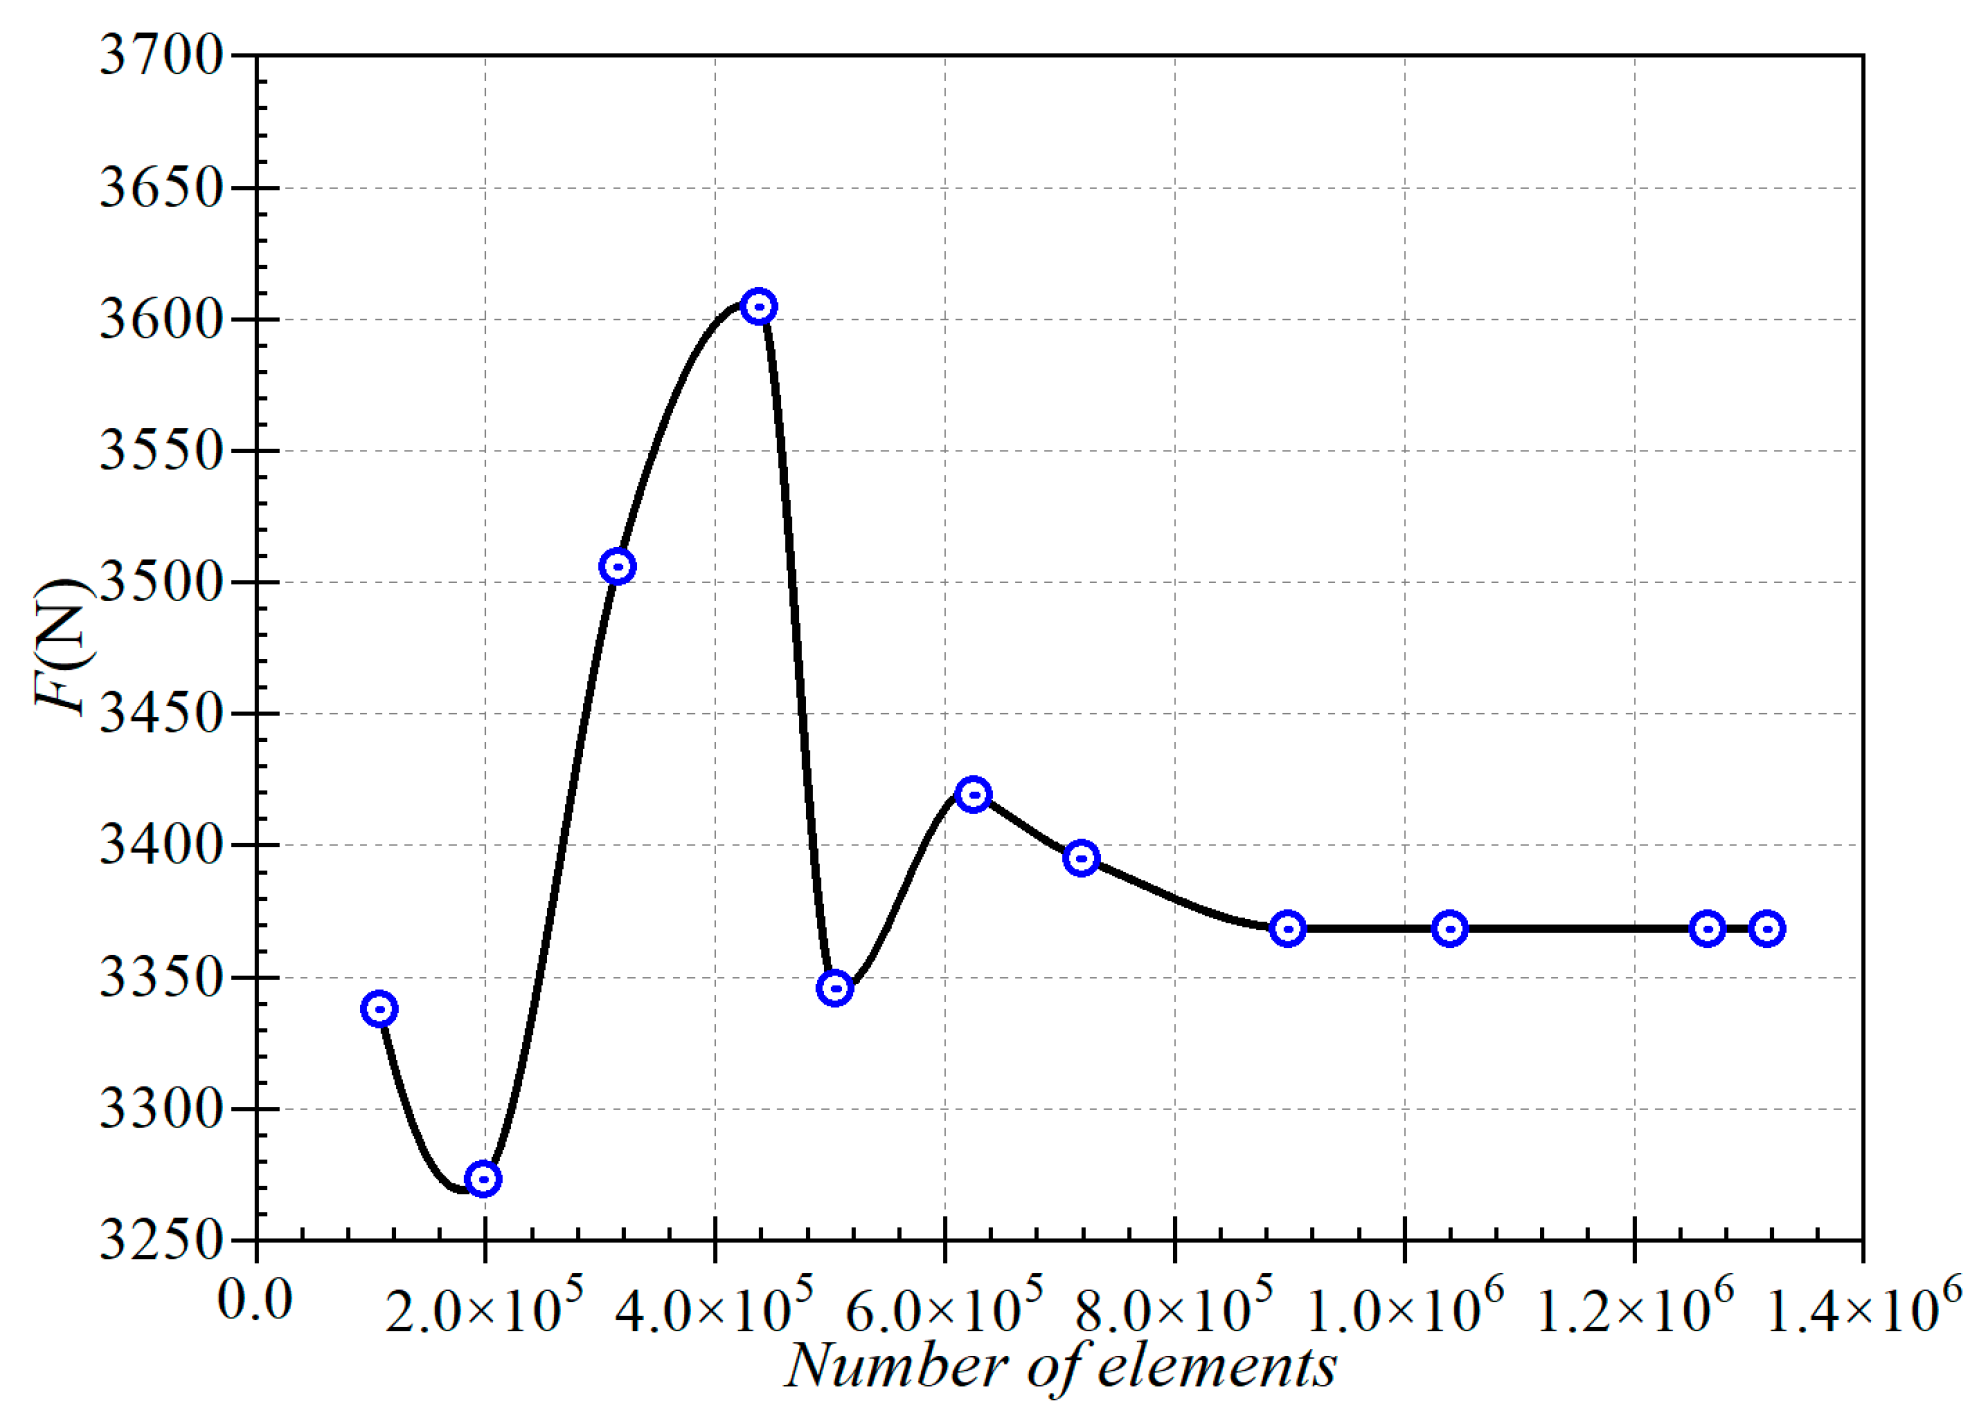
The computational domain and grid division of the solar photovoltaic panel are depicted in Figure 2. Figure 2a illustrates the grid division of the computational domain, while Figure 2b provides dimensions for the computational domain, which is 5.5 m long, 4.0 m wide, and 1.5 m high. To conduct numerical calculations, an unstructured grid was used to partition the computational domain. Figure 3 illustrates the influence of the number of grids on the force acting on the photovoltaic panel. As depicted in Figure 3, when the number of grids exceeds 900,000, the forces acting on the photovoltaic panel stabilize and no longer exhibit significant changes. Consequently, the computational model employed in this study will utilize a grid count exceeding 900,000.

Figure 2.
Illustration of the computational domain and grid division. (a) Calculation model; (b) Computational domain.
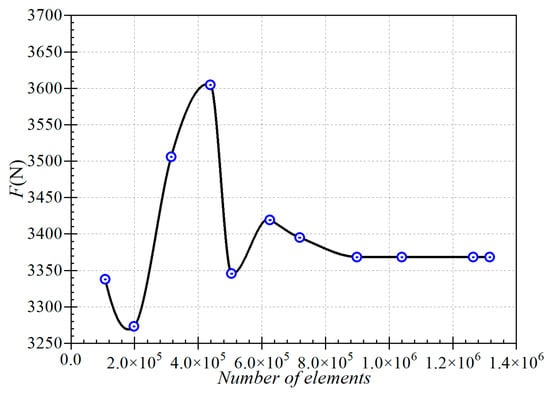
Figure 3.
Grid independence test.
2.3. Control Equations
The article employs the Reynolds-averaged Navier–Stokes [36] equations for research, with the mathematical expression of the equation as follows:
In this paper, the SST κ-ω turbulence model [36] is applied for analysis and solution, as follows:
where ρ is density, ui is the velocity component, p is pressure, τij is the stress tensor, Fi is the volume force, k and ω represent turbulent kinetic energy and turbulence dissipation rate, Gk and Gω are generation terms, Yk and Yω are turbulence dissipation terms, Dω represents the dissipation term, Sk and Sω are source terms, and μ is the turbulent viscosity, which is calculated as follows:
where Cμ is a constant.
2.4. Boundary Conditions
In this paper, the Fluent 19.0 is utilized for the calculation of external flows around solar photovoltaic panels.
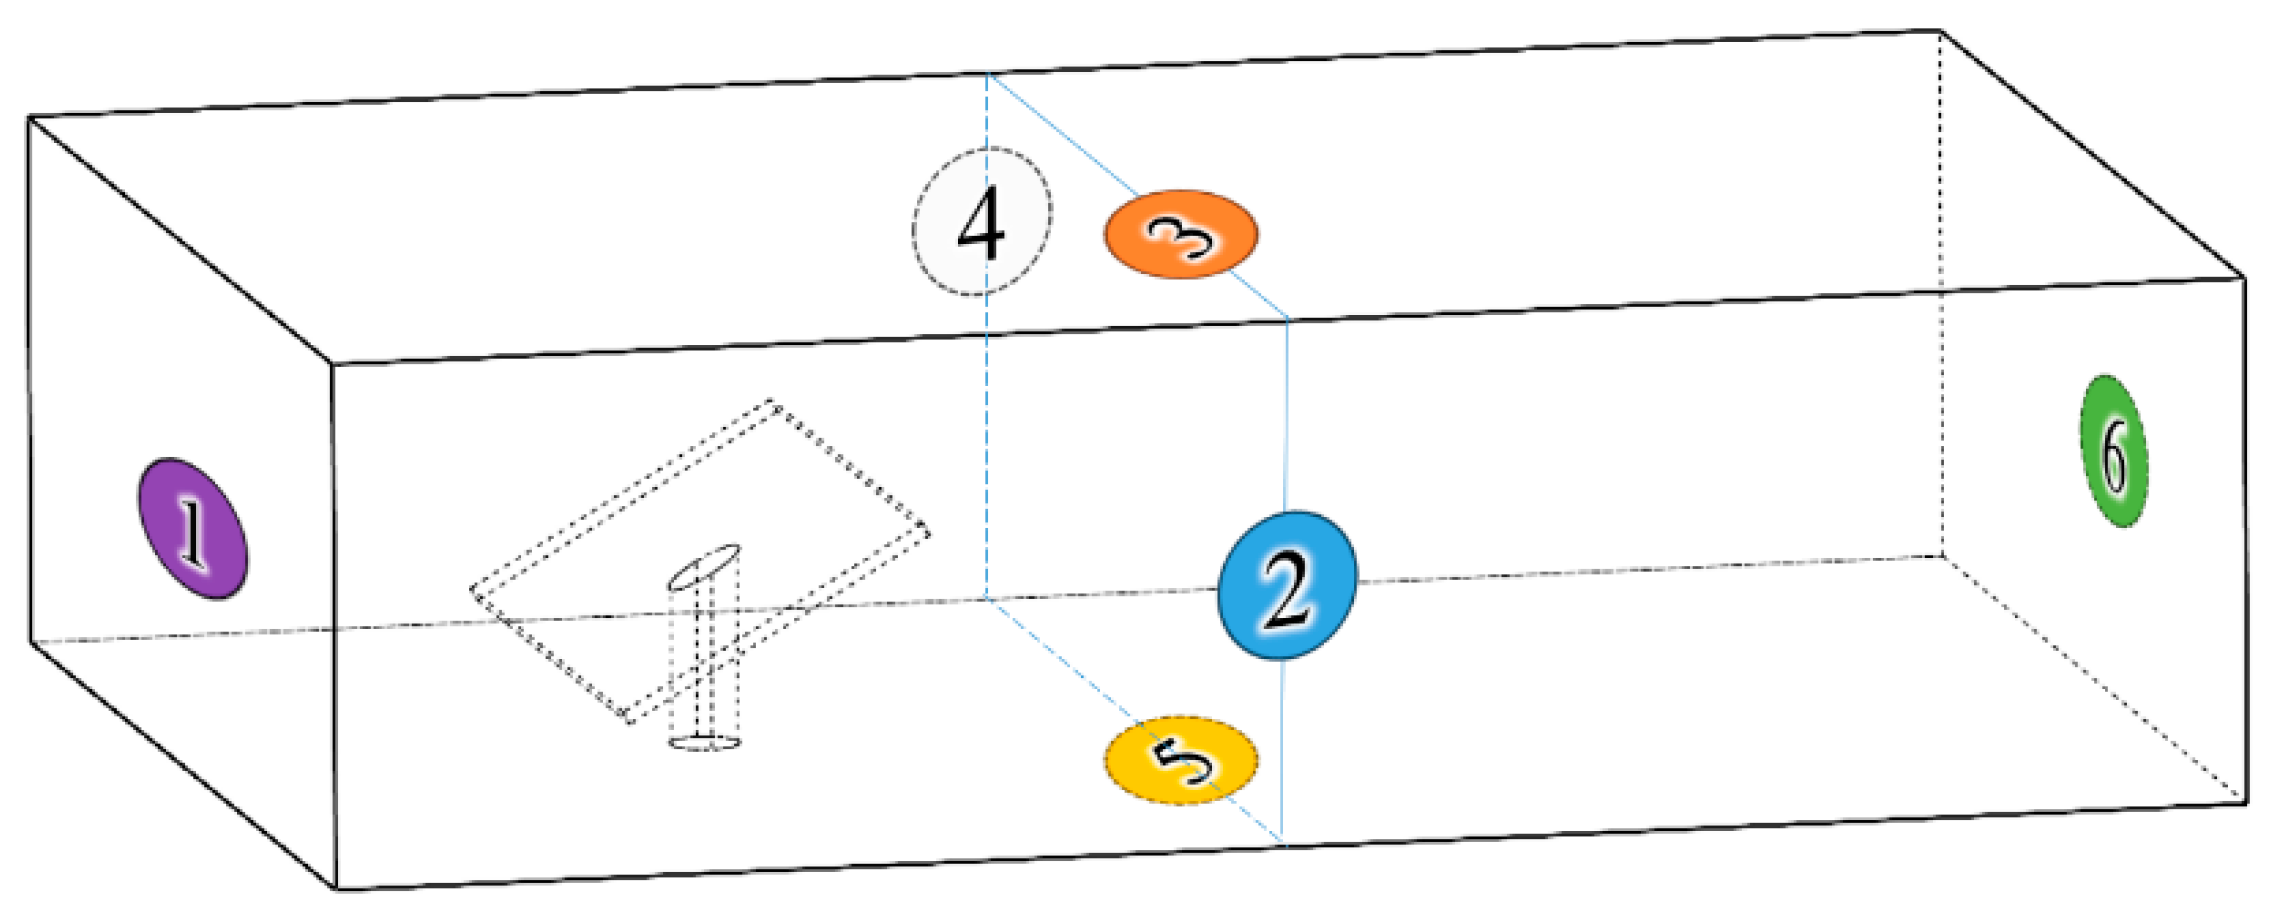
In extreme typhoon weather conditions, wind speeds can sometimes reach 50 m/s [37]. In Figure 4, the surfaces of the computational domain model are labeled. Among them, Surface 1 is designated as the inlet for airflow, configured as a velocity inlet with a wind speed of 50 m/s. Surfaces 2, 3, and 4 are designated as pressure outlets, with the surface pressure set to the standard atmospheric pressure of 1 atmosphere, equivalent to 101.325 kPa. Surface 5 is characterized as a wall surface, while Surface 6 serves as an outlet boundary.

Figure 4.
Observation surface of the computational domain model.
2.5. Computational Scheme
As depicted in Figure 5, the centerline length of the bracket is held constant at 500 mm, with a bottom diameter of 200 mm.
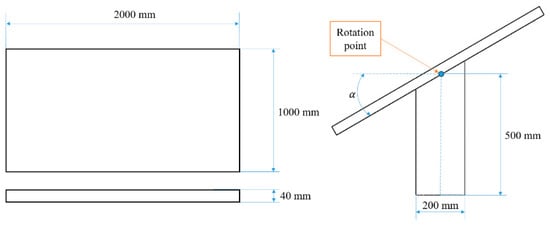
Figure 5.
Structural parameters diagram of solar absorption device.
In this study, eight computational schemes were devised, encompassing four installation angles (α) and two extreme wind directions (wind speed of 50 m/s). The specifics are outlined in Table 1.

Table 1.
Configuration of computational schemes.
The computational domain models for each computational scheme were discretized into grids. The grid counts for each model are presented in Table 2. The grid division for each computational scheme exceeds 900,000 to ensure that the grid quantity has no significant impact on the results.
Table 2.
Grid division of each model.
3. Results Analysis
3.1. Vortex Distribution
Figure 6a depicts a schematic diagram illustrating the positions of three observation planes. All three planes are perpendicular to the photovoltaic panel. Among them, Cross-Section 3 is located on the symmetry plane of the computational model, Section 1 passes through the side edge of the panel, and Cross-Section 2 is positioned between Cross-Sections 1 and 3. Figure 6b illustrates the establishment of the section coordinate axes, with the lower left corner of the computational domain as the origin, the bottom as the horizontal axis, and the left side as the vertical axis.
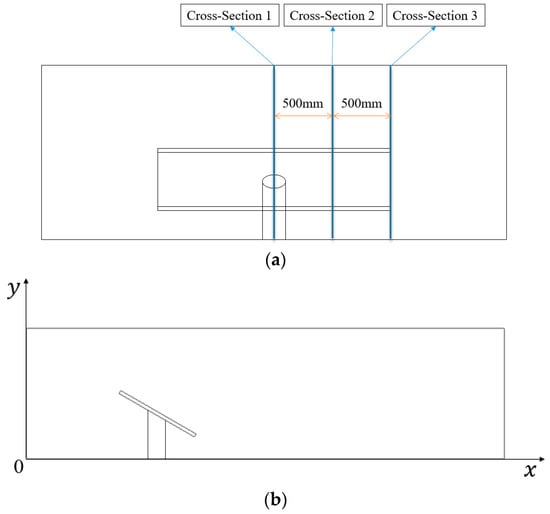
Figure 6.
Diagram of observation plane positions. (a) Observation plane; (b) Coordinate system.
Figure 7 displays pressure contour maps on various sections for each computational scheme. The streamlines depicted in the figure represent velocity streamlines.
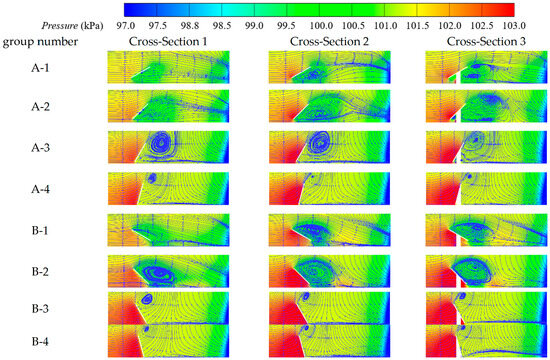
Figure 7.
Pressure contour map and velocity streamline at cross-sections.
In scheme A-1, no vortices were observed at Section 1; a vortex was observed at Section 2, with its center located approximately at coordinates (2, 0.41), affecting an area extending from the top to the bottom of the panel. At Section 3, two vortices were observed, with their centers located at (2.2, 0.38) and (2.3, 0.79), respectively. The influence areas of these two vortices extend from the top of the panel to the junction between the bracket and the panel. For this scheme, the pressure distribution on the solar panel exhibits a minimum value of 99.8007 kPa and a maximum value of 103.0034 kPa, with a ratio of approximately 1.032 between the two.
In scheme A-2, no vortices were observed at Section 1; a vortex was observed at Section 2, with its center located approximately at coordinates (2.3, 0.39), affecting an area extending from the top to the bottom of the panel. At Section 3, three vortices were observed, with their centers located roughly at coordinates (1.3, 0.21), (2.8, 0.12), and (3, 1.02), respectively. The leftmost vortex only affects the bottom of the panel to the junction between the panel and the bracket, while the other two vortices collectively affect the top of the panel to the junction between the panel and the bracket, with their vortex centers located further away from the panel. For this scheme, the pressure distribution on the solar panel exhibits a minimum value of 99.9870 kPa and a maximum value of 103.3878 kPa, with a ratio of approximately 1.034 between the two.
In scheme A-3, a vortex was observed at Section 1, with its center located approximately at coordinates (2.49, 0.91), exerting a significant influence on the part of the panel above the longitudinal coordinate of 0.5. At Section 2, a vortex was observed, with its center roughly at coordinates (2.4, 0.9), significantly affecting the part of the panel above the longitudinal coordinate of 0.45. The airflow at Section 3 was turbulent, with a prominent vortex center located around coordinates (2.3, 1.08), which had a significant impact on the range from the junction between the panel bracket and the panel to the top of the panel. For this scheme, the pressure distribution on the solar panel exhibits a minimum value of 100.9489 kPa and a maximum value of 103.7747 kPa, with a ratio of approximately 1.028 between the two.
In scheme A-4, it was observed that, at Sections 1, 2, and 3, each had only one vortex. The vortex centers were located approximately at coordinates (2.05, 1.22), (2.03, 1.29), and (2, 1.3), respectively. These vortex centers at these sections were relatively far from the panel, with only a slight impact on the solar panel at the edge of the vortices. For this scheme, the pressure distribution on the solar panel exhibits a minimum value of 101.0598 kPa and a maximum value of 104.0550 kPa, with a ratio of approximately 1.030 between the two.
In scheme B-1, no vortex was observed at Section 1; at Section 2, two vortices were observed with their centers located approximately at coordinates (2.1, 0.72) and (2.35, 0.3), jointly affecting the entire panel surface; at Section 3, two vortices were observed with their centers located approximately at coordinates (2.4, 0.81) and (2.3, 0.31), jointly affecting the entire panel surface. For this scheme, the pressure distribution on the solar panel exhibits a minimum value of 99.9805 kPa and a maximum value of 103.3897 kPa, with a ratio of approximately 1.034 between the two.
In scheme B-2, two vortices were observed at Section 1, with their centers located approximately at (2.4, 0.66) and (2.15, 0.18), jointly affecting the entire panel surface; at Section 2, two vortices were observed with their centers located approximately at (2.05, 0.72) and (2.75, 0.12), jointly affecting the entire panel surface; at Section 3, two vortices were observed with their centers located approximately at (2.3, 0.9) and (2.15, 0.2), jointly affecting the entire panel surface. For this scheme, the pressure distribution on the solar panel exhibits a minimum value of 100.1062 kPa and a maximum value of 103.8123 kPa, with a ratio of approximately 1.037 between the two.
In scheme B-3, it was observed that there is only one vortex at Sections 1, 2, and 3, with their centers located approximately at coordinates (1.8, 1.12), (1.7, 1.3), and (1.7, 1.31), respectively. These vortex centers are relatively far from the panel surface, and their influence on the solar panel is only minimal around the edges of the vortices. For this scheme, the pressure distribution on the solar panel exhibits a minimum value of 101.1967 kPa and a maximum value of 104.2234 kPa, with a ratio of approximately 1.030 between the two.
In scheme B-4, it was observed that there is only one vortex at Sections 1, 2, and 3, with their centers located approximately at coordinates (1.7, 1.3), (1.75, 1.32), and (1.71, 1.36), respectively. These vortex centers are relatively far from the panel surface, and their influence on the solar panel is minimal around the edges of the vortices. For this scheme, the pressure distribution on the solar panel exhibits a minimum value of 101.2013 kPa and a maximum value of 104.2906 kPa, with a ratio of approximately 1.031 between the two.
In computing schemes A-1 to A-4 and B-1 to B-4, it is evident that, as the installation tilt angle of the solar photovoltaic panel increases, the pressure on the windward side also increases. This correlation stems from the fact that a larger installation tilt angle of the solar panel leads to a larger effective force area on the panel surface. As a result, the pressure on the windward side intensifies, due to the increased surface area exposed to the wind flow.
In computing schemes A-1 to A-4, no vortex is generated at Section 1 for schemes A-1 and A-2, while vortices are generated at Section 1 for schemes A-3 and A-4, with the vortex at Section 1 of scheme A-3 being relatively larger. Although no vortex is generated at Section 1 for scheme A-2, the distortion of velocity streamline on the leeward side of the panel surface is significantly higher than that of Section 1 for scheme A-1. For Sections 2 and 3 of schemes A-1 to A-3, significant vortices are generated on the leeward side of the panel surface, especially two vortices at Section 3 for schemes A-1 and A-2. As for scheme A-4, vortices are generated at all three sections, with smaller vortex ranges and the vortex centers located relatively high at the top of the panel surface.
In computing schemes B-1 to B-4, vortices are generated at all sections except for Section 1 of scheme B-1, where no vortex is formed on the leeward side of the panel surface. The vortices generated at Sections 2 and 3 of scheme B-1, as well as Sections 1 to 3 of scheme B-2, are relatively larger, and all of them consist of two vortices. On the other hand, the vortices generated at the leeward side of the panel surface at all sections of schemes B-3 and B-4 are smaller, with the vortex centers located higher than the top of the panel surface.
Since the existence of wind vortices may cause oscillations on the solar photovoltaic panel [38], frequent oscillations can lead to material fatigue and damage, significantly reducing the lifespan of the solar panel. Moreover, a decrease in the tilt angle results in less force on the windward side. In this case, a smaller tilt angle is preferable. Additionally, excessively high tilt angles may reduce the efficiency of solar energy absorption by the solar panel. Therefore, when the direction of the wind flow is determinable, it is advisable to install the solar photovoltaic panel with a front tilt angle of 30° or 45° facing the wind, and a back tilt angle of 60° facing the wind.
3.2. Q Criterion
The calculation formula for the Q criterion is as follows [39]:
here, represents the square of the norm of matrix B, which is equivalent to the sum of squares of all elements in matrix B.
Matrix A and matrix B are, respectively, symmetric tensors and antisymmetric tensors of velocity gradients, as follows:
where T represents the transpose of the matrix. The definition of velocity tensor is as follows:
By utilizing the Q criterion to identify the scope of vortices in each computational scheme, velocity contour maps are plotted on the vortices. The level of the Q criterion used here is 0.05, with specific details depicted in Figure 8.
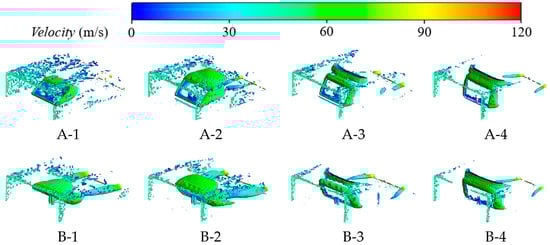
Figure 8.
Q criterion vortex map and velocity contour maps on the vortices, Qlevel = 0.05.
Observing Figure 8, it can be observed that, in the A-2, B-1, and B-2 computational schemes, the vortices on the leeward side are relatively larger. In contrast, in the A-1, A-3, A-4, B-3, and B-4 computational schemes, the vortices on the leeward side are relatively smaller, except for the A-1 scheme, where the vortex structures in the other schemes are also present at a higher position above the end of the plate. There is a non-linear relationship between the inclination angle and the vortex size. Additionally, in all computational schemes, vortices of varying sizes exist at the edges of the solar photovoltaic panels, which may cause turbulent pressure changes near the edges of the panels.
3.3. Pressure Distribution
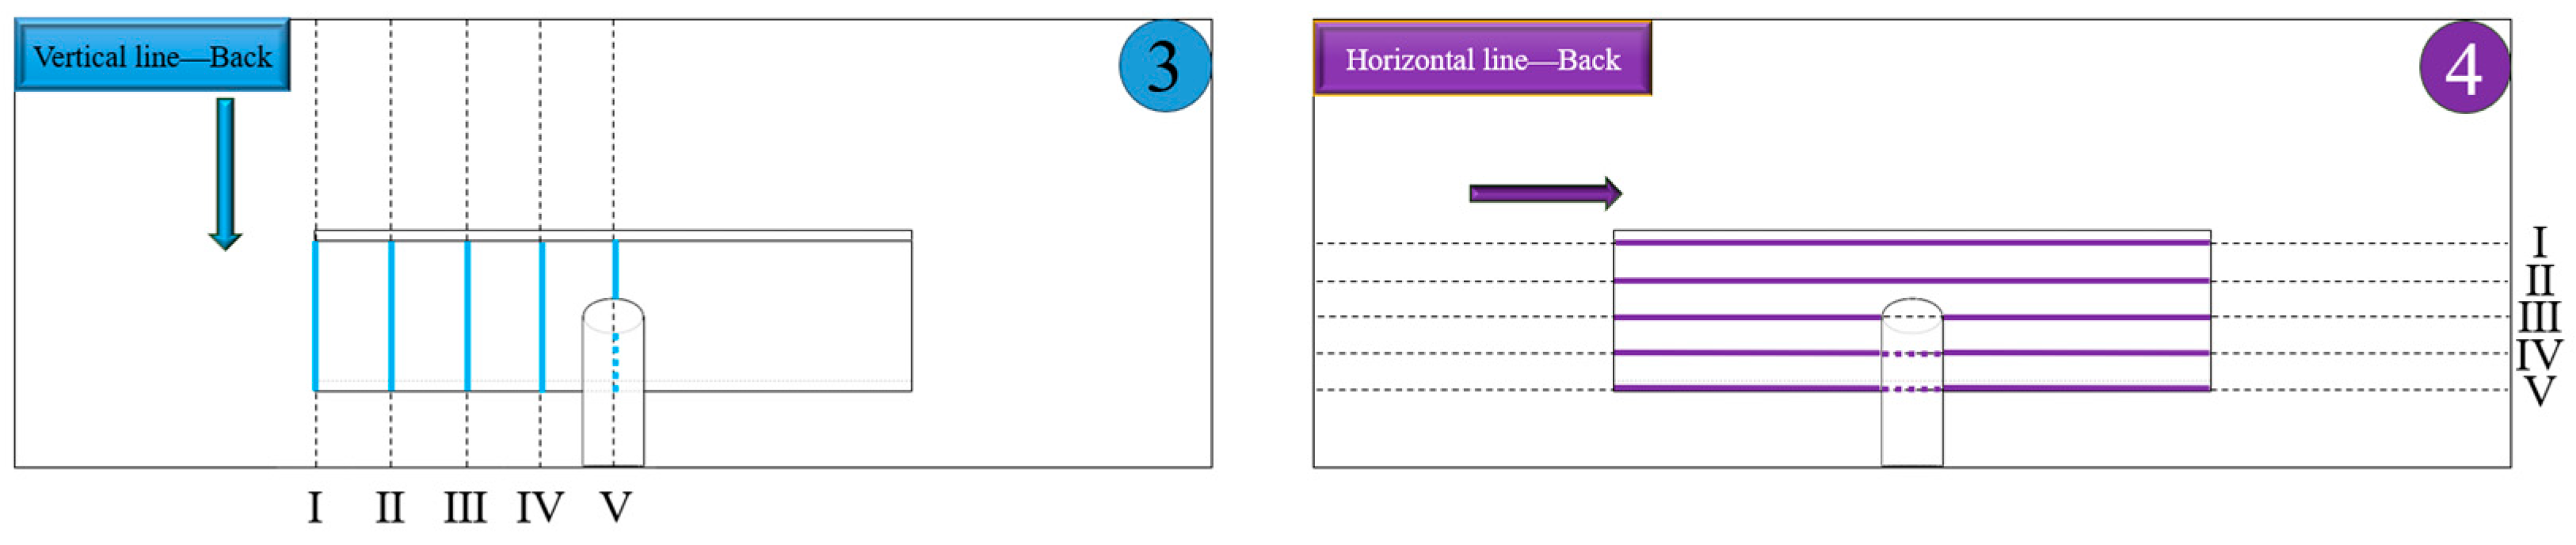
The schematic diagram of the pressure collection lines on the panel is presented in Figure 9. In this figure, images labeled 1 and 2 illustrate the method for determining the frontal collection lines on the panel, while images labeled 3 and 4 demonstrate the method for determining the rear collection lines on the panel. The collection lines on the panel are represented by bold lines in the figure.
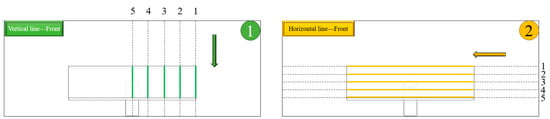
Figure 9.
Projection of the line on the panel and schematic diagram of the sampling direction.
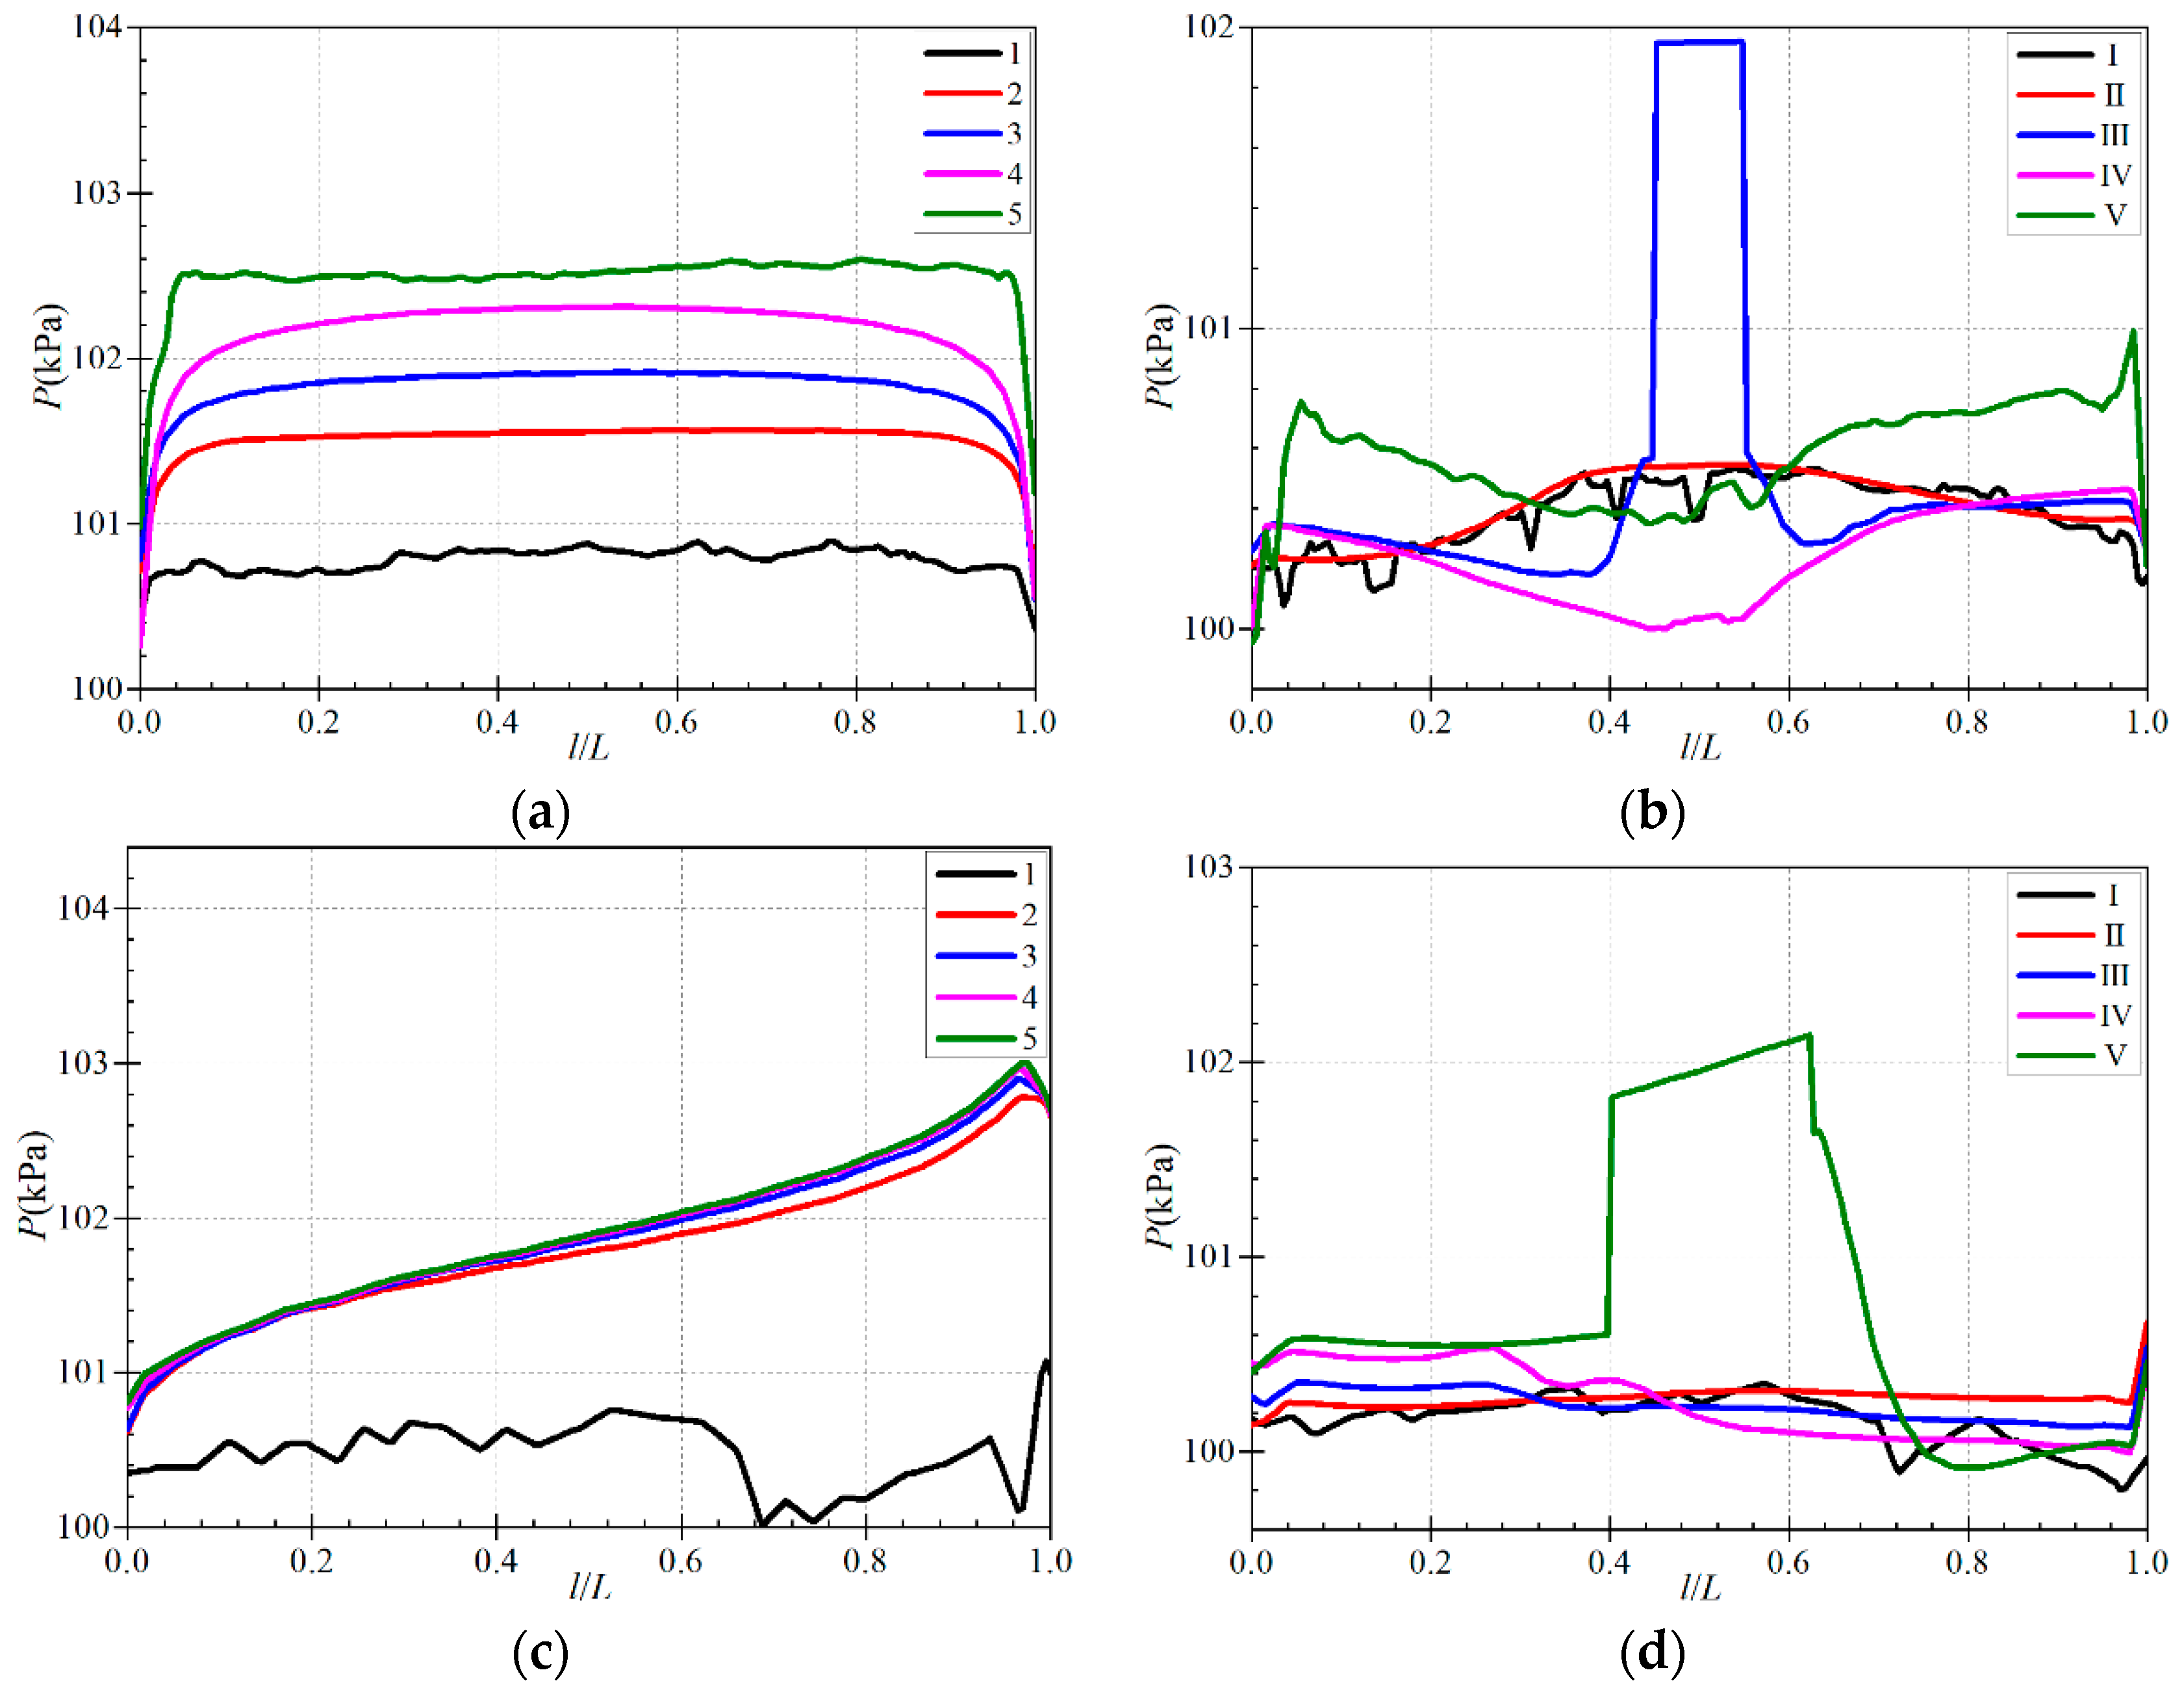
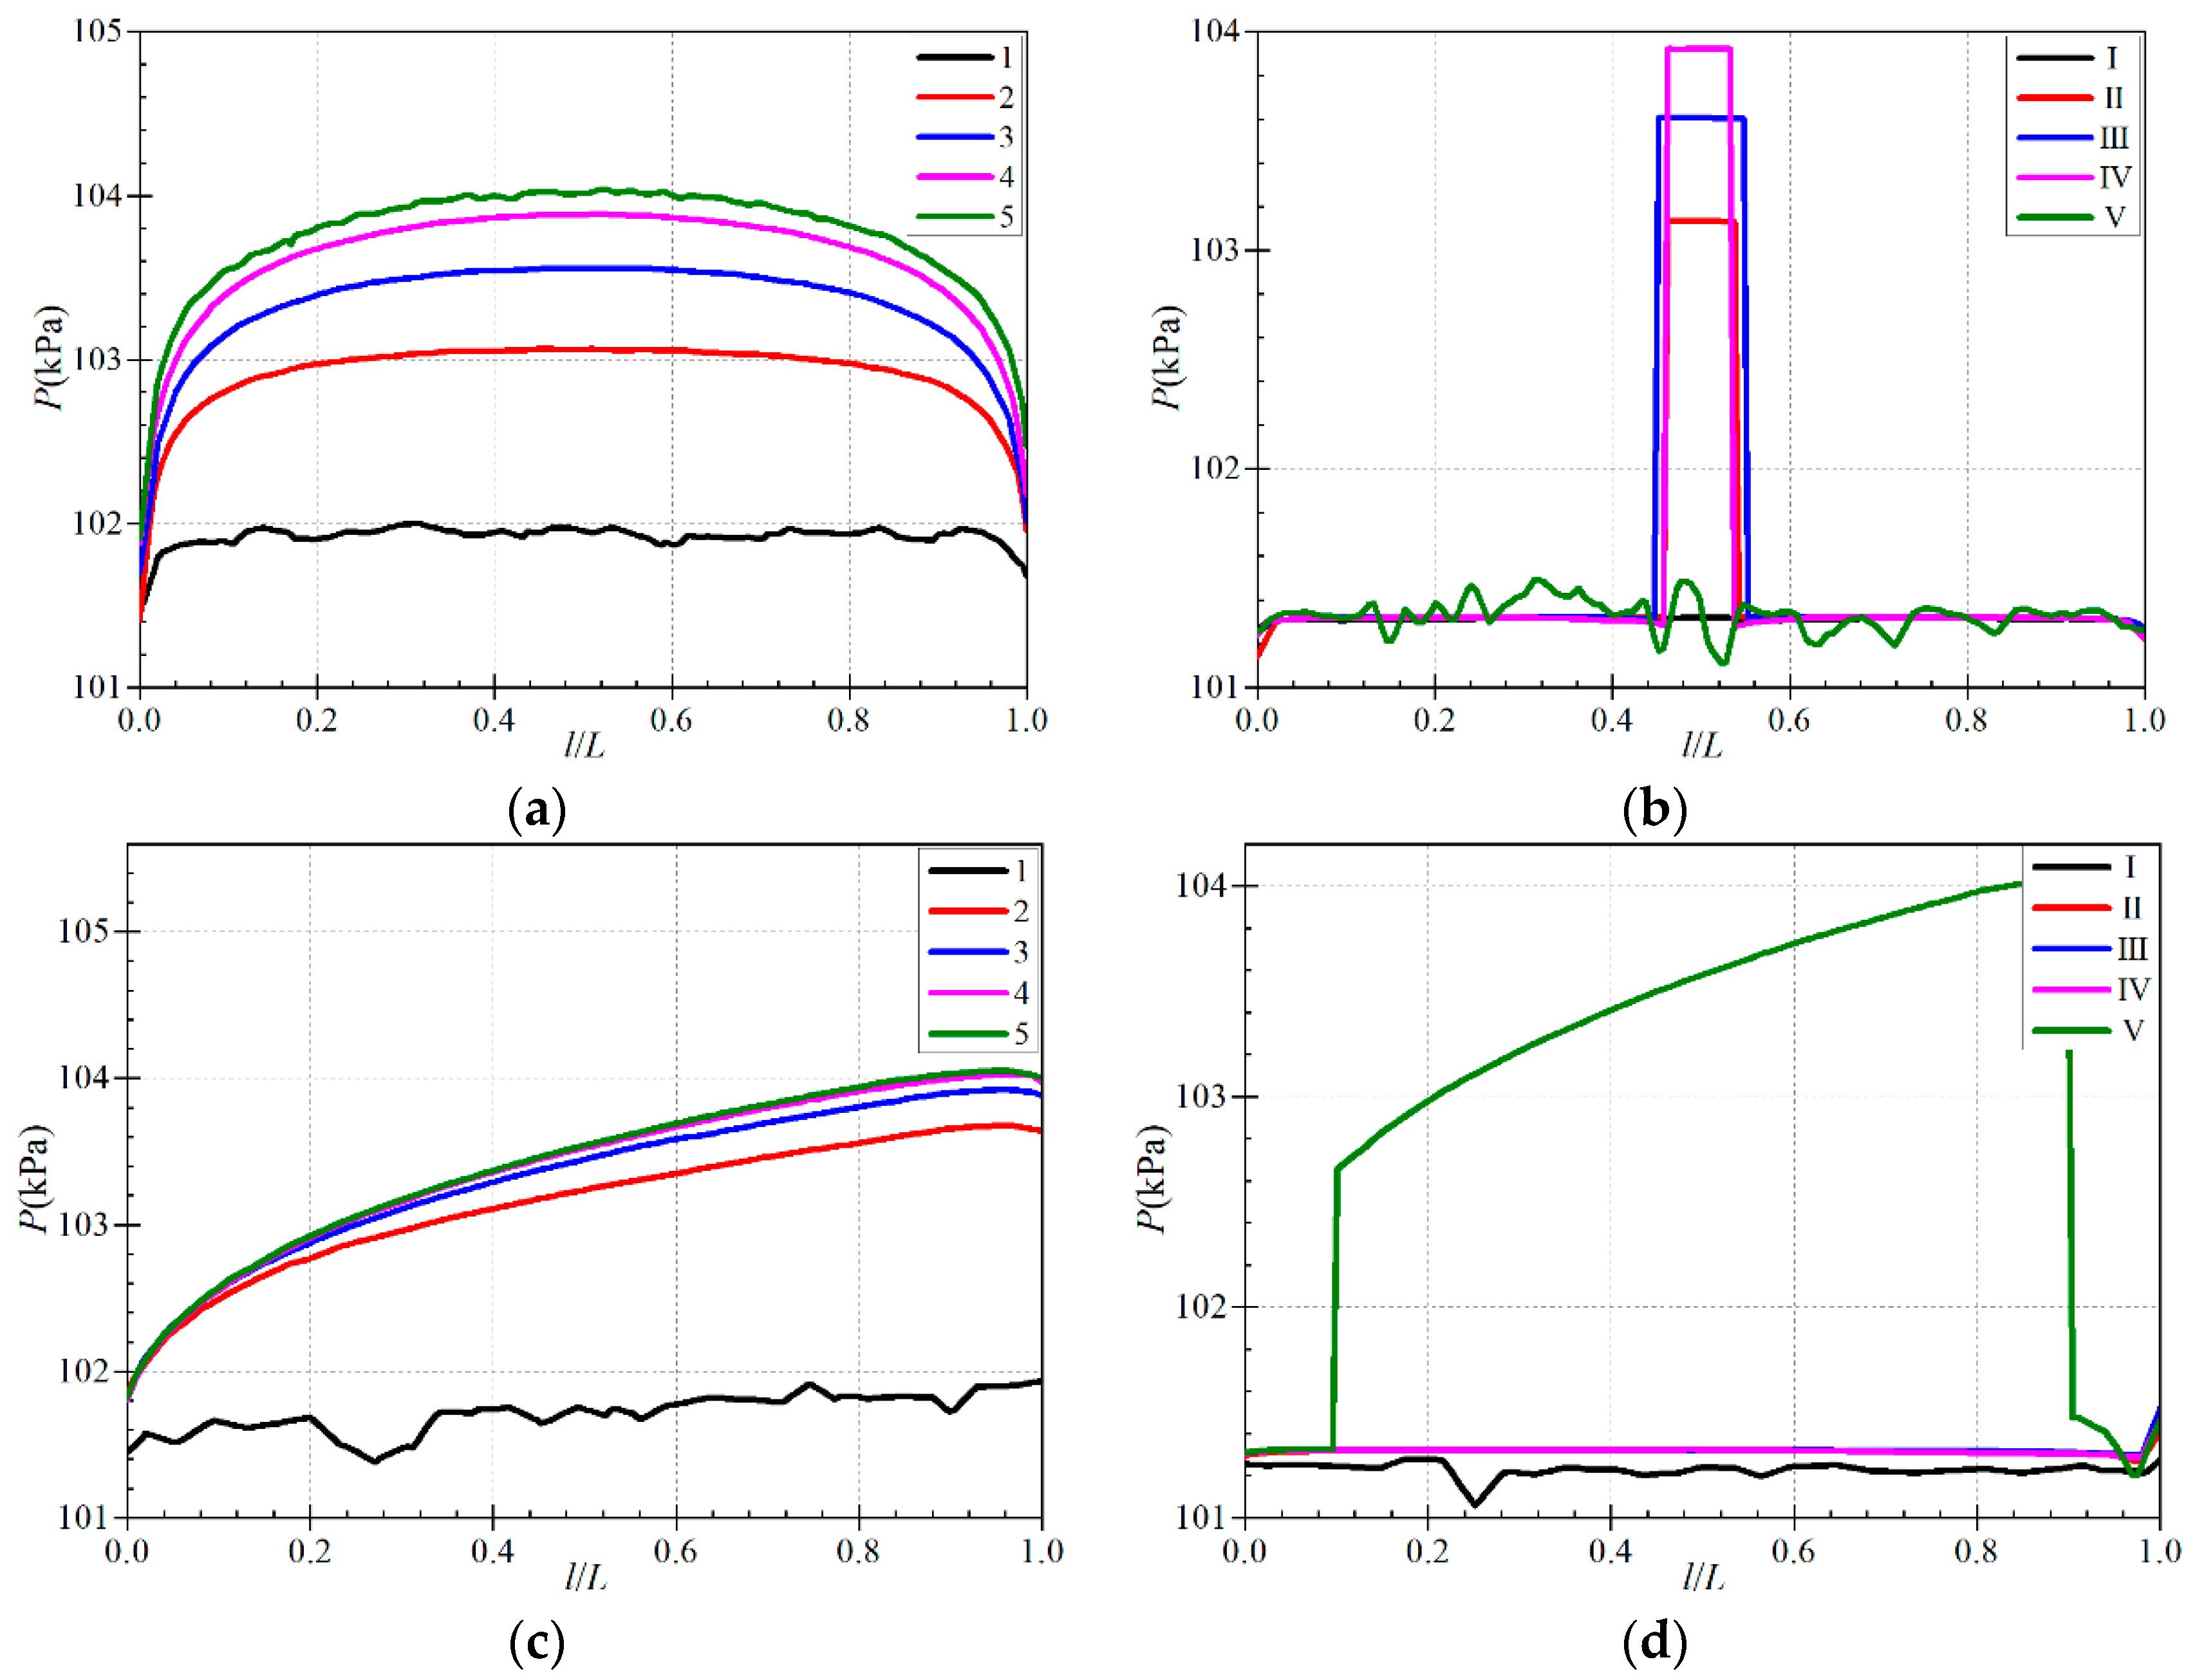
The pressure variation curve on the collection line in computational scheme A-1 is depicted in Figure 10. It is important to emphasize that, in Figure 10b,d, the abrupt changes in the data curves of lines III and V are due to the contact between the collection line and the panel support; similar situations thereafter will not be elaborated. The horizontal axis l/L in the figure represents the relative position of the sampling points on the collection line, i.e., the ratio of the distance from the starting point to the sampling point to the length of the collection line.
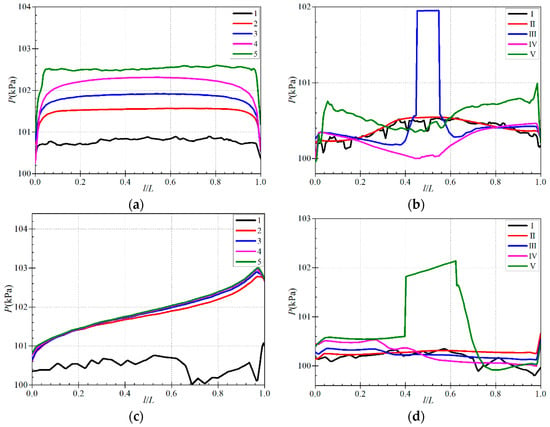
Figure 10.
The pressure variation curve on the collection line in calculation scheme A-1. (a) Front of the solar panel: horizontal lines 1 to 5; (b) Back of the solar panel: horizontal lines Ⅰ to Ⅴ; (c) Front of the solar panel: vertical lines 1 to 5; (d) Back of the solar panel: vertical lines Ⅰ to Ⅴ.
Through meticulous observation of each graph, it is evident that there is a significant difference in pressure between the windward and leeward sides of the solar photovoltaic panel. The pressure on the windward side is mostly concentrated in the range of 101~103 kPa, while on the leeward side, it is primarily distributed in the range of 100~101 kPa. This indicates that the windward side of the solar photovoltaic panel bears a significantly higher pressure than the leeward side, with a maximum difference of up to 3.2027 kPa.
Analyzing the pressure variation along the transverse collection line on the front face of the panel depicted in Figure 10a, it is observed that the pressure gradually increases from the top to the bottom. The pressure at the top is minimal, averaging 100.78 kPa, while at the bottom, it is highest, averaging 102.48 kPa. Additionally, lower pressure is observed on the sides of the solar photovoltaic panel. This trend indicates that the pressure along the transverse direction of the front face of the panel gradually increases with position and exhibits a noticeable gradient.
Examining the pressure variation along the vertical collection line on the front face of the panel depicted in Figure 10c, it is observed that the pressure change is consistent from line 2 to line 5, indicating a gradual increase in pressure with height along the vertical direction of the front face. Overall, the pressure increases from approximately 100.4 kPa at the top to 103 kPa at the bottom. However, the pressure variation along line 1 is irregular due to its proximity to the edge of the panel, where vortexes exist, leading to unstable pressure changes.
Regarding the pressure variation depicted in Figure 10b,d, no discernible patterns are evident, with significant differences in pressure values among the curves. This irregular variation may increase the risk of material fatigue and damage, as uneven pressure distribution may lead to certain areas of the solar photovoltaic panel bearing excessive pressure, exacerbating stress concentration and damage to the material.
Through conducting detailed observation and analysis of the pressure distribution at different positions of the solar photovoltaic panel, it can be concluded that there is a significant difference in pressure between the windward and leeward sides, and there are certain regularities in the transverse and vertical pressure variations on the front face of the panel. However, irregular pressure changes may increase the risk of fatigue damage to the solar photovoltaic panel, emphasizing the need for attention and control during design and usage.
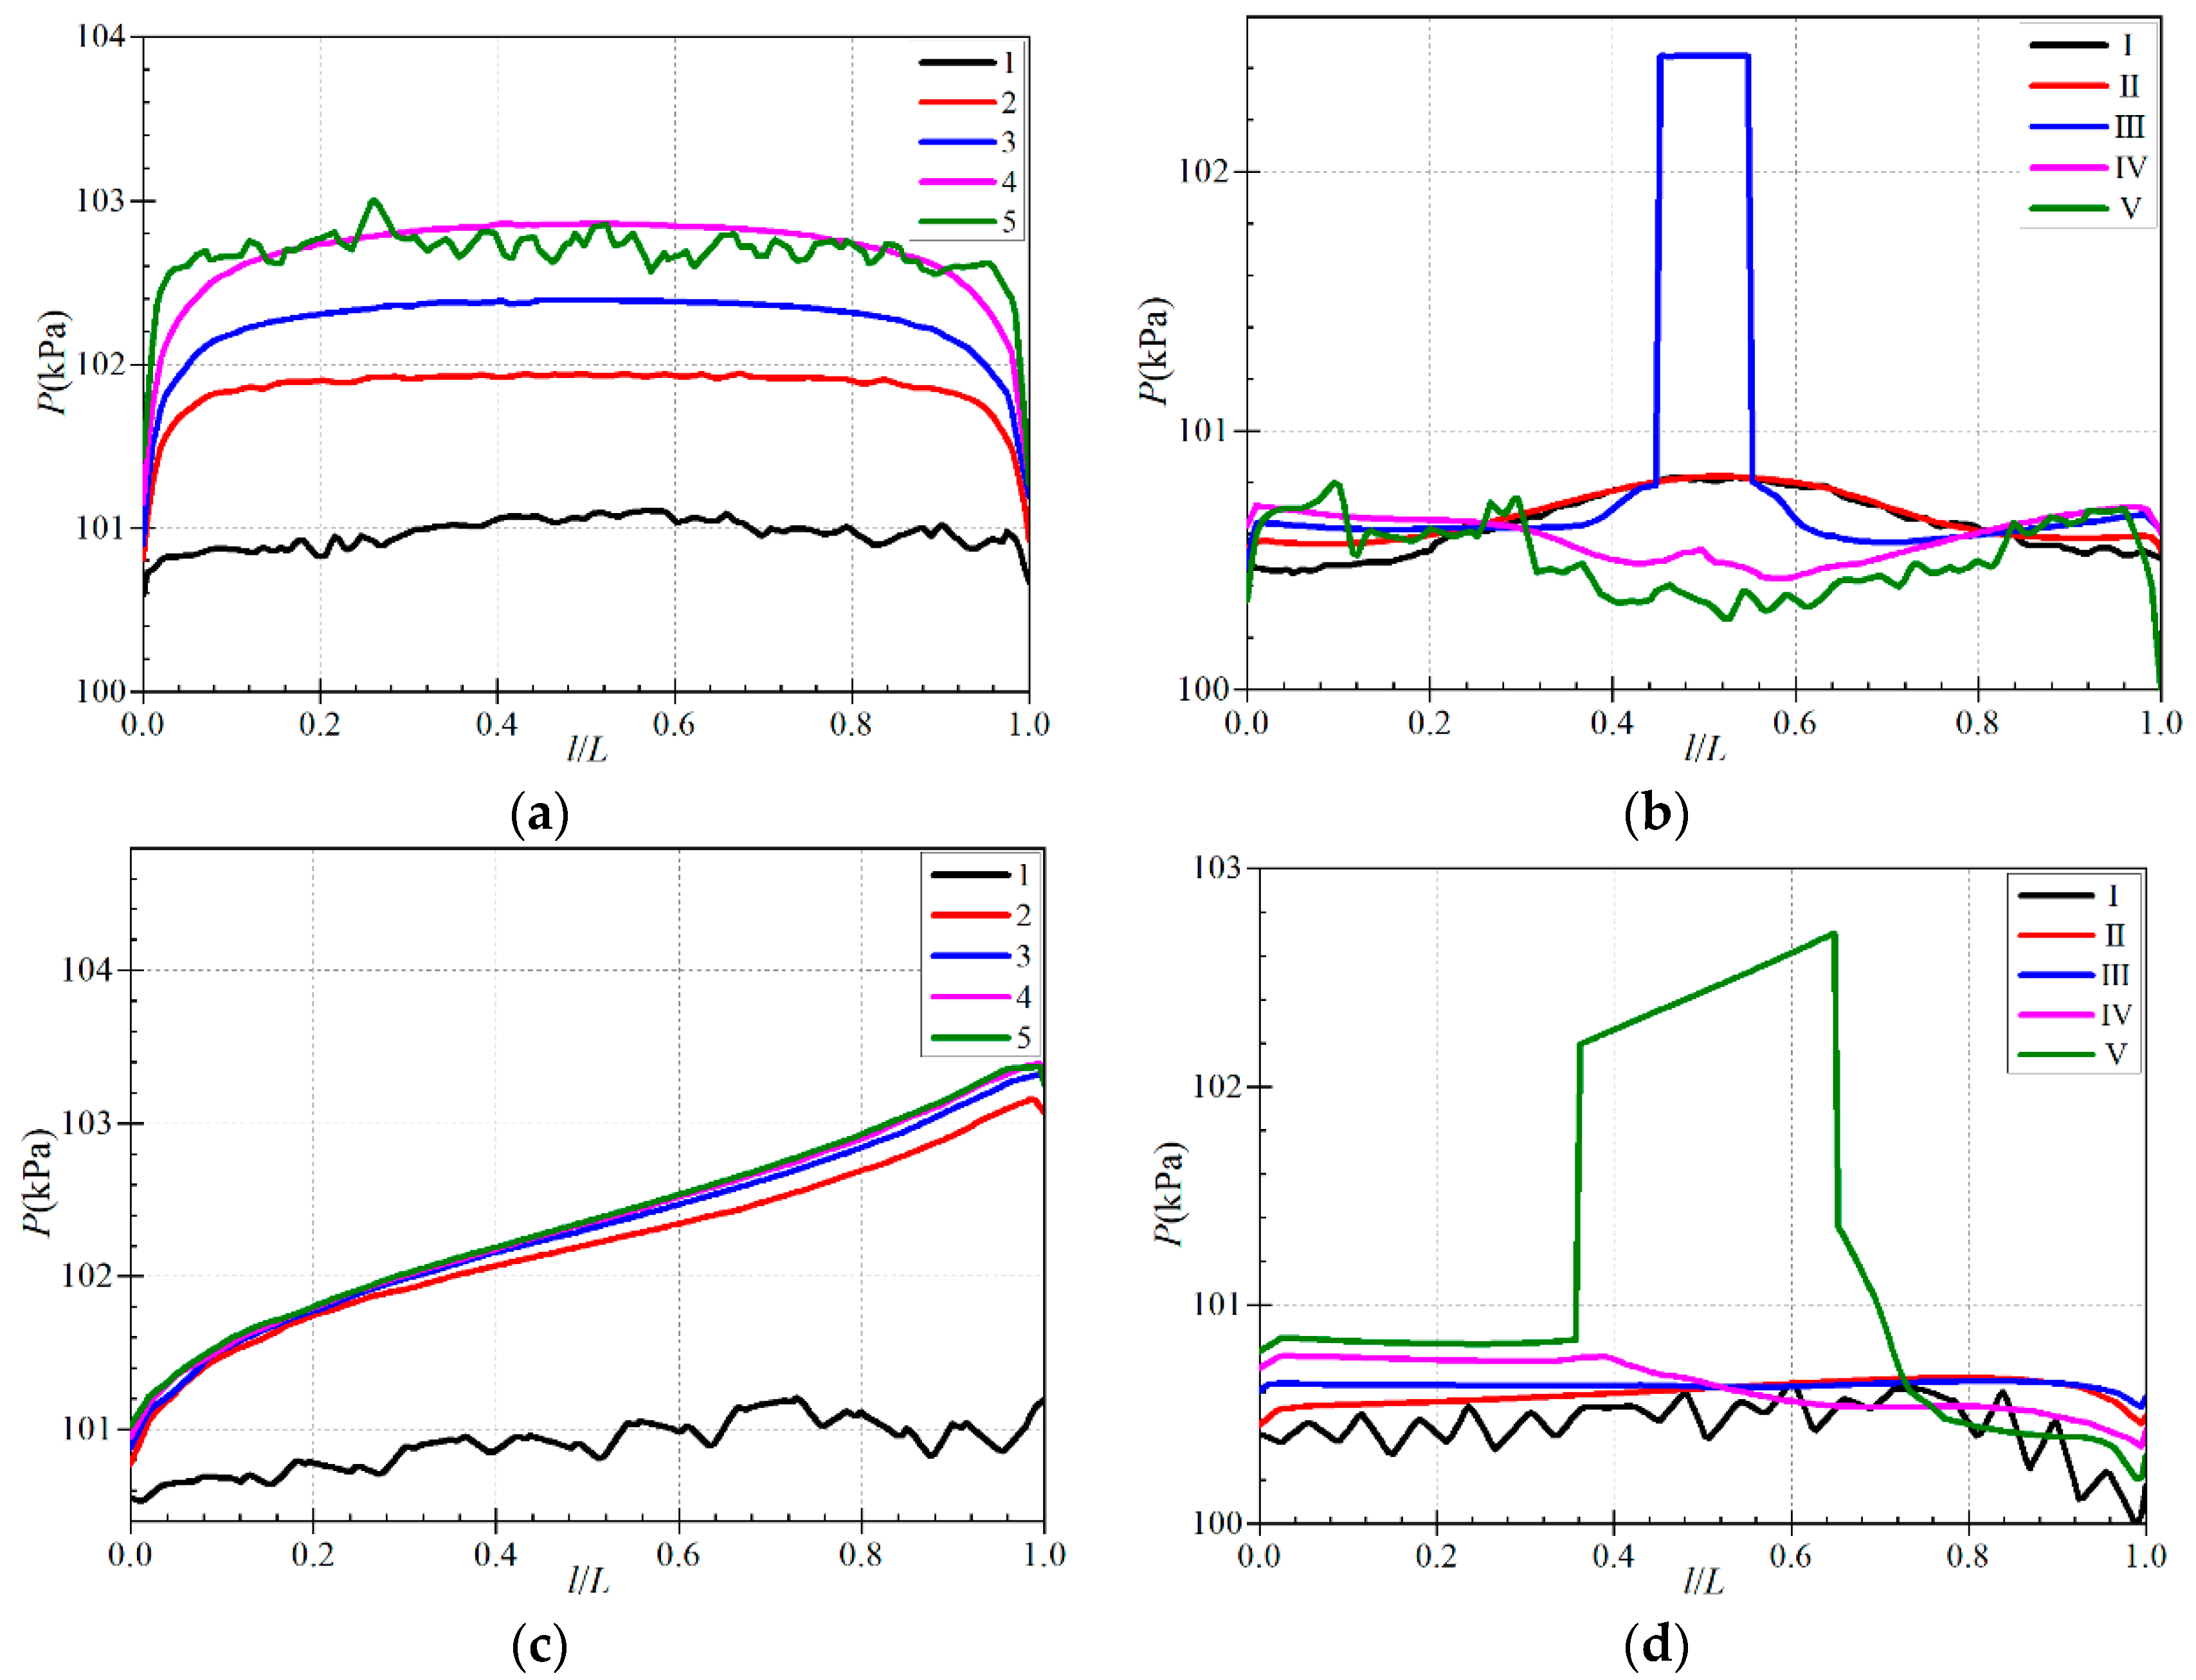
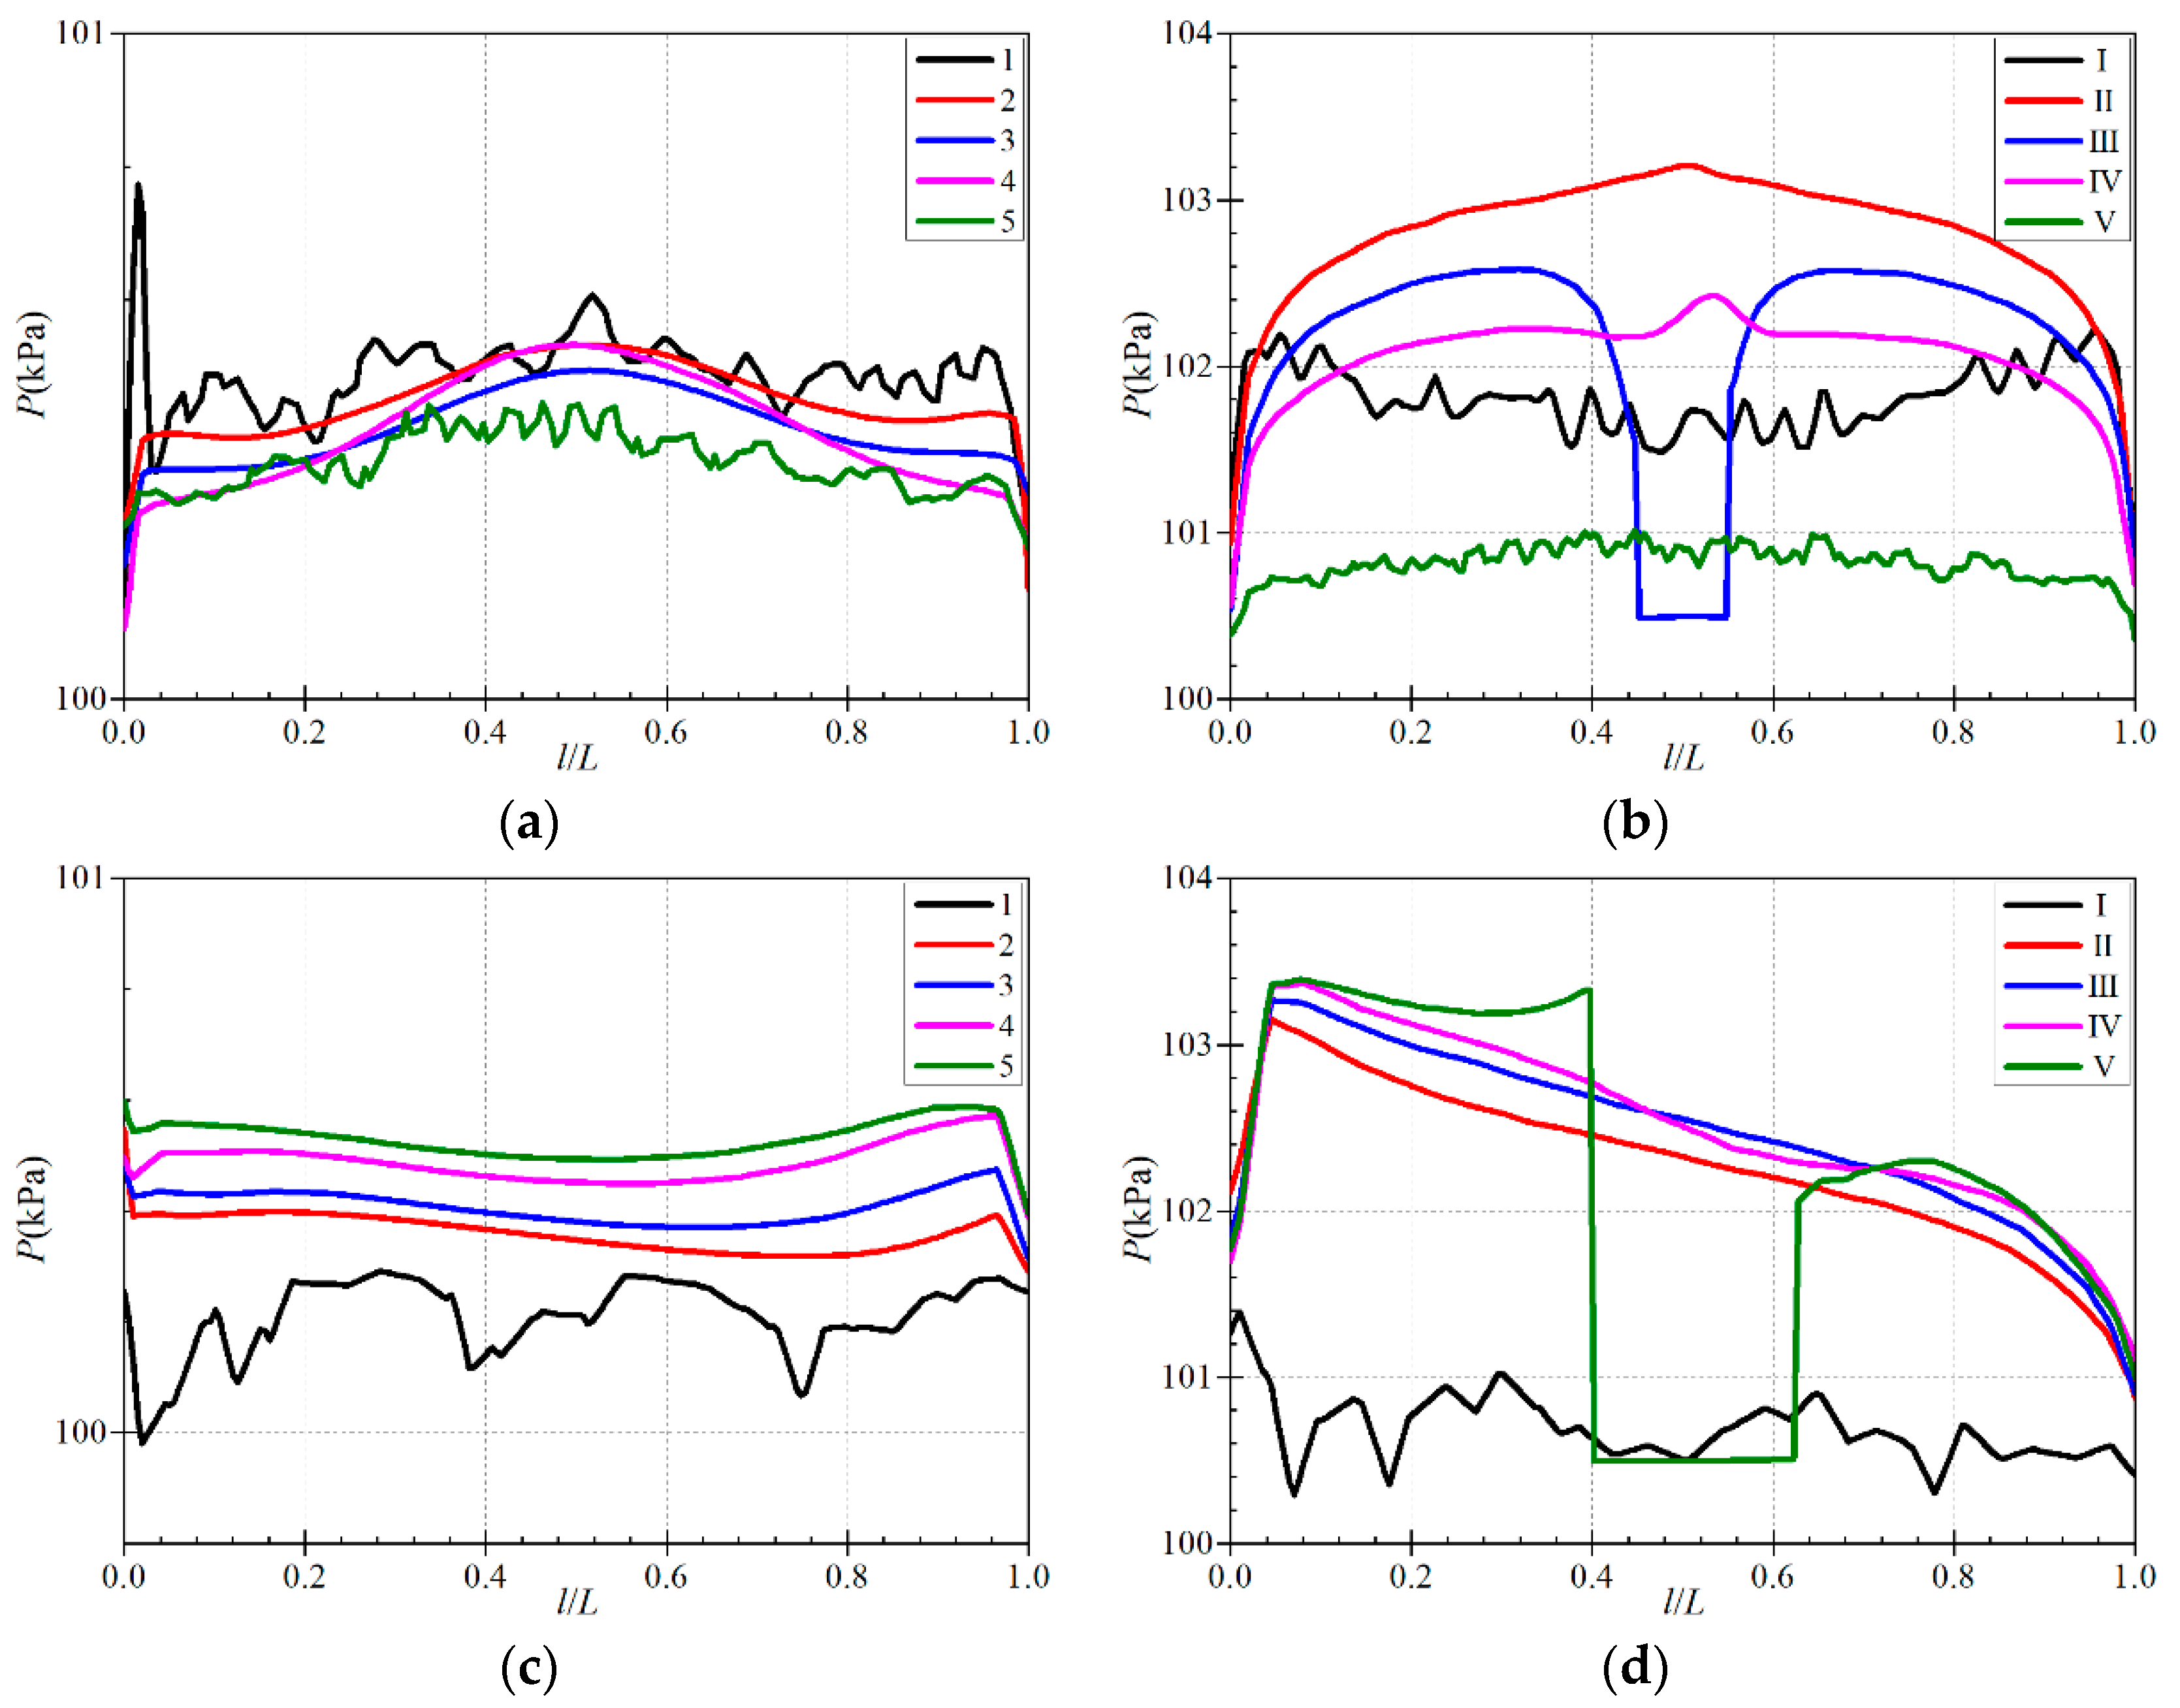
The pressure variation curve on the collection line in calculation scheme A-2 is depicted in Figure 11. Observing the graphs, it can be noted that on the wind-facing side, the pressure mostly ranges from 100.6 to 103 kPa, while on the leeward side, the pressure mostly ranges from 100 to 101 kPa. This indicates that the pressure on the wind-facing side of the solar panel is significantly higher than that on the leeward side, with a maximum difference of 3.4008 kPa.
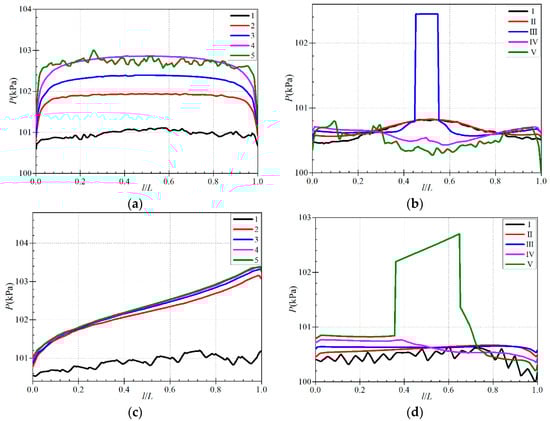
Figure 11.
The pressure variation curve on the collection line in calculation scheme A-2. (a) Front of the solar panel: horizontal lines 1 to 5; (b) Back of the solar panel: horizontal lines Ⅰ to Ⅴ; (c) Front of the solar panel: vertical lines 1 to 5; (d) Back of the solar panel: vertical lines Ⅰ to Ⅴ.
In Figure 11a, the pressure variations along the transverse acquisition lines on the front side of the panel are observed. There is a gradual increase in pressure from the top to the bottom, indicating an average pressure of 100.96 kPa at the top and 102.67 kPa at the bottom. It is noteworthy that the pressure at the sides of the solar photovoltaic panel is relatively lower, possibly due to design or environmental factors. Additionally, there is more turbulence in the pressure variation along line 5, likely due to its proximity to the edge of the panel, making it susceptible to vortex effects.
In Figure 11c, the pressure variations along the vertical acquisition lines on the front side of the panel are observed. The pressure changes from line 2 to line 5 are consistent, showing a gradual increase from 100.8 kPa at the top to 103.4 kPa at the bottom. However, line 1 exhibits irregular pressure changes, attributed to its position near the edge of the panel, making it susceptible to vortex effects and resulting in unstable pressure fluctuations.
In Figure 11b,d, no clear pattern in pressure variation is observed, with significant differences in pressure values among the curves. This suggests the presence of significant vortices near the back of the panel, increasing the risk of material fatigue and damage.
Pressure fluctuations at diverse locations on the solar photovoltaic panel are influenced by various factors, including panel design, surrounding environment, and the presence of vortices. Comprehending these fluctuations is of utmost importance for optimizing the design and upkeep of solar photovoltaic panels, with the aim of minimizing the risk of material fatigue and damage, and thereby enhancing the efficiency and dependability of solar photovoltaic systems.
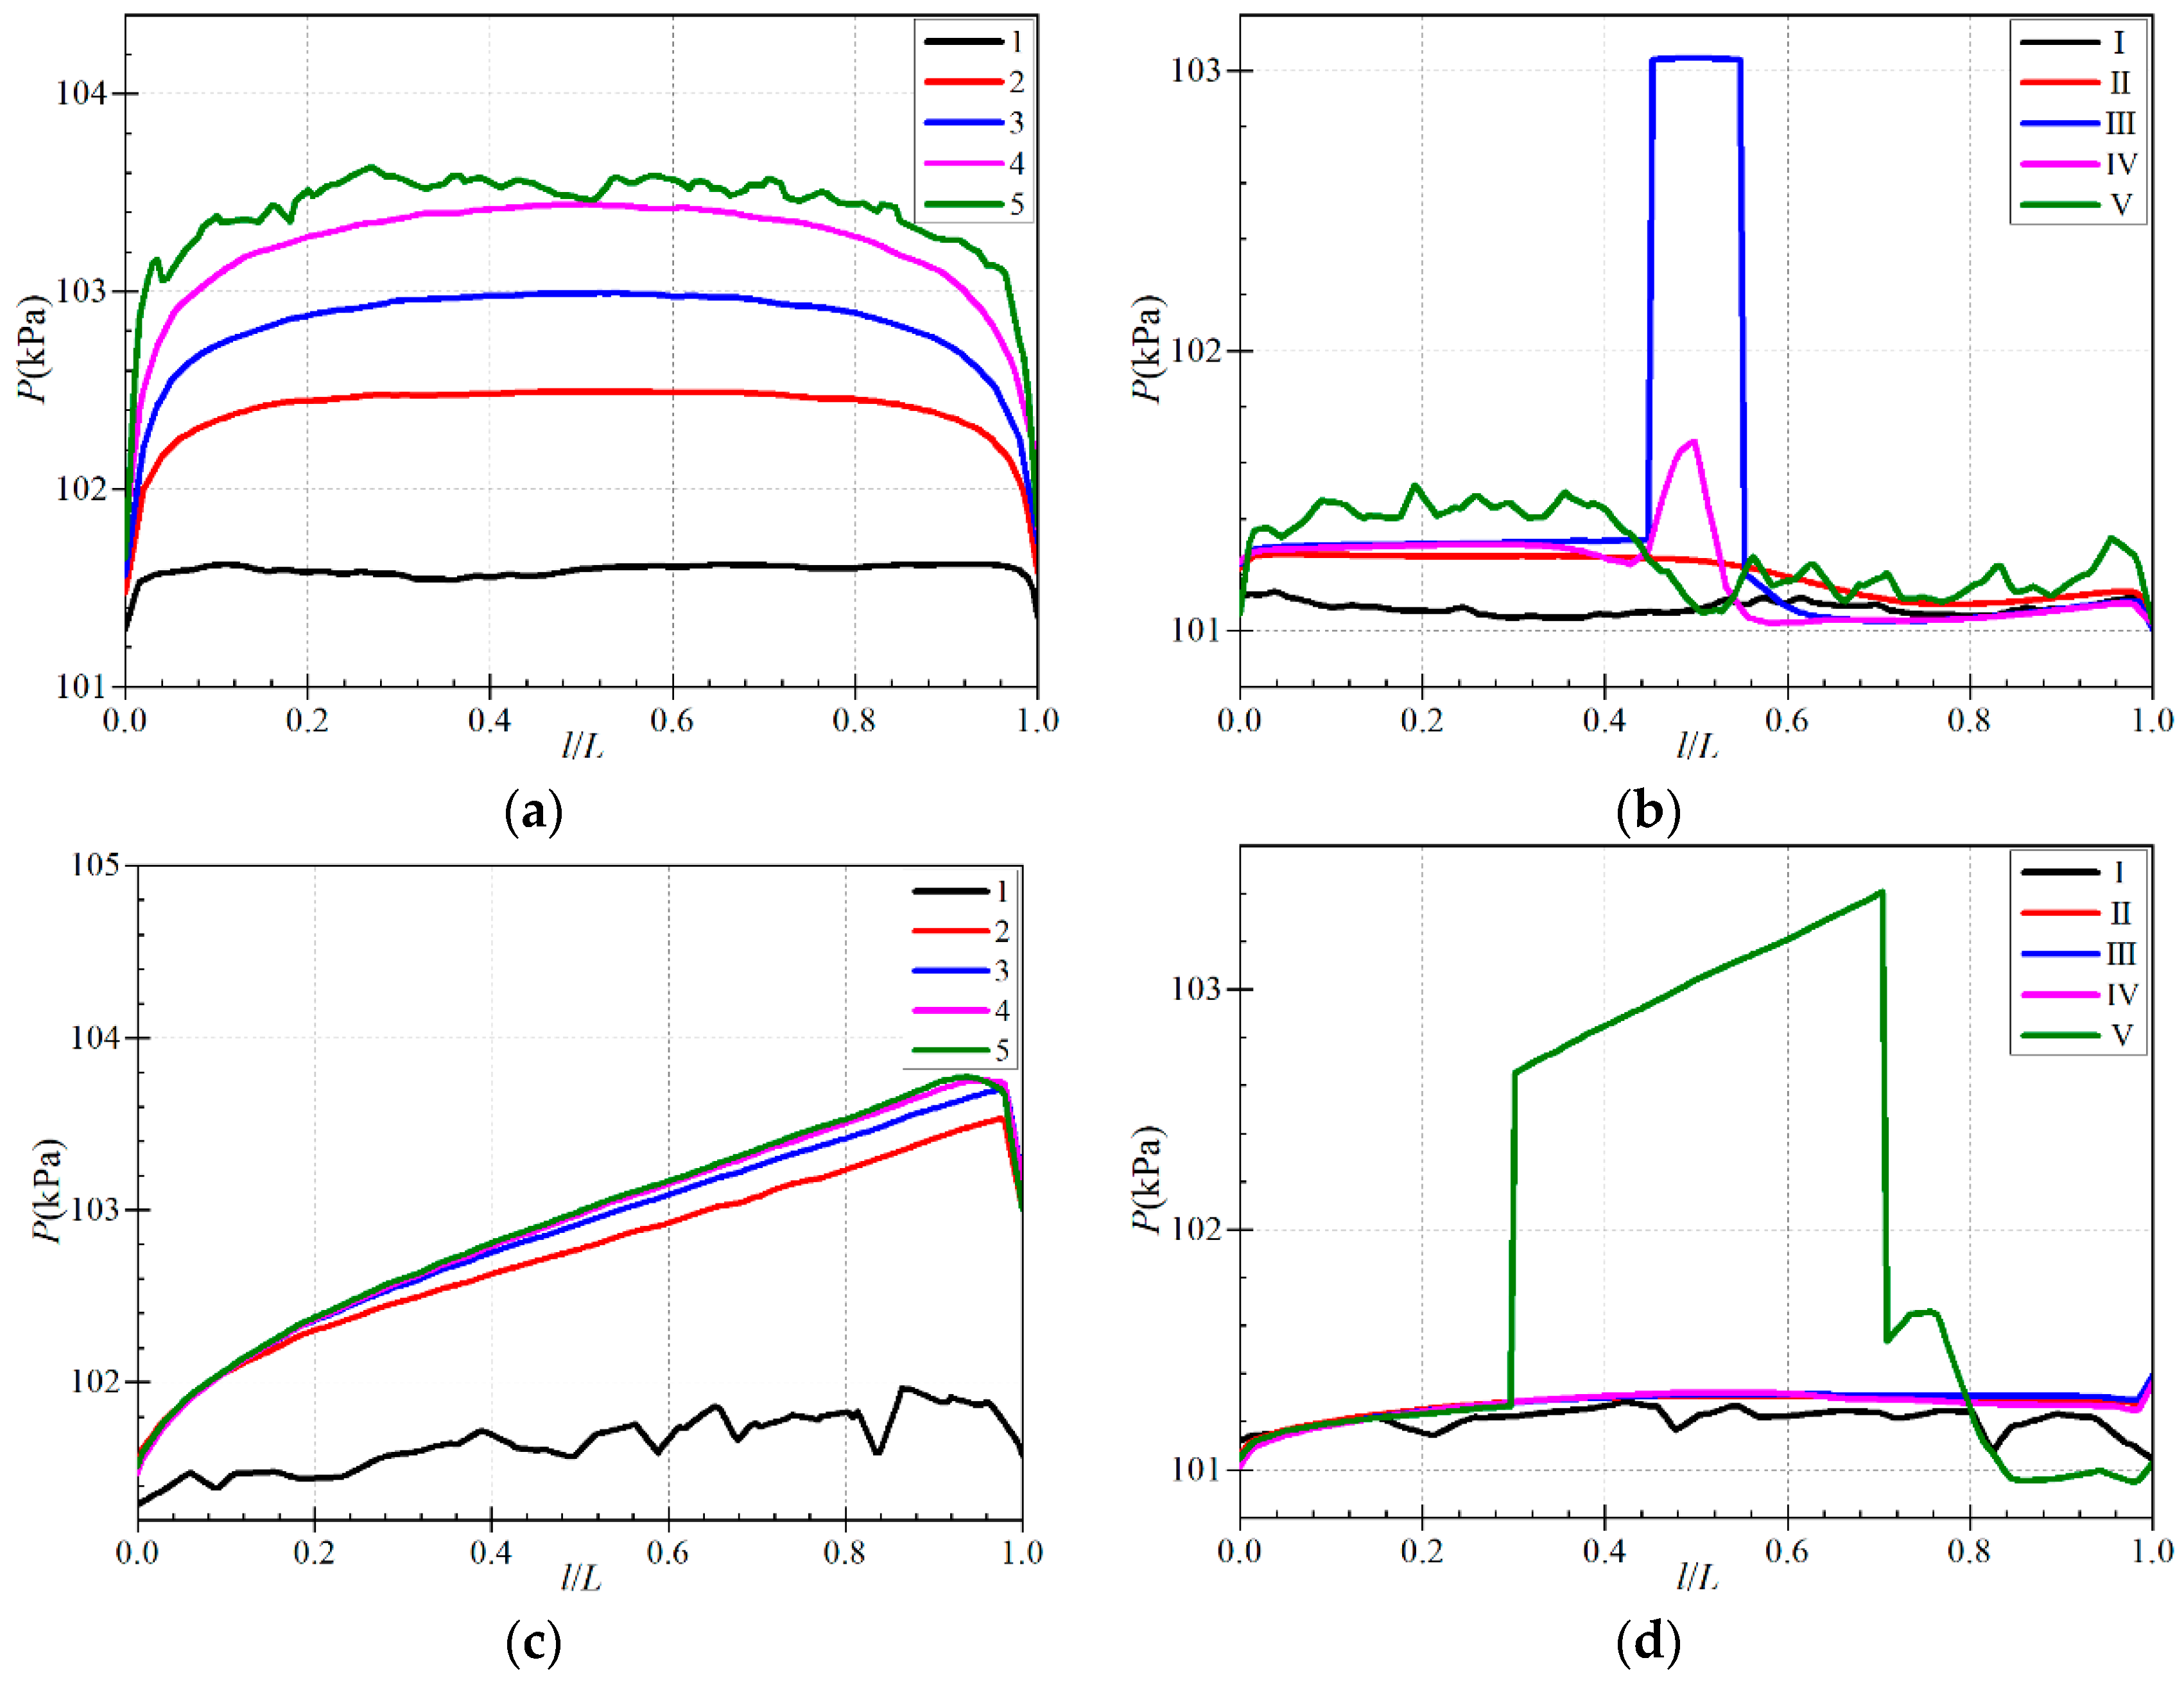
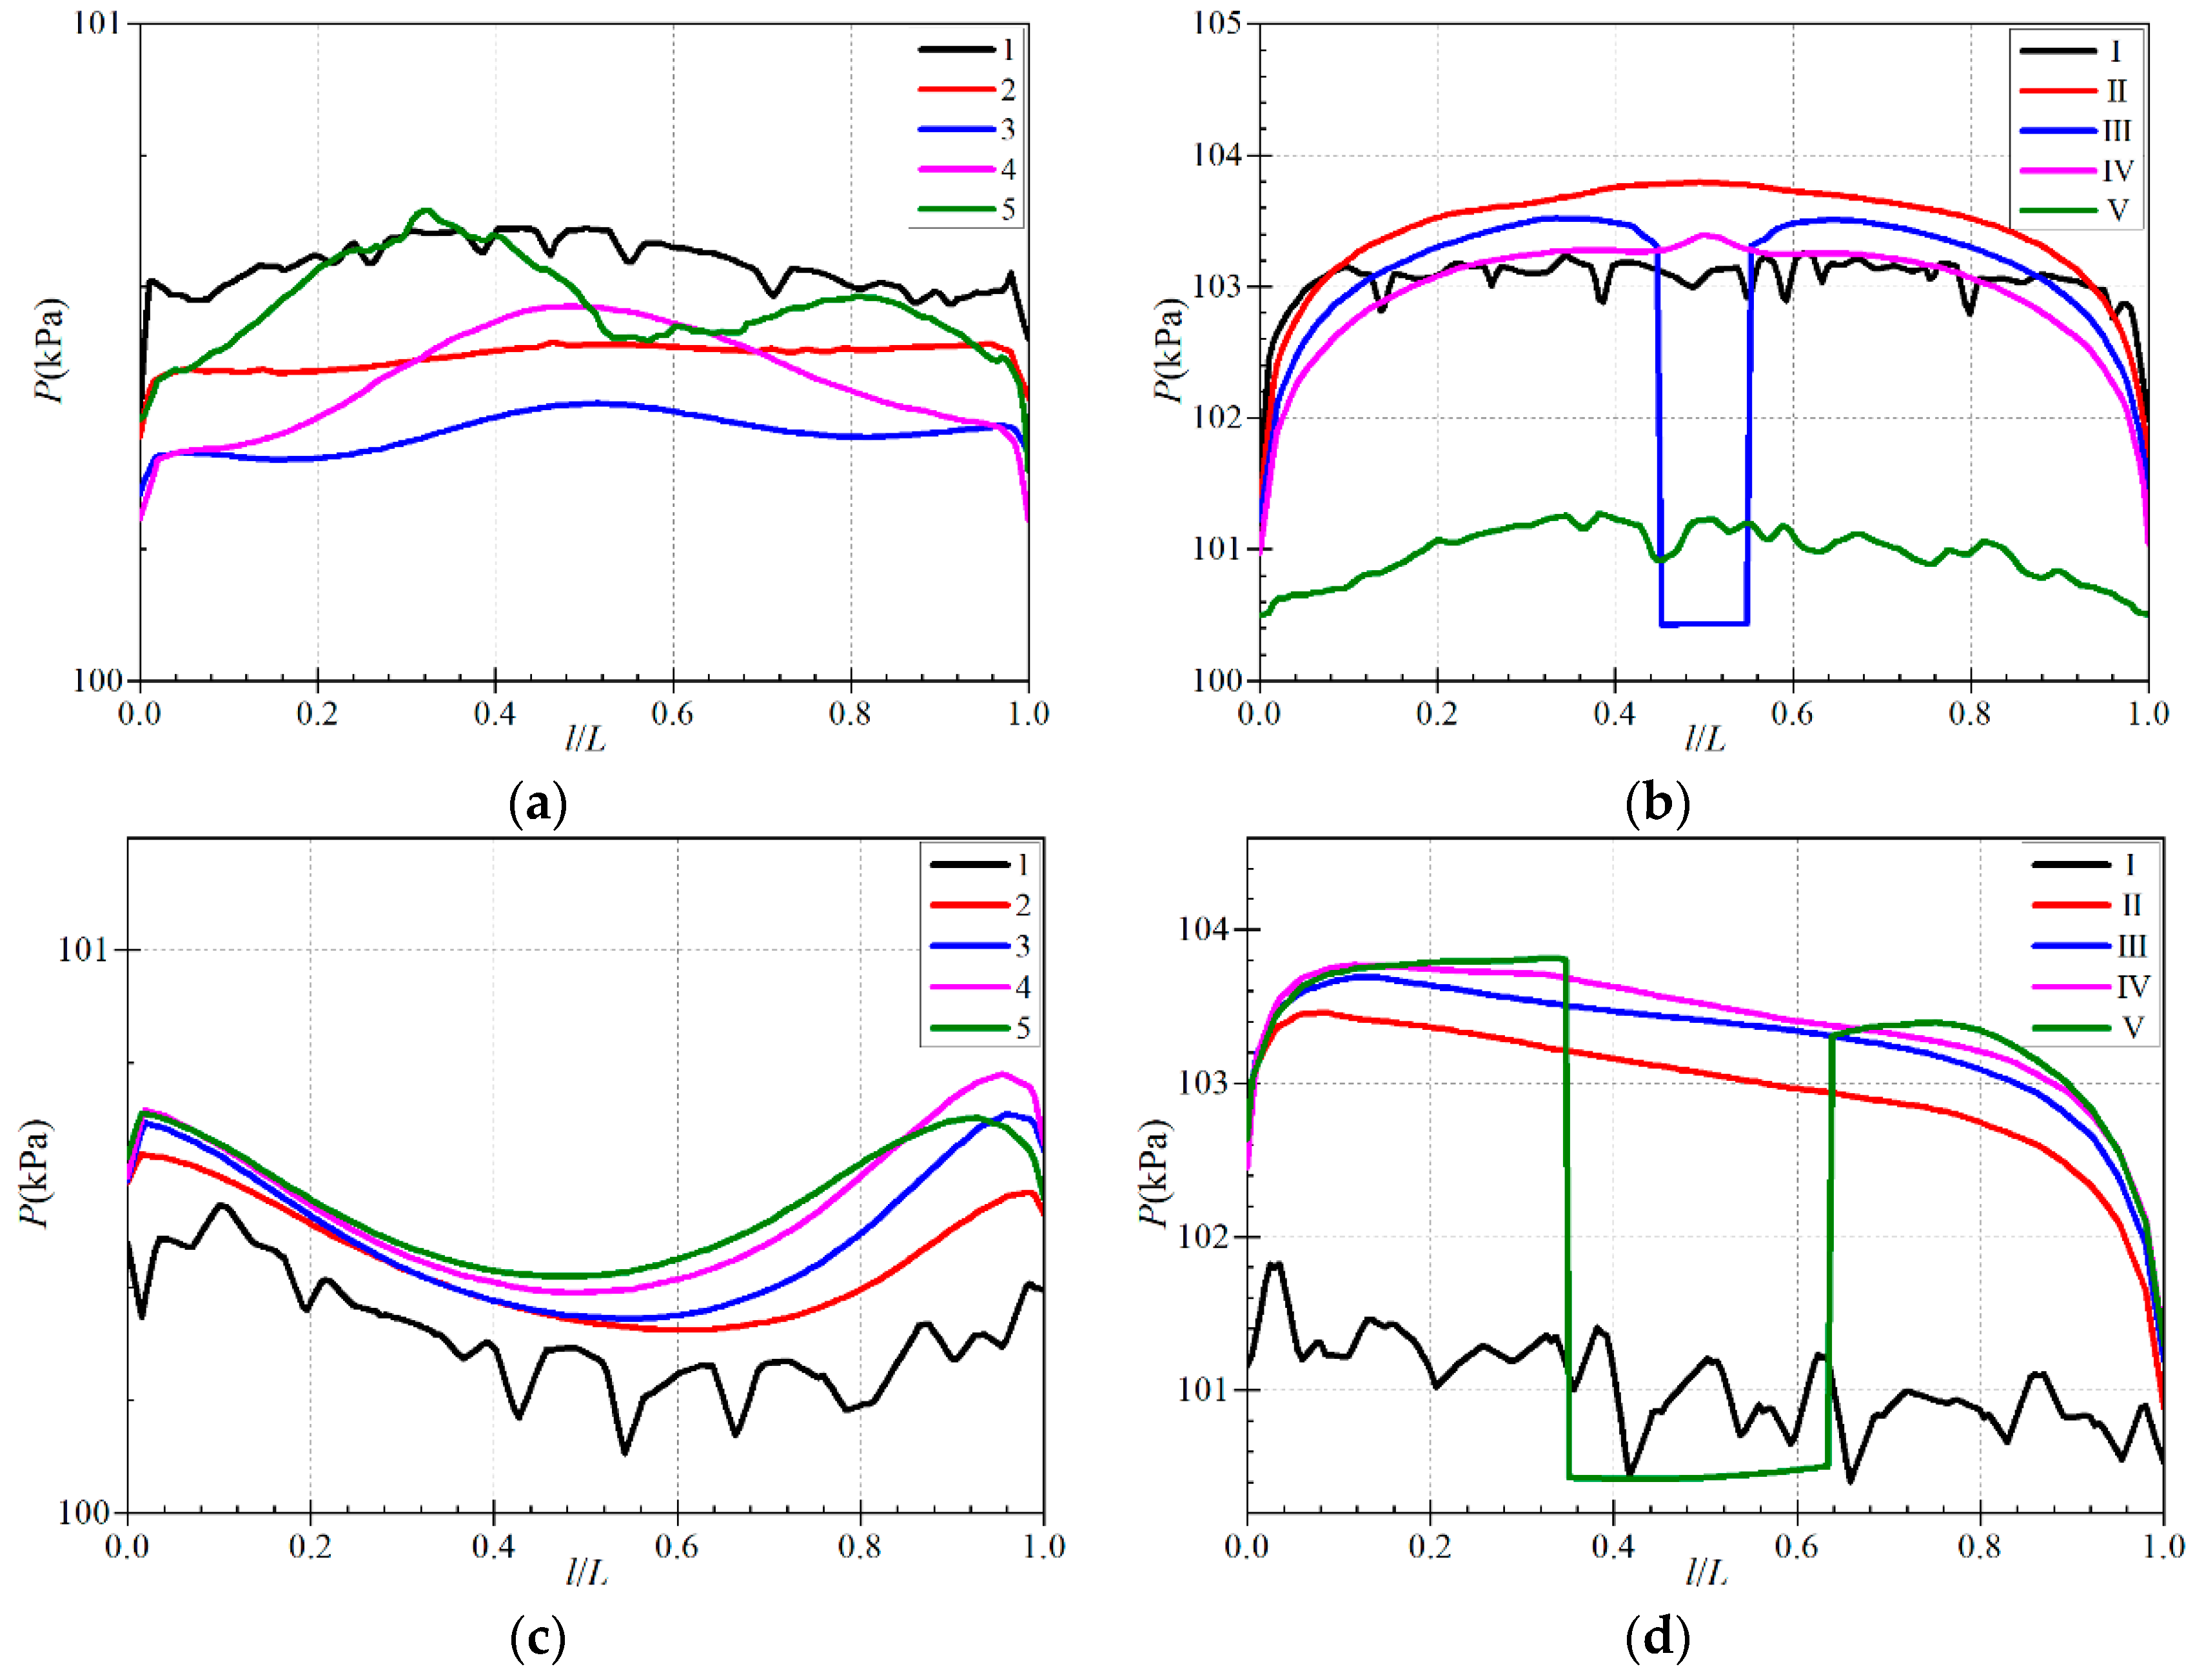
The pressure variation curve on the collection line in calculation scheme A-3 is depicted in Figure 12. Observing the graphs, it can be noted that, on the wind-facing side, the pressure mostly ranges from 101 to 104 kPa, while, on the leeward side, the pressure mostly ranges from 101 to 101.5 kPa. This indicates that the pressure on the wind-facing side of the solar panel is significantly higher than that on the leeward side, with a maximum difference of 2.8258 kPa.
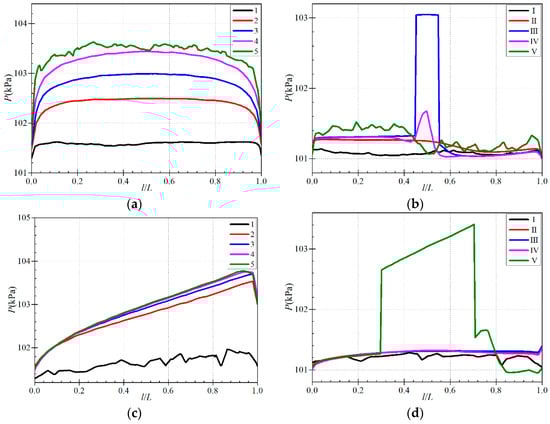
Figure 12.
The pressure variation curve on the collection line in calculation scheme A-3. (a) Front of the solar panel: horizontal lines 1 to 5; (b) Back of the solar panel: horizontal lines Ⅰ to Ⅴ; (c) Front of the solar panel: vertical lines 1 to 5; (d) Back of the solar panel: vertical lines Ⅰ to Ⅴ.
Figure 12a illustrates the pressure variation along the horizontal line on the front of the solar photovoltaic panel. From the top to the bottom, the pressure gradually increases, with the average pressure at the top being about 101.59 kPa, while the average pressure at the bottom is about 103.39 kPa. This suggests that the lower part of the solar photovoltaic panel experiences greater pressure, which might be related to the supporting structure or installation method. The pressure at both sides of the panel is relatively lower, possibly due to air movement along the edges. Notably, the pressure variation on Line 5 is more irregular compared to other lines, possibly because it is located at the edge of the solar panel, within the influence range of wind vortices.
Figure 12c exhibits pressure variation along the vertical line on the front of the solar photovoltaic panel. From top to bottom, the pressure gradually increases, with the overall pressure rising from about 101.6 kPa to about 103.6 kPa. The pressure variations from line 2 to line 5 are relatively consistent, indicating that the vertical pressure distribution on the solar panel is relatively uniform. However, the pressure on line 1 is more irregular, possibly because it is at the edge of the solar panel, where wind vortices have a greater impact.
In Figure 12b,d, apart from lines I and V having significant pressure differences due to their edge positions, the pressure curves in the rest of the figures show minor differences. This indicates that the pressure distribution across the solar photovoltaic panel is relatively uniform, reducing the risk of material fatigue and damage.
In general, the pressure distribution on the solar photovoltaic panel is affected by multiple elements, such as the supporting structure, the method of installation, and the surrounding environment. The rational design and optimization of these factors are capable of enhancing the stability and durability of the solar photovoltaic panel.
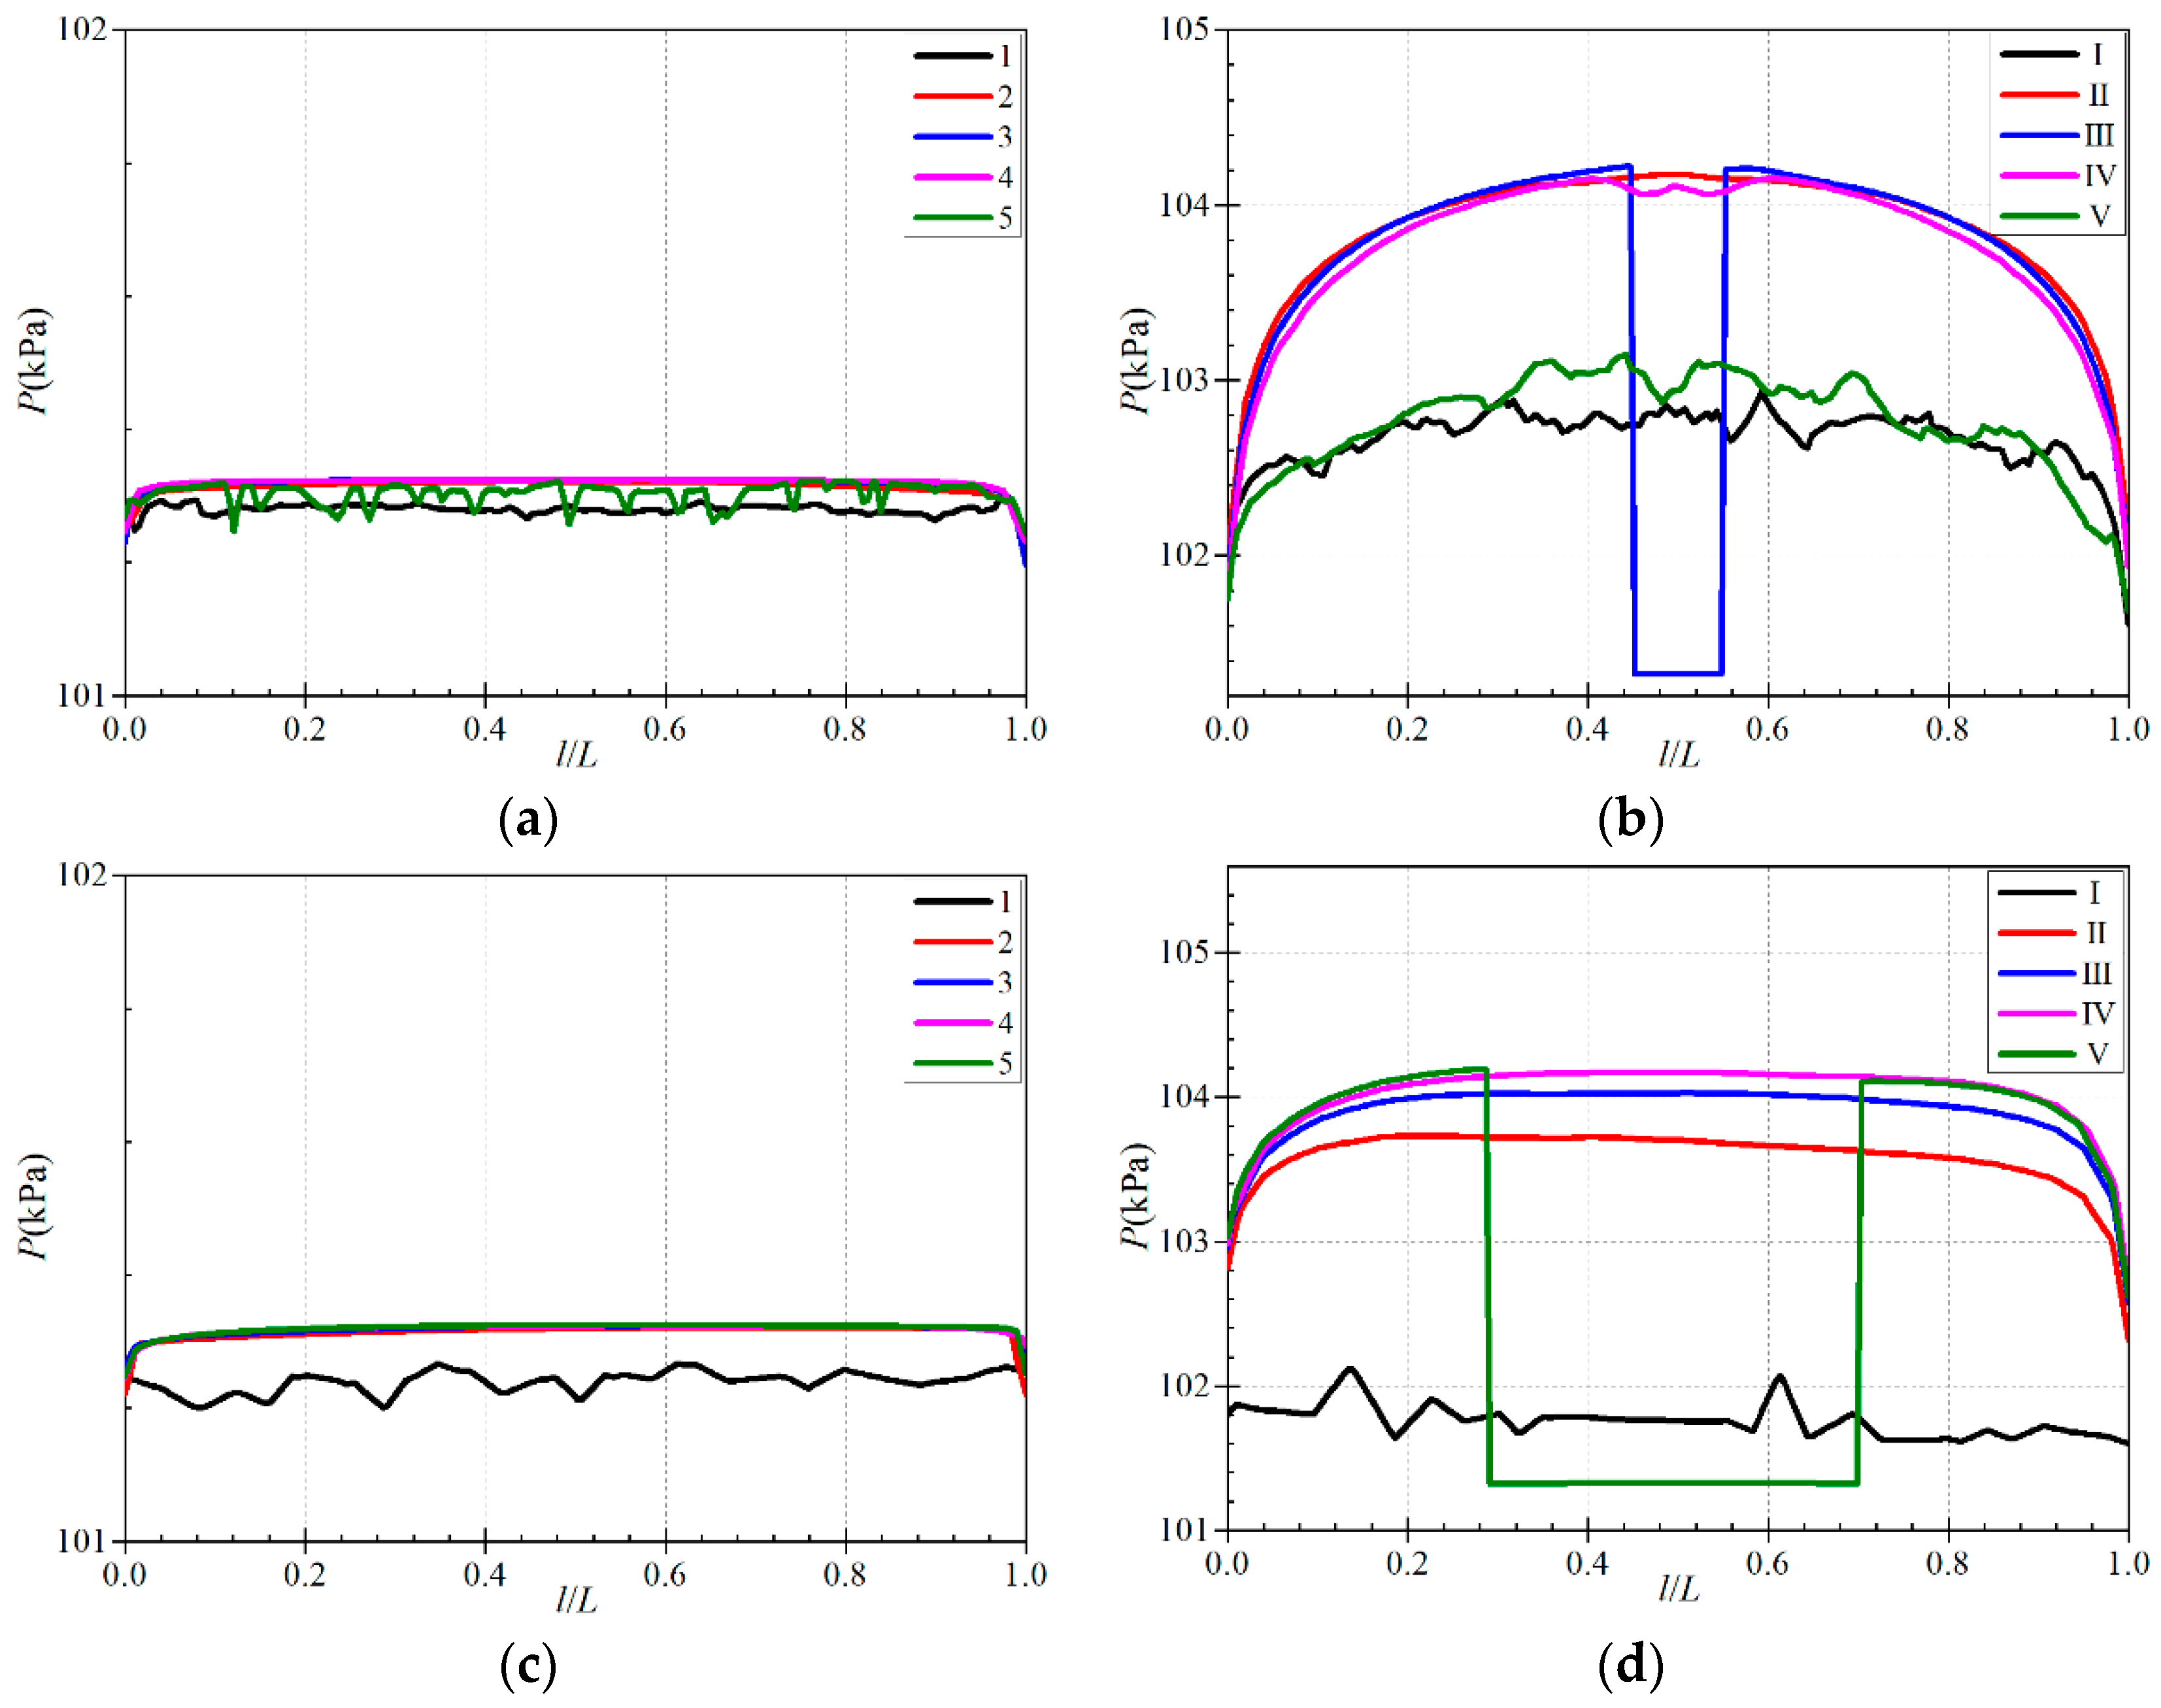
The pressure variation curve of the online collection line in scheme A-4 is depicted in Figure 13. Observing the graphs, it can be seen that the pressure on the windward side is mostly between 101.4 and 104 kPa, while, on the leeward side, it is mostly between 101.2 and 101.4 kPa. This indicates that the pressure on the windward side of the solar panel is significantly higher than that on the leeward side, with a maximum difference of 2.9952 kPa.
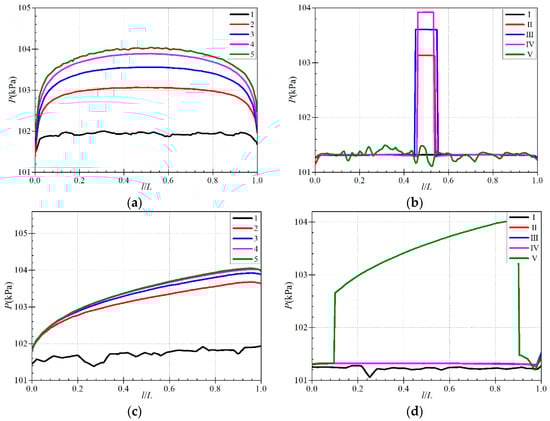
Figure 13.
The pressure variation curve on the collection line in calculation scheme A-4. (a) Front of the solar panel: horizontal lines 1 to 5; (b) Back of the solar panel: horizontal lines Ⅰ to Ⅴ; (c) Front of the solar panel: vertical lines 1 to 5; (d) Back of the solar panel: vertical lines Ⅰ to Ⅴ.
In Figure 13a, the pressure variation along the transverse collecting lines on the front face of the solar photovoltaic panel is presented. It is observed that the pressure at the top of the panel is relatively low, averaging 101.92 kPa, while it is higher at the bottom, averaging 103.75 kPa. Additionally, the pressure at the sides of the solar photovoltaic panel is relatively lower, possibly due to the flow conditions around the panel edges. Overall, there is a gradual decrease in pressure from the bottom to the top of the panel, likely influenced by the forces acting on the solar photovoltaic panel and aerodynamic effects.
In Figure 13c, the pressure variation along the vertical collecting lines on the front face of the solar photovoltaic panel is depicted. The pressure changes on lines 2 to 5 are consistent, indicating a gradual increase in pressure from the top to the bottom of the panel. However, the pressure variation on line 1 is irregular, likely due to its position near the panel’s edge where there may be airflow disturbances such as vortices, leading to unstable pressure changes.
In Figure 13b,d, the pressure values among the pressure curves are relatively consistent and low, indicating a relatively uniform and stable pressure distribution on the solar photovoltaic panel. This stable pressure distribution helps reduce material fatigue and damage risks, thereby extending the lifespan of the solar photovoltaic panel.
Consequently, analyzing the pressure variation along the transverse collection lines on the front side of the solar photovoltaic panel is able to offer an understanding of the panel’s stress distribution, facilitating the implementation of suitable measures to optimize the design and utilization of the solar photovoltaic panel, thereby enhancing its performance and dependability.
The pressure variation curve on the collection line in calculation scheme B-1 is depicted in Figure 14. Observing the graphs, it can be seen that, on the lee side, the pressure is mostly between 100 and 100.6 kPa, while, on the windward side, the pressure is mostly between 100 and 103.4 kPa. This indicates that the pressure on the windward side of the solar panel is significantly higher than on the lee side, with a maximum difference of 3.4092 kPa.
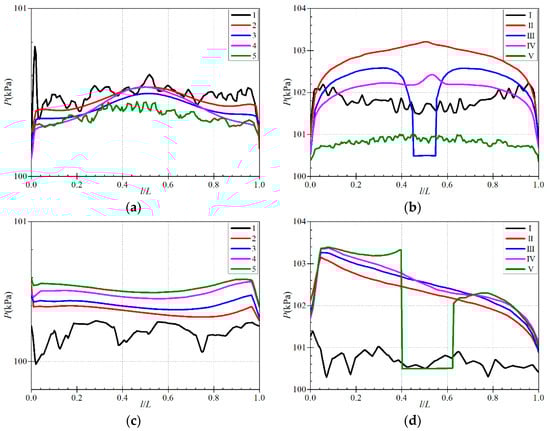
Figure 14.
The pressure variation curve on the collection line in calculation scheme B-1. (a) Front of the solar panel: horizontal lines 1 to 5; (b) Back of the solar panel: horizontal lines Ⅰ to Ⅴ; (c) Front of the solar panel: vertical lines 1 to 5; (d) Back of the solar panel: vertical lines Ⅰ to Ⅴ.
Figure 14a illustrates the pressure distribution along a transverse line on the front face of the board. From the graph, it can be observed that the pressure is relatively higher towards the center of the board, approximately 100.5 kPa, whereas it is lower along the sides of the board, around 100.2 kPa. Overall, the pressure variation across the board exhibits weak regularity.
Figure 14c exhibits the pressure variation along a vertical line on the front face of the board. Apart from significant fluctuations at the edges (line 1), the pressure remains quite uniform along other collection lines. Notably, the pressure increases with distance from the board’s edge and decreases towards the center, ranging from 100.2 kPa at the edge to 100.5 kPa at the center.
Figure 14b displays the pressure variation along a transverse line on the back face of the board. Similarly, there are notable fluctuations at the edges (line I), while lines II to V exhibit an interesting trend: higher pressure at the upper end of the board, reaching up to 103.2 kPa, and lower pressure at the lower end, down to 100.36 kPa.
Figure 14d demonstrates the pressure variation along a vertical line on the back face of the board. Like before, there are significant fluctuations at the edges (line I), but the pressure variation along other collection lines is relatively uniform. Notably, the pressure is lower towards the outer edges of the back face and higher towards the center, with higher pressure at the top compared to the bottom. Overall, the pressure on the back face decreases gradually from 103.2 kPa at the top to 101 kPa at the bottom.
To sum up, there is a clearly identifiable pattern in the pressure distribution throughout the board, ranging from the front to the back and from the top to the bottom. A higher pressure is noticed towards the center, while a lower pressure is observed towards the edges, which is likely to be affected by the board’s structure and external factors. The design and application of the board should take into consideration these characteristics of pressure distribution to guarantee its performance and stability.
The pressure variation curve of the online collection line in scheme B-2 is depicted in Figure 15. Observing the graphs, it can be seen that on the leeward side, the pressure mostly ranges from 100.2 to 100.8 kPa, while on the windward side, the pressure mostly ranges from 100 to 104 kPa. This indicates that the pressure on the windward side of the solar panel is significantly higher than that on the leeward side, with a maximum difference of 3.7061 kPa.
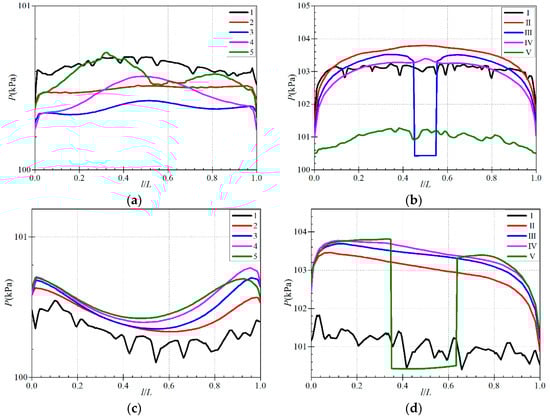
Figure 15.
The pressure variation curves on the collection lines in scheme B-2. (a) Front of the solar panel: horizontal lines 1 to 5; (b) Back of the solar panel: horizontal lines Ⅰ to Ⅴ; (c) Front of the solar panel: vertical lines 1 to 5; (d) Back of the solar panel: vertical lines Ⅰ to Ⅴ.
In Figure 15a, the pressure variation along the transverse acquisition lines on the front surface of the panel is depicted. The pressure fluctuations appear highly chaotic, indicating the presence of significant vortices at this location. It is noteworthy that these vortices result in relatively low pressure at the location, ranging only between 100.2 kPa and 100.8 kPa. This implies a lighter wind load on the solar panel surface at this point, although wind instability may also be a factor.
Figure 15c illustrates the pressure variation along the vertical acquisition lines on the front surface of the panel. Two distinct vortices can be observed, with one vortex centered around relative position 0.5 and another around relative position 0.9. This suggests a complex and variable wind field on the front surface of the solar panel, with multiple rotating flow structures significantly influencing the pressure distribution.
Figure 15b displays the pressure variation along the transverse acquisition lines on the back surface of the panel. Due to line I being located at the edge of the panel, pressure fluctuations are more erratic. However, from line II to line V, it can be observed that the pressure is higher towards the top end of the panel, averaging 103.43 kPa, while it is lower towards the bottom end, averaging only 100.97 kPa. This indicates a noticeable pressure gradient on the back surface of the panel, possibly due to local wind speed variations caused by the panel’s contact with the ground.
Figure 15d presents the pressure variation along the vertical acquisition lines on the back surface of the panel. Apart from the erratic pressure changes at line I near the edge of the panel, pressure variations along the other lines are relatively uniform. It is noteworthy that the pressure is lower towards the outer side of the back surface, at only 101.04 kPa, while towards the middle and upper side, it reaches 103.81 kPa and 103.6 kPa, respectively, with relatively lower pressure towards the lower side averaging 101 kPa. This indicates significant spatial differences in the wind load on the back surface of the panel, which are related to the panel’s shape and surrounding environment.
Finally, it is evident that there are notable disparities in the wind loads endured by the solar panel in different areas, which are closely associated with the panel’s configuration, the surrounding environment, and the intricacy of the wind field. Hence, in the design of solar energy systems, it is of utmost importance to take into account the panel structure and the characteristics of the wind field in a comprehensive manner to guarantee the stability and functionality of the system.
The pressure variation curves of the online data collection in scheme B-3 are depicted in Figure 16. Observing the graphs, it can be seen that the pressure on the leeward side is mostly between 100.2 and 100.4 kPa, while the pressure on the windward side is mostly between 101.6 and 104.4 kPa. This indicates that the pressure on the windward side of the solar panel is significantly higher than that on the leeward side, with a maximum difference of 3.0267 kPa.
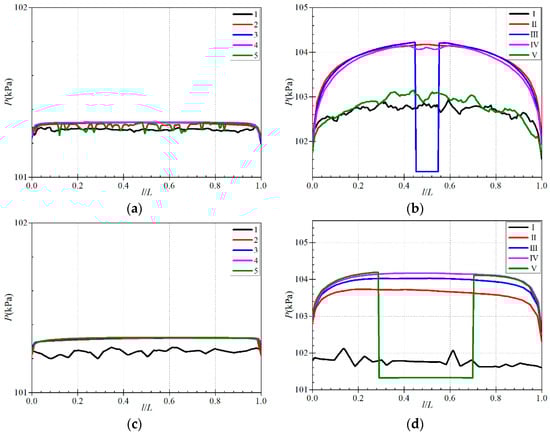
Figure 16.
The pressure variation curve on the data collection line in calculation scheme B-3. (a) Front of the solar panel: horizontal lines 1 to 5; (b) Back of the solar panel: horizontal lines Ⅰ to Ⅴ; (c) Front of the solar panel: vertical lines 1 to 5; (d) Back of the solar panel: vertical lines Ⅰ to Ⅴ.
Figure 16a reveals the pressure variation along the horizontal collection lines on the front side of the solar panel. The results indicate minimal pressure differences between the collection lines, with an overall low pressure averaging 101.31 kPa. This suggests a fairly uniform distribution of wind-induced pressure on the front side.
Figure 16c illustrates the pressure variation along the vertical collection lines on the front side of the solar panel. It is worth noting that the edge of the panel at collection line 1 is affected by swirling winds, resulting in lower external pressure averaging 101.24 kPa. However, minimal pressure differences are observed on other collection lines, with an overall average pressure of 101.32 kPa. This indicates a relatively uniform distribution of wind-induced pressure on the front side, albeit with some pressure reduction in the edge area.
Figure 16b displays the pressure variation along the horizontal collection lines on the back side of the solar panel. The results show that collection lines I and V, located at the edge of the panel, are affected by swirling winds, resulting in lower average pressures of 102.67 kPa and 102.76 kPa, respectively. Conversely, lines II to IV exhibit relatively higher pressures, averaging 103.80 kPa, indicating higher pressures in the central region of the back side compared to the front side.
Figure 16d illustrates the pressure variation along the vertical collection lines on the back side of the solar panel. The results show that line I at the edge of the panel experiences lower and unstable pressure, averaging only 101.76 kPa. Pressure variations on other collection lines are relatively uniform and higher, with lower pressure near the outer edge of the back side, averaging 103.56 kPa, and higher pressure in the central position, reaching a maximum of 104.19 kPa.
When exposed to wind loads, there exist notable differences in the pressure distribution between the front and rear sides of the solar panel. The front side undergoes relatively even pressure, whereas the central area of the rear side undergoes higher pressure, and the edge region undergoes pressure reduction as a result of swirling winds. These discoveries are of great significance for the design and optimization of the performance of the solar panel.
In scheme B-4, the pressure variation curve on the collection line is depicted in Figure 17. Observing the graphs, it can be seen that, on the leeward side, the pressure mostly ranges from 100.2 to 100.4 kPa, while, on the windward side, the pressure mostly ranges from 101.6 to 104.4 kPa. This indicates that the pressure on the windward side of the solar panel is significantly higher than that on the leeward side, with a maximum difference of 3.0893 kPa.
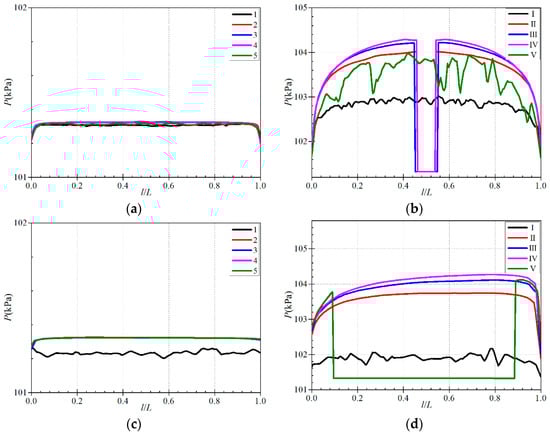
Figure 17.
The pressure variation curve on the collection line in scheme B-4. (a) Front of the solar panel: horizontal lines 1 to 5; (b) Back of the solar panel: horizontal lines Ⅰ to Ⅴ; (c) Front of the solar panel: vertical lines 1 to 5; (d) Back of the solar panel: vertical lines Ⅰ to Ⅴ.
Figure 17a exhibits the pressure variation along the transverse collection lines on the front side of the panel. It is observed that there is minimal pressure difference between the collection lines, with an average pressure of 101.32 kPa, indicating good uniformity of wind distribution across the transverse direction of the panel’s front side.
Figure 17c presents the pressure variation along the vertical collection lines on the front side of the panel. Despite line 1 being affected by wind eddies at the edge of the panel, resulting in a lower pressure of only 101.23 kPa, the pressure variation along the other collection lines is also minimal, with an average pressure of 101.32 kPa, suggesting overall stability in the wind loading characteristics along the vertical direction of the panel’s front side.
Regarding the transverse pressure variation on the back side of the panel, as depicted in Figure 17b, it is observed that lines I and V located at the panel’s edge are affected by wind eddies, resulting in lower and more erratic pressure. Specifically, the average pressure on line I is 102.81 kPa, while on line V it is 103.39 kPa. However, the pressure on lines II to IV is relatively higher, reaching up to 104.27 kPa, indicating higher pressure in the central region of the back side, possibly due to turbulence caused by the back side structure.
Figure 17d illustrates the pressure variation along the vertical collection lines on the back side of the panel. Similar to the front side, line I at the panel’s edge exhibits lower and more erratic pressure, with an average pressure of 101.89 kPa. However, pressure variation along other collection lines is more uniform and higher, especially in the central region of the back side, with the highest pressure on line II reaching approximately 103.74 kPa, and on line IV approximately 104.27 kPa.
By conducting in-depth analysis of the transverse and vertical pressure information on both the front and rear sides of the solar panel, it is clearly shown that the front side displays favorable wind uniformity, whereas the rear side is greatly influenced by wind vortices at the edges and demonstrates higher pressure in the central area. These discoveries have significant implications for the design and improvement of solar panels.
4. Conclusions
In the investigation of the wind loading characteristics of solar photovoltaic panels under extreme adverse weather conditions, a study based on the SST κ-ω turbulence model was employed. Through numerical calculations of three-dimensional, incompressible, viscous, and steady flow on the turbulent field of solar photovoltaic panels at four different installation angles and two extreme wind directions, the following conclusions were drawn:
Comparing experimental results, it was found that, at different installation angles, the pressure on the windward side is generally higher than on the leeward side. Additionally, it was observed that vortices tend to form on the leeward side of the solar photovoltaic panels, which can lead to fluctuating pressures on the panel surface, thereby increasing the risk of material fatigue damage. Particularly, at an installation angle of 60° with the solar photovoltaic panel facing the windward direction, and at installation angles of 30° and 45° with the panel facing the leeward direction, significant vortices were generated on the leeward side, resulting in fluctuating forces on the panel surface and increasing the risk of fatigue and damage to the materials, significantly affecting the solar photovoltaic panels. However, at an installation angle of 60° with the panel facing the leeward direction, and at an installation angle of 75°, the vortices generated on the leeward side of the solar photovoltaic panels were very small, with the centers of the vortices being higher than the top of the panels, thus having minimal impact on the pressure variations on the panels, resulting in minor effects on the solar photovoltaic panels. As the installation angle increases, the pressure on the windward side of the solar photovoltaic panels gradually increases. Therefore, preferred installation methods include the following: installing solar photovoltaic panels facing the wind at angles of 30° and 45°, where the panels experience lower forces on the windward side and smaller vortices on the leeward side; or installing panels facing the wind at a 60° angle, where the vortices on the leeward side are minimal and the forces on the windward side are relatively small compared to the 75° installation.
Based on the above research findings, it is recommended to use active solar panels in large solar farms. When considering factors such as solar irradiance angles and wind direction and force, it may be beneficial to consider installing solar photovoltaic panels facing the wind at angles of 30° and 45°, or at a 60° angle facing the leeward direction, to minimize the impact of wind loading on the solar photovoltaic panels. Future research could further explore the stability and efficiency of solar photovoltaic panels under different installation structures to enhance the overall performance and sustainability of solar farms.
Author Contributions
Conceptualization, Y.-L.Z.; Methodology, X.-W.X.; Software, H.-F.H.; Investigation, H.-B.J. and Y.-J.Z. All authors have read and agreed to the published version of the manuscript.
Funding
The research was funded by the Science and Technology Project of Quzhou (Grant No. 2023K256) and the Zhejiang Provincial Natural Science Foundation of China (Grant No. LZY21E050001).
Data Availability Statement
The data used to support the findings of this study are available from the corresponding author upon reasonable request.
Conflicts of Interest
The authors declare no conflict of interest.
References
- Schellenberg, A.; Maffei, J.; Telleen, K.; Ward, R. Structural analysis and application of wind loads to solar arrays. J. Wind Eng. Ind. Aerodyn. 2013, 123, 261–272. [Google Scholar] [CrossRef]
- Etyemezian, V.; Nikolich, G.; Gillies, J.A. Mean flow through utility scale solar facilities and preliminary insights on dust impacts. J. Wind Eng. Ind. Aerodyn. 2017, 162, 45–56. [Google Scholar] [CrossRef]
- Aly, A.M. On the evaluation of wind loads on solar panels: The scale issue. Sol. Energy 2016, 135, 423–434. [Google Scholar] [CrossRef]
- Hsu, S.-T.; Wu, T.-C. Simulated Wind Action on Photovoltaic Module by Non–uniform Dynamic Mechanical Load and Mean Extended Wind Load. Energy Procedia 2017, 130, 94–101. [Google Scholar] [CrossRef]
- Alrawashdeh, H.; Stathopoulos, T. Wind loads on solar panels mounted on flat roofs: Effect of geometric scale. J. Wind Eng. Ind. Aerodyn. 2020, 206, 104339. [Google Scholar] [CrossRef]
- Aly, A.M.; Clarke, J. Wind design of solar panels for resilient and green communities: CFD with machine learning. Sustain. Cities Soc. 2023, 94, 104529. [Google Scholar] [CrossRef]
- Browne, M.T.L.; Taylor, Z.J.; Li, S.; Gamble, S. A wind load design method for ground–mounted multi–row solar arrays based on a compilation of wind tunnel experiments. J. Wind Eng. Ind. Aerodyn. 2020, 205, 104294. [Google Scholar] [CrossRef]
- Wang, J.; Van Phuc, P.; Yang, Q.; Tamura, Y. LES study of wind pressure and flow characteristics of flat–roof–mounted solar arrays. J. Wind Eng. Ind. Aerodyn. 2020, 198, 104096. [Google Scholar] [CrossRef]
- Gong, B.; Wang, Z.; Li, Z.; Zhang, J.; Fu, X. Field measurements of boundary layer wind characteristics and wind loads of a parabolic trough solar collector. Sol. Energy 2012, 86, 1880–1898. [Google Scholar] [CrossRef]
- Cao, J.; Yoshida, A.; Saha, P.K.; Tamura, Y. Wind loading characteristics of solar arrays mounted on flat roofs. J. Wind Eng. Ind. Aerodyn. 2013, 123, 214–225. [Google Scholar] [CrossRef]
- Tansel, B.; Varala, P.K.; Londono, V. Solar energy harvesting at closed landfills: Energy yield and wind loads on solar panels on top and side slopes. Sustain. Cities Soc. 2013, 8, 42–47. [Google Scholar] [CrossRef]
- Jubayer, C.M.; Hangan, H. Numerical simulation of wind effects on a stand–alone ground mounted photovoltaic (PV) system. J. Wind Eng. Ind. Aerodyn. 2014, 134, 56–64. [Google Scholar] [CrossRef]
- Stenabaugh, S.E.; Iida, Y.; Kopp, G.A.; Karava, P. Wind loads on photovoltaic arrays mounted parallel to sloped roofs on low–rise buildings. J. Wind Eng. Ind. Aerodyn. 2015, 139, 16–26. [Google Scholar] [CrossRef]
- Abiola-Ogedengbe, A.; Hangan, H.; Siddiqui, K. Experimental investigation of wind effects on a standalone photovoltaic (PV) module. Renew. Energy 2015, 78, 657–665. [Google Scholar] [CrossRef]
- Jubayer, C.M.; Hangan, H. A numerical approach to the investigation of wind loading on an array of ground mounted solar photovoltaic (PV) panels. J. Wind Eng. Ind. Aerodyn. 2016, 153, 60–70. [Google Scholar] [CrossRef]
- Naeiji, A.; Raji, F.; Zisis, I. Wind loads on residential scale rooftop photovoltaic panels. J. Wind Eng. Ind. Aerodyn. 2017, 168, 228–246. [Google Scholar] [CrossRef]
- Vasel, A.; Iakovidis, F. The effect of wind direction on the performance of solar PV plants. Energy Convers. Manag. 2017, 153, 455–461. [Google Scholar] [CrossRef]
- Reina, G.P.; De Stefano, G. Computational evaluation of wind loads on sun–tracking ground–mounted photovoltaic panel arrays. J. Wind Eng. Ind. Aerodyn. 2017, 170, 283–293. [Google Scholar] [CrossRef]
- Wang, J.; Yang, Q.; Van Phuc, P.; Tamura, Y. Characteristics of conical vortices and their effects on wind pressures on flat–roof–mounted solar arrays by LES. J. Wind Eng. Ind. Aerodyn. 2020, 200, 104146. [Google Scholar] [CrossRef]
- Mignone, A.; Inghirami, G.; Rubini, F.; Cazzaniga, R.; Cicu, M.; Rosa-Clot, M. Numerical simulations of wind–loaded floating solar panels. Sol. Energy 2021, 219, 42–49. [Google Scholar] [CrossRef]
- Yemenici, O.; Aksoy, M.O. An experimental and numerical study of wind effects on a ground–mounted solar panel at different panel tilt angles and wind directions. J. Wind Eng. Ind. Aerodyn. 2021, 213, 104630. [Google Scholar] [CrossRef]
- Choi, S.M.; Park, C.-D.; Cho, S.-H.; Lim, B.-J. Effects of wind loads on the solar panel array of a floating photovoltaic system—Experimental study and economic analysis. Energy 2022, 256, 124649. [Google Scholar] [CrossRef]
- Peng, H.Y.; Song, S.S.; Liu, H.J.; Dai, S.F.; Zhang, F.L. Investigation of wind loading characteristics of roof–mounted solar panels on tall buildings. Sustain. Energy Technol. Assess. 2022, 54, 102800. [Google Scholar] [CrossRef]
- Dai, S.F.; Liu, H.J.; Yang, J.H.; Peng, H.Y. Wind loads on roof–mounted isolated solar panels of tall buildings through wind tunnel testing. Sol. Energy 2022, 231, 607–622. [Google Scholar] [CrossRef]
- Khan, A.K.; Shah, T.R.; Khosa, A.A.; Ali, H.M. Evaluation of wind load effects on solar panel support frame: A numerical study. Eng. Anal. Bound. Elem. 2023, 153, 88–101. [Google Scholar] [CrossRef]
- Sun, J.; He, Y.; Li, X.; Lu, Z.; Yang, X. CFD simulations for layout optimal design for ground–mounted photovoltaic panel arrays. J. Wind Eng. Ind. Aerodyn. 2023, 242, 105558. [Google Scholar] [CrossRef]
- Peng, H.Y.; Dai, S.F.; Liu, H.J. Wind loading characteristics and roof zoning of solar arrays mounted on flat–roofed tall buildings. J. Build. Eng. 2023, 66, 105823. [Google Scholar] [CrossRef]
- Alrawashdeh, H.; Stathopoulos, T. Wind loading of rooftop PV panels cover plate: A codification–oriented study. J. Wind Eng. Ind. Aerodyn. 2023, 240, 105489. [Google Scholar] [CrossRef]
- Ahmed, M.S.; Karal, R.; Das, B.K.; Das, A. Experimental investigation of cooling, wind velocity, and dust deposition effects on solar PV performance in a tropical climate in Bangladesh. Case Stud. Therm. Eng. 2023, 50, 103409. [Google Scholar] [CrossRef]
- Ma, W.; Zhang, W.; Zhang, X.; Chen, W.; Tan, Q. Experimental investigations on the wind load interference effects of single–axis solar tracker arrays. Renew. Energy 2023, 202, 566–580. [Google Scholar] [CrossRef]
- Homlakorn, S.; Velmurugan, K.; Suksri, A.; Wongwuttanasatian, T. Comparative study for photovoltaic cooling using metal mesh inserted eutectic phase change material enclosure. Case Stud. Therm. Eng. 2023, 45, 103024. [Google Scholar] [CrossRef]
- Velmurugan, K.; Karthikeyan, V.; Kumarasamy, S.; Wongwuttanasatian, T.; Sa-ngiamsak, C. Thermal mapping of photovoltaic module cooling via radiation-based phase change material matrix: A case study of a large-scale solar farm in Thailand. J. Energy Storage 2022, 55, 105805. [Google Scholar] [CrossRef]
- Poongavanam, P.; Chand, A.A.; Tai, V.B.; Gupta, Y.M.; Kuppusamy, M.; Dhanraj, J.A.; Velmurugan, K.; Rajagopal, R.; Ramachandran, T.; Prasad, K.A.; et al. Annual Thermal Management of the Photovoltaic Module to Enhance Electrical Power and Efficiency Using Heat Batteries. Energies 2023, 16, 4049. [Google Scholar] [CrossRef]
- Velmurugan, K.; Karthikeyan, V.; Sharma, K.; Korukonda, T.B.; Kannan, V.; Balasubramanian, D.; Wongwuttanasatian, T. Contactless phase change material based photovoltaic module cooling: A statistical approach by clustering and correlation algorithm. J. Energy Storage 2022, 53, 105139. [Google Scholar] [CrossRef]
- Velmurugan, K.; Elavarasan, R.M.; De, P.V.; Karthikeyan, V.; Korukonda, T.B.; Dhanraj, J.A.; Emsaeng, K.; Chowdhury, M.S.; Techato, K.; El Khier, B.S.A.; et al. A Review of Heat Batteries Based PV Module Cooling—Case Studies on Performance Enhancement of Large-Scale Solar PV System. Sustainability 2022, 14, 1963. [Google Scholar] [CrossRef]
- Han, J.-W.; Zhu, W.-Y.; Ji, Z.-T. Comparison of veracity and application of different CFD turbulence models for refrigerated transport. Artif. Intell. Agric. 2019, 3, 11–17. [Google Scholar]
- Tanaka, K.; Sato, I.; Utsunomiya, T.; Kakuya, H. Validation of dynamic response of a 2-MW hybrid-spar floating wind turbine during typhoon using full-scale field data. Ocean. Eng. 2020, 218, 108262. [Google Scholar] [CrossRef]
- Van Quyen, N.; Duc, N.D. Vibration and nonlinear dynamic response of nanocomposite multi-layer solar panel resting on elastic foundations. Thin-Walled Struct. 2022, 177, 109412. [Google Scholar] [CrossRef]
- Dehdarinejad, E.; Bayareh, M. Analysis of the vortical flow in a cyclone using four vortex identification methods. Powder Technol. 2023, 428, 118897. [Google Scholar] [CrossRef]


Disclaimer/Publisher’s Note: The statements, opinions and data contained in all publications are solely those of the individual author(s) and contributor(s) and not of MDPI and/or the editor(s). MDPI and/or the editor(s) disclaim responsibility for any injury to people or property resulting from any ideas, methods, instructions or products referred to in the content. |
© 2024 by the authors. Licensee MDPI, Basel, Switzerland. This article is an open access article distributed under the terms and conditions of the Creative Commons Attribution (CC BY) license (https://creativecommons.org/licenses/by/4.0/).