Article

Oil Removal Technology for Water Injection in Low-Permeability Reservoirs: A Micro-Vortex Flow Approach

1
PetroChina Planning & Engineering Institute, Beijing 100083, China
2
School of Environment & Energy Engineering, Beijing University of Civil Engineering and Architecture, Beijing 100032, China
3
PetroChina Jidong Oilfield Company, Tangshan 063004, China
4
Sinochem Holdings Corporation Ltd., Beijing 100081, China
*
Author to whom correspondence should be addressed.
Processes 2024, 12(6), 1092; https://doi.org/10.3390/pr12061092
Submission received: 7 March 2024 / Revised: 30 April 2024 / Accepted: 1 May 2024 / Published: 27 May 2024
(This article belongs to the Special Issue Advances in Enhancing Unconventional Oil/Gas Recovery)

Abstract

:
Gravity settling is a widely employed technology that removes oil from produced water in oilfields. However, with the transition of reservoir development to low-permeability reservoirs, conventional produced water settling tanks face limitations in the treatment efficiency and coagulant dosage. This study presents an innovative approach that optimizes sedimentation tank structures and integrates micro-vortex flow technology to enhance coagulation and flocculation. Through chemical dosage experiments, comparative experiments, and long-term observation, the micro-vortex flow reactor demonstrates a 9.4% increase in oil removal efficiency while reducing the coagulant dosage by 30.0%. The MOR equipment achieved a 20.5% higher oil removal efficiency than conventional methods while maintaining effluent oil and suspended solids below 20 mg/L. The long-term observation experiment of MOR equipment further highlights oil removal efficiency of 94.2% and the micro-vortex reactor’s excellent anti-pollution performance. The MOR equipment significantly reduces the land occupancy area by over 50% compared to conventional methods, thanks to the implementation of micro-vortex flow technology that effectively addresses the limitations associated with traditional settling tanks. This study contributes to advancing efficient and sustainable practices in waterflooding reservoirs, particularly for meeting stringent standards of water injection in low-permeability oilfields.

1. Introduction

In the petroleum and natural gas industry, the largest quantity of a byproduct resulting from oil and gas extraction is produced water, primarily generated through two processes. Firstly, a mixture of formation water and crude oil is produced in the extraction process, typically sourced from underground water surrounding oil wells. Secondly, water injection into reservoirs to maintain pressure, known as waterflooding, results in the injected water eventually becoming part of the produced water or wastewater [1]. After crude oil collection and initial processing, the water separated from the oil–water mixture is the target of oilfield water treatment. Its properties are influenced by factors such as the geological conditions of the crude oil, the quality of injected water, and crude oil gathering and transportation. Produced water mainly contains the following substances [2,3]:
  • Suspended Solids: Particle diameters range from 1 to 100 μm, with solids larger than 100 μm easily removed by settling. Suspended solids include various types of mud and sand (clay, silt, fine sand, etc.), corrosion products and scale (Fe2O3, CaO, FeS, CaCO3, etc.), bacteria (sulfate-reducing bacteria, saprophytic bacteria, etc.), organic matter, etc.
  • Colloidal Particles: Particle sizes range from 0.001 to 1 μm, with a composition similar to suspended solids but smaller in size and harder to separate.
  • Floating Oil and Dispersed Oil: Oil droplets larger than 100 μm are dispersed oil, while those between 10 and 100 μm are floating oil, both of which can be removed through natural settling over time or simple physical processes.
  • Emulsified Oil: Oil droplets have a diameter of 0.001 to 10 μm, and emulsified oil is difficult to remove through natural settling and requires chemical methods, air flotation, etc., making it a focal point in water treatment.
  • Dissolved Substances: Primarily includes dissolved inorganic salts smaller than 0.001 μm and gases dissolved in the 0. 3 to 0.5 nm range.
Produced water poses a detrimental impact on the environment due to its complex composition and costly disposal methods [4]. Produced water injection is a cost-effective approach for disposing of it. In numerous onshore wells, the practice of waterflooding to improve recovery is widely employed and considered as the preferred option [5,6]. Typically, the primary control parameters’ concentration for water injection includes oil, suspended solids, and bacteria. Failure to meet the designated water quality standards during water injection activities can damage the subterranean reservoir and result in a persistent reduction in its permeability, thereby impacting the productivity of the oilfield [6,7,8]. It is noteworthy that, unlike discharging produced water into the surface environment, although produced water typically has high Total Dissolved Solids (TDSs), which equal 50,000 to 250,000 mg/L, there are no requirements for TDS levels when treating and re-injecting formation water. This is because water injection with reduced TDS back into the underground formations may induce water-sensitive reactions [9], causing clay swelling, which could lead to formation blockages instead.
Reinforcing the continuous exploration and development of low-permeability and ultra-low-permeability oil reservoirs is crucial to enhancing its crude oil reserves and production in the future [10]; water drive development is still an effective way to develop low-permeability reservoirs [11]. The importance of treating produced water continues to grow. In oilfields, cost-effective and operationally simple physical oil removal methods are commonly employed [12,13]. Various physical methods are employed in oilfields, and the main principles and challenges are as follows:
  • Natural oil removal method [14,15,16]: The proposed approach leverages the density disparity between oil and water to effectively separate a substantial quantity of floating oil. Although it requires extended hydraulic retention time and occupies significant space, it demonstrates strong resilience to variations in water volume and quality. However, it has limited effectiveness in separating dispersed and emulsified oils.
  • Inclined plates (tubes) technology [17,18]: Based on the principles of shallow pools, integrating inclined plates into the oil removal system increases the surface area for separation, reduces the separation elevation, extends the wetted perimeter of water flow, reduces the hydraulic radius of water flow, and stabilizes flow dynamics, thereby facilitating the segregation of oil and water. When combined with flocculants, the effectiveness is further improved.
  • Coalescence technology [19,20,21]: The produced water passes through coalescence fillers. As the water flows through the fillers, oil droplets collide and adhere to them, gradually increasing and hastening the separation of oil and water. The selection of filler material has a significant impact on the efficiency of oil removal. When water contains significant sediments and suspended solids, the fillers are prone to clogging, making equipment maintenance challenging.
  • Air flotation separation technology [22,23,24]: Employing dispersed micro-bubbles as a medium, this method facilitates the adsorption of suspended solids and oil droplets in water. Typically, it necessitates the concurrent utilization of flocculants for optimal efficacy. While proficient in eliminating oil and suspended solids, it demands stringent bubble size criteria. Otherwise, the treatment outcome may fall short of expectations.
  • Hydraulic cyclone technology [25,26,27]: Exploiting the density variance between oil and water, this approach employs cyclones or eddy currents to engender centrifugal force for oil–water segregation, which is an efficient oil removal technology. Nonetheless, its susceptibility to impact loads is inadequate, its capacity for suspended solids removal is moderate, it cannot separate emulsified oil, and treating recovery water from backwashing poses challenges.
According to the development of international low-permeability oil and gas reservoirs, low-permeability reservoirs can be divided into general low-permeability (K = 1.0 to 10.0 mD), special low-permeability (K = 0.5 to 1.0 mD), and ultra low-permeability (K = <0.5 mD) based on the permeability rate (K) [28]. Oilfield enterprises determine the parameters of the water injection index through core experiments or on-site statistical experiments [29]. Industry standards also provide recommended water injection index parameters based on permeability rates, as shown in Table 1.
The oil and suspended solids requirements of the water injection determine the depth of the oilfield-produced-water treatment process; the higher the water injection requirement, the more emulsified oil and colloids need to be removed. Low-permeability reservoirs usually have the problems of a poor water injection effect and low injection-production ratio. They are faced with the challenge that the water quality of injection is high, and the conventional process cannot meet the treatment demand [31].
For produced water with high emulsification levels and a high content of colloids, conventional physical methods alone may not be achieved through treatment. Typically, chemical methods need to be combined, with the most common approach being the addition of coagulants and flocculants [32]. These chemical agents compress the double electric layers of colloidal particles in water, reduce colloidal stability, and promote collisions between destabilized colloidal ions, forming larger flocs. During this process, oil droplets are also adsorbed, resulting in the effective removal of both oil and suspended solids. A coagulation sedimentation tank is widely used in oilfields. Compared to a natural settling tank, a central reaction barrel incorporates swirling or turbulent flow to uniformly mix coagulants or flocculants with produced water, forming large aggregates, as shown in Figure 1. The produced water coming out of the central reaction barrel undergoes the separation of oil and suspended solids in the settling zone. The selection of suitable chemicals and dosages depends on the emulsification level and water quality characteristics (cations, anions, salinity) and often requires chemical tests [33]. The central reaction barrel may not achieve sufficient chemical reaction intensity when facing highly emulsified produced water, resulting in uneven agent diffusion. Inadequate contact efficiency with oil droplets and suspended solids ultimately fails to meet the expected water quality standards for oil removal.
To meet the standards for water injection, a filtration process is typically implemented after physical or chemical oil removal treatments. The filtration process can involve the use of a filter made of one or a combination of porous materials such as walnut shells, quartz sand, anthracite coal, magnetite, and garnet [34,35]. Water passes through the filtration bed of porous granular materials, where impurities are trapped in the voids and adsorbed onto the filtration media, resulting in water purification. If the influent oil content before the filtration stage is high, a large amount of oil will gradually adsorb onto the filtration media, obstructing the pore channels and causing media fouling, a reduced filtration rate, and deterioration in effluent quality. Therefore, it is essential to use treated water or gas for backwashing to reduce media contamination. When the filtration pressure continues to rise until the filtration system fails, and backwashing cannot restore filtration performance, replacing the media becomes necessary [36]; common backwashing methods include (1) water washing alone at fluidization velocity; (2) air scouring followed by fluidized water washing; (3) combining simultaneous air scouring and sub-fluidized water washing [37]. The design values for influent oil and suspended solids in the filtration process need to be comprehensively considered based on the settings of the oil removal and filtration processes. The recommended influent standards for filtration processes given by the Petroleum Industry Standardization Technical Committee in the petroleum industry standard are oil ≤ 100 mg/L and suspended solids ≤ 50 mg/L [38]. If the effluent water quality requirements are not high or the oil removal section performs well, only one filtration stage may be required. Depending on actual operating conditions, two- or three-stage filters can also be set up. An effective oil removal process not only enables the filtration system to demonstrate its outstanding capability in removing suspended solids and ensuring water quality compliance but also reduces energy consumption and media replacement costs by minimizing backwashing [39]. Therefore, the effluent water quality from the oil removal section significantly influences the parameter settings (filtration stages, filtration rate, backwash frequency, etc.) and operational performance (effluent quality, energy consumption levels, etc.) of the filtration section. Membrane filters can also be used in the filtration process [40], but they require higher influent water quality, and the cost of membrane replacement after membrane fouling is relatively high [41]. Oilfield companies are cautious when applying membrane filters. However, membrane technology with strong anti-fouling performance has also been widely used in oilfields, such as ceramic membranes [42].
The oil removal process has a natural settling tank and a coagulation settling tank, and the filtration process has one or two filtration stages; this combination of produced water treatment processes is widely used in conventional oilfields, as shown in Figure 2. To meet more stringent water injection standards for low-permeability fields, the advancement in water treatment technology aims to achieve integration, high efficiency, and cost-effectiveness. Gravity separation is currently the most commonly employed method for treating produced water from oilfields due to its cost-effectiveness and simplicity [13]. The produced water is stored in a system consisting of two vertically settling tanks. After a retention time of 6 to 8 h, the upper layer of oil is skimmed off, and the water is discharged from the bottom of the tank. In cases of highly emulsified or high-pour-point oils, chemical agents like coagulants and flocculants are added to aid in the separation process. The dosage of these agents needs to be determined through experimentation [43]. These agents are mixed in a conventional coagulation tank using turbulent agitation. Their performance depends on their diffusion and contact effects within the tank. The performance of the agents depends on their diffusion and contact effects within the tank. However, the traditional process of using two large sedimentation tanks for oil removal has some shortcomings, such as a large footprint, prolonged retention time for oil–water separation, low efficiency of coagulant reactions, and insufficient removal efficiency of emulsified oil [44,45]. Yang has proposed a challenge in the Changqing Oilfield where the expected design water injection volume for water flooding development cannot be achieved due to the changing formation water absorption capacity [46]. Following the decrease in formation water absorption capacity, elevating the water injection pressure is a method to facilitate injecting a larger volume of water. Nonetheless, an increase in water injection pressure signifies that higher-power water injection pumps will necessitate more electricity consumption [11]. One of the crucial factors affecting the formation of water absorption capacity is the quality of the injected water [8,47]. These challenges underscore the significant demand for high-quality water injection in low-permeability oilfields.
To mitigate the drawbacks of the existing two-stage settling tank oil removal process, optimization can be pursued in two principles: (1) re-optimizing the design structure to incorporate both natural settling and coagulation sedimentation, thereby reducing the time wasted on inefficient natural settling and achieving improved efficiency and integration to buffer fluctuations in water quality and quantity; (2) improving the efficiency of contact between the coagulants and oil droplets, and achieving enhanced oil removal using a reduced amount of agents during the coagulation sedimentation stage.
Conventional physical and chemical water treatment methods have been widely utilized in the past due to their mature application and low operational costs. However, as water quality requirements become more stringent, the treatment efficiency and effectiveness of these methods may need to be further improved to meet the new standards. Consequently, recent research efforts have been focused on enhancing conventional technologies and integrating them with new techniques to develop more efficient water treatment technologies. For instance, El-Sayed et al. developed a new carbon thin film (ACTF) by hydrolyzing wood sawdust and treating the residue. They tested its effectiveness in removing oil from synthetic produced water. The ACTF showed high oil adsorption capacity, reaching a maximum of 700 mg of oil per g of ACTF at a bed height of 5 mm and flow rate of 0.5 mL/min. The Yoon–Nelson model accurately describes the breakthrough curve for oil adsorption. This study highlights the promising potential of ACTF as an efficient technique for removing oil from produced water [48]. El-Maghrabi focused on the use of mesoporous silica (MCM-41) to remove oil from produced water in the oil and gas industry. A continuous fixed-bed experiment was conducted to examine how the flow rate and bed height affect the breakthrough characteristics of the adsorption system. The results showed a maximum oil removal efficiency of 70.26% at a flow rate of 0.5 mL/min and a bed height of 1.5 mm. The Thomas model provided a good fit, indicating the suitability of MCM-41 as an effective adsorbent for oil removal [49]. Hollanda et al. conducted a study to characterize oilfield-produced water and evaluate photochemical systems and combined processes for its treatment, contributing to a deeper understanding of the properties and treatment options for oilfield-produced water [50]. In another study, Das et al. evaluated the application of various coagulants and their associated costs for treating oil- and gas-produced water. This evaluation helps identify the most efficient and cost-effective coagulant for water treatment [51]. Similarly, Khor et al. analyzed the performance, energy consumption, and cost of chemical and electrochemical coagulation for treating produced water, providing valuable insights into the feasibility and cost-effectiveness of various coagulation methods for oil- and gas-produced water treatment [52]. Al Hawli et al. developed a hybrid electro-coagulation/forward osmosis system to treat produced water, combining electrocoagulation and forward osmosis to enhance water treatment efficiency and effectiveness [53]. Additionally, Shah et al. proposed a novel settling tank for the treatment of produced water, utilizing computational fluid dynamics simulations and particle image velocimetry experiments. This innovative approach improves the settling process and enhances overall treatment performance [54]. Zeliff et al. investigated the combination of hydrocyclone separation with other established separation techniques for treating produced water, aiming to optimize the separation process and achieve improved water treatment outcomes [55]. Research has demonstrated significant progress in enhancing the efficiency of produced water treatment by improving existing technologies and incorporating new methods [35]. Nevertheless, the development of new chemical agents, the use of electrochemical technology, or the use of membrane technology [56] increases the cost of produced water treatment. It is more economical to improve the conventional physical processing technology, but the stability of the technology needs to be observed for a long time.
In response to the current inefficiency of physical oil removal methods in removing emulsified oil, the problem of incomplete chemical reactions in chemical oil removal methods, and the requirement for certain oil content in the influent for filtration processes, our research has revealed that micro-vortex flow technology is a promising technique that can alleviate the limitations of these traditional methods. A micro-vortex refers to a small-scale vortex or swirling motion that occurs in a fluid, such as water, at a miniature level. It is characterized by its compact size and typically forms in localized areas, often near orifices or other flow disturbances. Micro-vortex flow plays a crucial role in fluid dynamics, influencing processes like mixing, particle interaction, and energy transfer within the fluid [57]. Micro-vortex flow technology is a straightforward and efficient auxiliary method used in water treatment. It involves the utilization of small-scale vortices or swirling motions to enhance various processes during water treatment. When water passes through orifices, it generates a locally uniform and isotropic turbulence, leading to the formation of numerous vortices of different sizes. The larger vortices transfer energy to the smaller ones, resulting in the relative motion of particles and the experience of centrifugal inertial forces within the vortex flow layer; particles of a similar vortex scale collide with each other in the vortex flow layer [58]. It can be used in flocculation and sedimentation units to improve the efficiency of coagulation and sedimentation processes [59]. Ban et al.’s study proposed a novel microporous flocculation magnetic fluidized bed (MFMFB) reactor for treating low-concentration lead-polluted groundwater. The reactor promoted enhanced flocculation through microporous flocculation, anisotropy, micro-vortex, and effective energy consumption [60]. Wang designed a novel vortex flocculation reactor, featuring a column–cone–column structure and incorporating vortex generators to create micro-vortex flow and enhance flocculation efficiency [57]. Zhengong’s study found that micro-vortex coagulation plays a crucial role in vortex clarification technology. By using micro-vortex flow technology to modify standard clarification tanks, the treatment capacity of the vortex clarification tank has been enhanced [61]. Harnessing exceptional diffusion capabilities of micro-vortex flow not only facilitates the uniform dispersion and contact of coagulants but also promotes the coalescence of minute oil droplets into larger ones [62], thereby facilitating their removal. This dual effect of micro-vortex flow enhances the overall coagulation process and augments oil removal efficiency.
In this study, we have developed multifunctional oil removal (MOR) equipment that integrates regulation buffering, natural settling, chemical mixing, and coagulation sedimentation processes. Incorporating micro-vortex flow reactors aims to improve the efficiency of chemical mixing and coagulation/flocculation. Through experiments evaluating the enhancement effect of micro-vortex flow technology in MOR equipment, our objective is to streamline on-site processes while ensuring qualified inlet water quality for the filter process. Ultimately, our goal is to improve the quality of water injection in low-permeability oil reservoirs and minimize environmental impacts [63].

2. Materials and Methods

2.1. Chemicals

The chemical agents utilized in the experiment underwent laboratory screening at an early stage. Coagulant screening encompassed polymeric aluminum ferric sulfate, polymeric ferric sulfate, and polymeric aluminum chloride. Flocculant screening included cationic polyacrylamide (with degrees of ionization of 40, 50, 60, and 90) as well as anionic polyacrylamide. On-site water sample tests were conducted by the laboratory to select the coagulant and flocculant with optimal performance in removing oil and suspended solids as pilot-scale chemical agents (Table A1 and Table A2).
The chemicals employed in the pilot test consisted of a coagulant, specifically yellow powder-form poly-aluminum chloride produced by Gongyi Dongfang Purification Materials Factory with an active content of 26%. Each bag weighed 25 kg. The recommended dosage for its application in water treatment by chemical manufacturers ranges from 10 to 30 mg/L. Furthermore, a white powder-form flocculant was used, which was cationic polyacrylamide manufactured by Daqing Tenghui Limited Company. It had a cationic degree of 90 and an effective substance content of 99%. Each bag also weighed 25 kg. The recommended dosage for its application in water treatment by chemical manufacturers is between 0.1 and 1.0 mg/L.

2.2. Field Water

The pilot equipment was installed adjacent to the existing oil removal tanks at a union station in an oilfield, as shown in Figure 3. This union station receives water from multiple blocks, resulting in a complex composition and significant fluctuations in quantity. The incoming water exhibits varying levels of oil content, ranging from 60 to 300 mg/L, as well as suspended solids content ranging from 30 to 60 mg/L. After undergoing thorough oil removal and filtration processes, the treated water is primarily utilized for reinjection into low-permeability formations.

2.3. Experimental Equipment Design and Principles

2.3.1. Main Components of Equipment

The MOR equipment is designed based on conventional vertical settling tanks but with innovative modifications. It is divided into three interconnected chambers: the natural oil removal (NR) chamber, the chemical reaction (CR) chamber, and the coagulation sedimentation (CS) chamber. The design of the inlet and outlet components in each chamber has been optimized, incorporating trumpet-shaped inlets and outlets along with circular weirs. This design ensures uniform water distribution and minimizes the impact of water flow disturbances on treatment efficiency. Additionally, the equipment includes oil collection and sludge discharge components to prevent the accumulation of pollutants, such as oil and mud, during prolonged operation. The main components of this equipment are illustrated in Figure 4a: (1) the NR Chamber Inlet; (2) NR chamber outlet; (3) chemical-dosing device; (4) micro-vortex flow reactors (installed in CR chamber); (5) CS chamber distribution outlet; (6) inclined tube device; (7) NR chamber oil collection weir; (8) CS chamber oil collection pipe; and (9) CS chamber outlet.
The positional relationship between the chambers and the direction of water flow is depicted in Figure 4b. The retention time of the equipment is determined by calculating the unit area load; values as outlined in the national standards [64] were taken into consideration. Upon entering the MOR equipment, the incoming water undergoes a stabilization and settling process in the NR chamber. The unit area load ranges from 0.98 to 1.48 m3/m2·h (producing a water descent rate of 0.27 mm/s to 0.41 mm/s) with a hydraulic retention time of 2.0 to 2.5 h. Chemicals are added before the water enters the CR chamber, equipped with a double-layered barrel containing micro-vortex flow reactors. During the process, water flows upward from the inner layer, reaches the top, and then flows downward in the outer layer. The double-layered barrel design ensures prolonged contact time between the chemicals and the produced water. Furthermore, this process promotes the occurrence of micro-vortex flow. Within the CR chamber, diffusion, coagulation, and flocculation reactions are enhanced by the micro-vortex flow reactors, taking approximately 15 to 20 min. Finally, the treated effluent from the CR chamber flows into the CS chamber for sedimentation, where inclined tube device is installed. The hydraulic retention time within the CS chamber is approximately 1.5 to 2.0 h, and the unit area load ranges from 1.17 to 1.76 m3/m2·h (produced water descent rate of 0.33 mm/s to 0.49 mm/s). The equipment processing flow rate corresponding to the above parameters is 20 to 30 m3/h. The MOR equipment is designed to handle inlet water with oil content ≤ 1000 mg/L and suspended solids content ≤ 300 mg/L [64]. It is also equipped with a liquid-level control device, allowing direct entry of water into the filter section without the need for a buffer tank.

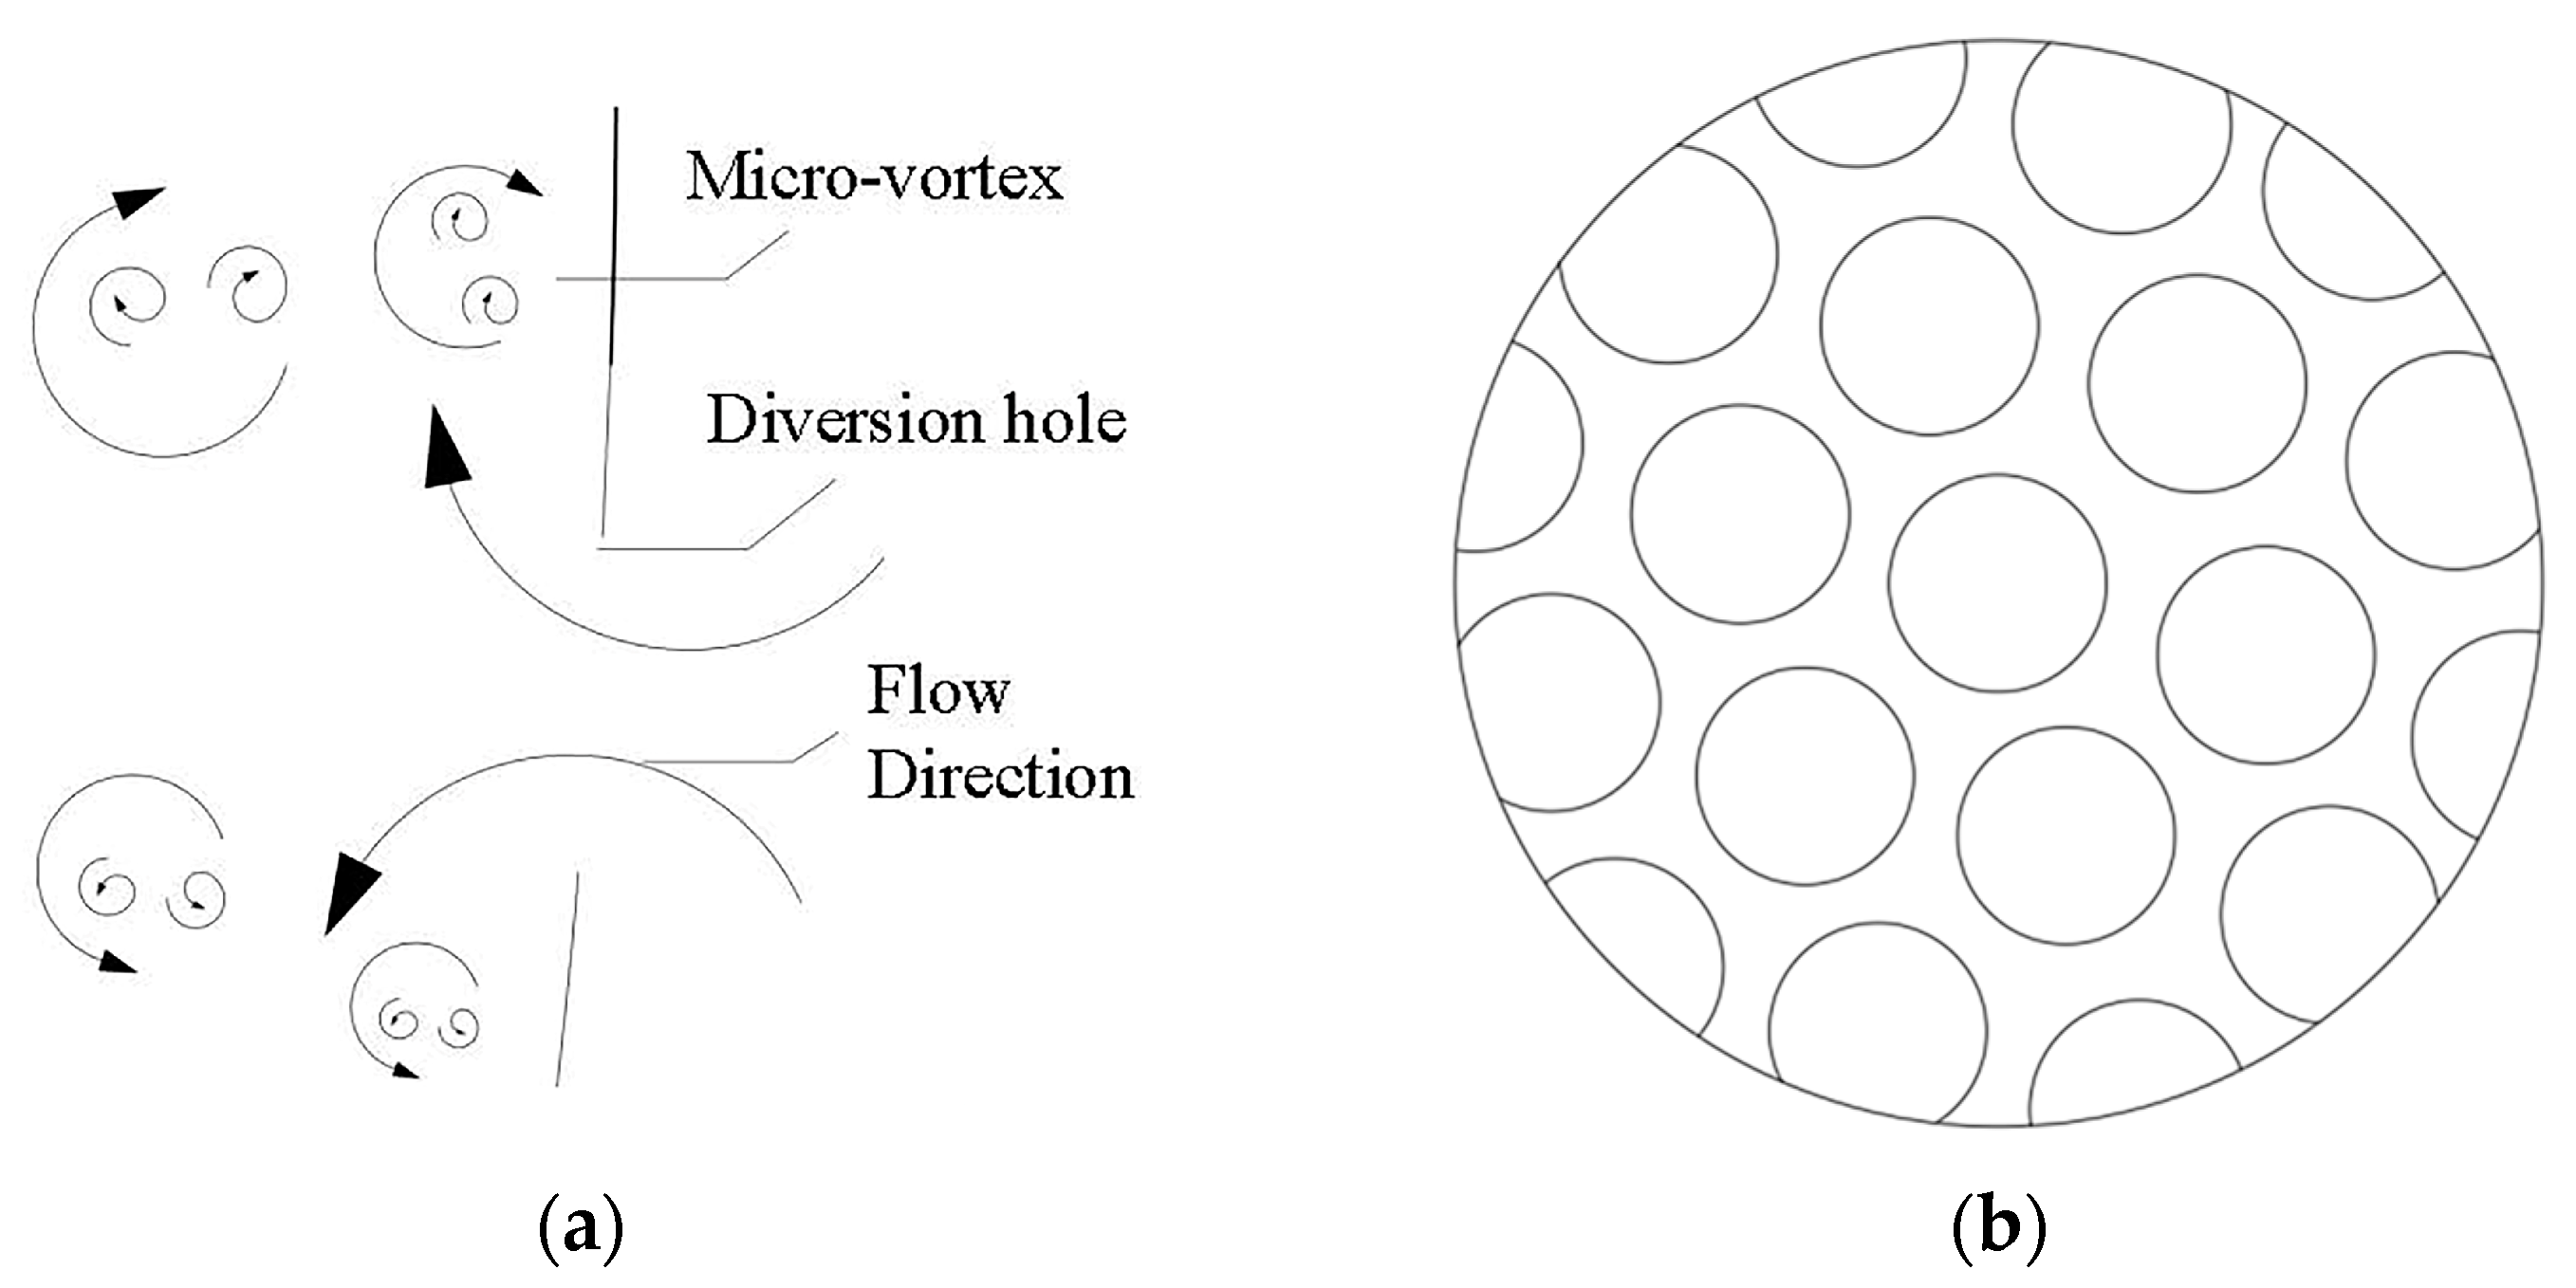
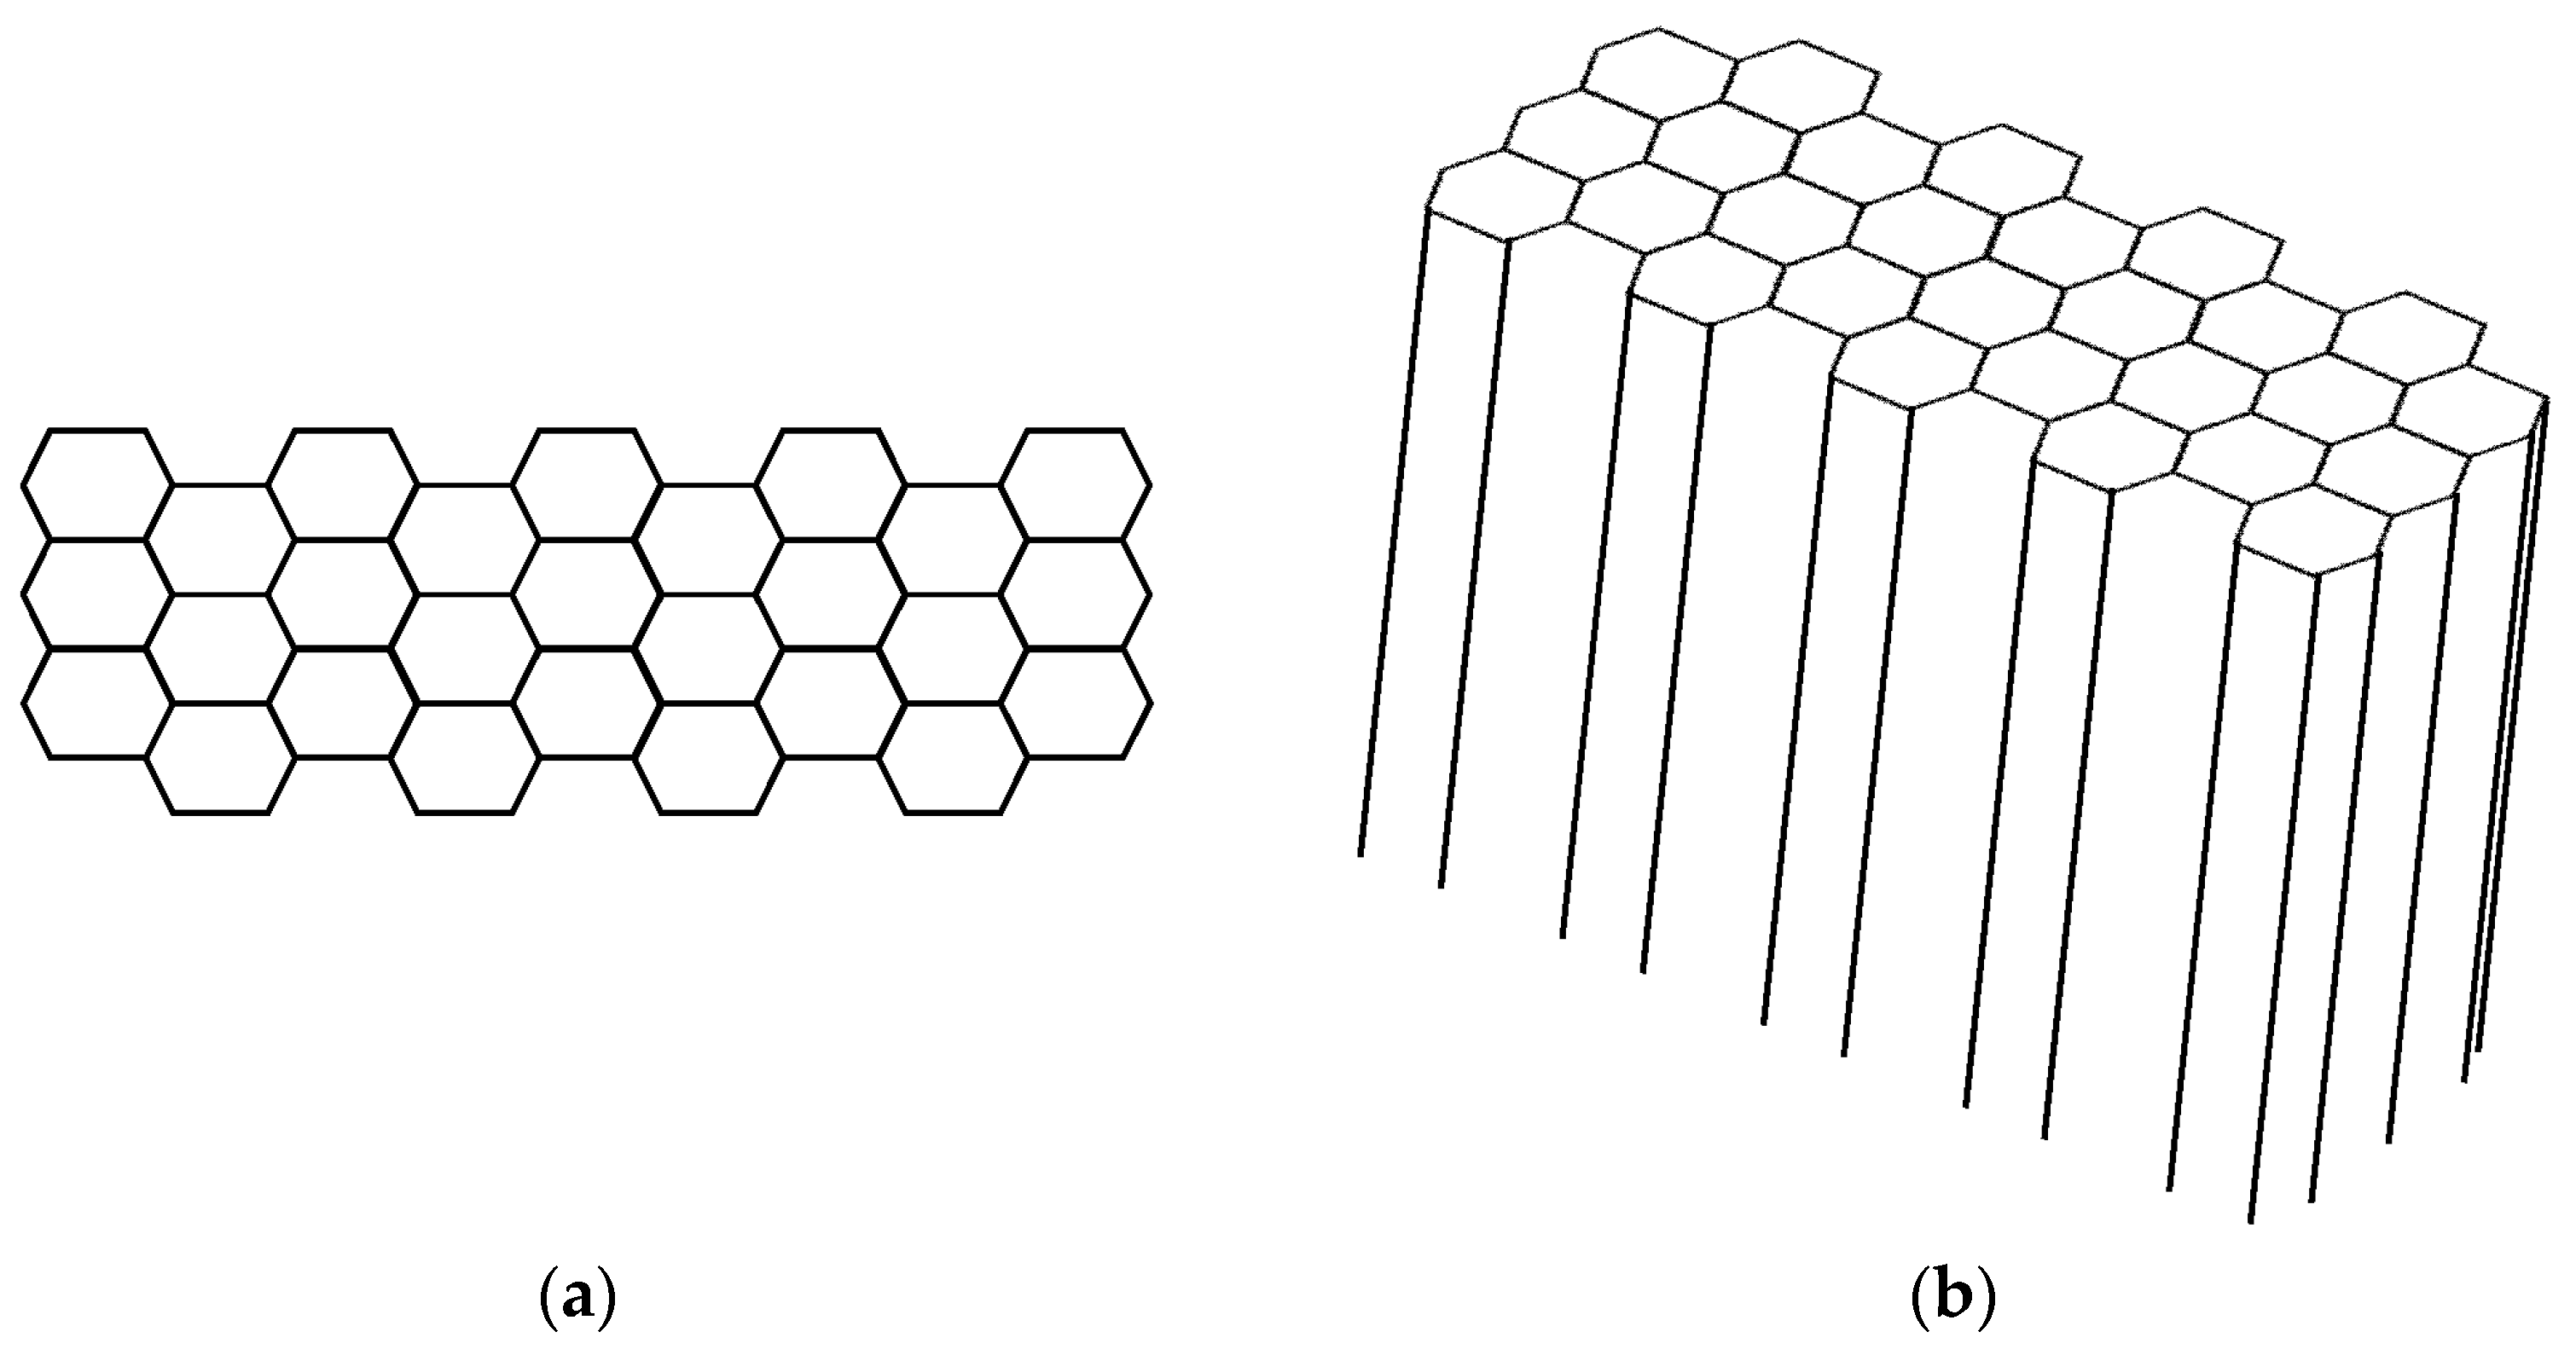
2.3.2. Micro-Vortex Flow Reactor

The micro-vortex flow reactors are essential for the CR chamber, where they play a crucial role in enhancing the coagulation process throughout the equipment. Micro-vortex flow pertains to the creation of localized, uniformly isotropic turbulence as water passes through the apertures of the micro-vortex flow reactors, as shown in Figure 5a. Consequently, the shape of the micro-vortex flow reactors may vary, encompassing polyhedral hollow spheres, pall rings, or saddle rings, among others. Pall rings and saddle rings have advantages such as high surface area and effective liquid distribution. However, they also have the following disadvantages: (1) There is a lack of rolling motion hinders the self-cleaning ability of pall rings and saddle rings, unlike spherical shapes. This can result in particle accumulation or fouling on the surface, reducing reactor efficiency over time. (2) The shape and structure of pall rings and saddle rings make them susceptible to contamination. Gaps or recessed areas allow for the accumulation of sediments, particles, or biofilms, which can impact water treatment quality and efficiency.
In this equipment, polyhedral hollow spheres made of ABS (Acrylonitrile Butadiene Styrene) have been selected for their ability to achieve a specific cleaning effect through the rolling friction between the spheres, thereby preventing blockage and fouling within the chamber. As shown in Figure 5b, several diversion holes of the same size are uniformly distributed on the spherical shell to realize the generation of water flow and a vortex. Our selection of the micro-vortex flow reactors and their specifications, including a diameter of 200 mm and diversion holes with a diameter of 30 mm, was informed by the research findings of other scholars [62,65] in the field of drinking water purification.

2.3.3. Principles and Process of Oil Removal in the Chamber

  • The NR (natural oil removal) chamber
The NR chamber uses a physical method that takes advantage of the density difference between oil and water to effectively remove oil from the water. The ascent of oil droplets follows the Stokes formula, which describes particle motion in a viscous fluid.
The main goal in this chamber is to remove oil larger than 50 μm, both free-floating and dispersed particles. After that, the effluent goes to the NR chamber outlet where it is directed to an external dosing device. This device introduces coagulants and flocculants to enhance the treatment process before reintroducing the water into the CR chamber.
  • The CR (chemical reaction) chamber
Three mechanisms are employed to effectively remove oil from the CR chamber: coagulation, demulsification, and three-dimensional contact flocculation.
Coagulation involves the gradual aggregation of oil droplets into larger globules. Micro-vortex flow reactors facilitate collision and coagulation among dispersed and partially emulsified oil particles, resulting in the formation of larger oil globules. These reactors offer advantages such as easy installation, clog resistance, and convenient maintenance.
The demulsification process starts by adding coagulants and flocculants before the CR chamber in the MOR equipment. These chemicals undergo hydrolysis in water, leading to processes like adsorption and electrostatic neutralization. This destabilizes emulsified oil and colloidal particles, which then enter the micro-vortex flow generated by the reactors. This facilitates the coagulation and enlargement of dispersed oil droplets. The combination of micro-vortex flow and chemical treatment enhances aggregation and settling of oil particles, improving efficiency in removing oil.
In the CR chamber, controlled flow dynamics create an environment that promotes three-dimensional contact flocculation, resulting in a strong adsorption and continuous absorption of fine particles. This interaction facilitates the gradual growth and aggregation of flocs. The CS chamber receives these enriched flocs containing captured particles. The CR chamber optimizes the coagulation and enlargement of dispersed oil and partially emulsified particles, specifically in the size range of 10 μm to 50 μm. Additionally, it enhances chemical mixing, creating ideal conditions for effective oil–water separation in the subsequent chamber.
  • The CS (coagulation sedimentation) chamber
The CS chamber uses an inclined tube area based on shallow pool and coalescence principles for efficient oil removal. Flocs and oil droplets enter the settling zone of the tubes, where oil droplets accumulate on the upper wall and suspended solids gather on the lower wall, enlarging their size for effective removal.
The inclined tube oil removal is based on the “shallow pool theory,” which states that the efficiency of gravity separation equipment depends on its horizontal cross-sectional area rather than its depth, assuming a constant effective volume in the sedimentation tank. Therefore, ideal gravity separation equipment should have a large surface area and shallow depth.
By incorporating honeycomb inclined tubes (as shown in Figure 6) into the CS chamber, the effective separation area increases and the separation height decreases. The presence of inclined tubes (or plates) also enhances water flow’s wet perimeter, reduces the hydraulic radius, and promotes laminar flow conditions by lowering the Reynolds number (Re). Moreover, a higher Froude number (Fr) stabilizes water flow, facilitating oil–water separation.

2.4. Pilot Experiment Design

2.4.1. Flocculant Dosage Experiment for Chemical Addition

The amount of chemicals added during produced water treatment is crucial as it directly affects both the cost and effectiveness. Cationic polyacrylamide is used as a flocculant with a recommended dosage range of 0.5 to 1 mg/L. To evaluate the impact of different dosages, we conducted experiments using four combinations of coagulants and flocculants, where polyaluminum chloride was used as the coagulant at levels of 16 mg/L and 22 mg/L.
The experiment involved combining two types of chemicals to establish four distinct dosage combinations, aiming to determine the optimal coagulant dosage by assessing the efficiency of oil removal and suspended solids removal for each combination. The detailed design of the dosage combinations for the experiment is provided in Table 2.
Ai and Bi represent the oil and suspended solids removal rates, respectively, where “i” denotes the experiment combination number. Based on the experimental results, the average oil removal rate (AOR) and the average suspended solids removal rate (ASR) for different chemical concentrations in each combination are calculated to evaluate the impact of the chemical dosage on pollutant removal. For example, the AOR for the coagulant dosage of 16 mg/L is calculated as (A1 + A2)/2, while the ASR is calculated as (B1 + B2)/2. Similarly, the AOR and ASR for coagulant dosages of 22 mg/L and flocculant dosages of 0.5 mg/L and 1.0 mg/L are determined.

2.4.2. Coagulant Dose Optimization and Micro-Vortex Flow Controlled Experiment

The aim of this experiment section was to determine the optimal coagulant dosage range for the MOR equipment and assess the effectiveness of coagulation enhancement by micro-vortex flow reactors. The pilot-scale MOR equipment operation was divided into two stages: without micro-vortex flow reactors in the first stage, and with micro-vortex flow reactors in the second stage. By comparing treatment efficiency between these stages, we evaluated the enhanced oil removal effect of micro-vortex flow reactors and determined an appropriate coagulant dosage range during the treatment process.

2.4.3. Comparative Study of Oil Removal Processes

We selected the MOR equipment equipped with micro-vortex flow reactors to compare its efficiency in removing oil with the oil removal process currently used in the union station for produced water treatment, both using a coagulant (polyaluminum chloride) and flocculant (cationic polyacrylamide) at optimized dosages. The oil removal process employed in the union station primarily consists of one natural settling tank (with a detention time of 7.5 h) and one coagulation sedimentation tank (with a detention time of 6.5 h), both with a volume of 3000 m3. To ensure that the MOR equipment operates under the same conditions as the natural settling tank, the unit area load in the settling tank is calculated based on its effective volume. By adjusting the flow rate of the MOR equipment, the unit area load can be made equivalent to that of the settling tank. The natural settling tank with a diameter of 15.8 m and a treatment flow rate of 291 m3/h has a unit area load of Q/A = 1.48 m3/m2·h. Similarly, the coagulation sedimentation tank with a diameter of 15.3 m and a treatment flow rate of 291 m3/h has a unit area load of Q/A = 1.59 m3/m2·h. In this case, a unit load index of 1.48 m3/m2·h is chosen for the MOR equipment, which has a diameter of 2.5 m. Calculations reveal that the flow rate of the MOR equipment should be 30 m3/h.

2.4.4. Long-Term Performance Observation

The majority of studies have focused on short-term evaluations of treatment technologies, but there is a need for further investigation into their long-term performance, stability, and reliability. It is essential to conduct long-term monitoring and evaluation to ensure sustainable and effective treatment of produced water.
Due to the complexity of the integrated equipment structure, issues such as clogging and material contamination are prone to occur over the long run [2,66]. Consequently, the initially achieved water quality standards may gradually become less stable. To assess the long-term stability and reliability of the MOR equipment, we conducted an 80-day pilot study at the union station oilfield site. Water quality tests were performed three times daily, with samples collected from the equipment’s inlet, outlet of the NR chamber, and equipment outlet. The daily data were averaged for each sampling point. The oil removal efficiency and suspended solids removal efficiency of the equipment were then calculated using stage averages and variances, providing valuable insights into its performance effectiveness and stability.

2.5. Methods for Data Collection and Analysis

During water sample collection, it is crucial to obtain samples from the designated sampling port of the equipment. Prior to sampling, open the sampling tap and let it run smoothly for 3 min before collecting the sample. The oil content in the water samples is measured using the petroleum ether extraction method. First, extract the water samples and determine the oil content (in mg) in the extracted samples using a standard curve. Measure the volume of the extracted water sample (in L) and then calculate its oil content (in mg/L).
The measurement method for suspended solids content utilizes the membrane filtration weighing technique. After collecting the water samples, carefully filter them through a membrane. By considering both the volume of filtered water (in L) and weight increase in the filter membrane (in mg), accurately calculate suspended solids content in water (in mg/L).

3. Results and Discussion

3.1. Flocculant Dose Optimization

Based on the experimental findings, this study calculated the average oil removal rates (AORs) and average suspended solids removal rates (ASRs) for a specific reagent under various combinations, with the results presented in Table 3 and Table 4. When increasing the flocculant dosage from 0.5 mg/L to 1 mg/L, the ASR decreased by 3.5% and the AOR has not changed. The decrease with the increased flocculant dosage can be attributed to several factors, including an excessive flocculant causing colloids to acquire a positive charge and an excessive flocculant dosage can deplete the alkalinity in the water, hindering the complete hydrolysis of the flocculant, resulting in residual amounts of the flocculant exceeding permissible limits in treated water. Conversely, the AOR and ASR increased by 11.2% and 18.1%, respectively, when the coagulant dosage was raised from 16 mg/L to 22 mg/L. The higher dosage of the coagulant improves oil and suspended solids removal efficiency by enhancing particle coagulation and destabilization. Increasing the coagulant dosage promotes the formation of larger, denser flocs, facilitating their separation from water. Considering cost implications, a flocculant dosage of 0.5 mg/L is considered suitable for MOR equipment.

3.2. Coagulant Dose Optimization and Micro-Vortex Flow Controlled Experiment

The experiment was conducted in two stages to test the enhanced coagulation/flocculation effect of micro-vortex flow reactors. The dosage of the coagulant was tested under two equipment states. In the first stage, the CR chamber of the MOR equipment had no micro-vortex flow reactors and the inlet/outlet water flow rate was 30 m3/h. In the second stage, the CR chamber of multifunctional oil removal equipment was filled with micro-vortex flow reactors, and the inlet water conditions and reagent dosage were set to be identical to those in the first stage. The flocculant dosage remained at 0.5 mg/L while different dosages (0 mg/L, 4 mg/L, 10 mg/L, 16 mg/L, 22 mg/L, 28 mg/L, and 34 mg/L) of the inorganic coagulant (polyaluminum chloride) were used successively. It is important to note that due to on-site testing being experimental in nature, there were fluctuations in influent water quality. The findings from both stages are presented in Table 5 and Table 6, respectively, while Figure 7 illustrates the results.
Based on the experimental results, the oil removal rate for MOR equipment without micro-vortex flow reactors is over 90% within a coagulant dosage range of 22 to 28 mg/L. For MOR equipment with micro-vortex flow reactors, the oil removal rate is over 95% within a coagulant dosage range of 10 to 22 mg/L. However, when the coagulant dosage exceeds 34 mg/L, both oil and suspended solids removal rates decrease significantly due to excessively high chemical concentrations causing colloidal stability in water and affecting sedimentation effectiveness.
Under the same experimental conditions, MOR equipment equipped with micro-vortex flow reactors exhibits an average oil removal rate that is 9.4% higher than that of MOR equipment without micro-vortex flow reactors. This suggests that the micro-vortex flow reactors enhance oil droplet coalescence and chemical dispersion, leading to improved oil removal performance. This finding aligns with previous studies conducted by other researchers [61,62]. While the average suspended solids removal rate also increases by 7.9%, there is significant fluctuation in suspended solids removal efficiency attributed to relatively low influent suspended solids content.

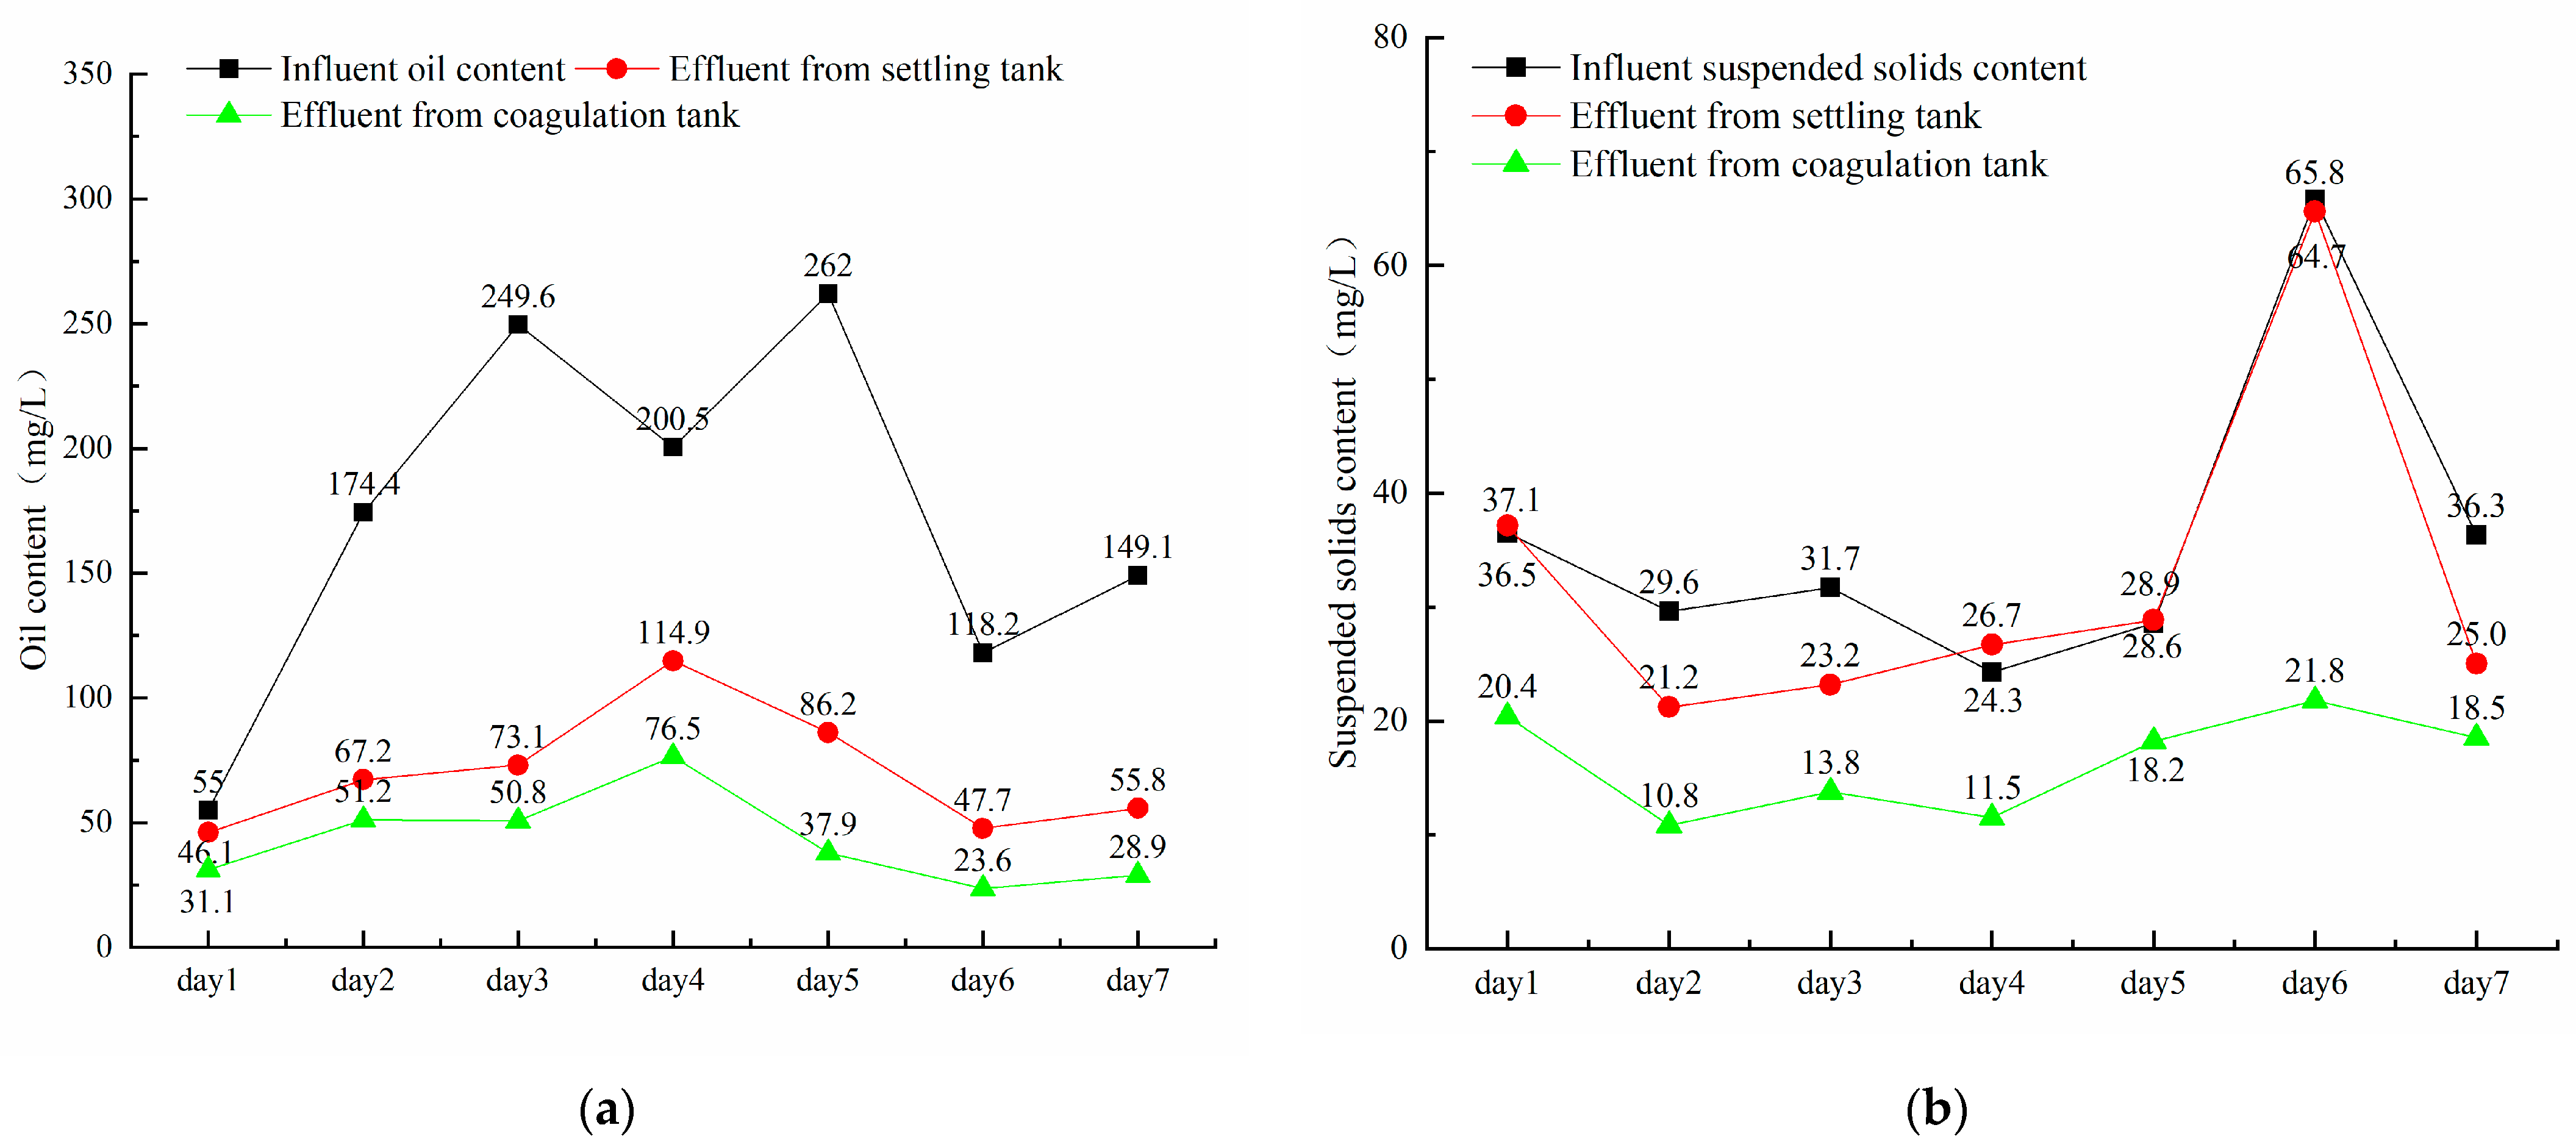
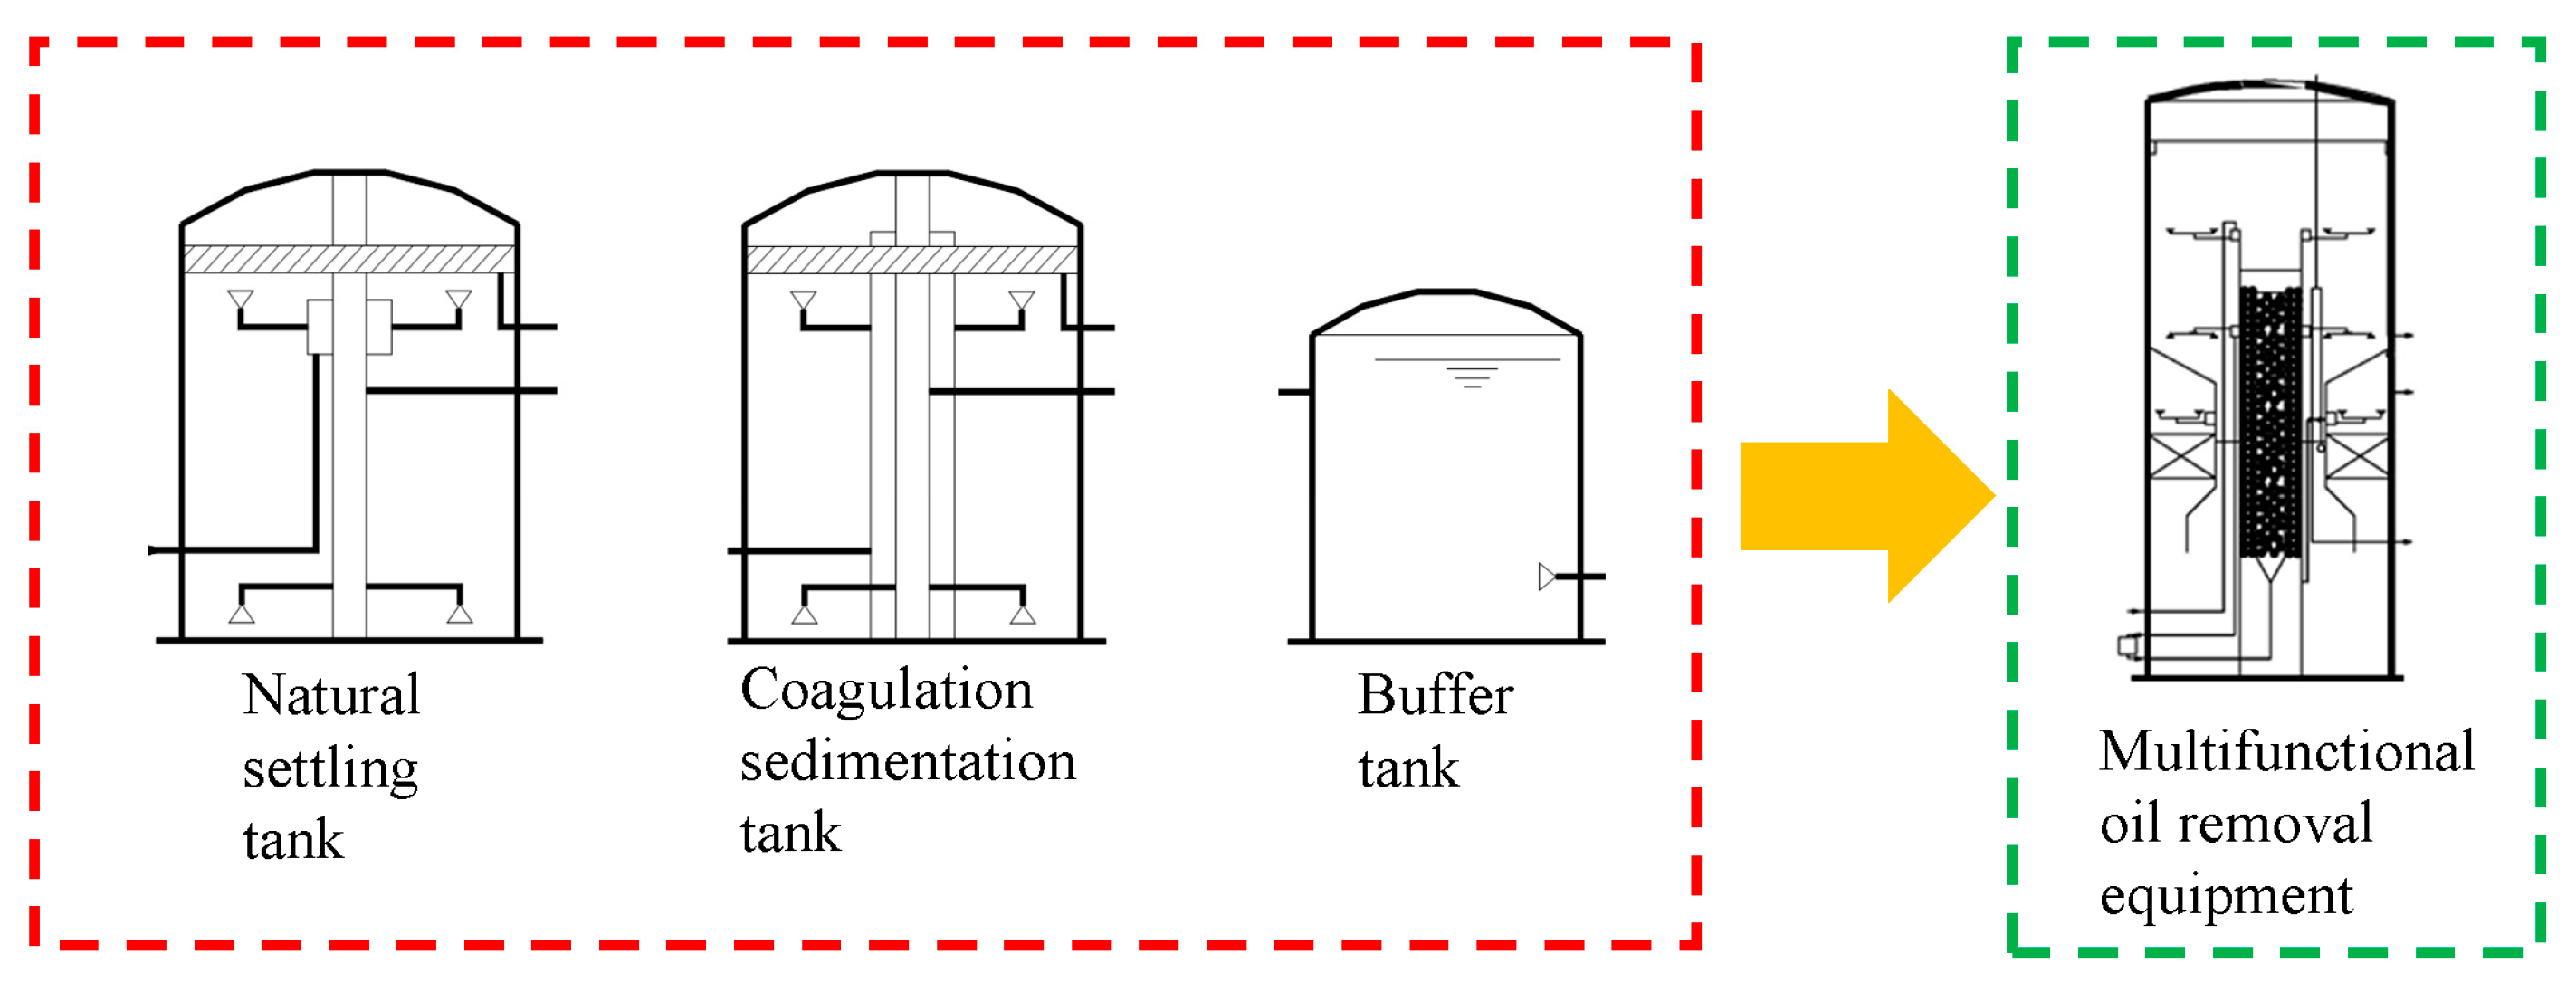
3.3. Comparative Study with Union Station Oil Removal Process

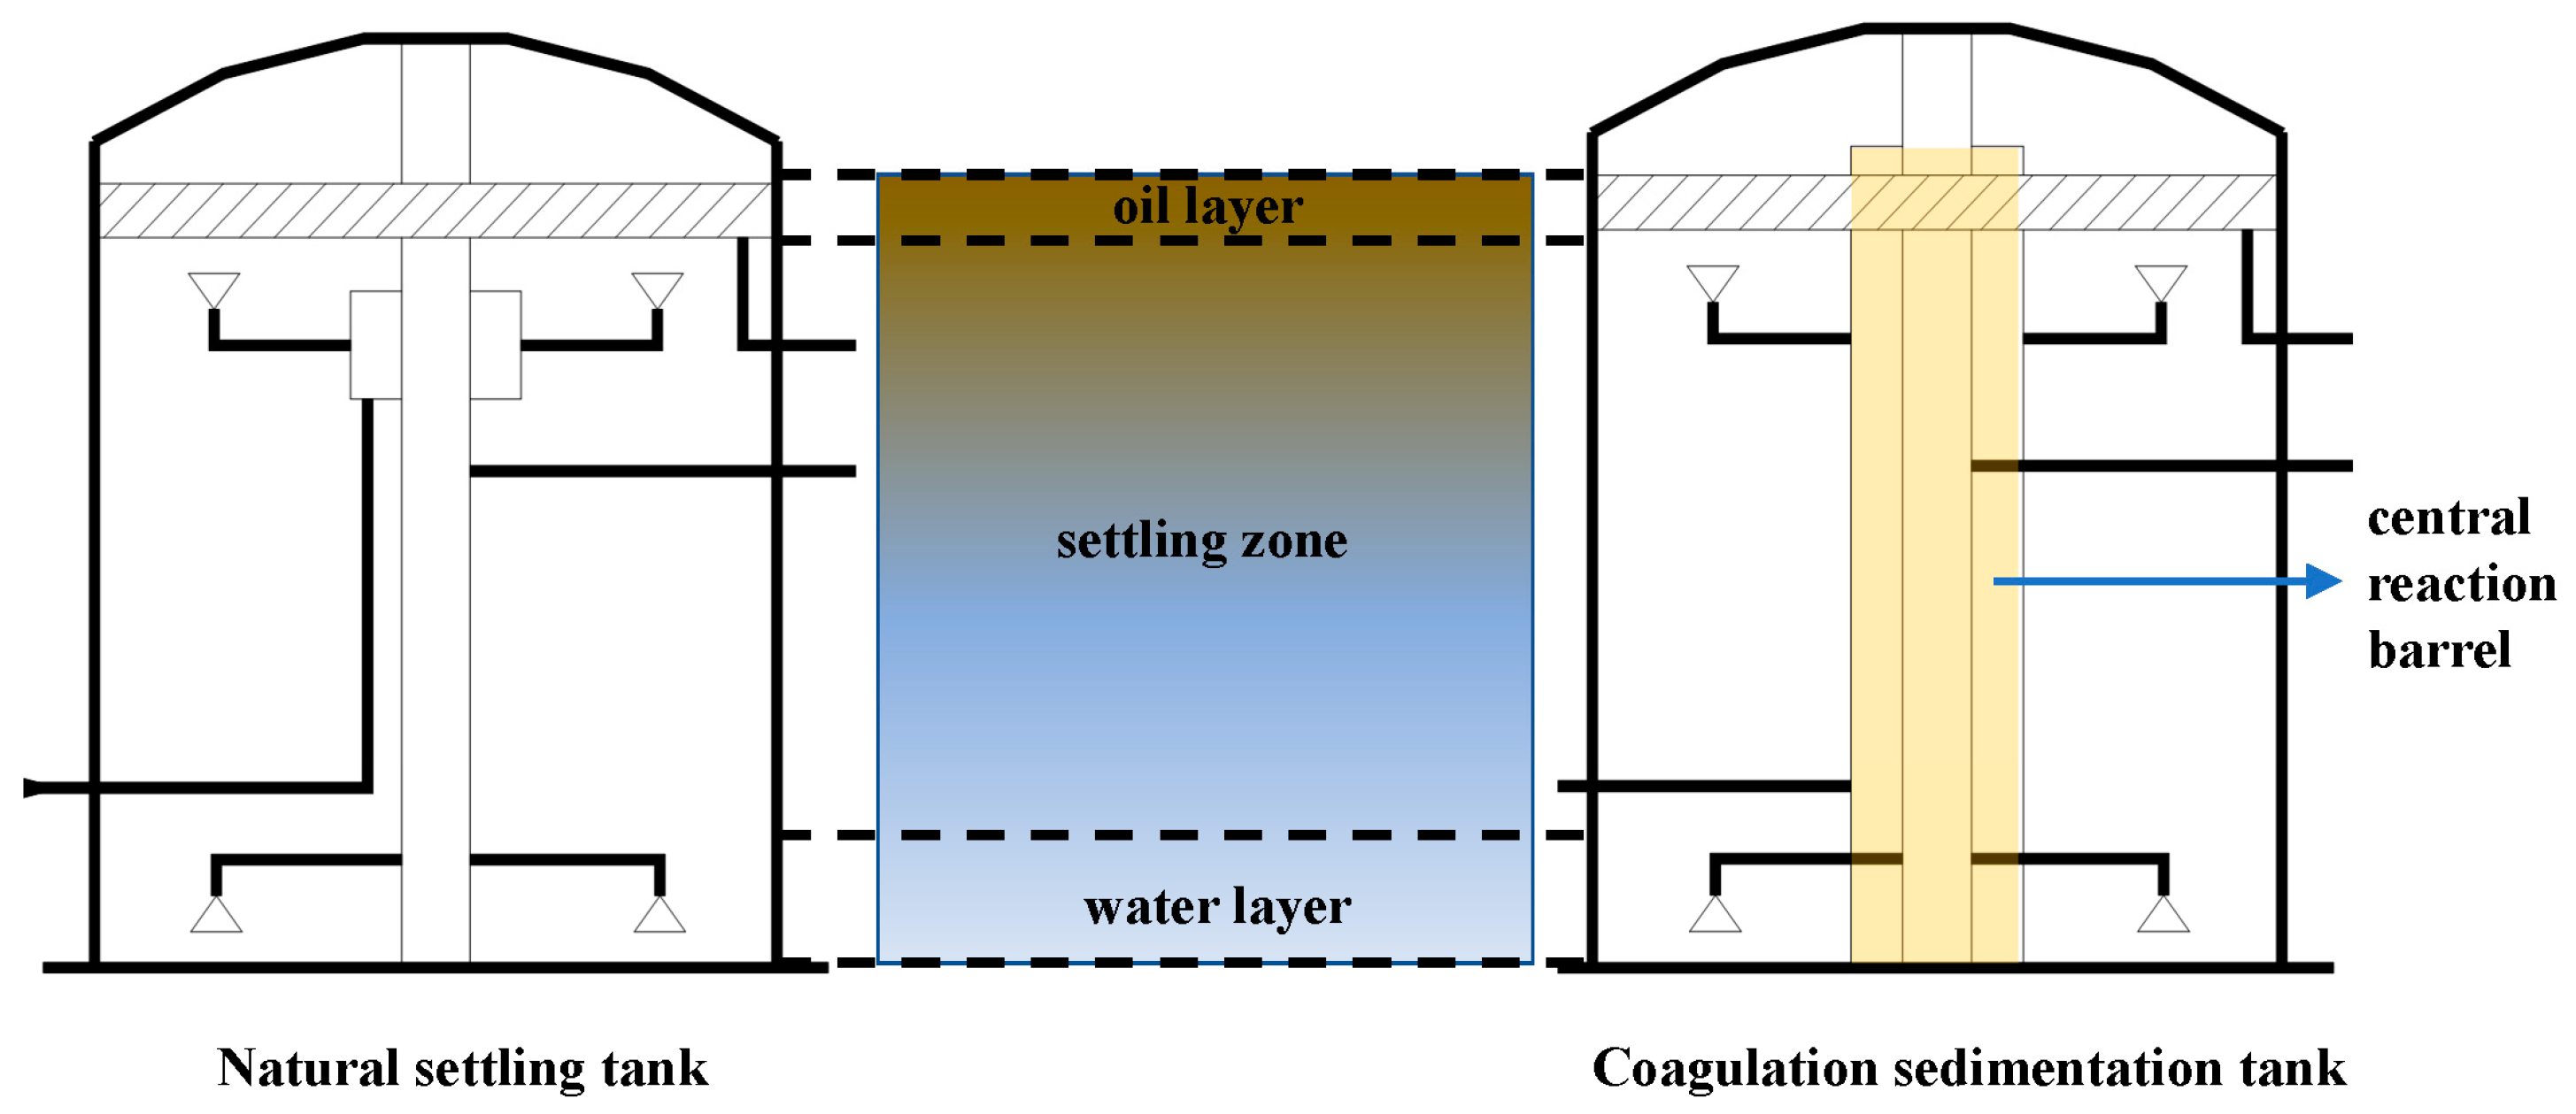
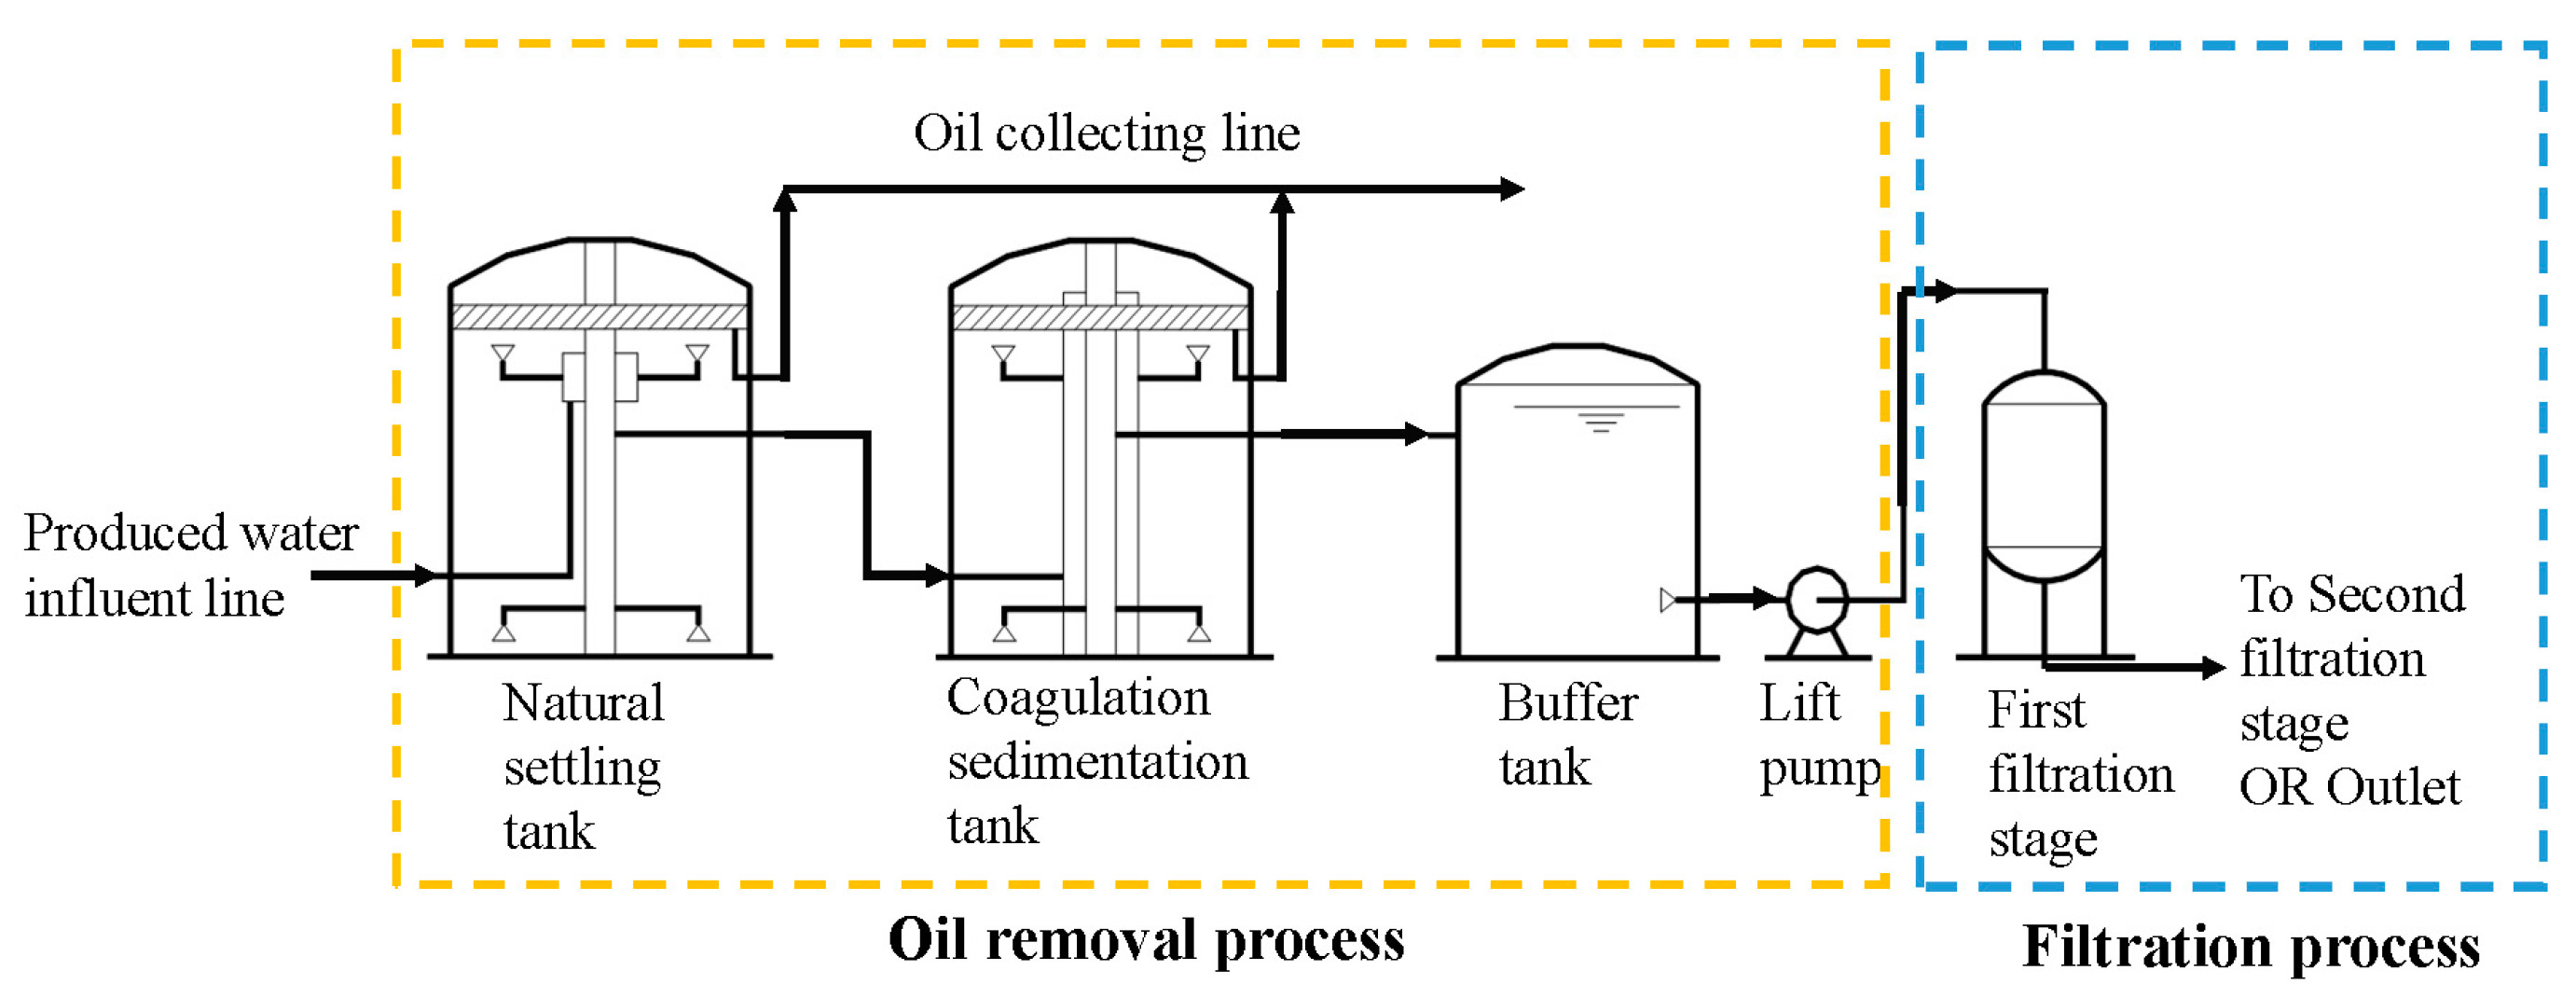
3.3.1. Union Station Oil Removal Process

The oil removal process at the union station consists of a natural settling tank and a coagulation sedimentation tank. The inorganic coagulant dosage in the coagulation (polyaluminum chloride) sedimentation tank is 22 mg/L, while the MOR equipment uses a dosage of 14 mg/L. Both processes employ an organic flocculant dosage of 0.5 mg/L.
The results of the 7-day operation of the combined natural settling tank and coagulation sedimentation tank process (referred to as the “dual-tank” process) are shown in Figure 8. The total influent oil content fluctuates between 55 and 262 mg/L, with an average of 172.7 mg/L. The average effluent oil content after treatment in the natural settling tank is 70.1 mg/L, while it is 42.8 mg/L after treatment in the coagulation sedimentation tank. The average oil removal rate of the “dual-tank” process is 71.7%.
The influent water has an average suspended solids content of 36.1 mg/L, while the effluent after natural settling tank treatment has an average suspended solids content of 32.4 mg/L, indicating a low removal efficiency in the natural settling tank. According to the Stokes’ Law analysis, the settling velocity of suspended solids is directly proportional to the square of their particle size. When colloidal particles (d = 0.001 to 1 μm) are present in the suspension, relying solely on gravity separation would require a lengthy retention time. Additionally, the natural settling chamber is the first chamber of the equipment, which needs to withstand the impact of changes in water quality and quantity, serving as a buffer and homogenization mechanism to ensure a smooth water flow into the second chamber. The average suspended solids content of the effluent after the coagulation sedimentation tank treatment is 16.4 mg/L, indicating that coagulation has effectively removed suspended solids. The average suspended solids removal rate of the “dual-tank” process is 52.7%.
The “dual-tank” process moderately removed oil and suspended solids. However, the effluent’s relatively high oil content indicates the need for further optimization to meet stricter quality standards. This may involve additional treatment steps like filtration or advanced processes to improve oil removal efficiency and prevent filter media fouling. Additionally, monitoring and adjusting the dosage of an inorganic coagulant and organic flocculant in the sedimentation tank can optimize removal performance and ensure efficient operation.

3.3.2. MOR Equipment

The influent water quality for the MOR equipment and the “dual-tank” oil removal process at the union station is the same. The 7-day experiment results for the MOR equipment, as shown in Figure 9, indicate that the average oil content of the influent water is 172.7 mg/L. Following treatment in the MOR equipment’s NR chamber, the average oil content in the effluent water is reduced to 88.2 mg/L. After further treatment in the CS chamber, the average oil content in the effluent water is reduced to 7.5 mg/L. The MOR equipment achieves an average oil removal rate of 95.7%, demonstrating a significant oil removal effect.
The influent water has an average suspended solids content of 36.1 mg/L, which decreases to 30.9 mg/L after treatment in the NR chamber of the MOR equipment. Further treatment in the CS chamber reduces the suspended solids content to 11.1 mg/L. The MOR equipment achieves a remarkable removal rate of 69.3% for suspended solids, indicating that the equipment also performs well in the removal of suspended solids.
According to Table 7, the treatment process of the MOR equipment and the “dual-tank” oil removal process at the union station can be divided into two stages: natural settling and coagulation sedimentation. Under identical influent water quality, both processes exhibit similar treatment effects during the natural settling stage. However, after natural settling, the oil removal rate at the union station is approximately 10% higher than that of the MOR equipment’s NR chamber. This disparity can be attributed to a longer retention time of 7.5 h in the natural settling tank at the union station compared to 2.5 h in the MOR equipment’s NR chamber. A longer retention time facilitates better oil removal efficiency by leveraging gravity separation based on density differences between oil and water.
During the coagulation–sedimentation stage, the MOR equipment exhibits a remarkable increase in the oil removal rate, from 48.9% to 95.7%. In contrast, the “dual-tank” oil removal process at the union station only shows an increase from 59.4% to 75.2%. The superior performance of the MOR equipment can be attributed to several factors:
  • In the preceding chamber (CR) of the MOR equipment, effluent water undergoes coalescence through micro-vortex flow, increasing the particle size of small oil droplets.
  • The micro-vortex flow in the CR enhances reagent diffusion, ensuring uniform contact with oil droplets and facilitating electrical neutralization and adsorption effects.
  • The micro-vortex flow strengthens reagent diffusion, enabling the formation of a high-quality three-dimensional contact coagulation layer that effectively removes suspended solids and oil.
  • Efficient oil removal conditions are already established within the influent entering the CS chamber, including larger coalesced droplets, the demulsification of reagents, and stable floc formation. These conditions significantly increase overall oil removal efficiency in the shallow pool section.
The MOR equipment outperformed the “dual-tank” process in comparative experiments with identical influent conditions and retention times, showing superior performance in removing oil and suspended solids from the produced water. It achieved a 20.5% higher oil removal rate within a shorter hydraulic retention time. Both effluent oil and suspended solids concentrations were below 20 mg/L, meeting the requirements for filtration stage entry. Additionally, the MOR equipment eliminates the need for a buffer tank, effectively fulfilling the functions of three tanks simultaneously as depicted in Figure 10.

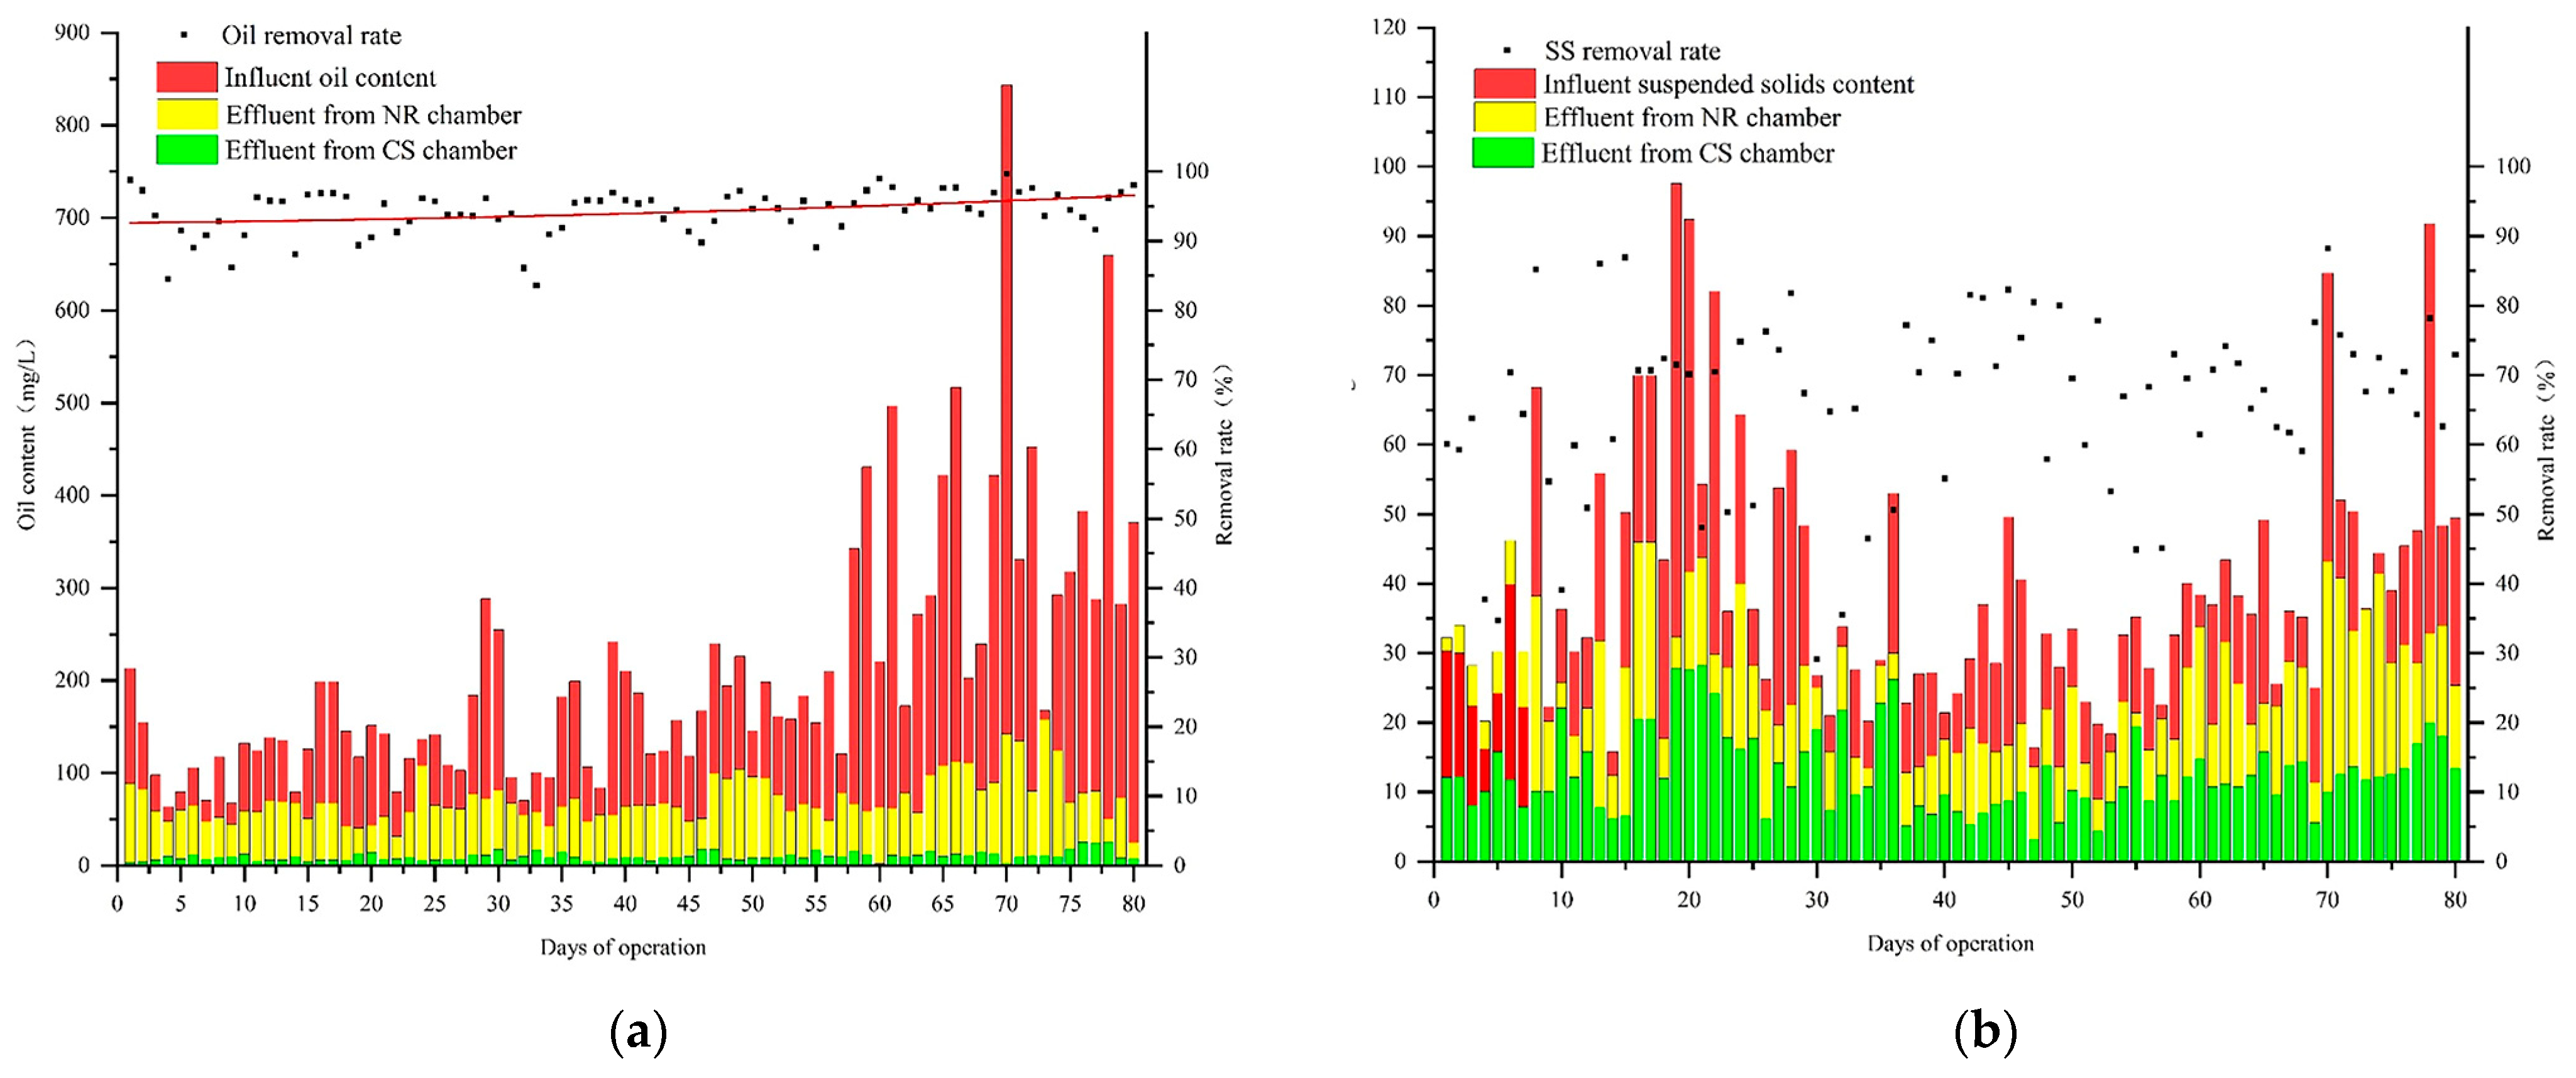
3.4. Long-Term Observations of MOR Equipment Performance

The MOR equipment underwent operational trials at the Daqing Oilfield Union Station for approximately three months, maintaining an inlet flow rate of 25 to 30 m3/h. An organic flocculant, cationic polyacrylamide, was applied at a dosage of 0.5 mg/L along with an inorganic coagulant, polyaluminum chloride, at a dosage of 16 mg/L.
Water quality evaluations were conducted over a period of 80 days during the experimental phase, with daily sampling at the MOR equipment’s inflow point, NR chamber’s output point, and CS chamber’s outlet point. It is important to note that operational produced water was introduced into the influent on day seven, and acidized fracturing water was added on days nineteen and twenty. Furthermore, untreated operational wastewater was introduced into the influent on days 70 to 72 and 77 to 79.
Experiment results are shown in Figure 11 and Table 8. This study was divided into three stages based on the experimental duration: the early stage (1 to 30 days), the middle stage (31 to 60 days), and the late stage (61 to 80 days). The average oil content in the influent of the MOR equipment during the first two stages was 155.4 mg/L. Some fluctuations were observed in treatment efficiency, resulting in an average oil removal rate of 93.6%. However, there was a significant increase in the average influent oil content to approximately 371.2 mg/L during days 61 to 80 of the experiment. Despite this change, the variance decreased to 4 while maintaining an average removal rate of around 96%. This suggests that with continued operation, the equipment demonstrated improved treatment efficiency and stability. The fitting line for the oil removal rate also supports this conclusion (the red line in Figure 11a). Overall, over a span of 80 days, the MOR equipment showed an impressive average oil removal efficiency of 94.2%, resulting in an effluent with an oil concentration of approximately 9 mg/L. Importantly, despite significant variations in influent quality during extended operation, consistent and effective oil removal performance was consistently demonstrated by the MOR equipment.
In terms of suspended solids removal, the performance of the MOR equipment exhibits significant fluctuations. From days 1 to 60, the average influent concentration of suspended solids is 37.5 mg/L, with a removal efficiency ranging between 21.4% and 86.9%, and a large variance exceeding 200 in mean values. The average removal rate is 63.7%. However, from days 61 to 80, the equipment’s treatment effect stabilizes gradually. The average influent concentration of suspended solids increases to 45.7 mg/L, with a decrease in variance to approximately 50. The average removal rate for suspended solids increases to 70.2%. The MOR equipment demonstrates certain efficiency in removing suspended solids, resulting in an effluent concentration averaging at around 12.7 mg/L; however, the removal effect fluctuates due to relatively low influent concentrations.
In the 80-day operational test, MOR equipment demonstrated excellent resistance to shocks and pollution. The analysis indicates that the spherical structure of the micro-vortex flow reactor significantly enhances its self-cleaning performance. The collisions and rolling between these spheres prevent oil adhesion while effectively promoting the condensation and diffusion of chemicals. The self-cleaning effect of the micro-vortex reactor is rarely addressed in other studies, which may be due to less blockage and adhesion occurring in drinking water purification processes compared to higher oil content in produced water [57,61]. Therefore, our research emphasizes the superior sustainability of spherical reactors in treating produced water, enhancing coagulation efficiency, and outstandingly removing oil throughout the entire 80-day operation.

4. Conclusions

This study employed multifunctional oil removal (MOR) equipment to enhance the efficacy of oil removal in produced water from low-permeability oilfields and address treatment challenges. The investigation was conducted at an oilfield union station, yielding the subsequent key findings:
(1)
The micro-vortex flow action promotes a uniform diffusion and contact of chemicals, resulting in a 30% reduction in the coagulant dosage compared to MOR equipment without micro-vortex flow reactors.
(2)
Comparative experiments were conducted to evaluate the performance of MOR equipment versus the “natural settling tank + coagulation sedimentation tank” process. The MOR equipment demonstrated superior removal rates, surpassing the conventional process by 20.5% for oil and 14.7% for suspended solids. It also reduced the coagulant dosage by 30%, while maintaining a hydraulic retention time of 5 h, resulting in an effluent with oil and suspended solids content below 20 mg/L.
(3)
Long-term operational observations have revealed the inherent self-cleaning effect of micro-vortex flow reactors, ensuring consistent and stable equipment performance over an extended duration. The MOR equipment consistently achieved oil removal rates exceeding 93% and suspended solids removal rates surpassing 63% during a continuous operation period of 80 days. The average concentrations in the effluent were measured at approximately 9 mg/L for oil and around 12.7 mg/L for suspended solids. As the operation time increased, higher removal rates and stability were observed during the third period.
Despite promising experimental results, micro-vortex flow technology and MOR equipment still face future challenges:
(1)
It is crucial to assess whether the oil removal efficiency can be maintained when dealing with different qualities of produced water and higher flow rates in larger treatment systems.
(2)
When dealing with high-viscosity organic compounds, such as polymers in chemically enhanced recovery produced water, the micro-vortex reactor’s resistance to contamination needs re-evaluation, and regular maintenance may be necessary.
(3)
The shape and material of the micro-vortex reactor can be further studied to achieve a better enhanced coagulation effect.
In conclusion, the MOR equipment demonstrated superior efficiency in oil removal using a single sedimentation tank. Furthermore, incorporating micro-vortex flow technology offers significant advantages such as improved water treatment efficiency, reduced chemical consumption, energy-efficient practice promotion, and minimized sludge generation through self-cleaning capabilities for long-term utilization at low costs. Integrating MOR equipment with micro-vortex flow technology enhances water injection quality in low-permeability reservoirs and facilitates sustainable development. Additionally, it can effectively be used in offshore oilfields, remote and small-scale stations, and stations facing challenges in meeting water treatment standards.

5. Patents

This research has led to the development of several patents, including a patented system and process for treating produced water [67], and two patented degreasing units [68,69].

Author Contributions

Conceptualization, D.Z. and W.X.; Data curation, Y.S. and X.H.; Formal analysis, L.W.; Investigation, L.W.; Methodology, J.Z. and B.L.; Project administration, B.L.; Resources, Y.S.; Supervision, J.Z.; Validation, L.W.; Visualization, D.Z.; Writing—original draft, D.Z.; Writing—review and editing, W.X. and T.C. All authors have read and agreed to the published version of the manuscript.

Funding

This research received no external funding.

Data Availability Statement

The data that support the findings of this study are available from the corresponding author, D. Z., upon reasonable request.

Acknowledgments

The authors would like to express their deep appreciation to the staff and technicians of the oil fields for granting us access to necessary data and facilities. We also extend our gratitude to our colleagues and fellow researchers for their intellectual contributions and stimulating discussions throughout this study. Our heartfelt thanks go out to everyone who played a role in successfully completing this research project.

Conflicts of Interest

Author Yuxin Sheng was employed by the PetroChina Jidong Oilfield Company, Xiujie Huang was employed by the Sinochem Holdings Corporation Ltd. The remaining authors declare that the research was conducted in the absence of any commercial or financial relationships that could be construed as a potential conflict of interest.

Appendix A

Results of screening tests for coagulant and flocculant type and concentration used in the test are shown in Table A1 and Table A2.
Table A1. Aggregation effect of different concentrations of commonly used coagulants in oilfield.
Chemical CompositionManufacturerConcentration/(mg·L−1)Turbidity before Dosing/NTUOil Content before Dosing
/(mg·L−1)
Turbidity after Dosing/NTUOil Content after Dosing
/(mg·L−1)
Oil Removal Efficiency/%Turbidity Removal Rate/%
polyaluminum ferric sulfate GY2160.0120.320.329.6575.2966.17
GY2560.2120.015.0712.4489.6374.88
GY21059.5120.312.55.4795.4579.17
GY22059.8120.011.85.2395.6480.27
GY23060.2119.59.215.1595.784.7
GY24060.2120.07.744.5396.2387.1
GY25060.2120.02.281.4598.7996.2
polyaluminum chloride
(active component 26%)
GYT *160.0120.318.220.782.7969.67
GYT *560.2120.014.211.390.5876.41
GYT *1059.5120.310.38.3493.0782.69
GYT *2060.2119.59.247.1594.1784.65
GYT *3060.2119.58.454.2496.4585.96
GYT *4060.2120.06.743.2397.3188.80
GYT *5060.2120.02.11.598.7596.51
polyferric sulfateBS159.8120.322.319.0584.1362.83
BS560.3120.321.317.3385.5659.5
BS1060.2120.016.65.4795.4572.33
BS2060.1120.014.34.5396.2276.17
BS3060.2120.09.73.6796.9483.89
BS4060.0119.86.722.6797.7888.8
BS5060.2120.05.32.198.2591.20
polyaluminum chloride active component 30%HNLQ160.3120.313.212.2189.8378
HNLQ560.2120.011.67.3393.9080.67
HNLQ1060.1120.09.085.3595.5484.87
HNLQ2060.1120.37.184.7796.0388.03
HNLQ3060.0120.05.873.8996.7690.22
HNLQ4060.0120.05.471.4298.8290.88
HNLQ5060.0120.01.351.199.0897.75
polyaluminum ferric sulfateJC160.3120.222.174.5337.8963.17
JC560.2120.020.152.4456.3066.5
JC1060.1120.016.950.7957.6771.83
JC2060.1120.315.544.7762.6974.17
JC3060.0120.014.928.376.4275.17
JC4060.0120.014.4129076
JC5060.1120.010.58.293.1782.53
polyaluminum chloride (active component 22%)MT160.3120.216.919.2183.9971.83
MT560.2120.015.818.8484.373.67
MT1060.1120.213.512.9189.2477.5
MT2060.0120.012.8992.578.67
MT3060.0120.011.88.393.0880.33
MT4060.0120.211.27.5393.7481.33
MT5060.0120.08.36.994.2586.17
* Chemical used in field pilot evaluation.
Table A2. Aggregation effect of different concentrations of commonly used flocculants in oilfield.
Chemical CompositionManufacturerConcentration/(mg·L−1)Turbidity before Dosing/NTUOil Content before Dosing
/(mg·L−1)
Turbidity after Dosing/NTUOil Content after Dosing
/(mg·L−1)
Oil Removal Efficiency/%Turbidity Removal Rate/%
cationic polyacrylamide
(ionic degree 50)
HNLQ0.160.0120.317.39.8891.7771.17
HNLQ0.260.0120.016.28.592.9273
HNLQ0.560.2120.015.78.49373.83
HNLQ159.5120.314.67.893.575.67
HNLQ259.6120.013.76.294.8377.17
HNLQ460.2120.012.2595.8379.67
cationic polyacrylamide
(ionic degree 60)
YLZ0.159.8120.322.712.9589.2162.17
YLZ0.260.0120.022.111.990.0863.17
YLZ0.560.3120.321.911.590.4263.5
YLZ160.2120.021.610.691.1764
YLZ260.1120.020.810.291.565.33
YLZ460.0119.819.09.4292.1568.33
cationic polyacrylamide
(ionic degree 90)
MT *0.160.3120.315.72579.1773.83
MT *0.260.0120.015.4188574.33
MT *0.560.2120.015.314.2388.1474.5
MT *160.1120.015.210.5891.1874.67
MT *260.1120.314.37.5693.776.17
MT *460.0120.013.8397.577
cationic polyacrylamide
(ionic degree 50)
JC0.160.3120.219.173.3738.8668.17
JC0.260.0120.018.962.148.2568.5
JC0.560.2120.018.661.24969
JC160.1120.01851.7456.8870
JC260.1120.31738.0268.3271.67
JC460.0120.015.831.5173.7473.67
anionic polyacrylamideYLZ-20.160.3120.218.625.2378.9869
YLZ-20.260.0120.018.320.982.5869.5
YLZ-20.560.2120.018.119.0284.1569.83
YLZ-2160.1120.217.518.2684.7870.83
YLZ-2260.0120.017.312.9189.2471.17
YLZ-2460.0120.2179.0992.4371.67
cationic polyacrylamide
(ionic degree 60)
KP0.160.2120.026.225.2378.9856.33
KP0.260.0120.023.524.179.9260.83
KP0.560.1120.222.6123.280.6762.32
KP160.0120.021.419.583.7564.33
KP260.0120.220.316.686.1766.17
KP460.1120.215.610.391.4274
* Chemical used in field pilot evaluation.

References

  1. Igunnu, E.T.; Chen, G.Z. Produced Water Treatment Technologies. Int. J. Low-Carbon Technol. 2014, 9, 157–177. [Google Scholar] [CrossRef]
  2. Fakhru’l-Razi, A.; Pendashteh, A.; Abdullah, L.C.; Biak, D.R.A.; Madaeni, S.S.; Abidin, Z.Z. Review of Technologies for Oil and Gas Produced Water Treatment. J. Hazard. Mater. 2009, 170, 530–551. [Google Scholar] [CrossRef] [PubMed]
  3. Nasiri, M.; Jafari, I.; Parniankhoy, B. Oil and Gas Produced Water Management: A Review of Treatment Technologies, Challenges, and Opportunities. Chem. Eng. Commun. 2017, 204, 990–1005. [Google Scholar] [CrossRef]
  4. Venkatesan, A.; Wankat, P.C. Produced Water Desalination: An Exploratory Study. Desalination 2017, 404, 328–340. [Google Scholar] [CrossRef]
  5. Zhong, W.J.; Fu, Y.C.; Tian, S.; Huang, Y.; Wang, X. A New Oilfield Injection Water Quality Decision-Making Method. Pet. Sci. Technol. 2022, 41, 123–138. [Google Scholar] [CrossRef]
  6. Kassab, M.A.; Abbas, A.E.; Elgamal, I.; Shawky, B.M.; Mubarak, M.F.; Hosny, R. Review on the Estimating the Effective Way for Managing the Produced Water: Case Study. Open J. Mod. Hydrol. 2021, 11, 19–37. [Google Scholar] [CrossRef]
  7. Bennion, D.B.; Thomas, F.B.; Imer, D.; Ma, T.; Schulmeister, B. Water Quality Considerations Resulting in the Impaired Injectivity of Water Injection and Disposal Wells. J. Can. Pet. Technol. 2001, 40, 53–61. [Google Scholar] [CrossRef]
  8. Wang, J.; Fu, Y.-C.; Huang, Y.; Wang, X.-T.; Tian, S. A Study of the Effect of Oilfield Water Quality on Reservoir Injury. In Proceedings of the International Field Exploration and Development Conference; Springer: Berlin/Heidelberg, Germany, 2021. [Google Scholar]
  9. Kong, B.; Wang, S.; Chen, S. Minimize Formation Damage in Water-Sensitive Montney Formation with Energized Fracturing Fluid. SPE Reserv. Eval. Eng. 2017, 20, 562–571. [Google Scholar] [CrossRef]
  10. Li, X.; Yang, Z.; Li, S.; Huang, W.; Zhan, J.; Lin, W. Reservoir Characteristics and Effective Development Technology in Typical Low-Permeability to Ultralow-Permeability Reservoirs of China National Petroleum Corporation. Energy Explor. Exploit. 2021, 39, 1713–1726. [Google Scholar] [CrossRef]
  11. Wang, B.; Zhao, Y.; Tian, Y.; Kong, C.; Ye, Q.; Zhao, S.; Li, Z.; Suo, Y. Numerical Simulation Study of Pressure-Driven Water Injection and Optimization Development Schemes for Low-Permeability Reservoirs in the G Block of Daqing Oilfield. Processes 2013, 12, 1. [Google Scholar] [CrossRef]
  12. Gao, P.; Qu, L.; Sun, W. Analysis of Reinjection Water to Improve Water-Flooding Effect for Low-Permeability Sandstone Reservoirs. In IOP Conference Series: Earth and Environmental Science; IOP Publishing: Bristol, UK, 2019. [Google Scholar]
  13. Shahryar, J. Petroleum Waste Treatment and Pollution Control; Butterworth-Heinemann: Oxford, UK, 2016. [Google Scholar]
  14. Nordvik, A.B.; Simmons, J.L.; Bitting, K.R.; Lewis, A.; Strøm-Kristiansen, T. Oil and Water Separation in Marine Oil Spill Clean-up Operations. Spill Sci. Technol. Bull. 1996, 3, 107–122. [Google Scholar] [CrossRef]
  15. Pintor, A.M.A.; Vilar, V.J.P.; Botelho, C.M.S.; Boaventura, R.A.R. Optimization of a Primary Gravity Separation Treatment for Vegetable Oil Refinery Wastewaters. Clean Technol. Environ. Policy 2014, 16, 1725–1734. [Google Scholar] [CrossRef]
  16. Liao, X.-H.; Yang, S.-J.; Qin, M.-W.; Dou, M.-Y.; Feng, Q.; Li, H.-M.; Zou, S. Overview of Oil-Water Separation Equipment Technology of Refined Oil. In IOP Conference Series: Earth and Environmental Science; IOP Publishing: Bristol, UK, 2020. [Google Scholar]
  17. Clark, S.E.; Roenning, C.D.; Elligson, J.C.; Mikula, J.B. Inclined Plate Settlers to Treat Storm-Water Solids. J. Environ. Eng. 2009, 135, 621–626. [Google Scholar] [CrossRef]
  18. Liu, Y.; Lu, H.; Li, Y.; Xu, H.; Pan, Z.; Dai, P.; Wang, H.; Yang, Q. A Review of Treatment Technologies for Produced Water in Offshore Oil and Gas Fields. Sci. Total Environ. 2021, 775, 145485. [Google Scholar] [CrossRef] [PubMed]
  19. Hafskjold, B.; Morrow, T.B.; Celius, H.K.B.; Johnson, D.R. Drop-Drop Coalescence in Oil/Water Separation. In Proceedings of the SPE Annual Technical Conference and Exhibition, New Orleans, LA, USA, 25–28 September 1994. [Google Scholar]
  20. Frising, T.; Noïk, C.; Dalmazzone, C. The Liquid/Liquid Sedimentation Process: From Droplet Coalescence to Technologically Enhanced Water/Oil Emulsion Gravity Separators: A Review. J. Dispers. Sci. Technol. 2006, 27, 1035–1057. [Google Scholar] [CrossRef]
  21. Lu, H.; Liu, Y.; Cai, J.; Xu, X.; Xie, L.; Yang, Q.; Li, Y.; Zhu, K. Treatment of Offshore Oily Produced Water: Research and Application of a Novel Fibrous Coalescence Technique. J. Pet. Sci. Eng. 2019, 178, 602–608. [Google Scholar] [CrossRef]
  22. Al-Shamrani, A.A.; James, A.; Xiao, H. Separation of Oil from Water by Dissolved Air Flotation. Colloids Surf. A Physicochem. Eng. Asp. 2002, 209, 15–26. [Google Scholar] [CrossRef]
  23. Al-Shamrani, A.A.; James, A.; Xiao, H. Destabilisation of Oil–Water Emulsions and Separation by Dissolved Air Flotation. Water research 2002, 36, 1503–1512. [Google Scholar] [CrossRef] [PubMed]
  24. Etchepare, R.; Oliveira, H.; Azevedo, A.; Rubio, J. Separation of Emulsified Crude Oil in Saline Water by Dissolved Air Flotation with Micro and Nanobubbles. Sep. Purif. Technol. 2017, 186, 326–332. [Google Scholar] [CrossRef]
  25. Liu, M.; Chen, J.; Cai, X.; Han, Y.; Xiong, S. Oil–Water Pre-Separation with a Novel Axial Hydrocyclone. Chin. J. Chem. Eng. 2018, 26, 60–66. [Google Scholar] [CrossRef]
  26. de Araújo, C.A.O.; Scheid, C.M.; Loureiro, J.B.; Klein, T.S.; Medronho, R.A. Hydrocylone for Oil-Water Separations with High Oil Content: Comparison between Cfd Simulations and Experimental Data. J. Pet. Sci. Eng. 2020, 187, 106788. [Google Scholar] [CrossRef]
  27. Zhang, J.; He, Y.-T.; Liu, S.; Xu, J.-Y. Oil-Water Separation in a Cylindrical Cyclone with Vortex Finder. Phys. Fluids 2022, 34, 033314. [Google Scholar] [CrossRef]
  28. Hu, W.; Wei, Y.; Bao, J. Development of the Theory and Technology for Low Permeability Reservoirs in China. Pet. Explor. Dev. 2018, 45, 685–697. [Google Scholar] [CrossRef]
  29. Al Moajil, A.; Almubarak, T.; Alotaibi, F.; Alhamad, L. Re-Injection of Produced Water: The Effect of Oil Micro-Emulsion Suspensions. In Proceedings of the Middle East Oil, Gas and Geosciences Show 2023, Manama, Bahrain, 19–21 February 2023. [Google Scholar]
  30. SY/T 5329-2022; Water Quality Specification and Practice for Analysis of Oilfield Injecting Waters in Clastic Reservoirs. National Energy Administration: Beijing, China, 2022.
  31. Qiang, Y.; Wang, X.; Wang, Y.; Zhang, X. Study on Evaluation Method of Water Injection Efficiency in Low-Permeability Reservoir. Geofluids 2021, 2021, 1–6. [Google Scholar]
  32. Zhao, C.; Zhou, J.; Yan, Y.; Yang, L.; Xing, G.; Li, H.; Wu, P.; Wang, M.; Zheng, H. Application of Coagulation/Flocculation in Oily Wastewater Treatment: A Review. Sci. Total Environ. 2021, 765, 142795. [Google Scholar] [CrossRef] [PubMed]
  33. You, Z.; Xu, H.; Sun, Y.; Zhang, S.; Zhang, L. Effective Treatment of Emulsified Oil Wastewater by the Coagulation–Flotation Process. RSC Adv. 2018, 8, 40639–40646. [Google Scholar] [CrossRef] [PubMed]
  34. Rawlins, C.H.; Erickson, A.E.; Ly, C. Characterization of Deep Bed Filter Media for Oil Removal from Produced Water. In Proceedings of the SME Annual Meeting, Phoenix, AZ, USA, 28 February–3 March 2010. [Google Scholar]
  35. Amakiri, K.T.; Canon, A.R.; Molinari, M.; Angelis-Dimakis, A. Review of Oilfield Produced Water Treatment Technologies. Chemosphere 2022, 298, 134064. [Google Scholar] [CrossRef] [PubMed]
  36. Liu, A.; Liu, S. Study on Performance of Three Backwashing Modes of Filtration Media for Oilfield Wastewater Filter. Desalination Water Treat. 2016, 57, 10498–10505. [Google Scholar] [CrossRef]
  37. Kim, S.-H.; Lim, H.-K.; Jeong, W.-C.; Park, N.-S. Optimum Backwash Method for Granular Media Filtration of Seawater. Desalination Water Treat. 2011, 32, 431–436. [Google Scholar] [CrossRef]
  38. SY/T 0523-2023; Oilfield Water Treatment Filters. National Energy Administration: Beijing, China, 2023.
  39. Beshr, S.; Moustafa, M.; Fayed, M.; Aly, S. Evaluation of Water Consumption in Rapid Sand Filters Backwashed under Varied Physical Conditions. Alex. Eng. J. 2023, 64, 601–613. [Google Scholar] [CrossRef]
  40. Samuel, O.; Othman, M.H.D.; Kamaludin, R.; Sinsamphanh, O.; Abdullah, H.; Puteh, M.H.; Kurniawan, T.A.; Li, T.; Ismail, A.F.; Rahman, M.A. Oilfield-Produced Water Treatment Using Conventional and Membrane-Based Technologies for Beneficial Reuse: A Critical Review. J. Environ. Manag. 2022, 308, 114556. [Google Scholar] [CrossRef] [PubMed]
  41. Munirasu, S.; Haija, M.A.; Banat, F. Use of Membrane Technology for Oil Field and Refinery Produced Water Treatment—A Review. Process Saf. Environ. Prot. 2016, 100, 183–202. [Google Scholar] [CrossRef]
  42. Ebrahimi, M.; Willershausen, D.; Ashaghi, K.S.; Engel, L.; Placido, L.; Mund, P.; Bolduan, P.; Czermak, P. Investigations on the Use of Different Ceramic Membranes for Efficient Oil-Field Produced Water Treatment. Desalination 2010, 250, 991–996. [Google Scholar] [CrossRef]
  43. Sun, Y.; Zhou, S.; Chiang, P.-C.; Shah, K.J. Evaluation and Optimization of Enhanced Coagulation Process: Water and Energy Nexus. Water-Energy Nexus 2019, 2, 25–36. [Google Scholar] [CrossRef]
  44. Behin, J.; Aghajari, M. Influence of Water Level on Oil–Water Separation by Residence Time Distribution Curves Investigations. Sep. Purif. Technol. 2008, 64, 48–55. [Google Scholar] [CrossRef]
  45. Li, J.; Gu, Y. Coalescence of Oil-in-Water Emulsions in Fibrous and Granular Beds. Sep. Purif. Technol. 2005, 42, 1–13. [Google Scholar] [CrossRef]
  46. Yang, L.; Yu, J.; Ju, M.; Luo, B.; Wang, Z.; Hu, G. Intelligent Monitoring and Controlling Technology of Water Injection in Ultra-Low Permeability Reservoir of Ordos Basin. In Proceedings of the International Field Exploration and Development Conference 2017; Springer: Berlin/Heidelberg, Germany, 2018. [Google Scholar]
  47. Silva, G.; Correia, B.; Cunha, A.; Santos, B.; Lima, A. Water Injection for Oil Recovery by Using Reservoir Simulation Via Cfd. Int. J. Multiphysics 2017, 11, 83–96. [Google Scholar]
  48. El-Sayed, M.; Ramzi, M.; Hosny, R.; Fathy, M.; Moghny, T.A. Breakthrough Curves of Oil Adsorption on Novel Amorphous Carbon Thin Film. Water Sci. Technol. 2016, 73, 2361–2369. [Google Scholar] [CrossRef]
  49. El-Maghrabi, H.H.; Hosny, R.; Ramzi, M.; Fathy, M. Novel Mesoporous Silica (Mcm-41) and Its Characterization for Oil Adsorption from Produced Water Injected in Water Injection Projects Using Fixed Bed Column Processes. Desalin Water Treat 2017, 60, 70–77. [Google Scholar] [CrossRef]
  50. Hollanda, L.R.; Santos, S.B.F.; Faustino, J.G.A.A.; Dotto, G.L.; Foletto, E.L.; Chiavone-Filho, O. Oil Field–Produced Water Treatment: Characterization, Photochemical Systems, and Combined Processes. Environ. Sci. Pollut. Res. 2021, 28, 52744–52763. [Google Scholar] [CrossRef]
  51. Das, N.; Rajput, H.; Hassan, A.A.; Kumar, S. Application of Different Coagulants and Cost Evaluation for the Treatment of Oil and Gas Produced Water. Water 2023, 15, 464. [Google Scholar] [CrossRef]
  52. Khor, C.M.; Wang, J.; Li, M.; Oettel, B.A.; Kaner, R.B.; Jassby, D.; Hoek, E.M.V. Performance, Energy and Cost of Produced Water Treatment by Chemical and Electrochemical Coagulation. Water 2020, 12, 3426. [Google Scholar] [CrossRef]
  53. Al Hawli, B.; Benamor, A.; Hawari, A.A. A Hybrid Electro-Coagulation/Forward Osmosis System for Treatment of Produced Water. Chem. Eng. Process.-Process Intensif. 2019, 143, 107621. [Google Scholar] [CrossRef]
  54. Shah, M.T.; Parmar, H.B.; Rhyne, L.D.; Kalli, C.; Utikar, R.P.; Pareek, V.K. A Novel Settling Tank for Produced Water Treatment: Cfd Simulations and Piv Experiments. J. Pet. Sci. Eng. 2019, 182, 106352. [Google Scholar] [CrossRef]
  55. Zeliff, T.; Gallegos, C.; Alghamdi, K.; Goettsche, D.; Bernards, M. Hydrocyclone Separation in Combination with Mature Separation Techniques to Treat Produced Water. In Waste-Management Education Research Conference (WERC) 2021; IEEE: Piscataway, NJ, USA, 2021. [Google Scholar]
  56. Abdelrazeq, H.; Khraisheh, M.; Ashraf, H.M.; Ebrahimi, P.; Kunju, A. Sustainable Innovation in Membrane Technologies for Produced Water Treatment: Challenges and Limitations. Sustainability 2021, 13, 6759. [Google Scholar] [CrossRef]
  57. Wang, Z.; Wu, M.; Liang, X.; Huang, N.; Li, X. A Novel Vortex Flocculation Reactor for Efficient Water Treatment: Kinetic Modeling and Experimental Verification. Chem. Eng. Process.-Process Intensif. 2023, 183, 109245. [Google Scholar] [CrossRef]
  58. Kolmogorov, A.N. A Refinement of Previous Hypotheses Concerning the Local Structure of Turbulence in a Viscous Incompressible Fluid at High Reynolds Number. J. Fluid Mech. 1962, 13, 82–85. [Google Scholar] [CrossRef]
  59. Wang, L.-P.; Chen, S.; Brasseur, J.G.; Wyngaard, J.C. Examination of Hypotheses in the Kolmogorov Refined Turbulence Theory through High-Resolution Simulations. Part 1. Velocity Field. J. Fluid Mech. 1996, 309, 113–156. [Google Scholar] [CrossRef]
  60. Ban, Y.; Liu, L.; Du, J.; Ma, C. Investigation of the Treatment Efficiency and Mechanism of Microporous Flocculation Magnetic Fluidized Bed (Mfmfb) Reactor for Pb (Ii)-Containing Wastewater. Sep. Purif. Technol. 2024, 334, 125963. [Google Scholar] [CrossRef]
  61. Zhengong, T. Study on the Technology of Vortex Clarification and Its Application in Wastewater Treatment. Nat. Environ. Pollut. Technol. 2013, 12, 537. [Google Scholar]
  62. Dai, H.; Qiu, Z.; Hu, F.; Gao, C.; Chen, Y.F.; Zhou, Z. Floc Performance Parameters during Water Treatment in a Micro-Vortex Flocculation Process Determined by Machine Vision. Environ. Technol. 2019, 40, 3062–3071. [Google Scholar] [CrossRef] [PubMed]
  63. Meng, Q. The Impacts of Fracking on the Environment: A Total Environmental Study Paradigm. Sci. Total Environ. 2017, 580, 953–957. [Google Scholar] [CrossRef] [PubMed]
  64. GB 50428-2015; Code for Design of Oil Field Produced Water Treatment. Ministry of Housing and Urban-Rural Development of the People’s Republic of China (MOHURD): Beijing, China, 2015.
  65. Dai, H.; Cao, Z.; Hu, F.; Huang, B.; Wang, Y.; Luo, W. Research on Water Treatment of Kongmu-Lake Based on Micro Vortex Flocculation Technology with the Combination of Vortex Reactor. In IOP Conference Series: Earth and Environmental Science; IOP Publishing: Bristol, UK, 2019. [Google Scholar]
  66. Vendramel, S.; Bassin, J.P.; Dezotti, M.; Sant’Anna, G.L., Jr. Treatment of Petroleum Refinery Wastewater Containing Heavily Polluting Substances in an Aerobic Submerged Fixed-Bed Reactor. Environ. Technol. 2015, 36, 2052–2059. [Google Scholar] [CrossRef] [PubMed]
  67. Xie, W.; Li, B.; Xu, Y.; Hui, X.; Tang, L.; Zhang, W.; Wang, Z.; Zhu, J. Produced Water Treatment System and Process. Available online: https://patents.google.com/patent/CN109455831B/en (accessed on 31 August 2021).
  68. Xie, W.; Li, B.; Zhuang, D.; Hui, X.; Yang, Q.; Liu, H.; Lv, C.; Tang, L.; Li, F.; Zhang, W. A Kind of Degreasing Unit. Available online: https://patents.google.com/patent/CN207566940U/en (accessed on 3 July 2018).
  69. Xie, W.; Li, B.; Xu, Y.; Hui, X.; Tang, L.; Zhang, W.; Wang, Z.; Zhu, J. A Kind of Degreasing Unit. Available online: https://patents.google.com/patent/CN207175538U/en (accessed on 3 April 2018).
Figure 1. Schematic diagram of natural settling tank and coagulation sedimentation tank.
Processes 12 01092 g001
Figure 2. Typical oil removal process and filtration process of oilfield-produced-water treatment.
Processes 12 01092 g002
Figure 3. The MOR (multifunctional oil removal) equipment at the oilfield union station.
Processes 12 01092 g003
Figure 4. (a) The main components of the equipment. (b) Three main chambers of the equipment: NR (natural oil removal) chamber; CR (chemical reaction) chamber; and CS (coagulation sedimentation) chamber. The arrows in the figure indicate the direction of the water flow.
Processes 12 01092 g004
Figure 5. (a) The micro-vortex flow reaction principle. (b) The polyhedral hollow spheres micro-vortex flow reactor.
Processes 12 01092 g005
Figure 6. Schematic of the honeycomb inclined tubes used in the CS chamber: (a) cross-sectional view, (b) 3D view.
Processes 12 01092 g006
Figure 7. A comparison of (a) oil and (b) suspended solids removal efficiency with/without micro-vortex flow reactors.
Processes 12 01092 g007
Figure 8. Oil content (a) and suspended solids content (b) of the “natural settling tank + coagulation sedimentation tank” process were measured at the union station.
Processes 12 01092 g008
Figure 9. Oil content (a) and suspended solids content (b) of the MOR equipment were measured.
Processes 12 01092 g009
Figure 10. The MOR equipment achieves the functions of a natural settling tank, coagulation sedimentation tank, and buffer tank.
Processes 12 01092 g010
Figure 11. (a) Observing the long-term performance of oil removal by applying MOR equipment; (b) observing the long-term performance of suspended solids removal by applying MOR equipment.
Processes 12 01092 g011
Table 1. Recommended water injection parameters based on permeability rates [30].
NumberPermeability Rate (K)
(mD)
Oil
(mg/L)
Suspended Solids (mg/L)
10.5 to 2.0≤30.0≤25.0
20.05 to 0.5≤15.0≤20.0
30.01 to 0.05≤10.0≤15.0
4<0.01≤5.0≤8.0
Table 2. Dosage Combinations for Chemical Addition Experiment.
NumberCoagulant
(mg/L)
Flocculant
(mg/L)
Oil Removal Rate
(%)
Suspended
Solids Removal Rate
(%)
116.00.5A1B1
216.01.0A2B2
322.00.5A3B3
422.01.0A4B4
Table 3. Chemical combination test results.
NumberCoagulant (mg/L)Flocculant (mg/L)Influent Oil
(mg/L)
Effluent Oil
(mg/L)
Oil
Removal (%)
Influent Suspended Solids
(mg/L)
Effluent Suspended Solids
(mg/L)
Suspended Solids Removal (%)
116.00.582.919.376.732.2 17.8 44.7
216.01.0113.218.983.336.2 22.0 39.2
322.00.5243.313.494.548.0 18.8 60.8
422.01.0108.113.187.938.8 15.8 59.3
Table 4. Coagulant and flocculant combination test AOR and ASR results.
NumberDosage
(mg/L)
AOR
(%)
ASR
(%)
10.5 (F *)85.652.8
21.0 (F *)85.649.3
316.0 (C *)80.042.0
422.0 (C *)91.260.1
* “F” means the flocculant; “C” means the coagulant.
Table 5. MOR equipment operation without micro-vortex flow reactors under different coagulant concentrations.
NumberCoagulant (mg/L)Flocculant (mg/L)Influent Oil
(mg/L)
Effluent Oil
(mg/L)
Oil
Removal (%)
Influent
Suspended Solids
(mg/L)
Effluent Suspended Solids
(mg/L)
Suspended Solids
Removal (%)
10.00.0282.964.477.238.222.241.9
24.00.5152.625.583.360.42263.6
310.00.5156.219.187.82826.16.8
416.00.5142.919.386.532.217.844.7
522.00.5243.313.494.54818.860.8
628.00.5160.114.590.956.617.668.9
734.00.5137.46254.964.461.84.0
Table 6. MOR equipment with micro-vortex flow reactors under different coagulant concentrations.
NumberCoagulant (mg/L)Flocculant (mg/L)Influent Oil
(mg/L)
Effluent Oil
(mg/L)
Oil
Removal (%)
Influent
Suspended Solids
(mg/L)
Effluent Suspended Solids
(mg/L)
Suspended Solids
Removal (%)
10.00.0284.337.187.052.121.858.2
24.00.5121.311.990.234.619.842.8
310.00.567.53.195.4508.583.0
416.00.5255.66.597.528.212.157.1
522.00.5145.46.395.727.818.334.2
628.00.568.33.694.723.811.950.0
734.00.583.353.835.458.145.721.3
Table 7. Comparative Experiment of MOR Equipment and “dual-tank” Oil Removal Process.
ProcessesSampling PointRetention Time
(h)
Average Oil (mg/L)Average
Suspended Solids
(mg/L)
Oil Removal
(%)
Suspended Solids
Removal (%)
InflowInlet line 172.736.1--
Natural
settling
Effluent of the union station’s natural settling tank7.570.132.459.410.2
Effluent of NR chamber2.588.230.948.914.4
Coagulation sedimentationEffluent of union station’s coagulation sedimentation tank6.542.816.475.254.6
Effluent of CS chamber2.07.511.195.769.3
Table 8. The Variance and Mean of Produced Water Treatment Results by the MOR Equipment.
Days of
Operation
Oil Removal Rate Average (%)Oil Removal Rate VarianceSuspended
Solids Removal Rate Average (%)
Suspended
Solids Removal Rate Variance
Days 1 to 3093.312.363.1233.6
Days 31 to 6093.611.464.4222.9
Days 61 to 8096.04.170.247.6
Whole period94.210.865.4187.3
Disclaimer/Publisher’s Note: The statements, opinions and data contained in all publications are solely those of the individual author(s) and contributor(s) and not of MDPI and/or the editor(s). MDPI and/or the editor(s) disclaim responsibility for any injury to people or property resulting from any ideas, methods, instructions or products referred to in the content.

