Article

Kinetics of Vegetable Oils (Rice Bran, Sunflower Seed, and Soybean) Extracted by Pressurized Liquid Extraction in Intermittent Process

by
Paulo Rodolfo Ramos
1,
Joyce Sponchiado
1,
João Victor Febrônio Echenique
1,
Gustavo César Dacanal
2,* and
Alessandra Lopes de Oliveira
1,*
1
Laboratory of High-Pressure Technology and Natural Products (LTAPPN), Department of Food Engineering, Faculty of Animal Science and Food Engineering (FZEA), University of São Paulo (USP), Av. Duque de Caxias Norte, 225, Pirassununga 13635-900, SP, Brazil
2
Laboratory of Fluid Dynamics and Characterization of Particulate Systems (LAFLUSP), Department of Food Engineering, Faculty of Animal Science and Food Engineering (FZEA), University of São Paulo (USP), Av. Duque de Caxias Norte, 225, Pirassununga 13635-900, SP, Brazil
*
Authors to whom correspondence should be addressed.
Processes 2024, 12(6), 1107; https://doi.org/10.3390/pr12061107
Submission received: 22 April 2024 / Revised: 22 May 2024 / Accepted: 24 May 2024 / Published: 28 May 2024
(This article belongs to the Special Issue Separation and Extraction Techniques in Food Processing and Analysis)

Abstract

:
The research focuses on optimizing vegetable oil production processes for human consumption, emphasizing green and efficient extraction methods using renewable solvents with minimal toxic residues. Pressurized liquid extraction (PLE), especially with ethanol, is studied for its efficiency and low solvent usage in intermittent processes. By evaluating extraction parameters and kinetics, the study aims to determine optimal conditions for higher extraction rates and yields, providing insights into production costs and other factors. Specifically, the research examines the behavior of extraction kinetics for vegetable oils like rice bran, sunflower seeds, and rolled soybeans. It also seeks to determine mass diffusivity in semi-continuous processes and to model PLE in intermittent processes using Fick’s Law and Mathematica Wolfram Software v11.2. The effective diffusivity (Deff) for rice bran oil in pressurized ethanol varied between 13.09 and 15.70 × 10⁻¹² m2/s, and the Deff value of sunflower seed oil was between 8.10 and 12.60 × 10⁻¹² m2/s. For rolled soybean oil, the Deff value ranged from 17.25 to 31.29 × 10⁻¹² m2/s. The mass diffusivity values of vegetable oils in pressurized ethanol remained within the same order of magnitude. The mass diffusivity for PLE in an intermittent process presented values of 5.97 × 10⁻¹² m2/s for rice bran oil with 3 extraction cycles. The Deff value for sunflower seed oil in pressurized ethanol was 1.38 × 10⁻¹² m2/s, with 4 cycles, and for rolled soybeans, the Deff value was 1.77 × 10⁻¹² m2/s in 3 cycles. The Deff value found in the intermittent extraction process was lower than that in the semi-continuous process. The total solvent renewal in the semi-continuous extraction process significantly impacted the diffusivity values for all extracted oils, as this process utilizes much more solvent compared to the intermittent process for all matrices studied. Various factors, including geometry, average particle diameter, extraction temperature, and rinse solvent volume, can affect the differences in curve behavior between the semi-continuous and intermittent processes. Despite these factors, the intermittent process is considered more viable for implementation due to its favorable economic and environmental characteristics, primarily because it requires a much smaller amount of solvent.

1. Introduction

Vegetable oils are important sources of micronutrients such as tocopherol, phospholipids, sterols, carotenoids, etc., and find widespread use in human nutrition, in the pharmaceutical or cosmetics industry. Unlike fossil oils, vegetable oils come from renewable sources and it is estimated that by 2025, the consumption of these oils will grow by up to 5.12% [1]. Rice oil, sunflower oil, and soybean oil are some examples of these vegetable oils.
Brazil ranks ninth globally in rice production, with production of 11.66 million tons in 2021, while world production was 742.54 million tons [2]. Rice bran is a by-product obtained during the rice milling process, comprising the outer layers of the grain removed along with the starchy endosperm. It is rich in lipids, with oil content ranging from 10 to 23%, and low moisture content (6–7%). In addition, it serves as an excellent source of protein, vitamins B and E, and contains antioxidants in small amounts, which are considered beneficial in reducing cholesterol in humans. Rice bran is also widely used in animal feed due to its oily nature, which makes it an excellent binder for animal feed [3].
Sunflower oil holds significant importance in the global vegetable oil market, being among the four most used oilseeds worldwide. Approximately 90% of sunflower oil produced is intended for human consumption [4]. Sunflower oil exhibits therapeutic potential and possesses important nutritional qualities, serving as a source of vitamin E. It can also function as a natural source of antioxidants when incorporated into other products to enhance nutritional value or extend shelf life.
According to Gasparetto et al. [5], soybean production in 2021 amounted to 360,000 thousand metric cubes, and most of this production is intended for the production of edible oil (about 80%). This oil is directly employed in food preparation, integrated into various products, or serves as a precursor for biodiesel production.
Currently, the industrial extraction process of vegetable oils uses mechanical extraction, solvent extraction, and a mix of both. Mechanical extraction, which consists of pressing the raw material, with a low yield, and solid-liquid extraction using organic solvent (hexane) is considered the most efficient process for obtaining vegetable oils [6]. However, extraction with n-hexane, or a combination of mechanical extraction with n-hexane usage, yields higher results. Hexane, a solvent derived from petroleum, poses health risks due to its toxicity to humans [5,7,8].
The yield presented by hexane compared to other organic solvents remains a barrier to the adoption of new extraction methods using less aggressive solvents, such as ethanol [5,9]. Consequently, recent studies have demonstrated the need to reduce or eliminate the use of toxic organic solvents (such as hexane) through the optimization of vegetable oil extraction processes.
In the search for environmentally friendly solutions, pressurized liquid extraction (PLE), using ethanol, emerges as a viable alternative for the extraction of oils and polar compounds due to the polar and non-polar characteristics of its molecules [10]. This is exemplified in the work of Ramos et al. [11] who evaluated the scale-up of pressurized ethanol extraction equipment to obtain soybean oil.
Another study, Rodrigues et al. [12] employed pressurized liquid in an intermittent process as an alternative to obtaining alcoholic extract from passion fruit leaves (Passiflora edulis), which results showed that this process requires less solvent and produced extracts with the same quality as the extract obtained using conventional solvents.
One of the critical parameters considered when analyzing the feasibility of extracting vegetable oils is the extraction yield. The aim is to maximize yield by reducing process costs, such as raw materials, energy consumption, and process time, for example. The latter is an important factor directly related to the production cost, since quicker production with consistent quality leads to higher profits [13].
To reduce process time, the study of extraction kinetics can evaluate the impact of various parameters (Temperature, Pressure, etc.) on extraction time. Effective diffusivity, inherent to the system used, is one of the properties that can indicate extraction speed, depending on the solvent and matrix employed. This is due to differences in density and viscosity of solvents and the format of the matrix used.
Moreover, system temperature and pressure can also interfere with diffusivity and it has been demonstrated that an increase in the system temperature or pressure increases diffusivity [14,15].
Furthermore, the study of the extraction kinetics can assist in the extraction of compounds of specific interest, as shown in the work by Segovia et al. [16] where the authors evaluated the effect of temperature and the use of different ultrasound levels on the extraction of polyphenols from avocado seeds. Also in this study, the Fick’s law was used to estimate the effective mass diffusivity of polyphenols as a function of temperature and ultrasound level.
As the concentration of oil in the solvent approaches equilibrium concentration, diffusion from the matrix to the solvent becomes slow and challenging, leading to high costs for low yield. The diffusivity of the matrix oil (both the surface and the inner portion) depends directly on parameters such as temperature, pressure, size, shape, and porosity of the particle. Mathematical models enable the estimation of effective mass diffusivity of a matrix/solvent pair by considering joint analysis of the physicochemical and geometric properties of the matrix used [6,14].
One such the mathematical model used is Fick’s Law, which reports that the mass flow is proportional to the concentration gradient, that is, the greater the concentration at the mass origin point, the greater the flow, and in the opposite direction to the concentration, thus occurring from the direction of greater concentration to that of lower concentration.
Authors assert that Fick’s law accurately represents the model of solute extraction kinetics in different solvents, exemplified in the study by Kabuba and Huberts [17], where steam was employed to investigate process parameters in extracting essential oil from Eucalyptus grandis leaves.
Taking the aforementioned points into consideration, the study of the kinetic profile of the extraction of vegetable oils (rice bran, sunflower seeds, and rolled soybean) can help in identifying the most profitable extraction range, reducing costs and optimizing the extraction process. Coupled with the use of non toxic solvents like ethanol, this approach can aid in evaluating the economic viability of vegetable oil extraction using ethanol. Thus, this study evaluated the kinetic profile of rice bran, sunflower seed, and rolled soybean oils extracted with ethanol, a solvent that mitigates issues with oil toxicity.

2. Material and Methods

2.1. Sample Preparation

Rice bran was kindly provided by Tech Bran (Pelotas, RS, Brazil), a specialist in rice bran stabilization. This raw material underwent special treatment to inactivate lipase, which is responsible for the transformation of triglycerides into free fatty acids. Sunflower seeds were supplied by company Caramuru Sementes (Itumbiara, GO, Brazil), and the rolled soybean was kindly provided by Bunge® (Jaguaré, SP, Brazil).
Sunflower seeds were selected, peeled, and dried using an oven with forced circulation. Rolled soybeans were separated into plastic packaging. Subsequently, the matrices were then stored in a freezer (−20 °C), protected from humidity and from light until extraction. Rice bran did not require additional processes from the reception moment until the extraction moment, except for storage in freezer in the absence of humidity and light.

2.2. Average Particle Size

The rice bran, sunflower seed, and rolled soybean were sieved using Tyler series sieves and a shaker ranging from 10 to 48 mesh (2 to 0.3 mm) to determine the particle size and average size of each particle. The average particle diameter was determined according to Equation (1).
d m = i = l n ( W i . d i ) i = l n W i
where: di is the nominal opening of the i-th sieve (mm); di+1 is the nominal sieve opening greater than the i-th sieve (mm); Wi is the mass of the material retained in the i-th sieve (g).
Rolled soybean particles were treated as flat plates. Therefore, a caliper was used to determine particle size. In the characterization of rolled soybean particles, 30 measurements were carried out and the largest width obtained in each measurement was used as the diameter, as shown in Figure 1.
Equation (2) shows how the average diameter of rolled soybean particles was determined [11].
d m = i = l n d i n
where: di is the diameter (mm) of each soybean flake, experimentally measured with caliper rule and n is 30.

2.3. Pressurized Liquid Extraction in Intermittent Process

Pressurized liquid extractions were carried out using ethanol anhydrous (99.5%) (Dinâmica Química Contemporânea Ltda., Indaiatuba, Brazil) in ASE 150 Dionex (Thermo Fisher Scientific, Newington, CT, USA). The variables analyzed were extraction temperature (T), static time (St) (contact time of the solvent with the matrix), number of cycles (C), and rinse solvent volume (VS, represented by the cell size percentage). After variable screening, the optimization of the PLE process was carried out according to a central composite rotational design (CCRD 22) applied to the variables temperature (T) and the number of cycles (C) in the extraction yield as presented by Ramos et al. [11]. For example, using the 100 mL extraction cell with 80% rinse volume and 4 cycles, the total rinse volume will be 80 mL and at each cycle, and 20 mL will be pumped into the extractor.
Different extraction cell masses and volumes were used depending on the mass quantity of samples. For rice bran, 10 g of sample was weighed in the 34-mL cell. For the extraction of sunflower oil, a 66-mL cell with sunflower seed mass of 20 g was used. For the extraction of soybean oil, 40 g was inserted into the 100-mL extraction cell.
The sample mass was inserted into the extraction cell with the filter, and the cell was taken to the PLE equipment oven. The extraction cell was filled with ethanol, pressurized at 10.34 MPa (the operating pressure of laboratory-scale equipment) and heated to the extraction temperature to start the first cycle.
After the time of the first cycle, the oil-solvent mixture corresponding to the rinse volume (VS) was purged and at the same time, the same amount of solvent was pumped into the cell, starting the second cycle. This process was repeated until the end of the last expected cycle, where all remaining oil-solvent mixture was purged with the aid of constant and high-pressure N2 flow.
The oil-solvent mixture was taken to the evaporator in 250-mL glass bottles at 50 °C, for complete solvent removal and recovery, obtaining the crude oil, from which the extraction yield and recovery percentage of oil from the matrix are calculated by the ratio between the oil mass obtained and the dry sample mass initially inserted into the extractor.
To understand and model the intermittent process of extracting vegetable oils with pressurized ethanol, the semi-continuous extraction process was applied under optimized PLE conditions in an intermittent process for the three vegetable matrices. The semi-continuous process was necessary to calculate the mass diffusivity (Deff, m2/s2) by studying the behavior of the extraction kinetics of the three different oils. Modeling the semi-continuous process allowed predicting the kinetic behavior of the intermittent process.
To better understand the design of experiments, the modeling was discussed in two different cases, case study 1 (semi-continuous process) and case study 2, intermittent process.

2.4. Mathematical Modeling of the Extraction Kinetics

This work considered two case studies for the mathematical modeling of extraction kinetics. Case study 1 assumed the analytical model of Fick’s Second Law for spheres (rice bran, sunflower seed) and for flat plates (soybean flakes) which concerns the physics of one-dimensional mass transfer by continuous diffusion. Additionally, case study 1 also evaluated the constant extraction rate period combined with the diffusion model. Case study 2, on the other hand, examined the extraction through an intermittent process (extract purge in each cycle). The mathematical model applied in case 2 assumed sequential batches of the Fick’s Second Law analytical model. The Levenberg–Marquardt optimization method was chosen to perform the least squares regression analysis by applying Equation (6), using the Mathematica Wolfram Software v.11.2.

2.4.1. Case Study 1: Semi-Continuous Process or General Extraction Curve

Extractions were carried out until the oil inside the matrix was fully extracted, that is, until it was no longer possible to extract oil from the matrix. Due to variation in geometry, size, and oil concentration which were different in each matrix, as well as the amount of mass and the solvent volume inside the cell.
Regardless of cell volume and sample mass used, the extraction process was carried out by weighing the sample mass (10, 20, or 40 g) and inserting it into the extraction cell with a cellulose filter (ASE extraction filters, Product 056780, Thermo Scientific, Newington, CT, USA) at the bottom of the cell to avoid clogging the extraction cell. Subsequently, the cell was introduced into the PLE oven, filled with ethanol, and heated to the process temperature (70, 75, 80, and 85 °C), values within the optimized range but not extreme (above 100 °C). For the semi-continuous process, no solvent rinse volume was used, only that necessary to fill all empty spaces in the extraction cell.
After the desired temperature was reached, the extraction process began and extracts were collected every 10 min until full extraction. The collected oil-solvent mixture was then transferred to a pre-weighed 250 mL glass bottle for subsequent solvent recovery and oil separation using a rotary evaporator (MARCONI, MA-120, Piracicaba/SP) at approximately 50 °C for approximately 25 min. As the extraction cycles progressed, the amount of oil extracted decreased leading to a reduction in evaporation time over successive stages.
This process was repeated as many times as necessary until the difference between the initial and final mass of the glass flask after evaporation, equaled zero. With each subsequent collection, the quantity of recovered oil diminished, and the kinetic analysis considered the amounts of oil recovered in each collection on a non-cumulative basis.
After complete solvent removal, the flask was weighed again and its yield (Y) and oil recovery percentage (OR) were calculated (Equation (3) and Equation (4), respectively).
Y ( % ) = m r e c m r a w   m a t e r i a l × 100
O R ( % ) = Y ( % ) × 100 O i l   C o n t e n t
where Y is the extraction yield; mrec is the oil mass after rotary evaporation; mraw material is the soybean, sunflower seeds or rice bran mass placed in the extractor, OR—oil recovery, and Oil Content is the amount of oil present in the raw material, 22.37 ± 0.05 (g of oil/100 g of raw material) for soybeans, 55.07 ± 0.30 (g/100 g) for sunflower seeds and 20.9 ± 0.1 (g/100 g) for rice bran.
The Fick’s diffusion model was used to determine the mean mass diffusivity (Deff, m2/s2). Initially, particles were considered to have spherical shape, so the model was adjusted to the kinetic profile according to Equation (5) [18,19].
c t = D e f f ( 2 c r 2 + 2 r   c r )
where: Deff is the effective mass diffusivity coefficient; c (g/g) is the dry extract concentration distributed throughout the particle; r (m) is the particle radius; t (s) is the time.
Using the boundary conditions of the dry extract concentration on the surface of particles (C1eq = 0) and the total amount of dry extract (C1) that migrates from the particle to the solvent, the analytical solution (Equation (6)) can be obtained [18].
C r = 6 π 2   n = 1 1 n 2   e x p ( n 2 π 2 D e f f t R s 2 )
where Rs2 is half of the mean diameter (dm), previously determined by particle distribution analysis.
Cr is defined by Equation (7).
C r = C 1 C 1 e q C 1 i n C 1 e q
where Cr is the concentration; C1in (g/g) is the initial dry extract concentration in the solid domain; C1eq (g/g) is the equilibrium concentration for the solvent phase, considered zero under the conditions under analysis.
The analysis carried out considered residual concentration in the particle to be zero at equilibrium (C1eq = 0) and the initial oil concentration inside each matrix was obtained using Equation (8).
C 1 i n = m i n m o u t m i n
where min is the sample mass at the beginning of extraction and mout is the sample mass at the end of the last extraction (in which oil could no longer be extracted from the particle).
Using the Fick’s law for cylindrical coordinates, it was possible to determine the effective mass diffusivity (Deff) for each temperature and each matrix (rice bran, sunflower seed, and rolled soybean).
For rolled soybean, diffusivity analysis was carried out taking into account its shape, and the Fick’s model for flat plates was used, since the shape of rolled soybean, although irregular and based on its thickness and average diameter, both measured using digital caliper with diameter much larger than the thickness, is more similar to the flat plate model than to the spherical model, since the diameter of rolled soybeans is much larger than their thickness. Thus, Equation (9) was used to estimate the Deff value.
C r = m t m = 1 n = 0 8 ( 2 n 1 ) 2 π 2 exp { D ( 2 n 1 ) 2 π 2 t 4 l 2 }
where m is the dry extract mass, l is the soybean flask width.

2.4.2. Case Study 2: PLE in Intermittent Process

PLE in intermittent process was the current mechanism for obtaining vegetable oils and to evaluating the behavior of this form of extraction process, where the optimized extraction conditions of the analyzed oils were used (Table 1). The recovered oil, as calculated according to Equation (4), was quite significant compared to the lipid content in the samples. Specifically, for rice bran, oil recovery exceeded 100% (Table 1) because ethanol extracted minor polar compounds along with the oil, unlike hexane.
Extracts were roto-evaporated at 50 °C and placed in an air-circulating oven for 24 h at 105 °C to obtain the overall yield. In addition, all solvent volumes used in each cycle were recorded. In comparison to the semicontinuous process, the intermittent purging extraction process utilized a reduced volume of solvent and longer intervals between purges.
The extract concentration throughout the intermittent purging process (C2purge) was estimated using the initial matrix mass (min), the matrix mass at time i (mout), and the initial concentration (C in 1), determined by the complete removal of the extract obtained in case 1. The extract concentration in particles throughout each cycle or purge interval is equal to the difference between the initial extract mass present in matrix and the extract mass that was removed in each purging process by the leaf mass at purging time I (Equation (10)).
C 2 p u r g e = m i n .   C 1 i n ( m i n m o u t ) m o u t
Fick’s Law was used with adaptations to its boundary conditions. In the initial extraction cycle, Fick’s model for extracting the semi-continuous process was used. This model is described in Equation (11).
C r = C 2 C 2 e q C 1 i n C 2 e q
where C 2 i n = C 1 i n is the initial dry extract concentration.
For the other cycles, it was considered that the solvent limitation promoted incomplete extraction, where the residual dry extract concentration at the end of each cycle was represented by C 2 r e s (g/g). In this way, it could be concluded that the initial concentration in cycle 2 is equal to the residual (final) concentration in cycle 1 and so on, generally described by Equation (12).
C 2 ; ( i ) i n = C 2 ; ( i 1 ) r e s
Thus, Fick’s model used from the second cycle of each modeling (sample) is described in Equation (13)
C r = C 2 C 2 e q C 2 ; ( i 1 ) r e s C 2 e q

3. Results and Discussion

3.1. Average Particle Size Determination

For rice bran, the average diameter was 0.88 ± 0.03 and for sunflower seeds, it was 0.84 ± 0.03. The diameter of rolled soybeans samples was 7.58 ± 2.20 mm. The high deviation found in values demonstrates the disparity and irregularity in the shape of rolled soybeans. Soybeans were used in the rolled form because this is how the industry uses them for the extraction process, underscoring the importance of studying kinetics for this grain [11].
Authors have shown that particle size affects the extraction yield and, consequently, in this case, the extraction kinetics. Smaller particles have a larger contact area with the solvent, which facilitates diffusion into the particle and subsequent migration of the oil outwards towards the solvent [20,21].

3.2. Pressurized Liquid Extraction in Intermittent Process

Optimizations of extraction processes for rice bran, sunflower seed, and rolled soybean oils were carried out using a central composite rotational design (CCRD 22) and from these tests, the optimized conditions for the different vegetables were identified.
For rice bran, the highest oil recovery rate (130.42%) was identified at temperature of 107 °C, with three cycles, a rinse solvent volume of 60%, and static time of 8 min. For sunflower seed oil, the highest oil recovery rate (93.9%) was identified at 84 °C, with four cycles, rinse solvent volume equal to 110%, and static time of 5 min. As for rolled soybean oil, the highest oil recovery rate (86.16%) was identified at 80 °C, 3 cycles, 12 min of static time, and solvent volume of 60%. Although the optimum temperature for rice bran oil extraction was 107 °C, the maximum temperature used in kinetics was 95 °C, in order to avoid high degradation of triacylglycerols.

3.3. Process Kinetics and Modeling

3.3.1. Extraction Kinetics of the Semi-Continuous Process

Different numbers of collects were required to extract and deplete the oil in different matrices. For rice bran, 15 collections were carried out at each temperature. To obtain the sunflower oil profile, 12 collections were necessary at temperatures of 70, 75, and 80 °C and 15 collects at 85 °C. To deplete the oil contained in rolled soybeans, between 20 and 30 collections were required to remove all the oil from the matrix. Table 2 shows the temperatures and oil masses obtained in each test for building kinetics.
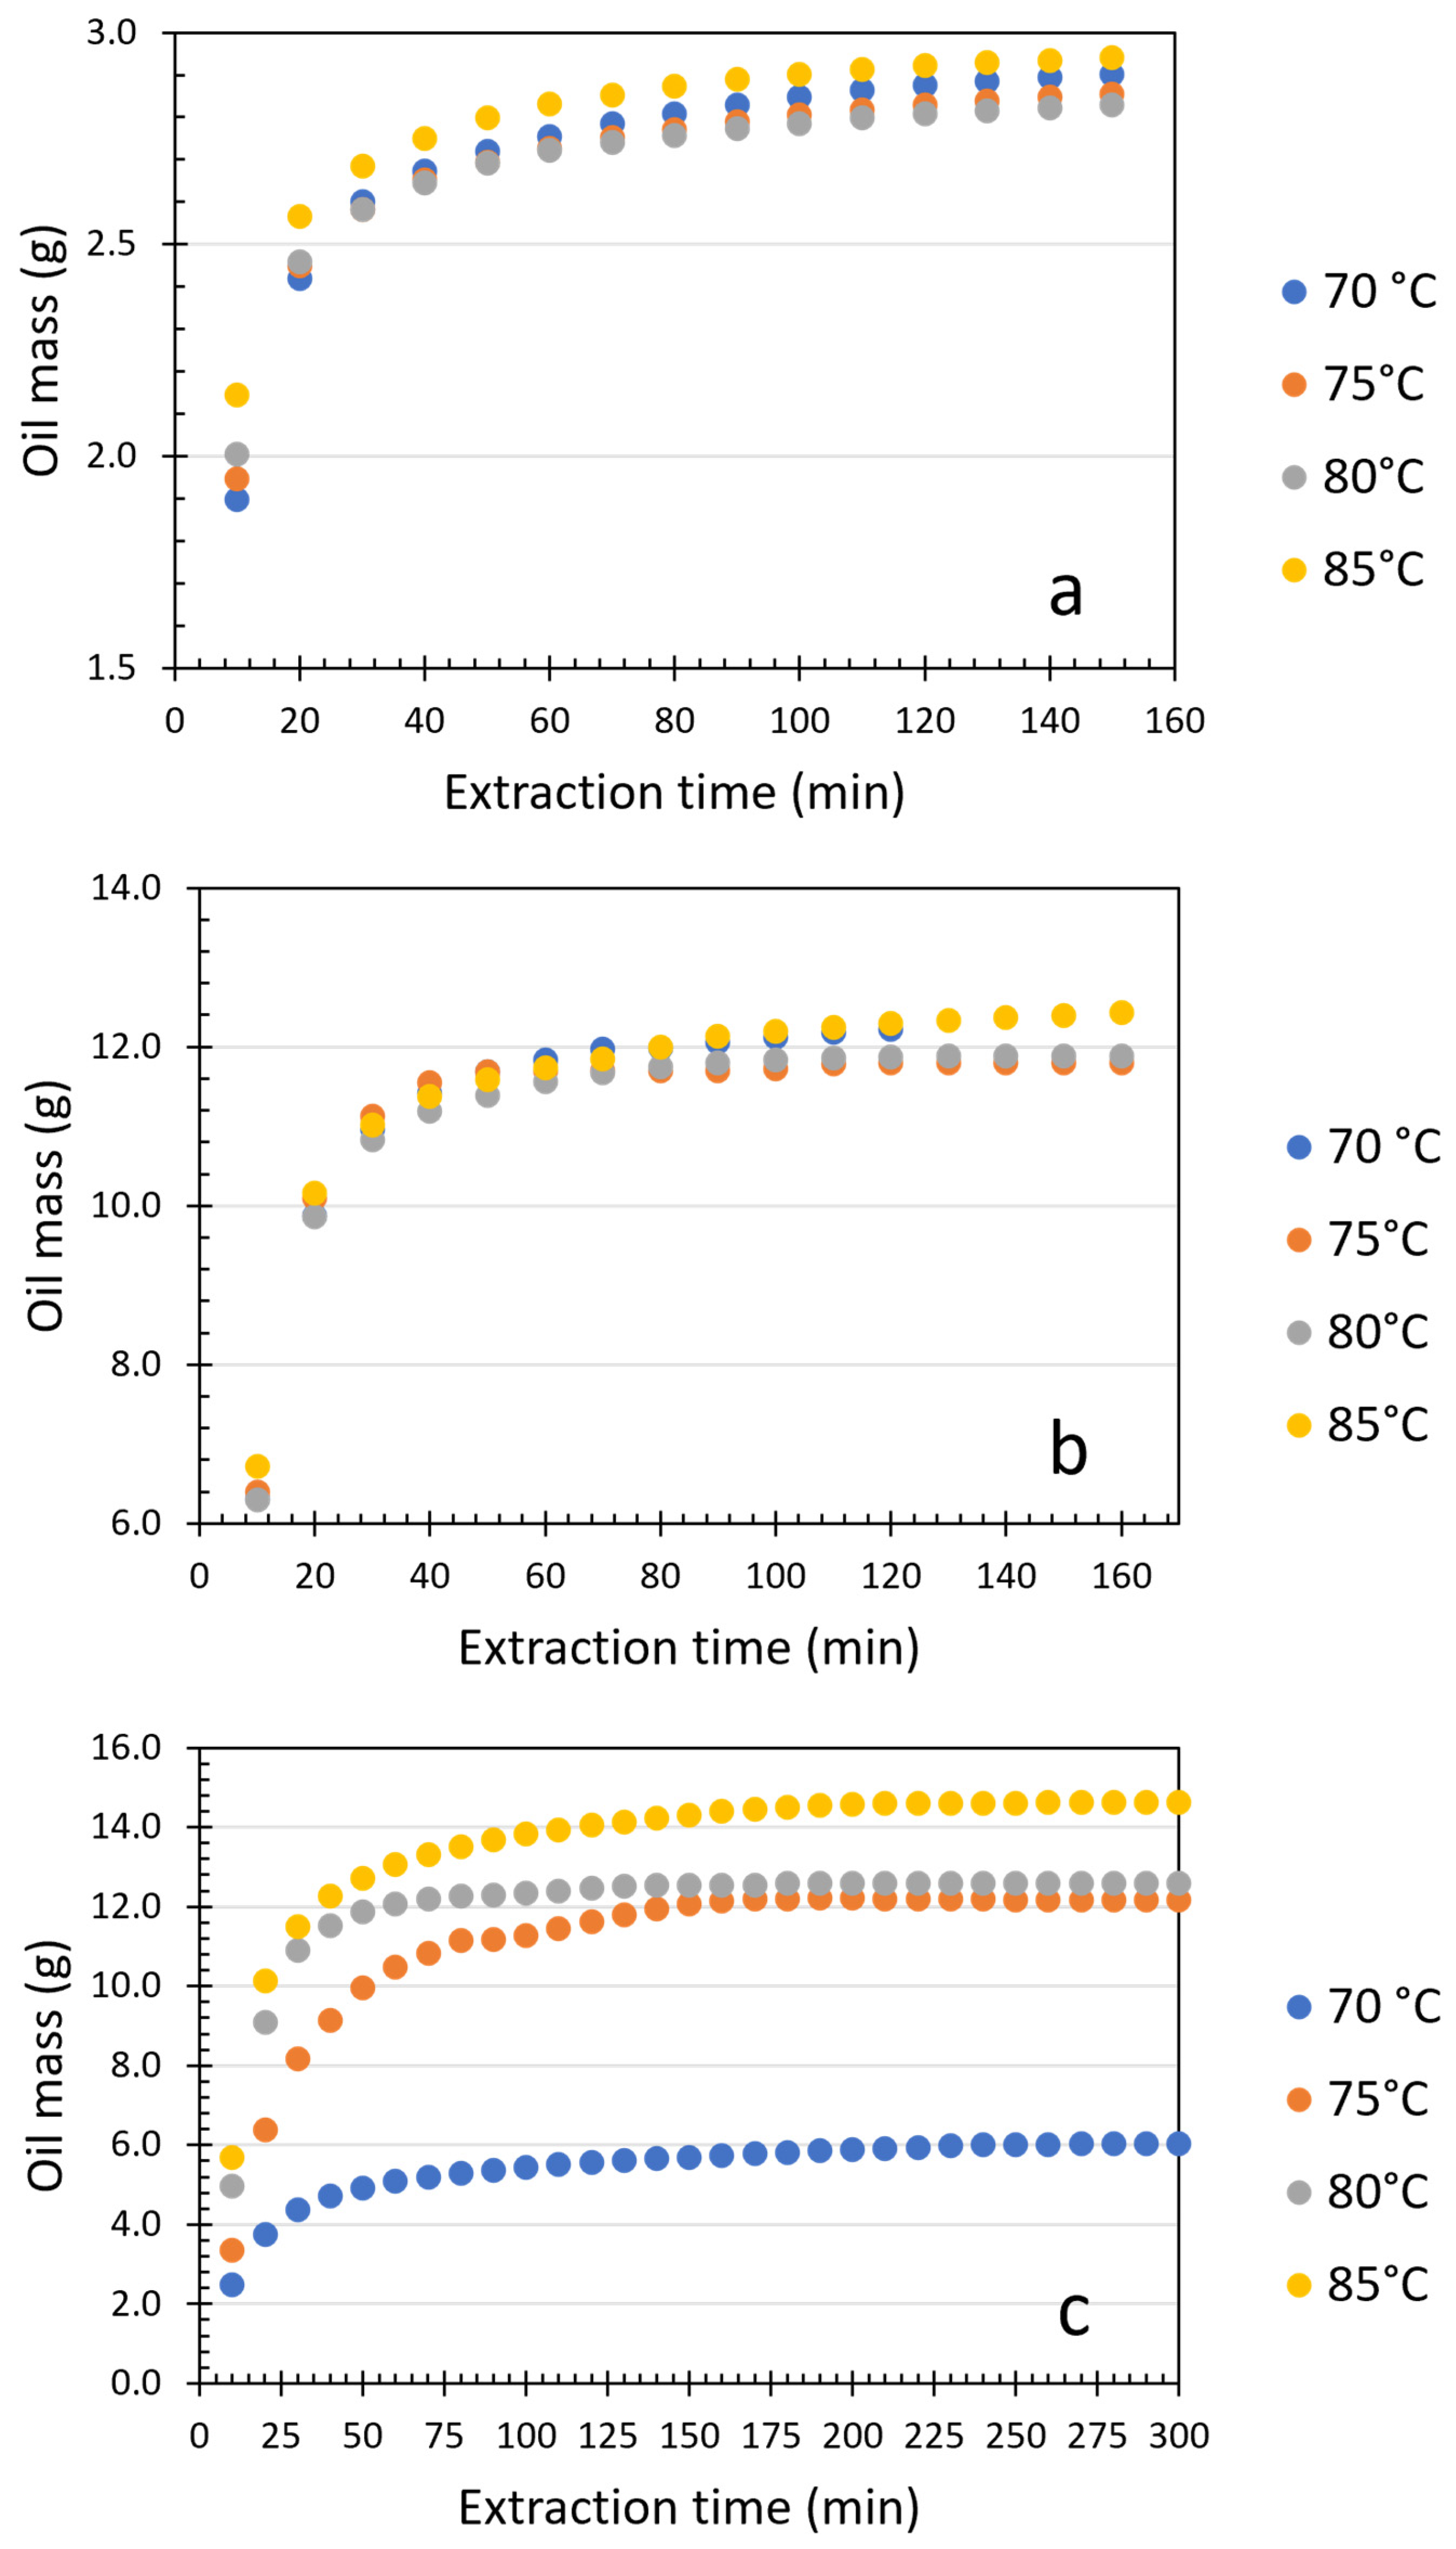
In the extraction of rice bran oil, an increase in the temperature of the first extraction led to a greater quantity of oil being obtained. Thus, at a temperature of 75 °C, 1.90 g of oil was obtained and at a temperature of 85 °C, 2.14 g of oil was obtained (Table 2). This aligns with reports from various authors indicating that extraction yield increases with temperature [10,11,22,23].
In subsequent extractions (from 1200 s), a pattern could not be observed with increasing temperature. However, the matrix depletion occurred at temperature of 85 °C, that is, at the highest temperature used in this analysis, it was faster than at lower temperatures, reaching stability in 6000 s (~1.7 h), while at the lowest temperature (75 °C), the time for reaching stability was 7200 s (2 h) (Table 2).
For sunflower seed oil, there was no pattern in the behavior of sunflower oil masses extracted at different temperatures, except in the first extraction stage, similar to rice bran oil, where at a temperature of 85 °C was obtained 6.72 g of sunflower oil while at a temperature of 75 °C only 6.31 g was obtained (Table 2).
Differently from that presented in the extraction of rice bran oil, at the highest temperature, there was a need for greater number of extractions to completely exhaust the sunflower seed oil. This may demonstrate that at higher temperatures, the solvent diffusion into the matrix is facilitated, thus increasing the extracted oil mass [6,15].
Regarding the extraction carried out on rolled soybean, between 23 and 30 collections were necessary to reach the point where it was no longer possible to extract oil from the matrix. At temperature of 70 °C, 2.49 g of oil was obtained in 600 s. As expected, with increase in temperature and keeping the extraction time constant, increased amount of oil was obtained, 3.75 g at 75 °C, 4.96 g at 80 °C and 5.69 g at 85 °C.
In general, for oils obtained from their respective matrices, it was observed that as the temperature increased, greater amount of oil was obtained and the matrix was exhausted more quickly. Figure 2 shows the oil mass accumulation curves at temperatures of 70, 75, 80, and 85 °C for extractions of rice bran (a), sunflower seed (b), and rolled soybean (c).
According to Figure 2, it is possible to verify that the constant extraction rate of rice bran oil occurred in the initial 10 min. Between 10 and 60 min, the period in which the extraction rate begins to decline occurs and from 60 min. onwards, the extraction rate is controlled. For sunflower seed oil, the period of constant extraction rate occurred in the first 20 min, with a decrease in the extraction rate between 20 and 60 min, and from that time onwards, the extraction rate is controlled.
As for soybean oil, the constant extraction rate was identified in the first 30 min., with a period of decreasing extraction rate between 30 and 200 min and a controlled rate was achieved from min 200 onwards. The constant extraction phase is the period during which the longer the oil is extracted and for this reason, it is the period most used in the industry for extracting vegetable oils [23].
It was observed that, regardless of the amount of oil extracted from each matrix, the behavior of the curves was the same with the increase in the amount of oil extracted as the temperature increased. It was also observed that for soybeans, the effect of temperature is very pronounced, especially when the temperature varies from 70 °C to 75 °C. As for rice bran and sunflower seeds, despite showing similar behavior, the variation in the mass extracted at lower and higher temperatures was not as pronounced.
Cornelio-Santiago et al. [23] studied the extraction yield of Brazil nut kernel oil with pressurized ethanol and demonstrated that the extraction yield increased from 78.86% at 60 °C to 87.91% at 90 °C. This is also reported by Oliveira et al. [24], who identified an increase in yield from 6.97% to 9.78% when the extraction temperature increased from 50 to 70 °C in the extraction of green coffee extract via PLE using ethanol as a solvent.
For industrial processes, it could be estimated that after extraction reaches its plateau (a point where the extraction rate is constantly low) the extraction cost becomes very high since it takes longer times to extract small amounts of oil. Therefore, it may be considered to interrupt the rice bran oil extraction process between 60 and 80 min, a period where the oil recovery percentage is greater than 99%.
For sunflower seed oil, extraction can be interrupted within 60 min, achieving oil recovery rate greater than 99%. As for soybean oil, oil recovery of 99% is achieved from minute 50 onwards when using a temperature of 85 °C.
For the analysis and determination of Deff values, the oil mass to particle mass ratio (Cr, g/g) was used. Cr was obtained from the matrix depletion experiment at temperatures of 70, 75, 80 and 85 °C.
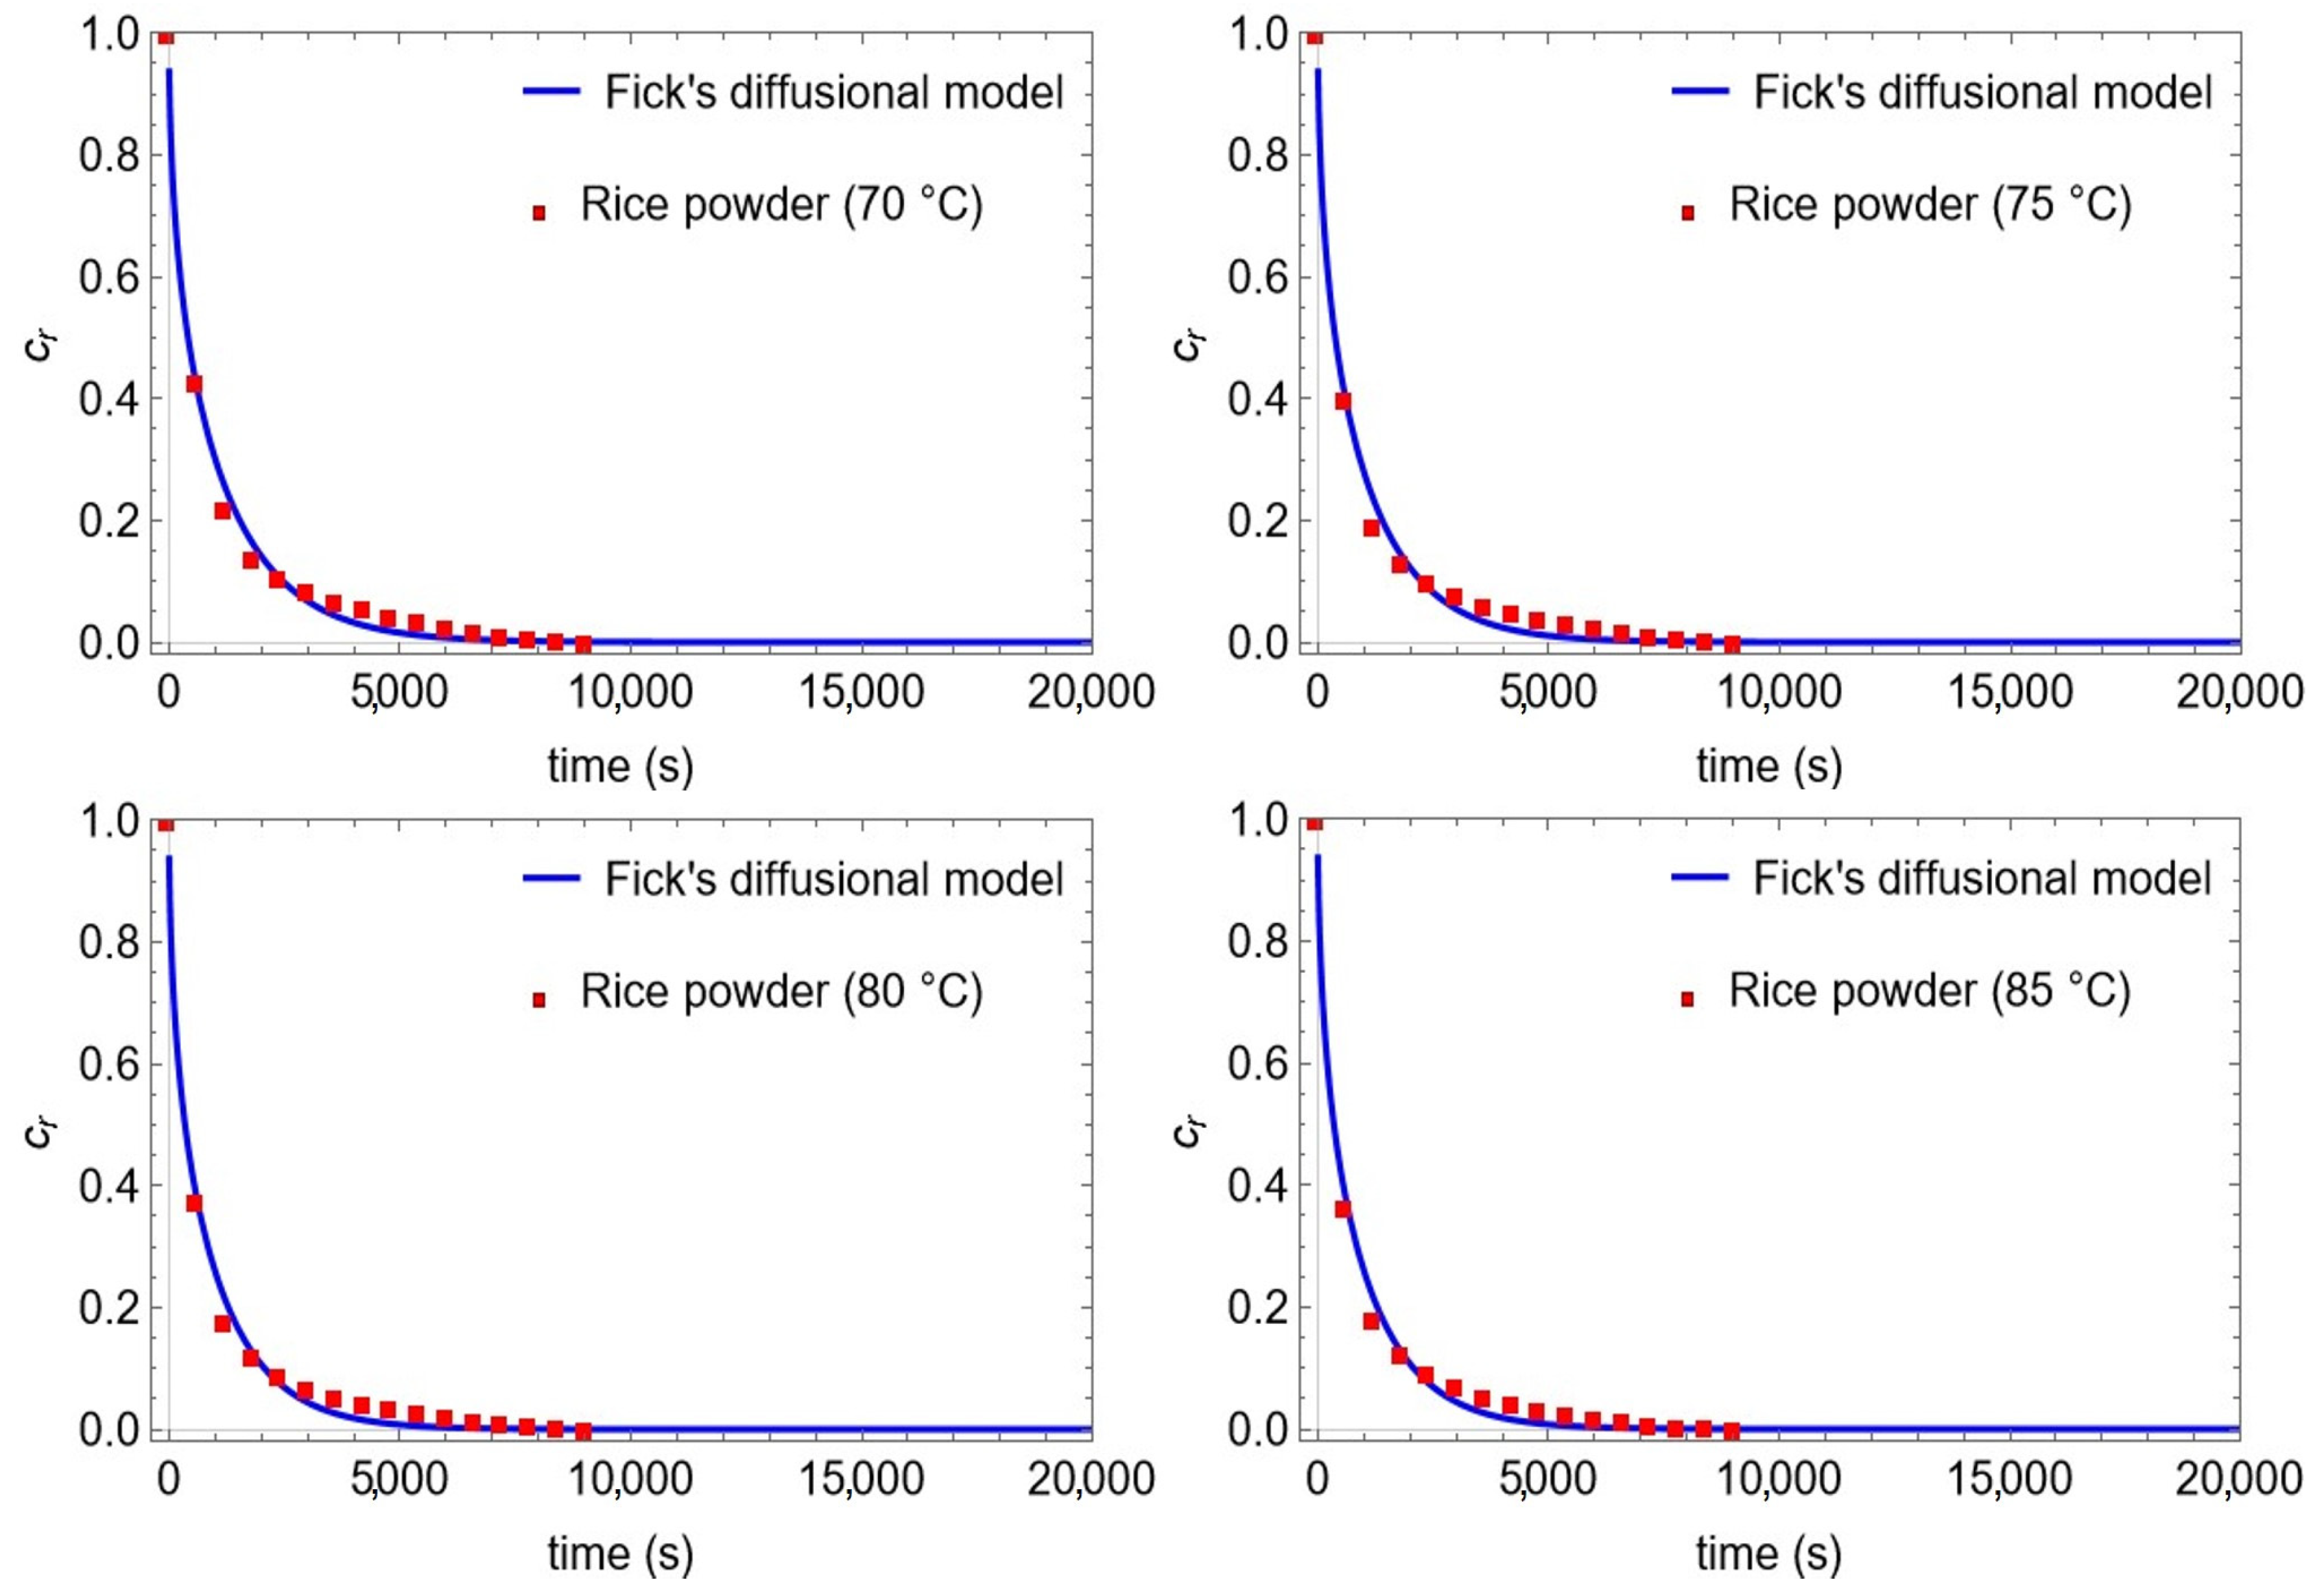
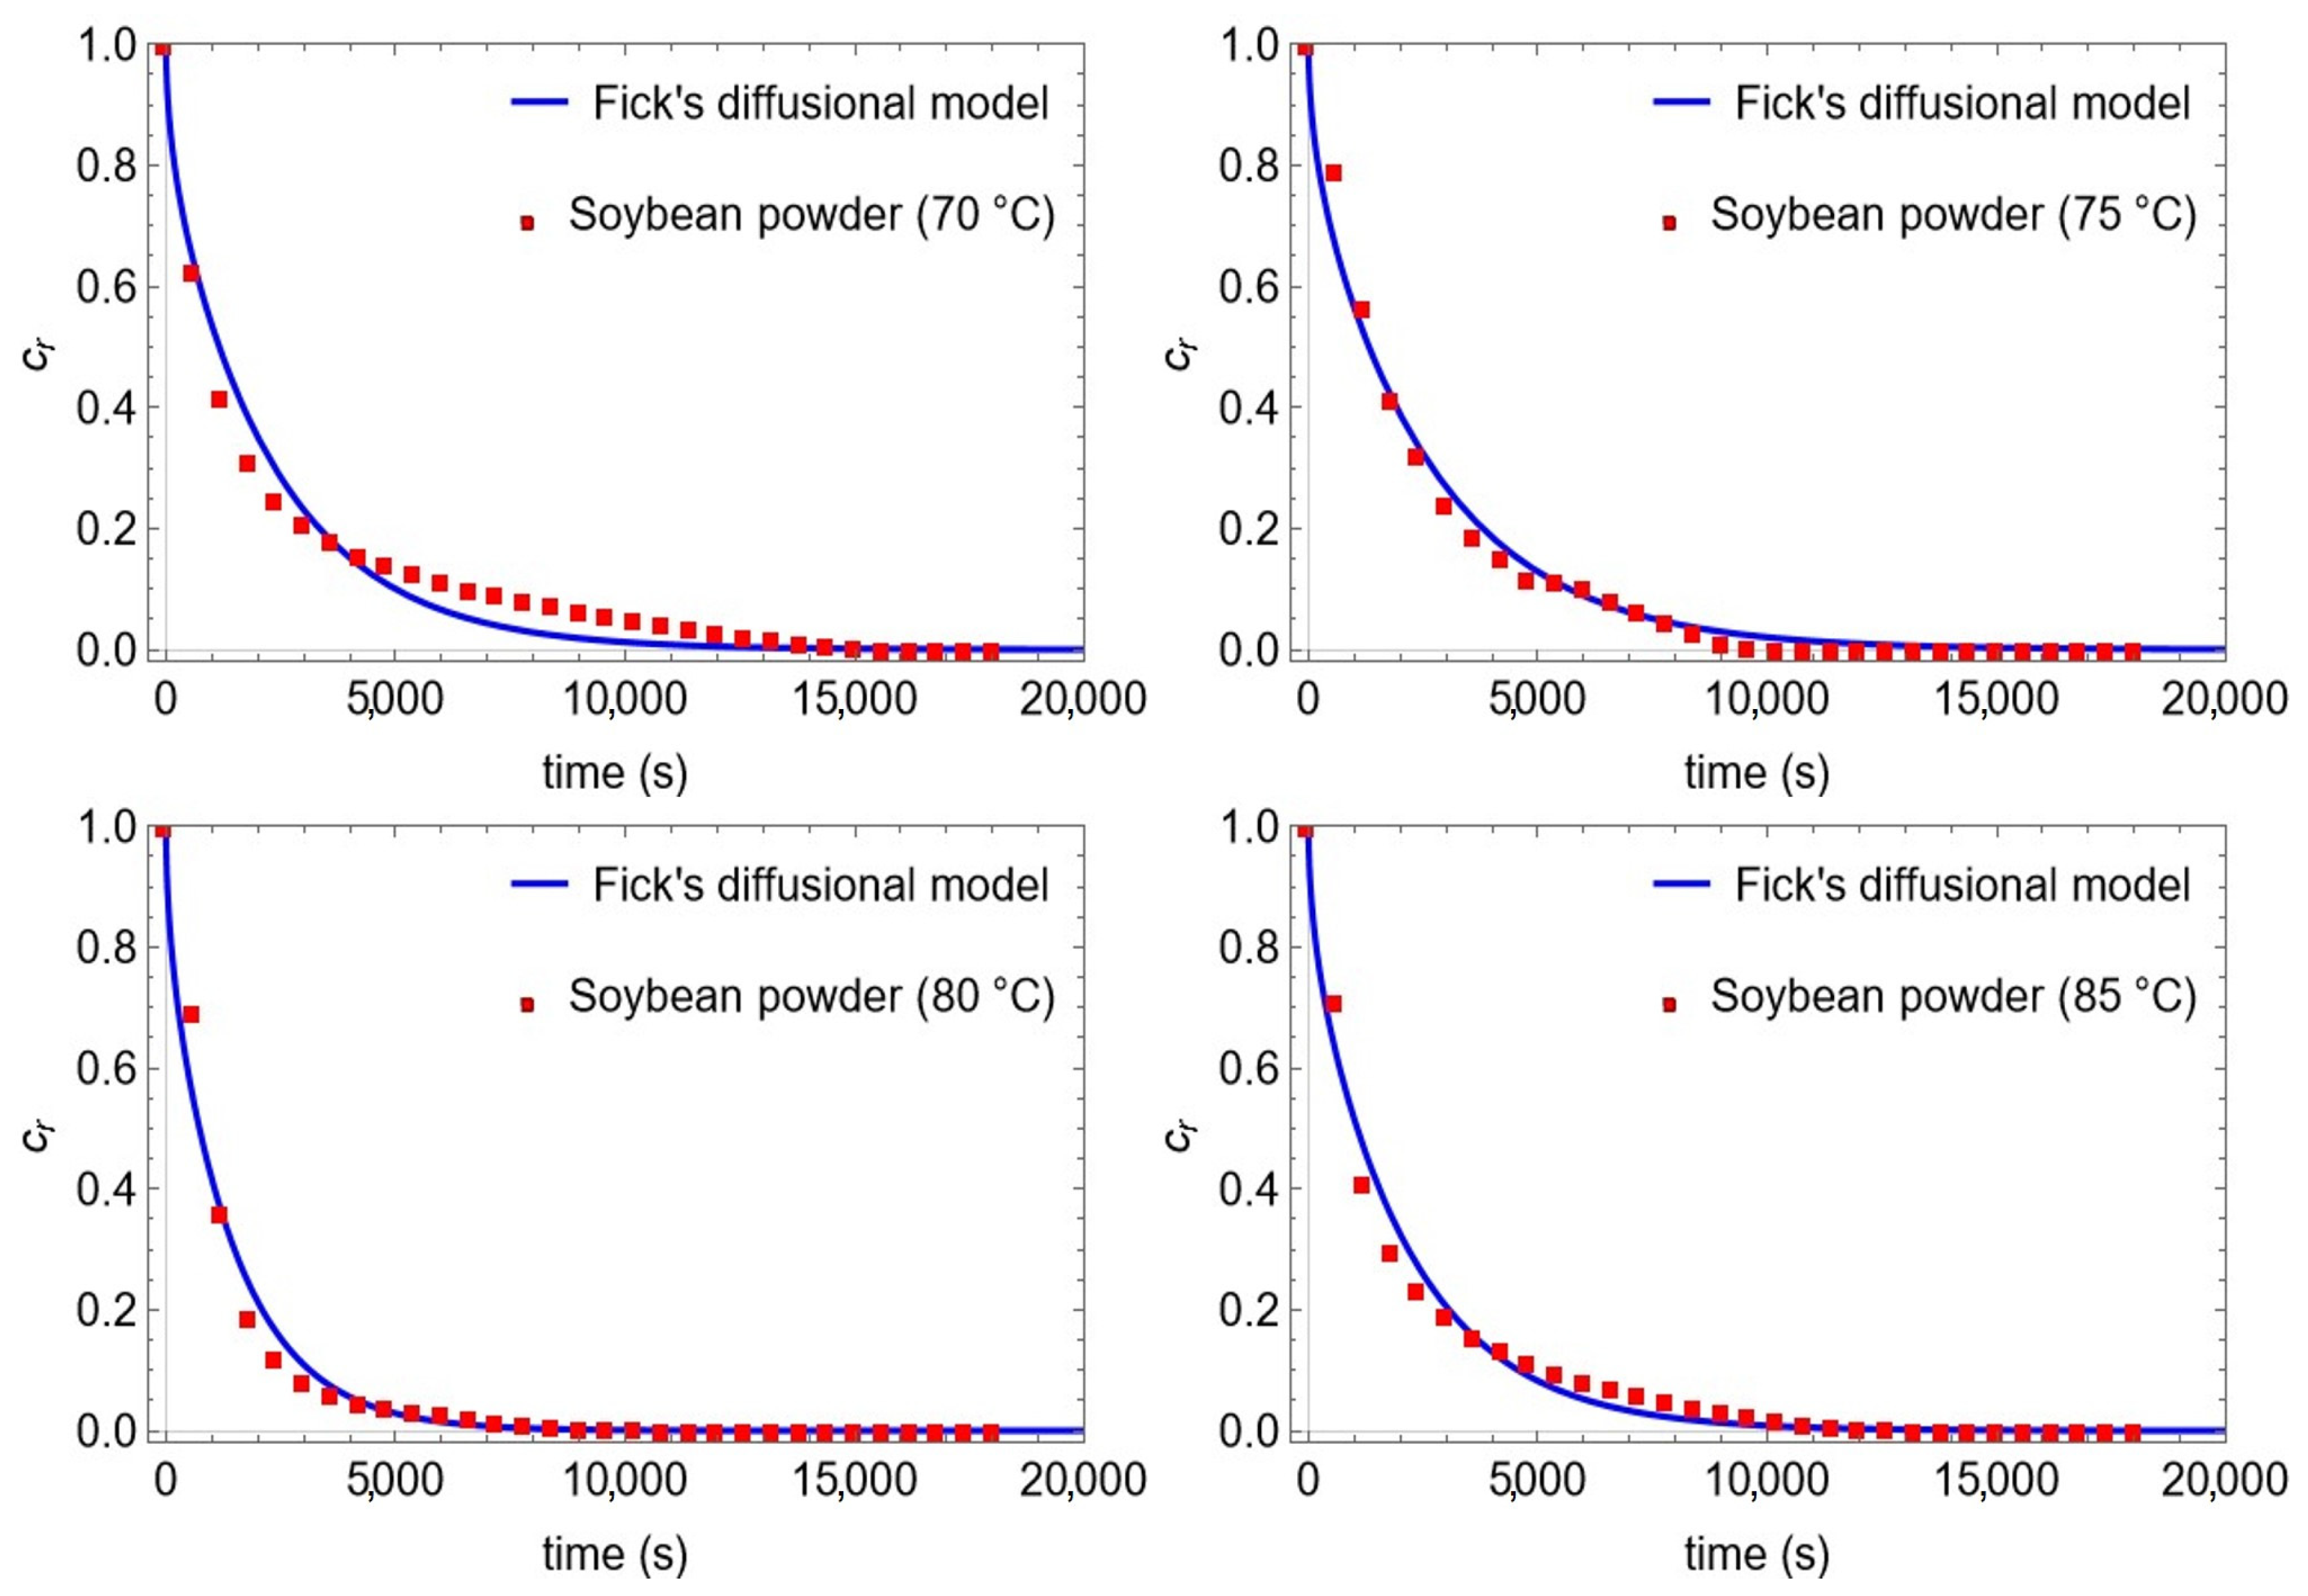
Regardless of matrix used, it was found that the extraction behavior was the same, with the highest concentration ratio in the first extraction min (between 10 and 20 min). The Fick’s diffusional models for rice bran oil, sunflower seed oil, and soybean oil are shown in Figure 3, Figure 4, and Figure 5, respectively.
It can be verified that the experimental data obtained from the extraction in a semicontinuous process fit well with the curve predicted by the model. In the case of rice bran oil (Figure 3), the behavior of the experimental data was practically identical at all temperatures, with the first 3 collections being the range where the most oil was extracted. During collections, a slightly decreasing rate in the concentration of extracted oil was noted.
For the oil extracted from sunflower seeds (Figure 5), the experimental data showed that the highest extraction rate occurred in the first 4 experimental points, showing behavior similar to the model found. At some points it is possible to notice that Cr is lower in the experimental data than in the Fick model, this demonstrates that the extraction is occurring slightly faster. As seen, the temperature of 75 °C, where experimental data demonstrated a greater amount of oil extracted, in a given time, in relation to the model prediction.
For the oil obtained from rolled soybean (Figure 4), the vast majority of experimental data showed behavior very similar to that predicted by the Fick model. With a high extraction rate at the beginning of the process, and a decrease in the amount of oil extracted during collections.
At lower temperatures (70 °C) it is noted that, in a given time, the model predicts a higher quantity of oil extracted than indicated in the experimental data, a phenomenon that is minimized as the extraction temperature increases. This reinforces the importance of temperature, among other factors, in the vegetable oil extraction process using pressurized ethanol.
Table 3 presents the temperatures, initial and final matrix masses, initial and final oil concentration in the matrix, average particle diameter, and effective diffusivity of rice bran, sunflower seed, and of soybean oils. For the extraction of rice bran and sunflower seed oils, Fick’s model was used for spherical surfaces, and for the extraction of soybean oil, Fick’s model was used for flat plates.
The Fick’s diffusion model (Fick’s Law) for spherical particles demonstrated good adjustment to Cr values obtained for the extraction kinetics at the temperatures analyzed (70, 75, 80, and 85 °C) (Table 3).
For oil extracted from rice bran, the model demonstrated good adjustment at all temperatures analyzed (R2 = 0.99) and the effective mass diffusion coefficient (Deff) was between 13.09 ± 0.66 × 10⁻¹² m2/s and 15.70 ± 0.86 × 10⁻¹² m2/s, the latter being at temperature of 80 °C. It is interesting to note that the diffusion coefficient increased at temperatures between 75 and 80 °C and decreased when it was analyzed at temperature of 85 °C. However, the diffusion values are very close at temperatures of 80 and 85 °C, making them within the calculated experimental error.
As expected, the effective mass diffusion coefficient increased with the rise in temperature, demonstrating that diffusion was facilitated at higher temperatures. It could be inferred that the agitation of solvent molecules, the decrease in viscosity, and the increase in diffusivity contributed to speed up the extraction kinetics [6,17,25].
For sunflower seed oil, the highest diffusion coefficient was 12.60 ± 1.84 × 10⁻¹² m2/s identified at temperature of 75° C and with R2 = 0.95. At higher temperatures, such as 80 and 85 °C, the Deff value declines to 10.41 ± 1.15 × 10⁻¹² and 8.10 ± 0.54 × 10⁻¹² m2/s, respectively. Guerrero et al. [26] reported that different plant materials may present extraction difficulty above 40 °C and that static beds may hinder mass transfer and consequently the extraction kinetics.
Table 3 shows the Deff values and the adjustment found when using the Fick’s Law model for flat plates. The highest Deff value (31.29 ± 1.50 × 10⁻¹² m2/s) was identified at temperature of 80 °C, with decrease to 21.41 ± 0.76 × 10⁻¹² m2/s at 85 °C.
The adjustment of the flat plate model presented correlation coefficient values (R2) between 0.98 and 0.99, very close to adjustment values found with the spherical model for rice bran and sunflower oil, demonstrating that the Fick’s diffusion model for flat plates is best suited to study the kinetics of oil extracted from rolled soybean, as its shape is more suitable for this model.
Being a property that depends on the interaction between solvent and matrix as well as its geometry, comparing the results obtained with other systems would not be valid in terms of validating results. However, a common behavior can be observed among all solvent/matrix systems, which is the increase in effective diffusivity with increasing system temperature. As in the work of Igbozulike et al. [27], the authors studied the effective diffusivity for African bean slices at temperatures of 40, 50, 60, and 70 °C. An increase in the Deff value from 0.857 × 10⁻¹⁰ to 1.903 × 10⁻¹⁰ m2/s in 2-mm thick bean slices and increase from 2700 × 10−10 to 4998 × 10−10 m2/s in 5-mm thick slices were observed as the temperature increased from 40 to 70 °C.
In another study, Pinheiro and Castro [28] studied the diffusivity of Portuguese fruits, such as Bravo de Esmolfe apple and Madeira banana. The authors identified that the Deff value of Bravo de Esmolfe apple increased from 1.968 × 10⁻¹⁰ m2/s at 35 °C to 4.013 × 10⁻¹⁰ m2/s at 50 °C; the Deff value of Madeira banana increased from 1.572 × 10⁻¹⁰ m2/s at 35 °C to 2.627 × 10⁻¹⁰ m2/s at 50 °C.

3.3.2. PLE in Intermittent Process

Extractions under optimized conditions for each matrix were carried out in triplicate, and the diffusivities found presented lower values than the diffusivities found in the semi-continuous process. The determination of the new effective diffusivity was carried out to evaluate the extraction behavior in the intermittent process, where there is no complete renewal of solvent in the system. With the Fick model and experimental data, it is possible to evaluate the efficiency of the extraction process with intermittent purging.
For rice bran, the effective diffusivity found was 5.97 ± 0.52 × 10⁻¹² m2/s with initial concentration of 0.295 g/g (g of oil/g of bran) and at the end of cycle 3, the residual concentration was around 0.063 g/g. For sunflower seed, the diffusivity found was 1.38 ± 0.26 × 10⁻¹² m2/s, with initial concentration of 0.623 g/g and concentration at the end of the 4th cycle of 0.298 g/g. Rolled soybeans presented initial concentration of 0.316 g/g, concentration at the end of cycle 3 of 196 g/g, and effective diffusivity of 1.77 ± 0.01 × 10⁻¹² m2/s.
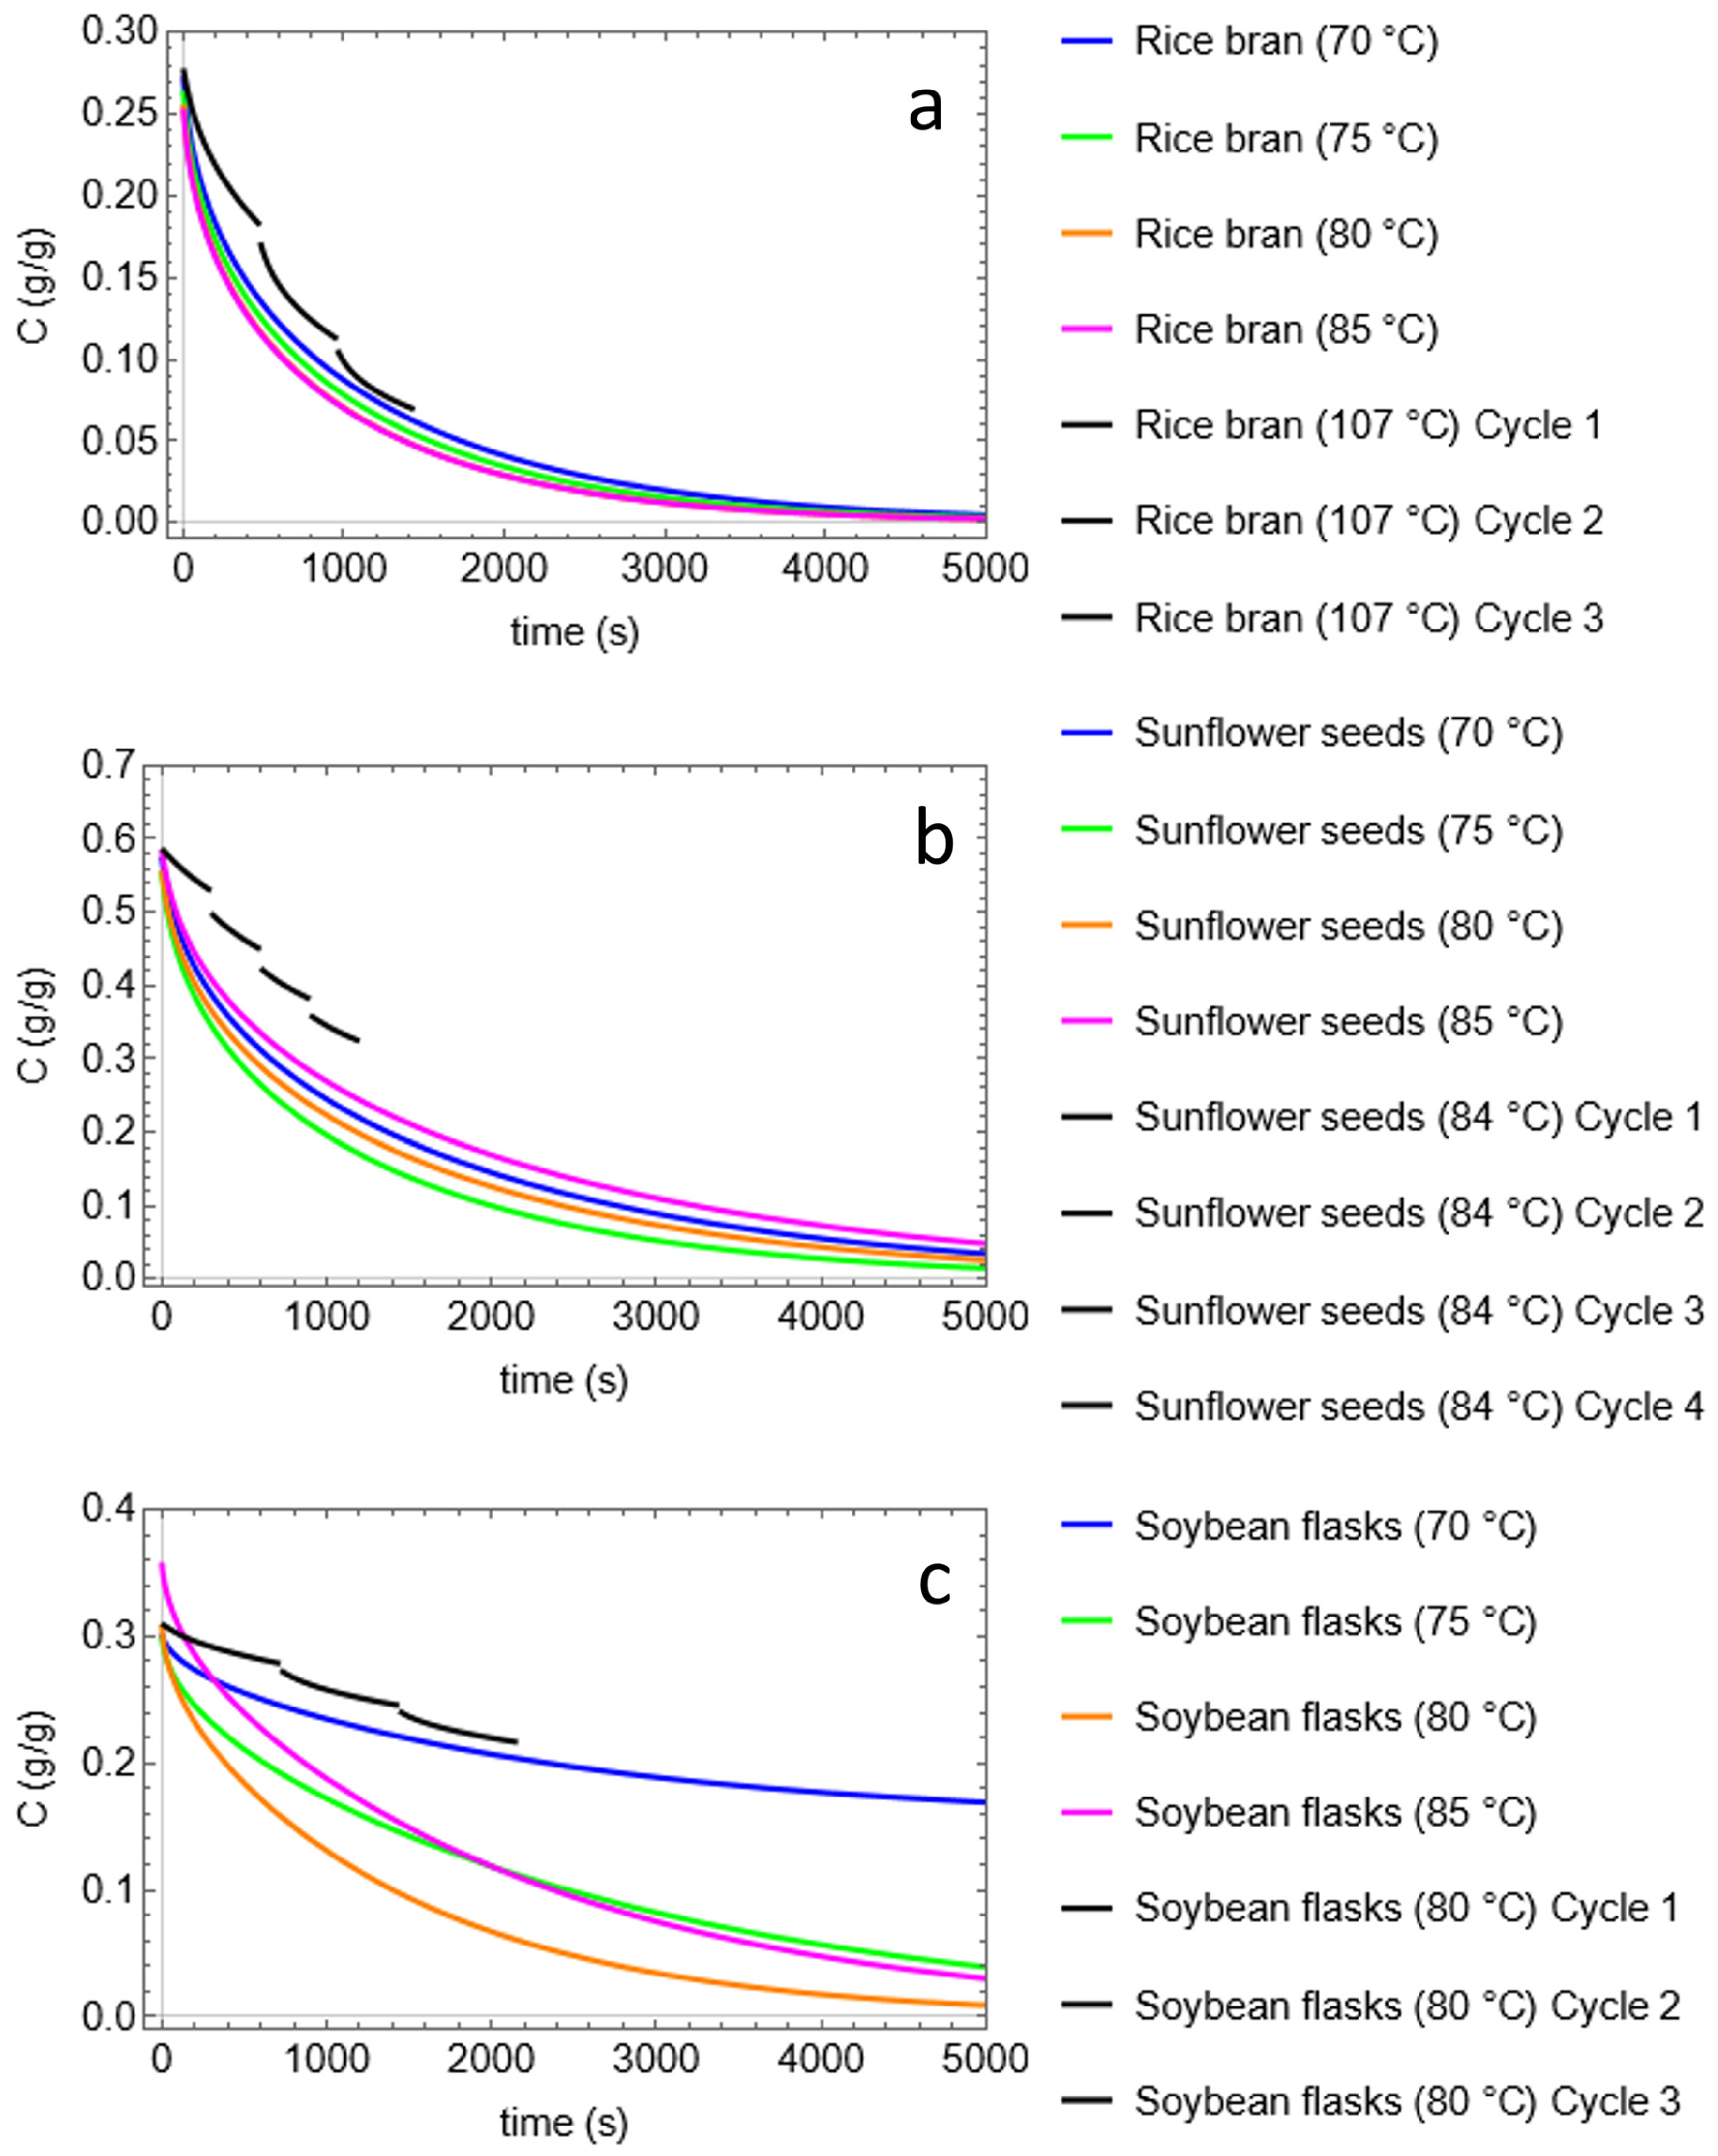
Figure 6 presents the curves obtained by the Fick’s Law analytical solution for rice bran (Figure 6a), sunflower seeds (Figure 6b), and rolled soybeans (Figure 6c). It was observed that for rice bran, the first extraction cycle coincided with the greatest curve decline, which demonstrates the greatest oil extraction rate at this stage of the process with concentration varying from 0.295 to 0.171 g/g in cycle 1, from 0.171 to 0.114 g/g in cycle 2 and from 0.114 g/g to the final concentration of 0.063 g/g. However, curves of the second and third extraction cycles showed decline similar to each other and not much lower than that shown in the first cycle.
For sunflower seeds, the 4 cycles showed similar decrease, from 0.623 to 0.546 g/g in the first cycle, from 0.546 to 0.464 g/g in the second cycle, from 0.464 to 0.376 g/g in the third cycle and from 0.376 up to 0.287 g/g in the fourth cycle. Rolled soybeans, on the other hand, showed greater decline in concentration in the 3rd cycle, with concentration ranging from 0.316 to 0.286 g/g in the first cycle, 0.286 to 0.267 g/g in the second cycle, and from 0.267 to 0.197 in the third cycle.
With the modeling of both processes, it was possible to compare the behavior of extractions in the semi-continuous process and in the intermittent process
It was observed that the extraction behavior in an intermittent process is very similar to the semi-continuous process with rapid decline in concentration in the initial phase of the extraction process (approximately 1400 s). This demonstrates that most of the oil is extracted at the beginning of the process, even in an intermittent regime.
For sunflower seed oil (Figure 6b), it was observed that the curve obtained by the intermittent process also showed extraction of the most of oil in the initial phase of the process (1200 s). Although the intermittent process curve differs slightly from the semi-continuous process curve in concentration values, the behavior remains similar.
Even though static time is an important process parameter, a very long contact time is not advisable in certain cases, as in addition to increasing the extraction cost, the high extraction temperature can degrade compounds of interest such as vitamins and bioactive compounds.
Figure 6c shows the semi-continuous process curves and the intermittent process for rolled soybean. As expected, at higher temperatures, it was possible to extract greater amounts of oil over the extraction time. However, the intermittent process did not present, in this case, curve similar to that obtained in the semi-continuous process.
The difference between curves of different processes can be explained by the solvent renewal that occurs in the semi-continuous process as opposed to the intermittent process. In extraction processes, the solvent undergoes saturation over time, that is, the oil/solute concentration within the matrix and in the solvent, it becomes equal. At this point, diffusion of oil from the matrix to the grain/seed will no longer occur.
In the semi-continuous process, the solvent was completely renewed after 10 min of extraction. In the intermittent process, only a small amount of solvent relative to the VS was inserted at the end of each cycle. This complete solvent renewal means that the oil extraction rate is always high, increasing the diffusivity rate. In the case of rolled soybean, in the intermittent process, only 20 mL of solvent were added to the system every 12 min of extraction, totaling 60 mL per 40 g of sample, while in the sunflower seed, 18.15 mL were added in each cycle, totaling 72.6 mL added to the initial mass of 20 g.
Another important factor in evaluating diffusivity is the extraction temperature. While rice bran oil, in its optimal conditions in the intermittent process, was extracted at 107 °C, soybean oil was obtained at 80 °C. This, added to the irregular geometry among matrices and the difference in average particle diameter, may indicate that diffusion is more facilitated in rice bran and sunflower seeds compared to rolled soybeans [29].
Although the diffusivities found in the intermittent process were much lower than those found in the semi-continuous process, intermittent extraction has the advantage of using smaller amounts of solvent. For rice bran, in the intermittent extraction process, 52 mL were used, while in the semi-continuous process, the amount of solvent used was 450 mL. For sunflower seeds, approximately 123 mL of solvent were used in the intermittent process, while approximately 765 mL were used in the semi-continuous process. As for soybean oil, approximately 138 mL of solvent were used in the intermittent process and approximately 1900 mL of solvent were used in cases where oil depletion requires longer time.
Thus, it was observed that the solvent savings provided by the intermittent process, as well as savings in time, electrical energy, and wear of the extraction equipment, make this extraction process extremely advantageous compared to the semi-continuous process.

4. Conclusions

The results show that different raw materials influenced the extraction yield and, consequently, the extraction kinetic profile of the different oils under study. Considering that the behavior of the extraction kinetics for soybean oil differed even further from the others, it can be suggested that the size of the particles as well as their geometric shape may also have influenced the extraction.
Temperature had a direct impact on oil yield during tests conducted to characterize the kinetic profile. As the temperature increases, more oil is extracted in a given moment (time) and, in some cases, more extractions are required to completely deplete the particle, increasing the overall yield of the process.
The Fick’s diffusion model for cylindrical coordinates used in rice bran and sunflower seeds proved to be suitable for the extraction kinetic profile for oil extracted from rice bran and sunflower seeds. For soybean oil, where the Fick’s diffusion model considered the rolled soybeans as a flat plate also presented good fit, demonstrating that the Fick’s Law is suitable for this type of extraction kinetics.
The effective diffusivity found in the intermittent process was lower than that found in the semi-continuous process for all matrices under study (rice bran, sunflower seed, and rolled soybean). However, the amount of solvent used in the intermittent process is much lower than that used in the semi-continuous process. Reduced solvent consumption in the extraction process leads to solvent savings, which can be significant when scaling up. By using a green and renewable solvent in the extraction process and minimizing solvent usage, we enhance the sustainability of the process.
In general, the study demonstrated that the largest amount of oil is extracted in the first minutes of the process and that after a certain time, the process becomes less viable from the economic point of view.

Author Contributions

Conceptualization, A.L.d.O. and G.C.D.; methodology, P.R.R., J.S., J.V.F.E., G.C.D. and A.L.d.O.; software, P.R.R. and G.C.D.; validation, P.R.R., J.S., J.V.F.E., G.C.D. and A.L.d.O.; formal analysis, A.L.d.O. and G.C.D.; investigation, P.R.R., J.S., J.V.F.E., G.C.D. and A.L.d.O.; resources, P.R.R., J.S. and J.V.F.E.; data curation, A.L.d.O. and G.C.D.; writing—original draft preparation, P.R.R. and J.V.F.E.; writing—review and editing, P.R.R., A.L.d.O. and G.C.D.; visualization, A.L.d.O. and G.C.D.; supervision, A.L.d.O.; project administration, A.L.d.O.; funding acquisition, A.L.d.O. All authors have read and agreed to the published version of the manuscript.

Funding

The authors would like to thank the Research Support Foundation of São Paulo (FAPESP), Process No. 2018/18024-7 & 2022/02336-5, and the National Council for Scientific and Technological Development (CNPq—Processes No. 304573/2019-1 and No. 306317/2016-8) for their financial support. Ramos P.R. thanks the Coordination for the Improvement of Higher Education Personnel (CAPES) for the scholarship granted (Process No. 001).

Data Availability Statement

Data are contained within the article.

Conflicts of Interest

The authors declare no conflict of interest.

References

  1. Wen, C.; Shen, M.; Liu, G.; Liu, X.; Liang, L.; Li, Y.; Zhang, J.; Xu, X. Edible Vegetable Oils from Oil Crops: Preparation, Refining, Authenticity Identification and Application. Process Biochem. 2023, 124, 168–179. [Google Scholar] [CrossRef]
  2. Food and Agriculture Organization of the United Nations. Available online: https://www.fao.org/faostat/en/#data/QCL (accessed on 27 September 2023).
  3. Saunders, R.M. Rice Bran: Composition and Potential Food Uses. Food Rev. Int. 1985, 1, 465–495. [Google Scholar] [CrossRef]
  4. Jaski, J.M.; Abrantes, K.K.B.; Zanqui, A.B.; Stevanato, N.; da Silva, C.; Barão, C.E.; Bonfim-Rocha, L.; Cardozo-Filho, L. Simultaneous Extraction of Sunflower Oil and Active Compounds from Olive Leaves Using Pressurized Propane. Curr. Res. Food Sci. 2022, 5, 531–544. [Google Scholar] [CrossRef]
  5. Gasparetto, H.; de Castilhos, F.; Paula Gonçalves Salau, N. Recent Advances in Green Soybean Oil Extraction: A Review. J. Mol. Liq. 2022, 361, 119684. [Google Scholar] [CrossRef]
  6. Mgoma, S.T.; Basitere, M.; Mshayisa, V.V. Kinetics and Thermodynamics of Oil Extraction from South African Hass Avocados Using Hexane as a Solvent. S. Afr. J. Chem. Eng. 2021, 37, 244–251. [Google Scholar] [CrossRef]
  7. Yang, J.; Vardar, U.S.; Boom, R.M.; Bitter, J.H.; Nikiforidis, C.V. Extraction of Oleosome and Protein Mixtures from Sunflower Seeds. Food Hydrocoll. 2023, 145, 109078. [Google Scholar] [CrossRef]
  8. Sayasoonthorn, S.; Kaewrueng, S.; Patharasathapornkul, P. Rice Bran Oil Extraction by Screw Press Method: Optimum Operating Settings, Oil Extraction Level and Press Cake Appearance. Rice Sci. 2012, 19, 75–78. [Google Scholar] [CrossRef]
  9. Baümler, E.R.; Carrín, M.E.; Carelli, A.A. Extraction of Sunflower Oil Using Ethanol as Solvent. J. Food Eng. 2016, 178, 190–197. [Google Scholar] [CrossRef]
  10. Colivet, J.; Oliveira, A.L.; Carvalho, R.A. Influence of the Bed Height on the Kinetics of Watermelon Seed Oil Extraction with Pressurized Ethanol. Sep. Purif. Technol. 2016, 169, 187–195. [Google Scholar] [CrossRef]
  11. Ramos, P.R.; Vicentini-Polette, C.M.; Mazalli, M.R.; de Lima Caneppele, F.; de Oliveira, A.L. Pressurized Liquid Extraction of Soybean Oil Using Intermittent Process with Ethanol and Hexane as Solvent: Extraction Yield and Physicochemical Parameters Comparison. J. Food Process Eng. 2024, 47, e14562. [Google Scholar] [CrossRef]
  12. Rodrigues, L.d.C.; Bodini, R.B.; de L. Caneppele, F.; Dacanal, G.C.; Crevelin, E.J.; de Moraes, L.A.B.; de Oliveira, A.L. Pressurized Liquid Extraction (PLE) in an Intermittent Process as an Alternative for Obtaining Passion Fruit (Passiflora edulis) Leaf Hydroalcoholic Extract (Tincture). Processes 2023, 11, 2308. [Google Scholar] [CrossRef]
  13. Ferro, D.M.; Mayer, D.A.; Oliveira Müller, C.M.; Ferreira, S.R.S. Scale-up Simulation of PLE Process Applied to Recover Bio-Based Materials from Sida Rhombifolia Leaves. J. Supercrit. Fluids 2020, 166, 105033. [Google Scholar] [CrossRef]
  14. Comerlatto, A.; Voll, F.A.; Daga, A.L.; Fontana, É. Mass Transfer in Soybean Oil Extraction Using Ethanol/Isopropyl Alcohol Mixtures. Int. J. Heat Mass Transf. 2021, 165, 120630. [Google Scholar] [CrossRef]
  15. Czaikoski, K.; Mesomo, M.C.; De Scheer, A.P.; Dalla Santa, O.R.; Queiroga, C.L.; Corazza, M.L. Kinetics, Composition and Biological Activity of Eupatorium Intermedium Flower Extracts Obtained from ScCO2 and Compressed Propane. J. Supercrit. Fluids 2015, 97, 145–153. [Google Scholar] [CrossRef]
  16. Segovia, F.J.; Corral-Pérez, J.J.; Almajano, M.P. Avocado Seed: Modeling Extraction of Bioactive Compounds. Ind. Crops Prod. 2016, 85, 213–220. [Google Scholar] [CrossRef]
  17. Kabuba, J.; Huberts, R. Steam Extraction of Essential Oils: Investigation of Process Parameters. Can. J. Chem. Eng. 2009, 87, 915–920. [Google Scholar] [CrossRef]
  18. Crank, J. The Mathematics of Diffusion, 2nd ed.; Clarendon Press: Oxford, UK, 1975. [Google Scholar]
  19. Ramos, P.E.; Cerqueira, M.A.; Cook, M.T.; Bourbon, A.I.; Khutoryanskiy, V.V.; Charalampoulos, D.; Teixeira, J.A.; Vicente, A.A. Development of an Immobilization System for in Situ Micronutrients Release. Food Res. Int. 2016, 90, 121–132. [Google Scholar] [CrossRef] [PubMed]
  20. Chinnarasu, C.; Montes, A.; Pereyra, C.; Casas, L.; Fernández-Ponce, T.; Mantell, C.; Pattabhi, S.; Martínez De La Ossa, E. Preparation of Polyphenol Fine Particles Potent Antioxidants by a Supercritical Antisolvent Process Using Different Extracts of Olea Europaea Leaves. Korean J. Chem. Eng 2016, 33, 594–602. [Google Scholar] [CrossRef]
  21. Özkal, S.G.; Yener, M.E. Supercritical Carbon Dioxide Extraction of Flaxseed Oil: Effect of Extraction Parameters and Mass Transfer Modeling. J. Supercrit. Fluids 2016, 112, 76–80. [Google Scholar] [CrossRef]
  22. Pereira, C.G.; Meireles, M.A.A. Supercritical Fluid Extraction of Bioactive Compounds: Fundamentals, Applications and Economic Perspectives. Food Bioprocess Technol. 2010, 3, 340–372. [Google Scholar] [CrossRef]
  23. Cornelio-Santiago, H.P.; Mazalli, M.R.; Rodrigues, C.E.C.; de Oliveira, A.L. Extraction of Brazil Nut Kernel Oil Using Green Solvents: Effects of the Process Variables in the Oil Yield and Composition. J. Food Process Eng. 2019, 42, e13271. [Google Scholar] [CrossRef]
  24. Oliveira, N.A.d.; Cornelio-Santiago, H.P.; Fukumasu, H.; Oliveira, A.L. de Green Coffee Extracts Rich in Diterpenes—Process Optimization of Pressurized Liquid Extraction Using Ethanol as Solvent. J. Food Eng. 2018, 224, 148–155. [Google Scholar] [CrossRef]
  25. Amarante, R.C.A.; Oliveira, P.M.; Schwantes, F.K.; Morónmorón-Villarreyes, J.A. Oil Extraction from Castor Cake Using Ethanol: Kinetics and Thermodynamics. Ind. Eng. Chem. Res. 2014, 53, 6824–6829. [Google Scholar] [CrossRef]
  26. Guerrero, M.S.; Torres, J.S.; Nuñez, M.J. Extraction of Polyphenols from White Distilled Grape Pomace: Optimization and Modelling. Bioresour. Technol. 2008, 99, 1311–1318. [Google Scholar] [CrossRef] [PubMed]
  27. Igbozulike, A.O.; Ndirika, V.I.O.; Simonyan, K.J. Influence of Drying Process Variables on the Effective Moisture Diffusivity and Activation Energy of African Oil Bean Seed. Sci. Afr. 2023, 22, e01895. [Google Scholar] [CrossRef]
  28. Pinheiro, M.N.C.; Castro, L.M.M.N. Effective Moisture Diffusivity Prediction in Two Portuguese Fruit Cultivars (Bravo de Esmolfe Apple and Madeira Banana) Using Drying Kinetics Data. Heliyon 2023, 9, e17741. [Google Scholar] [CrossRef]
  29. Salgin, U.; Doker, O.; Çalimi, A. Extraction of Sunflower Oil with Supercritical CO2: Experiments and Modeling. J. Supercrit. Fluids 2006, 38, 236–331. [Google Scholar] [CrossRef]
Figure 1. The direction of measurement of rolled soybean to determine the average particle diameter.
Processes 12 01107 g001
Figure 2. Mass accumulation curves of rice bran oil (a), sunflower seed oil (b), and soybean oil (c).
Processes 12 01107 g002
Figure 3. Curves obtained by the Fick model for the semi-continuous process of rice bran.
Processes 12 01107 g003
Figure 4. Curves obtained by the Fick model for the semi-continuous process of sunflower seed.
Processes 12 01107 g004
Figure 5. Curves obtained by the Fick model for the semi-continuous process of soybean flask.
Processes 12 01107 g005
Figure 6. Curves obtained in modeling the semi-continuous and intermittent process for rice bran (a), sunflower seed (b) and rolled soybean (c).
Processes 12 01107 g006
Table 1. Optimal conditions and oil recovery in intermittent process.
Temperature
(°C)
Static Time
(min)
CyclesRinse Volume
(%) *
Oil Recovery
(%)
Rice Bran1078360130.42
Sunflower seeds845411093.9
Soybean flask801236086.16
* Calculated depending on the volume of the extraction cell.
Table 2. Mass of oil obtained during extraction to obtain the kinetic profile.
Rice BranSunflower SeedSoybean Oil
Extraction Time (min)70 °C75 °C80 °C85 °C70 °C75 °C80 °C85 °C70 °C75 °C80 °C85 °C
101.901.952.012.146.316.406.306.722.493.354.965.69
200.520.500.450.423.573.703.563.431.263.034.124.45
300.180.130.120.121.091.030.960.860.621.781.811.36
400.070.070.060.070.450.420.370.360.340.990.620.75
500.050.040.050.050.280.140.200.220.210.810.370.47
600.030.030.030.030.150.010.170.150.170.530.180.34
700.030.030.020.020.130.000.110.110.110.330.140.24
800.020.020.020.020.010.000.080.140.090.330.060.19
900.020.020.020.020.080.000.050.150.080.020.040.17
1000.020.010.010.010.060.030.030.060.070.110.040.15
1100.020.010.010.010.050.050.020.050.070.180.060.12
1200.010.010.010.010.040.020.020.050.050.160.060.10
1300.010.010.010.01---0.040.050.170.050.09
1400.010.010.010.01---0.030.040.150.020.09
1500.010.010.010.01---0.030.040.130.020.08
160--------0.040.070.000.08
170--------0.040.060.000.06
180--------0.040.000.030.06
190--------0.030.010.010.04
200--------0.030.000.010.03
210--------0.03-0.000.000.02
220--------0.030.000.000.01
230--------0.030.000.000.01
240--------0.030.000.000.00
250--------0.010.000.000.00
260--------0.010.000.000.00
270--------0.010.000.000.00
280--------0.000.000.000.00
290--------0.000.000.000.00
300- - - - - - - - 0.000.000.000.00
Table 3. Extraction temperature, initial and final mass, initial and final concentration, average particle diameter, and effective diffusivity of rice bran, Sunflower seeds and Roasted soybean.
PropertiesRice Bran (Spherical)
T (°C)70758085
min (g)10101010
mout (g)7.107.207.287.31
Cin (goil/gmat)0.290.2810.2720.269
Ceq (goil/gmat)0000
dm (×10−3 m)0.840.840.840.84
Deff (×10−12 m2/s)13.09 ± 0.6614.38 ± 0.8015.70 ± 0.8615.55 ± 0.85
R20.99290.99190.99250.9924
PropertiesSunflower seeds (spherical)
T (°C))70758085
min (g)20202020
mout (g)7.578.28.127.57
Cin (goil/gmat)0.6110.590.5920.621
Ceq (goil/gmat)0000
dm (×10−3 m)0.880.880.880.88
Deff (×10−12 m2/s)9.37 ± 1.0012.60 ± 1.8410.41 ± 1.158.10 ± 0.54
R20.97130.95480.97020.9829
PropertiesRoasted soybean (plates)
T (°C))70758085
min (g)40404040
mout (g)29.2730.9230.3330.38
Cin (goil/gmat)0.3050.3050.3150.365
Ceq (goil/gmat)0.154000
dm (×10−3 m)0.680.680.680.68
Deff (×10−12 m2/s)19.61 ± 0.8617.25 ± 0.5531.29 ± 1.5021.41 ± 0.76
R20.98010.99020.98290.9881
Where: min is the mass of the matrix at the beginning of the extraction. mout is the mass of the matrix at the end of the extraction. Cin is the initial oil concentration. Ceq is the equilibrium concentration. d is the average particle diameter and Deff is the effective diffusivity.
Disclaimer/Publisher’s Note: The statements, opinions and data contained in all publications are solely those of the individual author(s) and contributor(s) and not of MDPI and/or the editor(s). MDPI and/or the editor(s) disclaim responsibility for any injury to people or property resulting from any ideas, methods, instructions or products referred to in the content.