
Erosive Wear Caused by Large Solid Particles Carried by a Flowing Liquid: A Comprehensive Review

Abstract
:1. Introduction
2. Fundamental Aspect of the Flow Carrying Large Particles
3. Engineering Correspondence
3.1. Pipe Joints
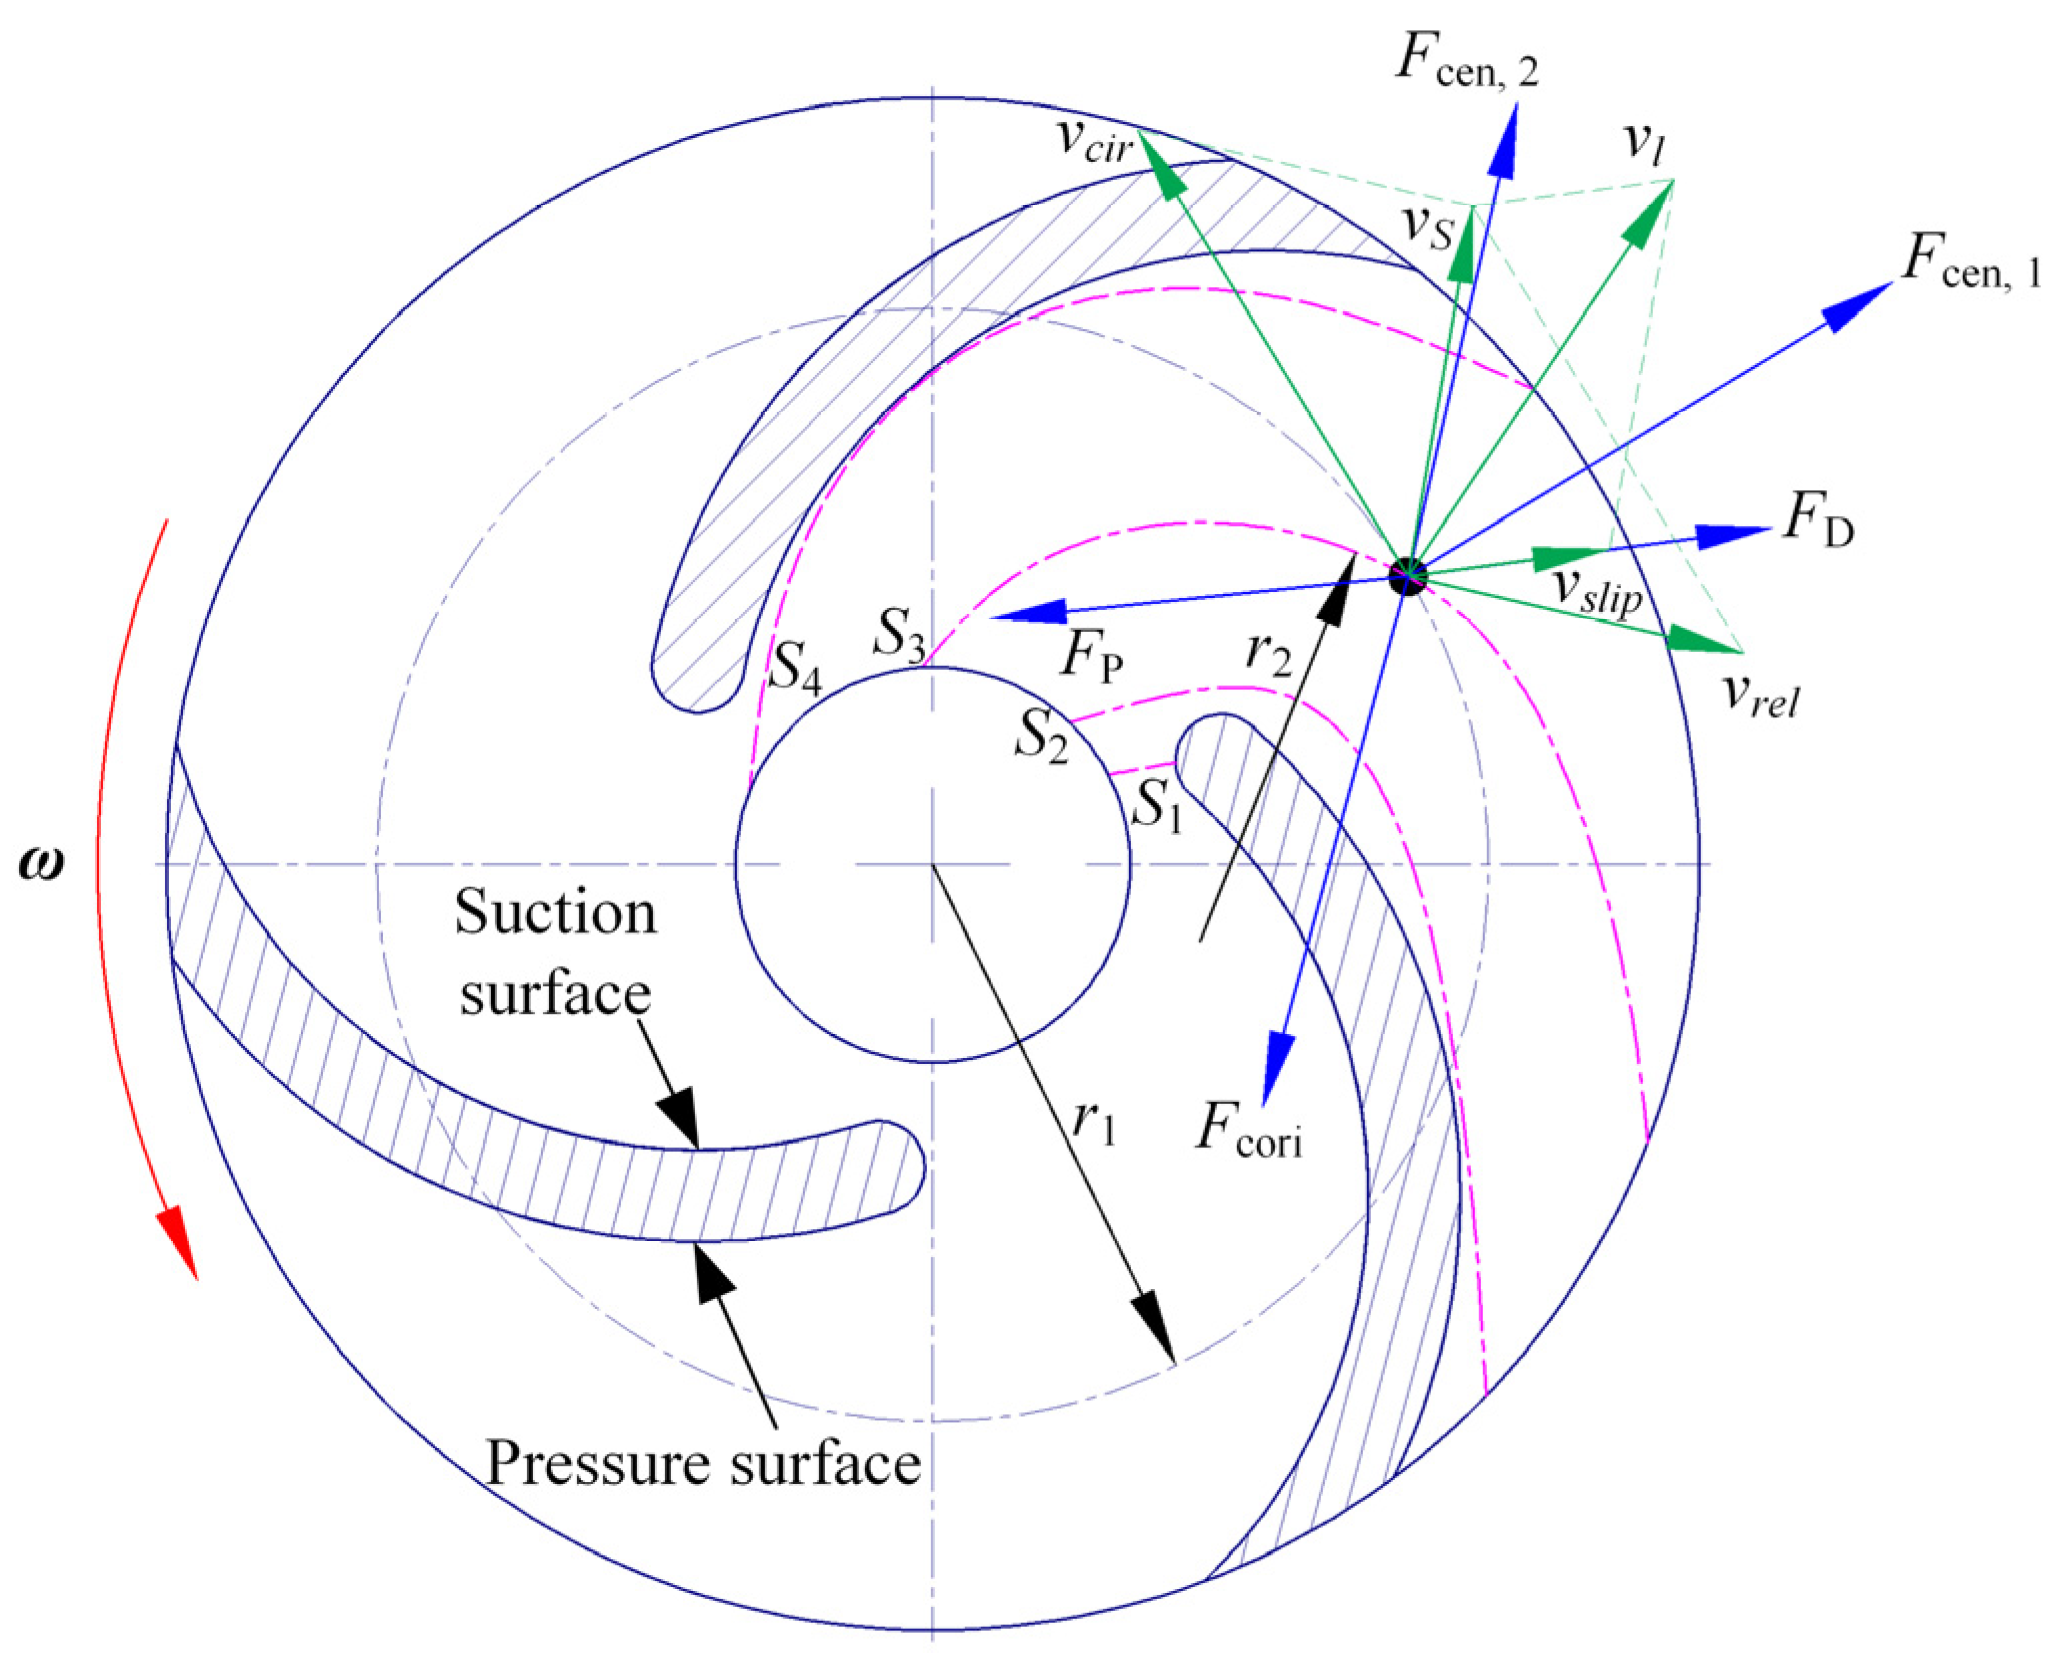
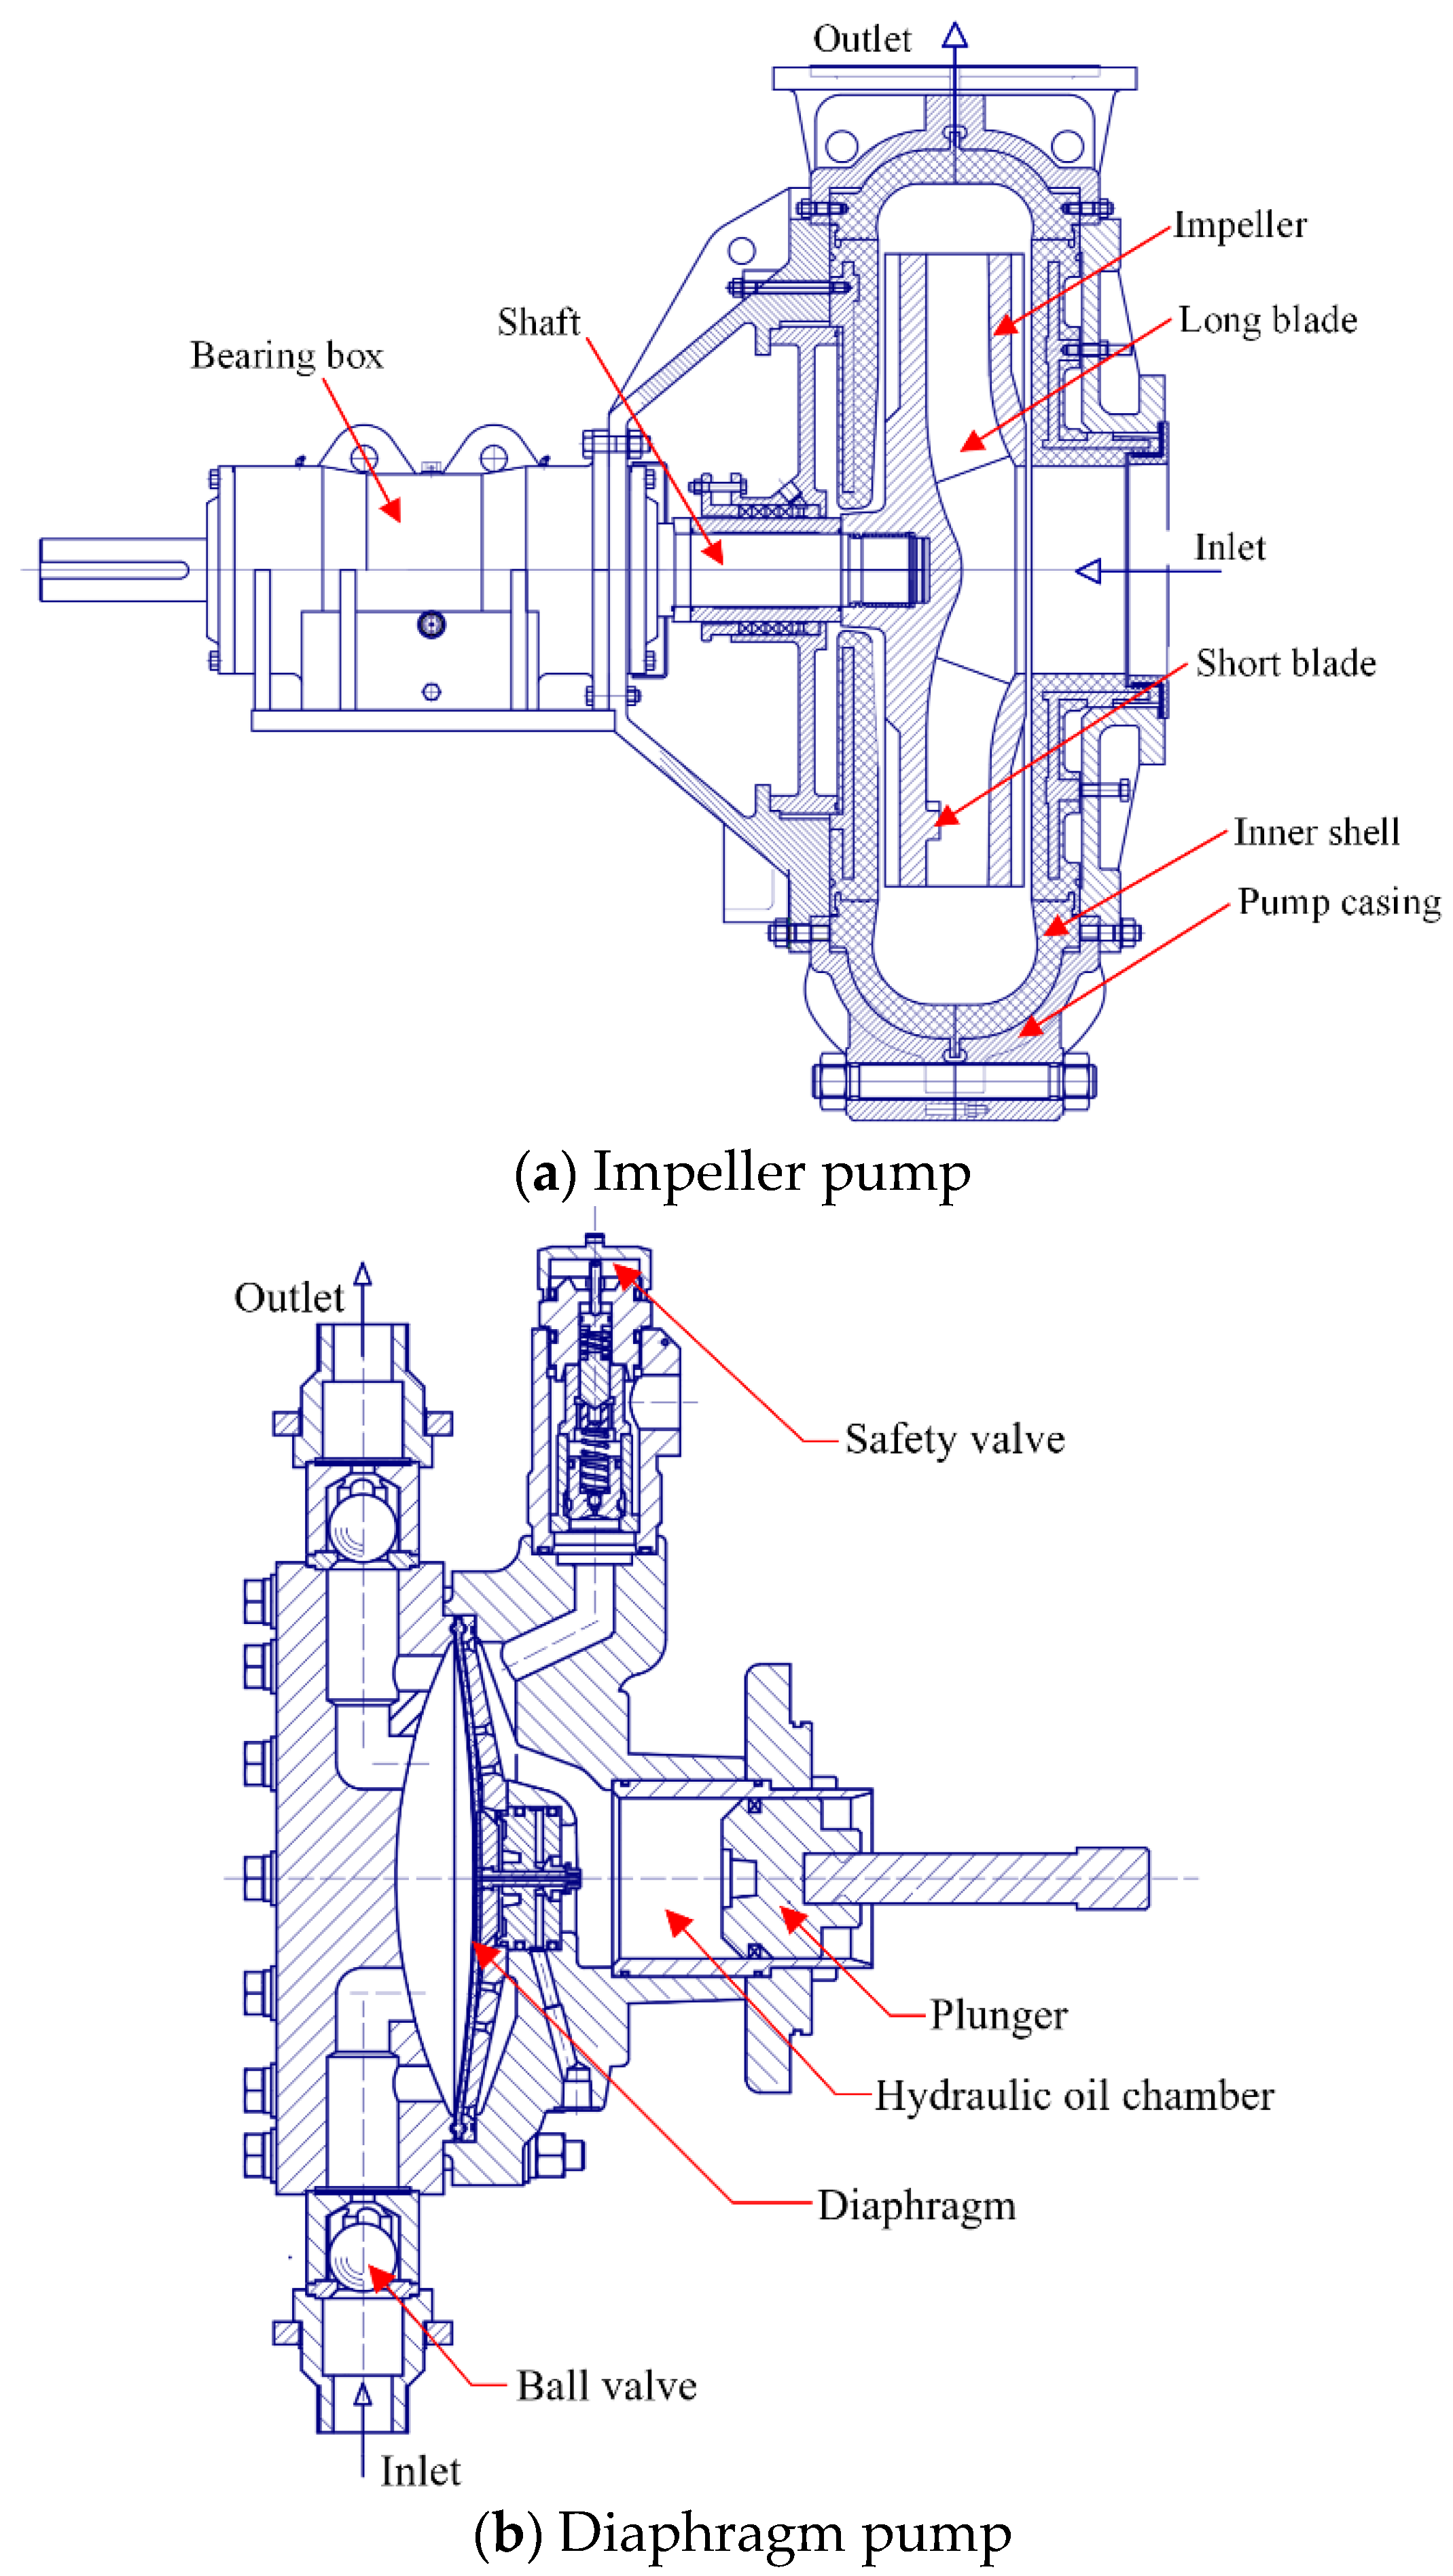
3.2. Pumps
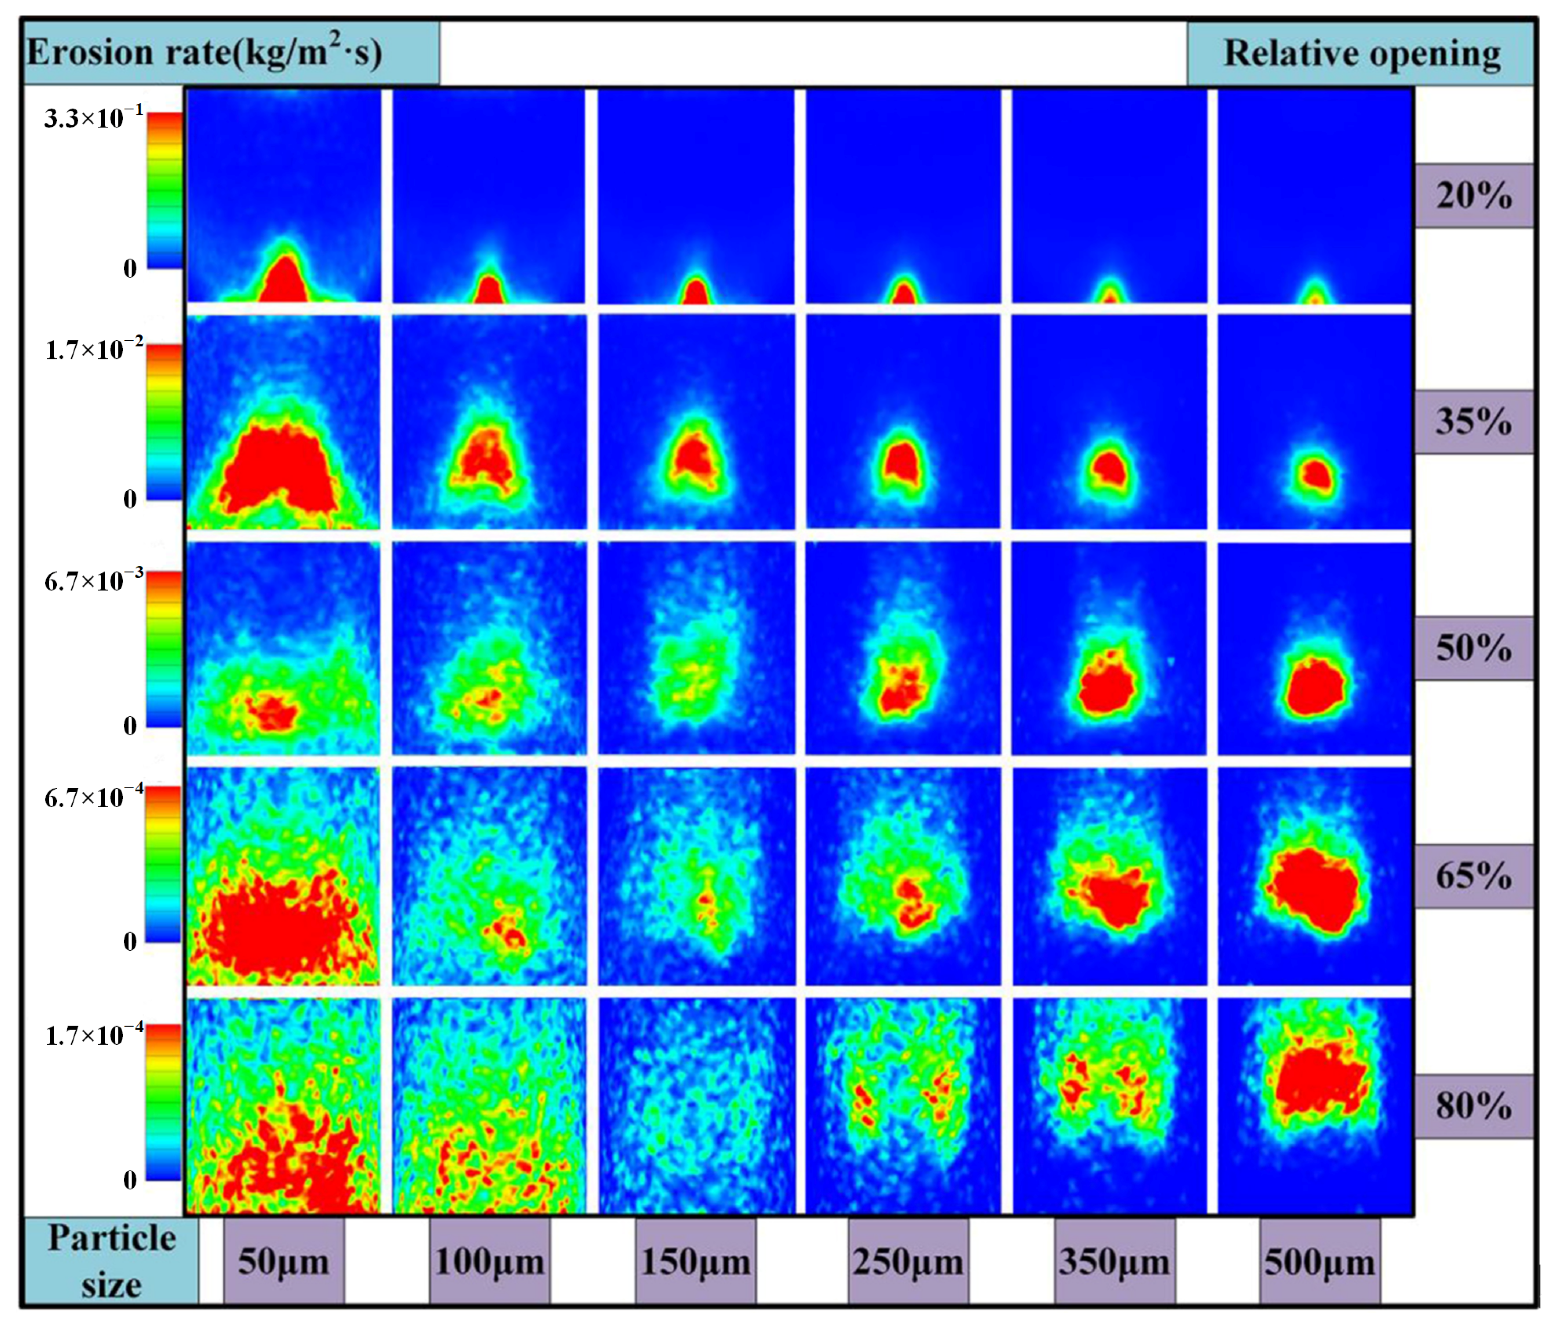
3.3. Valves
4. Main Parameters Influencing Erosive Wear
4.1. Material Properties
4.2. Impingement Parameters
4.2.1. Particle Impact Angle
4.2.2. Particle Impact Velocity
4.3. Particle Properties
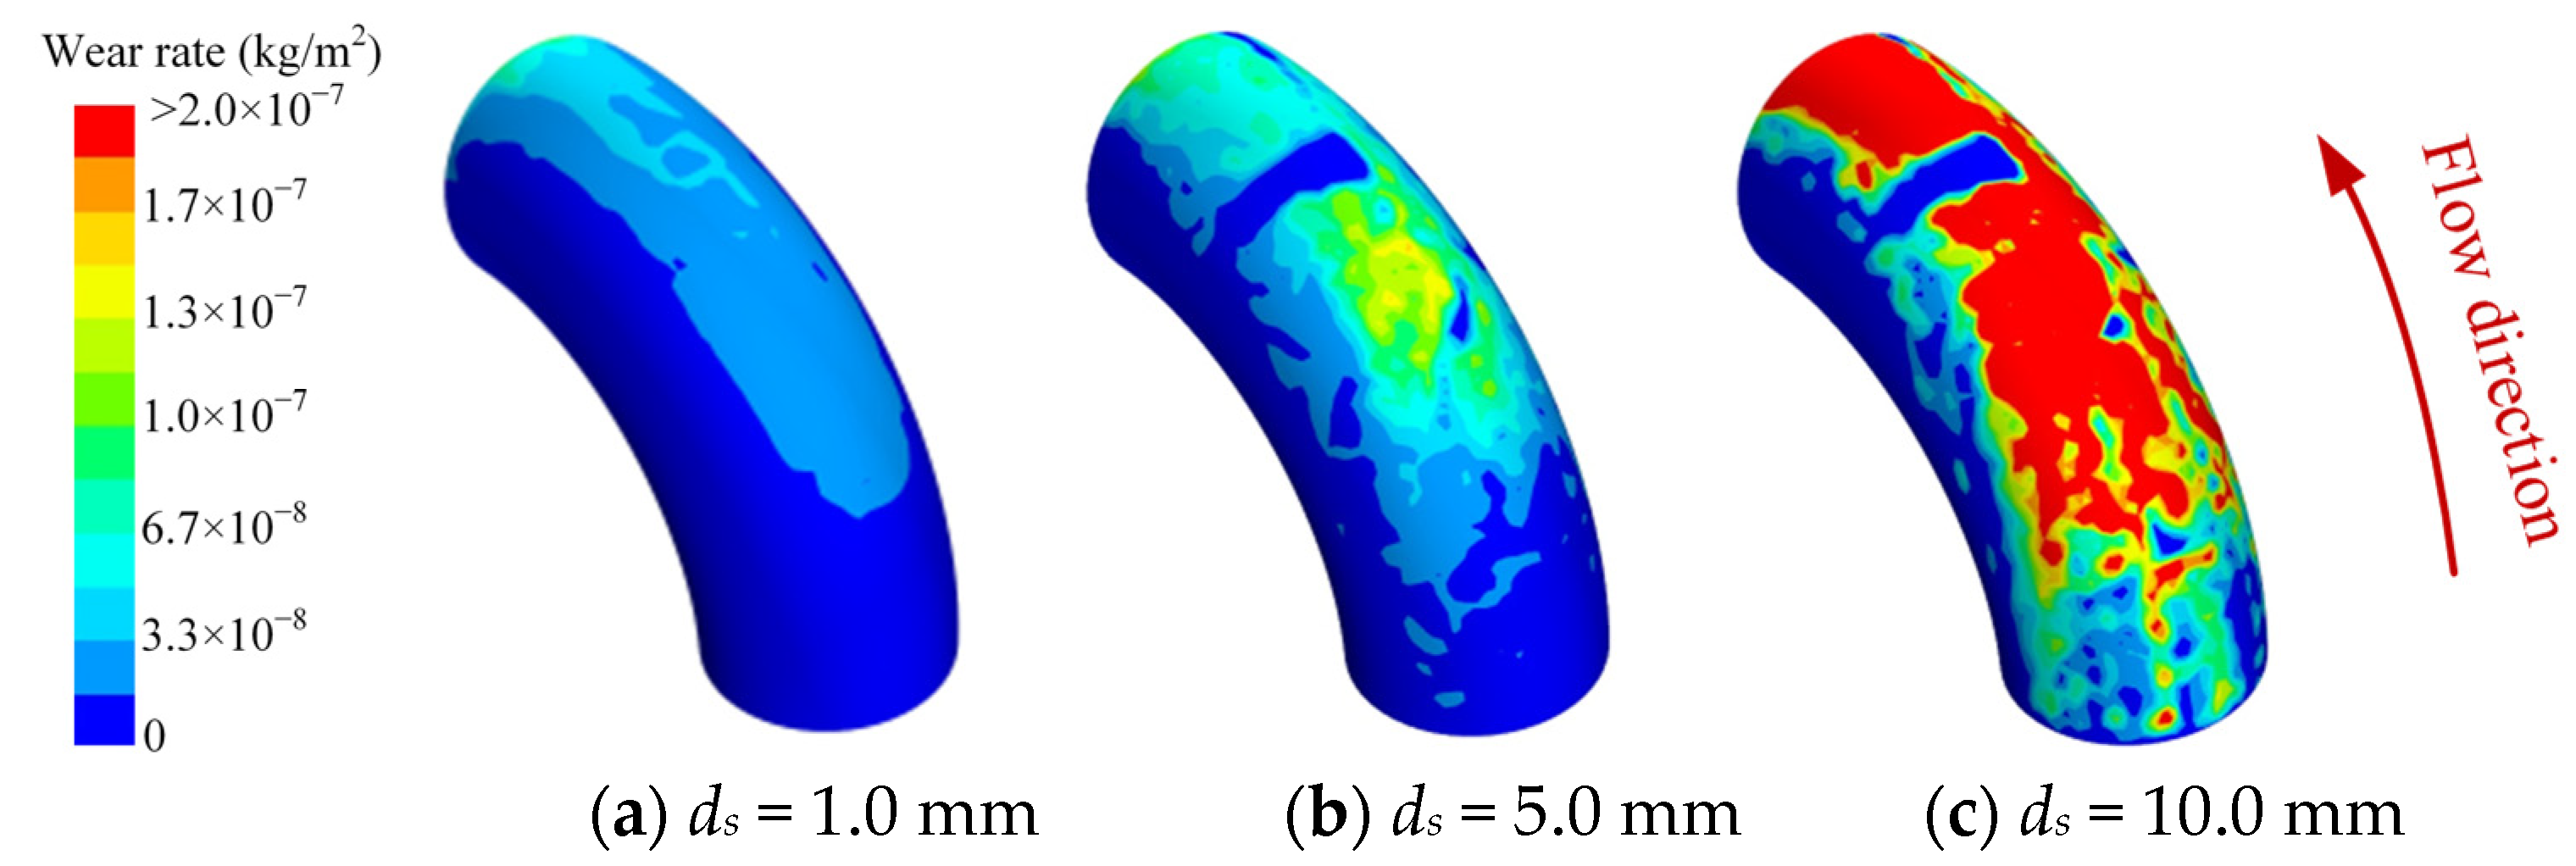
4.3.1. Particle Size
4.3.2. Particle Shape
4.3.3. Particle Hardness
4.4. Target Wall Properties
4.5. Properties of the Mixture
4.5.1. Solid Volume Fraction
4.5.2. Corrosivity of the Carrier Liquid
4.5.3. Liquid Temperature
4.6. Flow Pattern
5. Erosive Wear Models
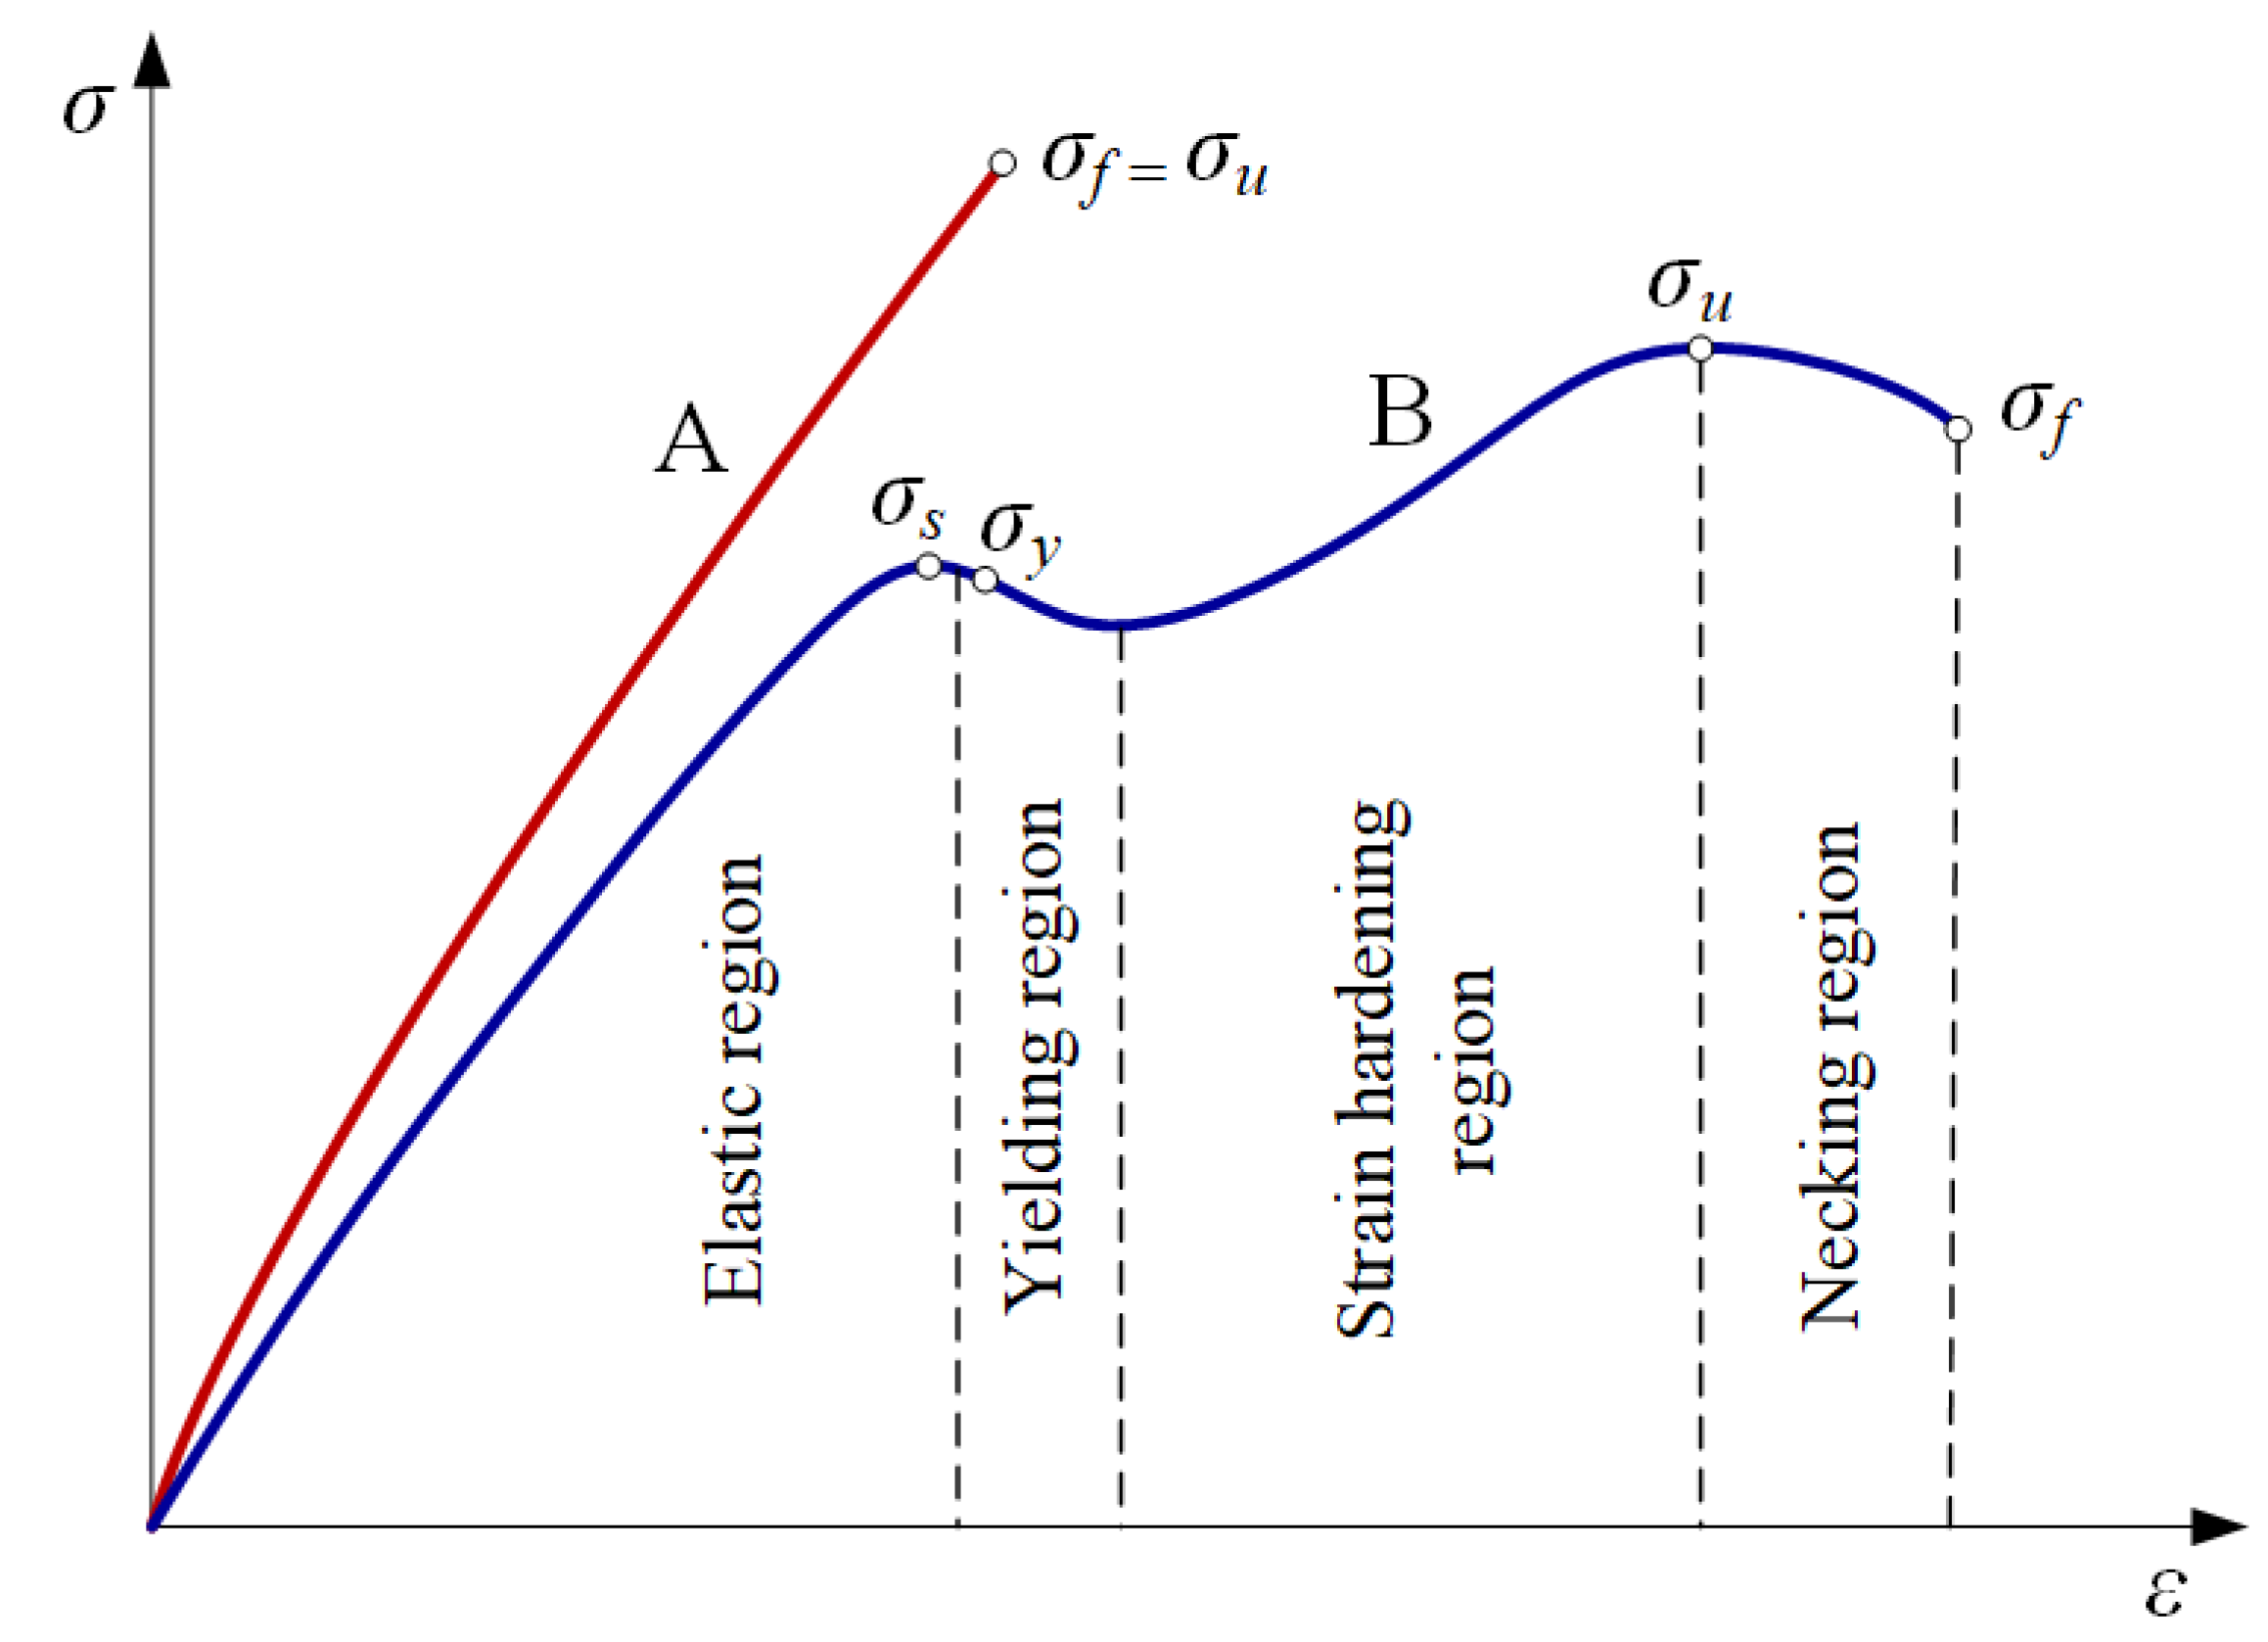
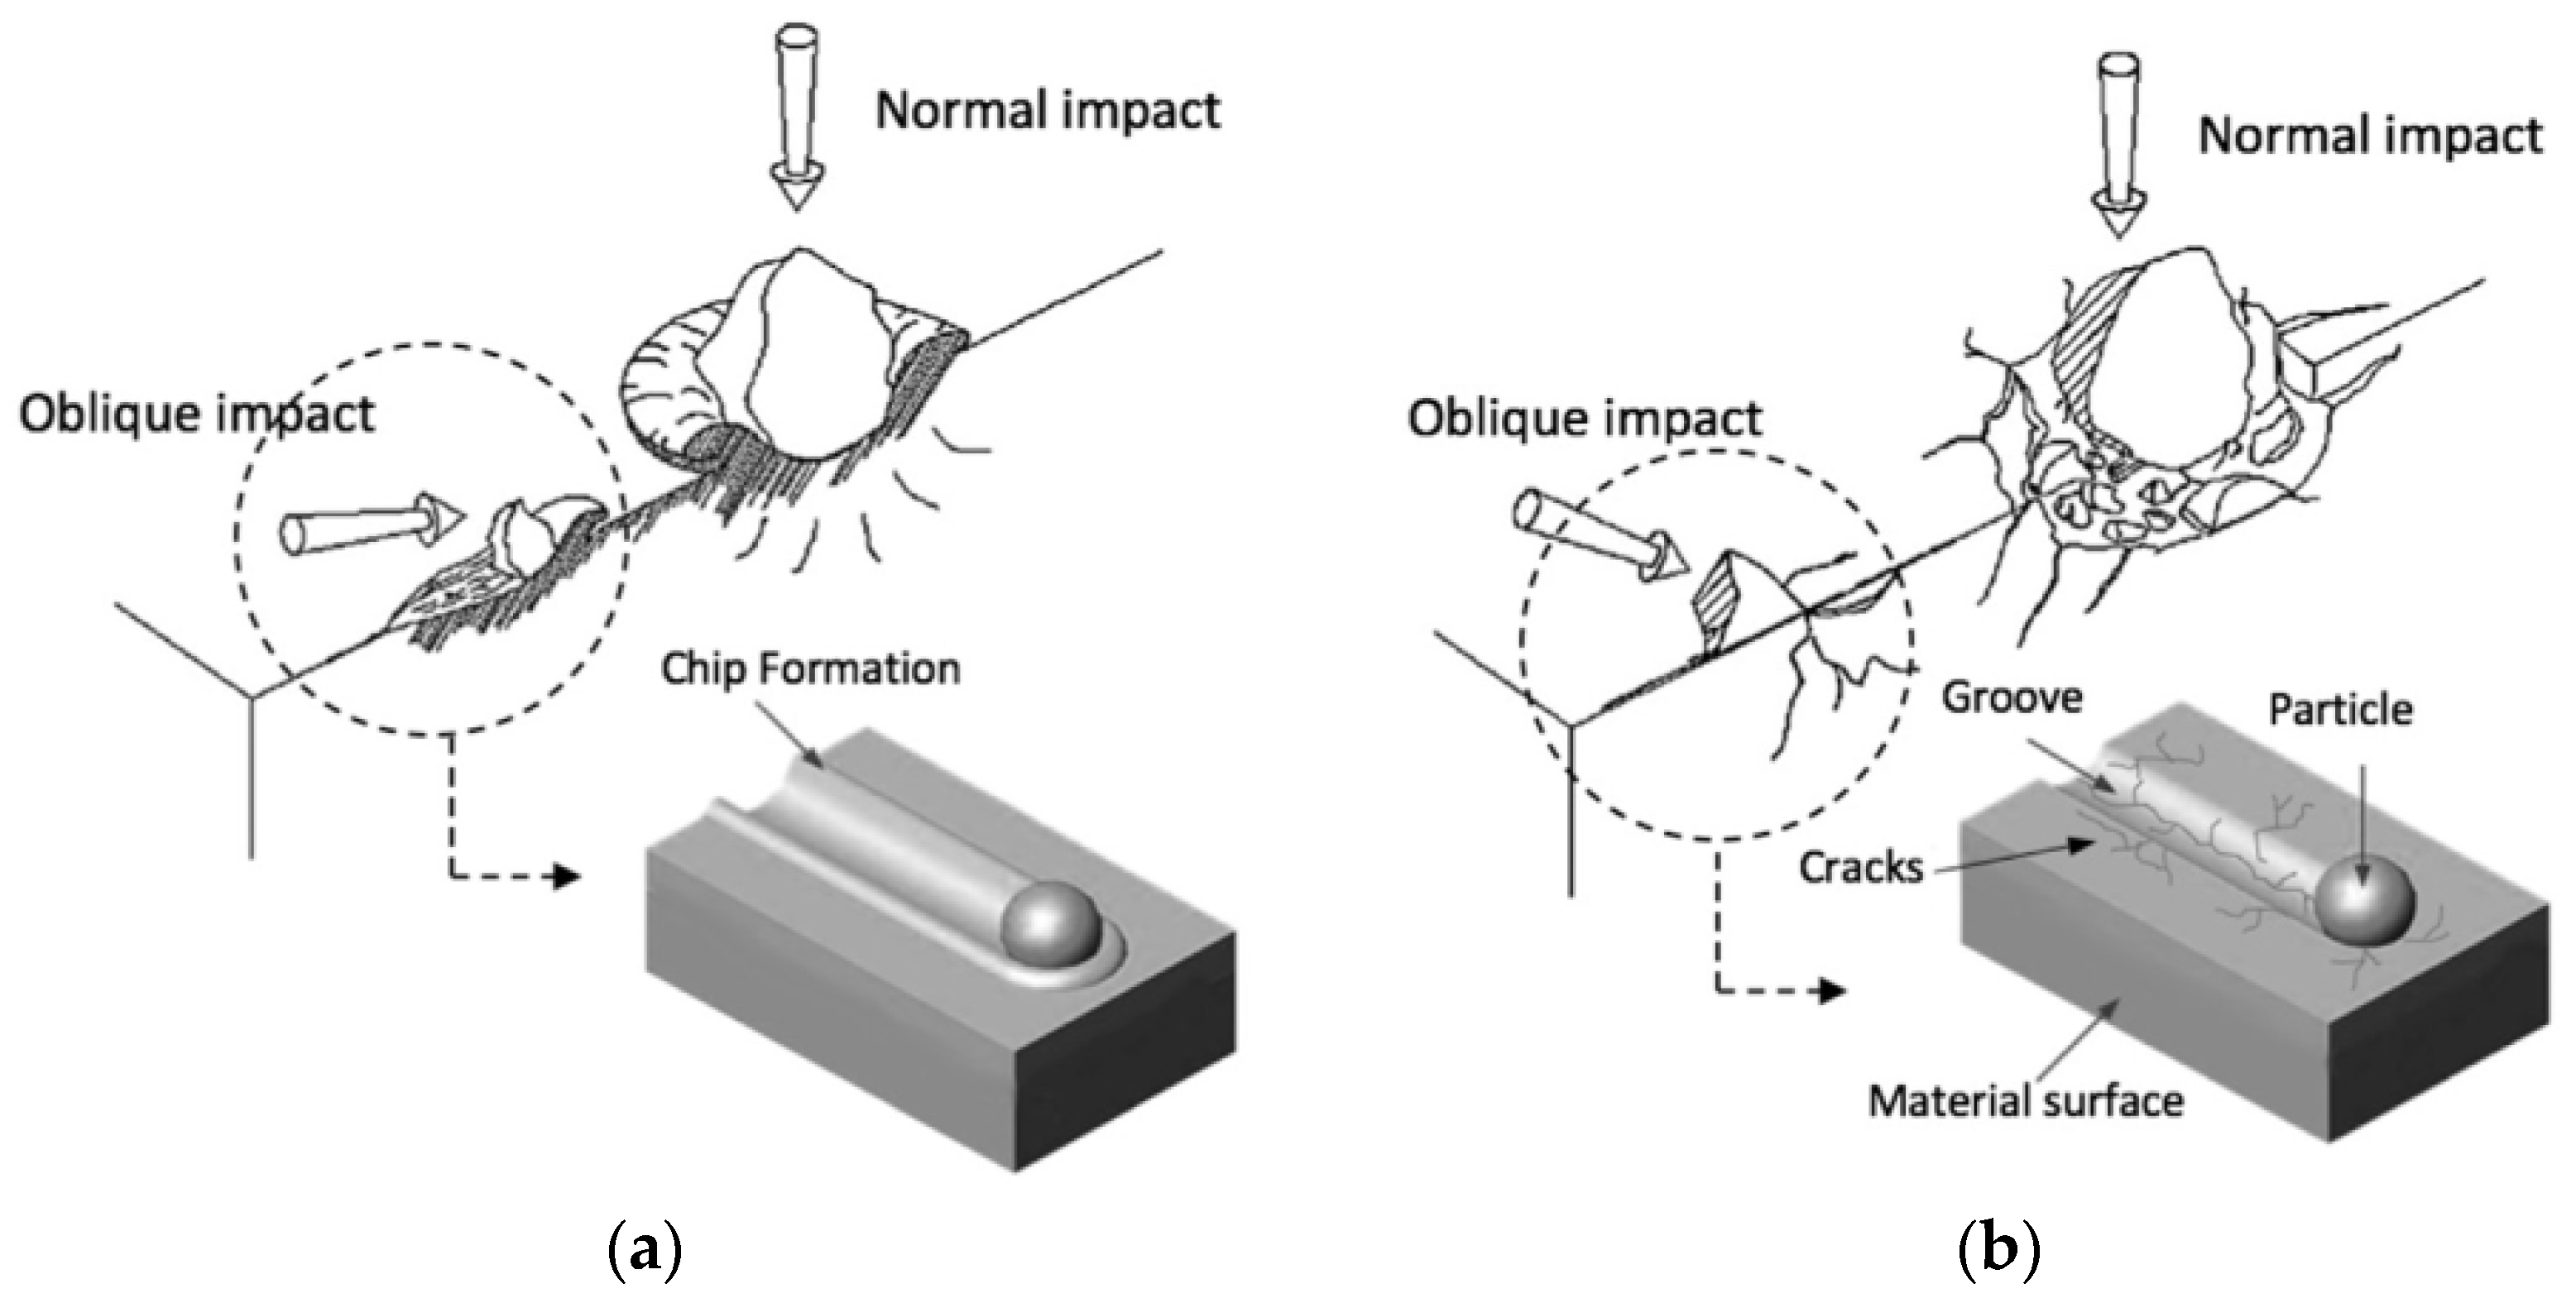
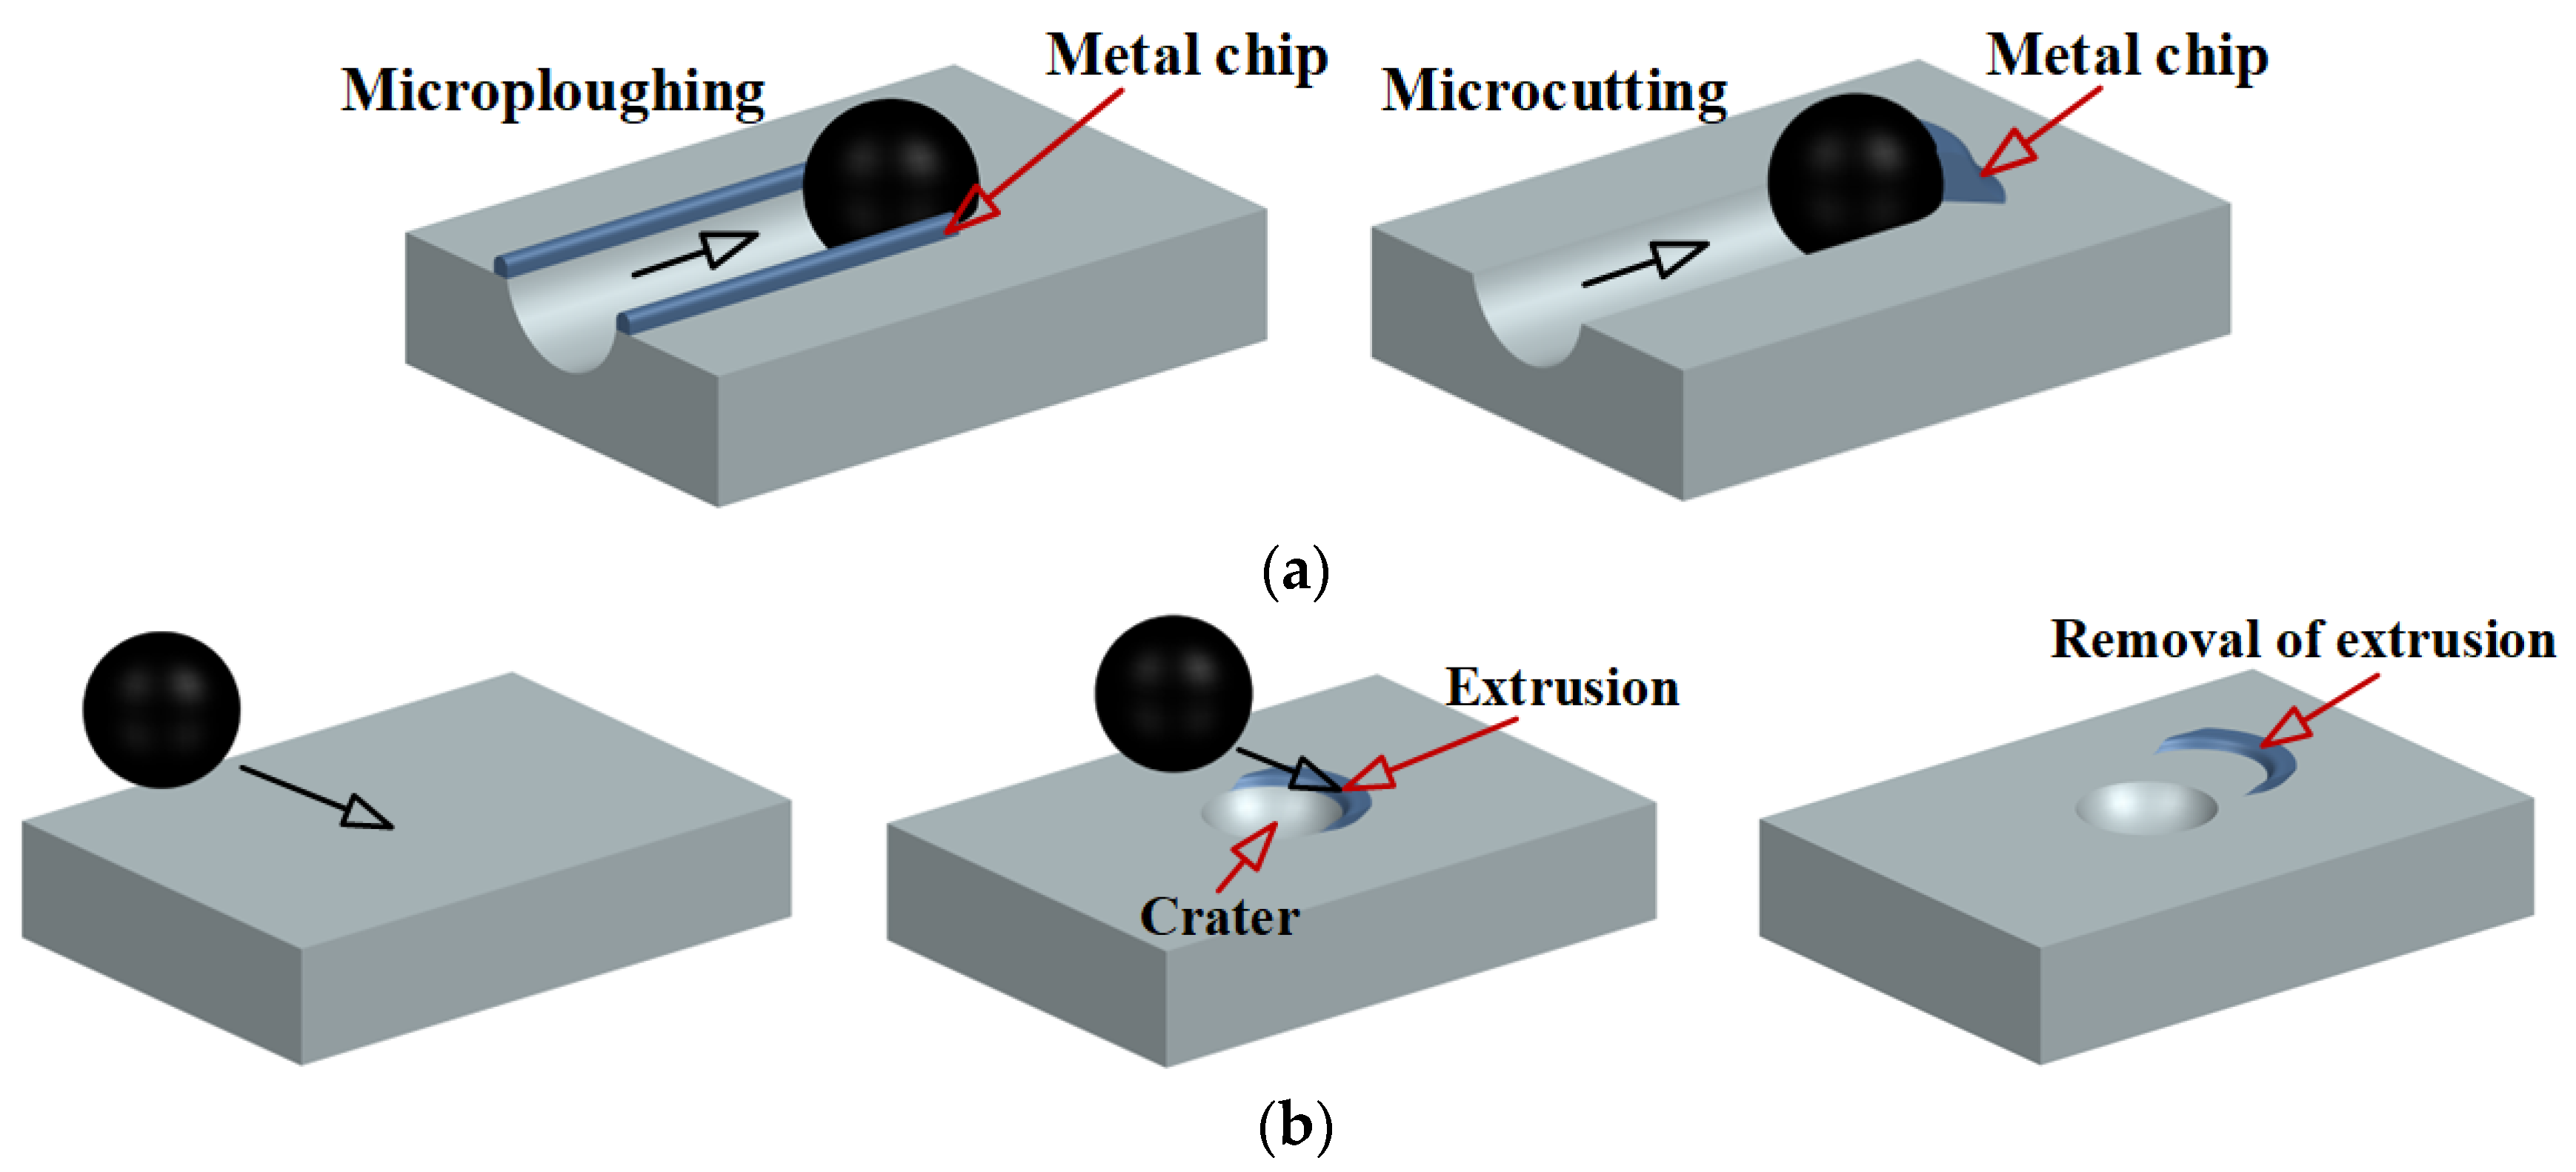
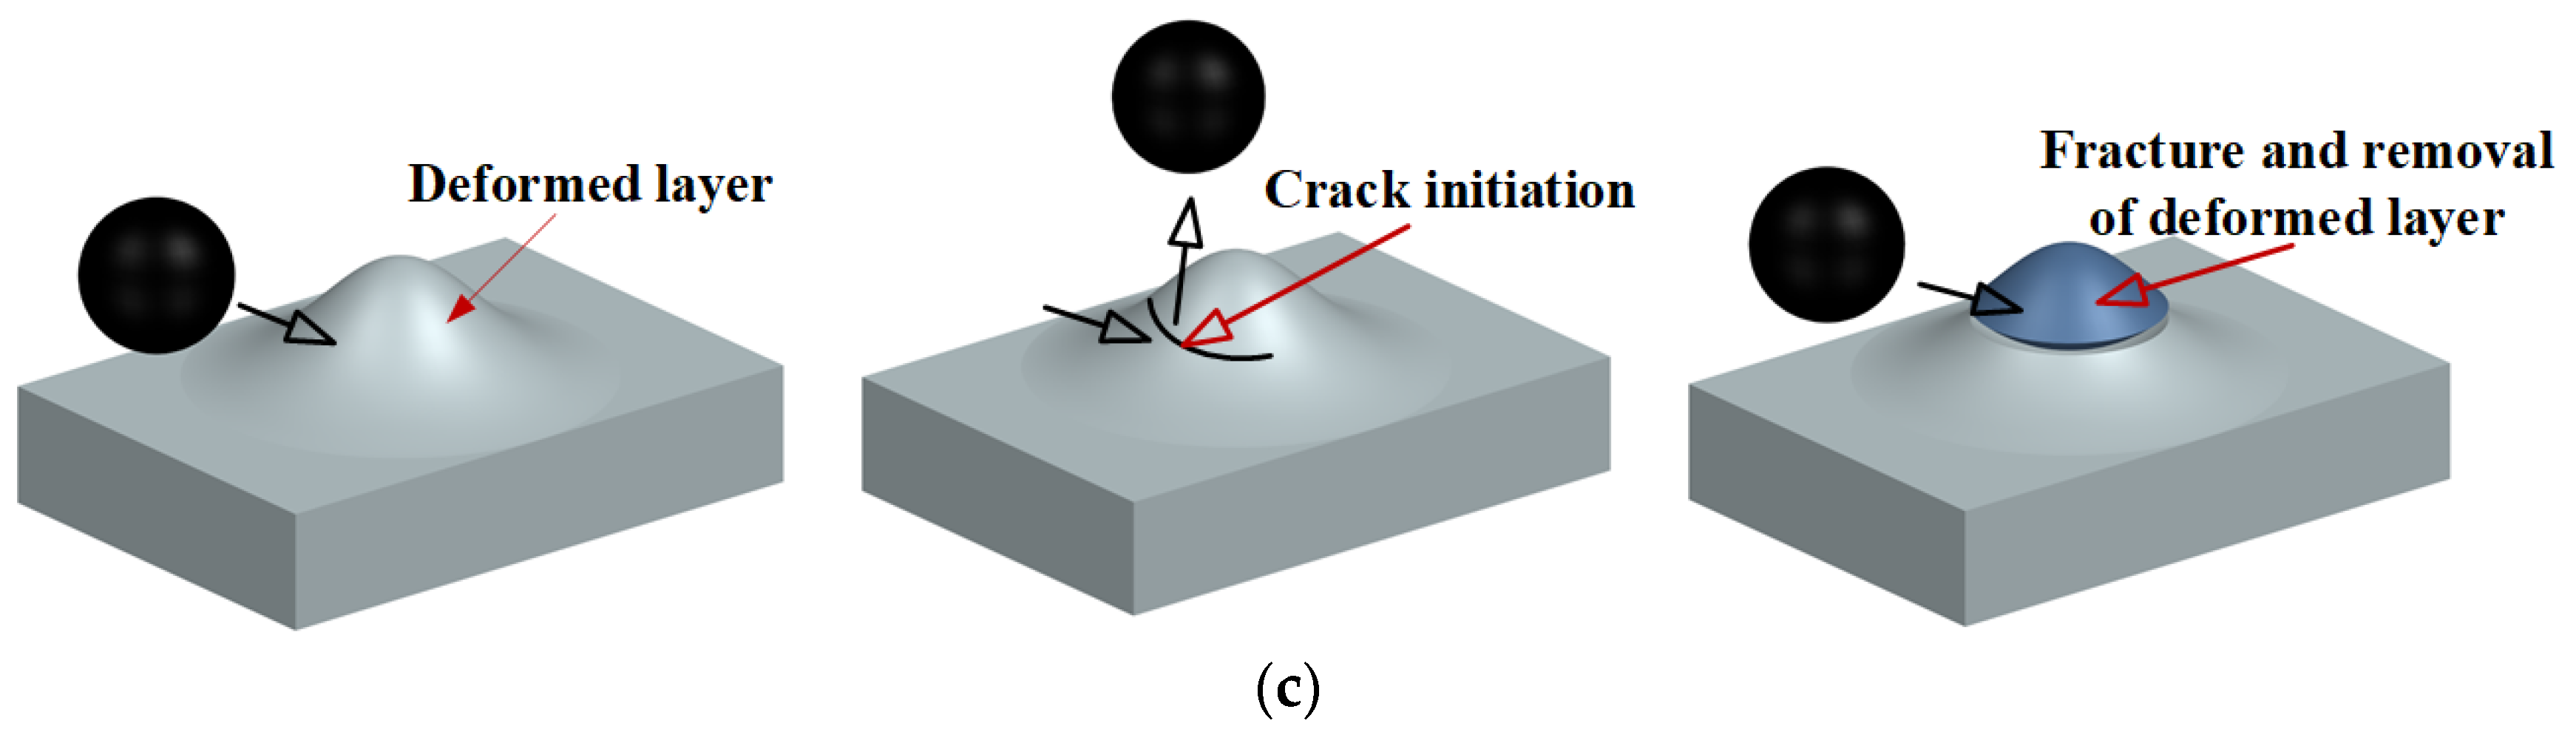
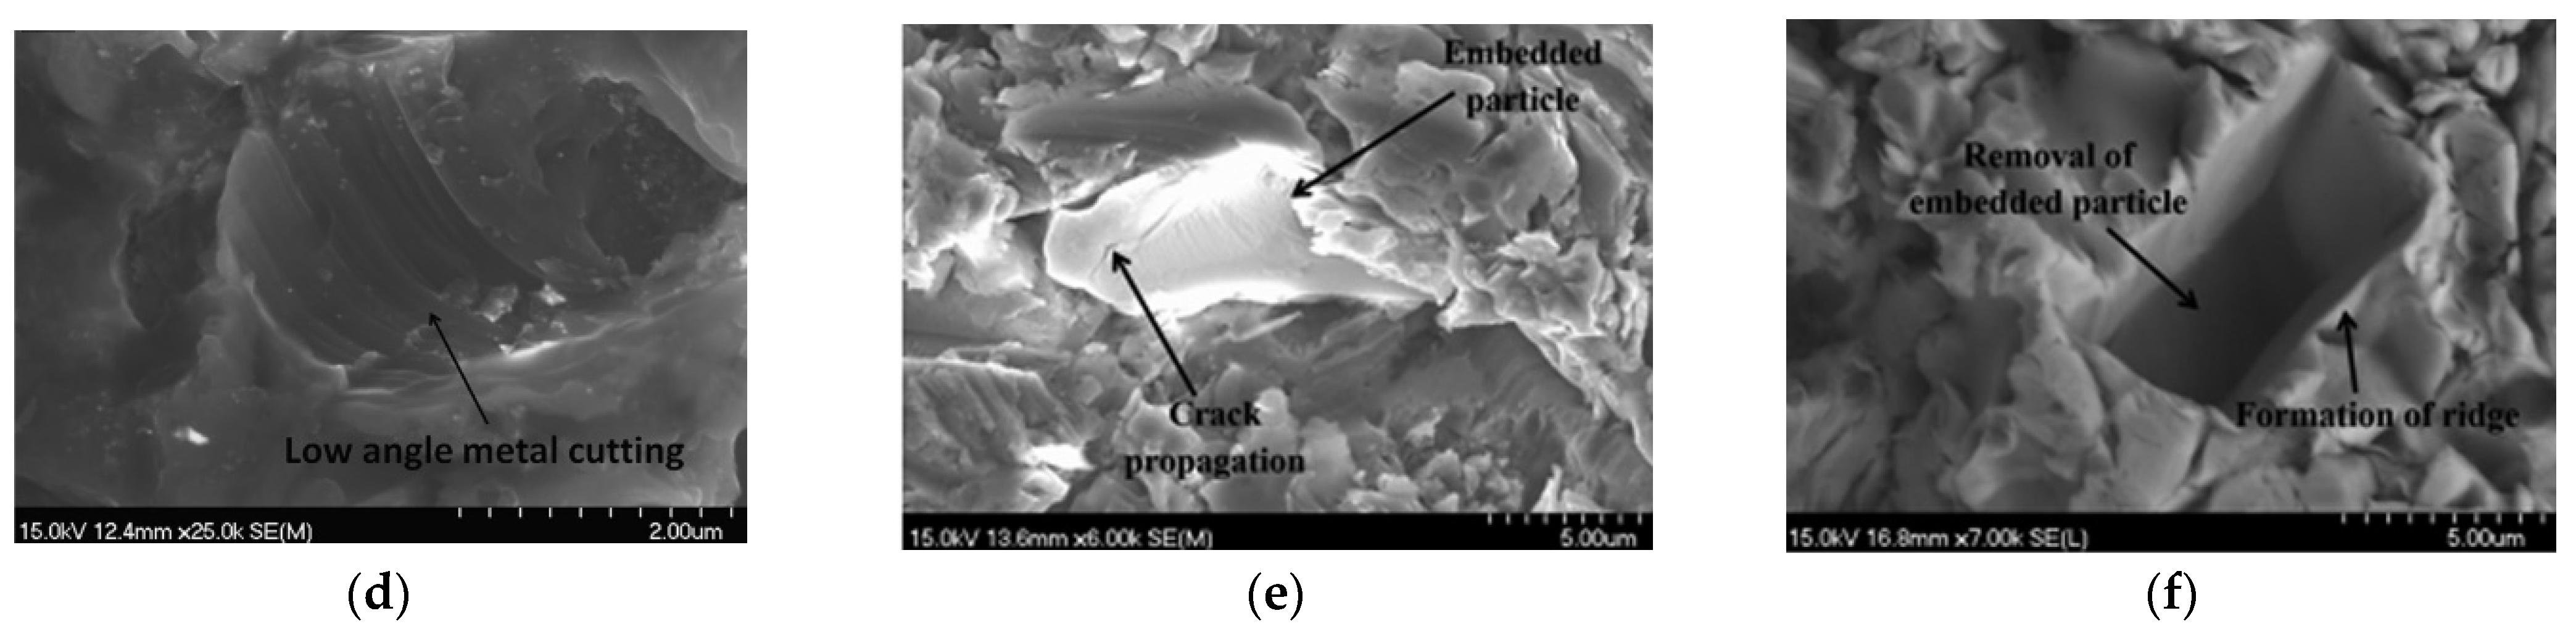
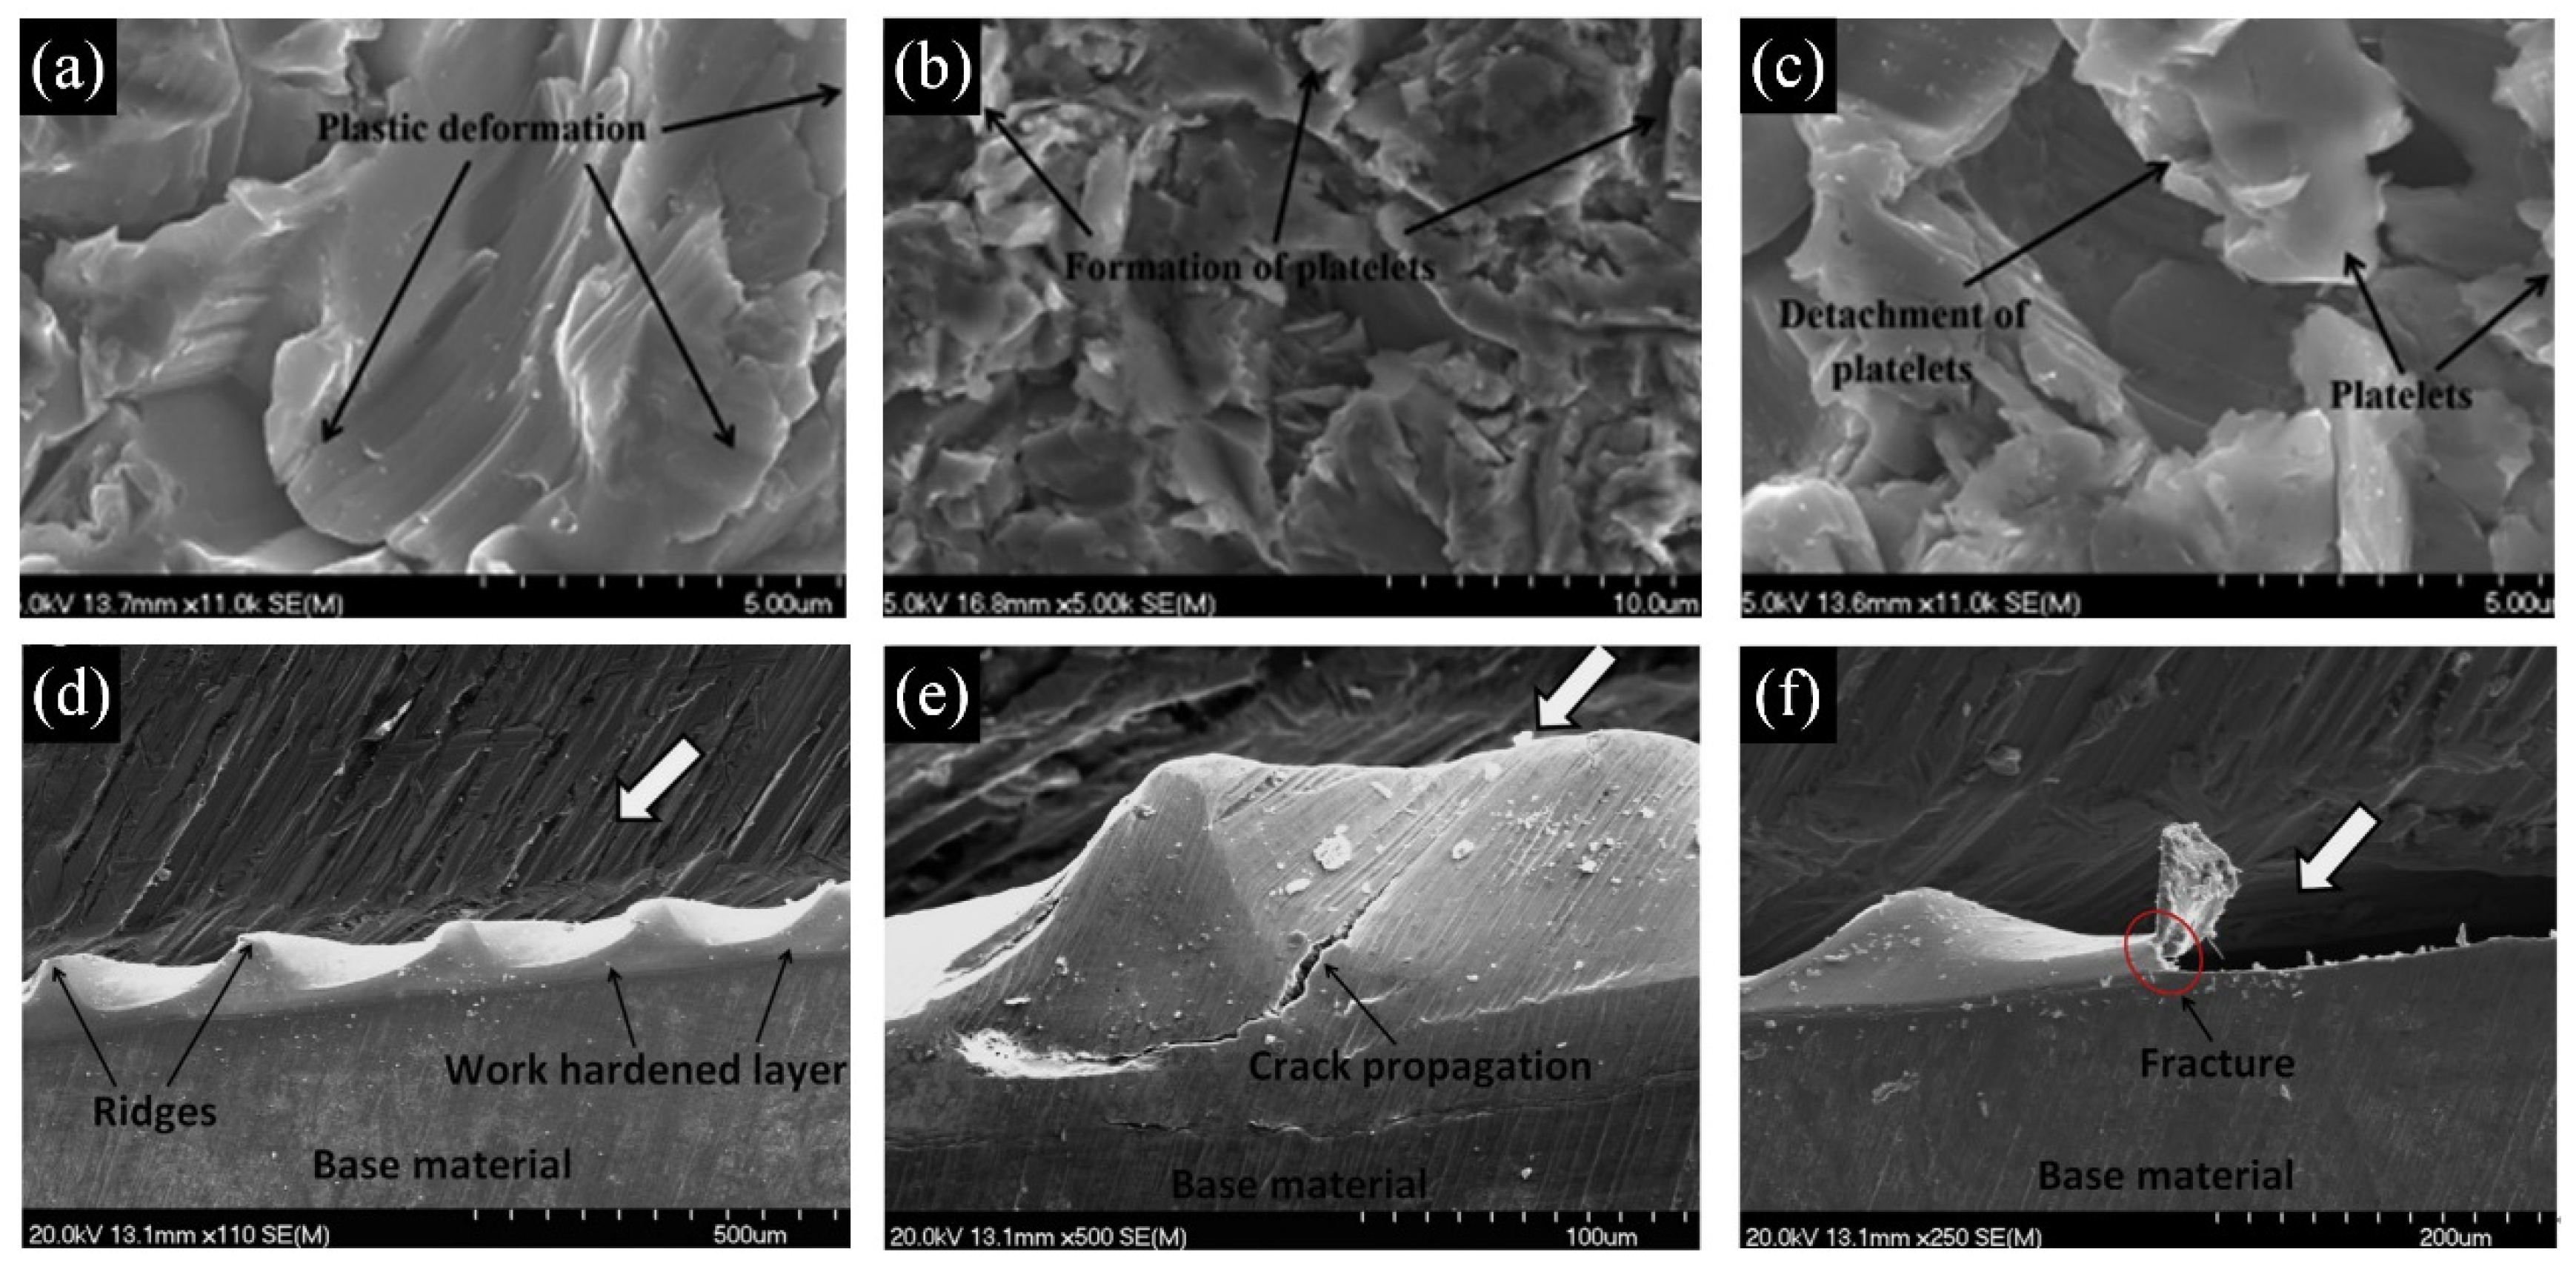
5.1. Description of Wear Mechanisms
5.2. Typical Patterns of Erosive Wear
5.3. Computational Model
5.3.1. Euler–Lagrange Approach
DPM
DDPM
DEM
5.3.2. CFD-Based Wear Models
- (1)
- Archard wear model
- (2)
- Finnie wear model
- (3)
- Oka wear model
- (4)
- McLaury (E/CRC) wear model
6. Wear Equipment and Measurement Method
6.1. Wear Equipment
6.1.1. Jet Erosion Rig
6.1.2. Whirling-Arm Rig
6.1.3. Closed-Loop Rig
6.2. Method of Wear Measurement
6.2.1. Electrical Resistance Probe
6.2.2. Profilometer
6.2.3. Ultrasonic Technique
7. Conclusions and Future Work
Author Contributions
Funding
Acknowledgments
Conflicts of Interest
Nomenclature
| Ai (i = 1~4) | Constants |
| As | Projected area of particle |
| a, b, c | Constants |
| as, bs, and cs | Axes of particle |
| Bcell | Volume of grid cell |
| Bcluster | Volume of mesh cluster |
| Bs | Volume of particle |
| Bs,i | Volume of particle i |
| Cd | Drag coefficient |
| CLS | Shear lift coefficient |
| CLR | Rotational lift coefficient |
| d0 | Threshold diameter of particle |
| ds | Particle diameter |
| dref | Reference diameter of particle |
| ER | Erosion rate |
| ER90 | Erosion rate at normal angle |
| ERA | Initial penetration component of erosion rate |
| ERC | Cutting component of erosion rate |
| ERD | Deformation component of erosion rate |
| FC | Forces acting on the particle by other particles |
| Fc,ij | Contact forces between particles i and j |
| FCen,1 | Centrifugal force generated owing to the rotation of impeller |
| FCen,2 | Centrifugal force generated due to the curved geometry of flow channel |
| FCori | Coriolis force |
| FD | Drag force |
| FDPM | Force acting on liquid from DPM model |
| Fd,v | Fragmentation factor |
| Fg | Gravitational force |
| Fg,i | Body force acting on particle i |
| FLR | Rotational lift force |
| FLS | Shear lift force |
| Fls,i | Force acting on particle i by liquid phase |
| Fl | Force acting on the particle by liquid phase |
| Fn | Applied normal load |
| Fnc,ik | Non-contact forces between particles i and k |
| Fother | Other forces |
| FP | Pressure gradient force |
| Fs | Particle shape coefficient |
| Fuser | Force acting on liquid from user definition |
| fl | Liquid volume fraction |
| fs | Solid volume fraction |
| g | Acceleration of gravity |
| H | Pump head |
| HB | Brinell hardness of target material |
| Hs | Vickers hardness of erodent particle |
| Hv | Vickers hardness of target material |
| Ii | Inertia moment of particle i |
| K, KC, KD | Constants |
| k, k1, k2, k3 | Constants |
| ls | Characteristic length of particle |
| Mr,ij | Normal friction moment between particles i and j |
| Mt,ij | Tangential friction moment between particles i and j |
| mi | Mass of particle i |
| ms | Particle mass |
| Ncell | Total number of particles in the cell |
| Ncluster | Total number of particles in the mesh cluster |
| n, n1, n2 | Constants |
| P | Static pressure of liquid |
| Ps | Overall perimeter of the projection of a particle |
| qV | Volume flow rate |
| r1,r2 | Curvature radius |
| SDPM | Source term from DPM model |
| SF | Particle shape factor |
| Sp | Surface area of the given particle |
| Ss | Surface area of a sphere |
| St | Stokes number |
| Suser | Source term from user definition |
| s | Sliding distance |
| T | Torque applied to a particle in a fluid domain |
| v0 | Threshold velocity of particle |
| vcir | Circumferential velocity of particle |
| vi | Translational velocity of particle i |
| vl | Liquid velocity |
| vref | Reference velocity of particle |
| vrel | Relative velocity of particle |
| vs | Particle velocity |
| vslip | Slip velocity of particle |
| vt | Test velocity of particle |
| vtsh | Critical velocity |
| WC | Cutting wear rate |
| WD | Deformation wear rate |
| WT | Total wear rate |
| ε | Strain |
| ε1 | Maximum primary erosion rate |
| ε2 | Maximum secondary erosion rate |
| θ | Impact angle |
| κ | Ratio of vertical to horizontal force component |
| μl | Dynamic viscosity of liquid |
| ρl | Liquid density |
| σ | Stress |
| σf | Fracture stress |
| σs | Elastic stress |
| σu | Ultimate stress |
| σy | Yield stress |
| Viscosity stress | |
| ωi | Angular velocity of particle i |
| ωl | Curl of liquid velocity |
| ωs | Angular velocity of particle |
| ωimp | Angular velocity of impeller |
| ψ | Ratio of the depth of a lip to its length |
References
- Finnie, I. Erosion of surfaces by solid particles. Wear 1960, 3, 87–103. [Google Scholar] [CrossRef]
- Islam, M.A.; Farhat, Z.N. Effect of impact angle and velocity on erosion of API X42 pipeline steel under high abrasive feed rate. Wear 2014, 311, 180–190. [Google Scholar] [CrossRef]
- Chen, P.; Cui, B.; Li, J.; Zheng, J.; Zhao, Y. Particle erosion under multiphase bubble flow in horizontal-vertical-upward elbows. Powder Technol. 2022, 397, 117002. [Google Scholar] [CrossRef]
- Peng, W.; Ma, L.; Wang, P.; Cao, X.; Xu, K.; Miao, Y. Experimental and CFD investigation of flow behavior and sand erosion pattern in a horizontal pipe bend under annular flow. Particuology 2023, 75, 11–25. [Google Scholar] [CrossRef]
- van Wijk, J.M.; Talmon, A.M.; van Rhee, C. Stability of vertical hydraulic transport processes for deep ocean mining: An experimental study. Ocean Eng. 2016, 125, 203–213. [Google Scholar] [CrossRef]
- Yan, Q.; Li, D.; Wang, K.; Zheng, G. Study on the hydrodynamic evolution mechanism and drift flow patterns of pipeline gas-liquid flow. Processes 2024, 12, 695. [Google Scholar] [CrossRef]
- Wang, X.; Gong, L.; Li, Y.; Yao, J. Developments and applications of the CFD-DEM method in particle-fluid numerical simulation in petroleum engineering: A review. Appl. Therm. Eng. 2023, 222, 119865. [Google Scholar] [CrossRef]
- Filho, E.A.S.; Lima, N.C.; Franklin, E.M. Resolved CFD-DEM simulations of the hydraulic conveying of coarse grains through a very-narrow elbow. Powder Technol. 2022, 395, 811–821. [Google Scholar] [CrossRef]
- Wu, J.; Li, L.; Li, Z.; Wang, T.; Tan, Y.; Tan, D. Mass transfer mechanism of multiphase shear flows and interphase optimization solving method. Energy 2024, 292, 130475. [Google Scholar] [CrossRef]
- Clarke, D.A.; Sederman, A.J.; Gladden, L.F.; Holland, D.J. Investigation of void fraction schemes for use with CFD-DEM simulations of fluidized beds. Ind. Eng. Chem. Res. 2018, 57, 3002–3013. [Google Scholar] [CrossRef]
- Zhang, Y.; Lu, X.; Zhang, X. Numerical simulation on transportation behavior of dense coarse particles in vertical pipe with an optimized Eulerian–Lagrangian method. Phys. Fluids 2022, 34, 033305. [Google Scholar] [CrossRef]
- Zhang, Y.; Ren, W.; Li, P.; Zhang, X.; Lu, X. Calculation of particle volume fraction in computational fluid dynamics-discrete element method simulation of particulate flows with coarse particles. Phys. Fluids 2023, 35, 11330. [Google Scholar] [CrossRef]
- Zhu, G.; Zhao, Y.; Wang, Z.; Khalid, M.S.U.; Liu, M. Semi-resolved CFD-DEM simulation of fine particle migration with heat transfer in heterogeneous porous media. Int. J. Heat Mass Transf. 2022, 197, 123349. [Google Scholar] [CrossRef]
- Zhou, J.; Du, C.; Liu, S.; Liu, Y. Comparison of three types of swirling generators in coarse particle pneumatic conveying using CFD-DEM simulation. Powder Technol. 2016, 301, 1309–1320. [Google Scholar] [CrossRef]
- Yan, T.; Qu, J.; Sun, X.; Li, W.; Chen, Y.; Hu, Q. A novel predictive model of drag coefficient and settling velocity of drill cuttings in non-Newtonian drilling fluids. Pet. Sci. 2021, 18, 1729–1738. [Google Scholar] [CrossRef]
- Liu, L.; Gai, K.; Yang, J.; Guo, X. Numerical investigation on the dynamics of mixture transport in flexible risers during deep-sea mining. J. Mar. Sci. Eng. 2022, 10, 1842. [Google Scholar] [CrossRef]
- Sedrez, T.A.; Shirazi, S.A.; Rajkumar, Y.R.; Sambath, K.; Subramani, H.J. Experiments and CFD simulations of erosion of a 90° elbow in liquid-dominated liquid-solid and dispersed-bubble-solid flows. Wear 2019, 426–427, 570–580. [Google Scholar] [CrossRef]
- Li, Y.; Liu, S.; Hu, X. Research on rotating speed’s influence on performance of Deep-Sea lifting motor pump based on DEM-CFD. Mar. Georesources Geotechnol. 2019, 37, 979–988. [Google Scholar] [CrossRef]
- Park, J.; Lee, G.H.; Park, J.Y.; Lee, J.C.; Kim, H.C. A numerical study of the Coriolis effect in centrifugal microfluidics with different channel arrangements. Microfluid. Nanofluidics 2016, 20, 65. [Google Scholar] [CrossRef]
- Agrawal, M.; Khanna, S.; Kopliku, A.; Lockett, T. Prediction of sand erosion in CFD with dynamically deforming pipe geometry and implementing proper treatment of turbulence dispersion in particle tracking. Wear 2019, 426–427, 596–604. [Google Scholar] [CrossRef]
- Sun, B.; Fan, J.; Wen, D.; Chen, Y. An experimental study of slurry erosion involving tensile stress for pressure pipe manifold. Tribol. Int. 2015, 82, 280–286. [Google Scholar] [CrossRef]
- Zhang, J.; Kang, J.; Fan, J.; Gao, J. Study on erosion wear of fracturing pipeline under the action of multiphase flow in oil & gas industry. J. Nat. Gas Sci. Eng. 2016, 32, 334–346. [Google Scholar] [CrossRef]
- Vieira, R.E. Sand Erosion Model Improvement for Elbows in Gas Production Multiphase Annular and Low-Liquid Flow. Ph.D. Dissertation, University of Tulsa, Tulsa, OK, USA, 2014. Available online: https://www.proquest.com/docview/1622416688 (accessed on 29 October 2018).
- Brennen, C.E. Fundamentals of Multiphase Flow; Cambridge University Press: Cambridge, UK, 2005. [Google Scholar] [CrossRef]
- Bilal, F.S.; Sedrez, T.A.; Shirazi, S.A. Experimental and CFD investigations of 45 and 90 degrees bends and various elbow curvature radii effects on solid particle erosion. Wear 2021, 476, 203646. [Google Scholar] [CrossRef]
- Chen, X.; McLaury, B.S.; Shirazi, S.A. Numerical and experimental investigation of the relative erosion severity between plugged tees and elbows in dilute gas/solid two-phase flow. Wear 2006, 261, 715–729. [Google Scholar] [CrossRef]
- Cui, B.; Chen, P.; Zhao, Y. Numerical simulation of particle erosion in the vertical-upward-horizontal elbow under multiphase bubble flow. Powder Technol. 2022, 404, 117437. [Google Scholar] [CrossRef]
- Haider, G.; Othayq, M.; Zhang, J.; Vieira, R.E.; Shirazi, S.A. Effect of particle size on erosion measurements and predictions in annular flow for an elbow. Wear 2021, 476, 203579. [Google Scholar] [CrossRef]
- Kang, R.; Liu, H. A probability model of predicting the sand erosion in elbows for annular flow. Wear 2019, 422–423, 167–179. [Google Scholar] [CrossRef]
- Pei, J.; Lui, A.; Zhang, Q.; Xiong, T.; Jiang, P.; Wei, W. Numerical investigation of the maximum erosion zone in elbows for liquid-particle flow. Powder Technol. 2018, 333, 47–59. [Google Scholar] [CrossRef]
- Vieira, R.E.; Mansouri, A.; McLaury, B.S.; Shirazi, S.A. Experimental and computational study of erosion in elbows due to sand particles in air flow. Powder Technol. 2016, 288, 339–353. [Google Scholar] [CrossRef]
- van Wijk, J.M.; van Grunsven, F.; Talmon, A.M.; van Rhee, C. Simulation and experimental proof of plug formation and riser blockage during vertical hydraulic transport. Ocean Eng. 2015, 101, 58–66. [Google Scholar] [CrossRef]
- Xia, J.X.; Ni, J.R.; Mendoza, C. Hydraulic lifting of manganese nodules through a riser. J. Offshore Mech. Arct. Eng. 2004, 126, 72–77. [Google Scholar] [CrossRef]
- Li, Y.; Zhang, H.; Lin, Z.; He, Z.; Xiang, J.; Su, X. Relationship between wear formation and large-particle motion in a pipe bend. R. Soc. Open Sci. 2019, 6, 181254. [Google Scholar] [CrossRef] [PubMed]
- Peng, W.; Cao, X. Numerical simulation of solid particle erosion in pipe bends for liquid–solid flow. Powder Technol. 2016, 294, 266–279. [Google Scholar] [CrossRef]
- Kuntz, G. Advantages of submersible motor pumps in deep-sea mining. J. Pet. Technol. 1980, 32, 2241–2246. [Google Scholar] [CrossRef]
- Volkmann, S.E. Blue Mining—Planning the Mining of Seafloor Manganese Nodules. Ph.D. Dissertation, RWTH Aachen University, Aachen, Germany, 2018. Available online: http://publications.rwth-aachen.de/record/750679 (accessed on 29 October 2018).
- Kurushima, M.; Kuriyagawa, M.; Koyama, N.K. Japanese program for deep seabed mineral resources development. In Proceedings of the 27th Offshore Technology Conference, Houston, TX, USA, 1–4 May 1995; pp. 87–94. [Google Scholar] [CrossRef]
- Yoon, C.-H.; Kang, J.-S.; Park, J.-M.; Park, Y.-C.; Kim, Y.-J.; Kwon, S.-K. Flow analysis by CFD model of lifting system for shallow sea test. In Proceedings of the Eighth (2009) ISOPE Ocean Mining Symposium, Chennai, India, 20–24 September 2009; pp. 225–228. [Google Scholar]
- Yoon, C.-H.; Kang, J.-S.; Park, Y.-C.; Kim, Y.-J.; Park, J.-M.; Kwon, S.-K. Solid-liquid flow experiment with real and artificial manganese nodules in flexible hoses. In Proceedings of the Eighteenth (2008) International Offshore and Polar Engineering Conference, Vancouver, BC, Canada, 6–11 July 2008; Volume 19, pp. 68–72. [Google Scholar] [CrossRef]
- Judge, R.A.; Yu, A. Subsea slurry lift pump for deepsea mining. In Proceedings of the ASME 2010 29th International Conference on Ocean 2010, Offshore and Arctic Engineering, Shanghai, China, 6–11 June 2010; pp. 181–188. [Google Scholar] [CrossRef]
- Li, Y.; Liu, S.; Hu, X. Research on reflux in deep-sea mining pump based on DEM-CFD. Mar. Georesources Geotechnol. 2020, 38, 744–752. [Google Scholar] [CrossRef]
- He, P.C.; Song, P.Y. A simple correlation equation to predict pump performance for slurry. Appl. Mech. Mater. 2013, 365–366, 365–369. [Google Scholar] [CrossRef]
- Noon, A.A.; Kim, M.-H. Erosion wear on centrifugal pump casing due to slurry flow. Wear 2016, 364–365, 103–111. [Google Scholar] [CrossRef]
- Sellgren, A.; Visintainer, R.; Furlan, J.; Matoušek, V. Pump and pipeline performance when pumping slurries with different particle gradings. Can. J. Chem. Eng. 2016, 94, 1025–1031. [Google Scholar] [CrossRef]
- Tarodiya, R.; Gandhi, B.K. Hydraulic performance and erosive wear of centrifugal slurry pumps—A review. Powder Technol. 2017, 305, 27–38. [Google Scholar] [CrossRef]
- Shen, Z.; Chu, W.; Li, X.; Dong, W. Sediment erosion in the impeller of a double-suction centrifugal pump–A case study of the Jingtai Yellow River Irrigation Project, China. Wear 2019, 422–423, 269–279. [Google Scholar] [CrossRef]
- Tarodiya, R.; Gandhi, B.K. Experimental investigation of centrifugal slurry pump casing wear handling solid-liquid mixtures. Wear 2019, 434–435, 202972. [Google Scholar] [CrossRef]
- Chen, H.; Fan, M.; Su, W.; Guo, Y.; Huang, Y. Effects of particle erosion on the submersible pump in an ultra-high voltage transformer. Energy Rep. 2021, 7, 7072–7081. [Google Scholar] [CrossRef]
- Na, S.J.; Kim, Y.S.; Jeon, E.S. Analysis of erosion minimization for a slurry pump using discrete phase model simulations. Appl. Sci. 2022, 12, 1597. [Google Scholar] [CrossRef]
- Dong, J.; Qian, Z.; Thapa, B.S.; Thapa, B.; Guo, Z. Alternative design of double-suction centrifugal pump to reduce the effects of silt erosion. Energies 2019, 12, 158. [Google Scholar] [CrossRef]
- Zhao, R.; Zhao, Y.; Zhang, D.; Li, Y.; Geng, L. Numerical investigation of the characteristics of erosion in a centrifugal pump for transporting dilute particle-laden flows. J. Mar. Sci. Eng. 2021, 9, 961. [Google Scholar] [CrossRef]
- Liu, S.; Wen, H.; Zou, W.; Hu, X.; Dong, Z. Deep-sea mining pump wear prediction using numerical two-phase flow simulation. In Proceedings of the International Conference on Intelligent Transportation 2019, Big Data & Smart City (ICITBS), Changsha, China, 12–13 January 2019; pp. 630–636. [Google Scholar] [CrossRef]
- Wen, H.; Liu, S.; Zou, W.; Hu, X.; Dong, Z. Effects of particle diameter on erosion wear characteristic of deep-sea mining pump. In Proceedings of the 2019 International Conference on Intelligent Transportation 2019, Big Data & Smart City (ICITBS), Changsha, China, 12–13 January 2019; pp. 507–512. [Google Scholar] [CrossRef]
- Alawadhi, K.; Alzuwayer, B.; Alrahmani, M.; Murad, A. Evaluation of the erosion characteristics for a marine pump using 3D RANS simulations. Appl. Sci. 2021, 11, 7364. [Google Scholar] [CrossRef]
- Xu, H.; Chen, W.; Xu, C. Cavitation performance of multistage slurry pump in deep-sea mining. AIP Adv. 2019, 9, 105024. [Google Scholar] [CrossRef]
- Chen, M.; Tan, L.; Fan, H.; Wang, C.; Liu, D. Solid-liquid multiphase flow and erosion characteristics of a centrifugal pump in the energy storage pump station. J. Energy Storage 2022, 56, 105916. [Google Scholar] [CrossRef]
- Wang, R.; Guan, Y.; Jin, X.; Tang, Z.; Zhu, Z.; Su, X. Impact of particle sizes on flow characteristics of slurry pump for deep-sea mining. Shock Vib. 2021, 2021, 6684944. [Google Scholar] [CrossRef]
- Hadjiyannis, S.; Charalambous, N.; Tourlidakis, A.; Michaelides, K. An experimental and computational study of the erosion in submersible pumps and the development of a methodology for selecting appropriate protective coatings. In Proceedings of the ASME Turbo Expo 2009: Power for Land 2009, Sea and Air, Orlando, FL, USA, 8–12 June 2009; pp. 61–72. [Google Scholar] [CrossRef]
- Hong, S.; Hu, X. Study on the non-steady-state wear characteristics and test of the flow passage components of deep-sea mining pumps. Appl. Sci. 2022, 12, 782. [Google Scholar] [CrossRef]
- Peng, G.J.; Luo, Y.Y.; Wang, Z.W. Research on wear properties of centrifugal dredge pump based on liquid-solid two-phase fluid simulations. IOP Conf. Ser. Mater. Sci. Eng. 2015, 72, 042048. [Google Scholar] [CrossRef]
- Peng, G.; Du, J.; Chang, H.; Chen, Q.; Li, J.; Pan, C.; Yang, Y. Numerical and experimental analysis of influence of impeller structures on slurry pump performance. Front. Energy Res. 2021, 9, 762159. [Google Scholar] [CrossRef]
- Qian, Z.; Dong, J.; Guo, Z.; Wang, Z.; Wang, F. Study of a bionic anti-erosion blade in a double suction centrifugal pump. In Proceedings of the ASME 2016 Fluids Engineering Division Summer Meeting, Washington, DC, USA, 10–14 July 2016; p. V01AT09A007. [Google Scholar] [CrossRef]
- Shen, Z.; Chu, W. Effect of particle parameters on erosion wear and performance of screw centrifugal pump. In Proceedings of the ASME 2018 International Mechanical Engineering Congress and Exposition 2018, Pittsburgh, PA, USA, 9–15 November 2018; p. V007T09A018. [Google Scholar] [CrossRef]
- Shi, X.; Ding, W.; Xu, C.; Xie, F.; Tian, Z. Numerical investigation of inlet section structure effect on wear characteristic of particle condition in centrifugal slurry pump by CFD-DEM coupling. Part. Sci. Technol. 2022, 41, 834–843. [Google Scholar] [CrossRef]
- Song, X.; Qi, D.; Xu, L.; Shen, Y.; Wang, W.; Wang, Z.; Liu, Y. Numerical simulation prediction of erosion characteristics in a double-suction centrifugal pump. Processes 2021, 9, 1483. [Google Scholar] [CrossRef]
- Tang, C.; Yang, Y.-C.; Liu, P.-Z.; Kim, Y.-J. Prediction of abrasive and impact wear due to multi-shaped particles in a centrifugal pump via CFD-DEM coupling method. Energies 2021, 14, 2391. [Google Scholar] [CrossRef]
- Tao, Y.; Bai, Y.; Wu, Y. Influence of blade thickness on solid-liquid two-phase flow and impeller wear in a ceramic centrifugal slurry pump. Processes 2021, 9, 1259. [Google Scholar] [CrossRef]
- Wang, H.; Tan, Z.; Kuang, S.; Yu, A. Numerical modeling and analysis of particle-fluid flow and wall erosion in centrifugal slurry pumps under different solid concentrations. Powder Technol. 2022, 410, 117861. [Google Scholar] [CrossRef]
- Xiao, Y.; Guo, B.; Ahn, S.-H.; Luo, Y.; Wang, Z.; Shi, G.; Li, Y. Slurry flow and erosion prediction in a centrifugal pump after long-term operation. Energies 2019, 12, 1523. [Google Scholar] [CrossRef]
- Cao, L.; Liu, S.; Hu, P.; Si, H. The influence of governing valve opening on the erosion characteristics of solid particle in steam turbine. Eng. Fail. Anal. 2020, 118, 104929. [Google Scholar] [CrossRef]
- Hu, G.; Zhang, P.; Wang, G.; Zhu, H.; Li, Q.; Zhao, S.; Qiao, K.; Wang, T. Performance study of erosion resistance on throttle valve of managed pressure drilling. J. Pet. Sci. Eng. 2017, 156, 29–40. [Google Scholar] [CrossRef]
- Liu, B.; Zhao, J.; Qian, J. Numerical analysis of cavitation erosion and particle erosion in butterfly valve. Eng. Fail. Anal. 2017, 80, 312–324. [Google Scholar] [CrossRef]
- Liu, X.; Ji, H.; Min, W.; Zheng, Z.; Wang, J. Erosion behavior and influence of solid particles in hydraulic spool valve without notches. Eng. Fail. Anal. 2020, 108, 104262. [Google Scholar] [CrossRef]
- Wang, G.R.; Chu, F.; Tao, S.Y.; Jiang, L.; Zhu, H. Optimization design for throttle valve of managed pressure drilling based on CFD erosion simulation and response surface methodology. Wear 2015, 338–339, 114–121. [Google Scholar] [CrossRef]
- Xu, B.; Lin, Z.; Zhu, Z.; Yu, T. Experimental and simulation study of the effect of gravity on the solid-liquid two-phase flow and erosion of ball valve. Adv. Powder Technol. 2022, 33, 103416. [Google Scholar] [CrossRef]
- Lin, Z.; Yu, H.; Yu, T.; Zhu, Z. Numerical study of solid-liquid two-phase flow and erosion in ball valves with different openings. Adv. Powder Technol. 2022, 33, 103542. [Google Scholar] [CrossRef]
- Javaheri, V.; Porter, D.; Kuokkala, V.-T. Slurry erosion of steel—Review of tests, mechanisms and materials. Wear 2018, 408–409, 248–273. [Google Scholar] [CrossRef]
- Clark, H.M.I.; Hartwich, R.B. A re-examination of the ‘particle size effect’ in slurry erosion. Wear 2001, 248, 147–161. [Google Scholar] [CrossRef]
- Abd-Elrhman, Y.M.; Abouel-Kasem, A.; Emara, K.M.; Ahmed, S.M. Effect of impact angle on slurry erosion behaviour and mechanisms of carburized AISI 5117 steel. J. Eng. Sci. 2013, 41, 137–157. [Google Scholar] [CrossRef]
- Abouel-Kasem, A.; Al-Bukhaiti, M.A.; Emara, K.M.; Ahmed, S.M. Fractal characterization of slurry eroded surfaces at different impact angles. J. Tribol. 2009, 131, 031601. [Google Scholar] [CrossRef]
- Arabnejad, H.; Shirazi, S.A.; McLaury, B.S.; Subramani, H.J.; Rhyne, L.D. The effect of erodent particle hardness on the erosion of stainless steel. Wear 2015, 332–333, 1098–1103. [Google Scholar] [CrossRef]
- Rigaud, E.; Le Bot, A. Influence of incidence angle on wear induced by sliding impacts. Wear 2013, 307, 68–74. [Google Scholar] [CrossRef]
- Toor, I.; Irshad, H.; Badr, H.; Samad, M. The effect of impingement velocity and angle variation on the erosion corrosion performance of API 5L-X65 carbon steel in a flow loop. Metals 2018, 8, 402. [Google Scholar] [CrossRef]
- Cheng, J.; Zhang, N.; Li, Z.; Dou, Y.; Cao, Y. Erosion failure of horizontal pipe reducing wall in power-law fluid containing particles via CFD–DEM coupling method. J. Fail. Anal. Prev. 2017, 17, 1067–1080. [Google Scholar] [CrossRef]
- Lin, N.; Lan, H.; Xu, Y.; Dong, S.; Barber, G. Effect of the gas–solid two-phase flow velocity on elbow erosion. J. Nat. Gas Sci. Eng. 2015, 26, 581–586. [Google Scholar] [CrossRef]
- Arabnejad, H.; Mansouri, A.; Shirazi, S.A.; McLaury, B.S. Development of mechanistic erosion equation for solid particles. Wear 2015, 332–333, 1044–1050. [Google Scholar] [CrossRef]
- Alam, T.; Islam, M.A.; Farhat, Z.N. Slurry erosion of pipeline steel: Effect of velocity and microstructure. J. Tribol. 2016, 138, 021604. [Google Scholar] [CrossRef]
- Bellman, R.; Levy, A. Erosion mechanism in ductile metals. Wear 1981, 70, 1–27. [Google Scholar] [CrossRef]
- Adler, T.A.; Doğan, Ö.N. Erosive wear and impact damage of high-chromium white cast irons. Wear 1999, 225–229, 174–180. [Google Scholar] [CrossRef]
- Tilly, G.P. A two stage mechanism of ductile erosion. Wear 1973, 23, 87–96. [Google Scholar] [CrossRef]
- Nguyen, V.B.; Nguyen, Q.B.; Zhang, Y.W.; Lim, C.Y.H.; Khoo, B.C. Effect of particle size on erosion characteristics. Wear 2016, 348–349, 126–137. [Google Scholar] [CrossRef]
- Abouel-Kasem, A. Particle size effects on slurry erosion of 5117 steels. J. Tribol. 2011, 133, 014502. [Google Scholar] [CrossRef]
- Desale, G.R.; Gandhi, B.K.; Jain, S.C. Particle size effects on the slurry erosion of aluminium alloy (AA 6063). Wear 2009, 266, 1066–1071. [Google Scholar] [CrossRef]
- Parsi, M.; Najmi, K.; Najafifard, F.; Hassani, S.; McLaury, B.S.; Shirazi, S.A. A comprehensive review of solid particle erosion modeling for oil and gas wells and pipelines applications. J. Nat. Gas Sci. Eng. 2014, 21, 850–873. [Google Scholar] [CrossRef]
- Cox, E.P. A method of assigning numerical and percentage values to the degree of roundness of sand grains. J. Paleontol. 1927, 1, 179–183. [Google Scholar]
- Zou, R.P.; Yu, A.B. Evaluation of the packing characteristics of mono-sized non-spherical particles. Powder Technol. 1996, 88, 71–79. [Google Scholar] [CrossRef]
- Albertson, M.L. Effect of shape on the fall velocity of gravel particles. In Proceedings of the Fifth Hydraulics Conference 1953, Iowa City, IA, USA, 9–11 June 1952; pp. 243–261. Available online: https://hdl.handle.net/10217/185039 (accessed on 29 October 2018).
- Salik, J.; Buckley, D.; Brainard, W.A. The effect of mechanical surface and heat treatments on the erosion resistance of 6061 aluminum alloy. Wear 1981, 65, 351–358. [Google Scholar] [CrossRef]
- Levy, A.V.; Chik, P. The effects of erodent composition and shape on the erosion of steel. Wear 1983, 89, 151–162. [Google Scholar] [CrossRef]
- Al-Bukhaiti, M.A.; Abouel-Kasem, A.; Emara, K.M.; Ahmed, S.M. Particle shape and size effects on slurry erosion of AISI 5117 steels. J. Tribol. 2016, 138, 024503. [Google Scholar] [CrossRef]
- Shipway, P.H.; Hutchings, I.M. The role of particle properties in the erosion of brittle materials. Wear 1996, 193, 105–113. [Google Scholar] [CrossRef]
- Gandhi, B.K.; Singh, S.N.; Seshadri, V. Study of the parametric dependence of erosion wear for the parallel flow of solid–liquid mixtures. Tribol. Int. 1999, 32, 275–282. [Google Scholar] [CrossRef]
- Al-Bukhaiti, M.A.; Mohamad, A.A.K.; Emara, K.M.; Ahmed, S.M. Effect of slurry concentration on erosion wear behavior of AISI 5117 steel and high-chromium white cast iron. Ind. Lubr. Tribol. 2018, 70, 628–638. [Google Scholar] [CrossRef]
- Mahdavi, M.; Karimi, S.; Shirazi, S.A.; McLaury, B.S. Parametric study of erosion under high concentrated slurry: Experimental and numerical analyses. In Proceedings of the ASME 2016 Fluids Engineering Division Summer Meeting, Seoul, Republic of Korea, 26–31 July 2016; p. V01AT06A002. [Google Scholar] [CrossRef]
- Pouraria, H.; Darihaki, F.; Park, K.H.; Shirazi, S.A.; Seo, Y. CFD modelling of the influence of particle loading on erosion using dense discrete particle model. Wear 2020, 460–461, 203450. [Google Scholar] [CrossRef]
- Duarte, C.A.R.; de Souza, F.J.; dos Santos, V.F. Numerical investigation of mass loading effects on elbow erosion. Powder Technol. 2015, 283, 593–606. [Google Scholar] [CrossRef]
- Deyab, M.A.; Keera, S.T. Investigating of erosion-corrosion behavior of carbon steel in egyptian crude oil-water mixture using electrochemical method. Z. Für Phys. Chem. 2020, 234, 75–84. [Google Scholar] [CrossRef]
- Zeng, L.; Zhang, G.A.; Guo, X.P. Erosion-corrosion at different locations of X65 carbon steel elbow. Corros. Sci. 2014, 85, 318–330. [Google Scholar] [CrossRef]
- Guo, H.X.; Lu, B.T.; Luo, J.L. Interaction of mechanical and electrochemical factors in erosion–corrosion of carbon steel. Electrochim. Acta 2005, 51, 315–323. [Google Scholar] [CrossRef]
- Stack, M.M.; Abdulrahman, G.H. Mapping erosion-corrosion of carbon steel in oil-water solutions: Effects of velocity and applied potential. Wear 2012, 274–275, 401–413. [Google Scholar] [CrossRef]
- Yang, Y.; Cheng, Y.F. Parametric effects on the erosion-corrosion rate and mechanism of carbon steel pipes in oil sands slurry. Wear 2012, 276–277, 141–148. [Google Scholar] [CrossRef]
- Hu, X.; Barker, R.; Neville, A.; Gnanavelu, A. Case study on erosion–corrosion degradation of pipework located on an offshore oil and gas facility. Wear 2011, 271, 1295–1301. [Google Scholar] [CrossRef]
- Elemuren, R.; Evitts, R.; Oguocha, I.; Kennell, G.; Gerspacher, R.; Odeshi, A. Slurry erosion-corrosion of 90° AISI 1018 steel elbow in saturated potash brine containing abrasive silica particles. Wear 2018, 410–411, 149–155. [Google Scholar] [CrossRef]
- Xu, Y.; Tan, M.Y. Probing the initiation and propagation processes of flow accelerated corrosion and erosion corrosion under simulated turbulent flow conditions. Corros. Sci. 2019, 151, 163–174. [Google Scholar] [CrossRef]
- Bhosale, D.G.; Prabhu, T.R.; Rathod, W.S.; Patil, M.A.; Rukhande, S.W. High temperature solid particle erosion behaviour of SS 316L and thermal sprayed WC-Cr3C2–Ni coatings. Wear 2020, 462–463, 203520. [Google Scholar] [CrossRef]
- Galiullin, T.; Gobereit, B.; Naumenko, D.; Buck, R.; Amsbeck, L.; Neises-von Puttkamer, M.; Quadakkers, W.J. High temperature oxidation and erosion of candidate materials for particle receivers of concentrated solar power tower systems. Sol. Energy 2019, 188, 883–889. [Google Scholar] [CrossRef]
- Gietzen, E.; Karimi, S.; Goel, N.; Shirazi, S.A.; Keller, M.; Otanicar, T. Experimental investigation of low velocity and high temperature solid particle impact erosion wear. Wear 2022, 506–507, 204441. [Google Scholar] [CrossRef]
- Roco, M.C. Wear mechanisms in centrifugal slurry pumps. Corrosion 1990, 46, 424–431. [Google Scholar] [CrossRef]
- Islam, M.A.; Farhat, Z. Erosion-corrosion mechanism and comparison of erosion-corrosion performance of API steels. Wear 2017, 376–377, 533–541. [Google Scholar] [CrossRef]
- Ojala, N.; Valtonen, K.; Antikainen, A.; Kemppainen, A.; Minkkinen, J.; Oja, O.; Kuokkala, V.-T. Wear performance of quenched wear resistant steels in abrasive slurry erosion. Wear 2016, 354–355, 21–31. [Google Scholar] [CrossRef]
- Walker, C.I.; Hambe, M. Influence of particle shape on slurry wear of white iron. Wear 2015, 332–333, 1021–1027. [Google Scholar] [CrossRef]
- Feng, Z.; Ball, A. The erosion of four materials using seven erodents—Towards an understanding. Wear 1999, 233–235, 674–684. [Google Scholar] [CrossRef]
- Babu, P.S.; Basu, B.; Sundararajan, G. The influence of erodent hardness on the erosion behavior of detonation sprayed WC-12Co coatings. Wear 2011, 270, 903–913. [Google Scholar] [CrossRef]
- Zeng, D.; Zhang, E.; Ding, Y.; Yi, Y.; Xian, Q.; Yao, G.; Zhu, H.; Shi, T. Investigation of erosion behaviors of sulfur-particle-laden gas flow in an elbow via a CFD-DEM coupling method. Powder Technol. 2018, 329, 115–128. [Google Scholar] [CrossRef]
- Archard, J.F. Contact and rubbing of flat surfaces. J. Appl. Phys. 1953, 24, 981–988. [Google Scholar] [CrossRef]
- Archard, J.F.; Hirst, W. The wear of metals under unlubricated conditions. Proc. R Soc. London Ser. A Math. Phys. Sci. 1956, 236, 397–410. [Google Scholar]
- Finnie, I. Some observations on the erosion of ductile metals. Wear 1972, 19, 81–90. [Google Scholar] [CrossRef]
- Finnie, I.; McFadden, D.H. On the velocity dependence of the erosion of ductile metals by solid particles at low angles of incidence. Wear 1978, 48, 181–190. [Google Scholar] [CrossRef]
- Oka, Y.I.; Yoshida, T. Practical estimation of erosion damage caused by solid particle impact. Wear 2005, 259, 102–109. [Google Scholar] [CrossRef]
- Zhang, Y.; Reuterfors, E.P.; McLaury, B.S.; Shirazi, S.A.; Rybicki, E.F. Comparison of computed and measured particle velocities and erosion in water and air flows. Wear 2007, 263, 330–338. [Google Scholar] [CrossRef]
- Arabnejad, H.; Mansouri, A.; Shirazi, S.A.; McLaury, B.S. Abrasion erosion modeling in particulate flow. Wear 2017, 376–377, 1194–1199. [Google Scholar] [CrossRef]
- Hall, N.; Elenany, M.; Zhu, D.Z.; Rajaratnam, N. Experimental study of sand and slurry jets in water. J. Hydraul. Eng. 2010, 136, 727–738. [Google Scholar] [CrossRef]
- Naz, M.Y.; Sulaiman, S.A.; Shukrullah, S.; Ghaffar, A.; Ibrahim, K.A.; AbdEl-Salam, N.M. Development of erosion-corrosion mechanisms for the study of steel surface behavior in a sand slurry. Measurement 2017, 106, 203–210. [Google Scholar] [CrossRef]
- Ukpai, J.I.; Barker, R.; Hu, X.; Neville, A. Exploring the erosive wear of X65 carbon steel by acoustic emission method. Wear 2013, 301, 370–382. [Google Scholar] [CrossRef]
- Mansouri, A.; Arabnejad, H.; Shirazi, S.A.; McLaury, B.S. A combined CFD/experimental methodology for erosion prediction. Wear 2015, 332–333, 1090–1097. [Google Scholar] [CrossRef]
- Saleh, B.; Ahmed, S.M. Slurry erosion-corrosion of carburized AISI 5117 steel. Tribol. Lett. 2013, 51, 135–142. [Google Scholar] [CrossRef]
- Sedrez, T.A.; Rajkumar, Y.R.; Shirazi, S.A.; Khanouki, H.A.; McLaury, B.S. CFD predictions and experiments of erosion of elbows in series in liquid dominated flows. In Proceedings of the ASME 2018 5th Joint US-European Fluids Engineering Division Summer Meeting, Montreal, QC, Canada, 15–20 July 2018; p. V003T17A001. [Google Scholar] [CrossRef]
- Zahedi, P.; Parsi, M.; Asgharpour, A.; McLaury, B.S.; Shirazi, S.A. Experimental investigation of sand particle erosion in a 90° elbow in annular two-phase flows. Wear 2019, 438–439, 203048. [Google Scholar] [CrossRef]
- Wood, R.J.K.; Jones, T.F.; Ganeshalingam, J.; Miles, N.J. Comparison of predicted and experimental erosion estimates in slurry ducts. Wear 2004, 256, 937–947. [Google Scholar] [CrossRef]
- Russell, R.; Shirazi, D.S.; Macrae, J. A new computational fluid dynamics model to predict flow profiles and erosion rates in downhole completion equipment. In Proceedings of the SPE Annual Technical Conference and Exhibition, Amsterdam, The Netherlands, 27–29 October 2014; p. SPE-90734-MS. [Google Scholar] [CrossRef]
- Wong, C.Y.; Solnordal, C.; Swallow, A.; Wu, J. Experimental and computational modelling of solid particle erosion in a pipe annular cavity. Wear 2013, 303, 109–129. [Google Scholar] [CrossRef]
- Yang, H.; Liu, S. Measuring Method of Solid-Liquid Two-Phase Flow in Slurry Pipeline for Deep-Sea Mining. Thalass. Int. J. Mar. Sci. 2018, 34, 459–469. [Google Scholar] [CrossRef]
- Varga, M.; Goniva, C.; Adam, K.; Badisch, E. Combined experimental and numerical approach for wear prediction in feed pipes. Tribol. Int. 2013, 65, 200–206. [Google Scholar] [CrossRef]
- Fan, C.; McLaury, B.S.; Shirazi, S.A. Evaluation of electrical resistance probes to detect pipeline erosion and sand production in low liquid loading flow conditions. In Proceedings of the SPE Eastern Regional Meeting 2011, SPE-149013-MS, Columbus, OH, USA, 17–19 August 2011. [Google Scholar] [CrossRef]
- Vieira, R.E.; Parsi, M.; Zahedi, P.; McLaury, B.S.; Shirazi, S.A. Electrical resistance probe measurements of solid particle erosion in multiphase annular flow. Wear 2017, 382–383, 15–28. [Google Scholar] [CrossRef]
- Xu, Y.; Liu, L.; Zhou, Q.; Wang, X.; Tan, M.Y.; Huang, Y. An overview of major experimental methods and apparatus for measuring and investigating erosion-corrosion of ferrous-based steels. Metals 2020, 10, 180. [Google Scholar] [CrossRef]
- Mazumder, Q.H.; Shirazi, S.A.; McLaury, B. Experimental investigation of the location of maximum erosive wear damage in elbows. J. Press. Vessel Technol. 2008, 130, 011303. [Google Scholar] [CrossRef]
- Kesana, N.R.; Grubb, S.A.; McLaury, B.S.; Shirazi, S.A. Ultrasonic measurement of multiphase flow erosion patterns in a standard elbow. In Proceedings of the ASME 2012 Fluids Engineering Summer Meeting, Rio Grande, PR, USA, 8–12 July 2012; pp. 1183–1195. [Google Scholar] [CrossRef]


| References | Geometry | Method | Operating Condition | ds (μm) | fs (%) | r/D |
|---|---|---|---|---|---|---|
| [25] | 45° elbow 90° elbow | Experiment Euler–Lagrange | VL = 5.49~7.26 m/s VG = 5.37~6.21 m/s Liquid–solid flow Gas–liquid–solid flow | 300 | 0.35~0.98 | 1.5~5 |
| [3] | 90° elbow | VOF–DPM | Bubbly flow | 30~120 | 3.5~12 | 6 |
| [27] | 45° elbow 90° elbow | VOF–DPM | Bubby flow | 75 | 3.5 | 3 |
| [17] | 90° elbow | Experiment Euler–Lagrange | VL = 5.5~6.31 m/s VG = 2.04~5.46 m/s Liquid–solid flow Gas–liquid–solid flow | 300 | 0.31~0.37 | 1.5 |
| [28] | 90° elbow | Experiment VOF–DPM | VL = 0.04~0.1 m/s VG = 23~31 m/s Gas–solid flow Gas–liquid–solid flow | 25~300 | ≈0.4 | 1.5 |
| [4] | 90° elbow | Experiment VOF–DPM | VL = 0.33 m/s VG = 32.66 m/s Gas–liquid–solid flow | 280~315 | ≈0.8 | 1.5 |
| [30] | 90° elbow | DPM | VL = 5~10 m/s Liquid–solid flow | 300~1500 | 20 | 1.5~3.5 |
| [35] | 90° elbow | Euler–Lagrange | VL = 5~10 m/s Liquid–solid flow | 50~200 | 0.1~3.2 | 1.5~8 |
| [20] | Choke Blind tee 90° elbow | Euler–Lagrange | Liquid–solid flow Gas–solid flow | 25~250 | - | - |
| References | qV (m3/h) | H (m) | Method | Erosion Model | ρp (kg/m3) | dp (μm) | Cv (%) |
|---|---|---|---|---|---|---|---|
| [55] | - | - | Euler–Euler | Finnie | - | 50~1250 | 5~25 |
| [49] | 135 | 60 | DPM | Oka | - | 50~450 | 0.2~0.6 |
| [57] | 61,200 | 240 | Euler–Lagrange | Finnie | 1550~3550 | 1530 | - |
| [51] | 485 | 14 | DPM | Generic | 2740 | 40~427.5 | 0.36 |
| [59] | - | - | DPM | Finnie | 2300 | 20~70 | ≈1.7 |
| [60] | 420 | 100 | Euler–Lagrange | Generic | - | 6000 | 7.5 |
| [50] | 6800 | - | DPM | Finnie | - | 37~53 | - |
| [44] | - | - | Euler–Euler | Finnie | - | - | 5~20 |
| [61] | 9000 | 34 | Euler–Lagrange | Finnie | 1950 | 200 | 5~10 |
| [62] | 26 | 11 | - | - | 2900 | 600 | 5~25 |
| [63] | 485 | 14 | DPM | Generic | - | 20 | 0.4 |
| [64] | 165 | 32 | DPM | E/CRC | 2650 | 25 | 0.43~4.3 |
| [47] | 1260 | 43.5 | DPM | E/CRC | 2650 | 4~250 | 0.5~6.1 |
| [65] | 180 | 26 | DEM | Archard | 2500 | 100 | 1 |
| [66] | 11,100 | 50 | Euler–Lagrange | Tabakoff | - | 25 | 0.1~1 |
| [67] | 68.4 | 8.3 | DEM | Oka | 2600 | 1 | 2 |
| [68] | 100 | 40 | Euler–Euler | - | 2650 | 1 | 10 |
| [69] | 5000 | 24 | DDPM | Oka | - | 300 | 4~12 |
| [70] | 690 | ≈40 | Euler–Euler | Finnie | - | 500 | 5 |
| [52] | 15 | 4 | CFD–DPM | E/CRC | 2500 | 500 | 0.1~2.5 |
| [53] | 420 | 80 | Euler–Lagrange | Finnie | - | 0~40,000 | 5.14 |
| [54] | 420 | 80 | Euler–Lagrange | Finnie | - | 5000~40,000 | 5.14 |
| Material | ER90 | Hv (GPa) | n1 | n2 | k2 | k3 | vref (m/s) | dref (μm) |
|---|---|---|---|---|---|---|---|---|
| Sand-steel | 6.15 × 10⁻⁴ | 1.8 | 0.8 | 1.3 | 2.35 | 0.19 | 104 | 326 |
| Material | KC | KD | K | vtsh (m/s) |
|---|---|---|---|---|
| Carbon steel 1018 | 5.90 × 10⁻⁸ | 4.25 × 10⁻⁸ | 0.5 | 5.5 |
| Carbon steel 4130 | 4.94 × 10⁻⁸ | 4.94 × 10⁻⁸ | 0.4 | 3.0 |
| Stainless steel 316 | 4.58 × 10⁻⁸ | 5.56 × 10⁻⁸ | 0.4 | 5.8 |
| Stainless steel 2205 | 3.92 × 10⁻⁸ | 2.30 × 10⁻⁸ | 0.4 | 2.3 |
| 13 chrome steel | 4.11 × 10⁻⁸ | 3.09 × 10⁻⁸ | 0.5 | 5.1 |
| Inconel 625 | 4.58 × 10⁻⁸ | 4.22 × 10⁻⁸ | 0.4 | 5.5 |
| Aluminum alloy 6061 | 3.96 × 10⁻⁸ | 3.38 × 10⁻⁸ | 0.4 | 7.3 |
Disclaimer/Publisher’s Note: The statements, opinions and data contained in all publications are solely those of the individual author(s) and contributor(s) and not of MDPI and/or the editor(s). MDPI and/or the editor(s) disclaim responsibility for any injury to people or property resulting from any ideas, methods, instructions or products referred to in the content. |
© 2024 by the authors. Licensee MDPI, Basel, Switzerland. This article is an open access article distributed under the terms and conditions of the Creative Commons Attribution (CC BY) license (https://creativecommons.org/licenses/by/4.0/).
Share and Cite
Kang, C.; Li, M.; Teng, S.; Liu, H.; Chen, Z.; Li, C. Erosive Wear Caused by Large Solid Particles Carried by a Flowing Liquid: A Comprehensive Review. Processes 2024, 12, 1150. https://doi.org/10.3390/pr12061150
Kang C, Li M, Teng S, Liu H, Chen Z, Li C. Erosive Wear Caused by Large Solid Particles Carried by a Flowing Liquid: A Comprehensive Review. Processes. 2024; 12(6):1150. https://doi.org/10.3390/pr12061150
Chicago/Turabian StyleKang, Can, Minghui Li, Shuang Teng, Haixia Liu, Zurui Chen, and Changjiang Li. 2024. "Erosive Wear Caused by Large Solid Particles Carried by a Flowing Liquid: A Comprehensive Review" Processes 12, no. 6: 1150. https://doi.org/10.3390/pr12061150