Abstract
The extrusion processing of food powder relies heavily on its moisture content to aid in flow and proper cooking, shaping, and/or puffing. This study focused on the impact of the moisture content on the dynamic flow and shear properties of coarse food powders (corn meal, wheat farina, and granulated sugar). The dynamic flow properties explored were the specific basic flowability energy (SBFE), specific energy, stability index, and flow rate index. The shear properties were the angle of internal friction, unconfined yield strength, major principal stress, wall friction angle, flow factor (FF), and compressibility. Corn meal exhibited an increase in SBFE as the moisture content increased (6.70 mJ/g at 13.13% to 9.14 mJ/g at 19.61%) but no change in FF (4.94 to 5.11); wheat farina also showed an increase in energy requirement as the moisture increased (5.81 mJ/g at 13.73% to 9.47 mJ/g 19.57%) but a marked decrease in FF ratings (18.47 to 6.1); granulated sugar showed a decrease in energy requirements as the moisture increased (51.73 mJ/g at 0.06% moisture content to 13.58 mJ/g at 0.78% moisture content) and a decrease in FF ratings (8.53 to 3.47). Overall, upon the addition of moisture, corn meal became cohesive yet free-flowing; wheat farina became less compressible and more cohesive; and granulated sugar became more cohesive and compressible and less free-flowing.
Keywords:
composition; corn; energy requirement; food powders; particle size; powder rheology; preconditioner; sugar; wheat 1. Introduction
Understanding the flow characteristics of powders is crucial for efficient processing and packaging. The moisture content of a powder can influence whether the powder exhibits cohesive behavior (clumping) or flows freely. The characteristics of food powders significantly impact various processing stages like formulation, mixing, storage, compression, packaging, and transportation [1]. A crucial aspect is the powder’s ability to flow smoothly, resembling a fluid, enabling easy handling without constraints like cohesion, friction, or particle interlocking. Thus, understanding powder flow properties is vital for designing efficient handling processes. The particles’ size, shape, and general composition are all important to determine the flow functionality of granular material [2,3]. However, some products such as pet food or other high-protein products require conditioning prior to processes like extrusion. By using a preconditioner, thermal energy (in the form of steam) and moisture (in the form of water) can be added to the raw material, partially cooking it, or to achieve processing parameters during extrusion (increasing moisture content to aid in cooking or to reduce mechanical shear, for example). The increased moisture content modifies the surface chemistry of the still-granular material, resulting in agglomeration that can lead to clumping or further resistance to flow, depending on the composition of the powder and how this surface moisture impacts the granules. Stoklosa et al. [4] found a significant impact of relative humidity and formulation on powder flowability, which indicated that physical and chemical changes on the surface of a material due to increased moisture in the air play a critical role in increasing the angle of internal friction and reducing flow properties. Differences in the physical and chemical properties of particles vary from one compound to another and affect the cohesive forces acting between particles and capillary forces associated with liquid bridging [5]. Increased powder strength as a result of the absorption of moisture from the atmosphere has been researched since the 1960s, due to problems with regard to flow and other process-related issues this phenomenon causes [6].
The cohesion and adhesion of powders rely on intrinsic material properties, encompassing surface composition, elasticity, hardness, and particle characteristics like size, shape, surface texture, and moisture content [7,8]. Material composition significantly influences flow patterns. Cohesiveness in powders correlates with moisture content, as interparticle liquid bridges lead to spontaneous particle agglomeration. Starch-based, protein-based, and sucrose-based powders each play distinct roles in processing to achieve the desired end products, contributing different flow properties and sometimes leading to flow issues. McGuire et al. [9] delved into how particle size and composition affect the flow properties of food powders such as corn flour and wheat flour. This is applicable to the food powders used in this study. For instance, the presence of starch in corn meal can influence its flow properties. Starch particles can interact with each other through hydrogen bonding and other molecular forces. The nature of these interactions affects the cohesion of the powder particles. The granular nature of wheat farina, along with its protein content, may contribute to its flow properties. Gluten, a protein found in wheat, can affect the cohesion and flowability of the powder. The shape, arrangement, and packing of sugar crystals in the granulated powder may affect its overall density. Bulk density, in turn, can impact flow properties, with lower densities generally contributing to better flow. The hydrophilic nature of sugar or sucrose due to the binding sites provided by its hydroxyl groups can also hugely impact its bulk density and flow. Fitzpatrick et al. [5] examined a dozen fine-particle-sized food powders, noting that their flow index was impacted by equilibrium moisture content. There is limited research exploring the flow and shear properties of food powders concerning moisture content. Examples include milk-malted barnyard and foxtail millet powders [10]; basundi mix (a concentrated sweetened milk powder), studied by Mitra et al. [11]; and investigations on molasses and starch powder by Jange and Ambrose [7]. Jung et al. [1] summarized how moisture content influences powder flow properties. Chinwan and Castell-Perez [12] explored the impact of conditioner and moisture content on the flowability of yellow cornmeal. Littlefield et al. [13] corroborated that the compressibility of pecan shells increased with moisture content. Teunou et al. [14] reported that high moisture content in food powders like wheat, milk, tea, and whey-permeate resulted in decreased flowability due to increased cohesion caused by water. Opaliński et al. [15] observed moisture acting as a plasticizer in semolina. Juarez-Enriquez et al. [16] noted that pectin powder transitioned from free-flowing to cohesive as water content increased. However, no such study compared the flow functionality of coarse food powders with varying moisture content. This study aims to explore the correlation between flow properties and energy requirements as the moisture content of coarse food powders (corn meal, wheat farina, and granulated sugar) increases. This knowledge will help in designing equipment and processes that promote the desired flow properties of food powders.
2. Materials and Methods
2.1. Materials
The materials used for this experiment were as follows: corn meal (Aunt Jemima, Chicago, IL, USA), wheat farina (Hal Ross Mill, Kansas State University, Manhattan, KS, USA), and granulated sugar (C&H, Yonkers, NY, USA).
2.2. Moisture Modification
To increase the moisture content of each material, a relative humidity chamber was used. Corn meal and farina were placed in the chamber at 22 °C and 95% relative humidity (RH) for 2 h (to achieve mid-range moisture content) or 4 h (to achieve high-range moisture content). Granulated sugar was the only non-starch powder used in this study. Due to the highly hydrophilic nature of sucrose, the surface of granulated sugar became wet at 95% RH. Therefore, it was placed in the chamber at 22 °C and 85% RH for 3 h (to achieve mid-range moisture content) or 4 h (to achieve high-range moisture content). The combinations of RH and time of equilibration were determined from the preliminary trials.
2.3. Moisture Testing
AOAC moisture method 930.15 [17] was employed for all samples to ascertain the initial moisture content using a conventional drying oven operated at 135 °C for 2 h.
2.4. Equipment and Testing Methods
The assessment of powder flow properties was conducted using a Freeman Technology FT4 Powder Rheometer (FT4, Freeman Technologies, Tewkesbury, UK) at room temperature (22 °C). For a comprehensive understanding of the equipment, its calibration, validation, and application in powder flow characterization, readers can refer to Freeman [18] and McGuire [19]. Here, we provide a concise overview of the equipment’s usage and a description of the key analysis.
2.4.1. Stability and Variable Flow Rate
Basic flowability energy (BFE) is the total energy used for the blade traversing downwards in the seventh cycle of the testing process, which represents confined flow (as the blade moves toward the base of the sample, meeting resistance). The higher this value, the more energy required for this cycle.
where T is the rotation resistance or torque experienced by the helical blade (N·m); F is the vertical resistance or force experienced by the blade (N); θ is the angular speed of the blade (rad/s); vx = is the vertical speed of the blade (m/s); and Δx is the vertical distance traversed by the blade. Specific basic flow energy (SBFE) is the BFE per unit total mass of product in the cylinder. The specific energy (SE) represents the energy taken to move from the base of the cylinder to the top, representing unconfined flow (Equation (2)):
FE6 and FE7 are the upward flow energy (mJ) required during test cycles 6 and 7, respectively; m refers to the sample mass (g).
The stability index (SI) gauges if a powder expands, compacts, or stays constant across test cycles. An SI value near 1 maintains volume; >1 or <1 indicates compaction or expansion tendency. This SI value was calculated using Equation (3):
where BFE1 and BFE7 represent the flow energy required during test cycles 1 and 7, respectively.
Finally, the flow rate index (FRI) is the factor by which flow energy is changed when the blade tip speed is reduced by a factor of 10. It evaluates the sensitivity of the powder to different flow rates. FRI was calculated as per Equation (4):
where BFE8 and BFE11 represent the flow energy required during test cycles 8 and 11, respectively. Eleven different blade tip speeds were used in computing the FRI to account for the variations in the handling and conveyance of the food powders.
2.4.2. Compressibility
The compressibility tests assess alterations in the density of food powders caused by mechanical compaction during the preconditioning and conditioning stages of the extrusion process. The compressibility test for the samples was conducted as per the protocol detailed by McGuire et al. [9]. In the compressibility test, a 48 mm helical blade conditions the sample, utilizing an 85 mm × 50 mm glass cylinder as the base. Once the conditioning cycle concludes, the blade is substituted with a 48 mm diameter vented piston. The upper cylinder is split to eliminate excess powder, maintaining a standardized product volume. Subsequently, the piston descends with increasing force levels: 0.5, 1, 2, 4, 6, 8, 10, 12, and 15 kPa. The powder’s percentage compression is recorded at each force interval. These force/compression data points are graphically represented internally and presented upon test completion. Compressibility is determined by calculating the percentage change in volume.
2.4.3. Shear Cell
The shear properties of the sample were estimated using the protocol described by McGuire et al. [9]. These shear properties provide valuable insights into the inter-particulate forces exerted on powders during handling and processing, including critical factors like the yield point of powder flow initiation. To conduct the shear cell test, a sequential process was followed, beginning with the use of a 48 mm helical blade, followed by the application of a 48 mm diameter vented piston. Subsequently, the two 85 mm × 50 mm glass cylinders were separated, leaving a compacted sample volume for testing. The shear cell attachment, possessing the same radius as the vented piston but featuring small blades on the underside, was employed to execute the test by inducing both rotational and vertical stress. The corresponding stress value was recorded upon the powder bed in the cylinder yielding to the stress applied by the shear head.
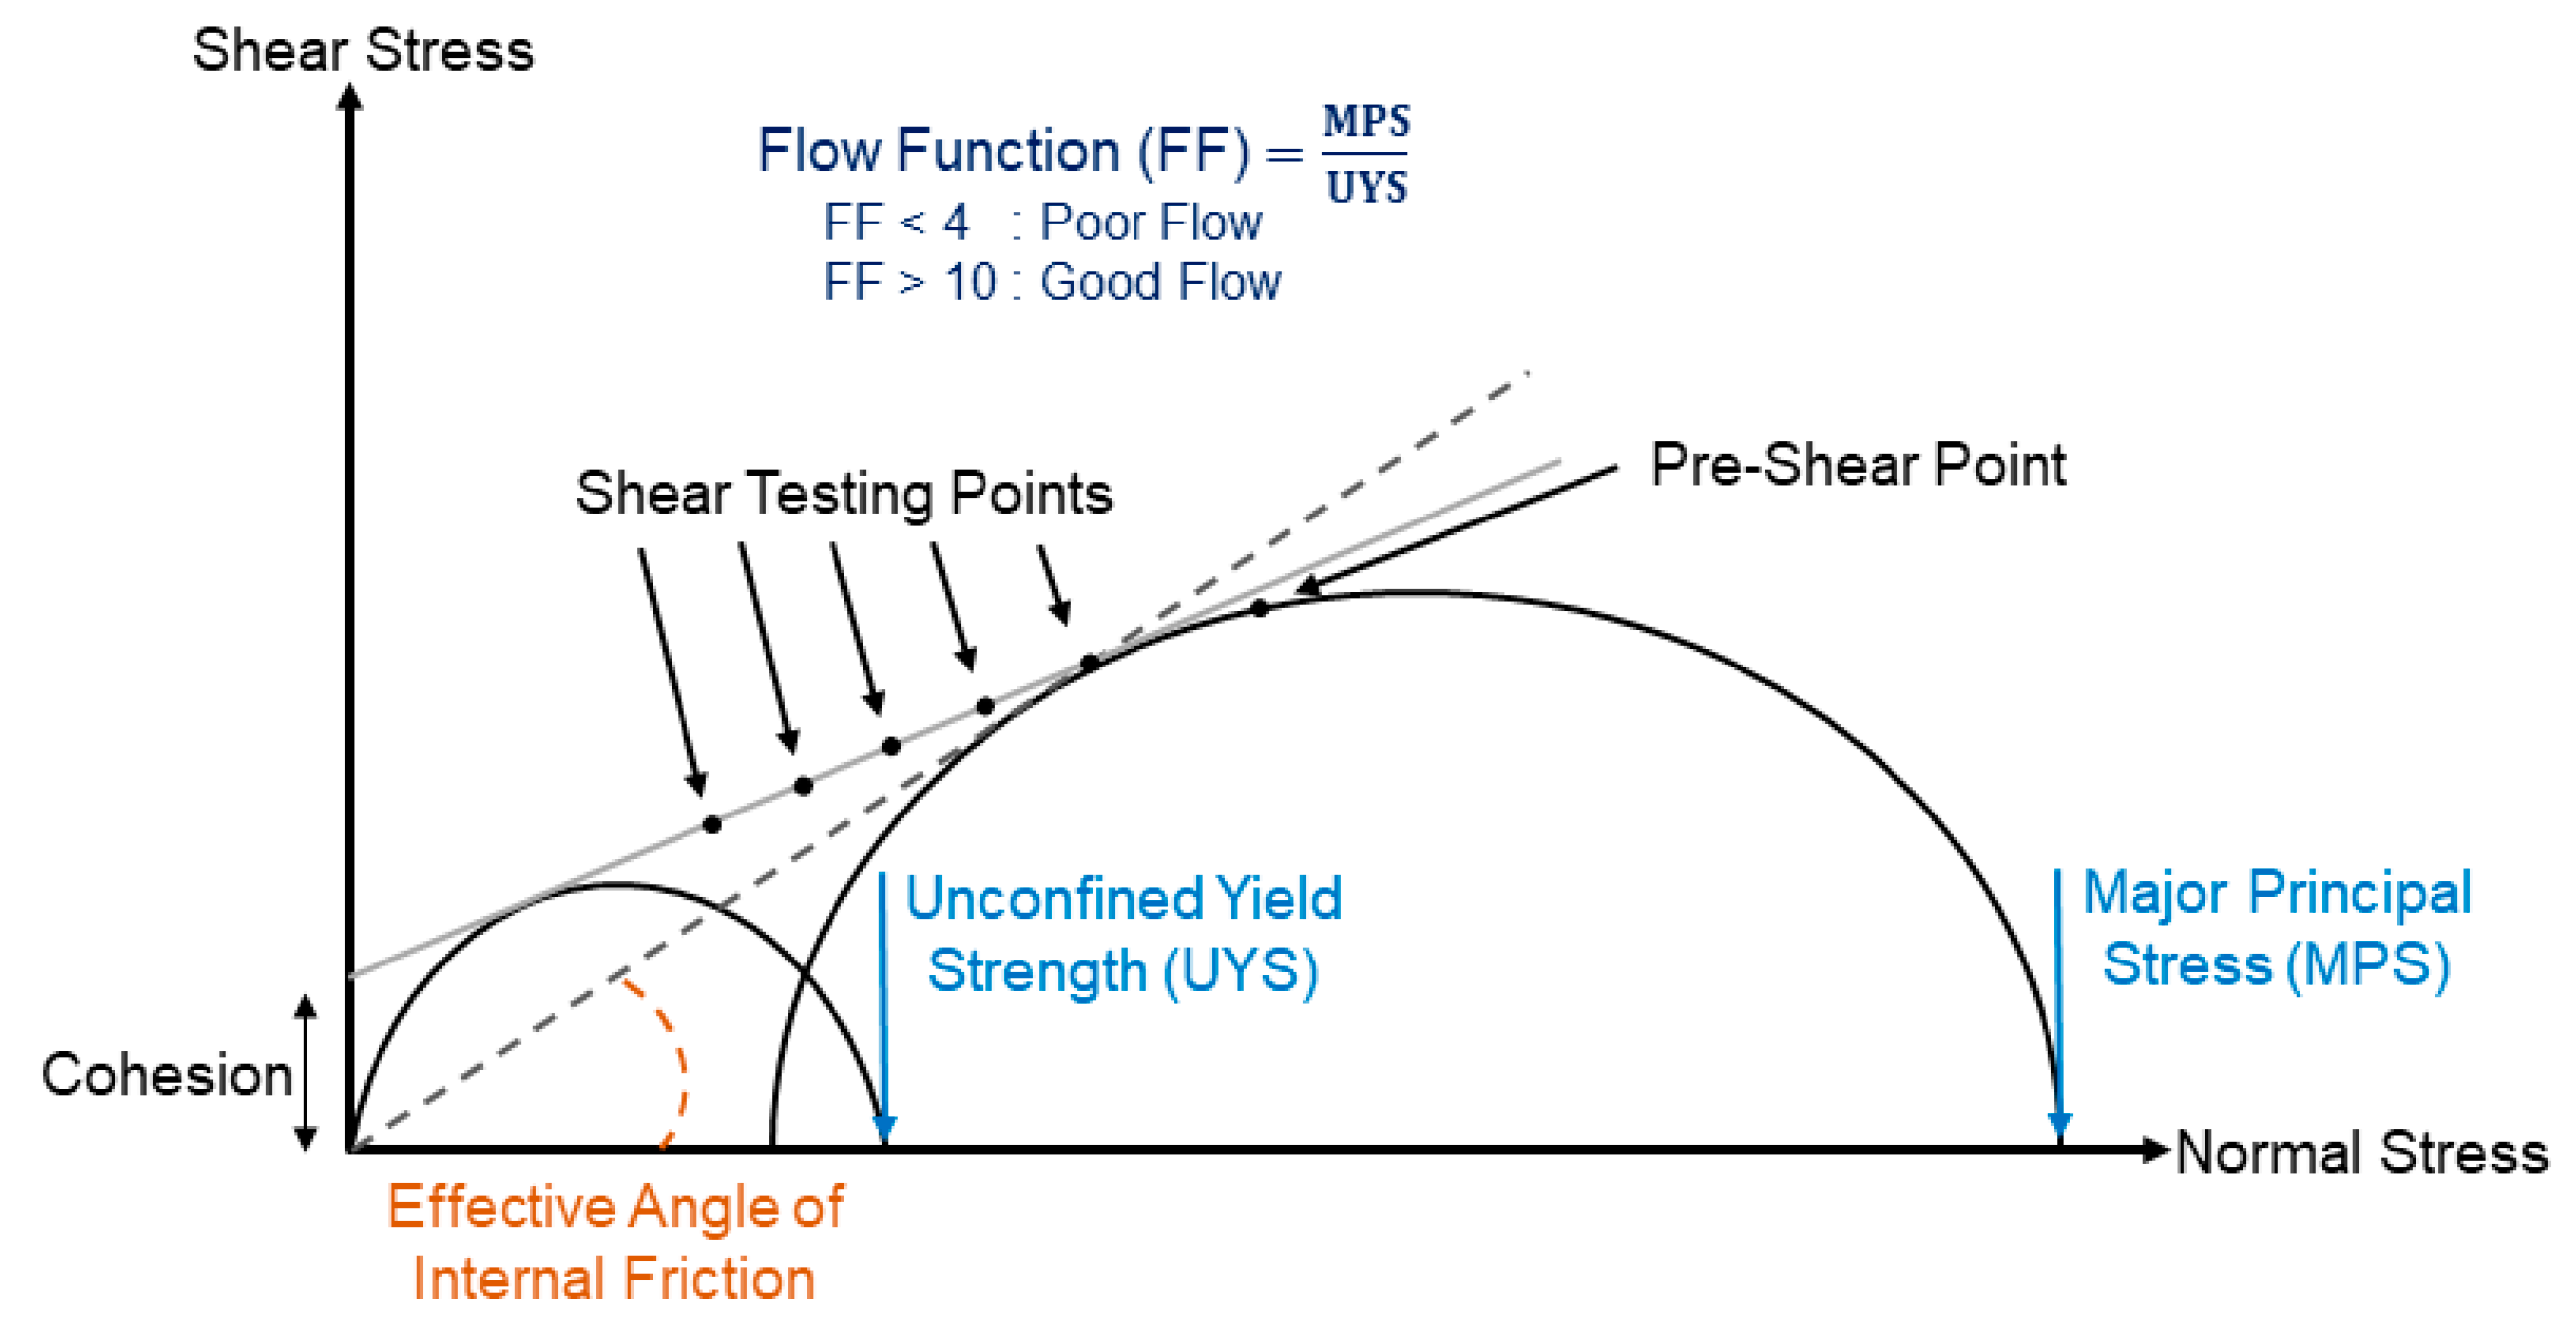
The obtained results underwent Mohr circle analysis to derive crucial values such as cohesion, major principal stress, unconfined yield strength, and flow factor, as depicted in Figure 1. Test data points were plotted on a graph to ascertain the cohesion factor (y-intercept value of yield locus—line through data points) and the effective angle of internal friction (angle of the line drawn between the farthest test point and the origin in comparison to the x-axis).
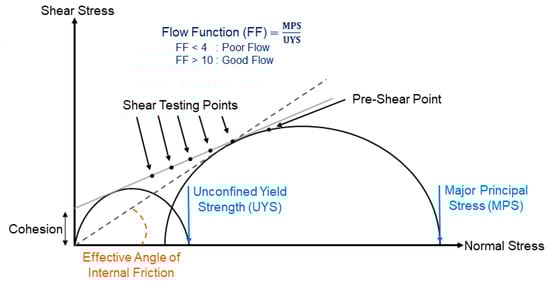
Figure 1.
Schematic showing the Mohr’s circle analysis of shear properties.
Unconfined yield strength (UYS) was determined by drawing a half-circle from the origin, tangent to the yield locus, and identifying the point where the half-circle intersected the x-axis as the UYS. Similarly, major principal stress (MPS) was calculated, with a semi-circle drawn between the farthest test point and the pre-shear point, designating the higher end of the semi-circle as the MPS.
The flow function (FF) was computed using Equation (5) [20,21], directly indicating a powder’s flowability. A higher FF value signifies greater ease of flow, while a lower value indicates resistance to flow.
Based on the FF value, the flowability of the particulate was considered as ‘not flowing’, ‘very cohesive’, ‘cohesive’, ‘easy-flowing’, and ‘free-flowing’ when FF < 1, 1 < FF < 2, 2 < FF < 4, 5 < FF < 10, FF > 10, respectively.
2.4.4. Wall Friction
The wall friction test gauges the resistance to the flow of powders concerning the surface of process equipment. It employs a friction disc head that exerts both vertical and rotational stress on a stationary powder, determining the torque necessary to overcome the powder bed’s resistance. The test utilized a wall friction disc with a µ-value of 0.05. The torque needed to sustain the disc’s rotational momentum was measured to compute a ‘steady-state’ shear stress, with the normal stress held constant throughout the measurement. The wall friction angle (ɸ) calculation was derived from Equation (6):
where σw and τw represent the normal and shear stress values, respectively.
2.5. Statistical Analysis
All the experiments were conducted in triplicate and the mean values were reported with standard error. The significance between the mean values was assessed using Tukey’s HSD test from analysis of variance (ANOVA) conducted at a 95% confidence interval. The statistical analysis and ANOVA were performed in SAS 9.3 software (SAS Institute, Cary, NC, USA). The GLIMMIX procedure was adopted for analyzing the flow properties of the powder. The data on flow and shear properties were condensed using principal component analysis (PCA) to streamline the data into a smaller set of components. Origin Pro 2023b software (OriginLab Corporation, Northampton, MA, USA) was employed for this purpose, utilizing a multivariate analysis of variance (MANOVA) approach.
3. Results and Discussion
3.1. Moisture Content
The moisture content for corn meal was 13.13% (ambient), 15.46% (mid-range), and 19.61% (high); wheat farina had moisture contents of 13.73% (ambient), 15.69% (mid-range), and 19.57% (high); and the granulated sugar had moisture contents of 0.06% (ambient), 0.40% (mid-range), and 0.78% (high).
3.2. Dynamic Flow Properties
For the confined flow parameters of corn meal, the specific basic flow energy (SBFE) changed from 6.70 to 9.14 mJ/g when the moisture content increased from 13.13 to 19.61% (Table 1). Wheat farina showed a definitive increase in energy requirements for confined flow but only a slight tendency to increase energy during unconfined flow. The SBFE of wheat farina increased from 5.81 to 9.47 mJ/g when the moisture content increased from 13.73 to 19.57%. However, granulated sugar, the only non-starch powder analyzed in this study, behaved much differently than the wheat farina and corn meal. The granulated sugar, which had a higher moisture content, showed lower SBFE values. The SBFE values for granulated sugar were 51.73 and 14.72 mJ/g when the initial moisture content was 0.06 and 0.4%, respectively. The SBFE values for granulated sugar corresponding to 0.4 and 0.78% moisture content were statistically similar (p > 0.05). SBFE is a measure of the energy required to initiate the flow of a unit mass of powder. Similar results for corn and wheat powders have been reported previously. An increase in SBFE with moisture content has been reported in the case of milk-malted barnyard millet powder [10] and starch powder [7]. The opposite trend was prominent in the case of milk-malted foxtail millet powder [10] and molasses powder [7]. Abu-hardan [22] studied the impact of moisture on wheat and maize starches and flours, finding that the caking ability of maize flour was largely uninfluenced by an increase in moisture content, while wheat flour showed an enormous increase in cake-forming ability. Higher moisture content increases the SBFE by promoting the factors that hinder free flow. These factors include an increase in cohesion and agglomeration, inducing capillary forces and surface tension between particles, modifying the electrostatic forces, interparticle friction, and structure. As the moisture content increased (on a much smaller scale due to the soluble nature of granulated sugar in water), the energy requirements decreased for both confined and unconfined flows.

Table 1.
Dynamic flow properties of different samples with varying moisture contents.
For unconfined flow for corn meal, an increase in moisture content from 13.13 to 15.45% led to an increase in the stability index (SI) value from 0.97 to 1.15; however, for 15.45 and 19.61% moisture, the SI values were statistically similar (p > 0.05). The acquired SI fell within the range considered “safe” for flow (0.9 to 1.1), as defined by Bian et al. [23]. Should the value exceed or fall below this threshold, the powder could be deemed “unstable”, leading to potential segregation and disintegration during flow.
This trend is the same for SE also. SE represents the energy taken (for unconfined flow) to move from the base to the top of the cylinder, thus indirectly following the pathway of SI. For corn meal, the SE increased from 3.77 to 4.21 mJ/g when the moisture increased from 13.13 to 15.45%; however, afterward, it was statistically similar (p > 0.05) to 19.61%. For wheat farina, the specific energy was statistically the same (p > 0.05) for all three moisture content levels (13.73, 15.69, and 19.57%). In the case of granulated sugar, the SE decreased from 10.90 to 6.94 mJ/g when the moisture content increased from 0.06 to 0.78%. On the other hand, the stability index for granulated sugar remained constant with an increase in the moisture content. The SIs for corn meal and wheat farina showed opposite behaviors with an increase in the moisture content of the powder. Wheat farina samples with 13.73 and 15.69% moisture showed SI values of 1.00 and 0.94, respectively, while at 19.57% moisture, the SI again reduced to 0.92. This might be a result of the water-soluble starch leeching out and creating a sticky surface for the particles. This sticky surface could cause adhesion with less surface contact, resulting in the powder taking up more volume as the blade cycled through it during testing.
The flow rate index (FRI) for corn meal shows that, as moisture increases, the sensitivity to the blade speed is reduced, denoted by the FRI value gradually decreasing from 1.40 to 1.14 when the initial moisture increased from 13.13 to 19.61%. For granulated sugar, the FRI increased from 0.91 to 1.23 when the moisture content increased from 0.06 to 0.78%. For wheat farina, the FRI increased from 0.95 to 1.09 when the moisture content increased from 13.73 to 15.69%; however, a reverse trend was profound after that. While the initial energy requirement is higher than the lower moisture content, a reduced blade speed requires less additional energy at a higher moisture content. The increased flow rate index indicated that the moisture content caused a greater sensitivity to the reduced blade speed despite the overall lesser energy requirements. The relatively constant stability index shows that the sugar does not readily compact more during conditioning/testing cycles due to increased surface moisture.
Geethambika et al. [10] reported an increase in the SE, SI, and FRI of milk-malted barnyard millet powder with an increase in moisture content from 3% to 9% on a dry basis. The opposite trend for the SE and SI was prominent in the case of milk-malted foxtail millet powder when the moisture content in the sample increased from 3% to 6% on a dry basis [10]. The flow stability index decreased from 1.1 to 0.86 for durum wheat flour when the moisture content increased from 16% to 33% [24]. For starch powder, the FRI decreased with an increase in the moisture content [7]. A higher tip speed might also increase energy, potentially due to agglomeration (SI > 1, FRI > 1). This process demotes momentum, thereby aiding the blade’s upward motion [1].
3.3. Shear Flow Properties
Increasing the moisture content (to the ranges utilized in extrusion preconditioning) impacted the above testing results. Furthermore, moisture emerged as a pivotal factor significantly impacting both static and dynamic flow properties, showcasing a strong correlation between them. With an increase in moisture content from 13.13 to 19.61%, the cohesion values for corn meal remained statistically the same (p > 0.05) within 0.843–0.951, whereas the effective angle of internal friction (AIF) clearly decreased from 49.0 to 42.4° (Table 2). An increase in the moisture of corn meal resulted in a significant increase in the wall friction interaction, with greater moisture content yielding a greater surface–wall interactive force. In the case of wheat farina, the initial increase in the moisture content appeared to have no effect on cohesion and yield strength. For instance, the cohesion value remained statistically similar between 0.395 and 0.385 when the moisture content increased from 13.13 to 15.69%. There was a substantial increase in the AIF (from 34.0 to 40.6°) when the moisture content increased from 13.13 to 15.69%. Further increasing the moisture (up to 19.57%) resulted in much stronger cohesion results and a higher yield strength. One possible reason for these results is the starchy particles adhering in the presence of surface moisture, causing a sticky product that resists flow. Cohesion values for granulated sugar overlapped between 0.807 and 0.862 for the first two moisture samples (0.06 to 0.4%). An increase in the AIF (from 40.5 to 42.6°) was observed for the moisture increase from 0.06 to 0.4%. The high-moisture sample clearly showed a cohesive product that had a higher propensity for remaining stationary and stacking up (as implied by the increased angle of internal friction).
Table 2.
Shear flow properties of corn meal, wheat farina, and granulated sugar at varying moisture contents.
The movement of powders during processing and transportation can be assessed by their shear flow properties, which determine if a powder will flow smoothly or potentially cause obstructions and interruptions. As the moisture content rises, the cohesive properties of all powders tend to increase in terms of stress. At higher moisture levels, it is presumed that the forces causing particles to bridge each other became more dominant than the van der Waals forces in both powders [25]. The cohesion results closely mirrored the observations of SE (shear efficiency). In the case of milk-malted foxtail millet powder, cohesion and UYS gradually decreased with rising moisture content, consequently improving flow function.
The AIF gauges the force necessary to mobilize or shift powder, overcoming the friction among particles. It relies on factors such as particle size, shape, distribution, and powder composition. Bian et al. (2015) noted an AIF range of 35.99 to 38.6 for hard red winter wheat flour. In the case of corn meal, a slight decrease in the AIF was observed with increasing moisture content (Table 2). Similarly, Pushpadass et al. [26] documented a parallel decline in the AIF, ranging from 42.92 to 32.16, as the moisture content of ice cream powder, containing 15% added sugar, rose from 3% to 9%. Geethambika et al. [10] also observed a decrease in the AIF for milk-malted foxtail millet powder with rising moisture levels. This decline might primarily stem from larger particle sizes, the reduced presence of fines, and alterations in the contact surface area due to agglomeration, dissolution, and plasticization [27].
The UYS of corn meal remained fairly consistent within the range of 3.7 to 4.09 as the moisture content increased from 13.13% to 19.61%. Conversely, both wheat farina and granulated sugar exhibited an increase in UYS as moisture levels rose. This trend aligns with findings reported by Mitra et al. [11] concerning basundi mix. UYS serves as a stability measure and can quantify the tendency for caking, with values above 1 kPa indicating a propensity for caking [28]. In the case of milk-malted foxtail millet powder, the UYS decreased from 13.76 to 7.71 kPa as the moisture content climbed from 3% to 9% [10]. The UYS values observed for granulated sugar correspond to those reported for skim milk powder and whey powder [29], likely owing to the presence of sugars in these samples.
The flow factor (FF) stems from the correlation between the UYS and the primary stress exerted on solids. It characterizes the strength needed to initiate powder flow. A higher FF implies a smaller UYS-to-principal consolidation stress ratio, indicating better powder flowability. Corn meal, wheat farina, and granulated sugar had FF values ranging from 4.94 to 5.11, 6.11 to 18.47, and 3.47 to 8.53, respectively (Table 2). According to the Jenike classification, an FF between 4 and 10 signifies an “easy-flowing regime”, while >10 indicates “free-flowing” [30]. Except for wheat farina samples at 13.73% and 15.69% moisture content, all other samples fell within the easy-flowing regime. Fournaise et al. [31] noted FF values of 2.28 for whole milk and 5.59 for skim milk spray-dried powder. The FF of wheat farina and granulated sugar declined as the moisture content increased until reaching the initial uptick (up to 0.4% for granulated sugar), coinciding with an increased tendency to cake. There was a substantial decrease in the FF of wheat farina (from 18.47 to 6.11) when the moisture content increased from 13.13 to 19.57%. For molasses powder, FF remained the same with an increase in the moisture content [7]. On the contrary, Geethambika et al. [10] reported that the FF of milk-malted barnyard millet powder showed a decreasing trend with an increase in moisture. The reason might be due to the partial hydration of the gluten matrix, allowing particles to create a protein matrix on the surface, resisting the greater flowability seen when no additional moisture is added to the system. Wheat farina consistently exhibited a higher FF compared to corn meal and granulated sugar across all moisture levels, attributed to sites experiencing elevated pre-shear stress, demanding fewer principal stresses to initiate shear [7]. These findings suggest that corn meal exhibited relatively higher cohesion and lower flowability for the first two moisture levels than granulated sugar due to a larger presence of fines.
The wall friction results aid in evaluating the resistance to flow that the material encounters against the bin or hopper walls. The wall friction angle (ɸ) is a common parameter used to quantify this interaction, representing the angle at which the powder material remains stable against the container walls before sliding or flowing. The ɸ for corn meal changed from 5.8 to 10.5° when the moisture content increased from 13.13 to 19.61% (Table 2). Additionally, an increase in the moisture of wheat farina resulted in increased interaction with surfaces, as shown by the increase in ɸ. The ɸ changed from 5.6 to 10.0° when the moisture content increased from 13.73 to 19.57%. These interactions would tend to decrease flow in an enclosed environment. Mitra et al. [11] reported for the basundi mix that the ɸ changed from 29.60° to 38.06° when the moisture contents increased from 3% to 9%. For granulated sugar, the increase in the moisture content (from 0.06 to 0.78%) decreased particle interactions with walls, shown by the decrease in the wall friction angle (from 9.5 to 6.3°). Due to the high cohesion and angle of internal friction, the decrease in the wall friction angle can be explained by the interparticle forces increasing with moisture content more than particle–surface interactions [32,33].
As a whole, the corn meal agglomerates as the moisture content increases but would be intrinsically inclined to move as an agglomerated mass as opposed to having a propensity for remaining stationary as a cohesive mass. King et al. [34] reported a model that suggests that when two moistened particles come into contact, they build a bridge with sufficient strength to overcome mechanical deformation and increase cohesive forces. While the cohesion of corn meal did not substantially increase, the irregular particle shape may have been of greater consequence than the model described by the authors. The elevation in atmospheric moisture led to an increase in the UYS and MPS of flour, as Teunou et al. [14] reported. Geethambika et al. [10] reported a decrease in the UYS of milk-malted barnyard and foxtail millet powders with an increase in moisture content from 3% to 9% on a dry basis.
Combining the trends of increased cohesion and flow factor with the decreased angle of internal friction, increased wall friction angle, and increased basic flow energy requirements makes the impact of moisture on flow in an extruder difficult to ascertain due to the mixing of characteristics that increase flow with those that decrease flow. With the number of traits that appear to increase flow properties, however, it is likely that corn meal would flow as a free or loosely agglomerated powder when fed into an extruder barrel after preconditioning increased the moisture content. The results of moisture addition to wheat farina led to increased energy requirements in confined flow, decreased flow factors, increased angles of internal friction, and increased wall friction angles. These resulted in a decreased propensity to flow in an extrusion system after exiting the preconditioning system.
The major difference between these starch-based powders appears to be how the materials behave in the presence of moisture. Two primary interactions determine the flow of a powder in a confined space—particle–particle forces and particle–surface forces. Stronger particle–particle forces would increase agglomeration but not necessarily decrease flow properties, as seen by the flow factor of corn meal tending to increase with moisture content. Conversely, stronger particle–surface interactions would decrease flow. As farina has a flow factor that is greatly reduced as moisture increases, the particle–surface interaction (inferred from wall friction results) is more likely to create a poorly flowing product in tandem with the reduced internal flow characteristics.
Moreover, each powder’s unique chemical characteristics contribute to its distinct flow properties in different conditions. For instance, corn meal is rich in starch and proteins. Wheat farina, derived from wheat endosperm, contains different proportions of carbohydrates, protein, crude fat, and fiber. Granulated sugar is entirely sucrose. The starches in corn meal and wheat farina may behave differently under varying moisture conditions, affecting the powder’s flow properties. The absence of certain components, like fats in granulated sugar, can also impact its behavior compared to the other two. Therefore, the dynamic flow and shear flow properties at different moisture levels vary due to their diverse compositions, making a direct comparison between the powders challenging.
3.4. Compressibility
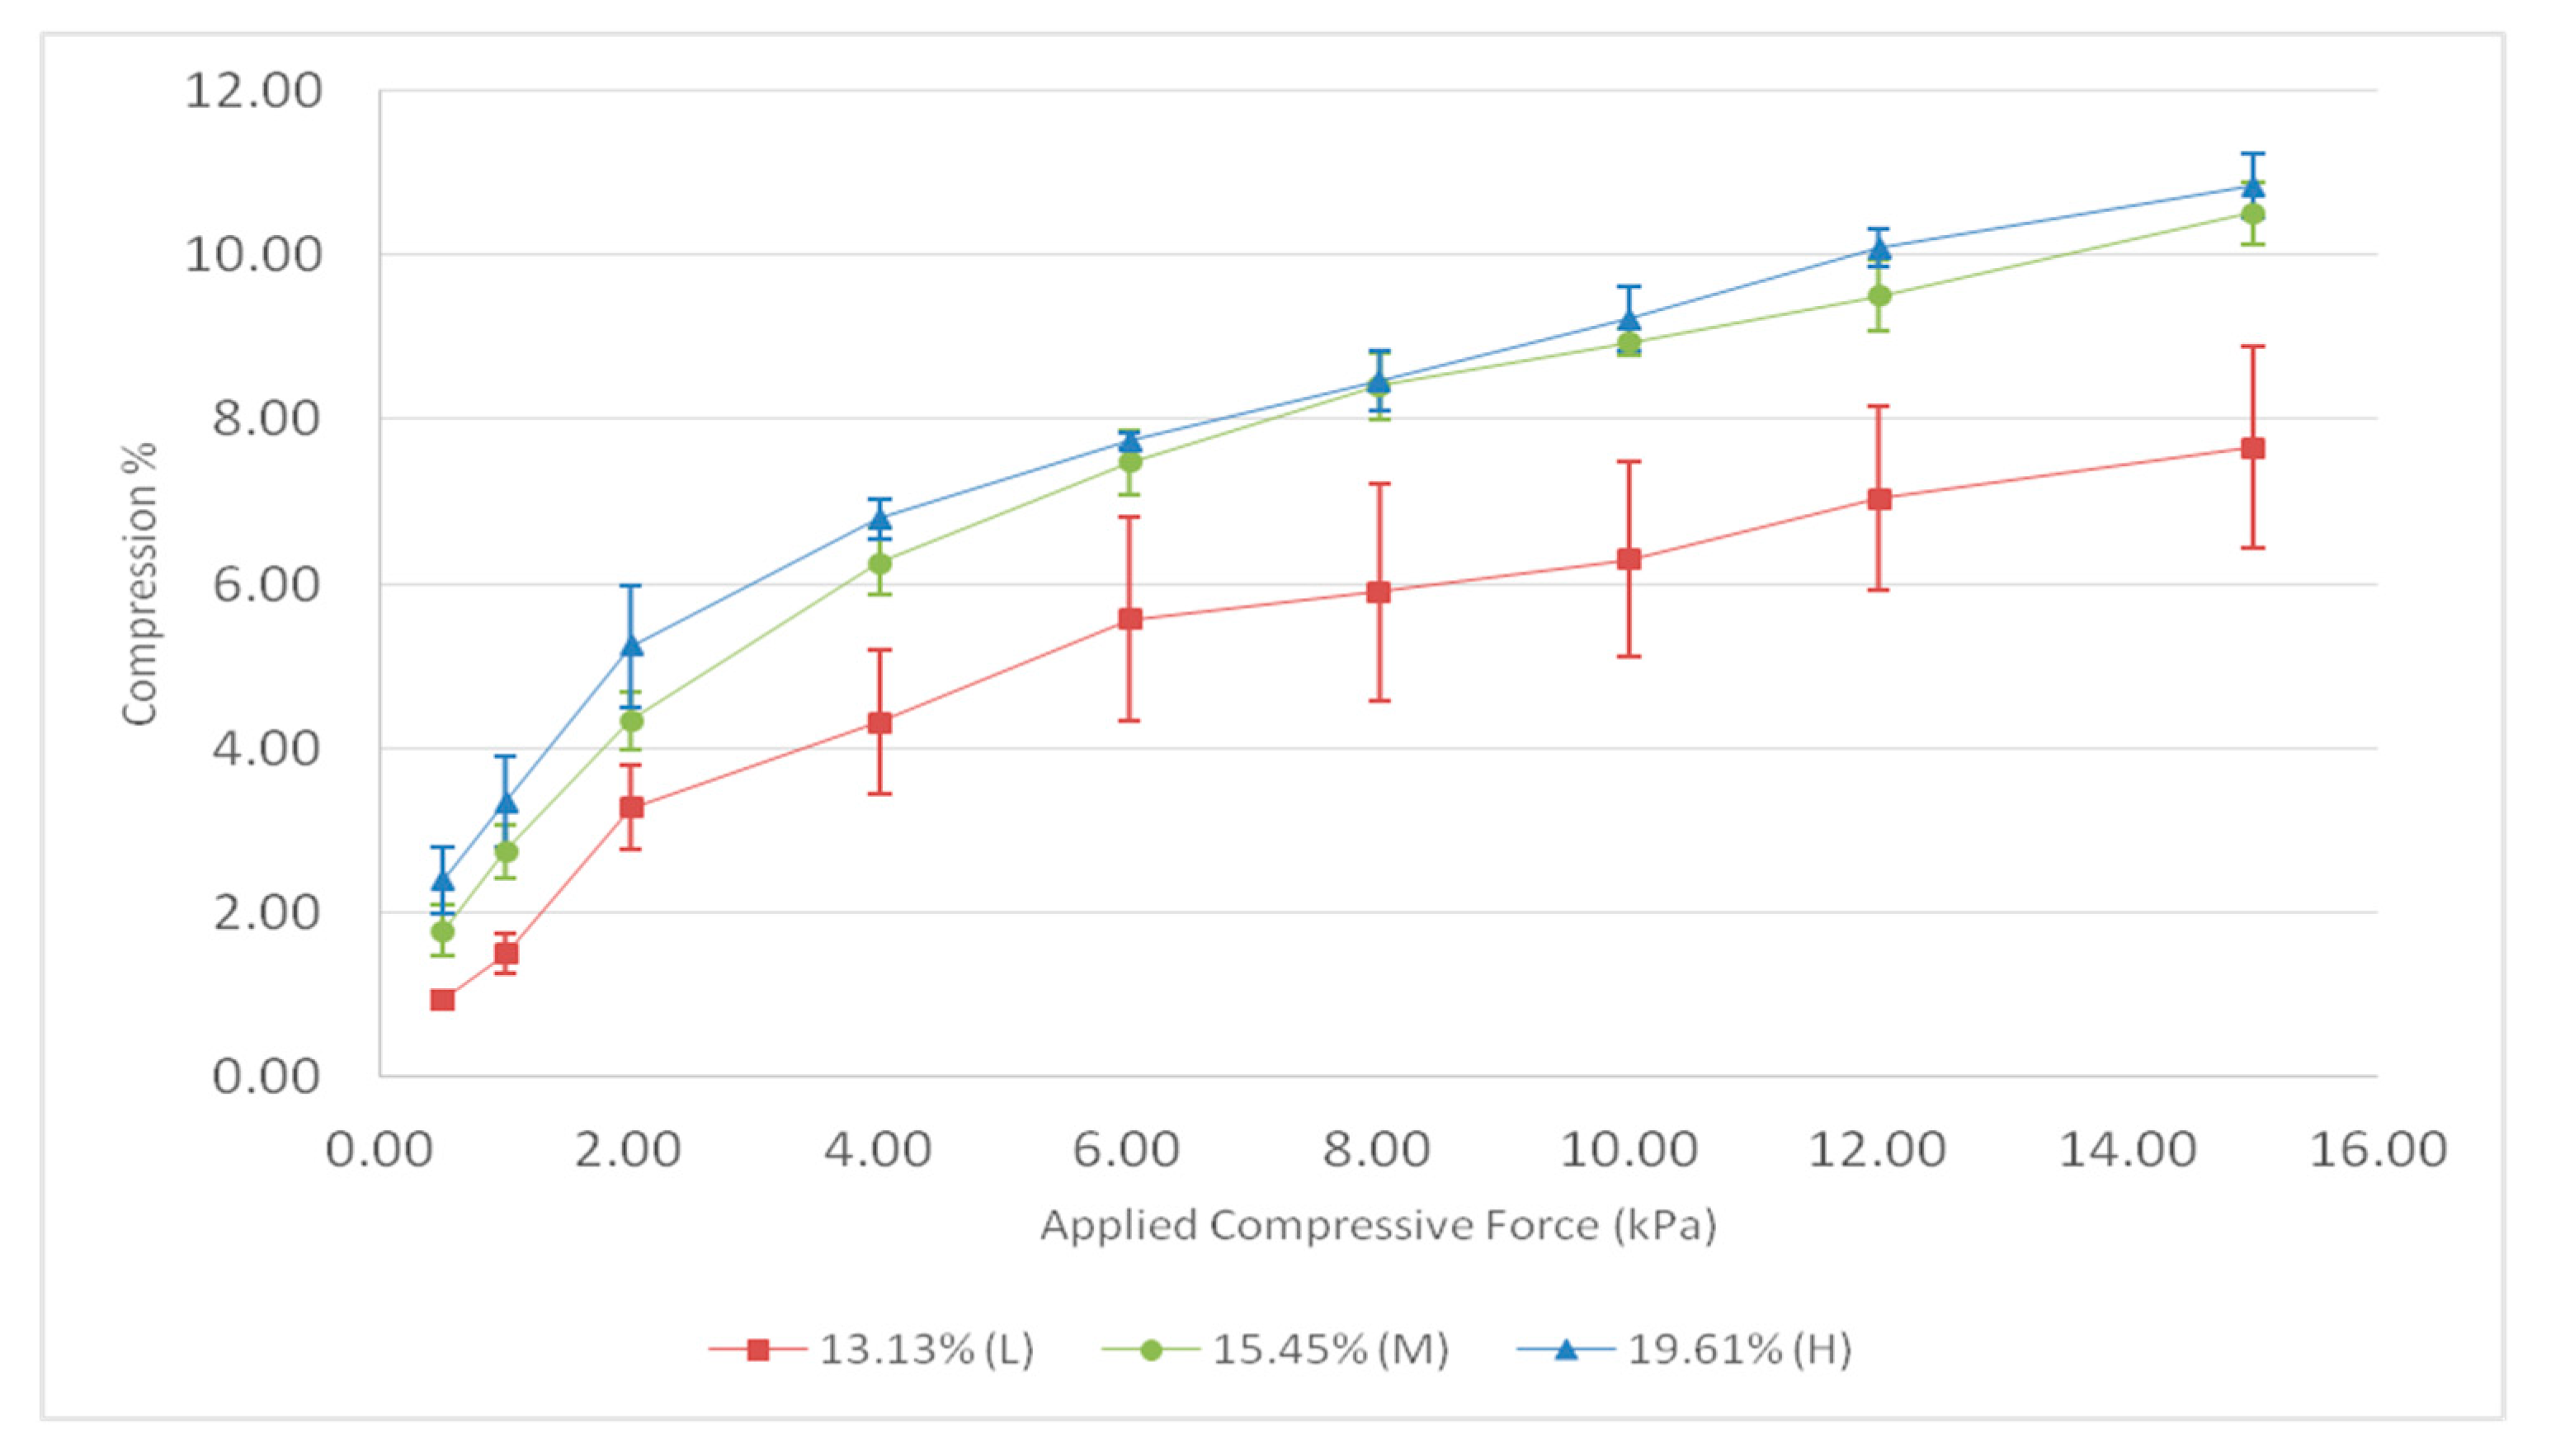
The compressibility results do mirror the cohesion results from the shear testing, although there is a more drastic difference between initial compressibility and samples with additional moisture. The addition of moisture definitively increases compressibility, although increasing the moisture content further appears to have a drastically mitigated effect. This correlation makes sense, as the increase in cohesion values would result in granules of corn meal sticking more readily, causing more void space between particles even after the conditioning cycle of the test and, in turn, allowing more opportunity for compressibility as these void spaces are filled with corn meal particles (Figure 2). Free-flowing powders tend to respond less to direct compression. With increasing normal stress, corn meal exhibited a gradual (p < 0.05) rise in compressibility, as expected (Figure 2). This was due to the applied pressure reducing the distance between particles, bolstering the powder’s strength. Consequently, the powders could compress more consistently under constant stress. Corn meal’s compressibility notably increased as the moisture content rose from 13.13% to 19.61%. Geethambika et al. [10] noted a similar pattern in milk-malted foxtail millet powders, where compressibility increased from 6% to 9% moisture content on a dry basis. However, corn meal with 15.45% and 19.61% moisture content showed comparable values (p > 0.05) between 4 and 16 kPa of compressive force.
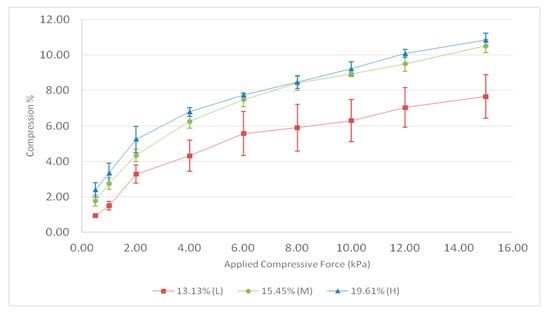
Figure 2.
Changes in compressibility (%) of corn meal at different compressive forces (kPa) as influenced by initial moisture content.
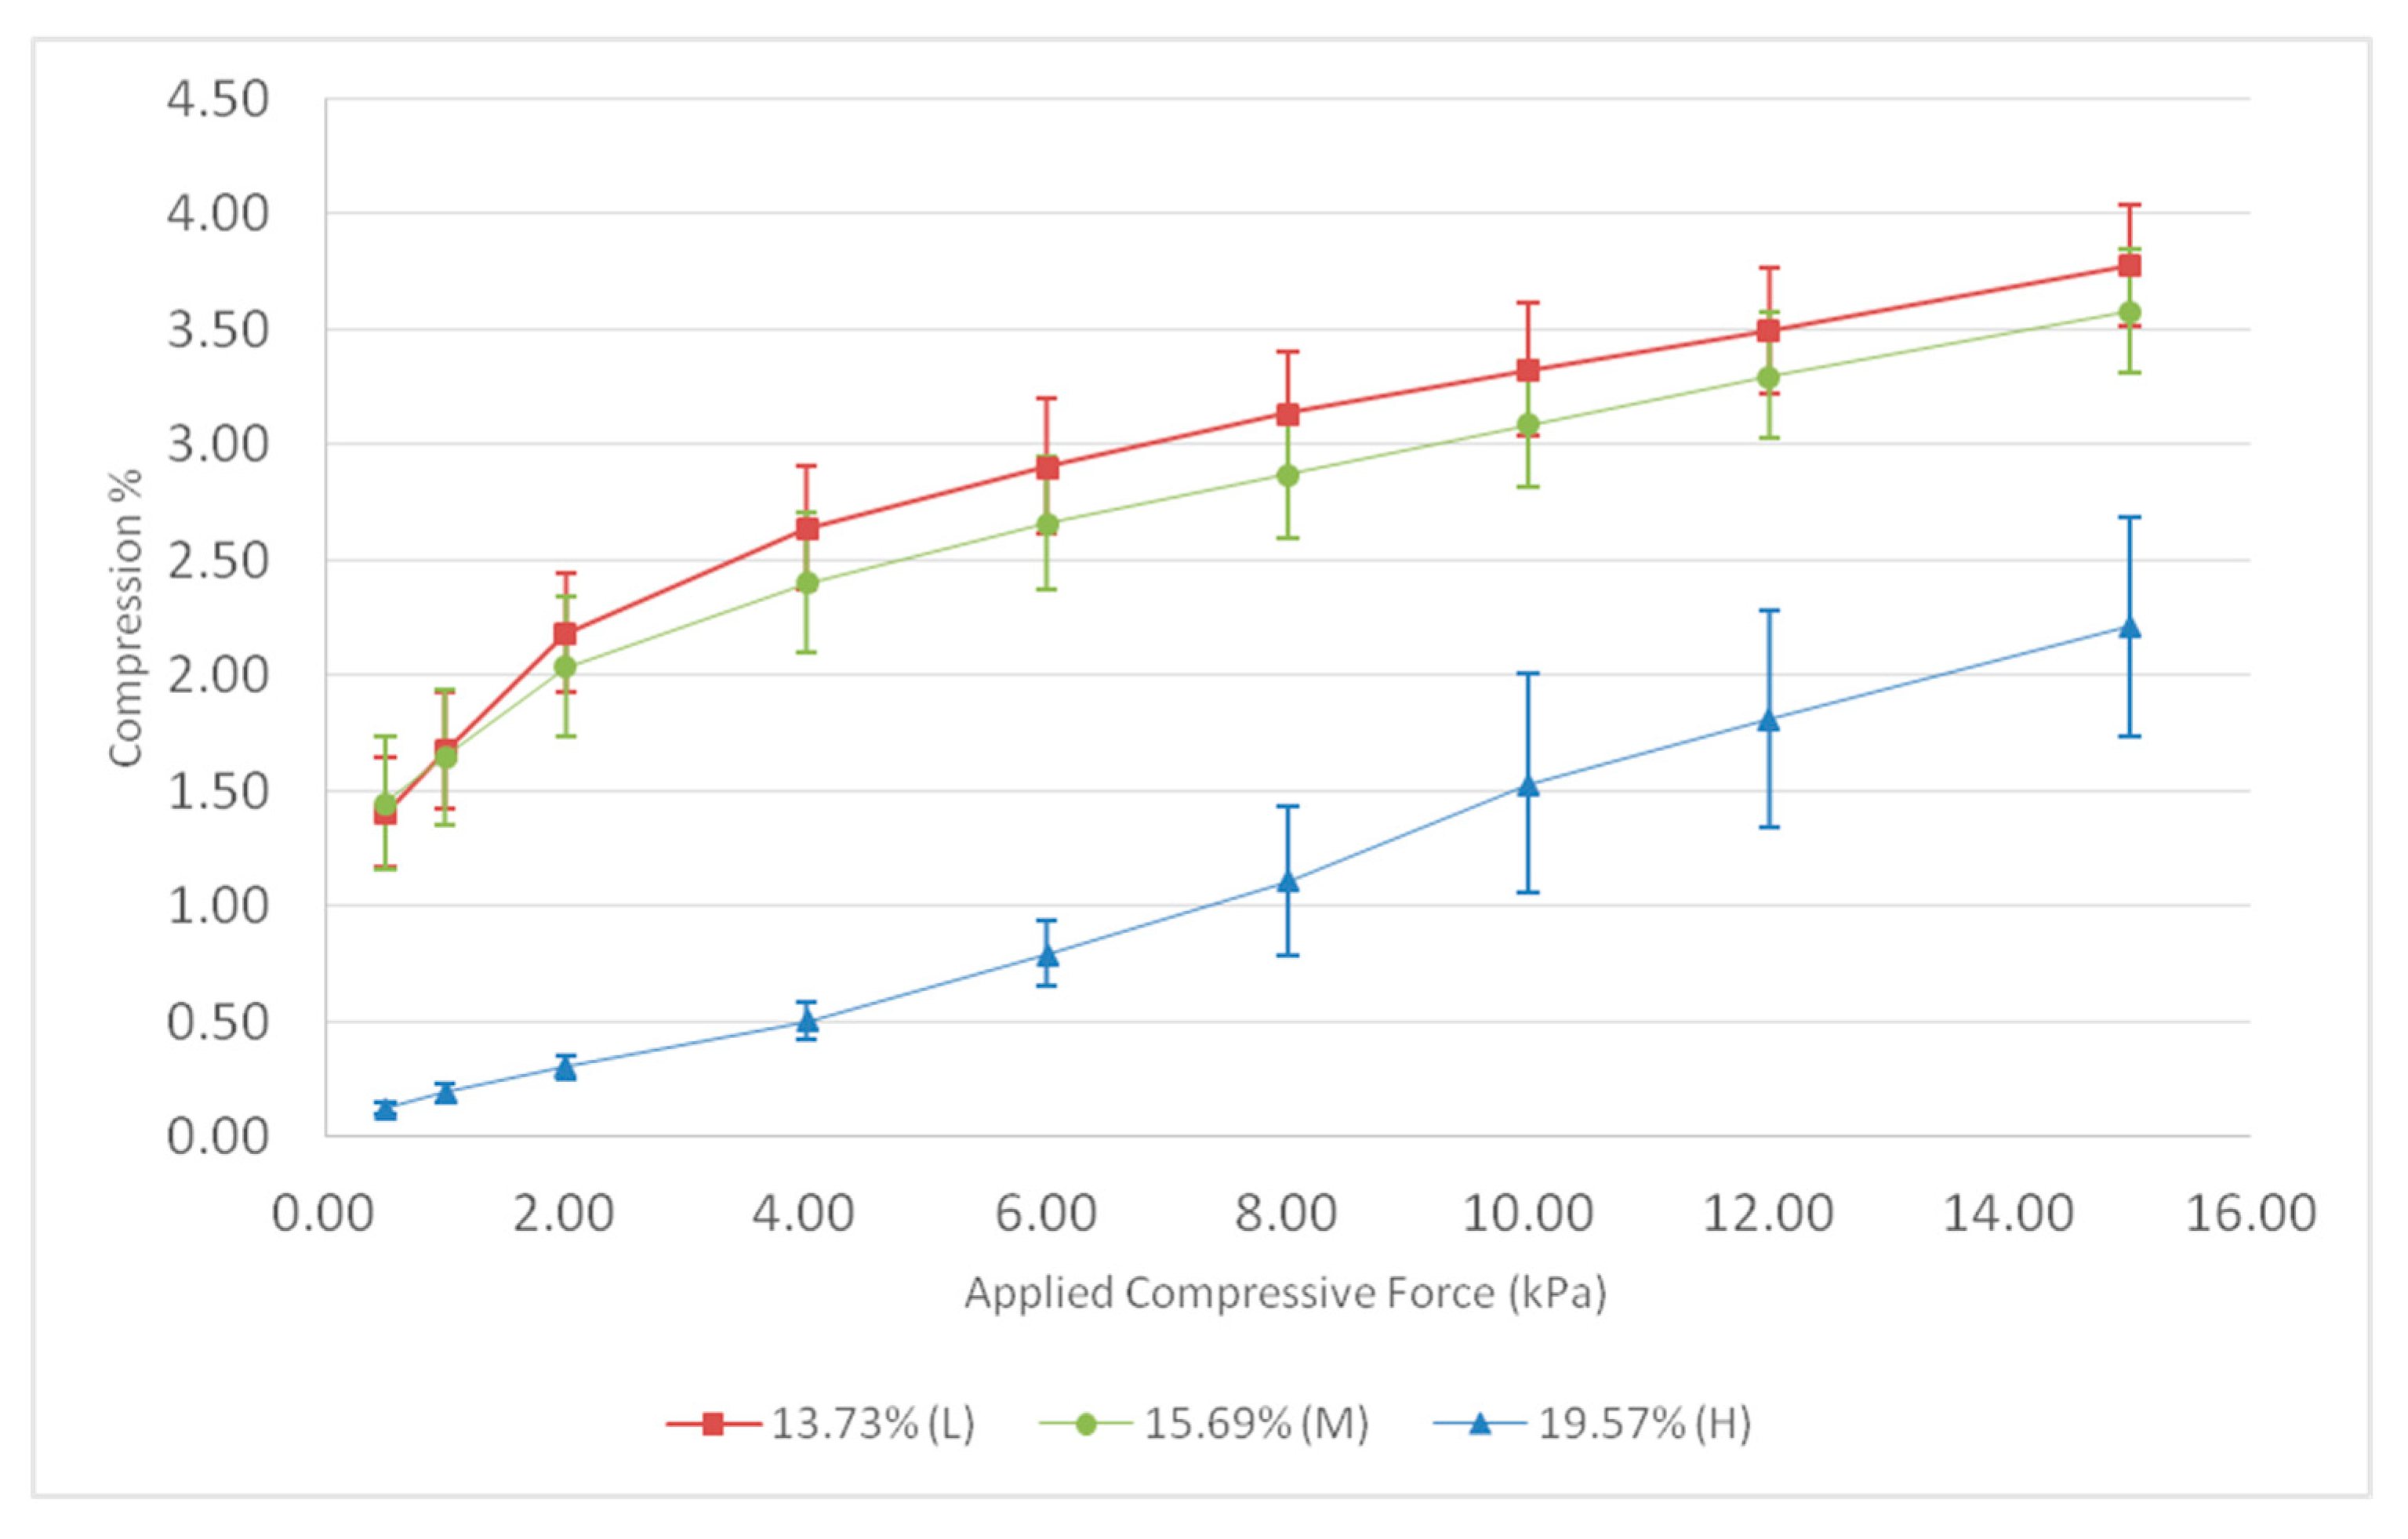
In contrast, wheat farina displayed an inverse trend in compressibility with varying moisture content. With increasing moisture from 13.73% to 19.57%, wheat farina exhibited lower compressibility. Geethambika et al. [10] observed a similar trend in milk-malted foxtail millet powders, where compressibility decreased from 3% to 6% moisture content on a dry basis. Interestingly, for a specific moisture content, compressibility grew with applied compressive force (Figure 3). At 13.73% moisture, wheat farina formed small clusters, creating void spaces and possessing low bulk density. However, as moisture content increased to 19.57%, reduced void space due to agglomeration and the moisture binding the particles led to decreased compressibility. Due to the sticky nature of the particle surface and the matrix that may have been forming across the surfaces, the subsequent decrease in the stability index (indicating expansion), and the increase in cohesive properties, these results make sense despite initially seeming counterintuitive.

Figure 3.
Changes in compressibility (%) of wheat farina at different compressive forces (kPa) as influenced by initial moisture content.
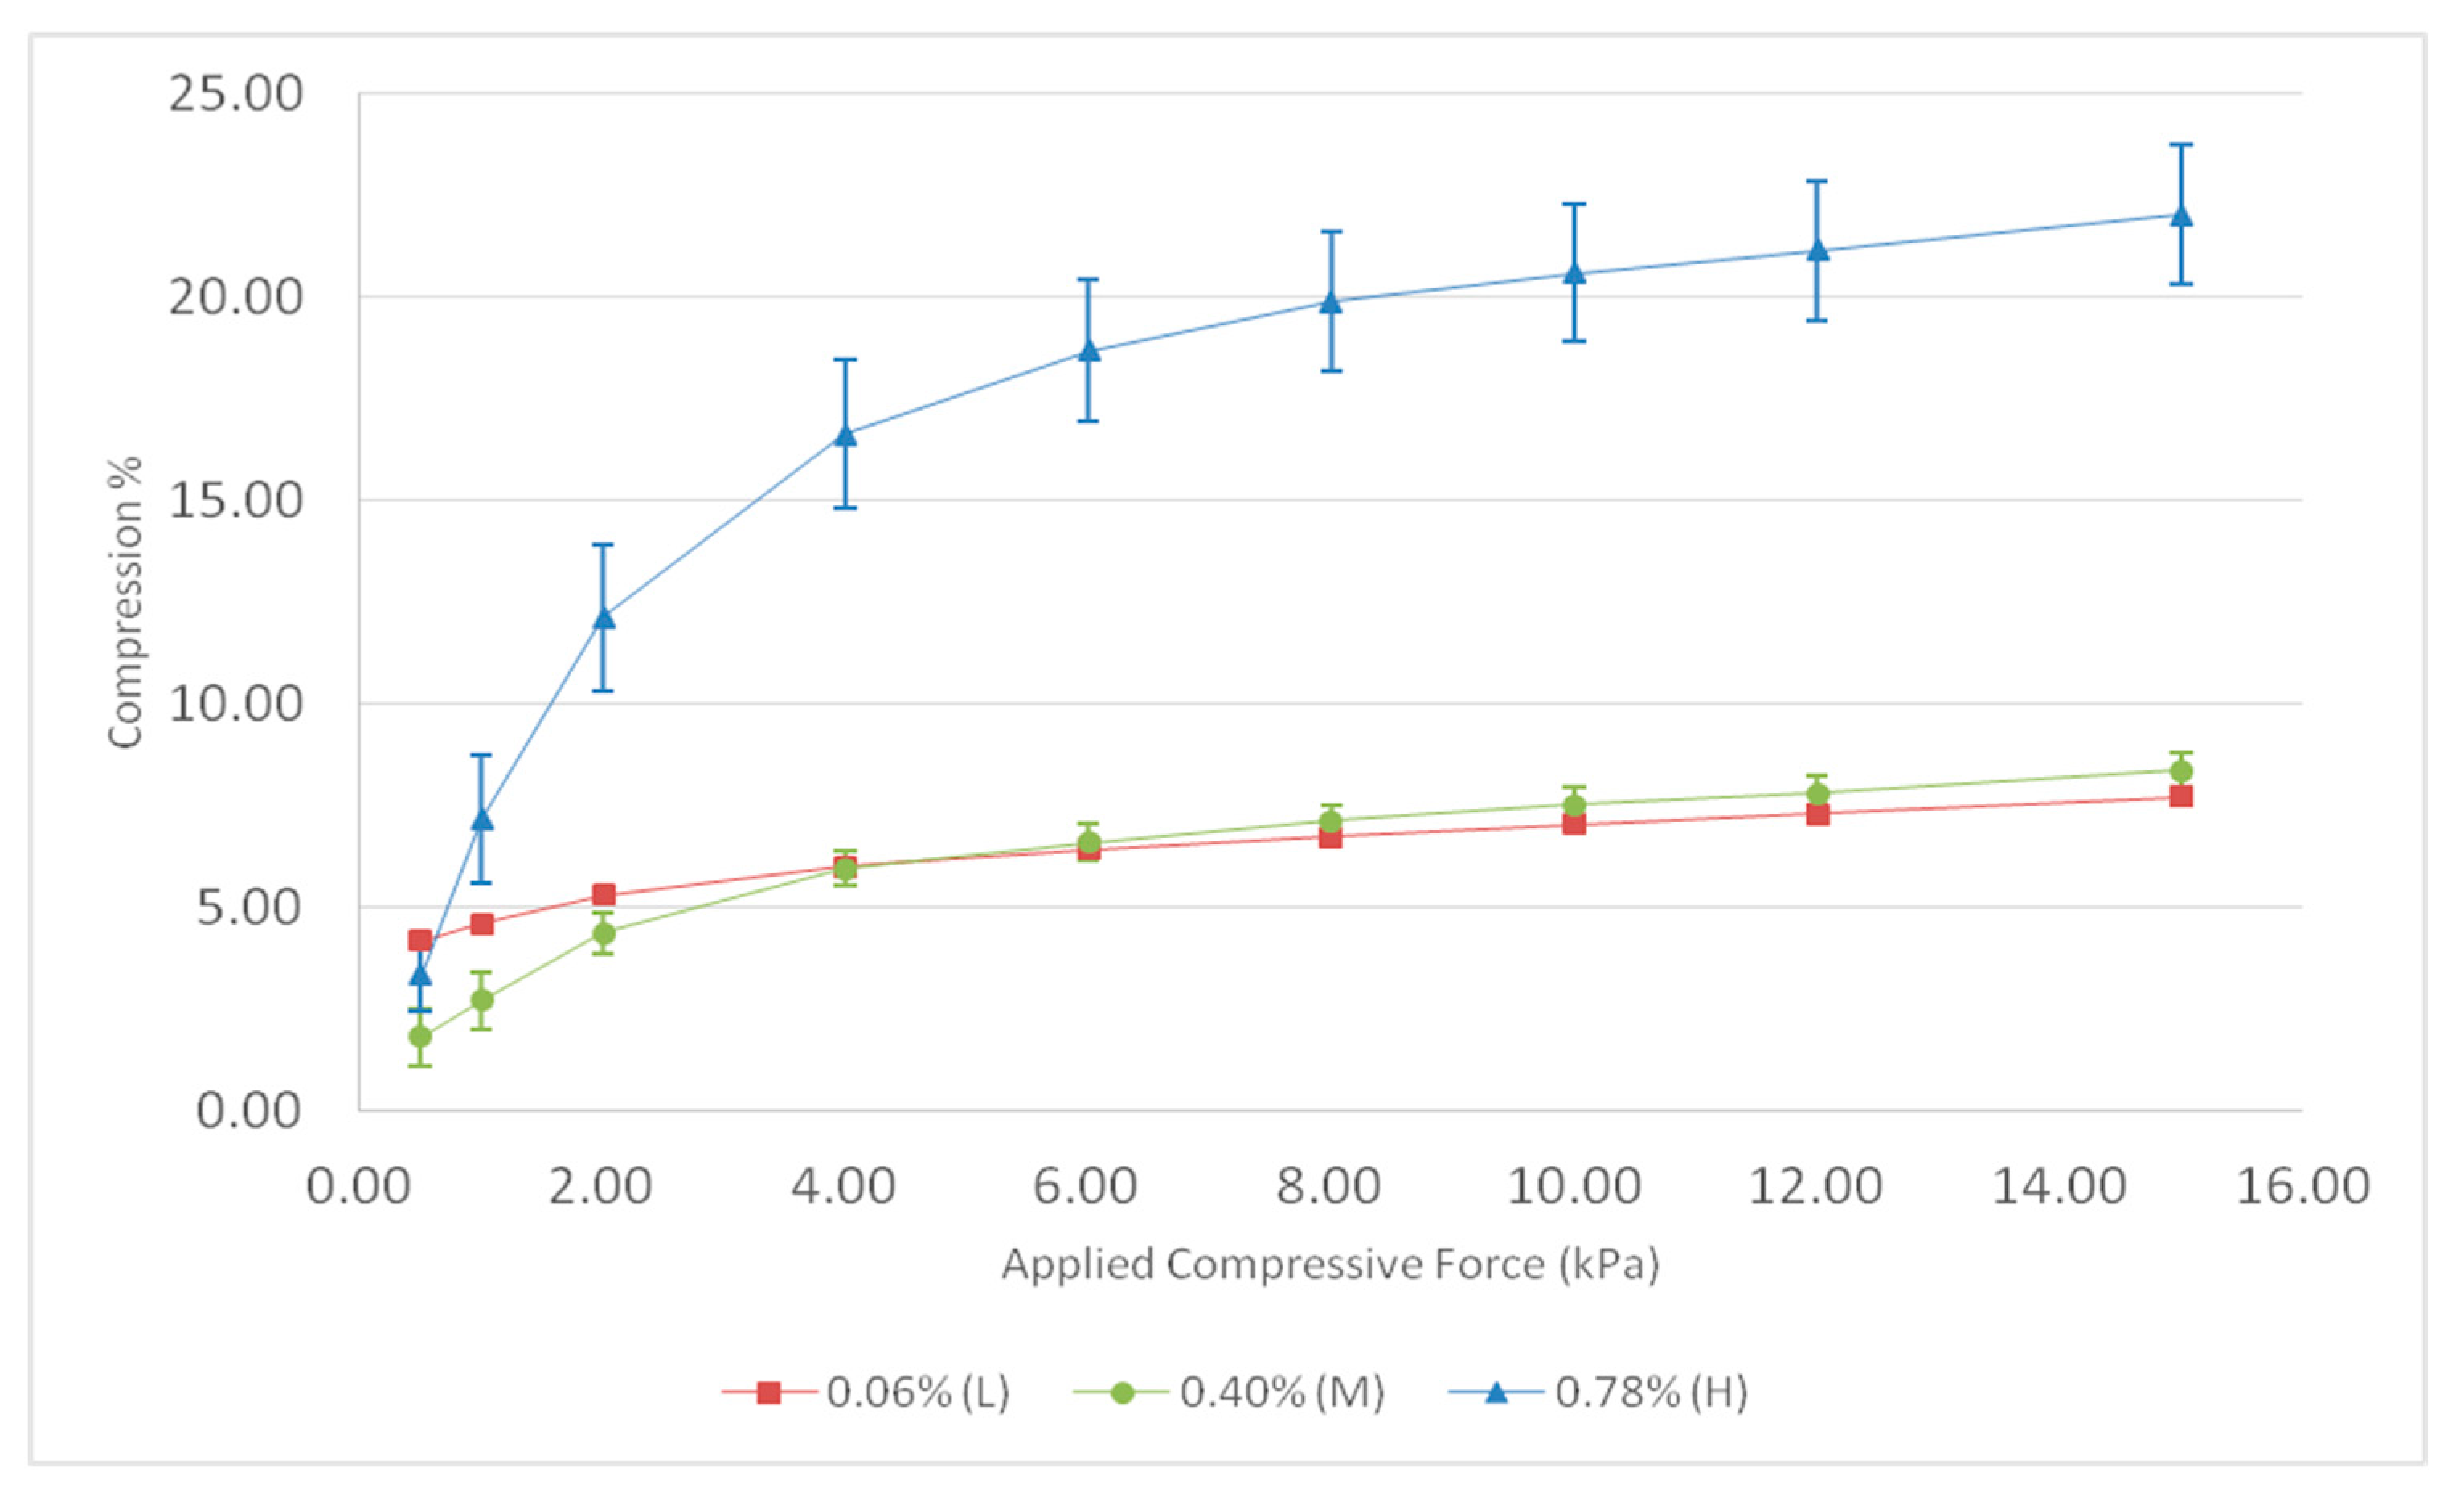
Granulated sugar’s compressibility correlates with cohesion. As the compressive force increased from 0.5 to 15 kPa, the compressibility of granulated sugar rose. Notably, sugar samples with 0.06% and 0.4% moisture exhibited statistically similar compression values (p > 0.05) between 4 and 15 kPa force. At 0.5–2 kPa, sugar with 0.06% moisture displayed higher compressibility than that with 0.4% moisture. Geethambika et al. [10] noted a similar trend in milk-malted barnyard millet powders as the moisture content increased from 6% to 9% on a dry basis. Mitra et al. [11] found that basundi mix had the highest compression value at 6% moisture, followed by 3% and 9% moisture content.
Granulated sugar showed significantly increased compressibility from 0.06% to 0.78% moisture (Figure 4). Jange and Ambrose [7] also observed heightened compressibility in molasses powder as the moisture content increased from 0.08 to 0.14%. This could also be due to the sample beginning to melt with the high moisture content, exceeding the threshold for maintaining shape and solid form, and resulting in the sample condensing under pressure to eliminate air pockets created due to the shape of the dry, crystalline structure.
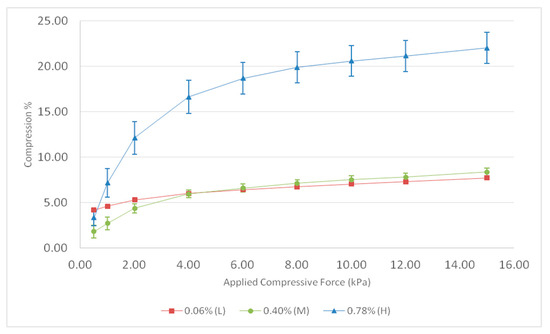
Figure 4.
Changes in compressibility (%) of granulated sugar at different compressive forces (kPa) as influenced by initial moisture content.
3.5. Principal Component Analysis
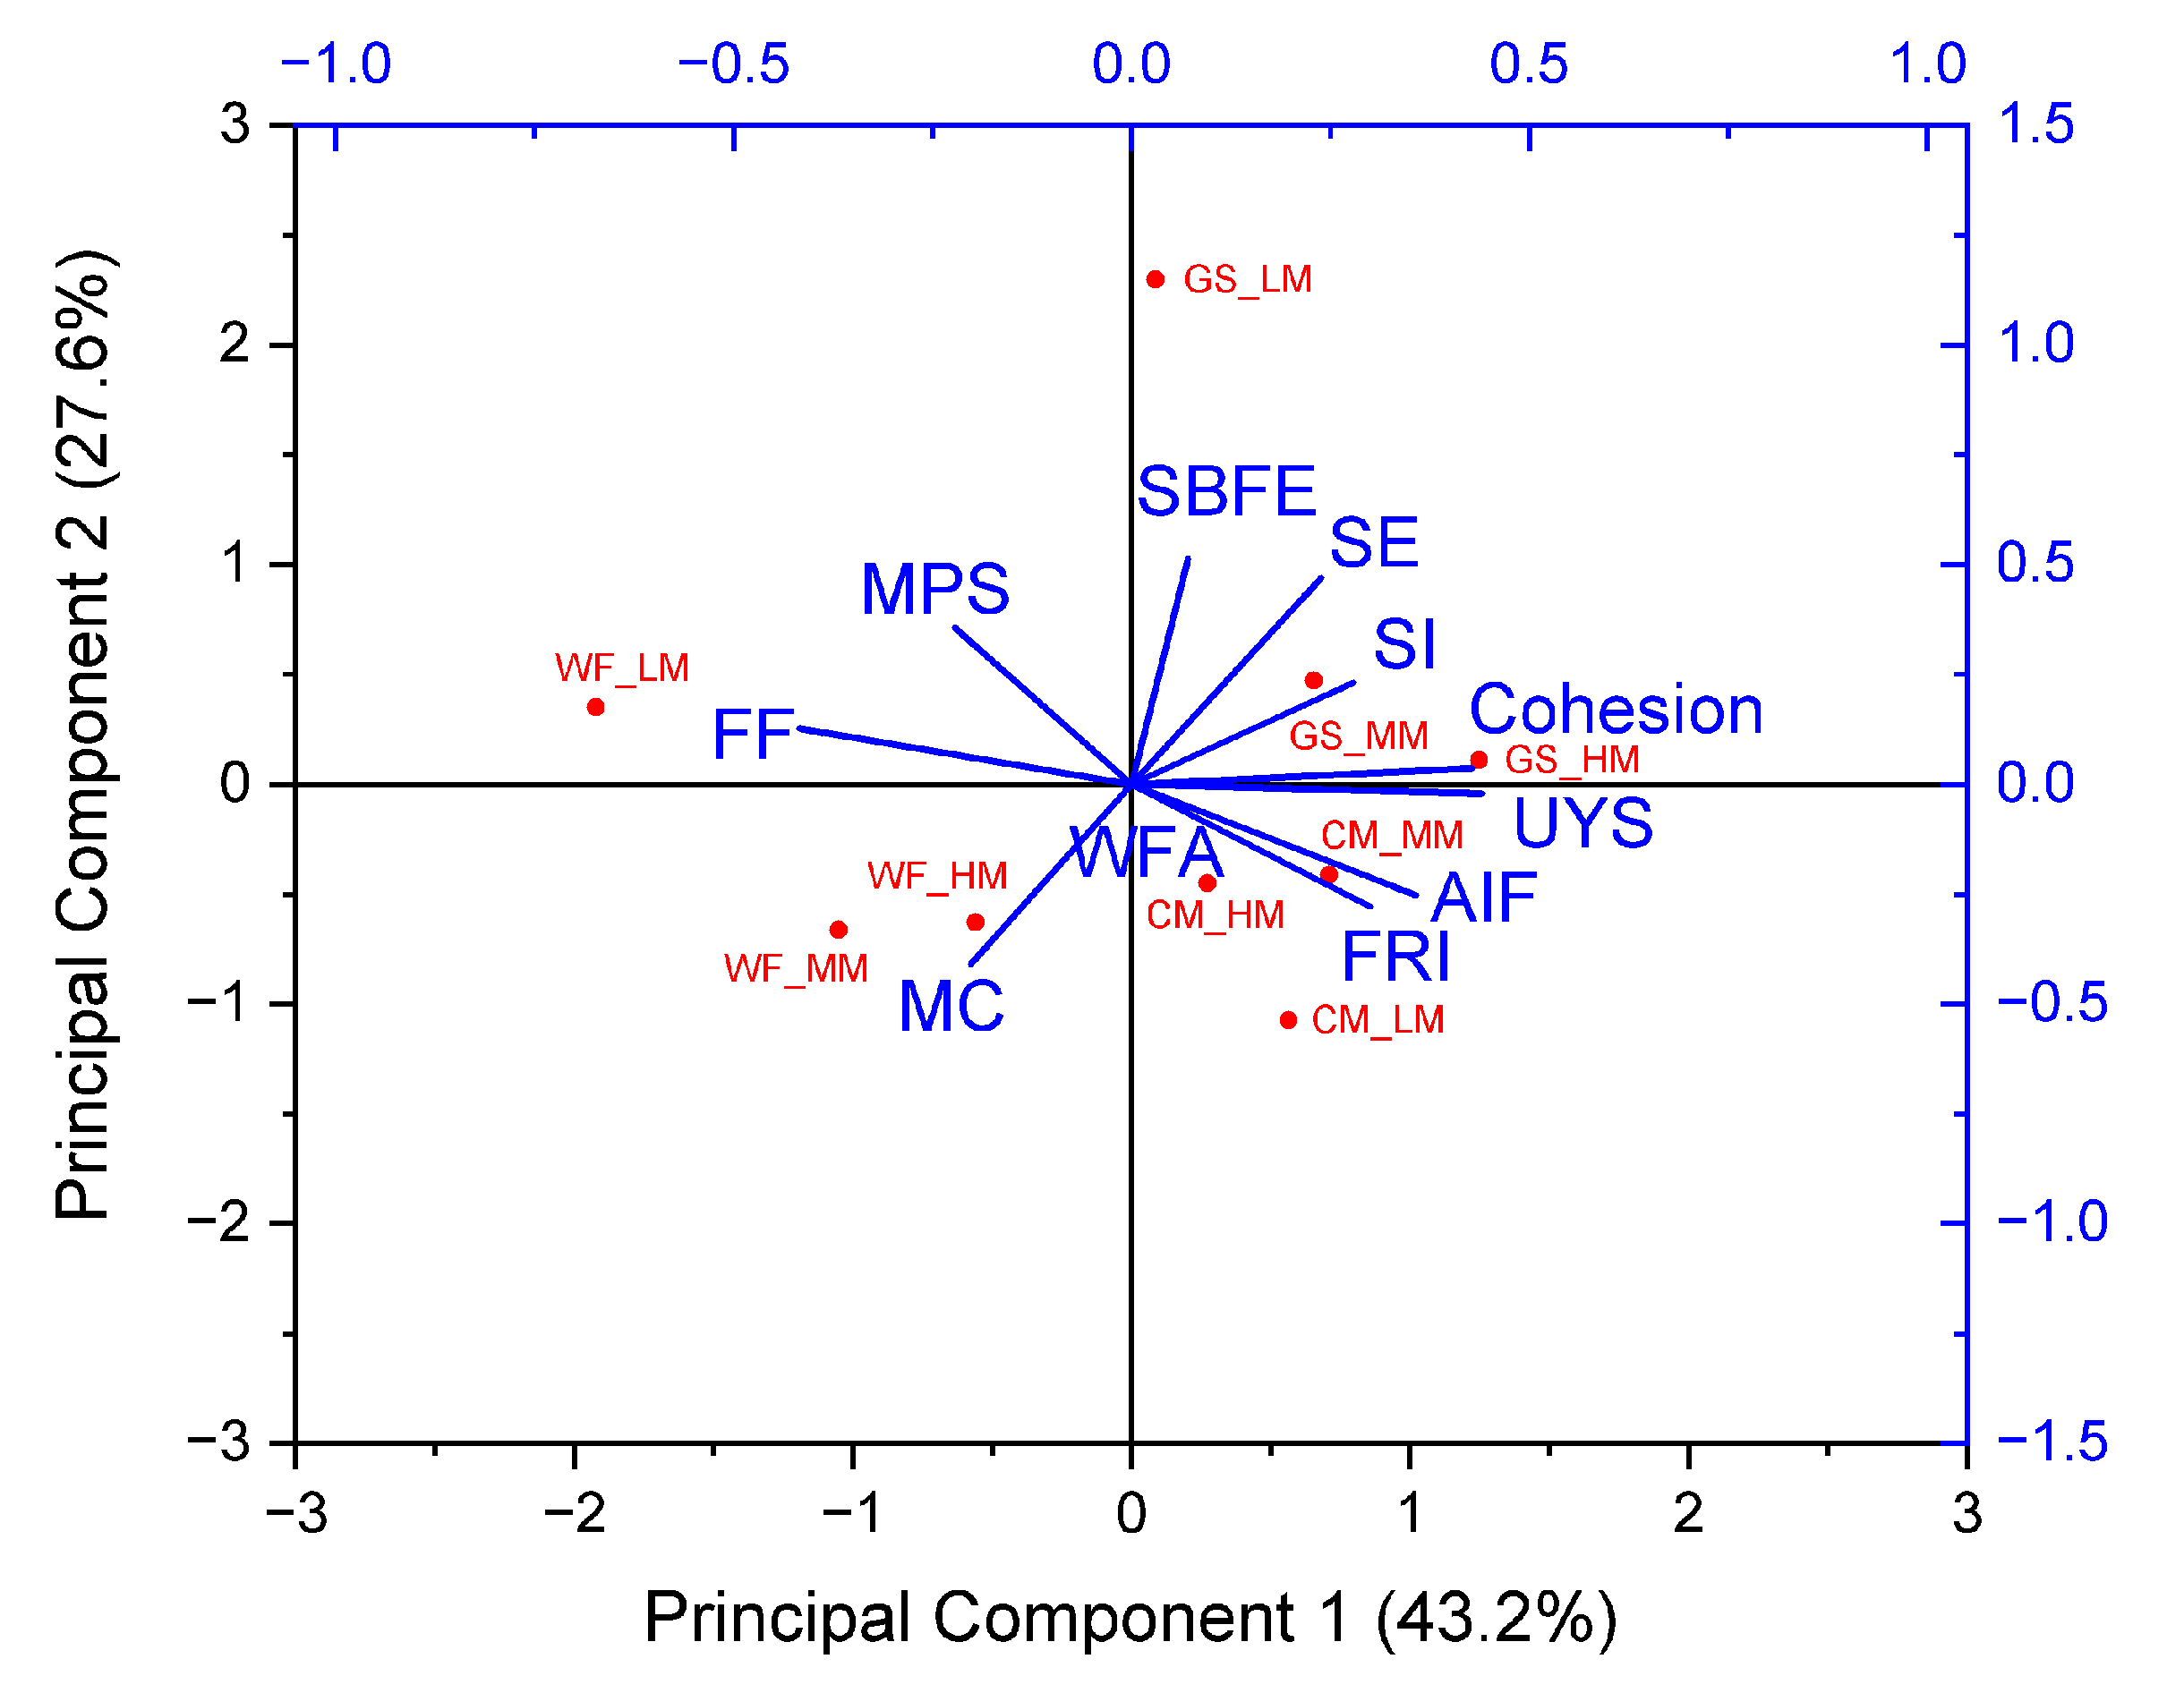
The initial moisture content significantly shapes the three food powder samples’ dynamic flow and shear properties. Through the multivariate analysis depicted in Figure 5, we derived Principal Component 1 (PC1) and Principal Component 2 (PC2) from eleven dependent variables, capturing the majority of the variability. In a bi-rotated space orthogonal to PC1 and PC2, over 70% of the dataset’s variability is explained, with PC1 accounting for 43.2% and PC2 for 27.6% of the variability.
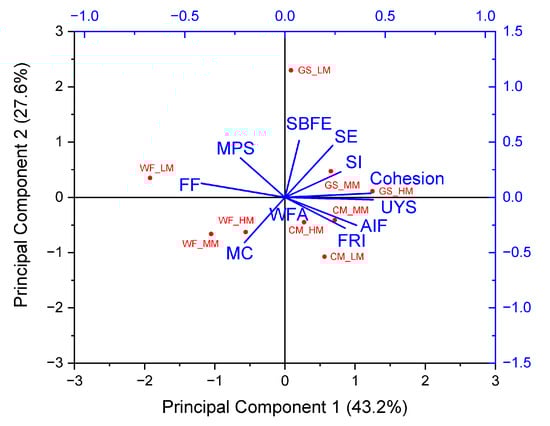
Figure 5.
Bi-plot showing the loading and scoring plots between two principal components (PC1 and PC2) while describing the changes in various dynamic flow and shear properties of different powder samples as a function of their moisture content. In the score plot, CM, WF, and GS stand for corn meal, wheat farina, and granulated sugar, respectively. LM, MM, and HM refer to low moisture, medium moisture, and high moisture, respectively. LM, MM, and HM for corn meal refer to 13.13, 15.45, and 19.61% moisture content, respectively; LM, MM, and HM for wheat farina refer to 13.73, 15.69, and 19.57% moisture content, respectively; LM, MM, and HM for granulated sugar refer to 0.06, 0.40, and 0.78% moisture content, respectively. In the loading plot, MC, moisture content (%); AIF, angle of internal friction; SBFE, specific basic flowability energy (mJ/g); SE, specific energy (mJ/g); SI, stability index; UYS, unconfined yield strength (kPa); MPS, major principal stress (kPa); FRI, flow rate index; WFA, wall friction angle (°); FF, flow factor.
Notably, PC1 contributes the most to the overall variability, with eigenvalues of 4.757 and 3.039 for PC1 and PC2, respectively. The loading plot showcases positive associations of all attributes with PC1, revealing variability in each sample’s attributes without distinct clusters. For instance, granulated sugar (0.06% moisture content) and corn meal (13.13% moisture content) exhibit markedly different flow and shear properties situated in opposite quadrants of the PCA biplot (Figure 5). Conversely, changes in attributes for corn meal with varying moisture content are less pronounced compared to those in wheat farina. Granulated sugar samples with 0.4% and 0.78% moisture contents display similar flow and shear properties, positioned closely within the same quadrant.
Principal component analysis, or PCA, has been found to be useful for understanding the flow properties of various food powders, including starches, flour, fruit powder, and coffee powder [35,36,37,38,39,40]. In this study as well, PCA was able to describe the differences in the granular flow properties of corn meal, wheat farina, and granulated sugar under different moisture regimens, and pointed to a higher sensitivity of wheat farina to moisture as compared to corn meal.
4. Conclusions
The FT4 rheometer has been used extensively in studying the flow differences in various powders [41,42,43,44]. It proved to be an effective tool for understanding the role of moisture in the flow behavior of corn meal, wheat farina, and granulated sugar. While granulated sugar would not be incorporated into systems that use moisture levels this low (0.06%), the results here show how differently a powder can behave based on its composition when exposed to changes in moisture content. Each of the three powders analyzed in this study behaved uniquely when all results were compiled—corn meal became more cohesive but free-flowing and more compressible; wheat farina became less compressible, more cohesive, and less free-flowing; and granulated sugar became more cohesive, more compressible, and less free-flowing. In addition to the interparticle and particle–wall forces interpreted in this work, the difference in caking properties may also be attributed to partial activation of the gluten matrix in wheat powders, further supporting the correlations found in this experiment.
The practical implications of this study lie in the critical considerations for industries employing food extrusion processes. Understanding how powders, such as corn meal, wheat farina, and granulated sugar, behave under varying moisture levels is essential for optimizing extrusion processing parameters. The findings highlight the need for precise control of moisture content during extrusion to balance thermal energy, prevent rapid cooking, and ensure proper flow, ultimately aiding industry practitioners in designing effective equipment and processes for achieving desired flow properties in food powders. The future research scope involves exploring temperature effects on flow behavior, which have been shown to be an important consideration for food powders such as flours and dairy powders [45,46,47]. It will provide comprehensive insights, enabling precise strategies for optimizing flow in extrusion food processing.
Author Contributions
Conceptualization, S.A.; methodology, C.M., K.A., and S.A.; formal analysis, C.M., S.C., and K.S.; investigation, C.M., S.A., and K.S.; resources, K.A. and S.A.; data curation, C.M., S.C., and K.S.; writing—original draft preparation, C.M. and S.C.; writing—review and editing, K.S. and S.A.; visualization, C.M.; supervision, K.A. and S.A.; project administration, S.A.; funding acquisition, S.A. All authors have read and agreed to the published version of the manuscript.
Funding
This research received no external funding.
Data Availability Statement
Data are contained within the article.
Acknowledgments
The authors would like to acknowledge Wenger Manufacturing, Inc. (Sabetha, KS) for their support of the Kansas State University Extrusion Lab and Eric Maichel for his assistance with the extrusion visualization studies.
Conflicts of Interest
The authors declare no conflicts of interest.
References
- Jung, H.; Lee, Y.J.; Yoon, W.B. Effect of Moisture Content on the Grinding Process and Powder Properties in Food: A Review. Processes 2018, 6, 69. [Google Scholar] [CrossRef]
- Campbell, C.S. Granular Material Flows–An Overview. Powder Technol. 2006, 162, 208–229. [Google Scholar] [CrossRef]
- Lumay, G.; Boschini, F.; Traina, K.; Bontempi, S.; Remy, J.C.; Cloots, R.; Vandewalle, N. Measuring the Flowing Properties of Powders and Grains. Powder Technol. 2012, 224, 19–27. [Google Scholar] [CrossRef]
- Stoklosa, A.M.; Lipasek, R.A.; Taylor, L.S.; Mauer, L.J. Effects of Storage Conditions, Formulation, and Particle Size on Moisture Sorption and Flowability of Powders: A Study of Deliquescent Ingredient Blends. Food Res. Int. 2012, 49, 783–791. [Google Scholar] [CrossRef]
- Fitzpatrick, J.J.; Barringer, S.A.; Iqbal, T. Flow Property Measurement of Food Powders and Sensitivity of JenikeÕs Hopper Design Methodology to the Measured Values. J. Food Eng. 2004, 61, 399–405. [Google Scholar] [CrossRef]
- Rabinovich, Y.I.; Esayanur, M.S.; Moudgil, B.M. Capillary Forces between Two Spheres with a Fixed Volume Liquid Bridge: Theory and Experiment. Langmuir 2005, 21, 10992–10997. [Google Scholar] [CrossRef]
- Jange, C.G.; Ambrose, R.P.K. Effect of Surface Compositional Difference on Powder Flow Properties. Powder Technol. 2019, 344, 363–372. [Google Scholar] [CrossRef]
- Faqih, A.M.N.; Mehrotra, A.; Hammond, S.V.; Muzzio, F.J. Effect of Moisture and Magnesium Stearate Concentration on Flow Properties of Cohesive Granular Materials. Int. J. Pharm. 2007, 336, 338–345. [Google Scholar] [CrossRef] [PubMed]
- McGuire, C.; Siliveru, K.; Ambrose, K.; Alavi, S. Food Powder Flow in Extrusion: Role of Particle Size and Composition. Processes 2022, 10, 178. [Google Scholar] [CrossRef]
- Geethambika, S.B.; Harthikote Veerendrasimha, V.S.; Prakash, A.K.; Pasagadi, A.S.; Franklin, M.E.E.; Ambrose, R.P.K.; Pushpadass, H.A. Effect of Moisture Content on Physical and Flow Properties of Milk-Millet Powders. J. Food Process Eng. 2022, 46, e14198. [Google Scholar] [CrossRef]
- Mitra, H.; Pushpadass, H.A.; Franklin, M.E.E.; Ambrose, R.P.K.; Ghoroi, C.; Battula, S.N. Influence of Moisture Content on the Flow Properties of Basundi Mix. Powder Technol. 2017, 312, 133–143. [Google Scholar] [CrossRef]
- Chinwan, D.; Castell-Perez, M.E. Effect of Conditioner and Moisture Content on Flowability of Yellow Cornmeal. Food Sci. Nutr. 2019, 7, 3261–3272. [Google Scholar] [CrossRef] [PubMed]
- Littlefield, B.; Fasina, O.O.; Shaw, J.; Adhikari, S.; Via, B. Physical and Flow Properties of Pecan Shells—Particle Size and Moisture Effects. Powder Technol. 2011, 212, 173–180. [Google Scholar] [CrossRef]
- Teunou, E.; Fitzpatrick, J.J.; Synnott, E.C. Characterization of Food Powder Flowability. J. Food Eng. 1999, 39, 31–37. [Google Scholar] [CrossRef]
- Opaliński, I.; Chutkowski, M.; Hassanpour, A. Rheology of Moist Food Powders as Affected by Moisture Content. Powder Technol. 2016, 294, 315–322. [Google Scholar] [CrossRef]
- Juarez-Enriquez, E.; Olivas, G.I.; Zamudio-Flores, P.B.; Ortega-Rivas, E.; Perez-Vega, S.; Sepulveda, D.R. Effect of Water Content on the Flowability of Hygroscopic Powders. J. Food Eng. 2017, 205, 12–17. [Google Scholar] [CrossRef]
- AOAC International. Official Methods of Analysis, 17th ed.; AOAC International: Gaithersburg, MD, USA, 2006. [Google Scholar]
- Freeman, R. Measuring the Flow Properties of Consolidated, Conditioned and Aerated Powders—A Comparative Study Using a Powder Rheometer and a Rotational Shear Cell. Powder Technol. 2007, 174, 25–33. [Google Scholar] [CrossRef]
- McGuire, C. Granular Flow Properties of Food Powders in Extrusion Processing. Master’s Thesis, Kansas State University, Manhattan, Kansas, 2017. [Google Scholar]
- Jenike, A.W. Gravity Flow of Bulk Solids. Bull. Univ. Utah 1961, 52, 1–322. [Google Scholar]
- Thomas, J.; Schubert, H. Particle Characterization. In Proceedings of the International Congress on Particle Technology, Nuremberg, Germany, 24–25 September 1979; pp. 301–319. [Google Scholar]
- Abu-hardan, M.; Hill, S.E. Handling Properties of Cereal Materials in the Presence of Moisture and Oil. Powder Technol. 2010, 198, 16–24. [Google Scholar] [CrossRef]
- Bian, Q.; Sittipod, S.; Garg, A.; Ambrose, R.P.K. Bulk Flow Properties of Hard and Soft Wheat Flours. J. Cereal Sci. 2015, 63, 88–94. [Google Scholar] [CrossRef]
- Landillon, V.; Cassan, D.; Morel, M.H.; Cuq, B. Flowability, Cohesive, and Granulation Properties of Wheat Powders. J. Food Eng. 2008, 86, 178–193. [Google Scholar] [CrossRef]
- Teunou, E.; Fitzpatrick, J.J. Effect of Storage Time and Consolidation on Food Powder Flowability. J. Food Eng. 2000, 43, 97–101. [Google Scholar] [CrossRef]
- Pushpadass, H.A.; Mitra, H.; Franklin, M.E.E.; Ghoroi, C.; Ambrose, R.P.K.; Battula, S.N. Physicochemical, Thermal, and Flow Properties of Ice Cream Powder as Influenced by Moisture Content. J. Food Process Preserv. 2021, 45, e15106. [Google Scholar] [CrossRef]
- Chang, K.S.; Kim, D.W.; Kim, S.S.; Jung, M.Y. Bulk Flow Properties of Model Food Powder at Different Water Activity. Int. J. Food Prop. 1998, 1, 45–55. [Google Scholar] [CrossRef]
- Palzer, S.; Sommer, K. Caking of Water-Soluble Amorphous and Crystalline Food Powders. In Food Engineering Series; Springer: Berlin, Germany, 2011. [Google Scholar]
- Jenike, A. Storage and Flow of Solids, Bulletin No. 123. Utah Eng. Exp. Stn. 1964, 53, 1–209. [Google Scholar]
- Leturia, M.; Benali, M.; Lagarde, S.; Ronga, I.; Saleh, K. Characterization of Flow Properties of Cohesive Powders: A Comparative Study of Traditional and New Testing Methods. Powder Technol. 2014, 253, 406–423. [Google Scholar] [CrossRef]
- Fournaise, T.; Burgain, J.; Perroud, C.; Scher, J.; Gaiani, C.; Petit, J. Impact of Formulation on Reconstitution and Flowability of Spray-Dried Milk Powders. Powder Technol. 2020, 372, 107–116. [Google Scholar] [CrossRef]
- Cheng, Z.; Gao, D.W.; Powers, F.M.; Navar, R.; Leal, J.H.; Ajayi, O.O.; Semelsberger, T.A. Effect of Moisture and Feedstock Variability on the Rheological Behavior of Corn Stover Particles. Front. Energy Res. 2022, 10, 868050. [Google Scholar] [CrossRef]
- Lu, Y.; Jin, W.; Klinger, J.L.; Dai, S. Effects of the Moisture Content on the Flow Behavior of Milled Woody Biomass. ACS Sustain. Chem. Eng. 2023, 11, 11482–11489. [Google Scholar] [CrossRef]
- King, C.J.; Downton, G.E.; Flores-Luna, J.L. Mechanism of Stickiness in Hygroscopic, Amorphous Powders. Ind. Eng. Chem. Fundam. 1982, 21, 447–451. [Google Scholar] [CrossRef]
- Orefice, L.; Remmelgas, J.; Neveu, A.; Francqui, F.; Khinast, J.G. A novel methodology for data analysis of dynamic angle of repose tests and powder flow classification. Powder Technol. 2024, 435, 119425. [Google Scholar] [CrossRef]
- Lever, J.; Krzywinski, M.; Altman, N. Points of significance: Principal component analysis. Nat. Methods 2017, 14, 641–642. [Google Scholar] [CrossRef]
- Türker, D.A.; Saraç, M.G.; Doğan, M. Powder flow speed dependency, caking and cohesion behaviors of tomato powders as affected by drying methods. Int. J. Food Eng. 2024. [Google Scholar] [CrossRef]
- Saha, S.; Sarkhel, S.; Sahoo, B.; Kumari, A.; Jha, S.; Mukherjee, A.; Biswas, D.; Saha, R.; Chatterjee, A.; Sarkar, B.; et al. Impact of fortificants on the powder properties of a gluten-free porous starch matrix of puffed rice flour. LWT 2023, 175, 114432. [Google Scholar] [CrossRef]
- Doğan, M.; Aslan, D.; Gürmeriç, V.; Özgür, A.; Saraç, M.G. Powder caking and cohesion behaviours of coffee powders as affected by roasting and particle sizes: Principal component analyses (PCA) for flow and bioactive properties. Powder Technol. 2019, 344, 222–232. [Google Scholar] [CrossRef]
- Razavi, S.M.; Tao, Y.; Scicolone, J.; Morker, T.; Cunningham, C.; Rajabi-Siahboomi, A.; Hausner, D.B.; Muzzio, F.J. Starch products as candidate excipients in a continuous direct compression line. J. Pharm. Innov. 2022, 17, 460–471. [Google Scholar] [CrossRef]
- Fitzpatrick, J.J. Food powder flowability. In Encapsulated and Powdered Foods; CRC Press: Boca Raton, USA, 2005; pp. 247–260. [Google Scholar]
- Shi, H.; Mohanty, R.; Chakravarty, S.; Cabiscol, R.; Morgeneyer, M.; Zetzener, H. Effect of particle size and cohesion on powder yielding and flow. KONA Powder Part. J. 2018, 35, 226–250. [Google Scholar] [CrossRef]
- Thomas, A.; Clayton, J. Stress distribution in a powder column under uniaxial compression. Powder Technol. 2022, 408, 117768. [Google Scholar] [CrossRef]
- Gnagne, E.H.; Petit, J.; Gaiani, C.; Scher, J.; Amani, G.N. Characterisation of flow properties of foutou and foutou flours, staple foods in West Africa, using the FT4 powder rheometer. J. Food Meas. Charact. 2017, 11, 1128–1136. [Google Scholar] [CrossRef]
- Iqbal, T.; Fitzpatrick, J.J. Effect of storage conditions on the wall friction characteristics of three food powders. J. Food Eng. 2006, 72, 273–280. [Google Scholar] [CrossRef]
- Teunou, E.; Fitzpatrick, J.J. Effect of Relative Humidity and Temperature on Food Powder Flowability. J. Food Eng. 1999, 42, 109–116. [Google Scholar] [CrossRef]
- Rennie, P.R.; Chen, X.D.; Hargreaves, C.; MacKereth, A.R. Study of the cohesion of dairy powders. J. Food Eng. 1999, 39, 277–284. [Google Scholar] [CrossRef]
Disclaimer/Publisher’s Note: The statements, opinions and data contained in all publications are solely those of the individual author(s) and contributor(s) and not of MDPI and/or the editor(s). MDPI and/or the editor(s) disclaim responsibility for any injury to people or property resulting from any ideas, methods, instructions or products referred to in the content. |
© 2024 by the authors. Licensee MDPI, Basel, Switzerland. This article is an open access article distributed under the terms and conditions of the Creative Commons Attribution (CC BY) license (https://creativecommons.org/licenses/by/4.0/).