Abstract
Kombucha is a traditional, fermented beverage made with an essential biomaterial known as SCOBY (symbiotic culture of bacteria and yeast). Three different tea types, namely black, green, and oolong, were compared in kombucha fermentation in terms of pH dynamics, the formation of SCOBY biomass, and the production of acetic acid. The rational, exponential, and polynomial models described pH dynamics with good fit, R2 > 0.98. The formation of SCOBY biomass and the production of acetic acid were modelled using sigmoidal functions, with three-parameter logistic and Gompertz models and four-parameter Boltzmann and Richards models. The F-test indicated that the three-parameter models were statistically adequate; thus, the Gompertz model was modified to present the biological meaning of the parameters. The SCOBY biomass formation rates ranged from 7.323 to 9.980 g/L-day, and the acetic acid production rates ranged from 0.047 to 0.049% acid (wt/vol)/day, with the highest values from the non-conventional substrate, oolong tea. The correlations between pH and SCOBY biomass or acetic acid using polynomial models enable the prediction of product formation in kombucha processing.
1. Introduction
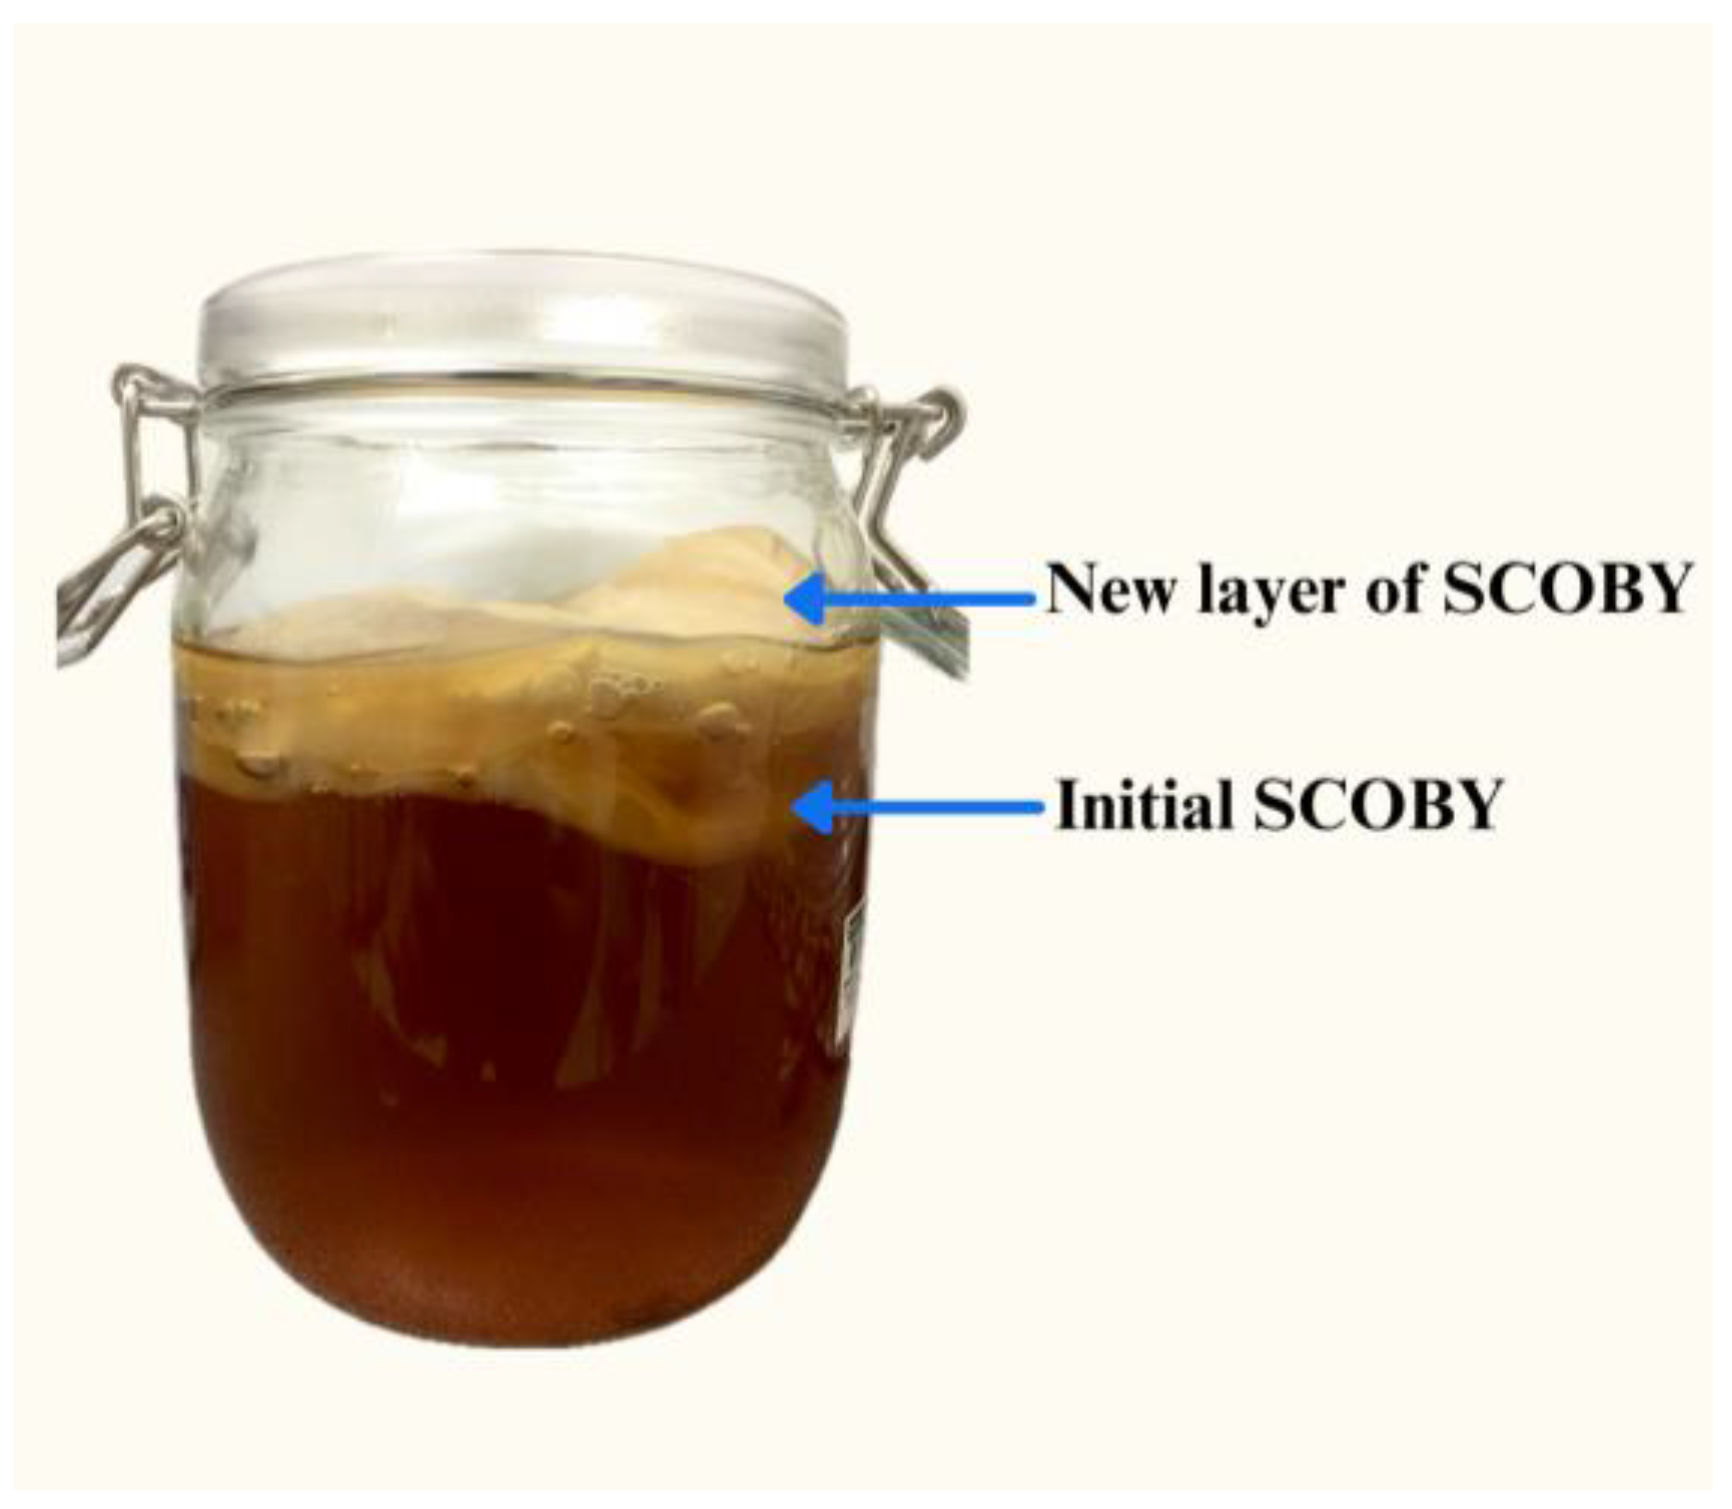
Kombucha is a slightly sweet, acidic, and carbonated fermented beverage which has been consumed since 220 B.C. [1]. The global market for kombucha has experienced substantial growth in recent years, with a compound annual growth rate (CAGR) of 15.4% from 2017 to 2023, reaching USD 3.4 billion in 2023, and is anticipated to reach 17.1 billion USD by 2033, with a projected CAGR of 17.4% [2]. The underlying causes that have been spurring the kombucha boom encompass its multitude of potential health benefits, with in vitro and in vivo evidence of its antimicrobial, antioxidant, antiproliferative, anti-inflammatory, and anti-carcinogenic properties, along with its ability to improve intestinal microbiota, regulate nutrient absorption, supply energy, detoxify the body, boost the immune system, and aid in weight loss [1,3,4,5,6,7]. This is associated with the presence of phenolic compounds from tea, organic acids, vitamins, and microbial enzymes produced during fermentation [8,9]. The fermentation process begins with the infusion of sweetened black tea, followed by the incorporation of a biomass cellulose pellicle known as ‘SCOBY’, a symbiotic culture of bacteria and yeast [10]. This is often accompanied by the addition of starter tea, which is previously fermented kombucha, serving to create an acidified environment conducive to SCOBY growth and prevent potential contaminants [11]. SCOBY is a three-dimensional zoogleal mat with a yellow–brown appearance that consists of acetic acid bacteria (AAB) and osmophilic yeast in a mutually beneficial symbiotic relationship [12,13]. The microbial composition of AAB commonly includes species belonging to Acetobacter (A. aceti, A. pasteurianus, A. nitrogenifigens), Gluconobacter (G. oxydans), Gluconacetobacter (G. sacchari), and Komagataeibacter (K. xylinus, K. kombuchae, K. europaeus, K. rhaeticus, K. saccharivorans), while the yeast population typically includes strains of Schizosaccharomyces (S. pombe), Zygosaccharomyces (Z. bailii, Z. lentus, Z. bisporus, Z. rouxii, Z. kombuchaensis), Saccharomyces (S. cerevisiae), Dekkera, Brettanomyces (B. bruxellensis, B. anomalus), Candida, Kluyveromyces, and Pichia [8,14]. During fermentation, which usually takes place for a duration of 7–10 days at temperatures ranging from 18 to 30 °C [1], the combined action of AAB and yeast leads to both SCOBY biomass formation (Figure 1) and acid production [7]. The resulting acid contributes to the distinct flavour, aroma, and quality of kombucha, while SCOBY formation serves essential roles in propagating and improving the fermentation efficiency. The pH value acts as a key determinant in shaping these processes and the resulting characteristics of the product as it primarily favours the selective growth of specific microorganisms, regulates their activity, and affects their metabolic pathways [6,15]. Hence, it is a standard practice to assess the completion of kombucha fermentation by pH measurement [16] and to ensure it falls within the recommended range of 2.5–4.2, as established by food guidelines [17,18,19], in accordance with the Food and Drug Administration (FDA) Food Code Model [20], Pennsylvania Department of Agriculture (USA) [17], Centre of Disease Control of British Columbia (BCCDC) plan [21], and Normative Instruction (IN), Brazil [22].
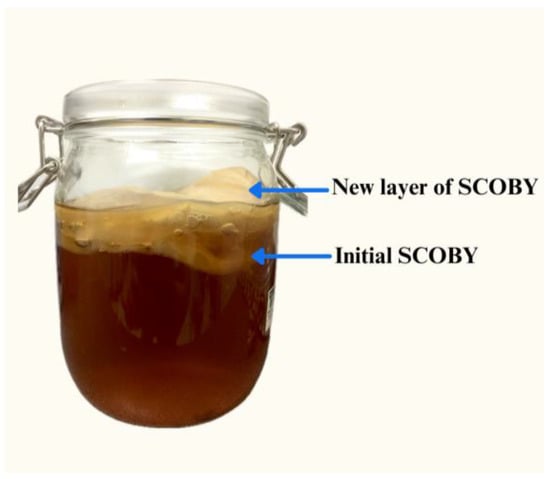
Figure 1.
Formation of SCOBY biomass during kombucha fermentation.
The outcome of kombucha fermentation is subject to the influence of numerous factors, which include variables such as the nature and composition of substrates, temperature, fermentation time, and microbial composition [7,14]. The choice of substrates—sugar as the primary source of carbon and tea as the primary source of nitrogen—influences the product yield during kombucha fermentation [12]. While research has examined the impact of various types and concentrations of carbon substrates, such as sucrose [23], molasses [24], glucose [25], brown sugar [26], white refined sugar, coconut palm sugar, and molasses [27], on key properties of kombucha fermentation, those that focus on the influence of nitrogen sources from different tea types are not known. Tea originates from a tea plant or tea shrub, Camellia sinensis (L.) Kuntze. The beverage can be produced from its leaves and buds [28,29]. Teas are classified as completely fermented (black tea), partially fermented (oolong tea), and non-fermented (green tea), which results in different compositions [29,30,31] in terms of polyphenols, amino acids, caffeine, volatile compounds, and minerals [17], which plausibly affect the microbial community and impact the product formation of kombucha fermentation [32]. For instance, certain phenolic compounds such as catechin and gallic acid have been studied for their ability to stimulate bacterial growth, which could eventually affect the fermentation outcomes [33,34,35]. Among the different tea types, kombucha has been traditionally made using black tea as it is claimed to be a good fermentation medium [36]. As green tea and oolong tea have been demonstrated to possess higher levels of catechins, total polyphenolic content, and antioxidant activity, as well as greater efficacy in inhibiting pathogenic bacteria compared to black tea [37], these two teas may be a great alternative to black tea in kombucha production.
The modelling of kombucha fermentation enables closer monitoring of the fermentation dynamics during the production process. It also offers opportunities to enhance kombucha fermentation through a better understanding of changes in substrate composition and the quality of the final product. It helps to improve resource utilisation and provide information on microbiota functions and progression under various conditions [38]. The models enable better control of the fermentation factors and assist in process scale-up, process optimisation, and the prediction of fermentation outcomes. For example, modelling techniques have been applied to understand the changes in lactose during milk fermentation by kombucha starter [39], for scale-up of the kombucha fermentation process [40,41], to optimise the liquid fermentation process via cell growth improvement and SCOBY production [42], and to predict the substrate consumption and metabolite production rates in kombucha fermentation using fruit and herbal teas [43]. The widespread utilisation of modelling in numerous research studies shows the growing importance of modelling. Predictive modelling represents a promising area of food fermentation. The sigmoidal models are examples of predictive models that introduce varying degrees of parameter complexity and are commonly used to describe nonlinear relationships within data. For example, the logistic and Gompertz models feature three parameters, while the Boltzmann and Richards models are characterised by four parameters. Models that are capable of interpreting data with biological meaning are exceptionally helpful [44].
With fermented tea and SCOBY biomass emerging to have wider applications beyond food [45,46,47,48], such as in the cosmetic and dermopharmaceutical [49], textile and fashion [50,51], electronic [52], bioelectronics [53], and biomedical industries [54,55], the kombucha fermentation process has received much attention and is in growing demand. This research aimed to model kombucha fermentation using different tea types, namely black, green, and oolong, through measuring pH dynamics, the formation of SCOBY biomass, and the production of acetic acid, and by investigating the relationships between them.
2. Materials and Methods
2.1. Materials
Black tea (Yellow Label Tea, Lipton, Unilever, Bekasi, Indonesia), green tea (Pure Green Tea, Lipton, Unilever, Hefei, China), oolong tea (Legend of Tea, Ipoh, Malaysia), and food-grade fine granulated sugar (Gula Prai, Malayan Sugar Manufacturing Company Berhad, Seberang Perai, Malaysia) were used in kombucha fermentation. SCOBY and starter tea were obtained from a local commercial source (Herbal Remedies, George Town, Malaysia). All chemicals used were of analytical grade.
2.2. Preparation of Kombucha
The kombucha fermentation process was adopted as described in previous studies with slight modifications [23,56], using clean and sanitised utensils to adhere to stringent standards of hygienic conditions. An amount of 1 L of water was heated, and 9% (w/v) sugar was added. After the sugar dissolved totally, 0.6% (w/v) tea leaves were incorporated and steeped for 10 min. After removing the tea leaves, the solution was cooled to room temperature (29 °C). SCOBY (3% w/v on a wet weight basis) and starter tea (10% v/v) with pH 2.7 were added to the cooled tea. The beaker was then covered with a clean paper towel secured by a rubber band. The fermentation process was conducted in triplicates over a period of 10 days in a dark environment at a room temperature of 29 °C, where the pH of the fermenting solution was regularly measured using a pH meter (Milwaukee MW-101, Milwaukee Instruments, Rocky Mount, NC, USA) calibrated at pH 4.0 and 7.0.
2.3. Analytical Techniques
SCOBY biomass measurement was performed through regular harvesting. After carefully removing the pellicle of SCOBY formed on the tea’s surface, excess moisture was eliminated using paper towels, and the wet weight of SCOBY was recorded, which was expressed in g/L [57,58]. The SCOBY biomass formation was determined by calculating the difference in wet weight before and after the harvesting period.
For acetic acid analysis, 10 mL of sample was extracted daily from the fermentation mixture. The amount of acetic acid was measured by acid-base titration method, with 0.1 M NaOH using phenolphthalein as an indicator [56,57]. The acetic acid concentration was calculated by subtracting the initial acidity from the acidity measurements throughout the fermentation process. The acidity in the fermented kombucha tea was expressed as percent acetic acid using the formula [59]:
where N is the normality of titrant, NaOH (mEq/mL), V1 is the volume of titrant (mL), Eq. wt. is the equivalent weight of predominant acid (60.05 mg/mEq), V2 is the volume of sample (mL), and 1000 is the factor relating mg to g (mg/g).
2.4. Modelling Study
Table 1 shows all equations used for modelling as a function of time. pH dynamics were modelled using the exponential, polynomial, and rational equations, while SCOBY biomass formation and acetic acid production were modelled using sigmoidal functions, i.e., the logistic, Gompertz, Boltzmann, and Richards equations. All models were fitted by applying the generalised reduced gradient (GRG2) nonlinear optimisation algorithm using solver function in Microsoft Office Excel 365 (Microsoft Corporation, Redmond, WA, USA), with the parameters estimated by minimisation of sum of quadratic differences between observed and model-predicted values to determine the coefficients, including those in the modified Gompertz model [60]. The coefficient of determination (R2) and residual sum of squares (RSS) between predicted and experimental data were calculated to assess the fitness of the models.

Table 1.
Equations used in mathematical modelling against time.
The model fitting performance was compared and validated for SCOBY biomass formation and acetic acid production using the F-test to test if additional parameter does improve modelling fitting significantly [44,64,65]. The lowest RSS values were from the Boltzmann model. Hence, it was used as reference RSS1, while RSS2 are those from the three-parameter models to calculate the F-values:
tested against ,
DF1 represents the number of degrees of freedom, where, in the Boltzmann model, n − 4, and DF2 is from the three-parameter models, n − 3.
The Gompertz model (3) was modified to develop an expression for the biological parameters following [44].
To obtain the inflection point of the curve, the second derivative is calculated:
At the inflection point, where , the second derivative (5) is equal to zero:
By substituting, the specific formation/production rate, denoted as, is derived by calculating the first derivative (4) at the inflection point:
From Equation (7), the parameter in the Gompertz equation is written as:
The description of the tangent line through the inflection point is:
The lag phase duration, λ, is defined as the t-axis intercept of the tangent through the inflection point:
Using Equations (6), (7), and (10) yields:
From Equations (8) and (11), the parameter in the Gompertz equation is written as:
The asymptotic value is reached for t approaching infinity:
The parameter in the Gompertz equation is substituted by A, yielding the modified Gompertz equation:
where y is the amount of SCOBY biomass (g/L) or acetic acid (% acid (wt/vol)) at time t, A is the upper asymptote value, is the specific formation rate of SCOBY (g/L-day) or specific production rate of acetic acid (% acid (wt/vol)/day), λ is the lag phase duration (days), and t is the time (days).
Finally, data on the tea type for kombucha fermentation in terms of SCOBY biomass formation and acetic acid production and their correlations with pH dynamics were developed for prediction purposes using nonlinear regression approach of third order polynomial equation.
3. Results and Discussion
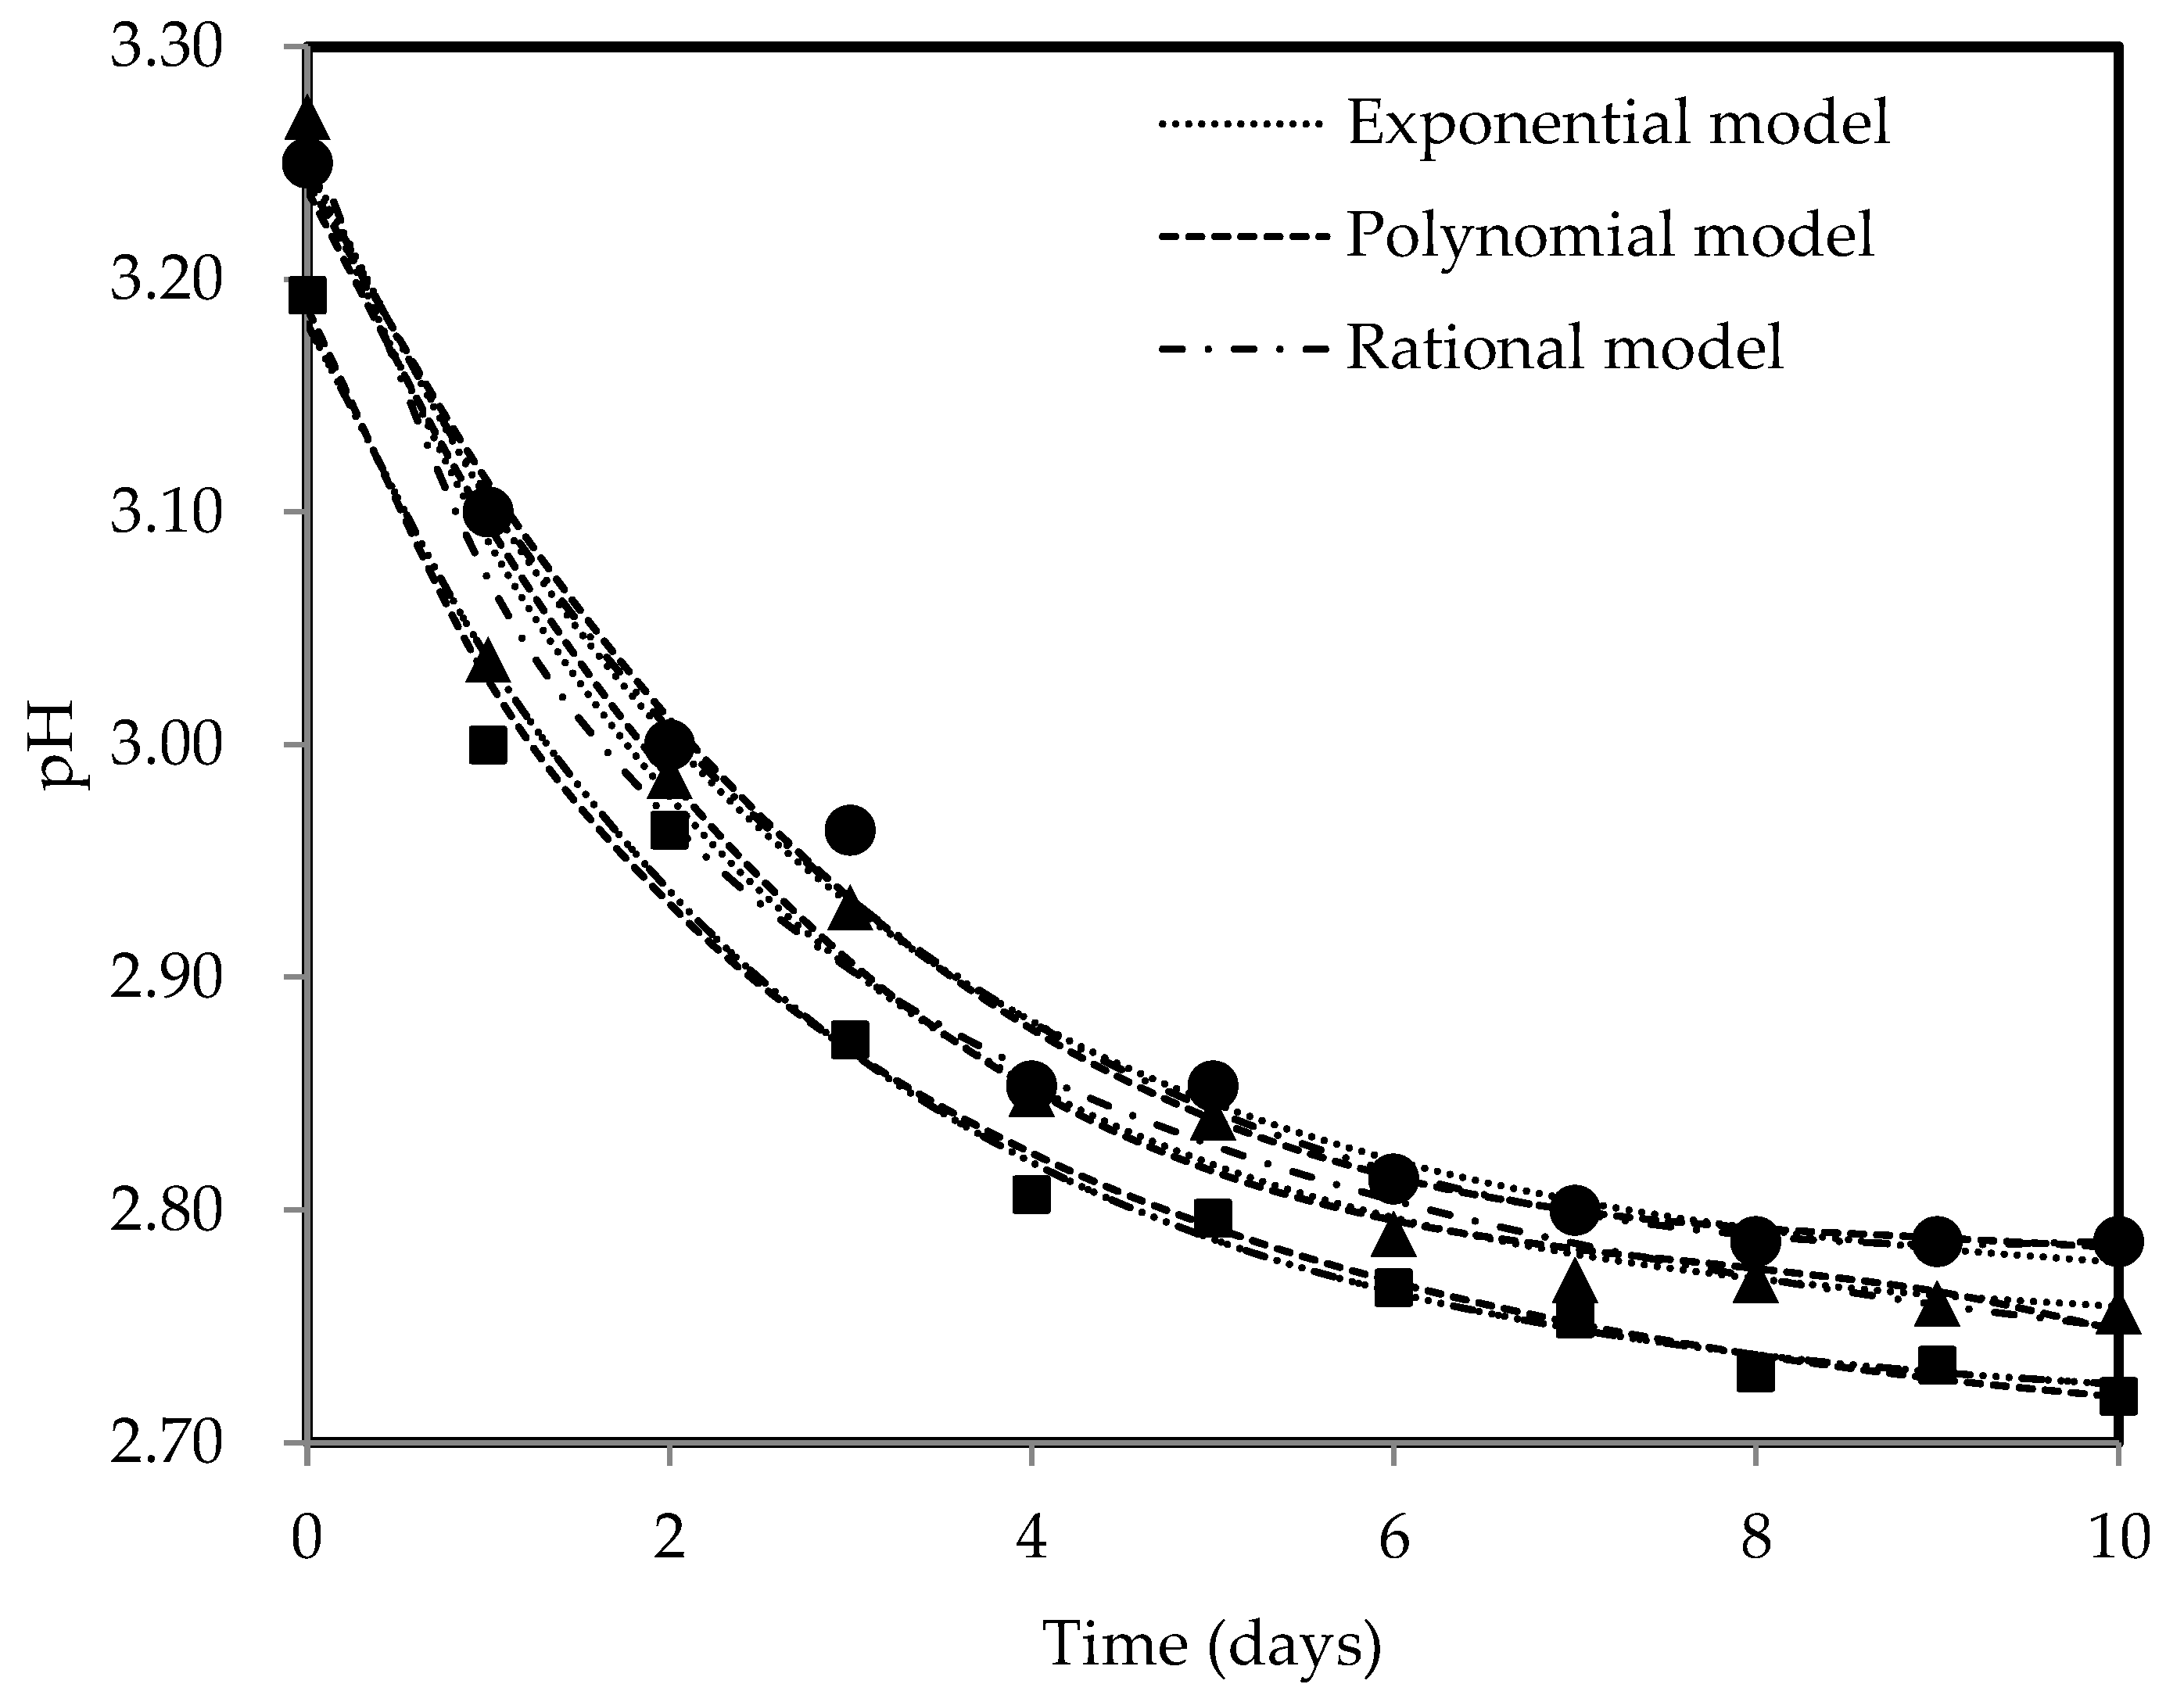
Figure 2 displays the pH profiles of kombucha fermentation using three different tea types, measured throughout the fermentation period of 10 days. The pH dynamics observed during kombucha fermentation with black, green, and oolong teas were the same, with pH levels dropping from 3.19–3.27 to 2.72–2.79. The pH decreased drastically at the beginning phase of fermentation, which is consistent with the observations of other authors [66,67], showing a pH drop between 0.29 and 0.32 units over the first three days of fermentation. The availability of nutrients stimulates the metabolic activity of microorganisms in SCOBY, resulting in higher acid production as they convert nutrients in the substrates [26]. The fermentable sucrose is rapidly used by yeast, where it is broken down into glucose and fructose. Subsequently, these simple sugars are further metabolised into organic acids by AAB, thereby contributing to the higher acid production and lower pH. However, as fermentation proceeds, the pH change becomes less drastic, with a decrease in pH levels of 0.06–0.08 units observed from day 4 to day 8, showing a decreasing rate of acid production. A slower pH drop may be related to the buffer effect arising from the reactions between synthesised organic acids and minerals from the substrate [24,68]. The decreasing trend of pH approached a straight line, indicating a more stable pH level and suggesting the completion of the fermentation process. Oolong tea kombucha consistently exhibited the lowest pH trend based on Figure 2, reaching a final pH value of 2.72, implying that it undergoes a more pronounced and extensive fermentation process, resulting in a greater amount of generated acid compared to other types of tea. The higher acidity can impart a tangier or sharper taste profile to the final product. The reduction in pH throughout fermentation is beneficial, particularly for polyphenols, which are known to be pH-sensitive, as it helps in preventing their chemical degradation [69,70]. Lower pH levels (pH 3 and below) provide higher stability for catechins [71], which contributes to their preservation and potential health benefits. It was stated that the beneficial properties of kombucha are primarily due to its acidic composition [72]. The acidic environment (pH < 4.5) is also vital for microbiological safety as it stops or severely curtails the growth of pathogenic microorganisms [19]. All kombucha samples maintained pH ranging from 2.5 to 4.2, which was within the acceptable levels, throughout a 10-day fermentation period [17,18,19], thus supporting the duration of fermentation chosen in terms of suitability and adequacy. Prolonged fermentation could lead to the excessive acidification of the fermented tea due to the continuous metabolism of AAB, which could compromise the health-promoting properties of fermented tea and potentially have detrimental effects on consumers’ health [73]. Exponential, polynomial, and rational models were used to describe pH dynamics because these models offer high flexibility and are capable of accommodating a vast variety of patterns [74]. All mathematical models have described pH trends against time effectively with R2 > 0.98, specifically the rational model with the highest R2 values of 0.99. The R2 values greater than 0.90 from the fitting of the mathematical models show that the models selected are suitable in explaining high fractions of total variation [65,75], i.e., whereby the responses are well explained by the factors such that their relationship is strong. The estimated coefficients are listed in Table 2.

Figure 2.
pH profiles for black (●), green (▲), and oolong (■) tea kombucha fermentation with exponential, polynomial, and rational models.
Table 2.
Estimated parameters for exponential, polynomial, and rational models of pH dynamics of different kombucha teas.
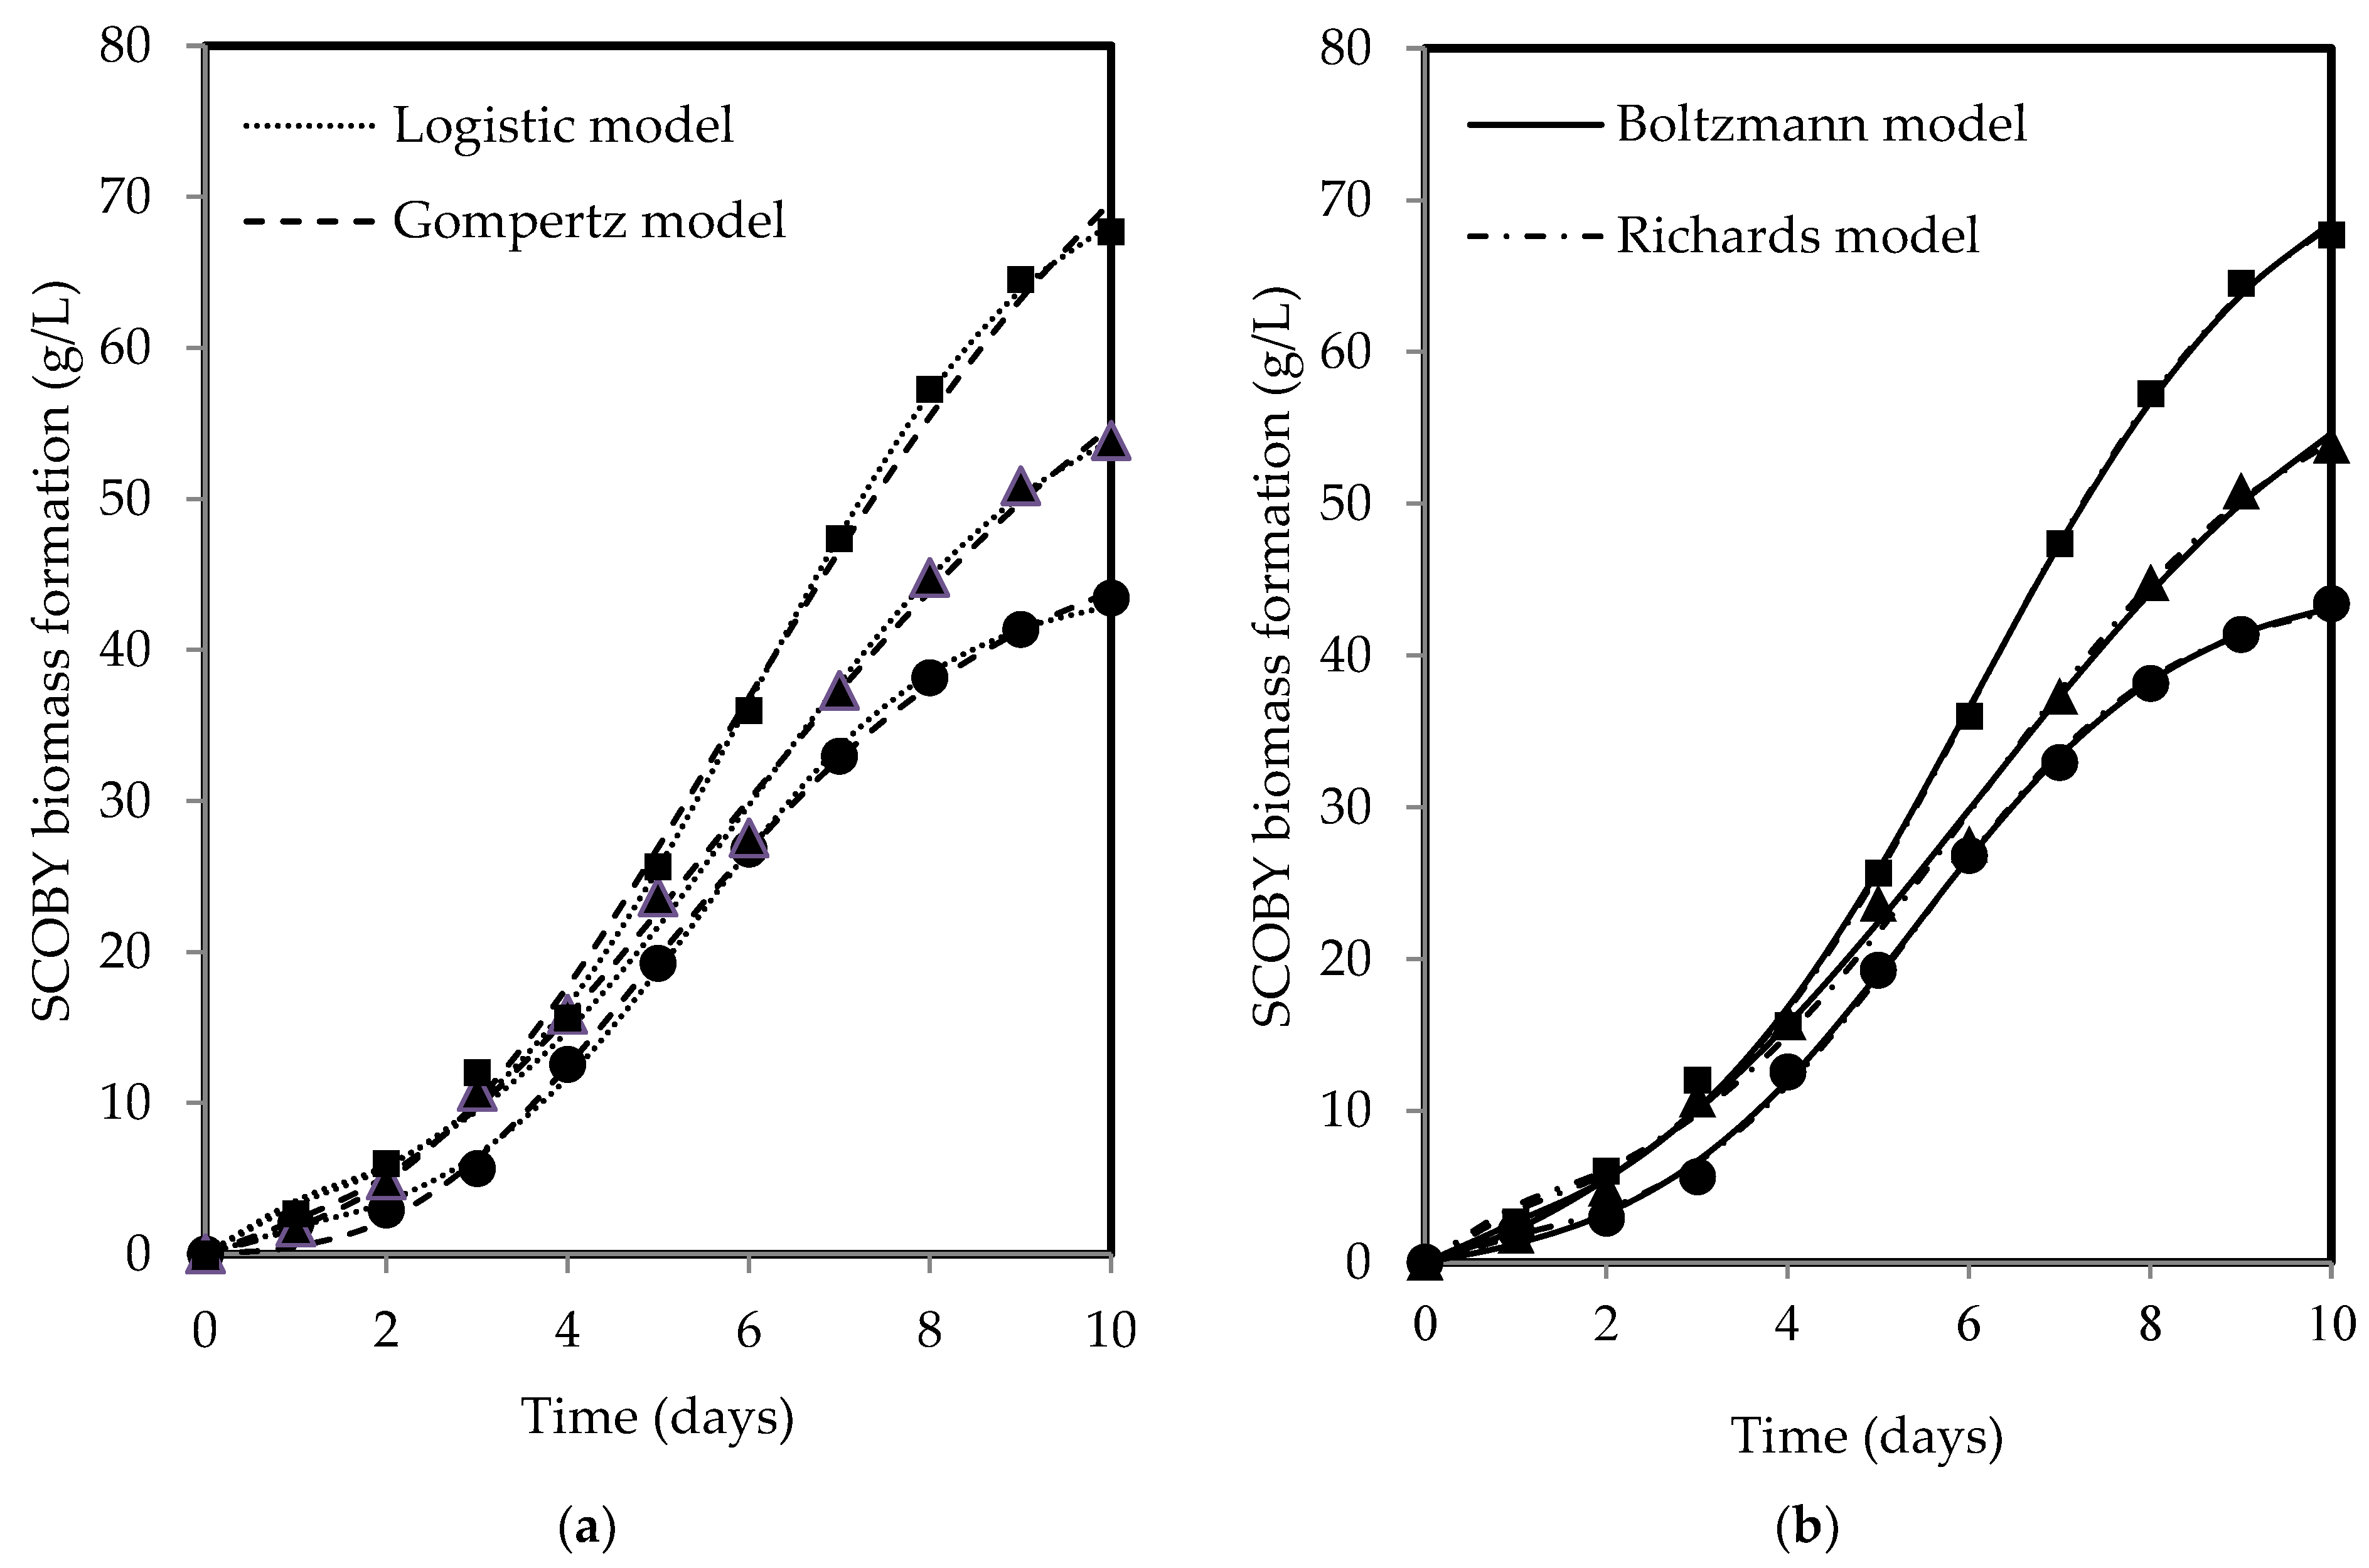
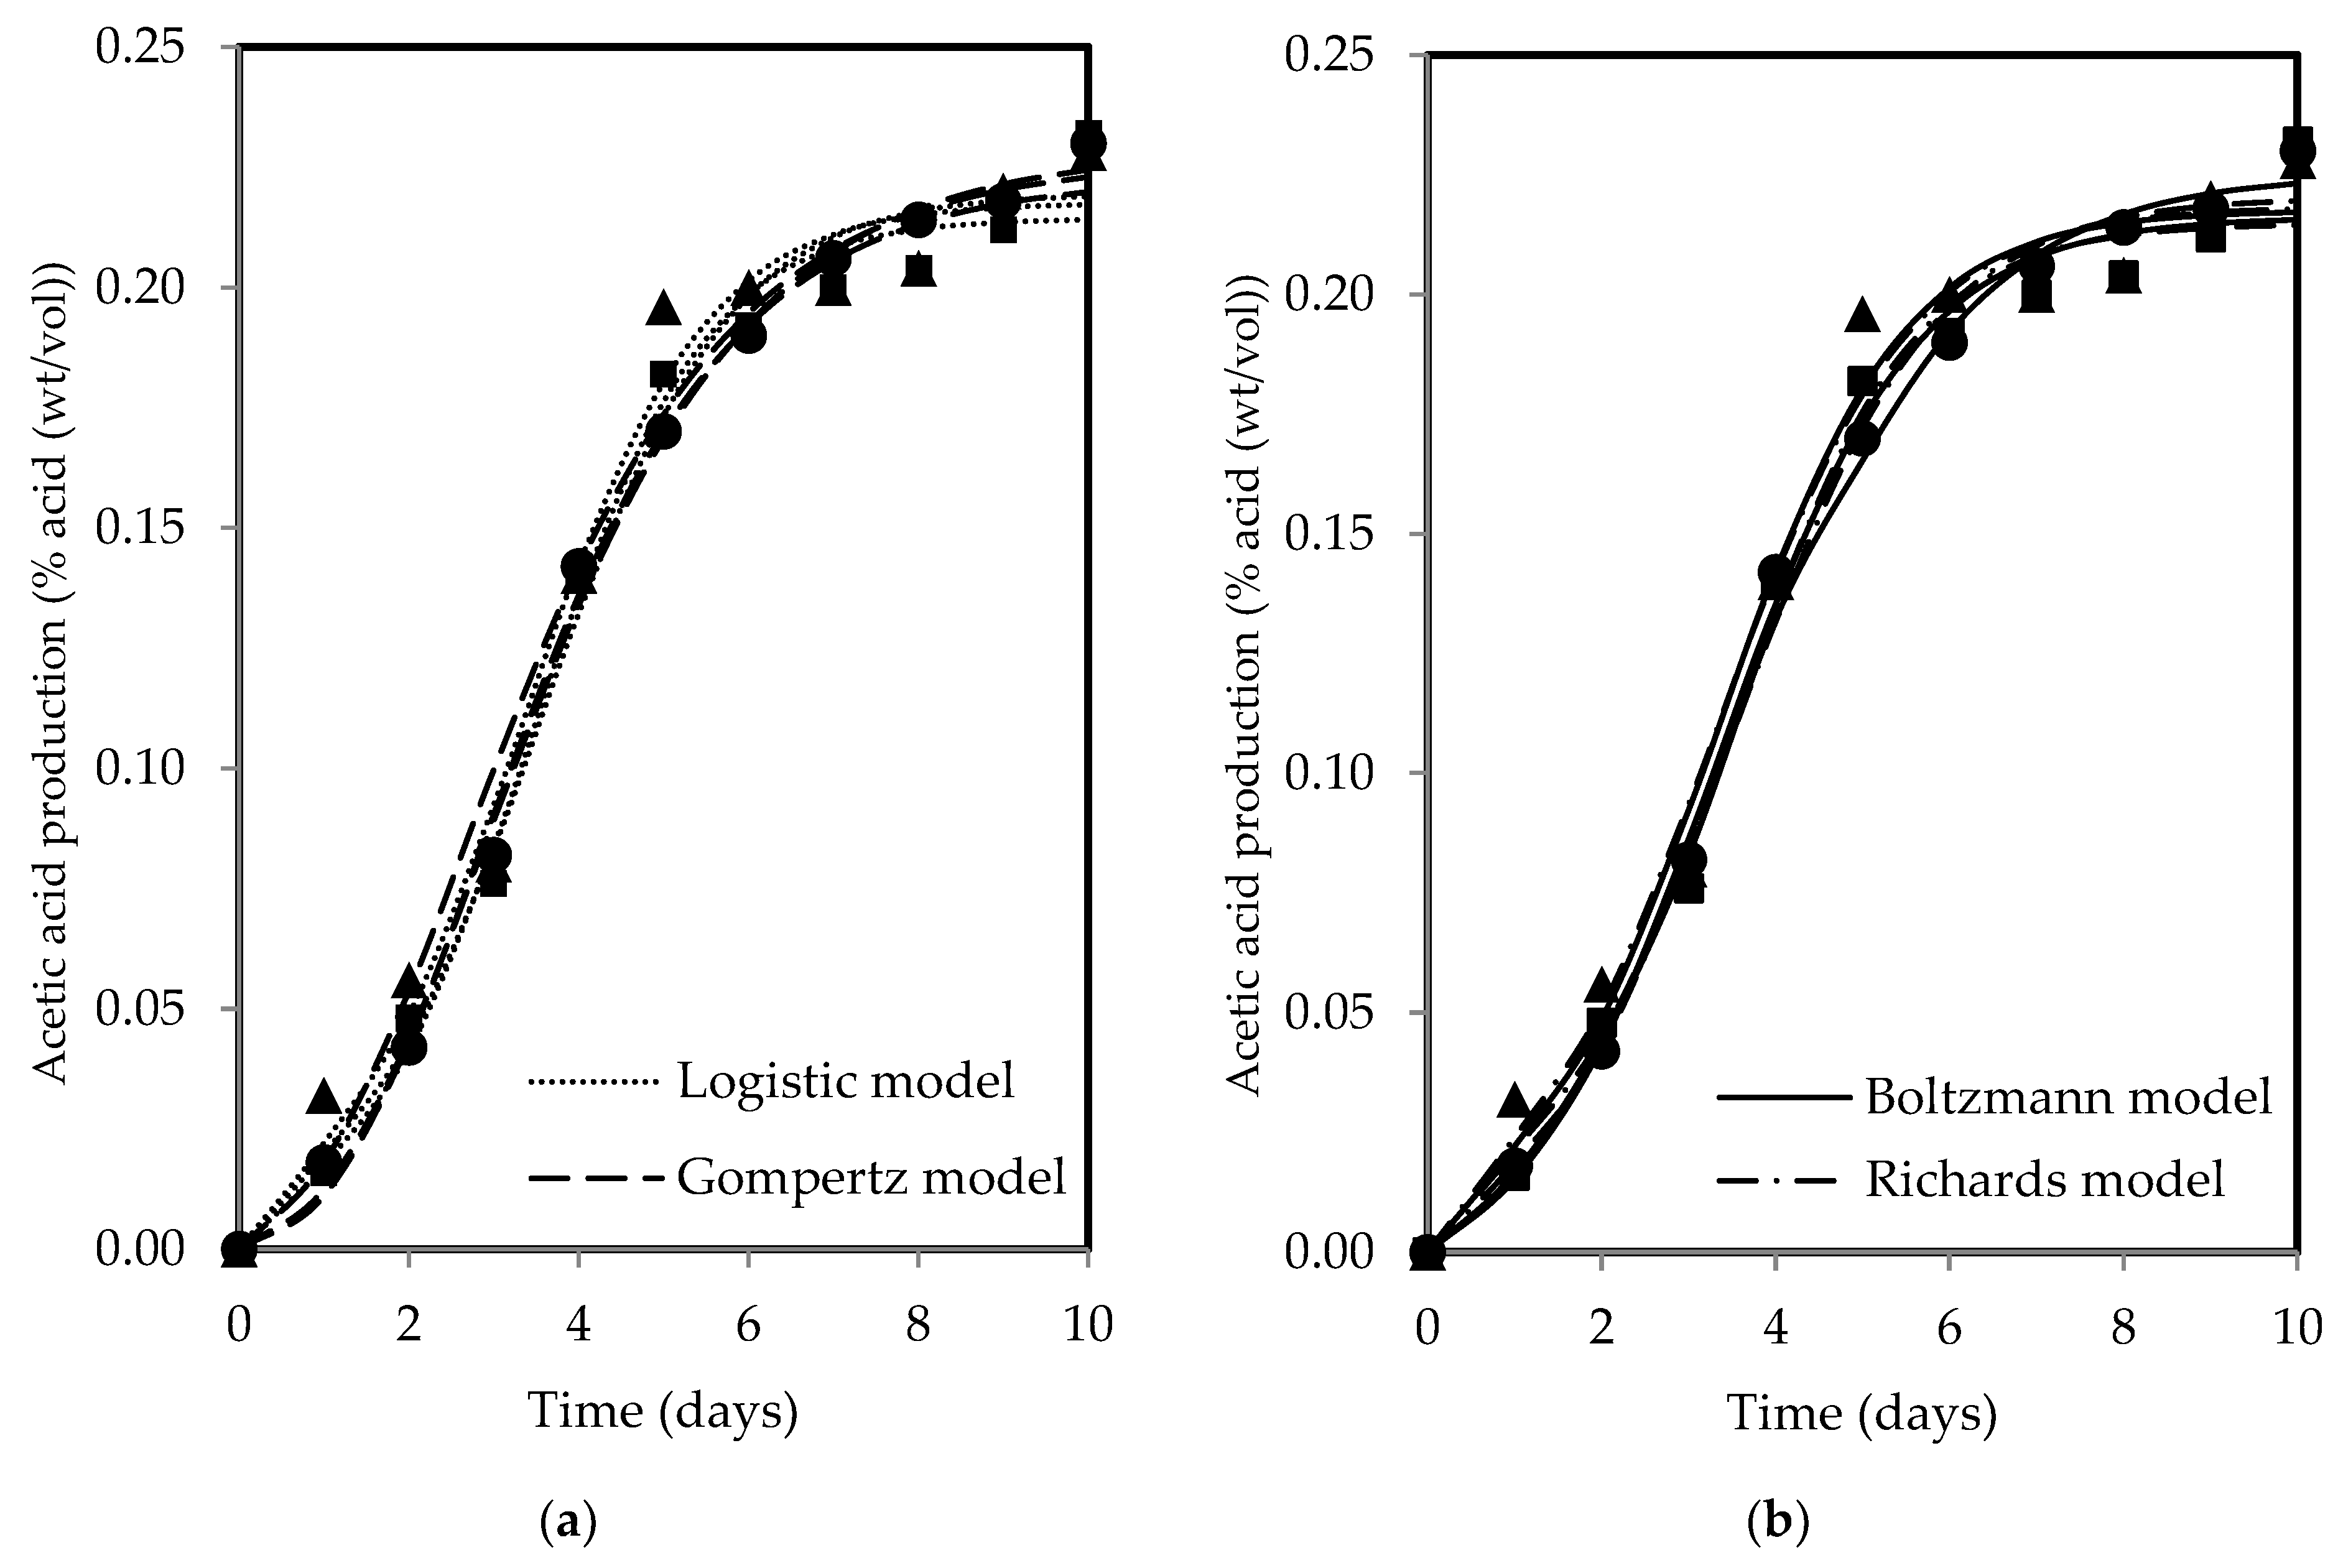
The changes in SCOBY biomass and acetic acid show a sigmoidal pattern over time, with both products increasing with fermentation period for all tea types. Figure 3 and Figure 4 present the fitted models of SCOBY biomass formation and acetic acid production, with reasonably good fits of R2 and RSS values reported in Table 3. The R2 values higher than 0.90 indicated that the models used are reliable for data prediction purposes when describing process and product changes. The three-parameter models (Gompertz and logistic models) yielded higher RSS values in comparison to the four-parameter models (Boltzmann and Richards models). The measurement error for the computation of F-values using the lowest RSS values from the Boltzmann model showed statistical validation of the F-ratio test accepting the null hypothesis, H0, where the addition of an extra parameter did not significantly improve model fitting, as presented in Table 4′s calculated F-values, which were lower than the F-table value. As such, the three-parameter models, which are simpler, were accepted, adhering to the principle of Occam’s razor, favouring a simpler model with acceptable fit [76]. Both Erkmen and Alben [64] and Zwietering et al. [44] recommended a three-parameter model over a four-parameter model due to its simplicity, ease of use, greater stability, and higher degree of freedom in the estimates, which is particularly essential when analysing growth curves with limited measured points. Specifically, the three-parameter model can be interpreted to give a biological meaning to its parameters as compared to the four-parameter model, which presents a challenge in terms of explaining the fourth parameter, a shape parameter, biologically [44,64].
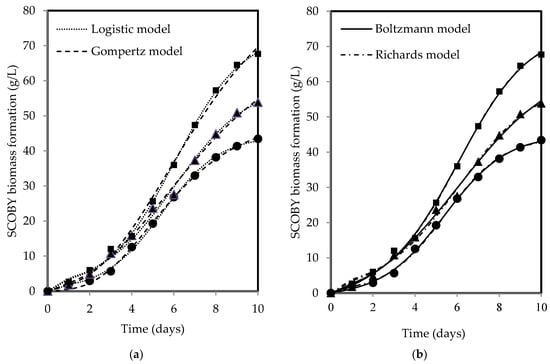
Figure 3.
(a) The logistic and Gompertz and (b) Boltzmann and Richards models fitted to describe SCOBY biomass formation during kombucha fermentation using black (●), green (▲), and oolong (■) teas.
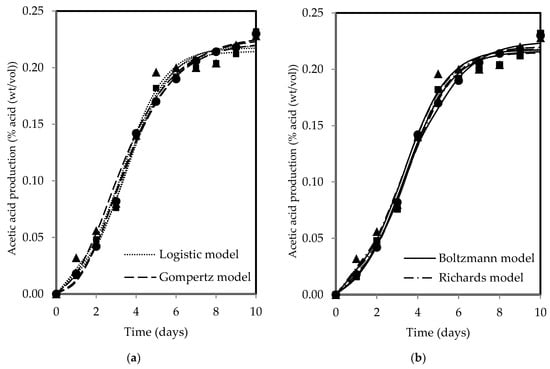
Figure 4.
(a) The logistic and Gompertz and (b) Boltzmann and Richards models fitted to describe acetic acid production during kombucha fermentation using black (●), green (▲), and oolong (■) teas.
Table 3.
R2 and RSS values from models fitting for SCOBY biomass formation and acetic acid production for three tea types of kombucha fermentation.
Table 4.
F-values of the models.
The Gompertz model was modified to ensure its parameters are biologically meaningful, making it more informative. Table 5 shows the values of the biological parameters determined from fitting of the modified Gompertz model. The type of tea exerted an influence on the resultant products, highlighting its role as an essential nutrient supply in kombucha fermentation. This is particularly pivotal as SCOBY cannot produce adequate cellulose independently [12] while also crucially modulating the metabolic activities for acid production. Using black, green, and oolong teas, the formation rates of SCOBY biomass and the production rates of acetic acid in kombucha fermentation were 7.323–9.980 g/L-day and 0.047–0.049% acid (wt/vol)/day, respectively. The oolong tea kombucha exhibited the highest levels of both SCOBY biomass formation and acetic acid production rates when compared to the black and green teas. This suggests that the fermentation process with oolong tea was more effective, as higher product formation rates not only serve as a key indicator of fermentation progress but also reflect a more conducive microbial environment for efficient metabolic processes. This is because microorganisms function most effectively only when they are provided with the right and optimal conditions, such as available nutrient content, appropriate pH, and favourable temperatures for metabolising their substrates [77]. However, the exact reasons for deviations in fermentation dynamics among different tea types remain unclear because of the complexity of compounds such as polyphenols and their biotransformation, which resemble a metabolic labyrinth driven by microorganisms [78,79]. The microbes responsible for SCOBY biomass formation include Komagataeibacter xylinus, Komagataeibacter rhaeticus, and Komagataeibacter hansenii [47,80], while acid production is attributed to AAB and yeasts such as Brettanomyces bruxellensis and Zygosaccharomyces bailii [81].
Table 5.
Parameters of modified Gompertz model: SCOBY biomass formation and acetic acid production rate (, lag phase duration (), and upper asymptote value (A).
Unlike the Gompertz model, the modified Gompertz model presented parameters which can be linked to the physical process, such as representing the formation and production rates of products when describing the growth dynamics of the kombucha fermentation process. This is especially valuable in light of the increasing demand for SCOBY biomass in various industries and the critical role of acid production in flavour development, safety, and quality control. SCOBY biomass has received growing interest beyond kombucha fermentation because of its unique qualities of microfibrillar nanostructure, high mechanical strength, high elasticity, thermal stability, excellent biological affinity, high liquid absorption capacity, biodegradability, high crystallinity, and high degree of polymerisation [82,83,84,85], all of which are highly valuable for industrial applications. Unlike plant cellulose, SCOBY biomass does not require extensive pre-treatment as it contains cellulose, which does not have lignin, hemicellulose, pectin, arabinose, and other plant-derived components [82,85,86]. The purification of plant cellulose requires the use of chemicals such as sodium hydroxide and sulfuric acid which increase biological oxygen demand (BOD) and chemical oxygen demand (COD) in aquatic ecosystems, contributing to environmental pollution [82,86]. Hence, promoting the productivity of SCOBY biomass is helpful in offering an environmentally friendly, sustainable, and renewable alternative while also tapping into the potential for additional profits.
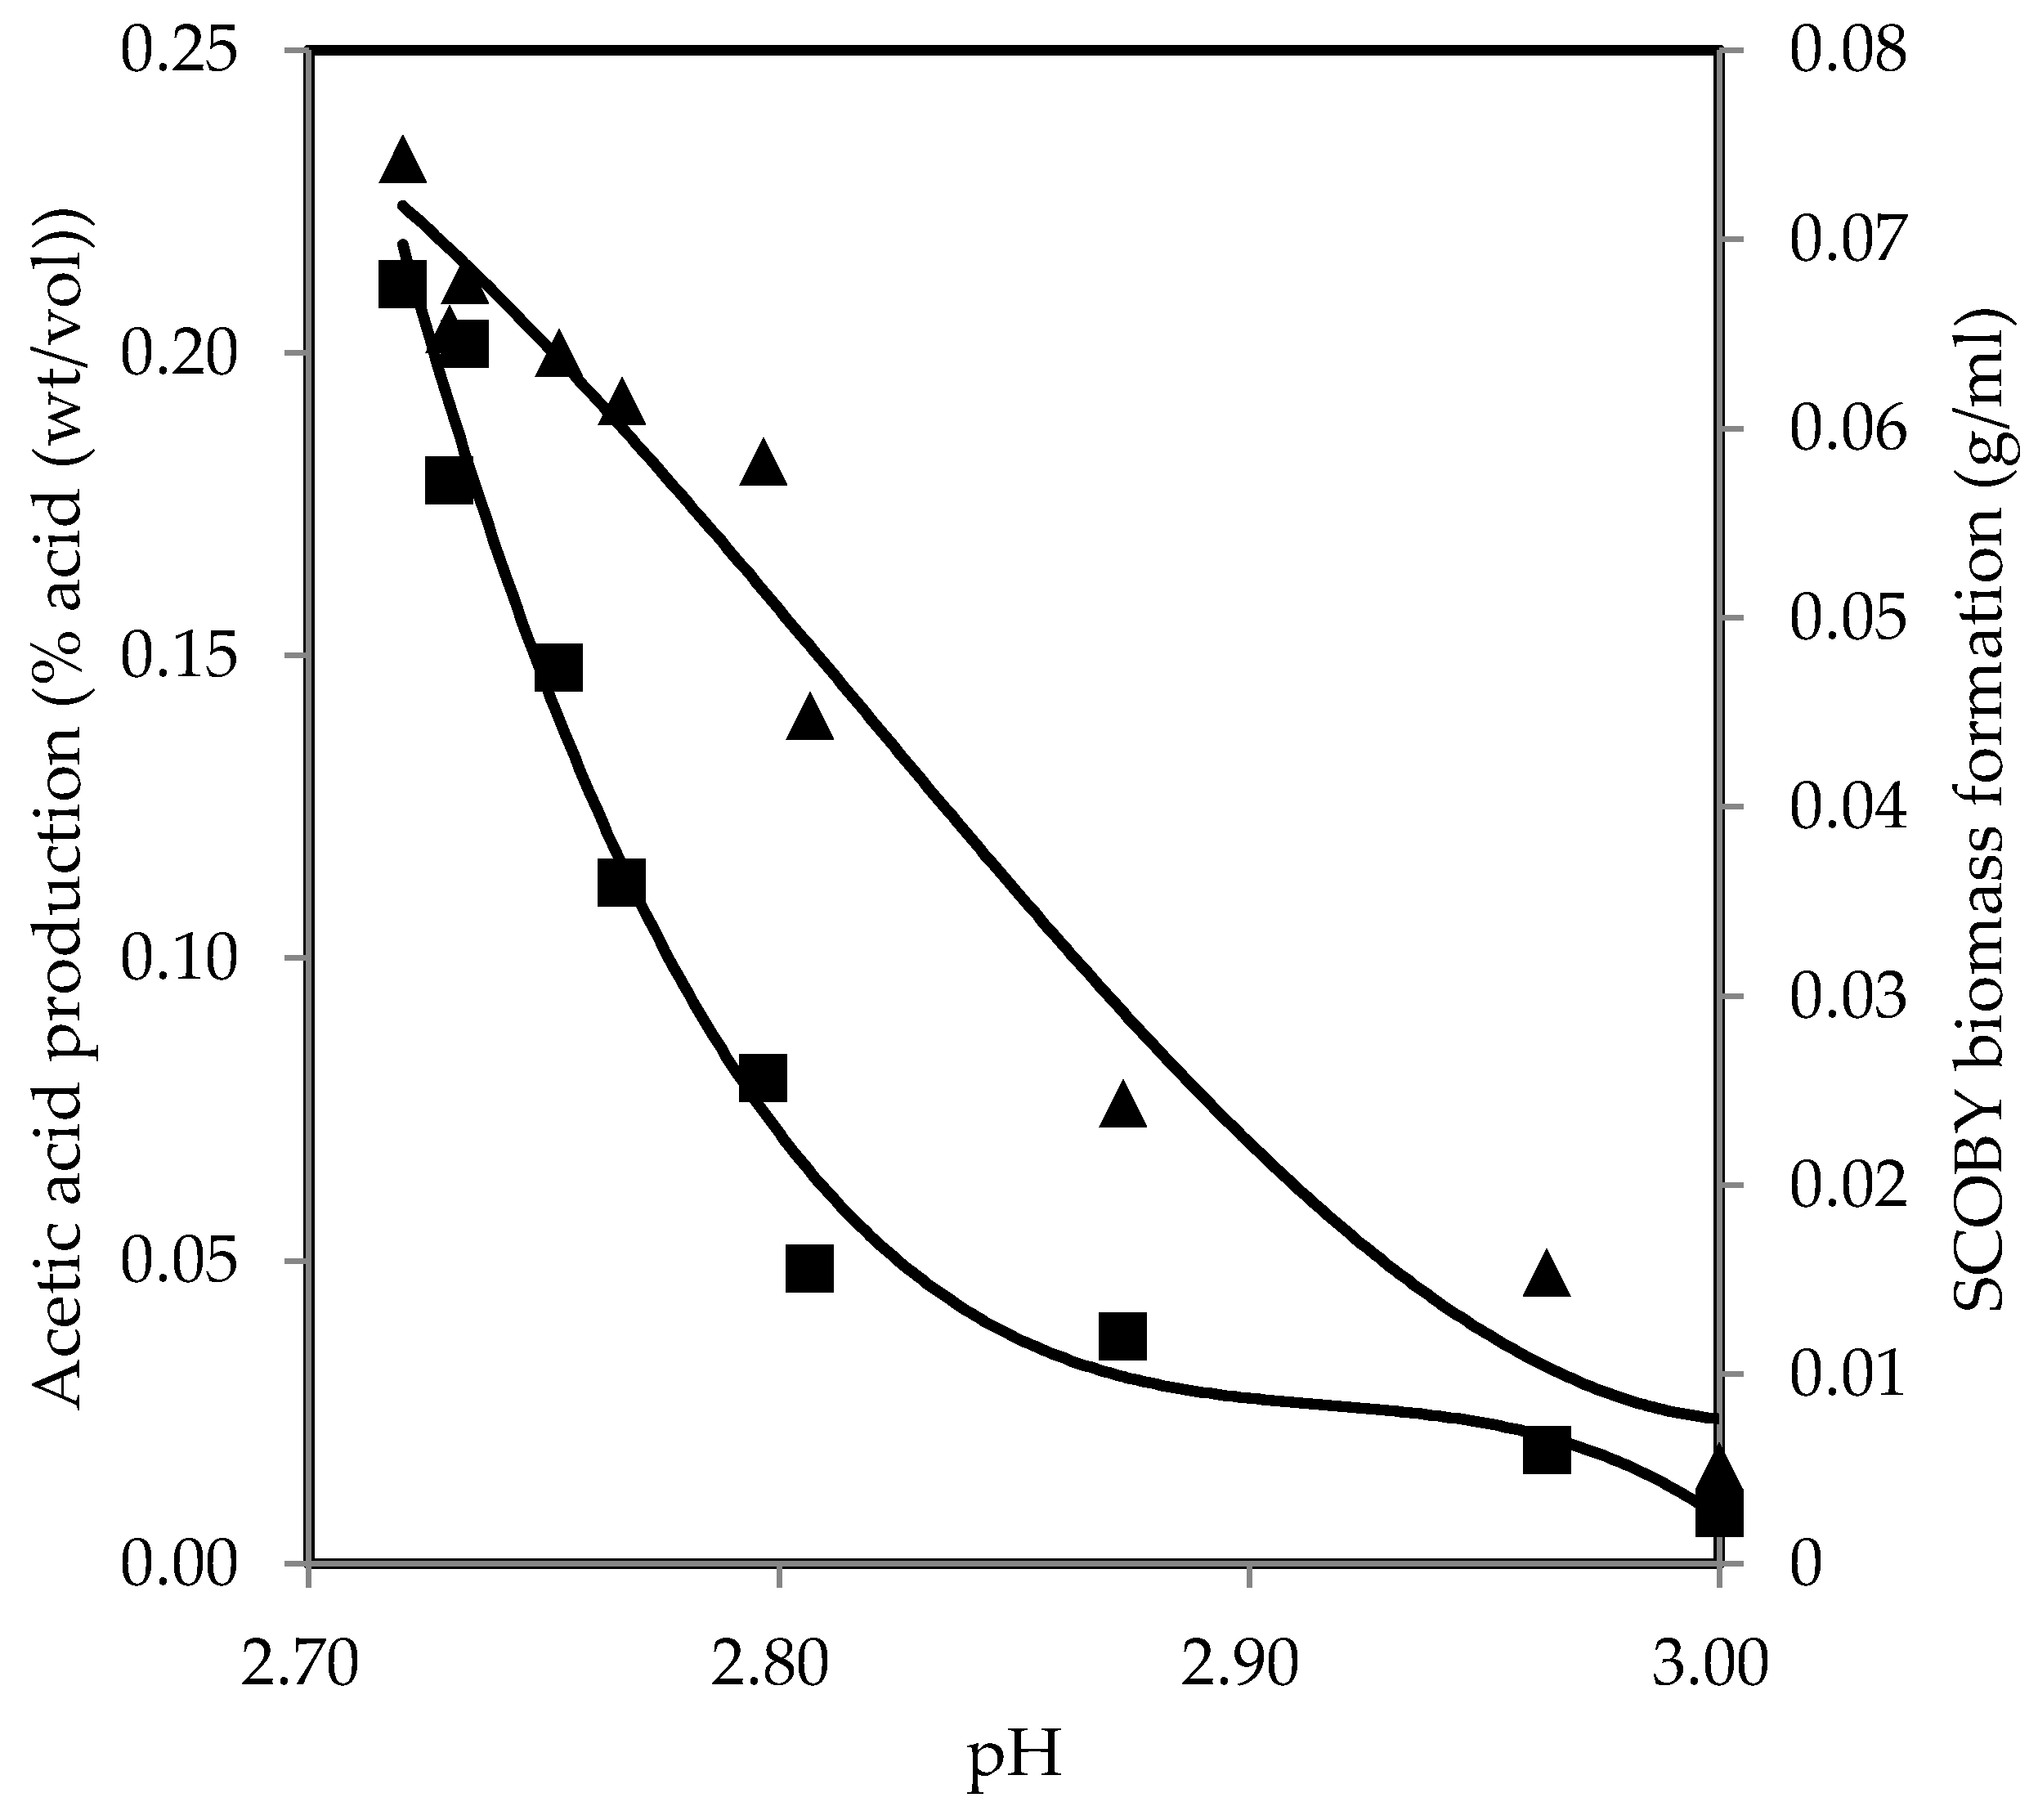
Figure 5 presents a correlation that allows for the prediction of SCOBY biomass formation and acetic acid production from pH with best-fit polynomial models, Equations (14) and (15), respectively. SCOBY biomass formation and acetic acid production decreased with pH increase, showing negative correlations and suggesting that microorganisms responsible for the fermentation process are less active at higher pH levels. This is consistent with earlier research, which indicated that elevating pH results in the diminution of SCOBY biomass formation [25]. Along with the decline in production, there was an emergence of mouldy growth and other contaminants when the pH was increased to 5 [25]. At pH 6, the only observation was the presence of mould growth embedded within the nanofibrils, with no discernible formation of SCOBY [25]. Typically, AAB is known to grow well within a pH range of 5.0–6.5 [87]. However, owing to the symbiotic relationship with other microorganisms present, it adapts more effectively to lower pH levels in kombucha fermentation [38]. Hence, AAB in kombucha showed the capability to thrive and generate SCOBY biomass at pH 3.0 or lower as fermentation progressed [23,25,67]. The count of AAB also increased consistently under acidic conditions, which increased the production efficiency of SCOBY biomass [15,38]. These bacteria use ethanol generated by yeast cells as a substrate for acetic acid production. The acetic acid produced by AAB, in turn, has been shown to stimulate yeast activity in ethanol production, demonstrating their synergistic growth and thereby facilitating SCOBY biomass formation [25,88,89]. The changes in hydrogen ion concentration from the acids not only inhibit the undesirable growth of microbial contaminants but also influence the growth of fermenting microorganisms and the formation of products. Therefore, monitoring pH levels is significant for quality assurance, as deviations from the optimal range may lead to the reduced efficiency of fermentation. The primary corrective action if the pH exceeds the limit is to continue the fermentation process and remeasure the pH [18]. If the pH does not drop to 4.2 or below within seven days, the fermentation temperature is likely too low or the culture is contaminated, and it should be discarded [18]. Alternatively, if the pH drops below the specified limit, the high acidity should be diluted by adding freshly brewed tea.
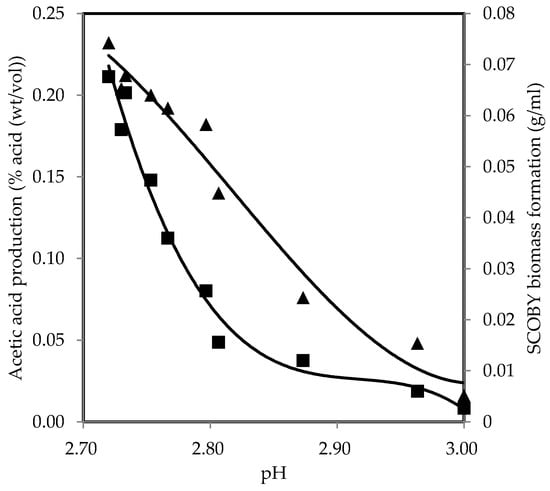
Figure 5.
SCOBY biomass formation (■) and acid production (▲) as a function of pH values during oolong tea kombucha fermentation.
4. Conclusions
Modelling was used to evaluate the impact of different tea types—black, green, and oolong—on pH, SCOBY biomass formation, and acid production in kombucha fermentation. With pH decreasing significantly and being well described using rational, exponential, and polynomial models, the products of SCOBY biomass and acetic acid increased throughout the course of fermentation. The sigmoid curve models—logistic, Gompertz, Boltzmann, and Richards—were all well fitted to describe the products adequately. From the modified Gompertz model, the SCOBY biomass formation and acetic acid production rates were the highest in non-conventional kombucha using oolong tea at 9.980 g/L-day and 0.049% acid (wt/vol)/day, respectively, compared to green tea at 7.393 g/L-day and 0.047% acid (wt/vol)/day, respectively, and black tea at 7.323 g/L-day and 0.048% acid (wt/vol)/day, respectively. With pH used as the main monitoring parameter in kombucha processing, the developed polynomial models correlating to product formation provide avenues for estimating product formation for production needs. The present study enabled the prediction of pH, SCOBY biomass formation, and acid production with different models, which is useful for improving the quality of kombucha fermentation and providing information on how the process can be made efficient. Future research should take into account the effects of other factors such as temperature, substrate concentration, the surface area of fermentation media, and microbial composition.
Author Contributions
Investigation, methodology, formal analysis, writing—original draft preparation, A.Q.C.; writing—review and editing, N.L.C.; supervision, N.L.C., R.A.T., and R.K.B. All authors have read and agreed to the published version of the manuscript.
Funding
This research received no external funding.
Data Availability Statement
Data are contained within the article.
Acknowledgments
This research did not receive any specific grant from funding agencies in the public, commercial, or not-for-profit sectors. A.Q.C acknowledges financial support from Universiti Putra Malaysia through Graduate Research Fellowship for her course in UPM.
Conflicts of Interest
The authors declare no conflicts of interest.
References
- Kim, J.; Adhikari, K. Current Trends in Kombucha: Marketing Perspectives and the Need for Improved Sensory Research. Beverages 2020, 6, 15. [Google Scholar] [CrossRef]
- Future Market Insights. Kombucha Market—Size, Growth, Trends, Share|2033. Available online: https://www.futuremarketinsights.com/reports/kombucha-market (accessed on 4 April 2024).
- Costa, M.A.d.C.; Vilela, D.L.d.S.; Fraiz, G.M.; Lopes, I.L.; Coelho, A.I.M.; Castro, L.C.V.; Martin, J.G.P. Effect of Kombucha Intake on the Gut Microbiota and Obesity-Related Comorbidities: A Systematic Review. Crit. Rev. Food Sci. Nutr. 2023, 63, 3851–3866. [Google Scholar] [CrossRef] [PubMed]
- Kaashyap, M.; Cohen, M.; Mantri, N. Microbial Diversity and Characteristics of Kombucha as Revealed by Metagenomic and Physicochemical Analysis. Nutrients 2021, 13, 4446. [Google Scholar] [CrossRef] [PubMed]
- Kapp, J.M.; Sumner, W. Kombucha: A Systematic Review of the Empirical Evidence of Human Health Benefit. Ann. Epidemiol. 2019, 30, 66–70. [Google Scholar] [CrossRef] [PubMed]
- Neffe-Skocińska, K.; Sionek, B.; Ścibisz, I.; Kołożyn-Krajewska, D. Acid Contents and the Effect of Fermentation Condition of Kombucha Tea Beverages on Physicochemical, Microbiological and Sensory Properties. CyTA-J. Food 2017, 15, 601–607. [Google Scholar] [CrossRef]
- Villarreal-Soto, S.A.; Beaufort, S.; Bouajila, J.; Souchard, J.P.; Taillandier, P. Understanding Kombucha Tea Fermentation: A Review. J. Food Sci. 2018, 83, 580–588. [Google Scholar] [CrossRef] [PubMed]
- Antolak, H.; Piechota, D.; Kucharska, A. Kombucha Tea—A Double Power of Bioactive Compounds from Tea and Symbiotic Culture of Bacteria and Yeasts (SCOBY). Antioxidants 2021, 10, 1541. [Google Scholar] [CrossRef] [PubMed]
- Ahmed, R.F.; Hikal, M.S.; Abou-Taleb, K.A. Biological, Chemical and Antioxidant Activities of Different Types Kombucha. Ann. Agric. Sci. 2020, 65, 35–41. [Google Scholar] [CrossRef]
- Harrison, K.; Curtin, C. Microbial Composition of SCOBY Starter Cultures Used by Commercial Kombucha Brewers in North America. Microorganisms 2021, 9, 1060. [Google Scholar] [CrossRef] [PubMed]
- Dutta, H.; Paul, S.K. Kombucha Drink: Production, Quality, and Safety Aspects. In Production and Management of Beverages; Grumezescu, A.M., Holban, A.M., Eds.; Woodhead Publishing: Cambridge, UK, 2019; pp. 259–288. ISBN 978-0-12-815260-7. [Google Scholar]
- Laavanya, D.; Shirkole, S.; Balasubramanian, P. Current Challenges, Applications and Future Perspectives of SCOBY Cellulose of Kombucha Fermentation. J. Clean. Prod. 2021, 295, 126454. [Google Scholar] [CrossRef]
- Tran, T.; Grandvalet, C.; Verdier, F.; Martin, A.; Alexandre, H.; Tourdot-Maréchal, R. Microbiological and Technological Parameters Impacting the Chemical Composition and Sensory Quality of Kombucha. Compr. Rev. Food Sci. Food Saf. 2020, 19, 2050–2070. [Google Scholar] [CrossRef] [PubMed]
- Chong, A.Q.; Lau, S.W.; Chin, N.L.; Talib, R.A.; Basha, R.K. Fermented Beverage Benefits: A Comprehensive Review and Comparison of Kombucha and Kefir Microbiome. Microorganisms 2023, 11, 1344. [Google Scholar] [CrossRef] [PubMed]
- De Filippis, F.; Troise, A.D.; Vitaglione, P.; Ercolini, D. Different Temperatures Select Distinctive Acetic Acid Bacteria Species and Promotes Organic Acids Production during Kombucha Tea Fermentation. Food Microbiol. 2018, 73, 11–16. [Google Scholar] [CrossRef] [PubMed]
- Sharifudin, S.A.; Ho, W.Y.; Yeap, S.K.; Abdullah, R.; Koh, S.P. Fermentation and Characterisation of Potential Kombucha Cultures on Papaya-Based Substrates. LWT 2021, 151, 112060. [Google Scholar] [CrossRef]
- Coelho, R.M.D.; de Almeida, A.L.; do Amaral, R.Q.G.; da Mota, R.N.; de Sousa, P.H.M. Kombucha: Review. Int. J. Gastron. Food Sci. 2020, 22, 100272. [Google Scholar] [CrossRef]
- Nummer, B.A. SPECIAL REPORT: Kombucha Brewing under the Food and Drug Administration Model Food Code: Risk Analysis and Processing Guidance. J. Environ. Health 2013, 76, 8–11. [Google Scholar] [PubMed]
- de Miranda, J.F.; Ruiz, L.F.; Silva, C.B.; Uekane, T.M.; Silva, K.A.; Gonzalez, A.G.M.; Fernandes, F.F.; Lima, A.R. Kombucha: A Review of Substrates, Regulations, Composition, and Biological Properties. J. Food Sci. 2022, 87, 503–527. [Google Scholar] [CrossRef] [PubMed]
- Food and Drug Administration. Food Code; Food and Drug Administration: Silver Spring, MD, USA, 2009. [Google Scholar]
- British Columbia Centre for Disease Control. Food Safety Assessment of Kombucha Tea Recipe and Food Safety Plan. Available online: http://www.bccdc.ca/resource-gallery/Documents/Educational%20Materials/EH/FPS/Food/kombucha1.pdf (accessed on 12 December 2023).
- Rossini, D.; Bogsan, C. Is It Possible to Brew Non-Alcoholic Kombucha? Brazilian Scenario after Restrictive Legislation. Fermentation 2023, 9, 810. [Google Scholar] [CrossRef]
- Goh, W.N.; Rosma, A.; Kaur, B.; Fazilah, A.; Karim, A.A.; Bhat, R. Fermentation of Black Tea Broth (Kombucha): I. Effects of Sucrose Concentration and Fermentation Time on the Yield of Microbial Cellulose. Int. Food Res. J. 2012, 19, 109. [Google Scholar]
- Malbaša, R.; Lončar, E.; Djurić, M.; Došenović, I. Effect of Sucrose Concentration on the Products of Kombucha Fermentation on Molasses. Food Chem. 2008, 108, 926–932. [Google Scholar] [CrossRef] [PubMed]
- Sharma, C.; Bhardwaj, N.K. Biotransformation of Fermented Black Tea into Bacterial Nanocellulose via Symbiotic Interplay of Microorganisms. Int. J. Biol. Macromol. 2019, 132, 166–177. [Google Scholar] [CrossRef] [PubMed]
- Amarasinghe, H.; Weerakkody, N.S.; Waisundara, V.Y. Evaluation of Physicochemical Properties and Antioxidant Activities of Kombucha “Tea Fungus” during Extended Periods of Fermentation. Food Sci. Nutr. 2018, 6, 659–665. [Google Scholar] [CrossRef] [PubMed]
- Muhialdin, B.J.; Osman, F.A.; Muhamad, R.; Che Wan Sapawi, C.W.N.S.; Anzian, A.; Voon, W.W.Y.; Hussin, A.S.M. Effects of Sugar Sources and Fermentation Time on the Properties of Tea Fungus (Kombucha) Beverage. Int. Food Res. J. 2019, 26, 481–487. [Google Scholar]
- Dufresne, C.; Farnworth, E. Tea, Kombucha, and Health: A Review. Food Res. Int. 2000, 33, 409–421. [Google Scholar] [CrossRef]
- Oliveira, A.P.; Guimaraes, A.L.; Goncalves de Oliveira-Junior, R.; Quintans, J.S.S.; Antônio de Medeiros, F.; Barbosa-Filho, J.M.; Almeida, J.R.G.S. Camellia sinensis (L.) Kuntze: A Review of Chemical and Nutraceutical Properties. In Natural Products: Research Reviews; Gupta, V.K., Ed.; Thomson Press India Limited: Faridabad, India, 2016; Volume 4, pp. 21–62. [Google Scholar]
- Habtemariam, S. The Chemical and Pharmacological Basis of Tea (Camellia sinensis (L.) Kuntze) as Potential Therapy for Type 2 Diabetes and Metabolic Syndrome. In Medicinal Foods as Potential Therapies for Type-2 Diabetes and Associated Diseases 1; Academic Press: Cambridge, MA, USA, 2019; pp. 839–906. [Google Scholar]
- Sharangi, A.B. Medicinal and Therapeutic Potentialities of Tea (Camellia sinensis L.)—A Review. Food Res. Int. 2009, 42, 529–535. [Google Scholar] [CrossRef]
- Gaggìa, F.; Baffoni, L.; Galiano, M.; Sandris Nielsen, D.; Riemer Jakobsen, R.; Castro-Mejía, J.L.; Bosi, S.; Truzzi, F.; Musumeci, F.; Dinelli, G.; et al. Kombucha Beverage from Green, Black and Rooibos Teas: A Comparative Study Looking at Microbiology, Chemistry and Antioxidant Activity. Nutrients 2018, 11, 1. [Google Scholar] [CrossRef] [PubMed]
- García-Ruiz, A.; Bartolomé, B.; Martínez-Rodríguez, A.J.; Pueyo, E.; Martín-Álvarez, P.J.; Moreno-Arribas, M.V. Potential of Phenolic Compounds for Controlling Lactic Acid Bacteria Growth in Wine. Food Control 2008, 19, 835–841. [Google Scholar] [CrossRef]
- Rapeanu, G.; Bahrim, G.; Stanciuc, N. Microorganism Metabolic Activity Stimulation by Polyphenols. In Polyphenols in Human Health and Disease; Academic Press: Cambridge, MA, USA, 2014; Volume 1, pp. 513–521. ISBN 9780123984562. [Google Scholar]
- Sabel, A.; Bredefeld, S.; Schlander, M.; Claus, H. Wine Phenolic Compounds: Antimicrobial Properties against Yeasts, Lactic Acid and Acetic Acid Bacteria. Beverages 2017, 3, 29. [Google Scholar] [CrossRef]
- Jakubczyk, K.; Kałduńska, J.; Kochman, J.; Janda, K. Chemical Profile and Antioxidant Activity of the Kombucha Beverage Derived from White, Green, Black and Red Tea. Antioxidants 2020, 9, 447. [Google Scholar] [CrossRef] [PubMed]
- Salman, S.; Öz, G.; Felek, R.; Haznedar, A.; Turna, T.; Özdemir, F. Effects of Fermentation Time on Phenolic Composition, Antioxidant and Antimicrobial Activities of Green, Oolong, and Black Teas. Food Biosci. 2022, 49, 101884. [Google Scholar] [CrossRef]
- Priyadharshini, T.; Nageshwari, K.; Vimaladhasan, S.; Prakash, S.P.; Balasubramanian, P. Machine Learning Prediction of SCOBY Cellulose Yield from Kombucha Tea Fermentation. Bioresour. Technol. Rep. 2022, 18, 101027. [Google Scholar] [CrossRef]
- Kanurić, K.G.; Milanović, S.D.; Ikonić, B.B.; Lončar, E.S.; Iličić, M.D.; Vukić, V.R.; Vukić, D.V. Kinetics of Lactose Fermentation in Milk with Kombucha Starter. J. Food Drug Anal. 2018, 26, 1229–1234. [Google Scholar] [CrossRef] [PubMed]
- Cvetković, D.; Markov, S.; Djurić, M.; Savić, D.; Velićanski, A. Specific Interfacial Area as a Key Variable in Scaling-up Kombucha Fermentation. J. Food Eng. 2008, 85, 387–392. [Google Scholar] [CrossRef]
- Malbaša, R.; Lončar, E.; Djurić, M.; Klašnja, M.; Kolarov, L.J.; Markov, S. Scale-up of Black Tea Batch Fermentation by Kombucha. Food Bioprod. Process. 2006, 84, 193–199. [Google Scholar] [CrossRef]
- Wu, Y.; Chen, Q.; Ruan, H.; He, G. Optimization of Liquid Fermentation Process for Improved Exo-Polysaccharides Production by Kombucha ZJU1. Adv. J. Food Sci. Technol. 2013, 5, 217–224. [Google Scholar] [CrossRef]
- Tarhan Kuzu, K.; Aykut, G.; Tek, S.; Yatmaz, E.; Germec, M.; Yavuz, I.; Turhan, I. Production and Characterization of Kombucha Tea from Different Sources of Tea and Its Kinetic Modeling. Processes 2023, 11, 2100. [Google Scholar] [CrossRef]
- Zwietering, M.H.; Jongenburger, I.; Rombouts, F.M.; Van’t Riet, K. Modeling of the Bacterial Growth Curve. Appl. Environ. Microbiol. 1990, 56, 1875–1881. [Google Scholar] [CrossRef] [PubMed]
- Azeredo, H.M.C.; Barud, H.; Farinas, C.S.; Vasconcellos, V.M.; Claro, A.M. Bacterial Cellulose as a Raw Material for Food and Food Packaging Applications. Front. Sustain. Food Syst. 2019, 3, 7. [Google Scholar] [CrossRef]
- Kruk, M.; Trząskowska, M.; Ścibisz, I.; Pokorski, P. Application of the “Scoby” and Kombucha Tea for the Production of Fermented Milk Drinks. Microorganisms 2021, 9, 123. [Google Scholar] [CrossRef] [PubMed]
- Soares, M.G.; de Lima, M.; Schmidt, V.C.R. Technological Aspects of Kombucha, Its Applications and the Symbiotic Culture (SCOBY), and Extraction of Compounds of Interest: A Literature Review. Trends Food Sci. Technol. 2021, 110, 539–550. [Google Scholar] [CrossRef]
- Tu, C.; Tang, S.; Azi, F.; Hu, W.; Dong, M. Use of Kombucha Consortium to Transform Soy Whey into a Novel Functional Beverage. J. Funct. Foods 2019, 52, 81–89. [Google Scholar] [CrossRef]
- Lintner, K. Cosmetic or Dermopharmaceutical Compositions Containing Kombucha. U.S. Patent Application 12/231,114, 8 January 2009. [Google Scholar]
- Domskiene, J.; Sederaviciute, F.; Simonaityte, J. Kombucha Bacterial Cellulose for Sustainable Fashion. Int. J. Cloth. Sci. Technol. 2019, 31, 644–652. [Google Scholar] [CrossRef]
- Kamiński, K.; Jarosz, M.; Grudzień, J.; Pawlik, J.; Zastawnik, F.; Pandyra, P.; Kołodziejczyk, A.M. Hydrogel Bacterial Cellulose: A Path to Improved Materials for New Eco-Friendly Textiles. Cellulose 2020, 27, 5353–5365. [Google Scholar] [CrossRef]
- Kalaiappan, K.; Rengapillai, S.; Marimuthu, S.; Murugan, R.; Thiru, P. Kombucha SCOBY-Based Carbon and Graphene Oxide Wrapped Sulfur/Polyacrylonitrile as a High-Capacity Cathode in Lithium-Sulfur Batteries. Front. Chem. Sci. Eng. 2020, 14, 976–987. [Google Scholar] [CrossRef]
- Shi, Z.; Li, Y.; Chen, X.; Han, H.; Yang, G. Double Network Bacterial Cellulose Hydrogel to Build a Biology-Device Interface. Nanoscale 2014, 6, 970–977. [Google Scholar] [CrossRef] [PubMed]
- Gatenholm, P.; Klemm, D. Bacterial Nanocellulose as a Renewable Material for Biomedical Applications. MRS Bull. 2010, 35, 208–213. [Google Scholar] [CrossRef]
- El-Wakil, N.A.; Hassan, E.A.; Hassan, M.L.; Abd El-Salam, S.S. Bacterial Cellulose/Phytochemical’s Extracts Biocomposites for Potential Active Wound Dressings. Environ. Sci. Pollut. Res. 2019, 26, 26529–26541. [Google Scholar] [CrossRef]
- Cohen, G.; Sela, D.A.; Nolden, A.A. Sucrose Concentration and Fermentation Temperature Impact the Sensory Characteristics and Liking of Kombucha. Foods 2023, 12, 3116. [Google Scholar] [CrossRef] [PubMed]
- Treviño-Garza, M.Z.; Guerrero-Medina, A.S.; González-Sánchez, R.A.; García-Gómez, C.; Guzmán-Velasco, A.; Báez-González, J.G.; Márquez-Reyes, J.M. Production of Microbial Cellulose Films from Green Tea (Camellia sinensis) Kombucha with Various Carbon Sources. Coatings 2020, 10, 1132. [Google Scholar] [CrossRef]
- Jarrell, J.A.; Walia, N.; Nemergut, D.; Agadi, A.; Bennett, J.W. Inoculation, Growth and Bactericidal Effects of Three Kombucha Cultures. Microbiol. Res. 2022, 13, 128–136. [Google Scholar] [CrossRef]
- Sadler, G.D.; Murphy, P.A. PH and Titratable Acidity. In Food Analysis 4; Springer: Boston, MA, USA, 2010; pp. 219–238. [Google Scholar]
- Chin, N.L.; Chan, S.M.; Yusof, Y.A.; Chuah, T.G.; Talib, R.A. Modelling of Rheological Behaviour of Pummelo Juice Concentrates Using Master-Curve. J. Food Eng. 2009, 93, 134–140. [Google Scholar] [CrossRef]
- Goršek, A.; Tramšek, M. Kefir Grains Production-An Approach for Volume Optimization of Two-Stage Bioreactor System. Biochem. Eng. J. 2008, 42, 153–158. [Google Scholar] [CrossRef]
- Apar, D.K.; Demirhan, E.; Özel, B.; Özbek, B. Kefir Grain Biomass Production: Influence of Different Culturing Conditions and Examination of Growth Kinetic Models. J. Food Process Eng. 2017, 40, e12332. [Google Scholar] [CrossRef]
- Loncar, E.; Kanuric, K.; Malbasa, R.; Djuric, M.; Milanovic, S. Kinetics of Saccharose Fermentation by Kombucha. Chem. Ind. Chem. Eng. Q. 2014, 20, 345–352. [Google Scholar] [CrossRef]
- Erkmen, O.; Alben, E. Mathematical Modeling of Citric Acid Production and Biomass Formation by Aspergillus niger in Undersized Semolina. J. Food Eng. 2002, 52, 161–166. [Google Scholar] [CrossRef]
- Germec, M.; Cheng, K.C.; Karhan, M.; Demirci, A.; Turhan, I. Application of Mathematical Models to Ethanol Fermentation in Biofilm Reactor with Carob Extract. Biomass Convers. Biorefin. 2020, 10, 237–252. [Google Scholar] [CrossRef]
- Phung, L.T.; Kitwetcharoen, H.; Chamnipa, N.; Boonchot, N.; Thanonkeo, S.; Tippayawat, P.; Klanrit, P.; Yamada, M.; Thanonkeo, P. Changes in the Chemical Compositions and Biological Properties of Kombucha Beverages Made from Black Teas and Pineapple Peels and Cores. Sci. Rep. 2023, 13, 7859. [Google Scholar] [CrossRef] [PubMed]
- Wang, B.; Rutherfurd-Markwick, K.; Naren, N.; Zhang, X.X.; Mutukumira, A.N. Microbiological and Physico-Chemical Characteristics of Black Tea Kombucha Fermented with a New Zealand Starter Culture. Foods 2023, 12, 2314. [Google Scholar] [CrossRef] [PubMed]
- Lončar, E.S.; Petrović, S.E.; Malbaša, R.V.; Verac, R.M. Biosynthesis of Glucuronic Acid by Means of Tea Fungus. Nahrung 2000, 44, 138–139. [Google Scholar] [CrossRef]
- Cao, H.; Saroglu, O.; Karadag, A.; Diaconeasa, Z.; Zoccatelli, G.; Conte-Junior, C.A.; Gonzalez-Aguilar, G.A.; Ou, J.; Bai, W.; Zamarioli, C.M.; et al. Available Technologies on Improving the Stability of Polyphenols in Food Processing. Food Front. 2021, 2, 109–139. [Google Scholar] [CrossRef]
- Zeng, L.; Ma, M.; Li, C.; Luo, L. Stability of Tea Polyphenols Solution with Different PH at Different Temperatures. Int. J. Food Prop. 2017, 20, 1–18. [Google Scholar] [CrossRef]
- Xu, Y.Q.; Yu, P.; Zhou, W. Combined Effect of PH and Temperature on the Stability and Antioxidant Capacity of Epigallocatechin Gallate (EGCG) in Aqueous System. J. Food Eng. 2019, 250, 46–54. [Google Scholar] [CrossRef]
- Vina, I.; Semjonovs, P.; Linde, R.; Deniņa, I. Current Evidence on Physiological Activity and Expected Health Effects of Kombucha Fermented Beverage. J. Med. Food 2014, 17, 179–188. [Google Scholar] [CrossRef] [PubMed]
- Watawana, M.I.; Jayawardena, N.; Gunawardhana, C.B.; Waisundara, V.Y. Health, Wellness, and Safety Aspects of the Consumption of Kombucha. J. Chem. 2015, 2015, 591869. [Google Scholar] [CrossRef]
- Glaz, B.; Yeater, K.M. Applied Statistics in Agricultural, Biological, and Environmental Sciences; ASA, CSSA, and SSSA Books; American Society of Agronomy, Crop Science Society of America, and Soil Science Society of America, Inc.: Madison, WI, USA, 2018; ISBN 9780891183600. [Google Scholar]
- Cayré, M.E.; Vignolo, G.; Garro, O. Modeling Lactic Acid Bacteria Growth in Vacuum-Packaged Cooked Meat Emulsions Stored at Three Temperatures. Food Microbiol. 2003, 20, 561–566. [Google Scholar] [CrossRef]
- Van Boekel, M.A.J.S. Kinetic Modeling of Food Quality: A Critical Review. Compr. Rev. Food Sci. Food Saf. 2008, 7, 144–158. [Google Scholar] [CrossRef]
- Hidalgo, D.; Corona, F.; Martín-Marroquín, J.M. Manure Biostabilization by Effective Microorganisms as a Way to Improve Its Agronomic Value. Biomass Convers. Biorefin. 2022, 12, 4649–4664. [Google Scholar] [CrossRef]
- Shi, S.; Wei, Y.; Lin, X.; Liang, H.; Zhang, S.; Chen, Y.; Dong, L.; Ji, C. Microbial Metabolic Transformation and Antioxidant Activity Evaluation of Polyphenols in Kombucha. Food Biosci. 2023, 51, 102287. [Google Scholar] [CrossRef]
- Filannino, P.; Di Cagno, R.; Gobbetti, M. Metabolic and Functional Paths of Lactic Acid Bacteria in Plant Foods: Get out of the Labyrinth. Curr. Opin. Biotechnol. 2018, 49, 64–72. [Google Scholar] [CrossRef]
- Semjonovs, P.; Ruklisha, M.; Paegle, L.; Saka, M.; Treimane, R.; Skute, M.; Rozenberga, L.; Vikele, L.; Sabovics, M.; Cleenwerck, I. Cellulose Synthesis by Komagataeibacter Rhaeticus Strain P 1463 Isolated from Kombucha. Appl. Microbiol. Biotechnol. 2017, 101, 1003–1012. [Google Scholar] [CrossRef] [PubMed]
- Wang, B.; Rutherfurd-Markwick, K.; Zhang, X.X.; Mutukumira, A.N. Kombucha: Production and Microbiological Research. Foods 2022, 11, 3456. [Google Scholar] [CrossRef] [PubMed]
- Suwanposri, A.; Yukphan, P.; Yamada, Y.; Ochaikul, D. Statistical Optimisation of Culture Conditions for Biocellulose Production by Komagataeibacter sp. PAP1 Using Soya Bean Whey. Maejo Int. J. Sci. Technol. 2014, 8, 1–14. [Google Scholar]
- Yim, S.M.; Song, J.E.; Kim, H.R. Production and Characterisation of Bacterial Cellulose Fabrics by Nitrogen Sources of Tea and Carbon Sources of Sugar. Process Biochem. 2017, 59, 26–36. [Google Scholar] [CrossRef]
- Islam, M.U.; Ullah, M.W.; Khan, S.; Shah, N.; Park, J.K. Strategies for Cost-Effective and Enhanced Production of Bacterial Cellulose. Int. J. Biol. Macromol. 2017, 102, 1166–1173. [Google Scholar] [CrossRef] [PubMed]
- Goh, W.N.; Rosma, A.; Kaur, B.; Fazilah, A.; Karim, A.A.; Bhat, R. Microstructure and Physical Properties of Microbial Cellulose Produced during Fermentation of Black Tea Broth (Kombucha). II. Int. Food Res. J. 2012, 19, 153. [Google Scholar]
- Avcioglu, N.H.; Birben, M.; Bilkay, I.S. Optimization and Physicochemical Characterization of Enhanced Microbial Cellulose Production with a New Kombucha Consortium. Process Biochem. 2021, 108, 60–68. [Google Scholar] [CrossRef]
- Laureys, D.; Britton, S.J.; De Clippeleer, J. Kombucha Tea Fermentation: A Review. J. Am. Soc. Brew. Chem. 2020, 78, 165–174. [Google Scholar] [CrossRef]
- Liu, C.H.; Hsu, W.H.; Lee, F.L.; Liao, C.C. The Isolation and Identification of Microbes from a Fermented Tea Beverage, Haipao, and Their Interactions during Haipao Fermentation. Food Microbiol. 1996, 13, 407–415. [Google Scholar] [CrossRef]
- Meng, Y.; Wang, X.; Li, Y.; Chen, J.; Chen, X. Microbial Interactions and Dynamic Changes of Volatile Flavor Compounds during the Fermentation of Traditional Kombucha. Food Chem. 2024, 430, 137060. [Google Scholar] [CrossRef] [PubMed]
Disclaimer/Publisher’s Note: The statements, opinions and data contained in all publications are solely those of the individual author(s) and contributor(s) and not of MDPI and/or the editor(s). MDPI and/or the editor(s) disclaim responsibility for any injury to people or property resulting from any ideas, methods, instructions or products referred to in the content. |
© 2024 by the authors. Licensee MDPI, Basel, Switzerland. This article is an open access article distributed under the terms and conditions of the Creative Commons Attribution (CC BY) license (https://creativecommons.org/licenses/by/4.0/).