Abstract
The Upper Paleozoic tight sandstone reservoirs on the eastern margin of the Ordos Basin exhibit strong heterogeneity and complex pore structures, leading to poor correlation between porosity and permeability and insufficient accuracy in permeability calculations to meet the requirements of reservoir fine evaluation. Therefore, a new method for high-precision permeability calculation based on flow zone index (FZI) reservoir classification is proposed. This method determines the number of reservoir classifications based on the characteristics of the FZI normal probability distribution plot and establishes FZI division criteria for reservoir types. Classified reservoirs exhibit similar flow characteristics, significantly improving the correlation between permeability and porosity. Based on nuclear magnetic resonance (NMR) combined with mercury injection capillary pressure (MICP) experiments, a modeling method for calculating the flow zone index based on the geometric mean of NMR T2 is proposed. This method realizes continuous calculation of FZI based on NMR logging, reservoir classification, and permeability for the entire wellbore, thereby constructing a new permeability prediction method for tight sandstone reservoirs based on NMR logging and FZI classification. Actual application results demonstrate that the permeability calculated using NMR logging is in high agreement with the permeability analyzed from core data, with an average relative error of 45.8%, proving the effectiveness of the proposed method in this study.
1. Introduction
As an important unconventional oil and gas resource, tight sandstone gas reservoirs have become a research hotspot in recent years [,,]. The Upper Paleozoic tight sandstone gas reservoir in the eastern margin of the Ordos Basin is rich in natural gas resources, and its main gas-bearing layers are tight sandstone gas reservoirs [,,]. Permeability is critical for evaluating fluid flow capacities in such tight reservoirs [,,]. Generally speaking, permeability can be obtained in two ways: One is the coring experiment, whose accuracy and representativeness are limited by the well segment and the number of cores. The second is permeability modeling with logging data calibrated by core experimental data. However, due to the tight lithology and complex pore–throat structure, permeability models built by multiple statistical regression based on conventional logging data are often inaccurate in fine reservoir evaluation.
How to fully mine logging and experimental data to develop a high-precision permeability model poses a great challenge for the fine evaluation of well-logging reservoirs. Lin et al proposed the quantitative prediction of reservoir permeability using neural network technology combined with conventional logging data []. Meng et al classified reservoirs according to the composition and structure of rocks and the microscopic characteristics of pore structure, and built permeability models for different types of reservoirs []. Anjos et al used three-dimensional scanning digital core analysis technology to research different pore structure characteristics and establish a permeability calculation model based on the classification criteria of digital rock cores []. Xia et al built a permeability model of tight sandstone on the basis of fractal theory, fully considering the influence of heterogeneity of pore structure on permeability []. The above-mentioned efforts fully consider the influence of pore structure on the classification of reservoir types, mainly through qualitative classification description based on mercury injection and digital core characteristics, and then use mathematical methods to achieve permeability modeling.
However, there has not been an effective coupling relationship established between the actual logging data and the permeability model of tight sandstone reservoirs established by the above scholars. Applying these models to uncored wells presents additional challenges. To address the above problems, this study establishes a permeability model on the basis of FZI reservoir classification theory and core analysis of porosity and permeability. The classification of permeability can be accurately calculated by inputting NMR logging data into FZI equations based on NMR T2 geometric mean theory. We present this as our novel concept and technical method of permeability modeling of tight sandstone reservoirs.
2. Characteristics of Tight Sandstone Reservoir
The Upper Paleozoic tight sandstone gas reservoir in the eastern margin of the Ordos Basin is mainly developed in the Permian Shihezi Formation and Carboniferous Benxi Formation, belonging to fluvial deltaic depositional systems [,,]. The reservoir is dominated by lithic sandstone, followed by lithic quartz sandstone and feldspar lithic sandstone, which is characterized by high lithic content near provenance. Due to the complexity of reservoir lithology and diagenetic processes, the reservoir exhibits strong heterogeneity and complex pore–throat structures.
2.1. Characteristics of Pore Spaces
There are various types of pore space in tight sandstone reservoirs, but the reservoir is obviously controlled by lithology. Thin section data show that secondary pores, microfractures, and intergranular pores are mainly developed in quartz sandstone and lithic quartz sandstone, and a few primary pores are developed in-between mineral particles, among which the pore space is dominated by secondary dissolution pores. The primary pores play a major role in controlling the fluid flow capacity (Figure 1a,b). The dissolved particles of feldspar lithic sandstone are dominated by feldspar minerals, and the pore spaces include intergranular pores and intragranular pores. The dissolution pores between the development grains dissolved along the grain edges and interstitial material show a harbor shape and chicken bone shape (Figure 1c). The dissolution holes in the particles are mainly dissolved along the cleavage surface of minerals or some easily soluble minerals of rock chips, which are completely dissolved to form mold holes, or partially dissolved (Figure 1d). Lithic sandstone mainly develops dissolution pores, which is mainly caused by the dissolution of unstable minerals in lithic. Due to the influence of the sedimentary environment and formation water activities, tight sandstone reservoirs have many pore types and complex pore–throat structures, which are the main reason for a poor porosity–permeability correlation.
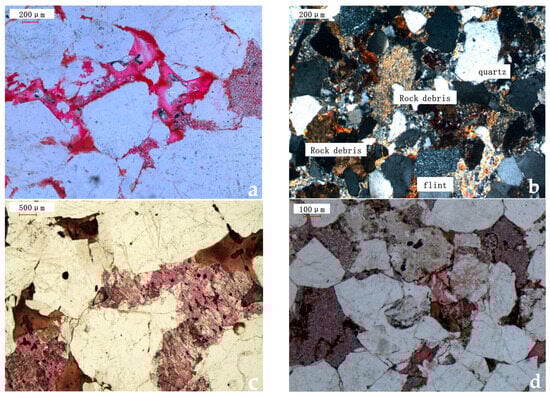
Figure 1.
Microscopic features of tight sandstone reservoir thin sections: (a) quartz sandstone, with residual intergranular pores, as well as sheet-like and curvilinear throat development, at 2243.22 m, (b) lithic quartz sandstone, primarily characterized by dissolution pores, with poor development of intercrystalline pores, microfractures, and intergranular pores, at 2193.06 m, (c) feldspar lithic sandstone, developed intergranular and intragranular solution holes, at a depth of 2210.35 m, and (d) lithic sandstone, developed lithic solution pores, intergranular pores, intergranular pores, at a depth of 2245.43 m.
2.2. Physical Properties
The Upper Paleozoic tight sandstone reservoir in the eastern margin of the Ordos Basin exhibits strong heterogeneity and complex pore–throat structures []. Using the AP608 porosity and permeability logging tool produced by CoreTest, porosity and permeability data of 138 tight sandstone core samples were measured. The cross-plot of porosity and permeability is shown (Figure 2), the porosity ranges from 2.6% to 7.8%, with an average of 4.8%. The permeability ranges from 0.02 × 10⁻³ μm2 to 8.6 × 10⁻³ μm2, with an average of 0.37 × 10⁻³ μm2, where 1 × 10⁻³ μm2 = 1 millidarcy (mD). Porosity and permeability are poorly correlated, and a single porosity corresponds to a large range of permeability. The reservoir generally is characterized as a tight sandstone reservoir. It can be seen that due to the complex pore–throat structure and poor relationship between porosity and permeability, a permeability model established by traditional modeling technology is incapable of accurate prediction. Therefore, it is significant to develop a new permeability model to improve the calculation accuracy.
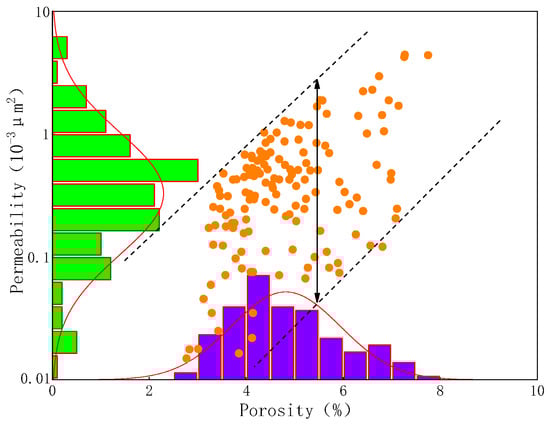
Figure 2.
Relationship between porosity and permeability on the basis of core analysis.
3. Reservoir Classification Based on Flow Unit
Reservoir permeability is mainly affected by porosity, pore structure, and other factors. For tight sandstone reservoirs, the pore–throat structure is complex, permeability is controlled by the pore–throat structure, and the correlation between porosity and permeability is poor, so it is necessary to conduct permeability classification modeling []. The Kozeny–Carman theory proposes a flow unit method based on the concept of average hydraulic radius to identify and characterize reservoir permeability [,]. Flow units are controlled by the mineral composition and structure of the reservoir rock, and thick layers are divided into different flow units based on pore–throat characteristics. According to the principles of flow mechanics in the Kozeny–Carman theory [], using the average hydraulic radius, the flow units can be related to porosity and permeability. Their relationship is expressed as follows:
where K is permeability, is porosity, is the pore geometry factor and is set as 3 for spherical pores and 2 for columnar and board-shaped throat, τ is the curvature of the flow path, and is the average pore radius. The equation establishes the quantitative relationship between macroscopic physical properties and microscopic pore–throat characteristic parameters.
The relationship between the average pore–throat radius and the pore-specific surface area is as follows []:
where is the pore-specific surface area. Substituting it into Equation (1), we obtain:
Divide both sides of the equation by and take the square root to obtain:
Here, Fps τ2 is a constant value fixed in the same flow unit but variable for different flow units. Define FZI as:
set:
where 0.0314 is the conversion coefficient for k from μm2 to mD, RQI is the reservoir quality index, and is the normalized porosity.
Taking the logarithm of both sides of the equation, we obtain:
The equation above shows that RQI and , when plotted on a double logarithmic coordinate system, will have sample points with the same values distributed along a line with a slope of 1, while sample points with different values will be located on lines with different slopes. Thus, reservoir classification can be based on these values, and the same reservoir type will have similar pore–throat characteristics.
Based on the above principles, the reservoir quality index, normalized porosity, and flow zone index were computed using core analysis data from 138 samples of the Upper Paleozoic tight sandstone reservoirs in the Ordos Basin. The classification criteria for the flow zone index were determined using the normal probability distribution plot method. By observing the distribution pattern of the flow zone index on the probability plot, continuous data points with obvious linear features that satisfy the characteristics of a normal distribution were used to establish classification boundaries to determine the categories of flow zones. The intersection of every two straight lines represents the classification boundary of the flow zone index, indicating the range of flow zone index values associated with each category. Based on the classification boundaries shown in the normal probability distribution plot of the flow zone index in Figure 3, the experimental data were divided into four flow zone bands, and the classification criteria for the flow zone index were determined as follows: Zone I (FZI ≥ 7.2); Zone II (7.2 > FZI ≥ 5.1); Zone III (5.1 > FZI ≥ 2.9); and Zone IV (FZI ≤ 2.9).
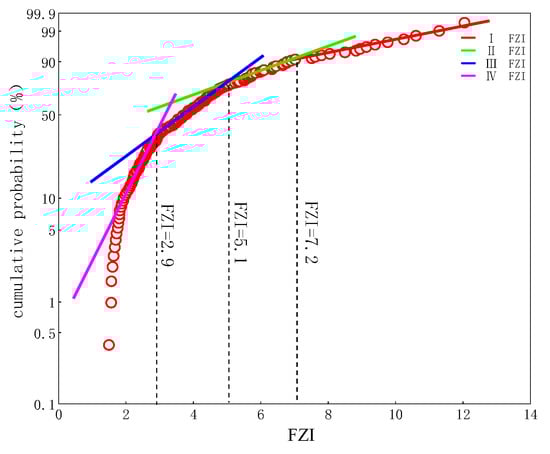
Figure 3.
Cumulative normal probability distribution of FZI.
The FZI classification chart depicted in Figure 4 indicates that, in the double logarithmic coordinate system of RQI and ϕz, the data points of different flow unit indices are clearly delineated under the FZI classification criteria. The correlation of the same FZI is significantly improved, indicating that the FZI classification criteria based on the normal probability distribution plot method can reflect the influence of reservoir pore–throat structure on porosity and permeability correlation, meeting the requirements of permeability classification modeling.
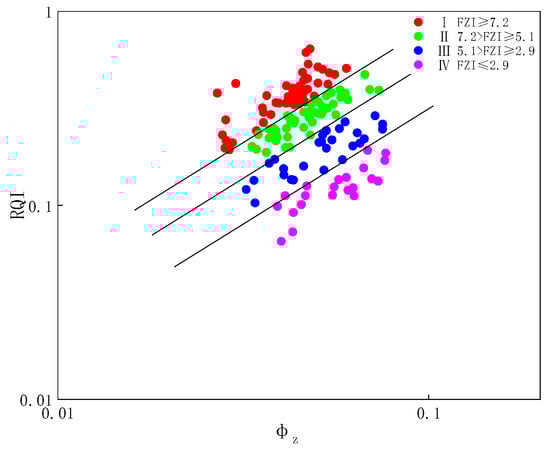
Figure 4.
Reservoir quality index vs. normalized porosity.
The relationship between porosity and permeability, constructed based on the FZI classification, is shown in Figure 5. It demonstrates that the correlation between porosity and permeability notably improves with the FZI classification. According to the intersection characteristics of porosity and permeability, the reservoir is identified as Class IV according to the FZI. The permeability model is established for each type of reservoir by using the statistical regression method, as shown in Table 1. The corresponding correlation coefficients are as high as 0.9. Compared with the permeability of core analyses (Figure 6), the matching between calculated permeability and measured permeability is significantly improved, and the error is evidently reduced. This shows that the FZI-based permeability model is rather accurate.
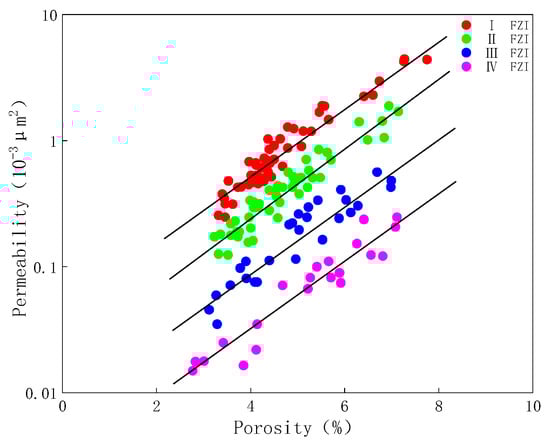
Figure 5.
Cross-plot of porosity and permeability based on reservoir classification.

Table 1.
Statistical table of permeability calculation model based on FZI.
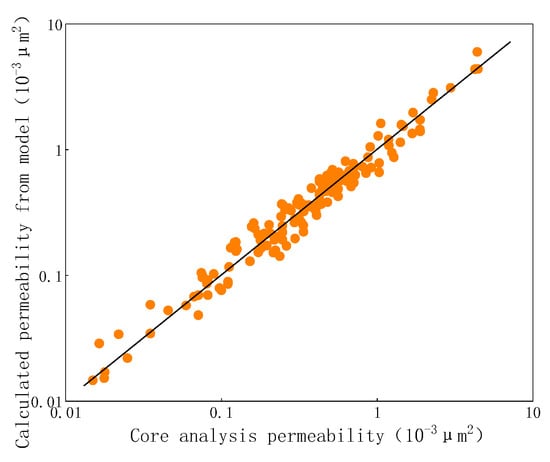
Figure 6.
Comparison between calculated permeability and core analysis permeability.
4. FZI Calculation Method Based on the Geometric Mean of NMR T2
The mapping relationship between FZI and logging response is constructed, so as to calculate the reservoir permeability by using logging data, which is the key for practical application [,]. Pore–throat structure is the main controlling factor of tight sandstone permeability, and the FZI also reflects the complex porosity–permeability relationship and pore–throat characteristics [,,]. The micropore throat structure characteristics indicated by the NMR T2 geometric mean correlates well with capillary pressure curves obtained from mercury penetration testing [,,]. It is found that there is a functional relationship between the geometric mean of NMR T2 and FZI, which is employed to calculate permeability by reservoir classification.
As a characteristic parameter reflecting pore structure, a geometric mean of NMR T2 is the mean value of each T2 and its corresponding signal amplitude. The specific calculation method is shown in Equation (10):
where is the geometric mean of NMR T2, ms; is the T2 value of each bin, ms; and is the NMR signal amplitude corresponding to each bin.
In order to study the pore–throat distribution characteristics of the Paleozoic tight sandstone gas reservoir in the research area, representative core samples of different pore and throat types were selected for nuclear magnetic and mercury penetration experiments. Based on the petrophysical experiments, a quantitative characterization method for reservoir micropore structure was established using the geometric mean of NMR T2. Firstly, porosity, permeability, and irreducible water saturation were measured by experiment. Then, we saturate the core with sodium chloride solution with similar salinity to the actual formation water, and measure the state of saturated water by NMR experiment. Finally, mercury penetration experiments were carried out.
Based on the porosity and permeability calculated from the analysis of rock physics experimental data, the FZI is classified according to reservoir classification criteria into four categories (Table 2). A comparative analysis is conducted by correlating the NMR T2 spectra and mercury injection capillary pressure characteristics with corresponding experimental samples, as shown in Figure 7. The displacement pressure of the Class I pore structure is about 0.33 MPa, with an average pore–throat radius of about 0.82 μm. The distribution of throat radius corresponding to large pore–throats is relatively concentrated, with a high peak, indicating that the pore structure is dominated by large throats. The NMR T2 spectrum shows a double-peak shape, with the dominant peak shifted to the right. This indicates a large volume of mobile fluid space, suggesting well-developed macropores. The displacement pressure of the Class II pore structure is approximately 0.50 MPa, with an average pore–throat radius of about 0.67 μm. The larger pore–throats correspond to a more concentrated distribution and higher peak values, indicating that the pore structure is primarily composed of large to medium throats. The NMR T2 spectrum exhibits a double-peak shape, with the dominant peak shifted to the right, indicating a relatively large volume of mobile fluid space and the development of medium to large pores. The displacement pressure of the pore structure in Class III is about 0.61 MPa, with an average pore–throat radius distribution of around 0.51 μm. The large pore–throats correspond to a relatively wide range of throat radii, with a lower peak, indicating that the pore structure is dominated by medium to large throats. The NMR T2 spectrum exhibits a bimodal shape, with the dominant peak shifted to the right and lower in amplitude, revealing the development of medium to large pores. The displacement pressure of Class IV pore structure is approximately 1.85 MPa, with an average pore–throat radius distribution of about 0.39 μm. The distribution of throat radius corresponding to large pores is wide with a low peak, indicating that the pore structure is dominated by medium to small throats. The NMR T2 spectrum shows a bimodal shape, with the dominant peak shifted to the left, suggesting a small volume of movable fluid space and indicating the development of medium to small pores. The peak distribution intervals of the mercury injection pore–throat distribution curves for each type of porous rock sample exhibit good correspondence and similar geometric shapes to the peak distribution intervals of the NMR porosity spectra, indicating a close relationship between NMR T2 distribution and rock pore structure. Across samples from Class I to Class IV, as rock properties deteriorate, both the mercury injection pore–throat distribution and NMR porosity components demonstrate a gradual decrease, showing good consistency with reservoir classification.
Table 2.
Classification criteria of tight sandstone reservoirs.
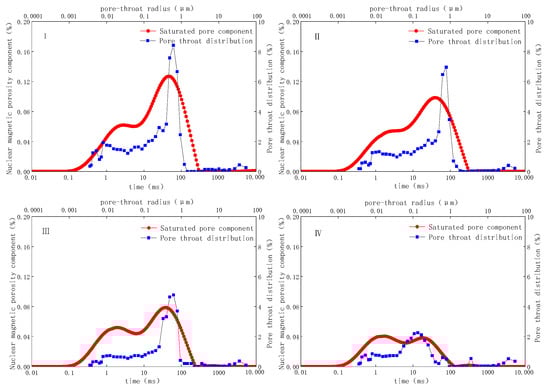
Figure 7.
Comparison of experimental results of T2 NMR spectra and mercury penetration pore structure of different types of cores.
Based on NMR–mercury injection combined testing, it is verified that there exists a close correlation and correspondence between the NMR T2 distribution and the pore–throat distribution determined by mercury injection. Utilizing the geometric mean of NMR T2 to characterize NMR spectral peak features and the average pore–throat radius to characterize pore–throat distribution, a coupling relationship between NMR and mercury injection is established. Figure 8 shows the relationship between the geometric mean of NMR T2 and the average pore–throat radius, indicating that the geometric mean of NMR T2 increases with the increase of the average pore–throat radius determined by mercury injection, demonstrating a good linear relationship. Based on this, a coupling relationship equation between the geometric mean of NMR T2 and the average pore–throat radius is constructed.
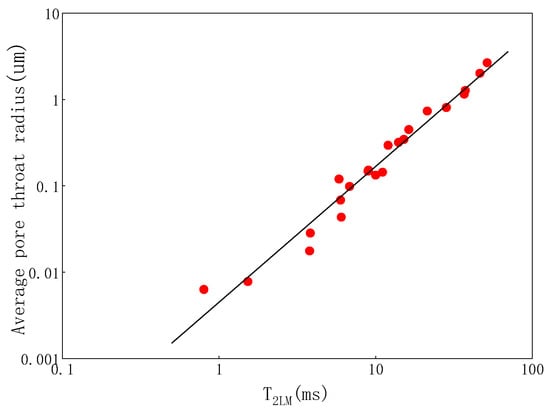
Figure 8.
Relationship between T2 geometric mean and average pore–throat radius.
The experiment shows that the average pore–throat radius r is linearly proportional to the T2 geometric mean:
Derive the model of the relationship between the FZI and the geometric mean of NMR T2 by substituting Equation (11) into Equations (2) and (5):
with , n is the power exponent of the geometric mean of NMR T2, then
where, a and n are model coefficients.
The experiment confirms a power function relationship between the FZI and the geometric mean of NMR T2. The coefficient a in Equation (13) is associated with parameters such as porosity shape factor, specific surface area, and normalized porosity. Figure 9 depicts the relationship between the FZI calculated by using core analysis porosity and permeability, and the geometric mean of NMR T2. It is shown that there is a positive correlation between the geometric mean of NMR T2 and the FZI, similar to Equation (13). Based on experimental analysis data of tight sandstones from the Paleozoic era in the eastern margin of the Ordos Basin, an empirical equation for calculating the FZI in this region is fitted as follows:
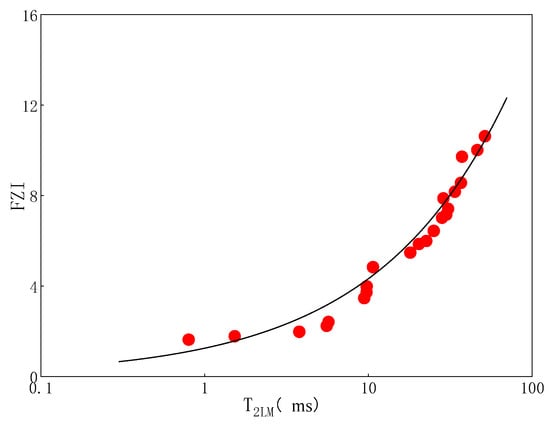
Figure 9.
Relationship between T2 geometric mean and FZI.
In the actual well data calculation process, the FZI is directly calculated by extracting the geometric mean of NMR T2 over a continuous depth range. This facilitates permeability classification modeling and thus enables reservoir classification across the entire wellbore at continuous depths.
5. Application
The Upper Paleozoic tight sandstone gas reservoir in the eastern margin of the Ordos Basin has strong heterogeneity and complex pore–throat structure []. Based on the permeability modeling, the FZI relationship is constructed by using the geometric mean of NMR T2, forming a method for accurate permeability calculation by logging data. Figure 10 depicts the logging evaluation results of Well X in the study area: the sixth track shows the FZI calculated based on the geometric mean of NMR T2, while the eighth track displays the permeability of tight sandstone reservoirs calculated using the permeability classification model based on Table 1. Employing the root mean square error (RMSE) statistical method for permeability, the RMSE between the model-calculated permeability and the core analysis permeability is 0.18 × 10⁻³ μm2, with an average relative error of 45.8%. This demonstrates that the permeability modeling based on the geometric mean of NMR T2 and FZI classification effectively enhances the accuracy of permeability calculation and holds promising applicability and prospects for application.
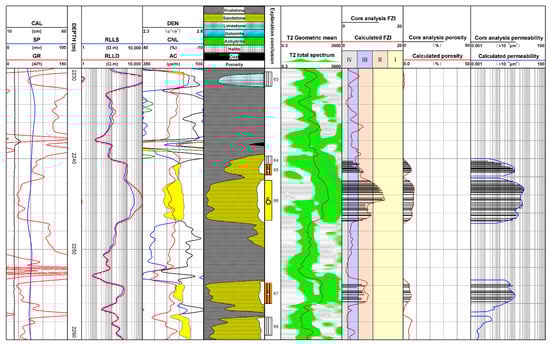
Figure 10.
Well logging evaluation in Well X.
6. Conclusions
The article addresses the technical challenges in the high-precision calculation of permeability in tight sandstone reservoirs of the Upper Paleozoic in the eastern margin of the Ordos Basin. It proposes a permeability calculation method based on NMR logging and FZI classification. This method utilizes the geometric mean of NMR T2 to predict the FZI and categorizes reservoir types based on different FZI values, thereby constructing a high-precision classification permeability calculation model. The absolute error between FZI values calculated from NMR logging and those analyzed from core samples is less than 0.15. After classification, the relationship between porosity and permeability significantly improves for each reservoir category, with correlation coefficients exceeding 0.9. The root mean square error (RMSE) between permeability calculated from NMR logging and core analysis is 0.18, with an average relative error of 45.8%. This confirms the effectiveness of the newly proposed method for permeability calculation in tight sandstone reservoirs. However, this classification permeability calculation method cannot yet be extended to conventional well logs. The introduction of this method is significant for the high-precision calculation of permeability in similar tight reservoirs, offering broad prospects for achieving refined evaluation and production in tight oil reservoirs.
Author Contributions
Writing—original draft, Z.L.; Writing—review & editing, X.L. and Q.S.; Supervision, A.S., F.H. and Z.Z. All authors have read and agreed to the published version of the manuscript.
Funding
Heilongjiang Provincial Natural Science Foundation Joint Guidance Project (LH2021D010).
Data Availability Statement
The data presented in this study are available on request from the corresponding author.
Conflicts of Interest
Authors Zhongkui Liang, Aiyan Sun were employed by the company Jidong Oilfield Company, PetroChina. Author Fang Hou was employed by the company PetroChina Changqing Oilfield Company. The remaining authors declare that the research was conducted in the absence of any commercial or financial relationships that could be construed as a potential conflict of interest.
References
- Dai, J.; Ni, Y.; Wu, X. Tight sandstone gas in China and its significance in exploration and development. Pet. Explor. Dev. 2012, 39, 277–284. [Google Scholar] [CrossRef]
- Holditch, S.A. Tight Gas Sands. J. Pet. Technol. 2006, 58, 86–93. [Google Scholar] [CrossRef]
- Kokkinos, N.C.; Nkagbu, D.C.; Marmanis, D.I.; Dermentzis, K.I.; Maliaris, G. Evolution of Unconventional Hydrocarbons: Past, Present, Future and Environmental FootPrint. J. Eng. Sci. Technol. Rev. 2022, 15, 15–24. [Google Scholar] [CrossRef]
- Fu, X.; Wang, H.; Feng, Y.; Shi, Z.; Zhang, B. Determination of reservoir characteristics and lower limit of physical properties of Member 8 of Shihezi Formation, Mizhi Area, eastern Ordos Basin. Nat. Gas Explor. Dev. 2002, 45, 33–39. [Google Scholar]
- Zou, C.N.; Yang, Z.; Tao, S.Z.; Yuan, X.J.; Zhu, R.K.; Hou, L.H.; Wu, S.T.; Sun, L.; Zhang, G.S.; Bai, B.; et al. Continuous hydrocarbon accumulation over a large area as a distinguishing characteristic of unconventional petroleum: The Ordos Basin, North-Central China. Earth-Sci. Rev. 2013, 126, 358–369. [Google Scholar] [CrossRef]
- Wu, X.; Liu, Z.; Wang, J.; Zheng, M.; Chen, X.; Qi, X. The potential, distribution and key exploration areas of oil and gas resources in China. Earth Sci. Front. 2022, 29, 146–155. [Google Scholar]
- Haider, W.H. Estimates of Total Oil & Gas Reserves in The World, Future of Oil and Gas Companies and SMART Investments by E & P Companies in Renewable Energy Sources for Future Energy Needs. In Proceedings of the International Petroleum Technology Conference, Dhahran, Saudi Arabia, 13–15 January 2020; IPTC: Pittsburgh, PA, USA, 2020. [Google Scholar]
- Moridis, G.J.; Collett, T.S.; Pooladi-Darvish, M.; Hancock, S.; Santamarina, C.; Boswell, R.; Kneafsey, T.; Rutqvist, J.; Kowalsky, M.; Reagan, M.T.; et al. Challenges, Uncertainties and Issues Facing Gas Production from Hydrate Deposits in Geologic Systems. In Proceedings of the SPE Unconventional Gas Conference, Pittsburgh, PA, USA, 23–25 February 2010; SPE: Dhahran, Saudi Arabia, 2010. [Google Scholar]
- Fu, N.; Yang, S.; He, Q.; Xu, W.; Lin, Q. Efficient reservoir-forming conditions of tight sandstone gas in LinxingShenfu block, eastern margin of Ordos Basin. Acta Pet. Sin. 2016, 37, 111–120. [Google Scholar]
- Lin, L.; Wang, J.; Liu, X.; Wen, X.; Sun, J. Permeability prediction of tight reservoir based on artificial neural network. Well Logging Technol. 2021, 45, 179–184. [Google Scholar]
- Meng, W.; Lv, Z.; Tang, Y.; Feng, M. Reservoir permeability prediction based on sandstone fabric classification and evaluation. J. China Univ. Pet. 2013, 37, 1–6+13. [Google Scholar]
- dos Anjos, C.E.M.; de Matos, T.F.; Avila, M.R.V.; Fernandes, J.D.C.V.; Surmas, R.; Evsukoff, A.G. Permeability estimation on raw micro-CT of carbonate rock samples using deep learning. Geoenergy Sci. Eng. 2023, 2022, 211335. [Google Scholar] [CrossRef]
- Xia, B.; Liao, C.; Luo, Y.; Ji, K. Fractal theory-based permeability model of fracture networks in coals. Coal Geol. Explor. 2023, 51, 107–115. [Google Scholar]
- Wang, F.Y.; Wang, L. Pore structure analysis and permeability prediction of shale oil reservoirs with HPMI and NMR: A case study of the Permian Lucaogou Formation in the Jimsar Sag, Junggar Basin, NW China. J. Pet. Sci. Eng. 2022, 214, 110503. [Google Scholar] [CrossRef]
- Jiang, X.; Tian, L.; Liu, Q.; Sun, R. Research on unconventional natural gas development strategy in China. China Energy 2017, 39, 8–11. [Google Scholar]
- Zhao, J.; Fu, J.; Yao, J.; Liu, X.; Wang, H.; Cao, Q.; Wang, X.; Ma, Y.; Fan, Y. Reservoir formation model of quasi-continuous tight sandstone gas field in Ordos Basin. Acta Pet. Sin. 2012, 33, 37–52. [Google Scholar]
- Yang, H.; Fu, J.; Liu, X.; Meng, P. Upper Paleozoic tight gas accumulation conditions and exploration and development in Ordos Basin. Pet. Explor. Dev. 2012, 39, 295–303. [Google Scholar] [CrossRef]
- Li, X.; Qin, R.; Ping, H.; Cao, J.; Wang, P. Establishment and application of high precision permeability model. J. China Univ. Pet. 2020, 44, 14–20. [Google Scholar]
- Song, Z.; Chen, R.; Kang, L.; Yang, J.; Pan, L.; Wang, J.; Lu, X. Analysis method of reservoir flow unit division and description. J. Xi’an Shiyou Univ. 2005, 20, 56–59. [Google Scholar]
- Li, Y.; Liu, J. Principles and Methods of Flow Unit Research; Geological Publishing House: Beijing, China, 2005; pp. 11–19. [Google Scholar]
- Carman, P.C. Fluid flow through granular beds. Trans. Inst. Chem. Eng 1937, 15, 150–166. [Google Scholar] [CrossRef]
- Kozeny, J. Uber Kapillare Leitung des Wassers im Boden. Sitzungs berichte. Akad. Wiss. Wien 1927, 136, 271–306. [Google Scholar]
- Zhao, J.; Cao, G.; Wu, Y. Application of multiple membership function in tight sandstone reservoir classification. Nat. Gas Geosci. 2018, 29, 1553–1558. [Google Scholar]
- Rosenbrand, E.; Fabricius, I.L.; Fisher, Q.; Grattoni, C. Permeability in Rotliegend gas sand stones to gas and brine as predicted from NMR, mercury injection and image analysis. Mar. Pet. Geol 2015, 64, 189–202. [Google Scholar] [CrossRef]
- Yan, W.; Sun, J.; Dong, H.; Cui, L. Investigating NMR-based absolute and relative permeability models of sandstone using digital rock techniques. J. Pet. Sci. Eng. 2021, 207, 109105. [Google Scholar] [CrossRef]
- Jin, G.; Xie, R.; Liu, M.; Guo, J.; Gao, L. A new method for permeability estimation using integral transforms basedon NMR echo data in tight sandstone. J. Pet. Sci. Eng. 2019, 180, 424–434. [Google Scholar] [CrossRef]
- Fan, Y.; Liu, J.; Ge, X.; Deng, S.; Liu, H.; Gu, D. A new permeability evaluation method of tight sandstone based on nuclear magnetic resonance double cutoff values. Chin. J. Geophys. 2018, 61, 1628–1638. [Google Scholar]
- Liu, M.; Xie, R.; Li, C.; Gao, L. A New Method for Determining Tight Sandstone Permeability Based on the Characteristic Parameters of the NMR T2 Distribution. Appl. Magn. Reson. 2017, 48, 1009–1029. [Google Scholar] [CrossRef]
- Li, Z.; Cui, Y.; Guan, Y.; Wang, M. Permeability determination method of low porosity reservoir based on pore size distribution and T2 spectrum. J. China Univ. Pet. 2018, 42, 34–40. [Google Scholar]
- Xiao, L. Nuclear Magnetic Resonance Imaging Logging and Nuclear Magnetic Resonance of Rock and Its Application; Science Press: Beijing, China, 1998. [Google Scholar]
- Liu, C.; Zhang, D.; Li, C.; Lu, Y.; Yu, S.; Guo, M. Accumulation conditions and main controlling factors of Upper Paleozoic tight sandstone gas reservoir in Linxing Block, Ordos Basin. Oil Gas Geol. 2019, 42, 1146–1158. [Google Scholar]
Disclaimer/Publisher’s Note: The statements, opinions and data contained in all publications are solely those of the individual author(s) and contributor(s) and not of MDPI and/or the editor(s). MDPI and/or the editor(s) disclaim responsibility for any injury to people or property resulting from any ideas, methods, instructions or products referred to in the content. |
© 2024 by the authors. Licensee MDPI, Basel, Switzerland. This article is an open access article distributed under the terms and conditions of the Creative Commons Attribution (CC BY) license (https://creativecommons.org/licenses/by/4.0/).