Article

Method for the Quantitative Evaluation of Low-Permeability Reservoir Damage in the East China Sea Based on Experimental Evaluation and Modeling Calculation

1
Exploration Department, CNOOC (China) Limited Shanghai Branch, Shanghai 200335, China
2
Research Institute, CNOOC (China) Limited Shanghai Branch, Shanghai 200335, China
3
School of Petroleum Engineering, Yangtze University, Wuhan 430100, China
*
Authors to whom correspondence should be addressed.
Processes 2024, 12(7), 1406; https://doi.org/10.3390/pr12071406
Submission received: 10 May 2024 / Revised: 3 June 2024 / Accepted: 10 June 2024 / Published: 5 July 2024
(This article belongs to the Topic Enhanced Oil Recovery Technologies, 3rd Volume)

Abstract

:
Reservoir damage is a key factor affecting reservoir evaluation, ensuring stable reservoir production and improving the utilization rate of oil and gas resources. At present, the evaluation of damage caused by reservoir drilling fluid is too empirical, and there is a lack of methods for the high-precision evaluation of reservoir damage after drilling fluid invasion and pollution. In a block in the East China Sea, the production capacity is limited due to an excessive balance of drilling fluid and long exposure time. In order to ensure safe drilling, the dynamic damage mechanism of drilling fluid during drilling was analyzed. The core of the main reservoir of well XH-1 in a block in the East China Sea was selected for carrying out an experiment evaluating the dynamic damage caused by drilling fluid. According to the experimental results, the damage rate of reservoir permeability caused by drilling fluid invasion ranges between 58.25 and 87.25%, and the overall dynamic damage degree can be classified between medium and high. Combined with the experimental parameters, a mathematical model of drilling fluid invasion depth was established, and the calculation formulas of drilling fluid invasion depth and contaminated skin were derived. The results showed that the drilling fluid depth of the reservoir section corresponding to the core of well XH-1 was 0.47~0.83 m, and the contaminated skin factor was 1.22~13.41, which made up for the lack of evaluation methods of reservoir damage caused by drilling fluid and provided a theoretical basis for the optimization of drilling fluid parameters and exploration drilling technology in oilfield operations.

1. Introduction

In recent years, oil and gas exploration and development have gradually entered deep and deep-water areas, with a significant increase in formation temperature and pressure [1,2,3]. There is a significant difference in the performance of drilling fluid under high-temperature and high-pressure compared to low-temperature and low-pressure conditions, and the increase in temperature and pressure may cause greater damage to the reservoir. With the development and utilization of global oil and gas resources, the difficulty of exploration has increased, and the issues of oil layer damage and protection are increasingly being considered. Once oil and gas formation damage occurs in drilling operations, the production efficiency of oil wells will be greatly reduced, the cost of oil and gas production will be increased, and significant economic losses will be easily caused [4,5]. During construction, the drilling fluid can be used to cool and lubricate the drill bit circularly, carry the generated rock cuttings to the ground, and clean the bottom of the well. When the oil and gas reservoir is drilled, the drilling fluid is the first external fluid to come into contact with the reservoir. To ensure operational safety and prevent the occurrence of well kicks and blowouts, the static hydraulic column pressure of the drilling fluid is usually greater than the formation pore pressure. Under this pressure difference, the drilling fluid will inevitably invade the reservoir, forming a reservoir damage zone in the vicinity of the wellbore, affecting the production capacity of the oil and gas reservoir [6,7,8].
Drilling fluid invasion is a complex physical process, and many scholars have conducted extensive research on the mechanism of drilling fluid invasion, drilling fluid invasion experiments, permeability damage evaluation, and other aspects. Some scholars use physical experiments to evaluate the degree of reservoir damage and optimize the drilling fluid according to the field application. Zhang et al. conducted an experimental analysis on an oilfield in the Bohai Sea to optimize the drilling fluid and reduce reservoir damage [9]. Han et al. carried out an extensive fluid selection process for offshore oilfields in Brazil to optimize drilling in a fluid to achieve maximum well productivity [10]. Doane et al. evaluated the dynamic damage caused by drilling fluid on a core gripper using both artificial and natural fractured core flow evaluations, which can simulate the dynamic circulation of drilling fluid [11,12]. Many scholars have analyzed and studied the related results of drilling fluid and reservoir damage through fine particle migration and retention models. Iscan A G et al. measured the functional relationship between the damage caused by two different drilling fluids and the filtration pressure through core experiments [13,14]. Kalhor Mohammadim et al. summarized the mechanical damage, chemical damage, and the interaction with reservoir rock fluid and discussed different filtration technologies and models [15]. Al-Yaseri et al. used in situ technology to study the movement of fine particles in sandstone at the micron pore scale and studied the relevant pore-scale mechanism leading to formation damage. Combined with the traditional permeability and production curve measurement, they proposed a new mechanical pore scale plugging model [16]. Recent studies have focused on evaluating the physical and chemical interactions between reservoirs and reservoir fluids. Es Muniz et al. conducted rock flow interaction experiments using shale samples collected to study the development relationship between osmotic pressure and the membrane effect [17,18]. HKJ Ladva et al. accurately calculated the displacement front under field conditions by using a specially constructed numerical simulator, introduced laboratory and large-scale storage yard test results, solved the key considerations of oil-based GP carrier fluid, and put forward suggestions on avoiding damage to gravel-packed wells drilled with oil-based RDF [19]. DB Bennion et al. discussed the optimal operating parameters for designing and implementing underbalanced drilling operations for specific reservoir applications. Properly designing and implementing underbalanced drilling operations can eliminate or significantly reduce formation damage caused by mud or drilling solid invasion, fluid entrainment, and capture effects, as well as potential adverse reactions between the invaded drilling or completion fluid and the reservoir matrix or in situ reservoir fluid [20]. The relationship between mud cake and drilling fluid dynamic damage has also been studied. Tan et al. conducted dynamic drilling fluid damage and filter cake pressure experiments on the Archean metamorphic rocks in Bohai and summarized three damage modes of the PDF-HSD drilling fluid system on the metamorphic rocks in the buried hills [21]. Cheng P, Duan, and others conducted research on the mechanism of mud cake formation and established a mud cake thickness prediction model through numerical simulation of the mud cake formation process [22,23]. Asad Elmgerbi et al. improved an experimental device for filter cake removal and proved that there was no obvious relationship between the green leaf volume and the degree of reservoir damage [24]. Other studies have shown the relationship between drilling fluid invasion and formation resistivity changes. Pan et al. established a correlation correction model of invasion depth and resistivity after research and analysis [25,26,27]. Zhang et al. conducted an experimental study on the damage caused by drilling fluid in tight sandstone in a certain block of the East China Sea, using the resistance testing method and volume method to calculate the invasion depth [28]. Guo and others have conducted systematic research on physical experimental simulation, drilling fluid invasion logging response characteristics, and numerical simulation of drilling fluid damage and have achieved rich theoretical and experimental results [29,30,31,32].
As early as the 20th century, scholars began to study the damage and protection of reservoirs by drilling fluids and established corresponding evaluation experimental methods and corresponding evaluation tools [33,34,35,36]. In terms of evaluating the damage to reservoirs caused by drilling fluid, the change in permeability before and after drilling fluid invasion is often used as an evaluation index, which is obviously not comprehensive enough. Based on previous research, this manuscript conducted dynamic damage evaluation experiments on the main reservoir of early exploration wells in a block in the East China Sea, which can simulate the comprehensive situation between drilling fluid and an oil and gas reservoir under actual conditions and is more conducive to selecting the drilling fluid system with the best field application and the least damage to the reservoir. According to the evaluation experiment results, the physical model of drilling fluid damage and the mathematical model of formation drilling fluid pollution depth are established, and the calculation formulas of drilling fluid invasion depth and skin factor are derived. The calculation results of the formula are used as important parameters for quantitative evaluation of reservoir damage, which can more comprehensively reflect the reservoir damage caused by drilling fluid invasion, and provide a theoretical basis for further optimization of drilling technology and drilling fluid systems.

2. Materials and Methods

In order to simulate the comprehensive situation of reservoir damage caused by drilling fluid invasion during field operation, the field core of a block in the East China Sea was selected for an experiment. During the experiment, low-free-water drilling fluid was mainly used for rock sample pollution, and the changes in rock sample permeability and flowback recovery rate before and after displacement were observed. A multi-functional dynamic damage evaluation instrument can better simulate the polluted state of an underground reservoir.

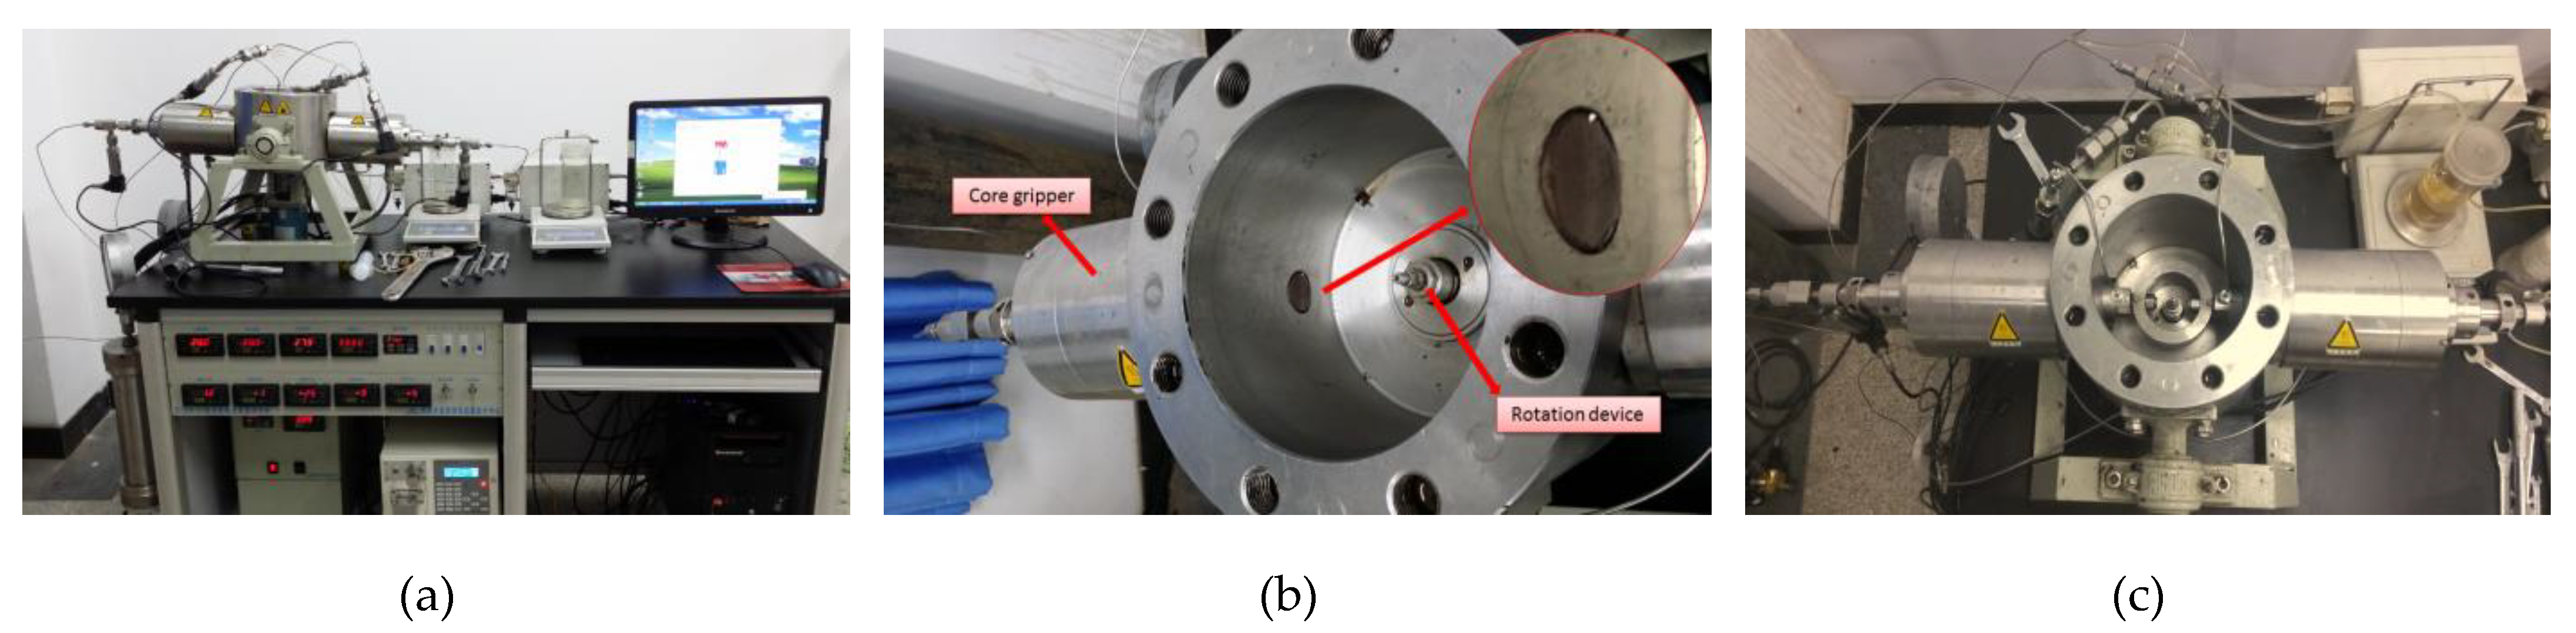
2.1. Experimental Materials and Instrument

The experimental materials were experimental cores with different parameters (see Table 1 for parameters), low-free-water drilling fluid (3% Seawater soil slurry+ 0.15% Na2CO3+ 0.2% NaOH+ 1.0% free water complexing agent PF-HXY-3+ 2% filter loss reducer PF-TEMP+ 2% plugging agents PF-DYFT-II+ 2% warm pressure film-forming agent PF-HCM+ 2% micelle agent PF-HSM+ 2% nano wall-fixing agent PF-@@W+ 3% KCL, heavy barite to 1.3 g/cm3). All materials used in the drilling fluid formula are from China Jingzhou Jiahua Technology Co., Ltd. (Jingzhou, China).
The experimental instrument was a multi-functional dynamic damage evaluation instrument (see Figure 1). Compared with the conventional drilling fluid damage instrument, the drilling fluid dynamic damage instrument used in this experiment is provided with a controller and a support. The support is provided with a kettle body, the inside of the kettle body is provided with a wellbore for placing drilling fluid, the well is provided with an agitator for stirring drilling fluid, and the outside of the kettle body is provided with a power component for driving the agitator. The upper end of the kettle body is provided with a well cover, which is provided with a data detection hole for installing the temperature and pressure sensor and a pressurization hole for installing the pressurization device. The increase in the kettle body can more truly simulate the damage caused by drilling fluid to oil and gas reservoirs under the actual downhole conditions. The side of the kettle body is provided with a core clamping component connected to the well, and the other end of the core clamping component is movably provided with a metering component. And the sensor is directly connected to the computer to monitor the change in permeability in real time, so as to determine the degree of damage and improve the accuracy of the evaluation of damage caused by drilling fluid.

2.2. Dynamic Damage Mechanism of Drilling Fluid

The experiment for the evaluation of dynamic damage caused by drilling fluid mainly evaluated the comprehensive damage caused by drilling fluid to oil and gas reservoirs under simulated actual working conditions, so as to provide a scientific basis for selecting the drilling fluid with the least damage to reservoirs and the optimal construction process parameters on site. Compared with the static damage evaluation, the dynamic damage evaluation can more truly simulate the damage caused by drilling fluid to oil and gas reservoirs under actual downhole conditions. The biggest difference between the two is that the states of the drilling fluid and core are different when they act. In the static damage evaluation, the flow direction of drilling fluid at the end face of the core is consistent with the axial direction of the core. In the dynamic damage evaluation, the drilling fluid is always in a state of continuous circulation or stirring in the core section to simulate the upward flow or shear flow of the fluid. Using the method for the evaluation of the dynamic damage caused by drilling fluid is closer to the field practice, and its experimental results are more instructive for drilling design and improvement.

2.3. Experiment for Evaluation of Dynamic Damage Caused by Drilling Fluid

The instrument used in the drilling fluid dynamic damage evaluation experiment is shown in Figure 2, and it could better restore the state of a reservoir polluted by downhole mud. The maximum confining pressure of the instrument could be controlled at 45 MPa, the maximum pressure in the cylinder was 35 MPa, the maximum heating temperature was 180 °C, and the maximum speed in the cylinder could reach 240 r/min. Two core experiments could be carried out at the same time to ensure the validity of the experimental data under the same conditions and simulate the wellbore conditions under actual drilling to the greatest extent. For this experiment, the evaluation standard for drilling fluid dynamic pollution experiments was adopted (the experimental conditions were pressure difference 3.0 MPa, shear rate 150 s−1, time 60 min).
(1)
Experimental steps of formation water damage displacement:
Pre-treatment of rock sample and evacuation of saturated formation water for 48 h;
Measurement of the positive permeability K0 of rock sample with formation water;
On the DTSH-III multi-functional damage evaluation instrument, the rock sample is contaminated with drilling fluid for 60 min under the pressure difference of 3.0 MPa, and the liquid output is measured;
The formation water forward drive is used to calculate the permeability of the rock sample Kd and the permeability flowback recovery rate of the rock sample Kd/K0.
(2)
Gas damage displacement test steps:
Rock samples are pretreated, saturated formation water is evacuated for 48 h, and irreducible water saturation is established by nitrogen gas flooding for 1 h under 2 MPa pressure difference;
Measurement of the positive permeability K0 of rock sample with nitrogen;
On the DTSH-Ⅲ multi-functional damage evaluation instrument, the rock sample is contaminated with drilling fluid for 60 min under the pressure difference of 3.0 MPa, and the liquid output is measured;
The permeability Kd of the rock sample and the recovery rate Kd/K0 of the permeability flowback of the rock sample are calculated by nitrogen forward drive.

3. Results

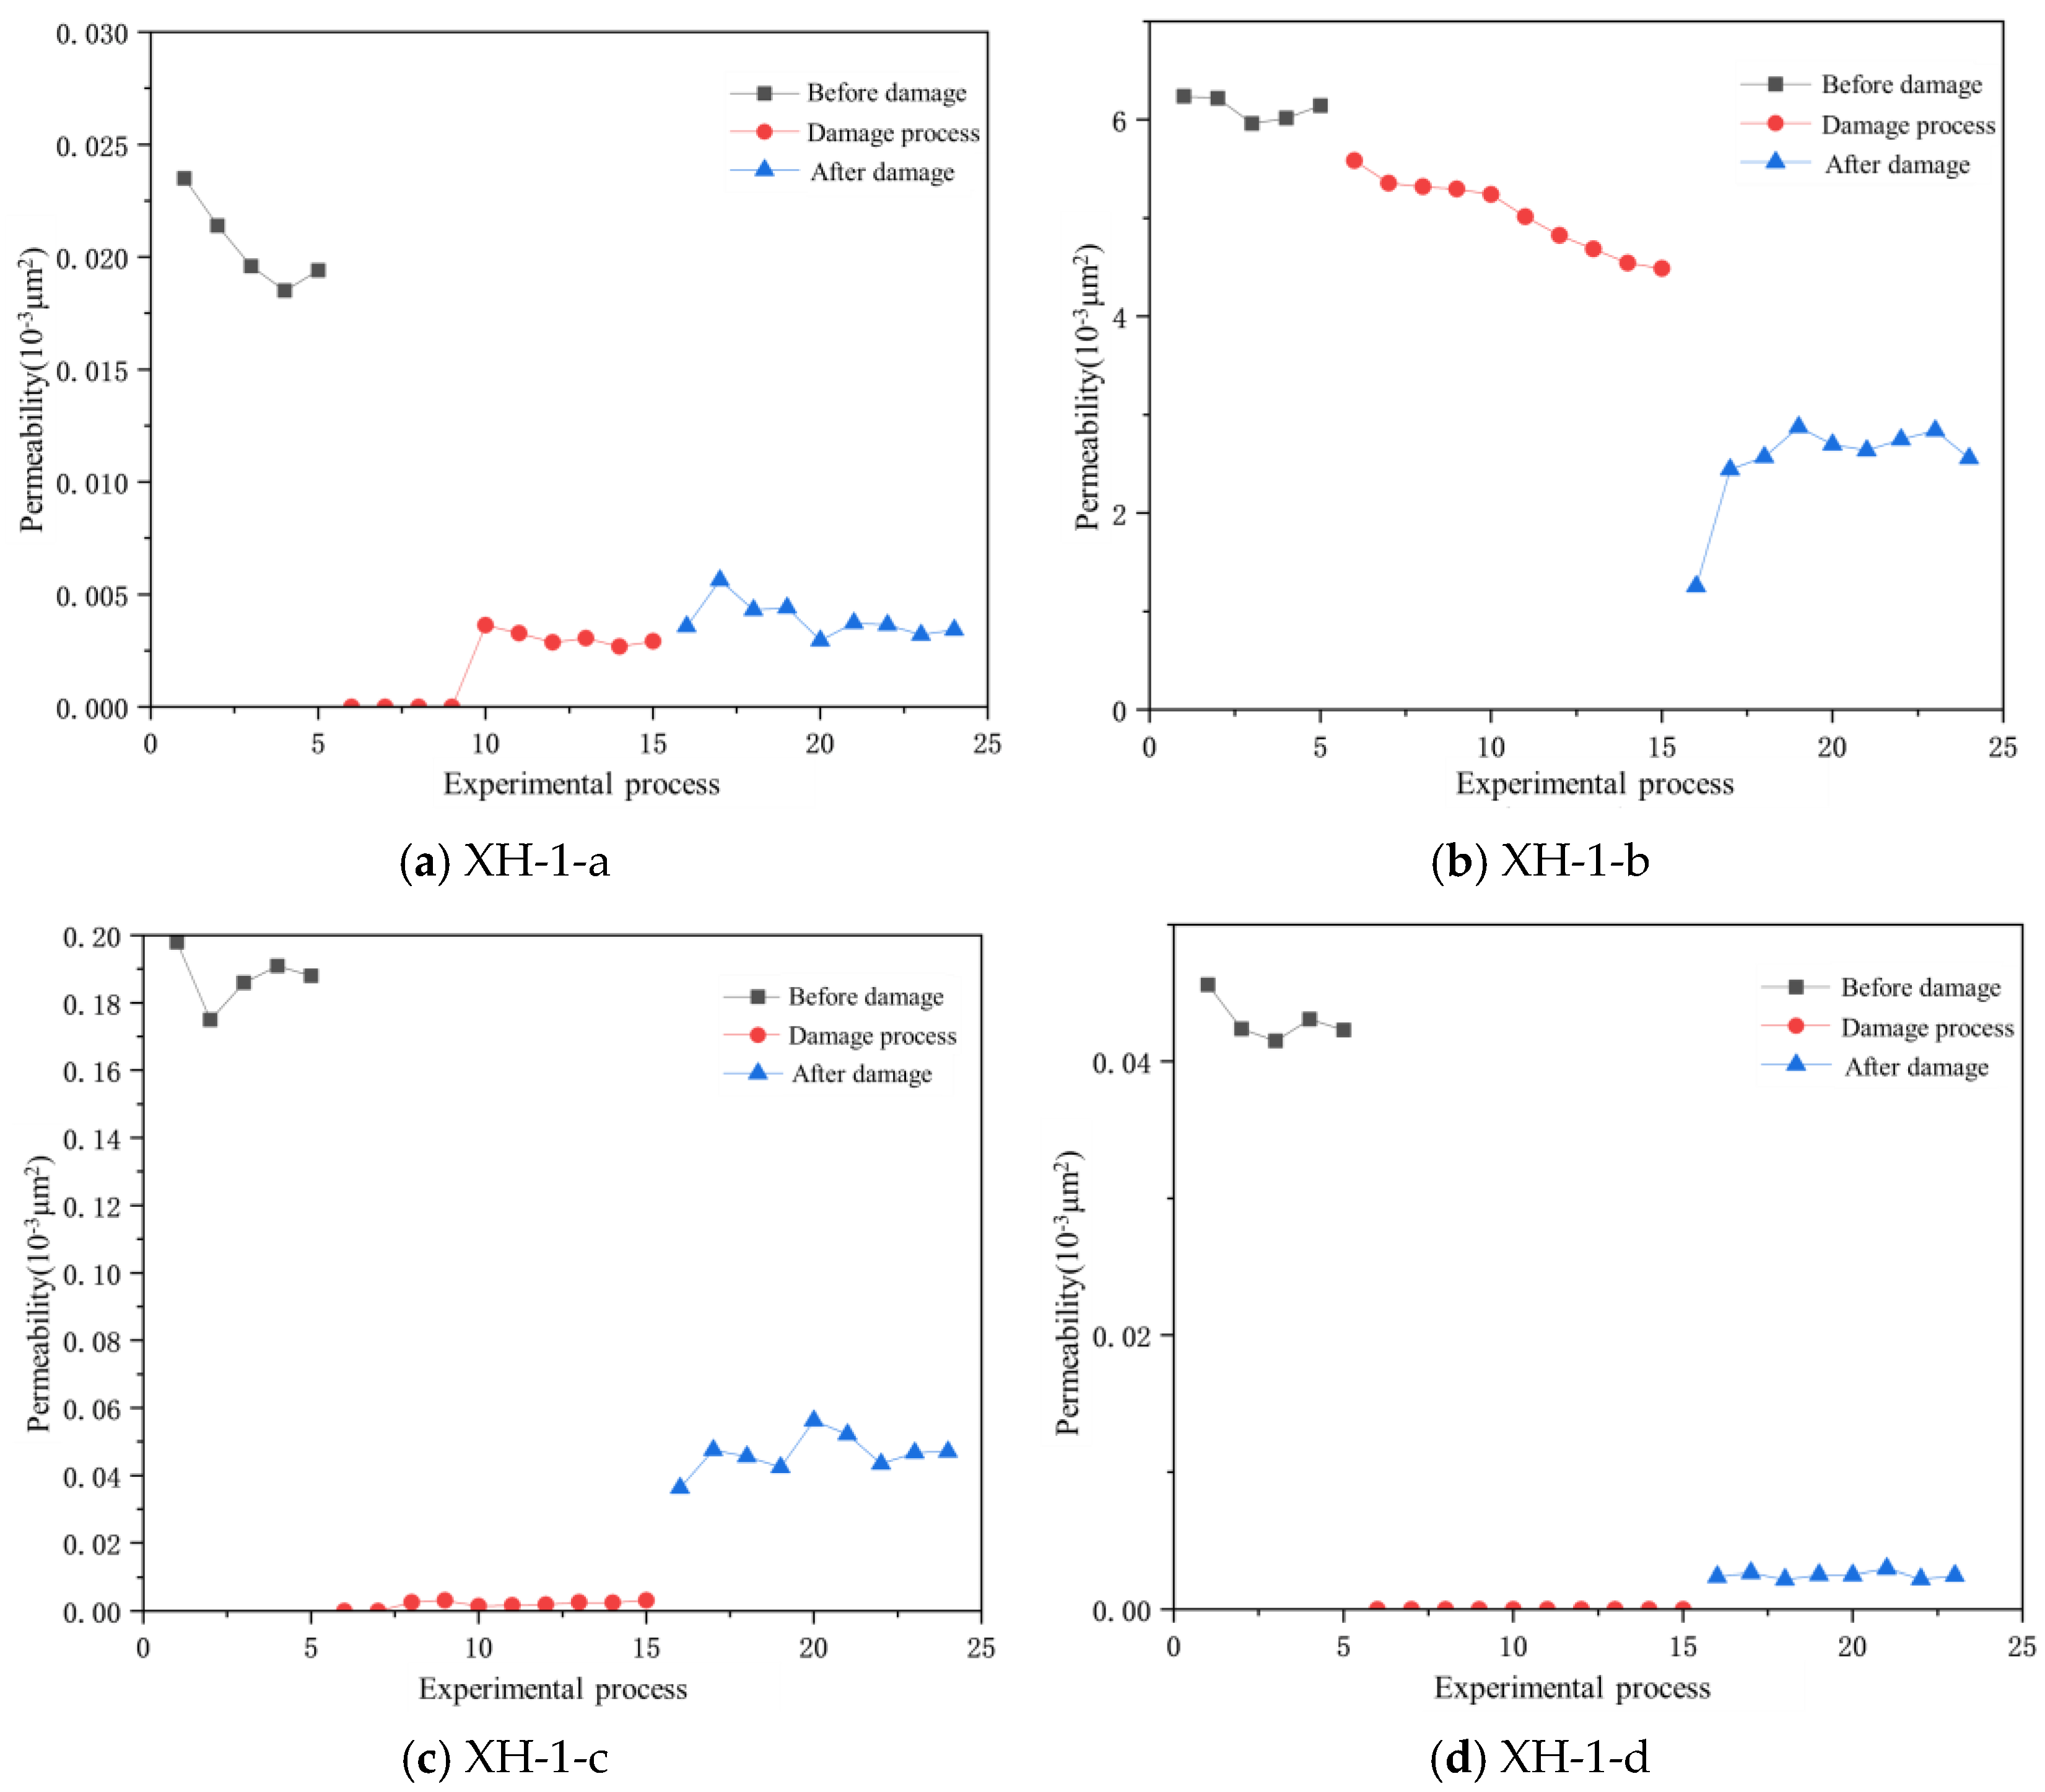
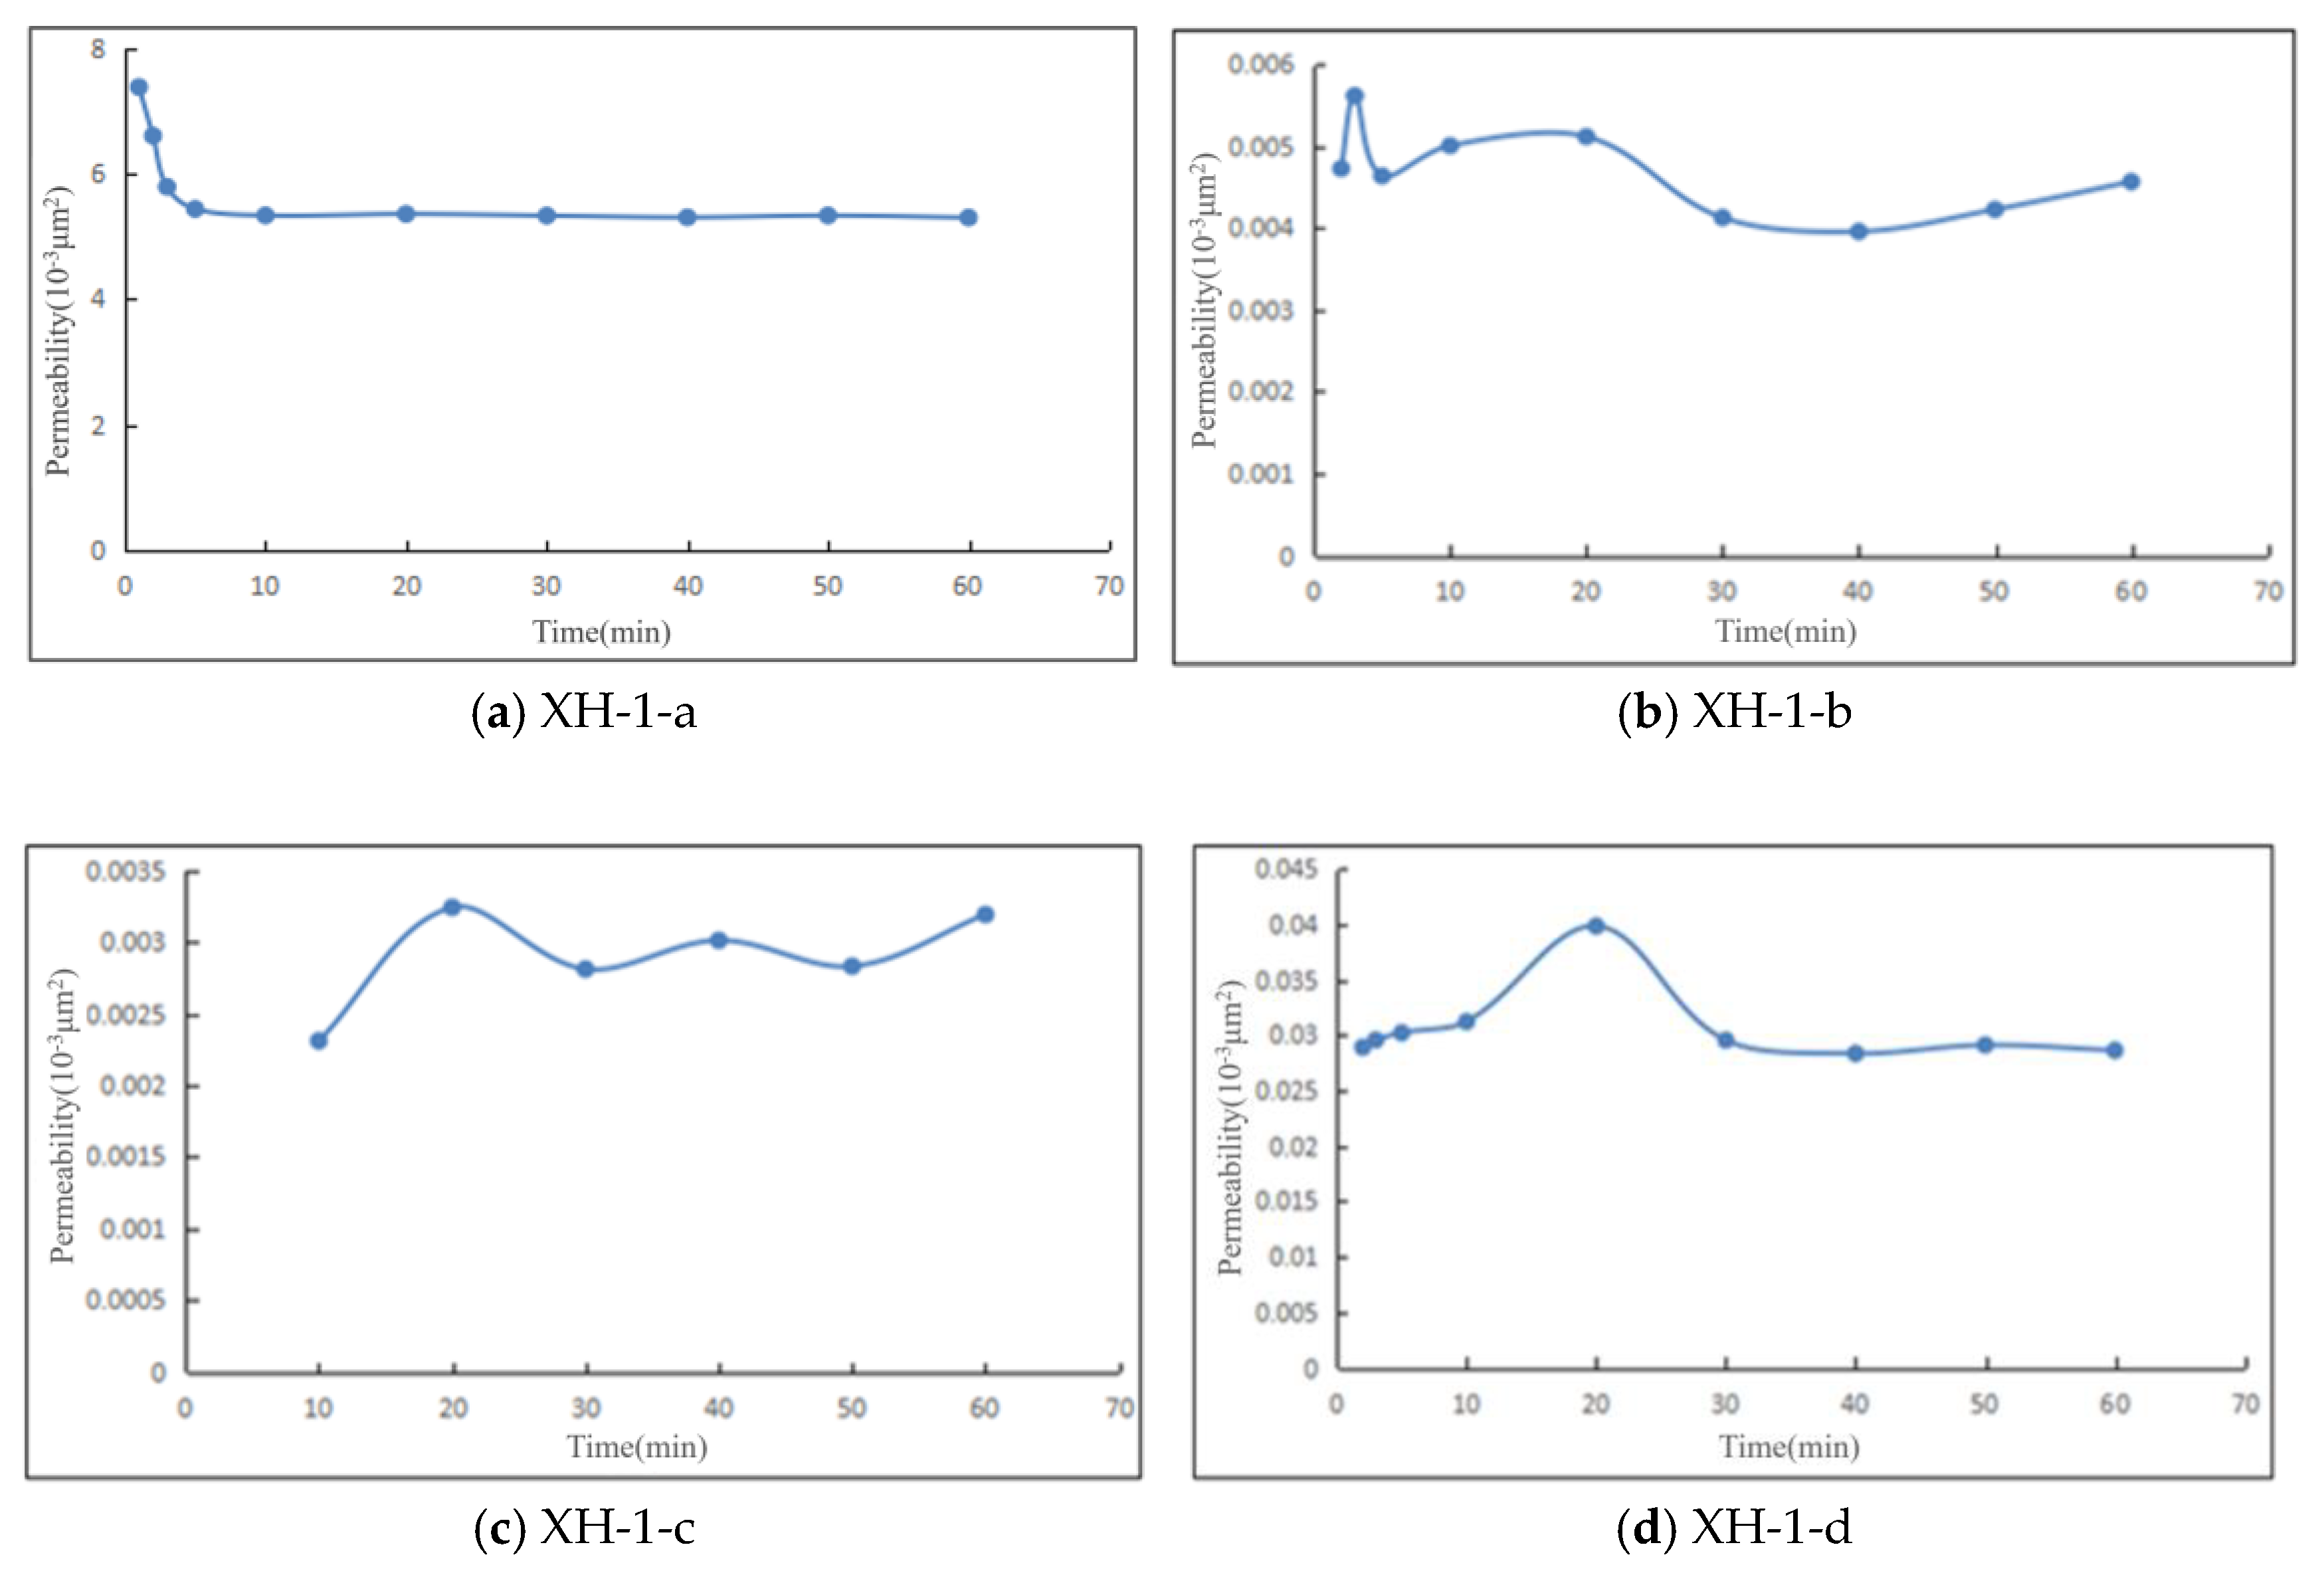
3.1. Dynamic Damage Evaluation of Reservoir under Formation Water Conditions

In response to the dynamic damage law of the main reservoir of the early key exploration well in a certain block of the East China Sea under formation water conditions, four cores of the main reservoir of the XH-1 well in a certain block were collected, and dynamic damage evaluation experiments were conducted on the reservoir using low-free-water drilling fluid under formation water drilling conditions.
According to the evaluation index of drilling fluid damage degree (Table 2) [37], rock core permeability data were measured before, during, and after drilling fluid damage during the experiment, and the changes in permeability were observed (as shown in Figure 3). The detailed experimental results are shown in Table 3.
Figure 3 shows the dynamic damage process of four cores in the main reservoir of the XH-1 well under the formation water environment. It can be clearly seen from the figure that the permeability of the core with lower permeability changes more significantly after dynamic damage to the reservoir core caused by low-free-water drilling fluid. From Table 3, it can be seen that the permeability damage rate of the four cores in the XH-1 well is 55.34~94.22%; among the cores, only the dynamic damage degree of the XH-1-b core is medium to high, and the dynamic damage degree is medium to high, and low-permeability cores have a higher damage rate and a higher degree of damage compared to slightly higher-permeability cores. The results show that the low permeability core has obvious damage under the condition of formation water, which may be due to the invasion of solid particles of drilling fluid and other polymer molecules into the core, resulting in greater dynamic damage.

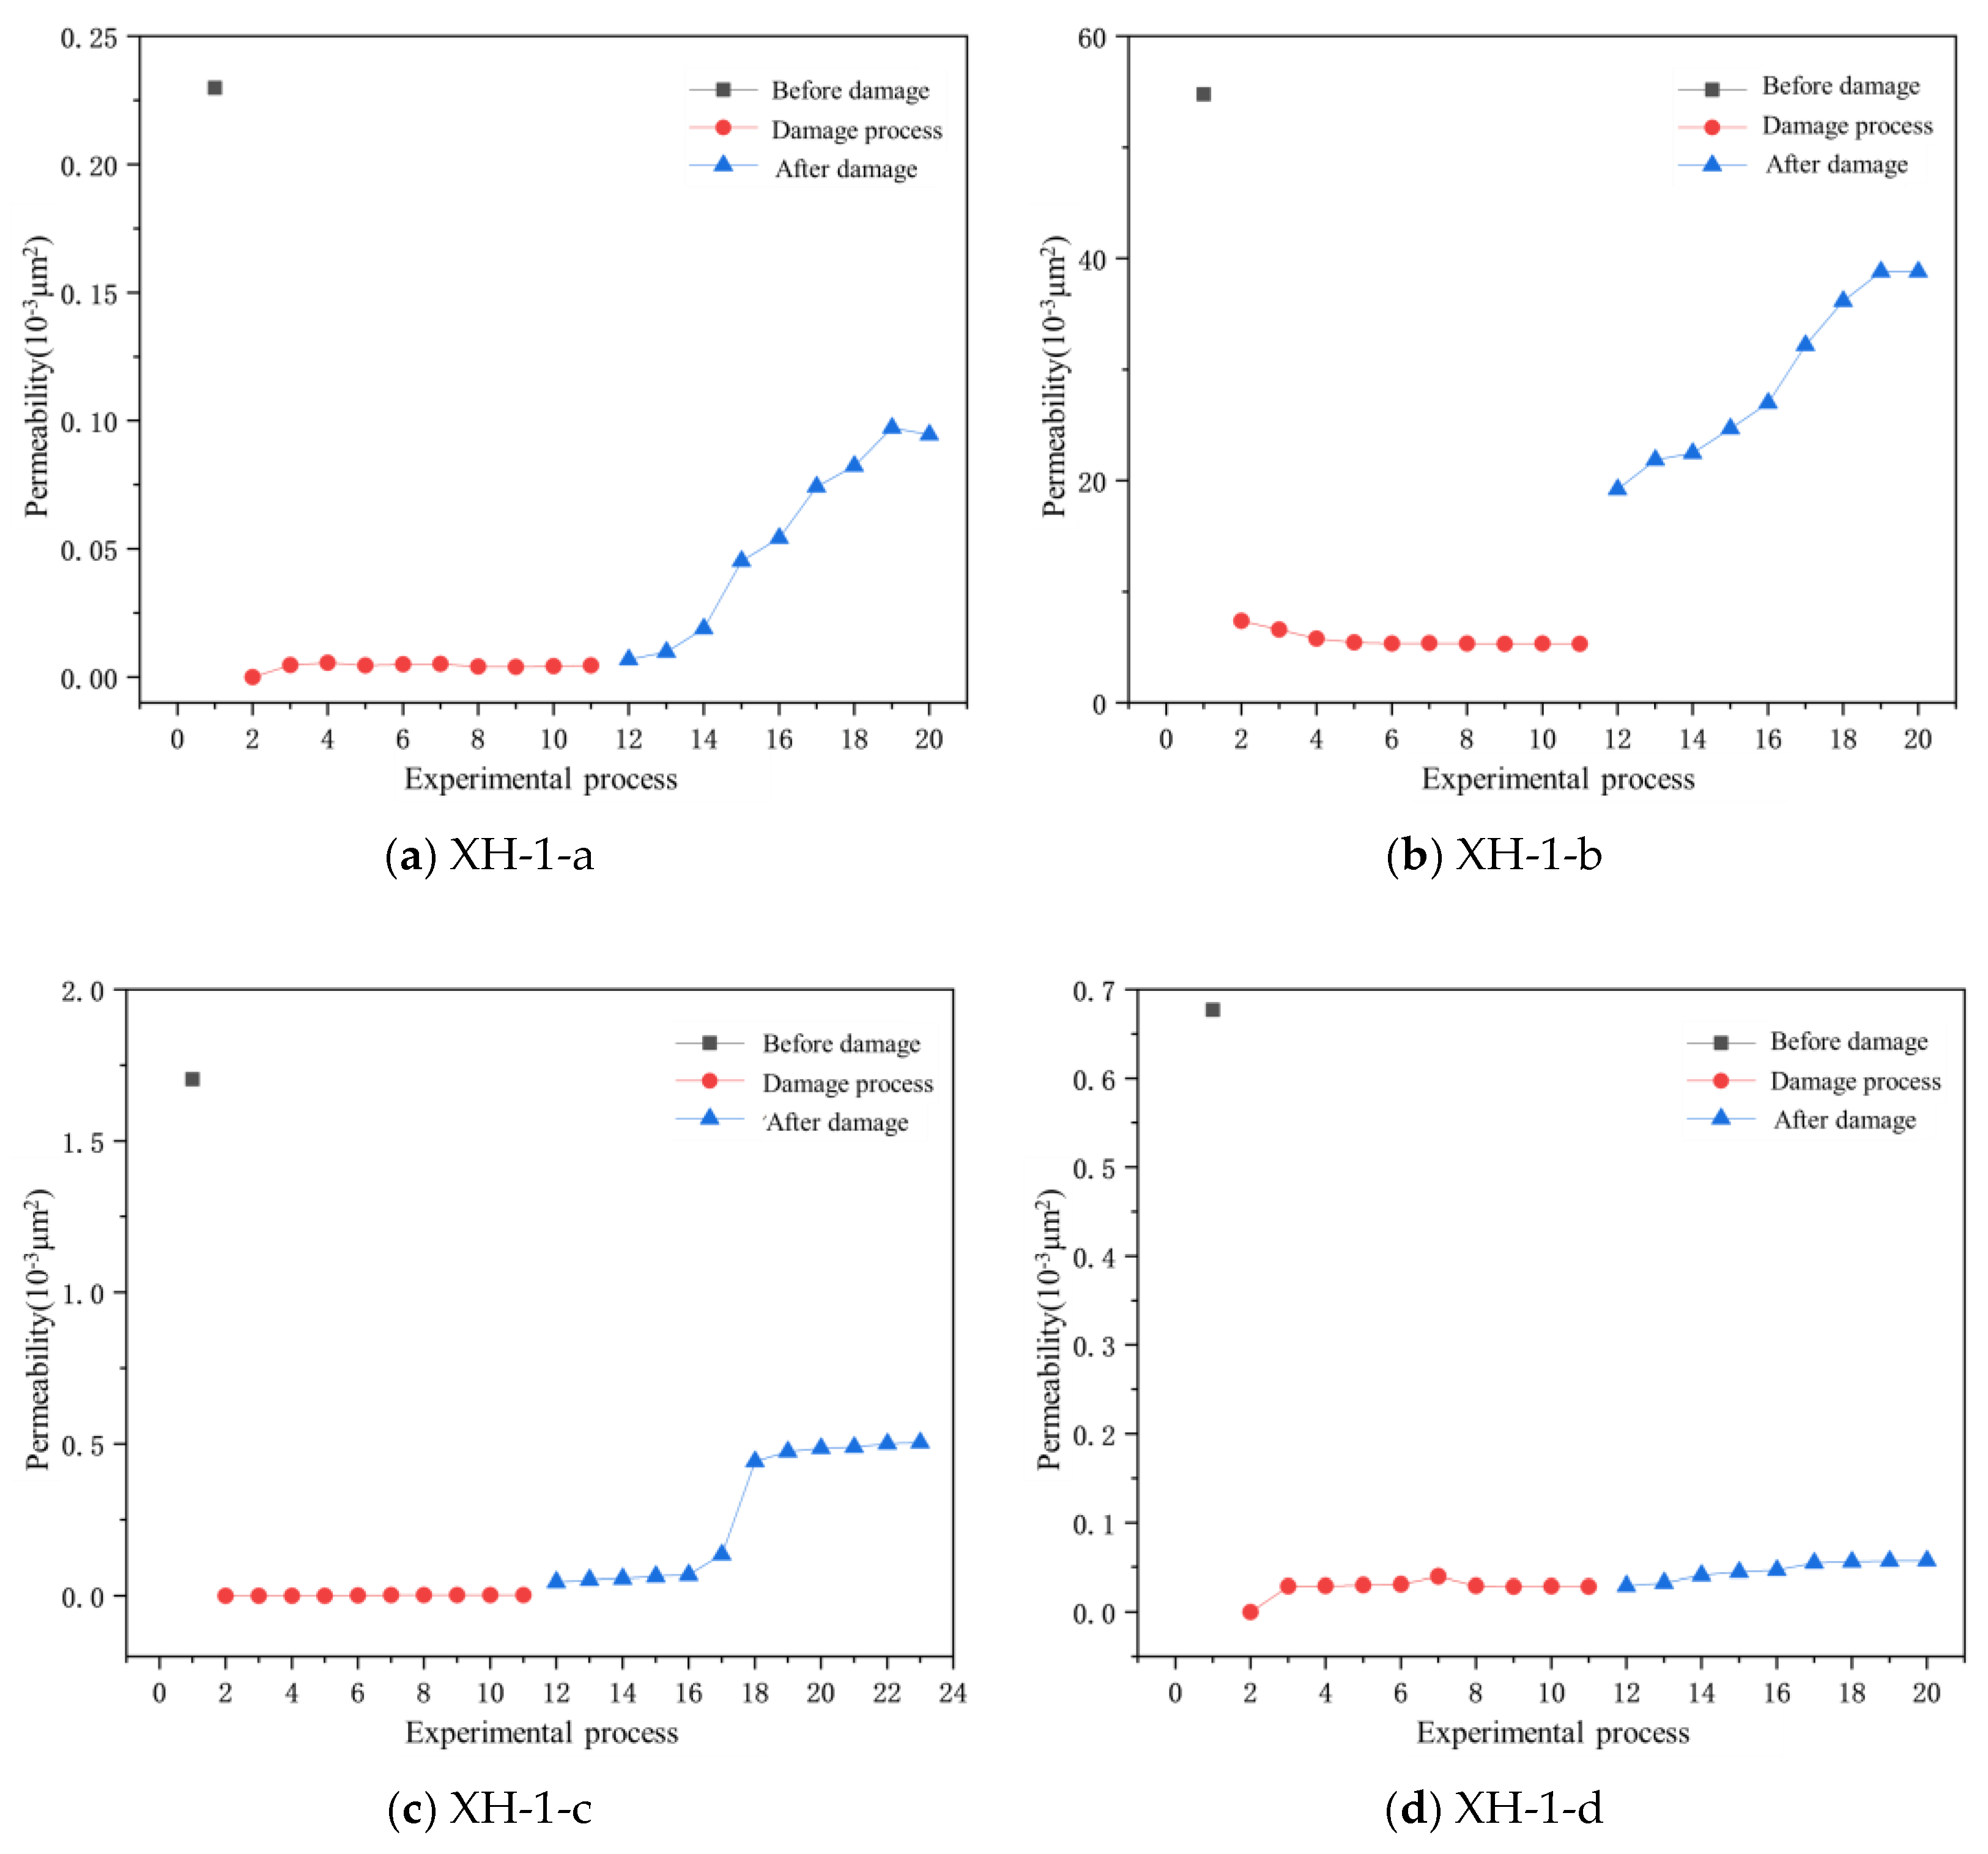
3.2. Reservoir Dynamic Damage Evaluation under Gas Drive Conditions

In response to the dynamic damage law of the main reservoir of the early key exploration well in a certain block of the East China Sea under gas drive conditions, four cores of the main reservoir of the XH-1 well in a certain block were collected, and the dynamic evaluation of damage to the reservoir caused by low-free-water drilling fluid under gas drive environment reservoir dynamic drilling conditions was conducted. According to the evaluation indicators of drilling fluid damage degree (Table 2), rock core permeability data were measured before, during, and after drilling fluid damage during the experiment, and the change law of permeability was observed (as shown in Figure 4). The detailed experimental results are shown in Table 4.
Figure 4 shows the dynamic damage process of four cores in the main reservoir of the XH-1 well under the formation water environment. It can be clearly seen from the figure that the permeability of low-permeability cores changes significantly after being dynamically damaged by low-free-water drilling fluid. From Table 4, it can be seen that the permeability damage rate of the four cores in the XH-1 well is the lowest at 33.37% and the highest at 91.69%, with a large range of dynamic damage degrees. Among these cores, the permeability damage rate of high-permeability cores is relatively low, and the degree of damage is medium to low. This result indicates that under gas drive conditions, the core is the same as under formation water conditions. Low-free-water drilling fluid causes significant damage to low-permeability cores, resulting in higher dynamic damage and higher-permeability cores.

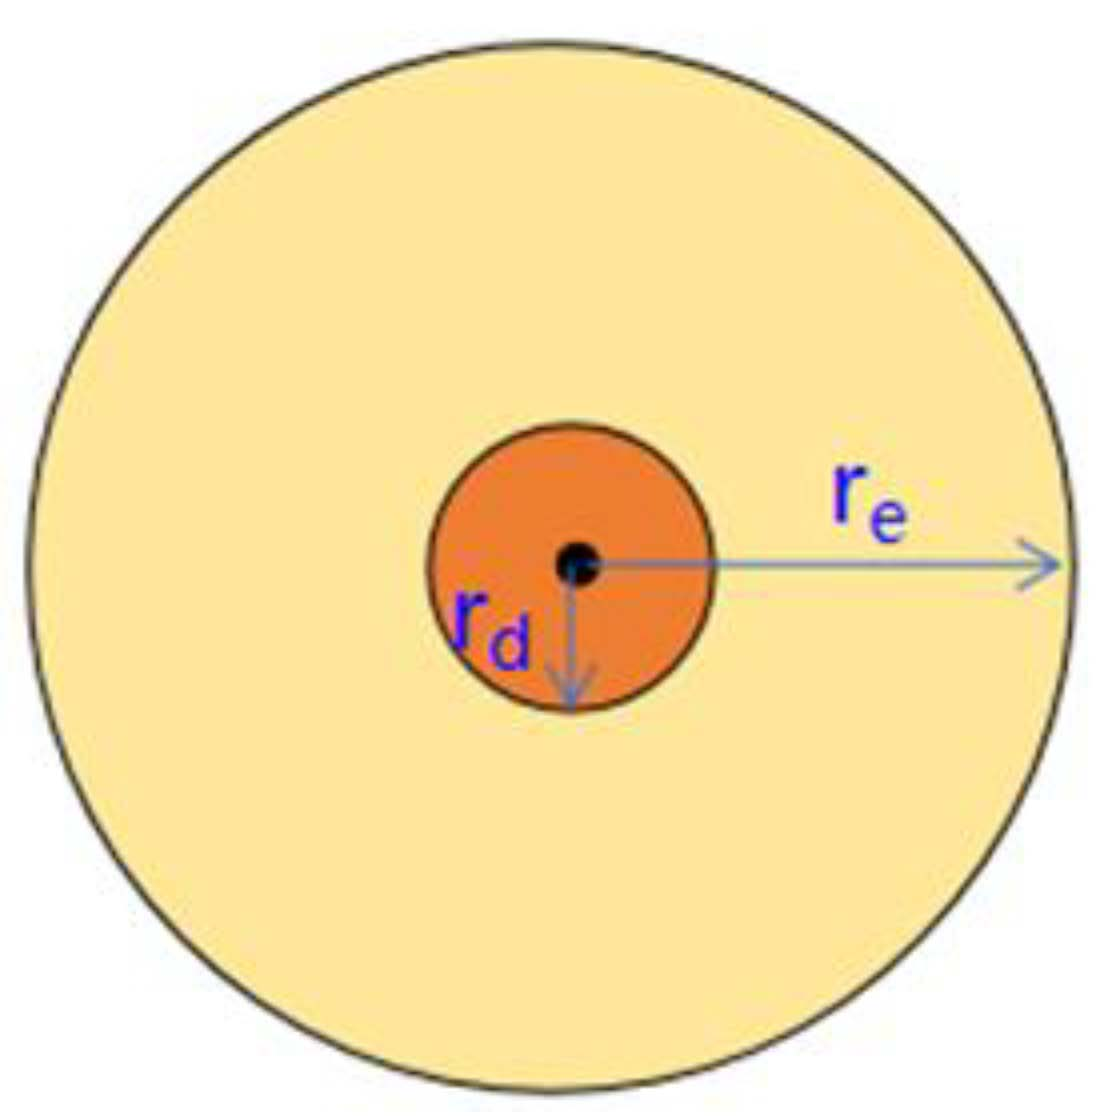
4. Physical Model of Drilling Fluid Damage

Drilling fluid damage refers to the change (decrease) in the permeability of the formation near the bottom of the well compared to the original condition caused by the invasion of drilling fluid. It is usually assumed that the original formation is homogeneous, meaning that the permeability of each point in the formation is equal. The damaged formation is equivalent to a composite formation, with a permeability ks (ks can be a constant or variable) within the damaged area and a permeability k in the outer area. The physical model of the damaged formation is shown in Figure 5. The physical model of the damaged formation with the permeability ks in the damaged area being constant is shown in Figure 6. The physical model of the damaged formation with the permeability ks in the damaged area being variable is shown in Figure 7.
Minimizing formation damage is an important guarantee for the efficient development of oil and gas fields. However, in the process of drilling, the invasion of drilling fluid is inevitable, especially in the process of drilling and completion of early key wells in a block in the East China Sea; in order to ensure safe drilling, high-density drilling fluid is usually used, and the exposure time of drilling fluid in some wells is more than 15 days, which may cause serious reservoir damage. In order to correctly evaluate the degree of reservoir damage, it is necessary to understand the depth of drilling fluid pollution. The variation curve of permeability with time after pollution during the drilling fluid pollution experiment of four rock samples is shown in Figure 8. Because the core permeability fluctuates little during the filtrate flow process, and there is a quantitative difference between the permeability before damage and the filtrate flow permeability, the permeability of the liquid invasion area can be taken as a fixed value when calculating the damage depth, so the uniform damage model can be used to study the damage depth of drilling fluid in this area.

5. Discussion

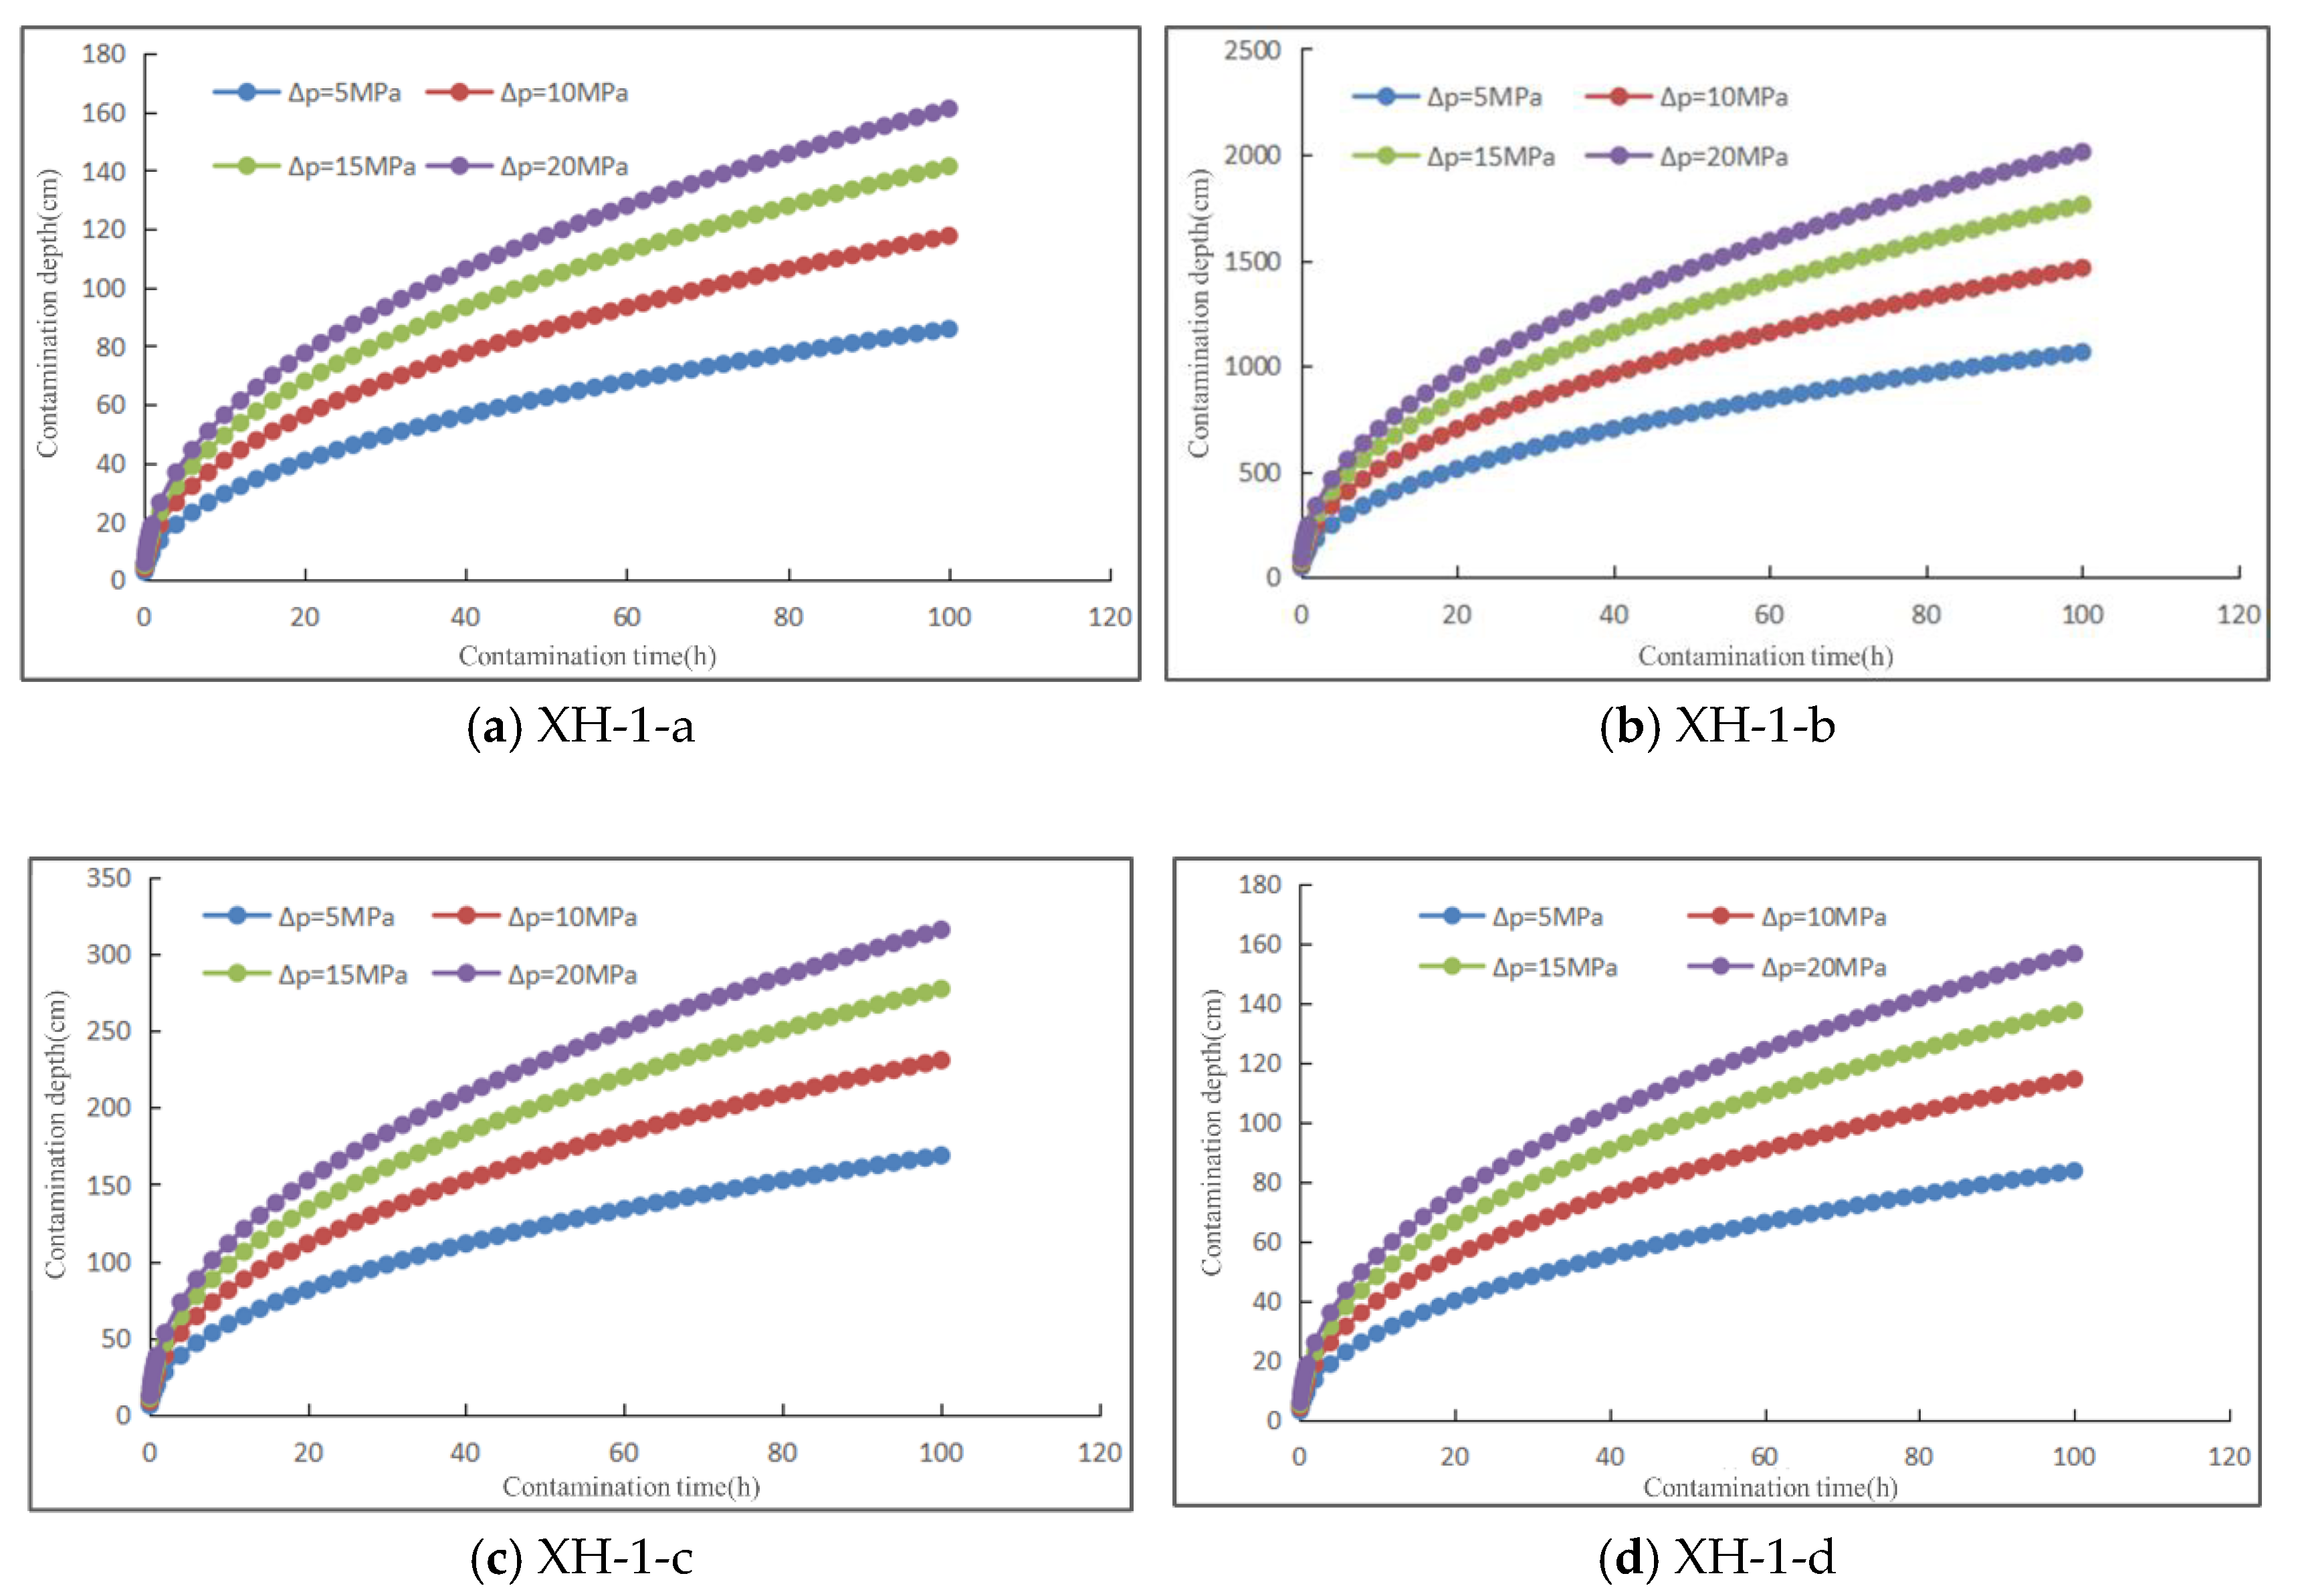
5.1. Mathematical Model and Calculation Results of Formation Drilling Fluid Pollution Depth

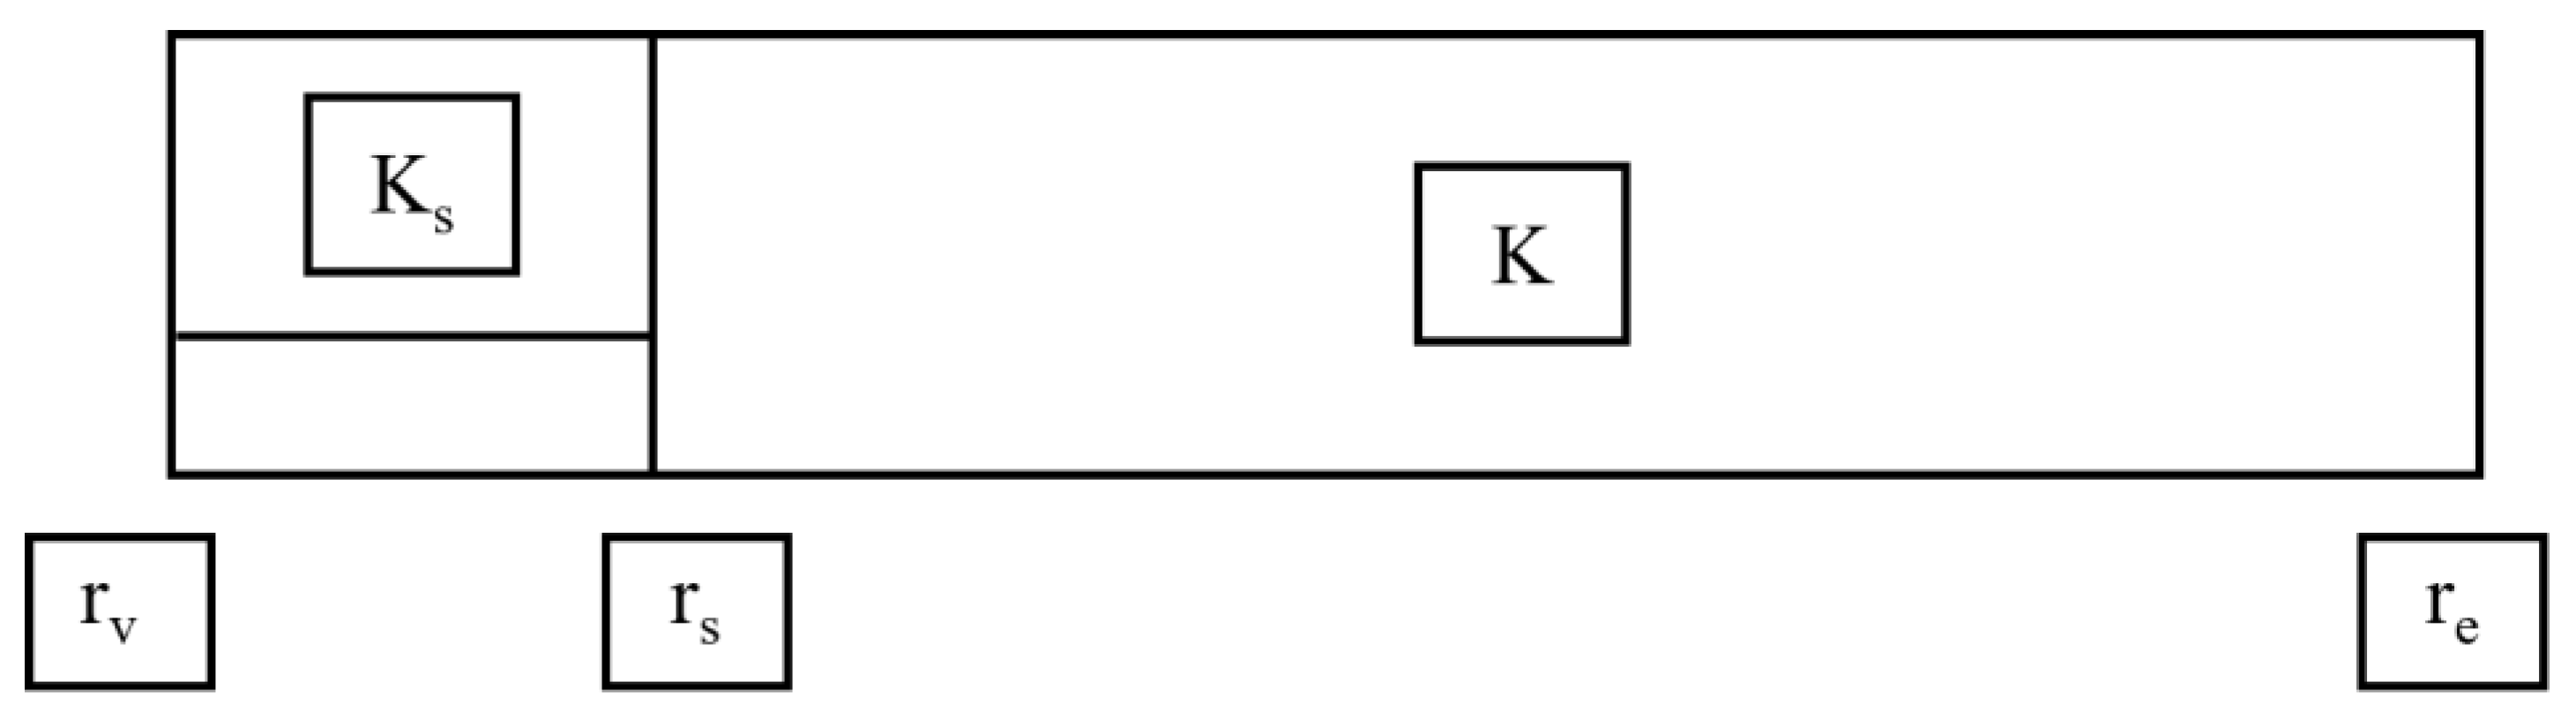
5.1.1. Mathematical Model of Filtrate Invasion Depth under Formation Conditions

It is assumed that the process of mud filtrate invading the formation is a steady flow process, and its flow resistance comes from two parts (Figure 9): one part is the flow resistance generated by the drilling fluid invasion part, and the other part is the flow resistance generated by the gas-phase part.
According to the equivalent resistance method, the invasion rate of filtrate can be expressed as follows:
q l = Δ p μ l 2 π K d h ln r d r w + μ g 2 π K g h ln r e r d
q l is the filtrate invasion rate, m3/s. Δ p is the differential pressure, MPa. μ l is the filtrate viscosity, Pa·s. μ g is the gas-phase viscosity, Pa·s. K d is the coefficient of flow resistance during mud invasion into the formation, m2. K g is the flow resistance coefficient related to the gas phase, m2. r d is the drill string radius, m. r e is the annulus radius, m. r w is the shaft radius, m. h is the well depth, m.
The amount of mud invasion is a function of time, and the total amount of mud invasion can be expressed as follows:
V L ( t ) = 0 t q l d t
As the gas in the formation pore is expelled after mud invasion, assuming that the saturation of the invaded mud is a constant, the depth of mud invasion can be expressed as follows:
r d = V L ( t ) π h ϕ S L + r w 2

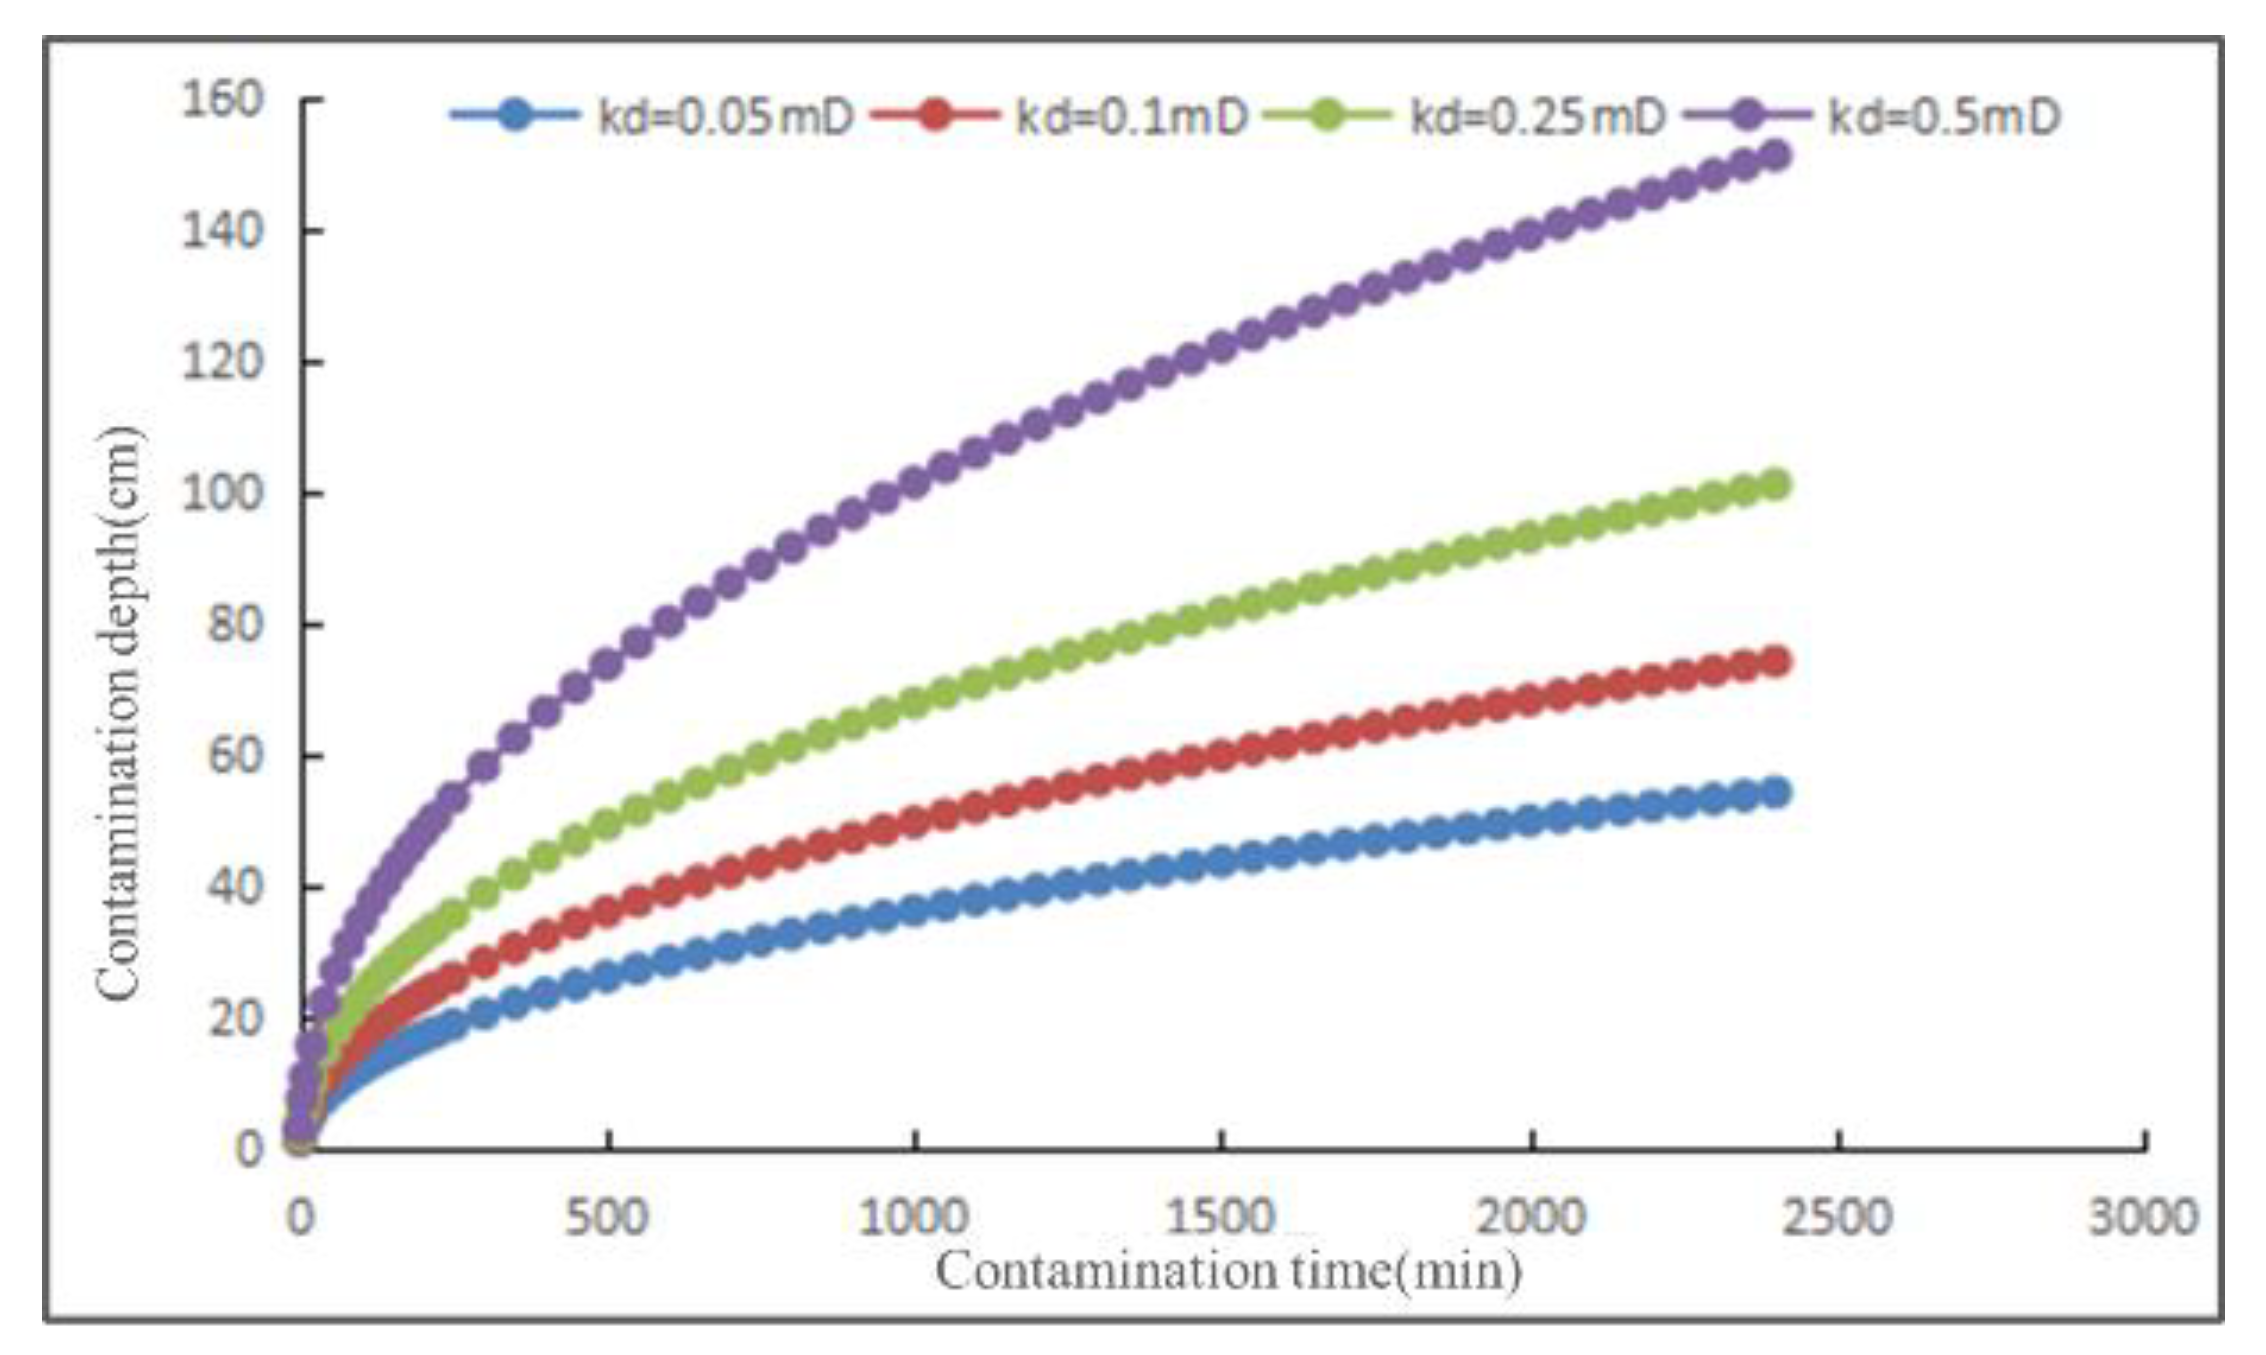
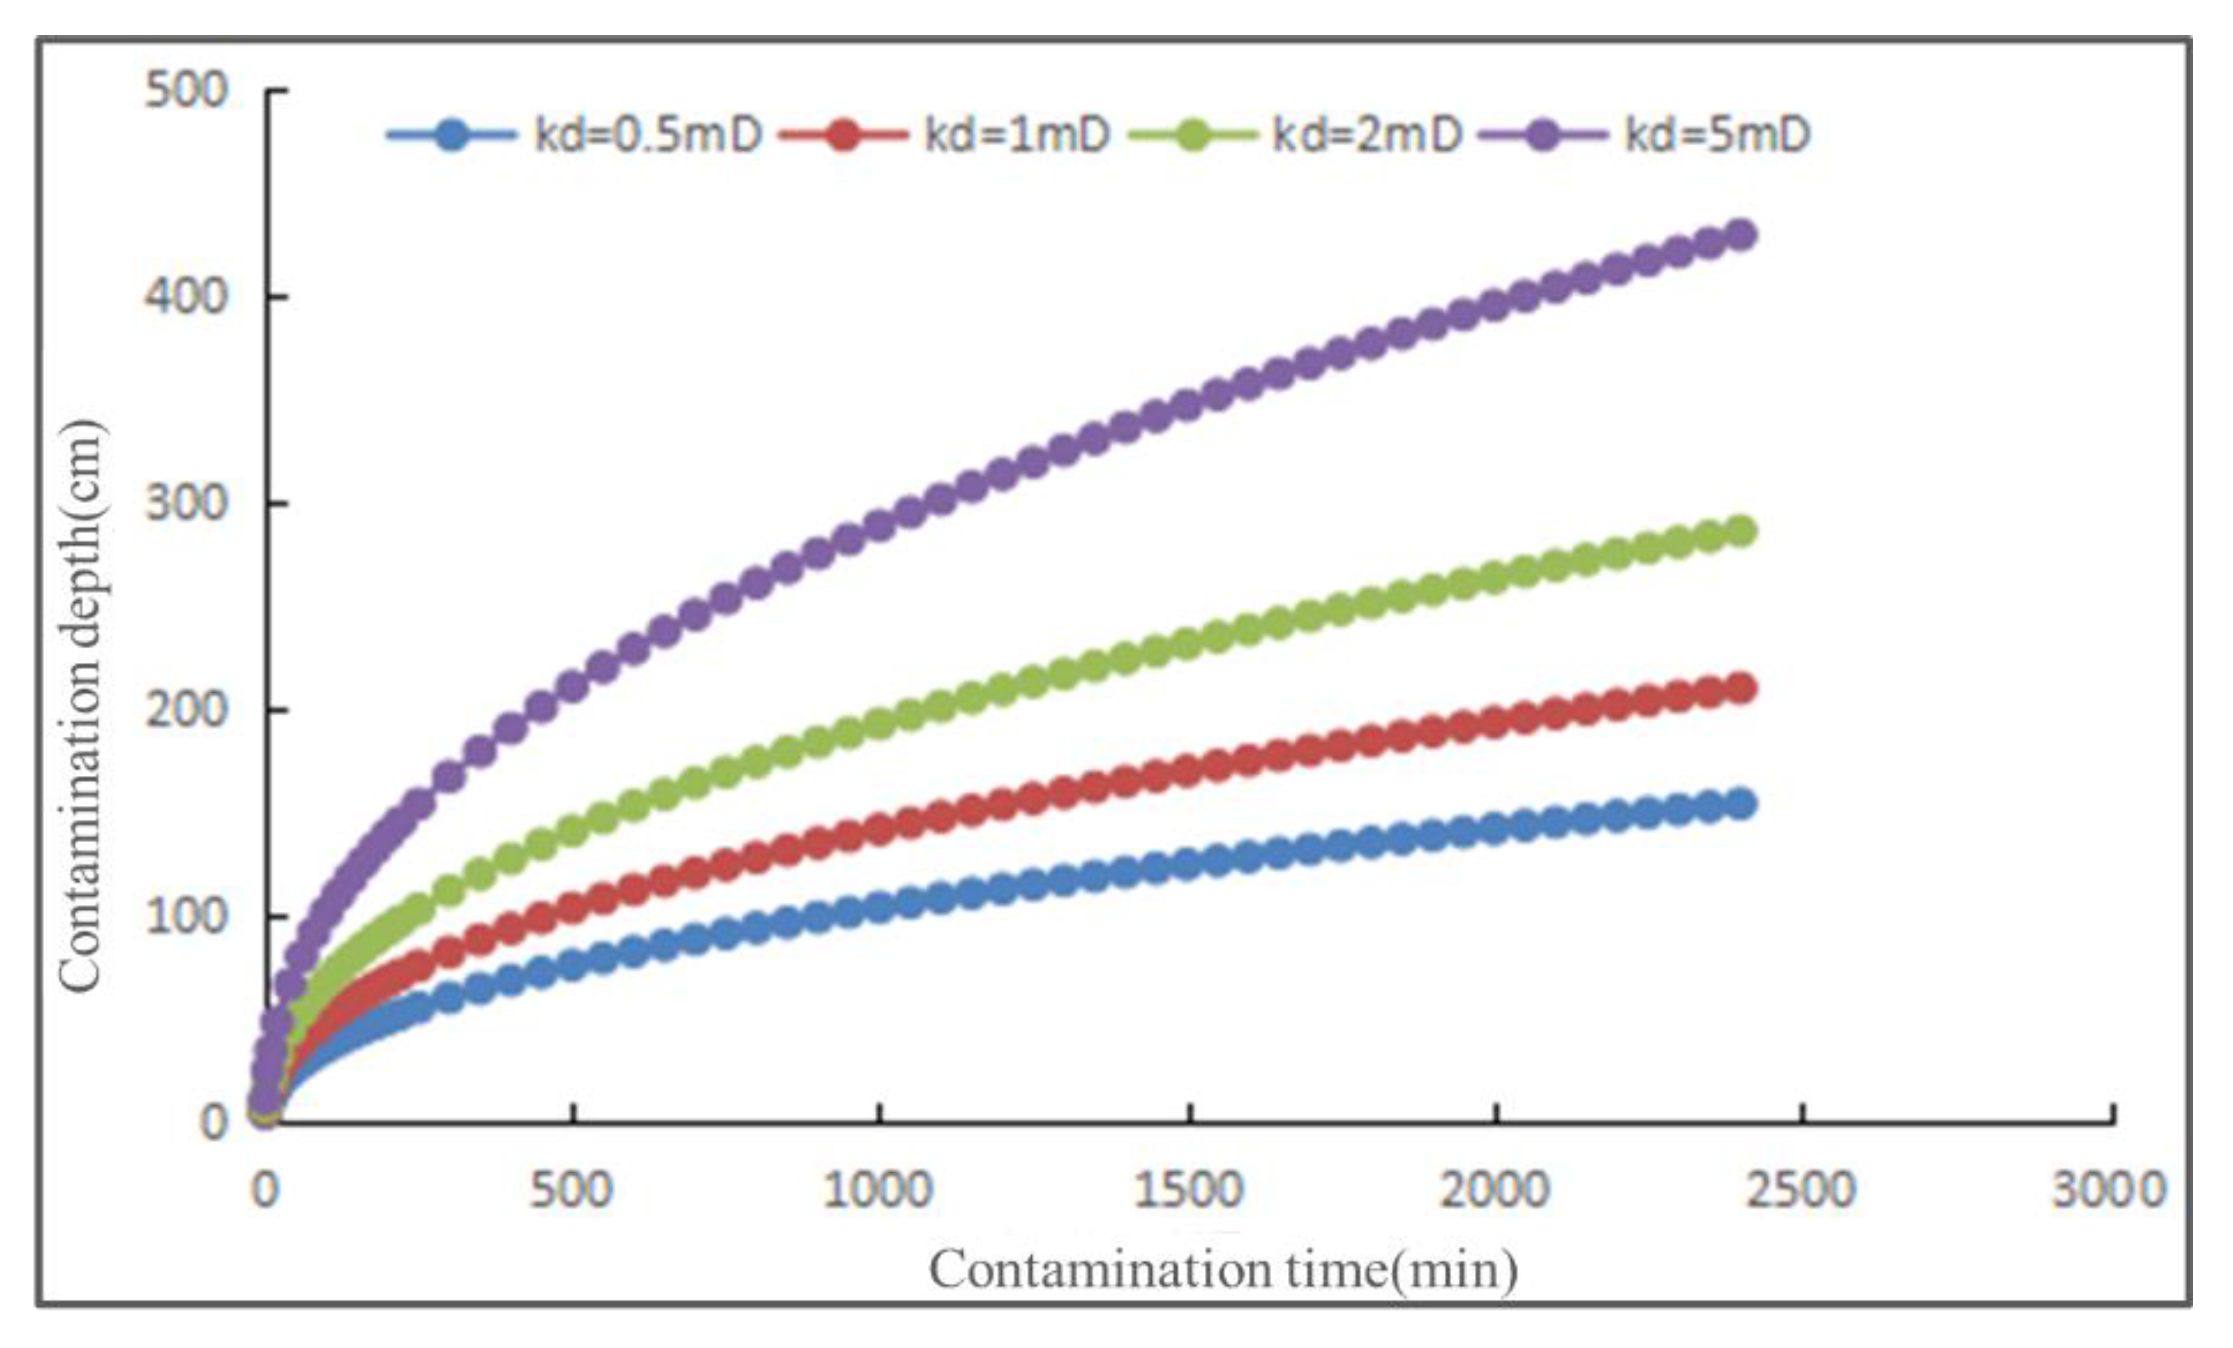
5.1.2. Calculation Results of invasion Depth under Formation Conditions

Assuming that the viscosity of the mud filtrate is 5 mPa·s, the formation thickness is 20 m, the porosity is 8.5%, the formation radius is 400 m, the saturation of the filtrate after displacement is 45%, and the gas viscosity under formation conditions is 0.25 mPa·s, the relationship between the pollution depth and time under the conditions of different pressure difference and permeability in different damage areas is calculated under the conditions of formation permeability of 1 mD and 10 mD (Figure 10).
It can be seen from Figure 11, Figure 12 and Figure 13 that without considering the influence of capillary pressure, the damage depth increases significantly with the increase in the original formation permeability and the formation permeability after damage, and the differential pressure and the permeability of the damaged area have a significant impact on the pollution radius.
In order to understand the geological measurement pollution depth under the actual formation conditions, combined with the drilling fluid pollution experiment results, it is assumed that the mud filtrate viscosity is 5 mPa·s, the formation thickness is 20 m, the porosity is the actual porosity of the core, the formation radius is 800 m, the filtrate saturation after displacement is 45%, and the gas viscosity under the formation conditions is 0.25 mPa·s. The relationship between the pollution depth and time under the conditions of different formation permeability and damage area permeability is calculated.
According to the simulation results of four core data of the main reservoir of well XH-1 polluted under different pressure differences in Figure 14, without considering the influence of capillary pressure, the damage depth increases significantly with the increase in the original formation permeability and the formation permeability after damage, and the pressure difference and the permeability of the damaged area have a significant impact on the pollution radius.

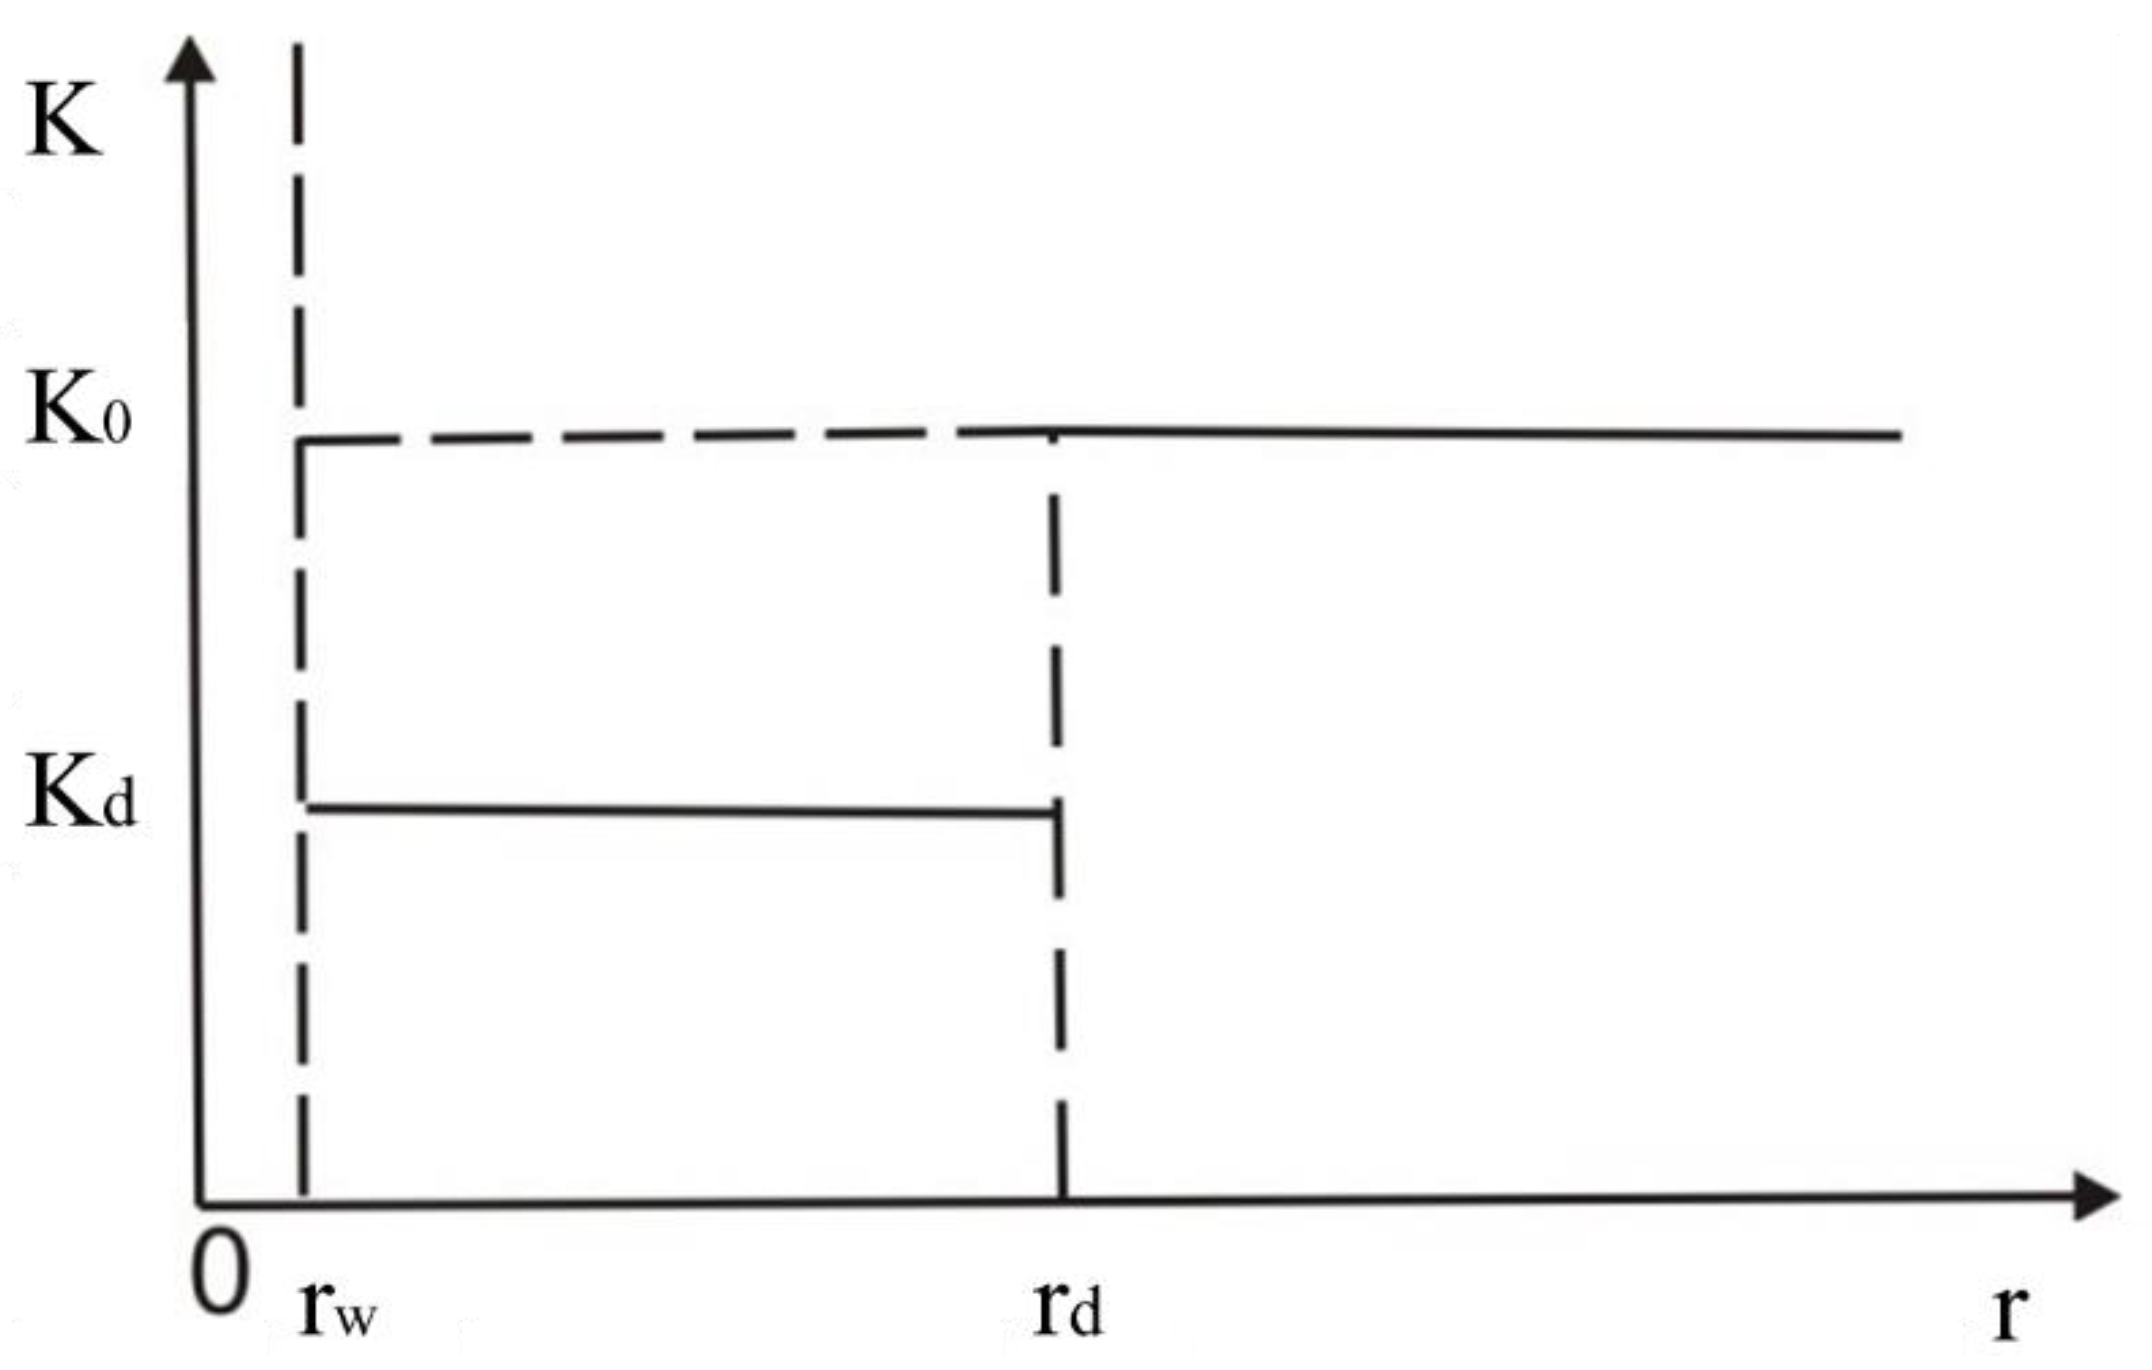
5.2. Calculation Method of Formation Drilling Fluid Pollution Skin Factor

We set the permeability of the damage area as a certain value, the permeability of damage area as Kd, and the damage radius as rd, as shown in Figure 15.
In the experiment for the evaluation of dynamic damage caused by drilling fluid, with the extension of drilling fluid circulation time, the filtration rate of drilling fluid will gradually decrease, and the filtration rate has a negative exponential relationship with time, which can be expressed by the following empirical formula:
q ( t ) = q 0 e α t
where q ( t ) is the filtration rate per unit area of core at time t, ml/min.m2. q 0 is the initial filtration rate, ml/min.m2. α is the attenuation coefficient, dimensionless, which is obtained from the dynamic damage experiment simulation of drilling fluid, and its size is related to the core pore structure, drilling fluid parameters, etc.
In the actual drilling process, if the seepage process of drilling fluid to the reservoir is assumed to be a steady flow, then
q ( t ) = 2 π r w h q ( t )
where q ( t ) is the filtration rate of drilling fluid from the wellbore to formation at time t, mL/min.m2. r w is the shaft radius, m. h is the reservoir thickness, m.
When the drilling fluid is soaked in the reservoir at time t, the total filtration loss is
Q ( t ) = 0 t q ( t ) d t = 2 π r w h q 0 α ( 1 e α t )
According to the conservation of mass, the filtration loss is equal to the invasion of reservoir drilling fluid, and the invasion can be expressed as follows:
Q ( t ) = π ( r d 2 r w 2 ) h φ ( 1 S w i )
where r d is the invasion radius of drilling fluid, m. φ is porosity, f. S w i is the initial water saturation, dimensionless.
According to simultaneous Equations (6) and (7), the variation formula of drilling fluid invasion depth with time is obtained as follows:
r d = 2 r w q 0 ( 1 e α t ) α φ ( 1 S w i ) + r w 2
After the drilling fluid invades the reservoir, if the process is assumed to be a uniform damage process, the permeability distribution of the reservoir is as follows:
K ( r ) = K d               r w < r r d K 0             r d < r r e
where K ( r ) is the radial permeability, 10−3 μm2. r e is the supply radius, m. According to Darcy’s Law,
Q = 172.8 π r h K ( r ) μ d p d r
Therefore,
d p = Q μ 172.8 π r h d r K ( r )
The integral on both sides of the above equation is
p e p w = Q μ 172.8 π h r w r e d r r K ( r ) = Q μ 172.8 π h [ 1 K d l n r d r w + 1 K 0 l n r e r d ]
where Q is the gas production, 104 m3/d. p e , p w represent boundary pressure and wellbore pressure, respectively, MPa. μ is the gas viscosity, mPa·s.
According to the definition of the skin factor,
p e p w = Q μ 172.8 π h [ l n r e r w + S d ]
Therefore, the skin factor of drilling fluid invasion damage is
S d = ( K 0 K d 1 ) l n r d r w
After the drilling fluid dynamic damage evaluation experiment on the core of the target formation, the parameters such as initial gas logging permeability K 0 and damaged permeability K d can be obtained. r d can be calculated by Equation (8), so as to realize the quantitative calculation of drilling fluid invasion damage skin factor S d .
Based on the established calculation model of contaminated skin factor, the relationship curve of skin factor with contaminated depth at different Kd/K values is calculated, as shown in Figure 16. It can be seen from the figure that under the condition of the same pollution depth, the larger the Kd/K, the smaller the skin factor; with the decrease in Kd/K, the skin factor increased significantly.

5.2.1. Calculation of Drilling Fluid Invasion into Skin in Well XH-1

Based on the established calculation model of the contaminated skin factor, the invasion depth and skin factor of drilling fluid in the reservoir section corresponding to different cores of well XH-1 are calculated as shown in Table 5.
See Table 4 for the basic parameters of the corresponding horizons of the four cores of well XH-1. The initial filtration rate is q 0 , and the filtration attenuation coefficient is α . According to the core experiment, the exposure time is the exposure time of the reservoir in the drilling fluid during drilling, which is obtained by consulting the early drilling daily report of well XH-1. According to the calculations, the drilling fluid invasion depth of the main reservoir of well XH-1 in early years is 0.47~0.83 m, the permeability damage rate is 58.25~91.69%, and the skin factor caused by drilling fluid invasion is 1.22~13.41. The XH-1 (4) cores have the shortest invasion depth of drilling fluid in the corresponding reservoir section, but the skin factor is the largest. The main reason is that the reservoir is more compact, the drilling fluid damage is difficult to recover (as shown in Figure 3d), and the permeability damage rate is serious, resulting in a large skin factor.

5.2.2. Calculation of Drilling Fluid Invasion Skin in Reservoir

Due to the limited cores, mud filtration tests and water lock damage tests were not conducted. The specific mud cake thickness and water lock damage degree of each test layer in the old well could not be known, but both of them had a direct impact on the damage evaluation results. Therefore, based on the solid damage obtained from the dynamic damage test, the representative relative permeability curve of the block was selected, and the reservoir damage was quantitatively evaluated when the water saturation caused by water lock increased by 5%, 10%, 15%, and 20% by referring to the previous experimental mud cake thickness range (1–4 cm).
According to the drilling and completion environment of each test interval, the difference between the liquid column pressure and the formation pressure during the mud immersion process is calculated. The empirical value of mud cake permeability is 0.001 mD, taking well XH-1 dst1 as an example.
Based on the logging results of this interval, the test interval is 3314.5–3319.0 m, the regression well test permeability is 1.99 mD, the mud density is 1.18 g/cm3, the formation static pressure is about 34.25 MPa, and the mud cake permeability is 0.001 mD. Based on the above parameters, the calculated pollution depth, skin factor, and other parameters are shown in Table 6, Table 7, Table 8, Table 9, Table 10 and Table 11:
The skin factor is an important technical index for evaluating the pollution degree of oil and gas wells near wells and reservoir damage. Table 6 shows the calculation results of the pollution depth of drilling fluid invading the formation. It can be seen from the table that the pollution depth of drilling fluid increases with the pollution time and decreases with the increase in mud cake thickness. In Table 7, the contaminated skin factor without considering the impact of water lock is the blank group. It can be seen that the contaminated skin factor increases with the increase in pollution time. The thicker the mud cake, the smaller the pollution skin factor. Table 8, Table 9, Table 10 and Table 11 respectively show the calculation results of the contaminated skin factor with the increase in reservoir water saturation by 5%, 10%, 15%, and 20% due to water lock damage. Through comparison, it can be seen that the contaminated skin factor gradually increases with the increase in formation water saturation.

6. Conclusions

The change in formation permeability caused by drilling fluid invasion is one of the main criteria for the evaluation of dynamic damage caused by drilling fluid. Aiming at the reservoir of a block in the East China Sea, a physical model of formation damage caused by drilling fluid was established to study the depth of formation damage caused by drilling fluid. Assuming that the invasion of drilling fluid filtrate into the formation is a steady flow process, the calculation formulas of drilling fluid pollution depth and skin factor were derived based on the experimental results. The drilling fluid dynamic damage test results show that the permeability damage rate of the main reservoir of well XH-1 is 58.25~87.25%, and the dynamic damage degree is medium to high, and high. Combined with reservoir physical properties and drilling parameters, according to the calculation formula of pollution depth, the invasion depth of drilling fluid in the early years of the reservoir corresponding to the four cores is 0.47~0.83 m; considering the factors of permeability damage rate and drilling fluid invasion depth, the skin factor of drilling damage in the main reservoir of well XH-1 is calculated to be 1.22~13.41. Finally, based on the reservoir physical parameters and other parameters of dst1 of well XH-1, the changes in pollution depth and skin factor were calculated under different mud cake thicknesses, and the effects of different water lock damage levels were considered. The calculation results show that the greater the formation water saturation, the greater the impact on the contaminated skin factor, and the more serious the reservoir damage. Therefore, combined with the experimental results of dynamic formation damage caused by drilling fluid, the established calculation model of drilling fluid invasion depth and skin factor can realize the quantitative evaluation of drilling fluid damage in early exploration wells and can provide theoretical guidance for field application.

Author Contributions

Conceptualization, P.X.; data curation, X.Z., Y.J. and J.Y.; investigation, X.Z., Y.J. and L.X.; resources, X.Z.; writing—original draft, X.Z., Y.J., P.X., J.Y. and L.X.; writing—review and editing, X.Z., Y.J., P.X. and L.X. All authors have read and agreed to the published version of the manuscript.

Funding

This study was funded by the “14th Five-Year Plan” Major Science and Technology Program of China National Offshore Oil Corporation (CNOOC): CCL2022SHPS004ET.

Data Availability Statement

The data presented in this study are available on request from the corresponding author due to the core data is taken from the site, and other relevant data shall be kept confidential as required by CNOOC Shanghai Branch.

Conflicts of Interest

Authors Xingbin Zhao and Yiming Jiang were employed by the CNOOC (China) Limited Shanghai Branch. The remaining authors declare that the research was conducted in the absence of any commercial or financial relationships that could be construed as a potential conflict of interest. The CNOOC (China) Limited Shanghai Branch had no role in the design of the study; in the collection, analyses, or interpretation of data; in the writing of the manuscript, or in the decision to publish the results.

References

  1. Apaleke, A.S.; Al-Majed, A.; Hossain, M.E. Drilling fluid: State of the art and future trend. In Proceedings of the SPE North Africa Technical Conference and Exhibition, Cairo, Egypt, 20–22 February 2012. SPE-149555-MS. [Google Scholar]
  2. Saychenko, L.; Tananykhin, D.; Ashena, R. Prevention of scale in the downhole equipment and productive reservoir during the oil well operation. J. Appl. Eng. Sci. 2021, 19, 363–368. [Google Scholar] [CrossRef]
  3. Yang, X.Y. Drilling fluid and completion fluid technology for reservoir protection: Present and future. Drill. Fluid Complet. Fluid 2000, 17, 6. [Google Scholar] [CrossRef]
  4. Yang, J.; Sun, J.; Bai, Y.; Lv, K.; Zhang, G.; Li, Y. Status and prospect of drilling fluid loss and lost circulation control technology in fractured formation. Gels 2022, 8, 260. [Google Scholar] [CrossRef] [PubMed]
  5. Zhonghua, W. Current Situation and Development Suggestions for Drilling Fluid Technologies in China. Pet. Drill. Tech. 2023, 51, 114–123. [Google Scholar]
  6. Yan, Z.; Jianhua, B.; Jinhong, Z.; Hongying, S.; Ling, T. Research progress and development trend of drilling and completion fluids for oil and gas reservoir protection. China Chem. Trade 2015, 146, 050801. [Google Scholar] [CrossRef]
  7. Guo, C. Current Status and Prospects of Waste Oil-Based Drilling Fluid Treatment Methods in China. In Proceedings of the International Petroleum and Petrochemical Technology Conference 2020, Shanghai, China, 26–28 August 2020; Springer: Singapore, 2021; pp. 94–104. [Google Scholar]
  8. Dindoruk, B.; Zhang, F. Advances in Drilling and Completion Fluid Technologies for Protecting Oil and Gas Reservoirs: Research Progress and Development Trends. J. Energy Resour. Technol. 2024, 146, 050801-1. [Google Scholar] [CrossRef]
  9. Zhang, Y.; Chen, Y.; Wang, C.; Yan, C. Study on Reservoir Damage Mechanism and Drilling and Completion Fluid Protection Technology in BOHAI A Oilfield. Guangdong Chem. Ind. 2022, 49, 79–82. [Google Scholar]
  10. Han, L.; Clinch, D.; van der Zwaag, C.; Galletti, E.; Fornasier, F.; Estevez, F.; McMillan, N.; Green, J.; Ian, P. Customizing Drill-In Fluid for Peregrino Project in Brazil: Laboratory Development and Field Experience. In Proceedings of the SPE International Symposium and Exhibition on Formation Damage Control, Lafayette, LA, USA, 15–17 February 2012. [Google Scholar] [CrossRef]
  11. Doane, R.D.; Bennion, D.B.; Thomas, F.B.; Bietz, R.R.; Bennion, D.W. Special Core Analysis Designed to Minimize Formation Damage Associated with vertical/Horizontal Drilling Applications. Can. Pet. Technol. 1999, 38, 35–45. [Google Scholar] [CrossRef]
  12. Jin, L. Quantitative Formation Damage Evaluation Using Dynamic/Static Drill-In Fluid Filtration Tests Data. In Proceedings of the SPE/IADC Drilling Conference and Exhibition, Amsterdam, The Netherlands, 17–19 March 2009. SPE-118659-MS. [Google Scholar]
  13. Iscan, A.G.; Civan, F.; Kok, M.V. Alteration of permeability by drilling fluid invasion and flow reversal. J. Pet. Sci. Eng. 2007, 58, 227–244. [Google Scholar] [CrossRef]
  14. Ibrahim, D.S.; Sami, N.A.; Balasubramanian, N. Effect of barite and gas oil drilling fluid additives on the reservoir rock characteristics. J. Pet. Explor. Prod. Technol. 2017, 7, 281–292. [Google Scholar] [CrossRef]
  15. Kalhor Mohammadi, M.; Riahi, S.; Boek, E.S. An insight review on formation damage induced by drilling fluids. Rev. Chem. Eng. 2023, 39, 387–415. [Google Scholar] [CrossRef]
  16. Al-Yaseri, A.Z.; Lebedev, M.; Vogt, S.J.; Johns, M.L.; Barifcani, A.; Iglauer, S. Pore-scale analysis of formation damage in Bentheimer sandstone with in-situ NMR and micro-computed tomography experiments. J. Petrol. Sci. Eng. 2015, 129, 48–57. [Google Scholar] [CrossRef]
  17. Alcheikh, I.M.; Ghosh, B. A comprehensive review on the advancement of non-damaging drilling fluids. Int. J. Petrochem. Res. 2017, 1, 61–72. [Google Scholar] [CrossRef]
  18. Muniz, E.S.; Da Fontoura SA, B.; Duarte, R.G.; Lomba, R.T. Evaluation of the shale-drilling fluid interaction for studies of wellbore stability. In Proceedings of the ARMA US Rock Mechanics/Geomechanics Symposium, Anchorage, AK, USA, 25–29 June 2005. ARMA-05-816. [Google Scholar]
  19. Ladva, H.K.J.; Brady, M.E.; Sehgal, P.; Kelkar, S.; Cerasi, P.; Daccord, G.; Foxenberg, W.E.; Price-Smith, C.; Howard, P.; Parlar, M. Use of oil-based reservoir drilling fluids in open-hole horizontal gravel-packed completions: Damage mechanisms and how to avoid them. In Proceedings of the SPE European Formation Damage Conference and Exhibition, The Hague, The Netherlands, 21–22 May 2001. SPE-68959-MS. [Google Scholar]
  20. Bennion, D.B.; Lunan, B.; Saponja, J. Underbalanced drilling and completion operations to minimize formation damage-reservoir screening criteria for optimum application. J. Can. Pet. Technol. 1998, 37, 3. [Google Scholar] [CrossRef]
  21. Tan, W.; Bai, R.; Zou, J.; Wang, S.; Li, X.; You, L.; Kang, Y.; Zhang, L. Drilling fluid damage analysis of fractured metamorphic rock reservoirs in Archaean buried hills in a block of Bozhong. Fault-BlockOilGas Field 2023, 30, 715–720. [Google Scholar]
  22. Chen, P.; Wang, X.; Dong, Y.; Chen, H.; Chen, A. Prediction model of filter cake buildup and its influential factor. Fault-Block Oil Gas Field 2012, 19, 522–525. [Google Scholar]
  23. Duan, Y.; Yang, H. Review of mud cake formation mechanism and evaluation method of drilling fluid. Sci. Technol. Eng. 2021, 21, 11443–11454. [Google Scholar]
  24. Elmgerbi, A.; Thonhauser, G.; Fine, A. Experimental approach for assessing filter-cake removability derived from reservoir drill-in fluids. J. Pet. Explor. Prod. Technol. 2021, 11, 4029. [Google Scholar] [CrossRef]
  25. Pan, H.; Fan, Z.; Ma, Y. Correction method of drilling fluid invasion of resistivity logging. Nat. Gas Ind. 2005, 25, 41–43. [Google Scholar]
  26. Min, W.A.; Wancai, L.I.; Xue, F.E. On Drilling Fluid Invasion Influence on Resistivity Logging Characteristics by Numerical Modeling and Experimental Method. Well Logging Technol. 2015, 39, 272–276. [Google Scholar]
  27. Luo, Y.; Zhang, J.; Wang, S. Usi ng Logging Data to Evaluate Invasion Damage in drilling Process. Well Logging Technol. 2006, 6, 568–570+586. [Google Scholar]
  28. Zhang, H.; Cai, B.; Liu, Y.; Shi, X. Experimental Study on penetration depth of drilling fluid into tight sandstone in an area of east china sea. J. Southwest Pet. Univ. 2017, 39, 152–158. [Google Scholar]
  29. Guo, D. The Physical Experiment and Numerical Simulation of the Invasion Depth of Drilling Fluid in Sandstone Reservoir; Southwest Petroleum University: Chengdu, China, 2018. [Google Scholar]
  30. Wu, J. Simulation of Drilling Mud Invasion and Evaluation of Permeability Damage in Sandstone Reservoir; China University of Petroleum: Beijing, China, 2019. [Google Scholar]
  31. Chen, X. Research on Calculation Model of Filtrate Invasion Radius for Water-Based Drilling Fluid; Northeast Petroleum University: Daqing, China, 2013. [Google Scholar]
  32. Chunping, G. Research on Skin Factor of Drilling Fluid Invasion in Horizontal Wells; Northeast Petroleum University: Daqing, China, 2021. [Google Scholar]
  33. Fan, S.; Dou, H. The development trend of reservoir protection technology. Pet. Explor. Dev. 2001, 28, 556. [Google Scholar]
  34. Krueger Roland, F. An overview of formation damage and well productivity in oilfield operations. J. Pet. Technol. 1986, 38, 131–152. [Google Scholar] [CrossRef]
  35. Schembre, J.M.; Kovscek, A.R. Mechanism of formation damage at elevated temperature. J. Energy Resour. Technol. 2005, 127, 171–180. [Google Scholar] [CrossRef]
  36. Wojtanowicz, A.K.; Krilov, Z.; Langlinais, J.P. Study on the effect of pore blocking mechanisms on formation damage. In Proceedings of the SPE Oklahoma City Oil and Gas Symposium/Production and Operations Symposium, Oklahoma City, OK, USA, 8–10 March 1987. SPE-16233-MS. [Google Scholar]
  37. Liao, Z.C.; Xiong, H.L. Oil and Gas Reservoir Protection Technology; Petroleum Industry Press: Beijing, China, 2012. [Google Scholar]
Figure 1. Multi-functional dynamic damage evaluation instrument.
Processes 12 01406 g001
Figure 2. Operation process of drilling fluid dynamic damage evaluation experiment: (a) Drilling fluid dynamic damage instrument. (b) A shaft is set inside the kettle body, the side of the shaft is connected with the kettle body, and an agitator is set inside the shaft. (c) A cylindrical frame is set above the agitator inside the wellbore to store cores. (d) A layer of diaphragms with holes is placed. (e) Drilling fluid is placed. (f) A sensor and a pressurizing device are arranged above the kettle body for integral assembly.
Processes 12 01406 g002aProcesses 12 01406 g002b
Figure 3. Dynamic damage process of core in the main reservoir of well XH-1 under formation water conditions.
Processes 12 01406 g003
Figure 4. Dynamic damage process of core in the main reservoir of xh-1 well under gas drive conditions.
Processes 12 01406 g004
Figure 5. Schematic diagram of physical model of damaged strata.
Processes 12 01406 g005
Figure 6. Permeability of reservoir damage zone is constant (uniform damage).
Processes 12 01406 g006
Figure 7. Permeability of reservoir damage area is variable (non-uniform damage).
Processes 12 01406 g007
Figure 8. Permeability curve of drilling fluid filtrate damage.
Processes 12 01406 g008
Figure 9. Schematic diagram of mud invasion into formation.
Processes 12 01406 g009
Figure 10. Relation curve between damage depth and time under different differential pressure at K = 1 mD and Kd = 0.1 mD.
Processes 12 01406 g010
Figure 11. Relation curve between damage depth and time under different differential pressure at K = 10 mD and Kd = 1 mD.
Processes 12 01406 g011
Figure 12. The relationship between damage depth and time under permeability of different damage zones at K = 1 mD and Δp = 10 MPa.
Processes 12 01406 g012
Figure 13. The relationship between damage depth and time under permeability of different damage areas at K = 10 mD and Δp = 10 MPa.
Processes 12 01406 g013
Figure 14. Pollution simulation results of core data of main reservoir of well XH-1 under different pressure differentials.
Processes 12 01406 g014
Figure 15. Schematic diagram of permeability change in damage zone.
Processes 12 01406 g015
Figure 16. Relationship between pollution depth and damage skin factor under stratum conditions.
Processes 12 01406 g016
Table 1. Parameters of the cores used for drilling fluid dynamic damage test.
Core NumberSampling Depth (m)Diameter (mm)Length (mm)Porosity (%)
XH-1-a3128.2824.6529.959.6
XH-1-b3418.0324.7863.8012.9
XH-1-c3978.6825.1462.729.3
XH-1-d4652.5025.4553.956.2
Table 2. Evaluation table of damage degree of drilling fluid intrusion into reservoir [37].
Damage Rate Rs (%)Damage Level
≤5/
5~30low
30~50Medium to low
50~70Medium to high
>70high
Table 3. Dynamic damage experimental results of the main reservoir of XH-1 well under formation water conditions.
CorePermeability before Damage
(×10−3 μm2)
Permeability
after Damage
(×10−3 μm2)
Damage Rate
(%)
Damage Level
XH-1-a0.01920.003780.49High
XH-1-b6.04022.697655.34Medium to high
XH-1-c0.18760.046475.2High
XH-1-d0.04300.002594.22High
Table 4. Dynamic damage experimental results of the main reservoir of XH-1 well.
CorePermeability before Damage
(×10−3 μm2)
Permeability
after Damage
(×10−3 μm2)
Damage Rate
(%)
Damage Level
XH-1-a0.22980.095958.25%Medium to high
XH-1-b54.786536.501833.37%Medium to low
XH-1-c1.70330.491171.17%High
XH-1-d0.67710.056391.69%High
Table 5. Related parameters for calculation of drilling fluid invasion skin in XH-1 well.
Core
Number
Shaft   Radius   r w Porosity   φ Initial   Water   Saturation   S w i Exposure Time t Initial   Filtration   Rate   q 0 Attenuation   Coefficient   α Invasion   Depth r d Skin   Factor   S d
m % % minml/min.m2/ m /
XH-1-a0.07629.632.89360910.000360.783.24
XH-1-b0.076212.934.660481520.831.22
XH-1-c0.07629.331.26912830.715.61
XH-1-d0.07626.221.67488350.4713.41
Table 6. Calculation results of contamination depth.
Contamination Time (h)Mud Cake Thickness (cm)
0.10.20.30.4
10060.2543.1734.6929.45
15074.9954.4144.0937.67
20087.3563.8952.0444.64
25098.2172.2359.0550.80
Table 7. Contaminated skin factor without considering water lock.
Contamination Time (h)Mud Cake Thickness (cm)
0.10.20.30.4
1004.804.113.693.38
1505.274.594.163.84
2005.604.924.494.18
2505.865.194.764.44
Table 8. Contaminated skin factor when water lock is considered (formation water saturation increases by 5%).
Contamination Time (h)Mud Cake Thickness (cm)
0.10.20.30.4
1007.16 6.14 5.50 5.04
1507.86 6.84 6.20 5.74
2008.36 7.35 6.70 6.24
2508.75 7.74 7.10 6.63
Table 9. Contaminated skin factor when water lock is considered (formation water saturation increases by 10%).
Contamination Time (h)Mud Cake Thickness (cm)
0.10.20.30.4
10010.94 9.38 8.40 7.70
15012.01 10.45 9.47 8.76
20012.77 11.22 10.24 9.53
25013.36 11.82 10.84 10.13
Table 10. Contaminated skin factor when water lock is considered (formation water saturation increases by 15%).
Contamination Time (h)Mud Cake Thickness (cm)
0.10.20.30.4
10017.6915.1613.5812.45
15019.4216.9015.3214.17
20020.6518.1516.5615.41
25021.6119.1217.5316.38
Table 11. Contaminated skin factor when water lock is considered (formation water saturation increases by 20%).
Contamination Time (h)Mud Cake Thickness (cm)
0.10.20.30.4
10031.3226.8424.0522.05
15034.3829.9327.1225.09
20036.5632.1329.3227.28
25038.2633.8531.0429.00
Disclaimer/Publisher’s Note: The statements, opinions and data contained in all publications are solely those of the individual author(s) and contributor(s) and not of MDPI and/or the editor(s). MDPI and/or the editor(s) disclaim responsibility for any injury to people or property resulting from any ideas, methods, instructions or products referred to in the content.

